Article

An Algorithm Based on DAF-Net++ Model for Wood Annual Rings Segmentation

1
School of Information and Electrical Engineering, Shandong Jianzhu University, Jinan 250101, China
2
Shandong Shansen CNC Technology Co., Ltd., Yuanda Road, Tengzhou 277500, China
3
School of Architecture and Urban Planning, Shandong Jianzhu University, Jinan 250000, China
*
Author to whom correspondence should be addressed.
Electronics 2023, 12(14), 3009; https://doi.org/10.3390/electronics12143009
Submission received: 29 May 2023 / Revised: 24 June 2023 / Accepted: 6 July 2023 / Published: 9 July 2023
(This article belongs to the Special Issue Deep Learning for Data Mining: Theory, Methods, and Applications)

Abstract

:
The semantic segmentation of annual rings is a research topic of interest in wood chronology. To solve the problem of wood annual rings being difficult to segment in dense areas and being greatly affected by defects such as cracks and wormholes, this paper builds a DAF-Net++ model which is based on U-Net whose backbone network is VGG16 and filled with dense jump links, CBAM and DCAM. In this model, VGG16 is used to enhance the extraction ability of image features, dense jump links are used to fuse semantic information of different levels, DCAM provides weighting guidance for shallow features, and CBAM solves the loss of down-sampling information. Taking a Chinese fir wood as the experimental object, 1700 CT images of wood transverse section were obtained by medical CT equipment and 120 of them were randomly selected as the dataset, which was expanded by cropping and rotation, among others. DAF-Net++ was used for training the model and segmentation of the annual rings, and finally the performance of the model was evaluated. The training method is freeze training followed by thaw training, and takes Focal Loss as the loss function, ReLU as the activation function, and Adam as the optimizer. The experimental results show that, in the segmentation of CT images of Chinese fir annual rings, the MIoU of DAF-Net++ is 93.67%, the MPA is 96.76%, the PA is 96.63%, and the Recall is 96.76%. Compared with other semantic segmentation models such as U-Net, U-Net++, DeepLabv3+, etc., DAF-Net++ has better segmentation performance.

1. Introduction

The annual ring is the concentric ring pattern on the transverse section of a woody plant stem, along with the growth of the wood cambium year by year. The annual ring is an important basis for recording the growth years of trees [1,2]. It contains a wealth of information on climate [3,4,5], history [6,7,8], environment [9,10], and medicine [11]. Accurate segmentation is a prerequisite for recording, statistics, and analysis of annual rings, so an intelligent method for accurate segmentation should be proposed as an important research topic in forestry science.
The traditional method of annual rings segmentation requires a specialized equipment consisting of a stereoscope, a mobile table, and a data logger. The advantage of this method is the accuracy of the results, and the disadvantage is that it is time-consuming and has low efficiency [12]. With the application of computer vision and image processing technology in the field of wood science, researchers have proposed a series of methods for wood annual rings segmentation. Ning Xiao et al. (2018) [13] constructed a pixel classifier, which is based on a random forest algorithm, for early wood and late wood segmentation of red pine, and the segmentation results meet the needs of annual rings counting and spacing measurements. Since the transverse section of the wood used in the experiment is free of defects such as knots and wormholes, the anti-interference ability of the method is to be verified. Cheng Yuzhu et al. (2018) [14] proposed an algorithm for wood annual rings image detection based on texture features. The algorithm removes the noise from the grayscale image of texture features and extracts the boundary target of annual rings by the Total Variation (TV) filtering algorithm as well as the Fuzzy Region Competition (FRC) model. Although the method has good noise immunity, it is not suitable for boundary locating of annual rings and extracting texture features for different tree species or gradient directions.
Since the AlexNet deep learning network model proposed by Krizhevsky et al. won the ImageNet competition in 2012 [15], convolutional neural networks (CNNs) have gradually gained significant attention in the field of computer vision. Classical network models have been improved and optimized by researchers and applied to different fields. Long et al. (2014) [16] proposed fully convolutional networks (FCNs), which improve CNNs by replacing the fully connected layer with a convolutional layer, but this model lacks the utilization of holistic information. Ronneberger et al. (2016) proposed the U-Net model based on the improved FCN [17]. The model achieves good segmentation performance through a small number of labeled images and is widely applied in biomedical fields [18,19] such as retinal vessel segmentation [20] and cell boundary segmentation [21]. Zhou et al. (2018) [22] redesigned the jump path based on U-Net for reducing the semantic gap between the feature mapping of encoder and decoder. U-Net++ with deep supervision was obtained and tested in the field of medical image segmentation, such as chest nodules and liver segmentation, and the segmentation performance was better than U-Net. Zhijun Gao et al. (2020) [23] redesigned convolutional blocks based on U-Net++ and used Deep Residual Nets (ResNet) as the backbone to segment the retinal macular edema region. The round holes as well as the cracked voids located around the segmentation target are very similar to the wormholes and cracks in computed tomography (CT) images of wood. Huang Hong et al. (2021) [24] proposed an adaptive weighted aggregation method based on U-Net++ in order to solve the boundary segmentation problem of lung CT images in complex scenes. This method provides the basis for the application of U-Net series networks for wood CT images.
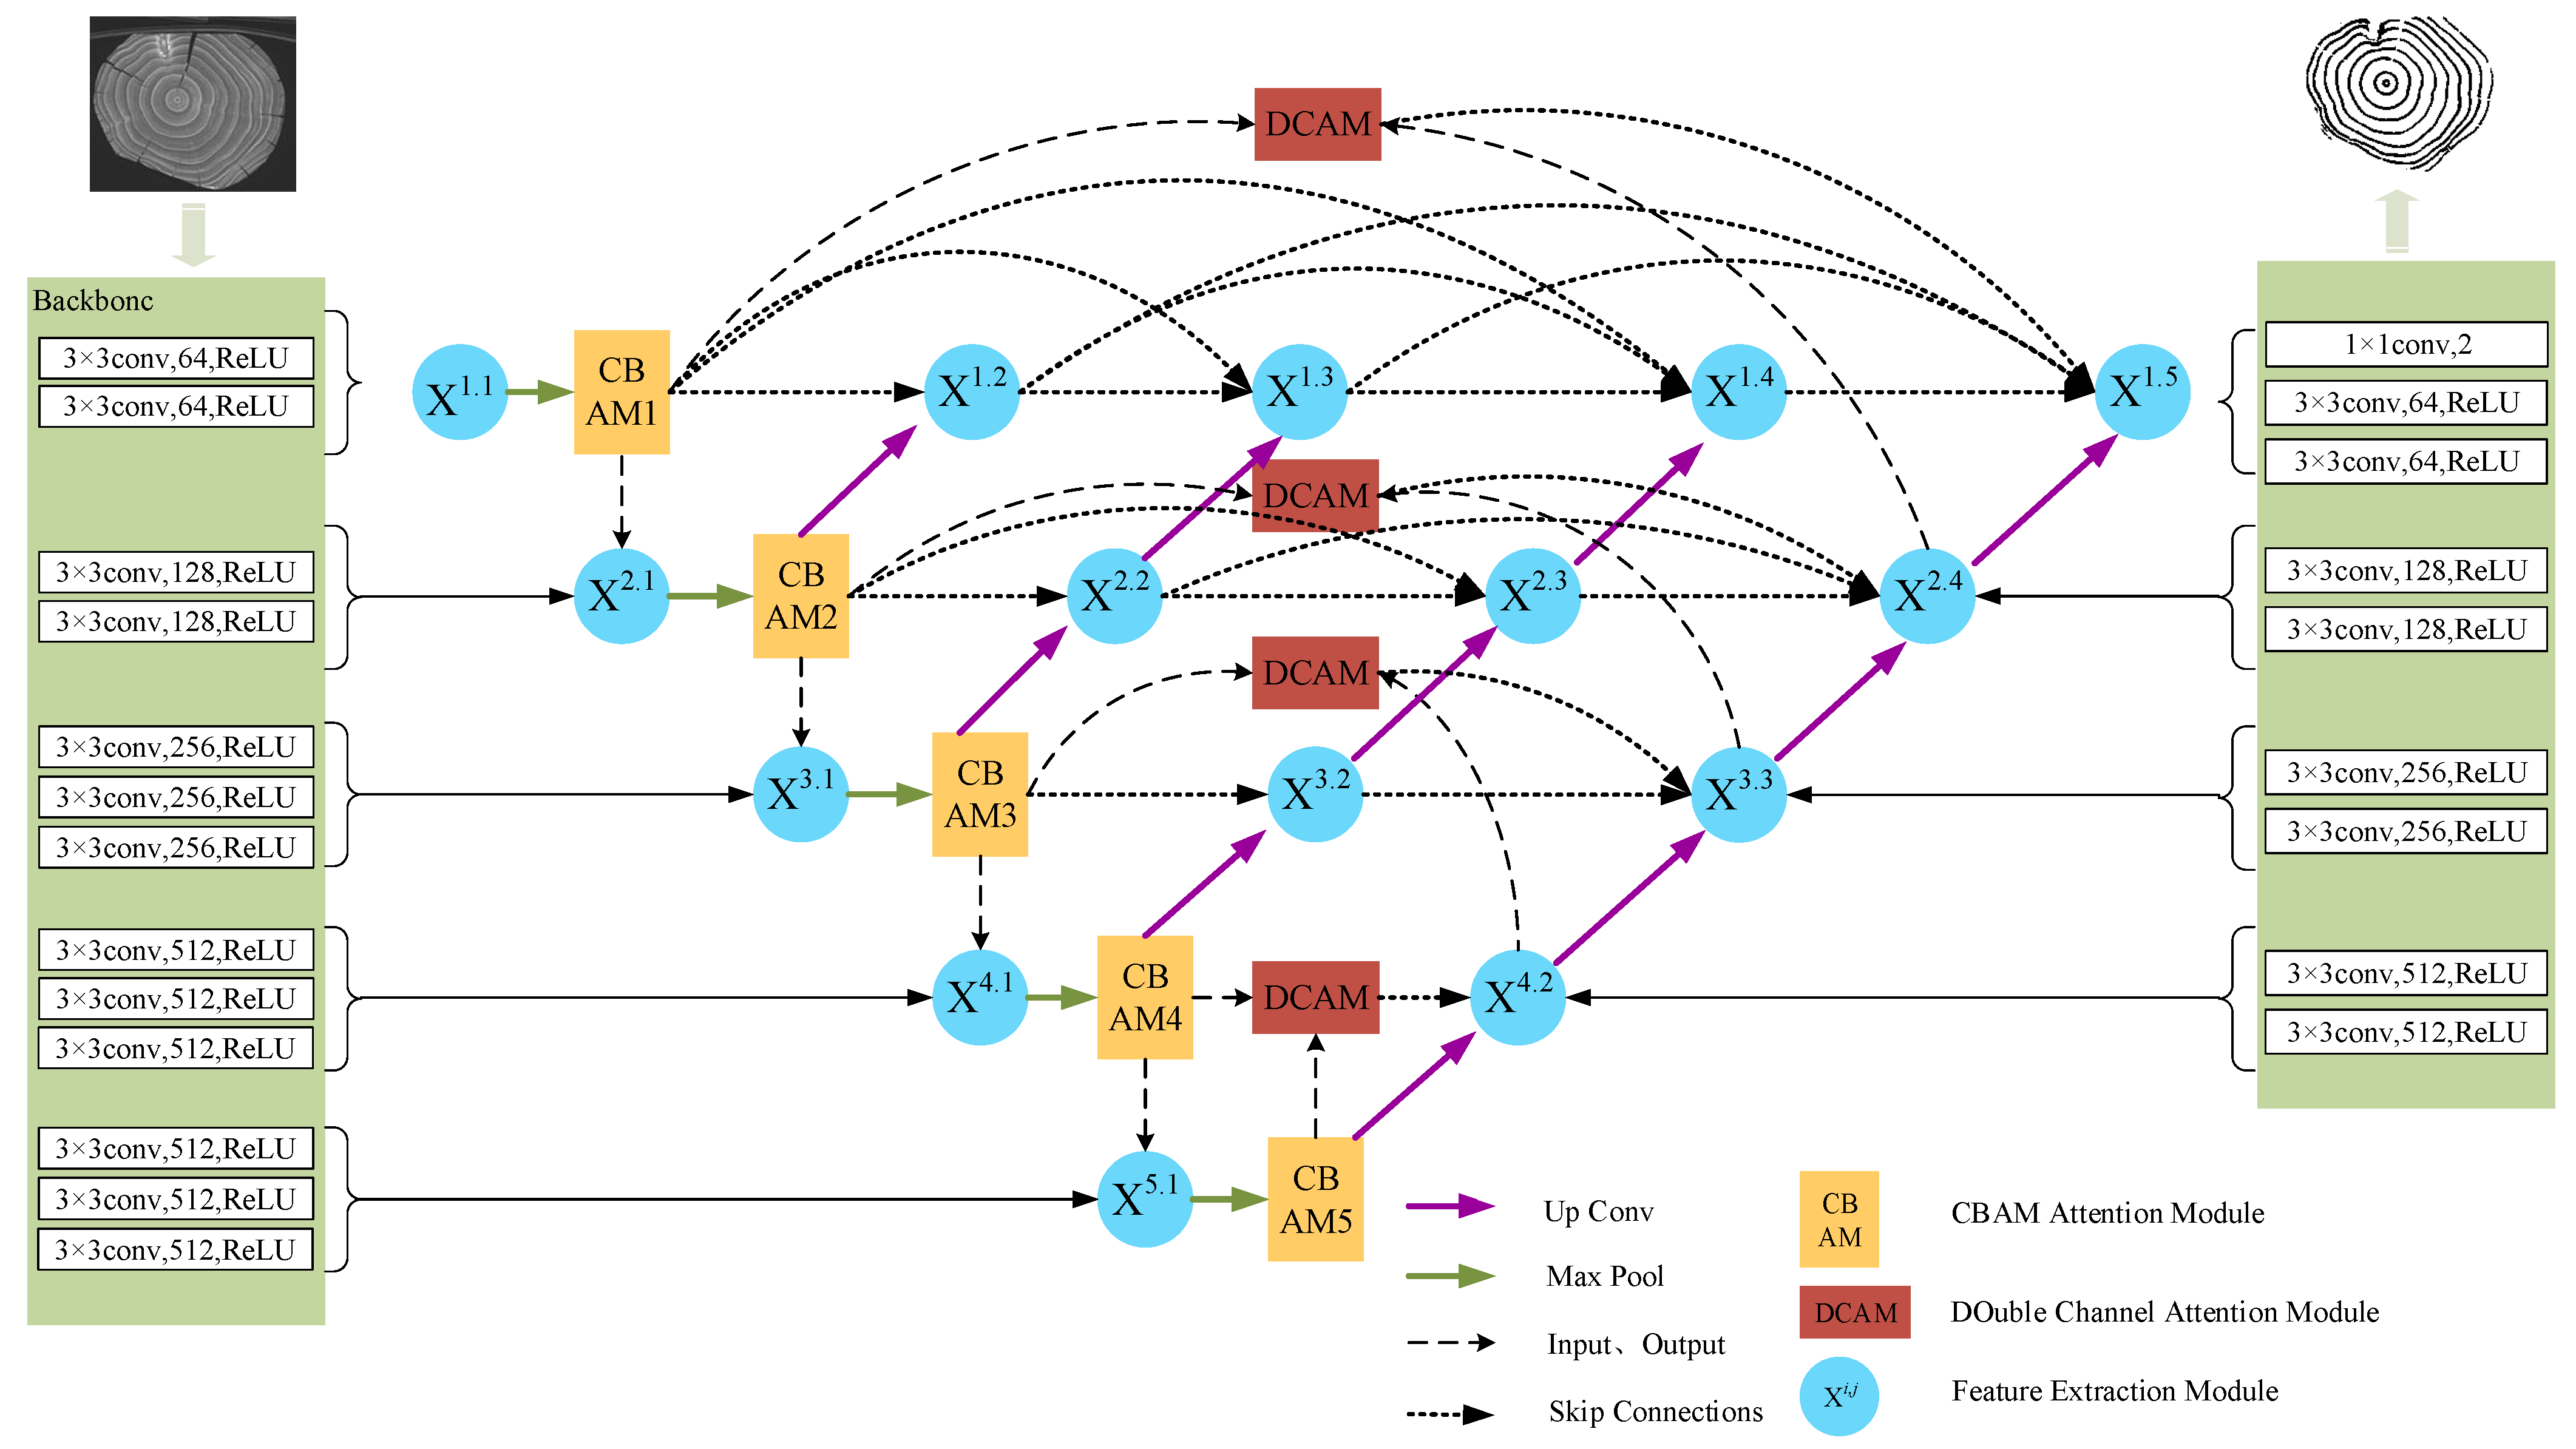
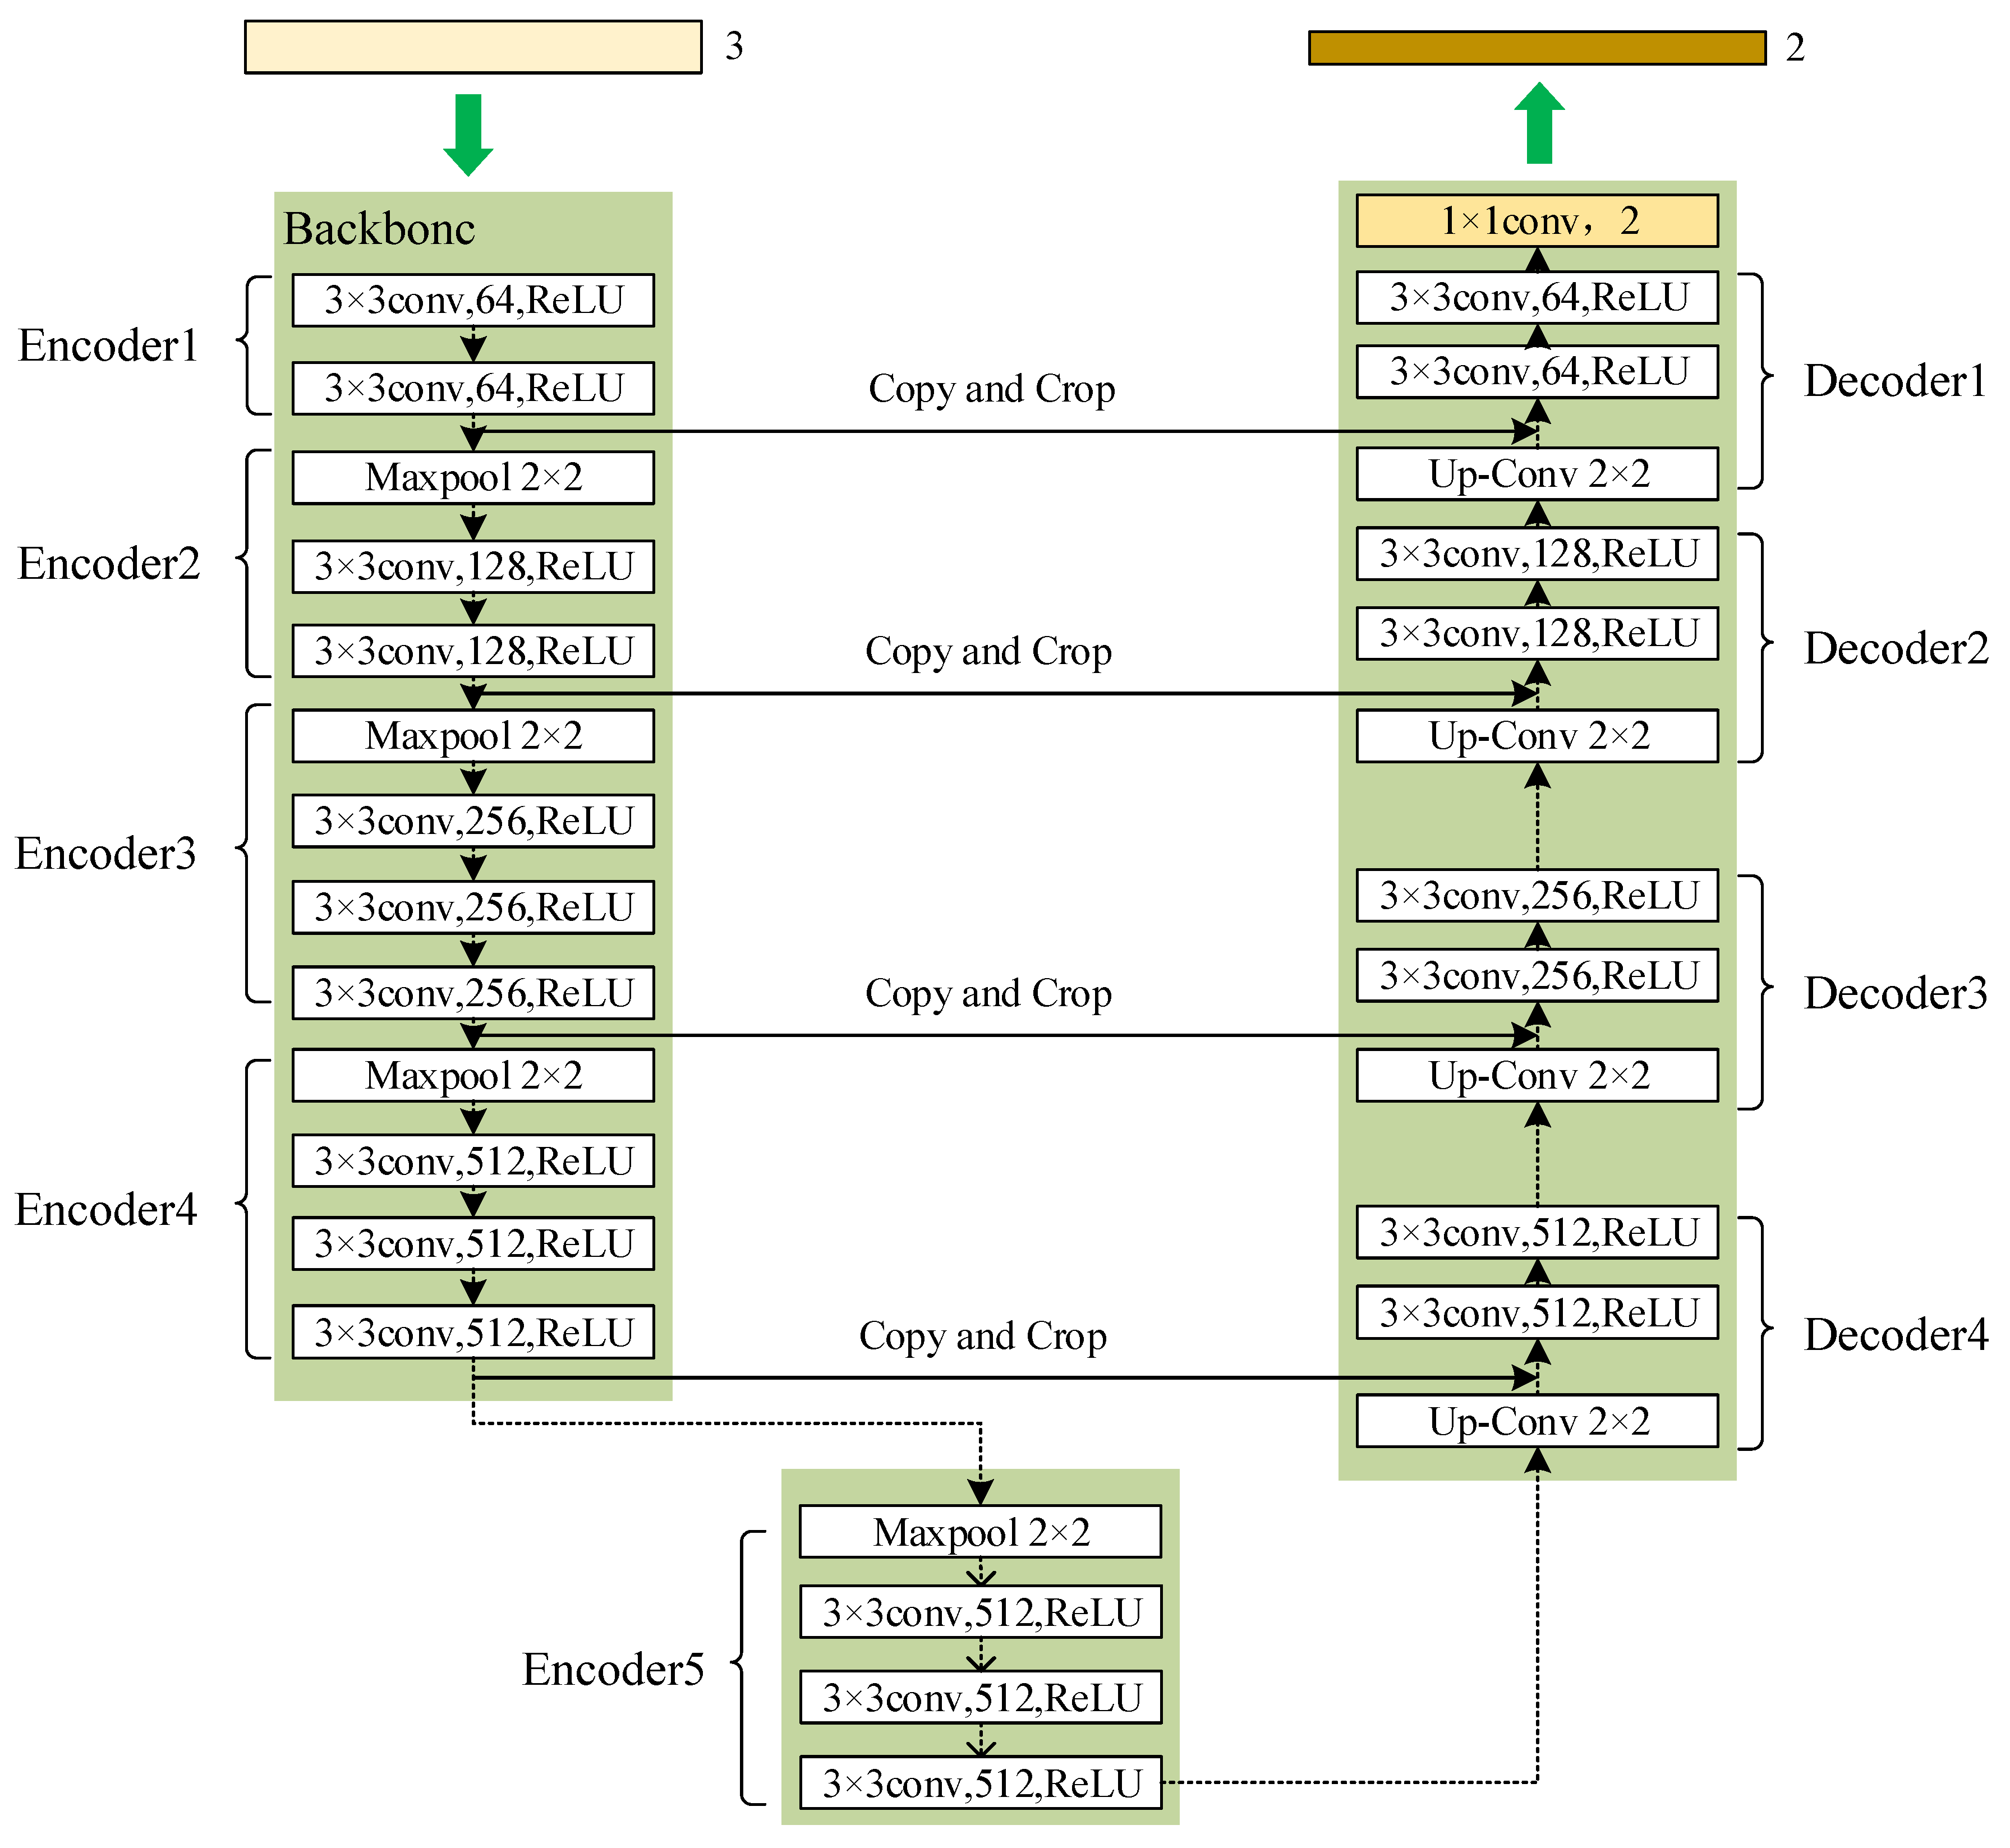
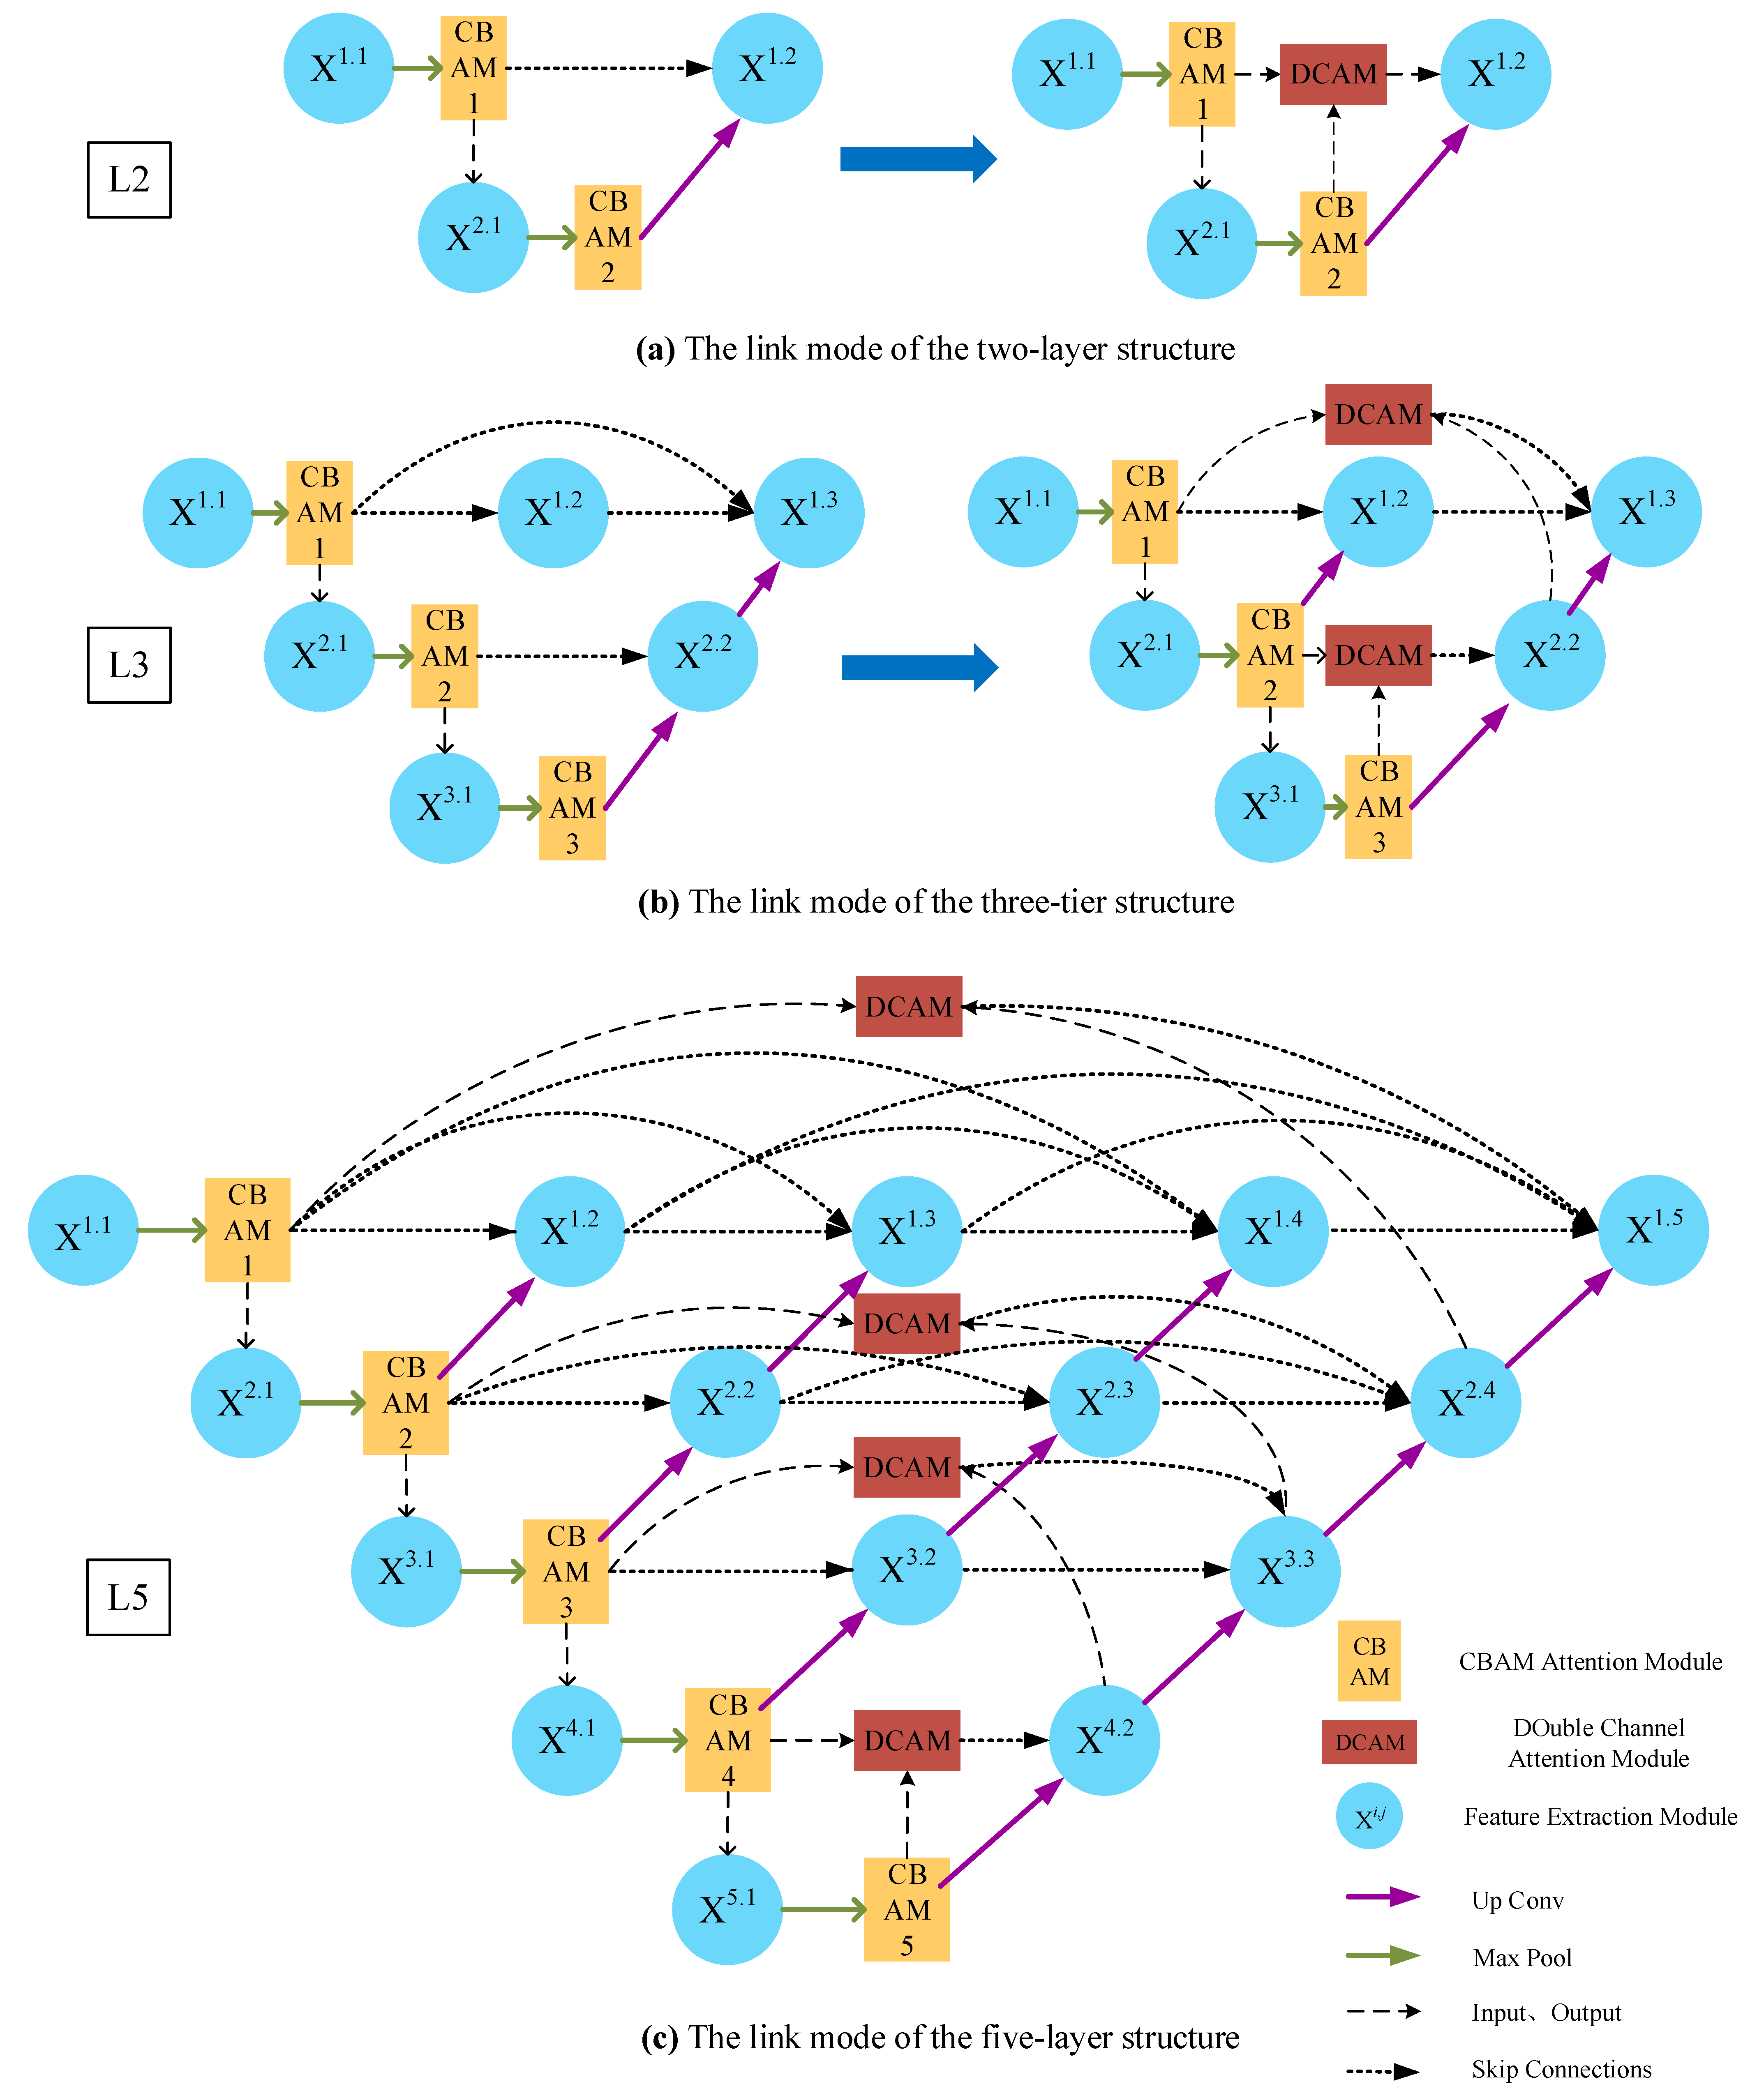
For the imbalance of positive and negative samples, we propose a model which uses dense jump links, attention mechanism, and Focal Loss (DAF-Net++). The model is constructed on U-Net with VGG16 (Visual Geometry Group, VGGNet with 16 layers) as the backbone network [
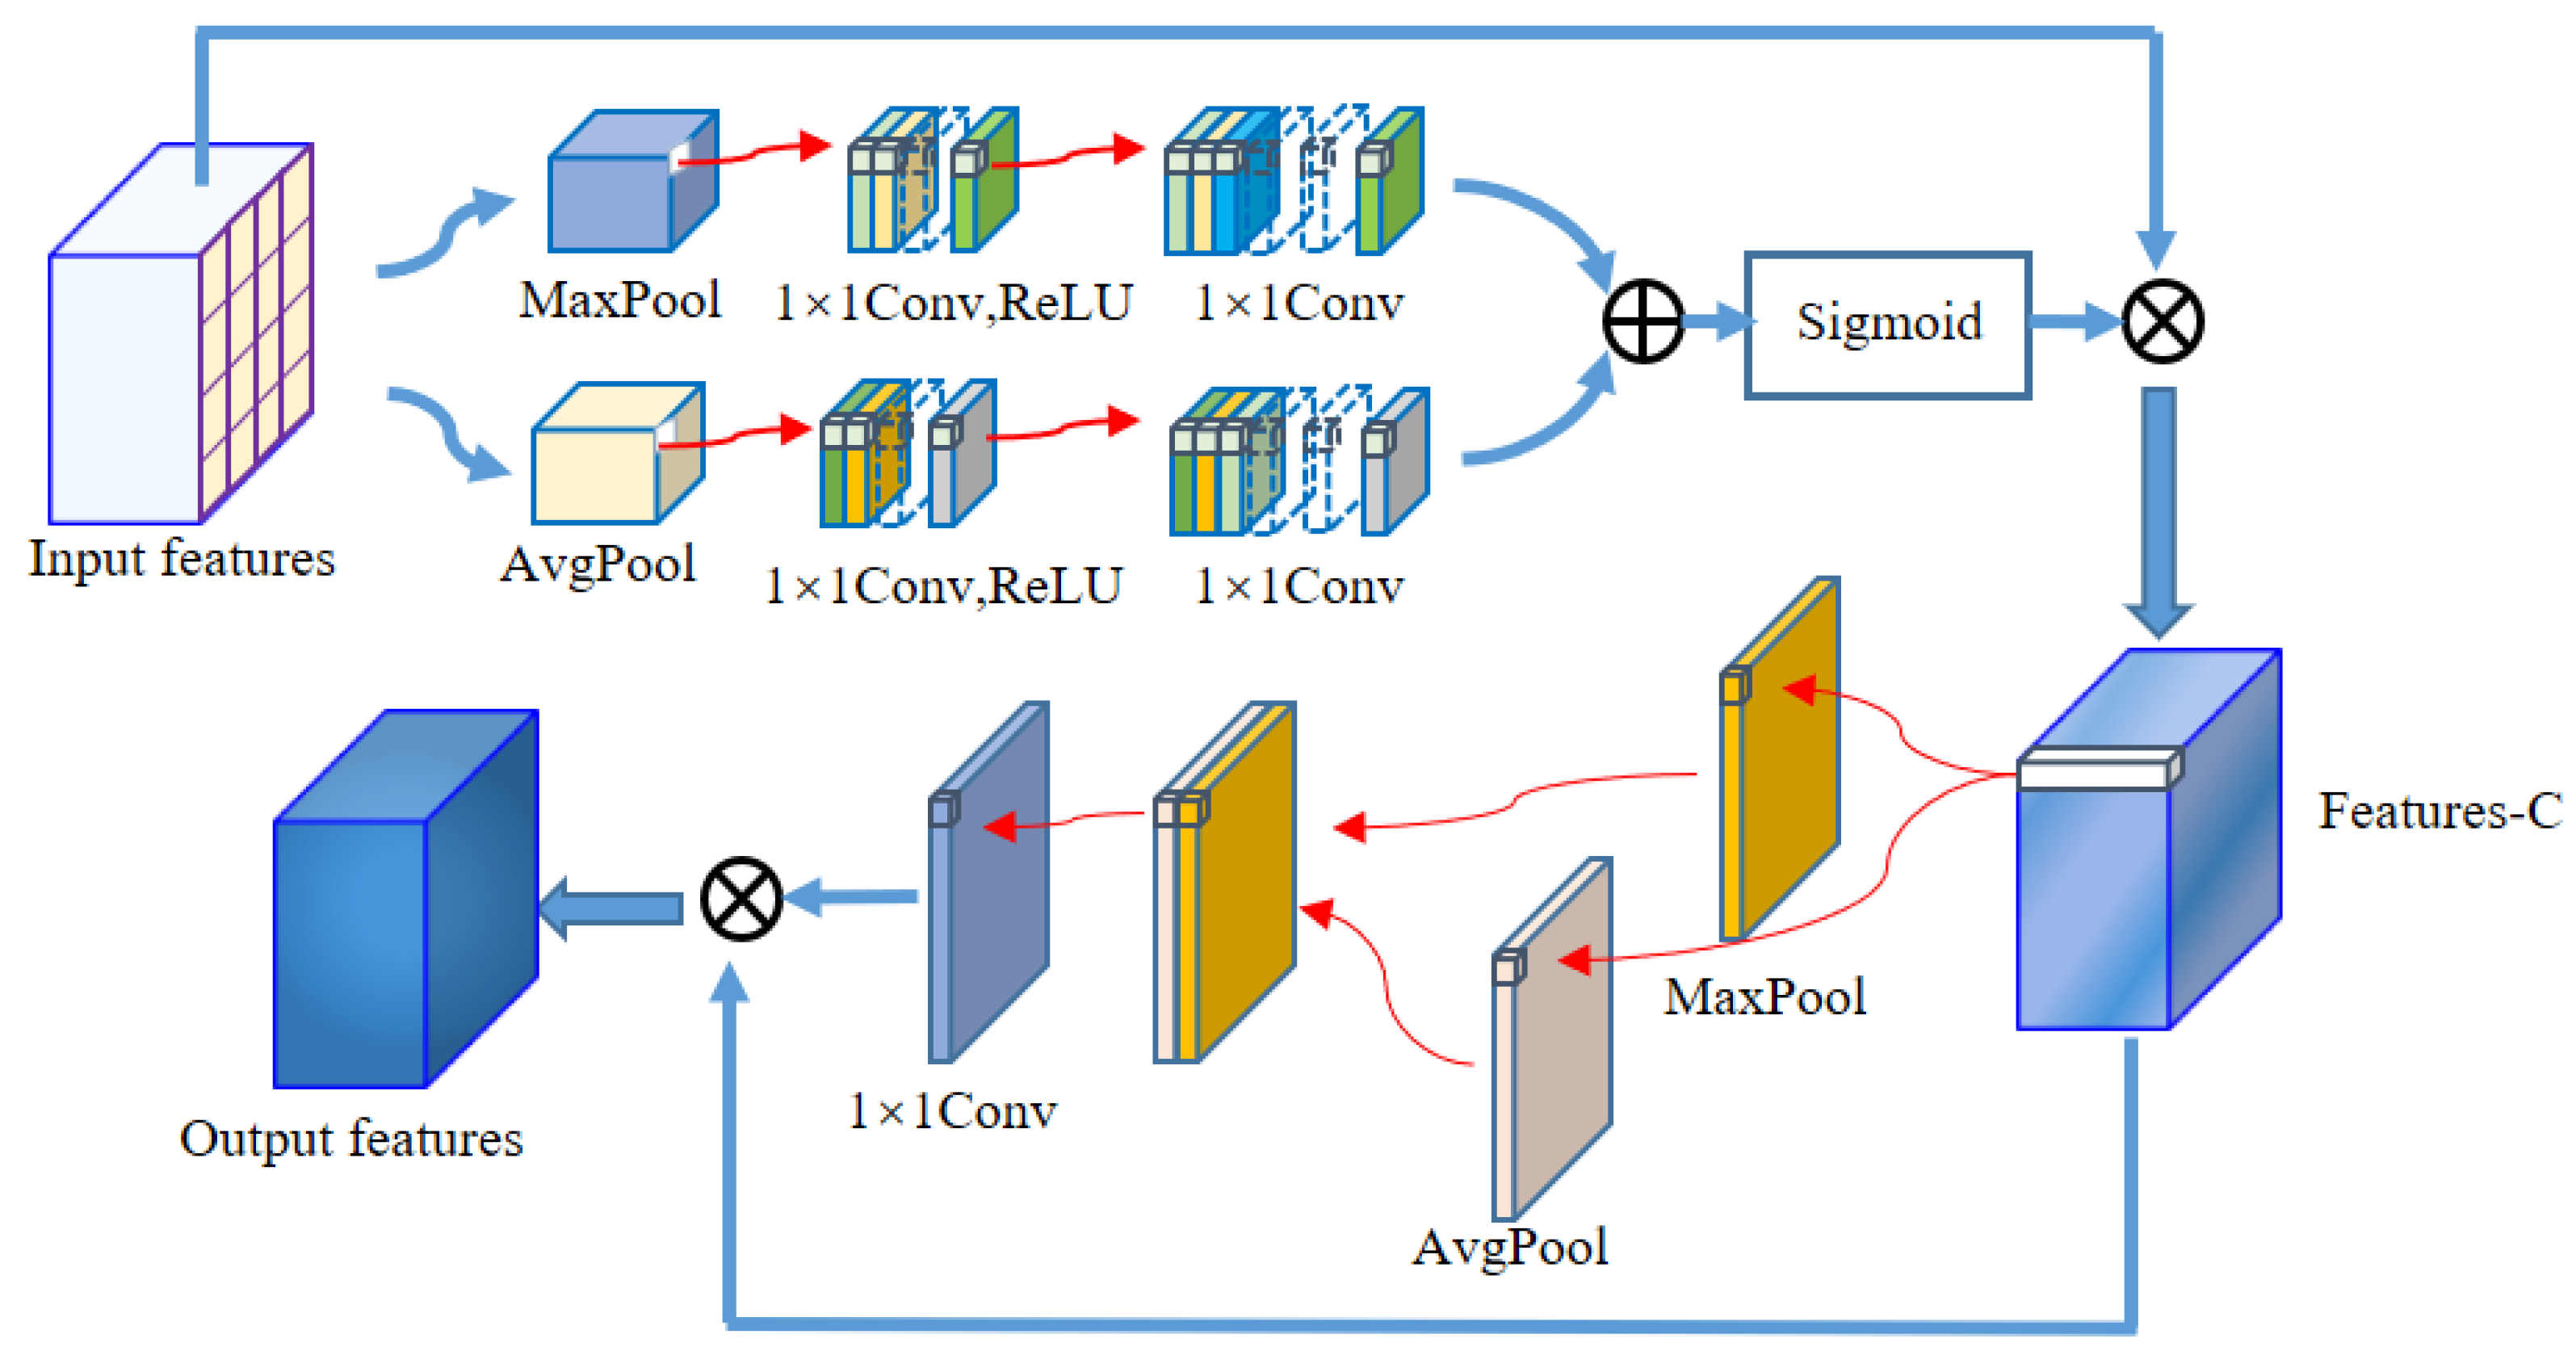
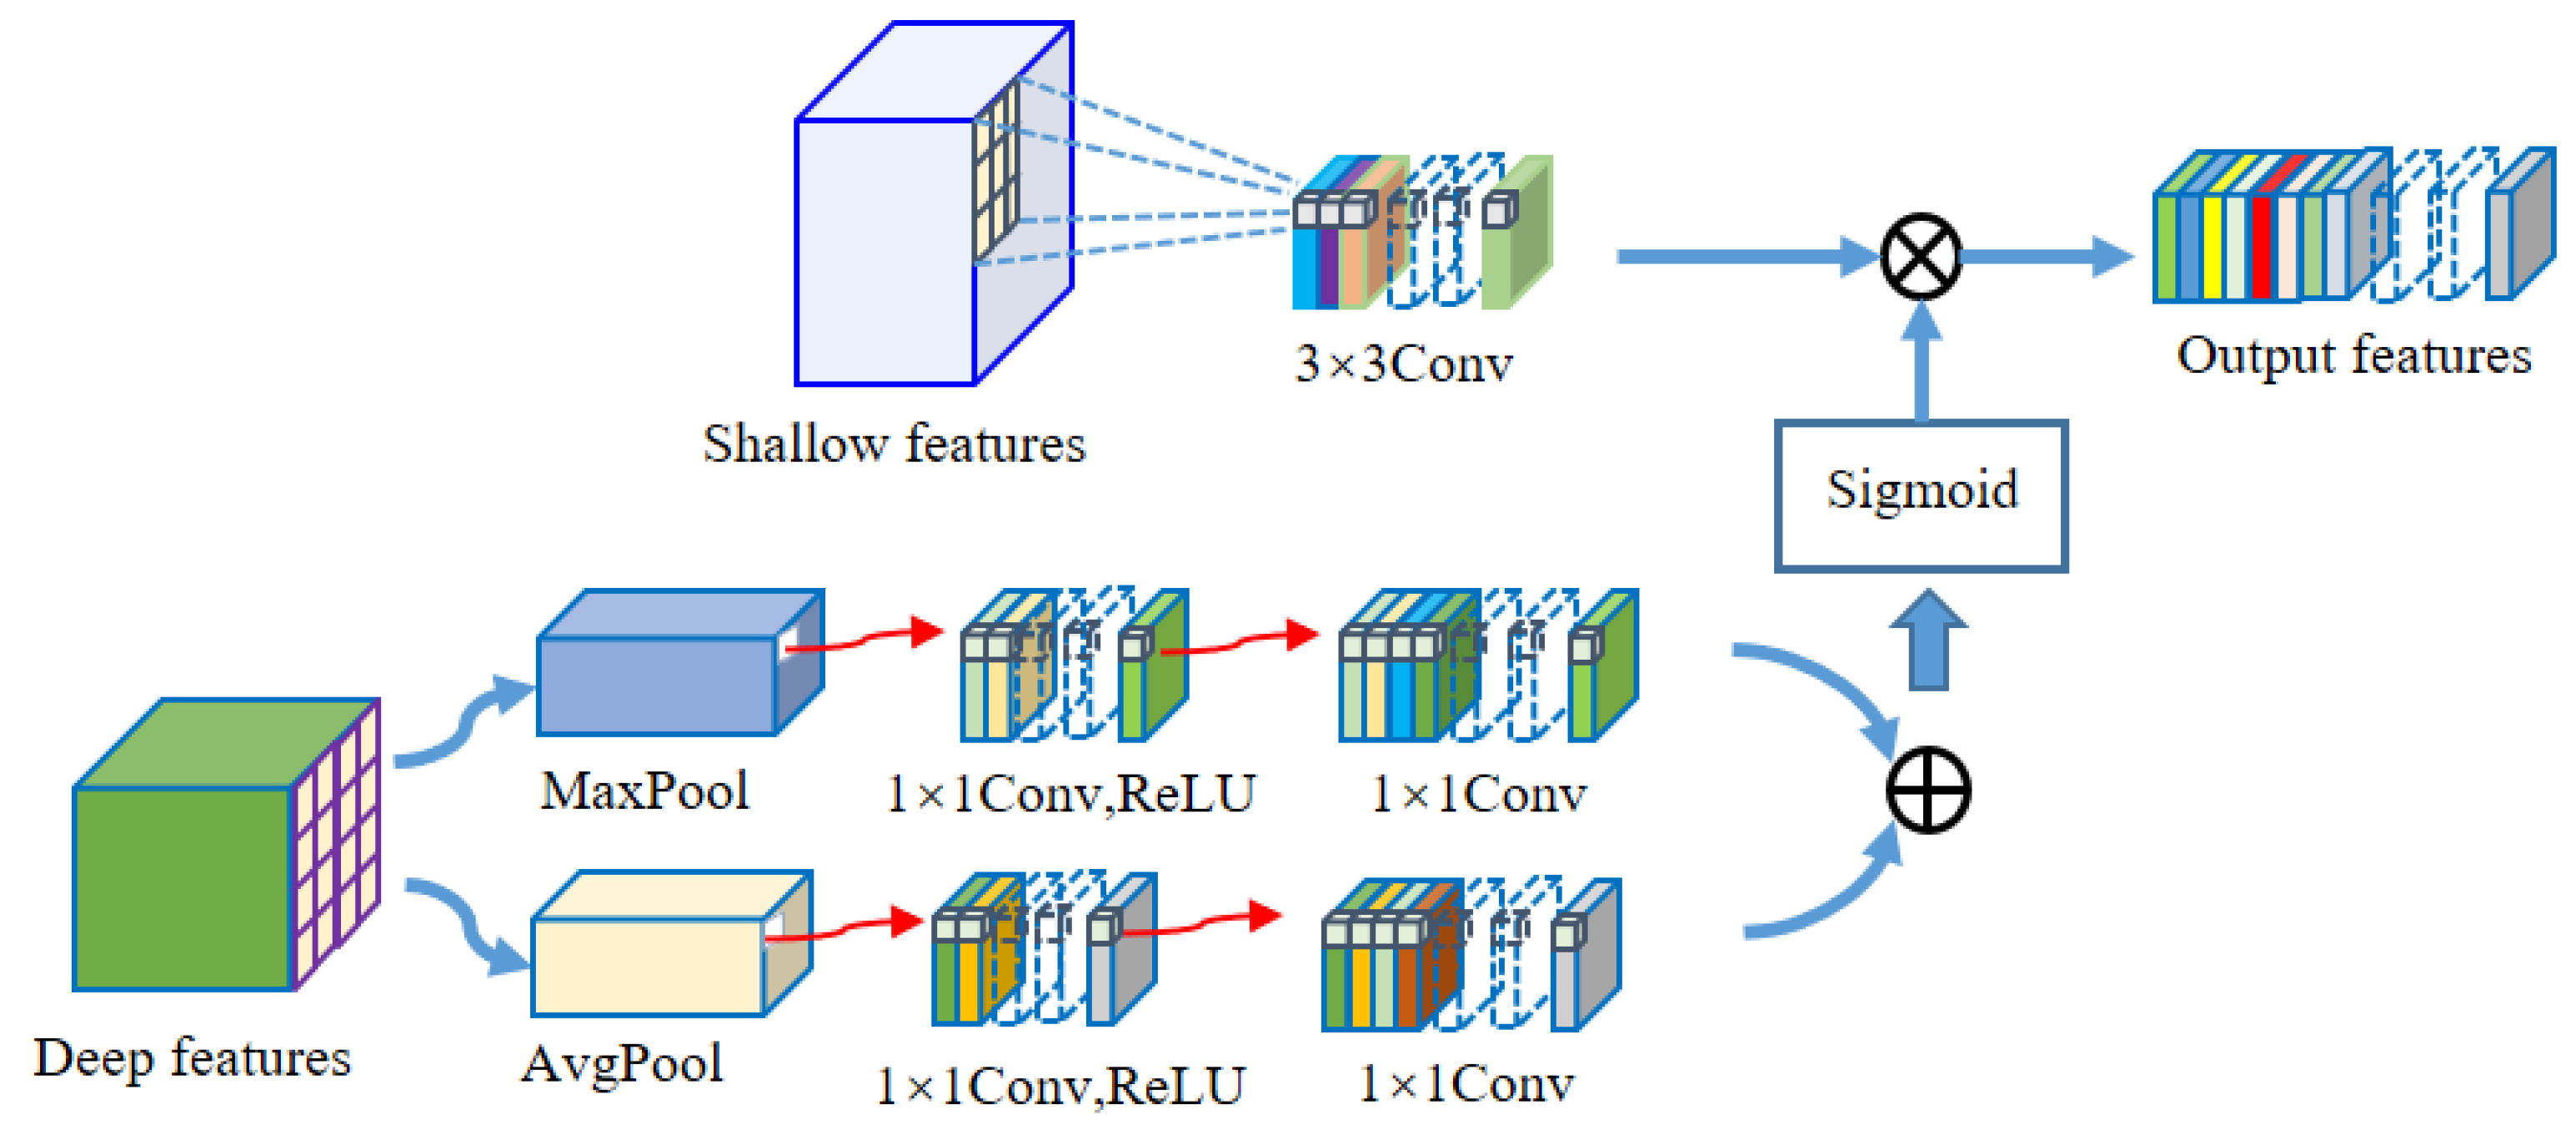
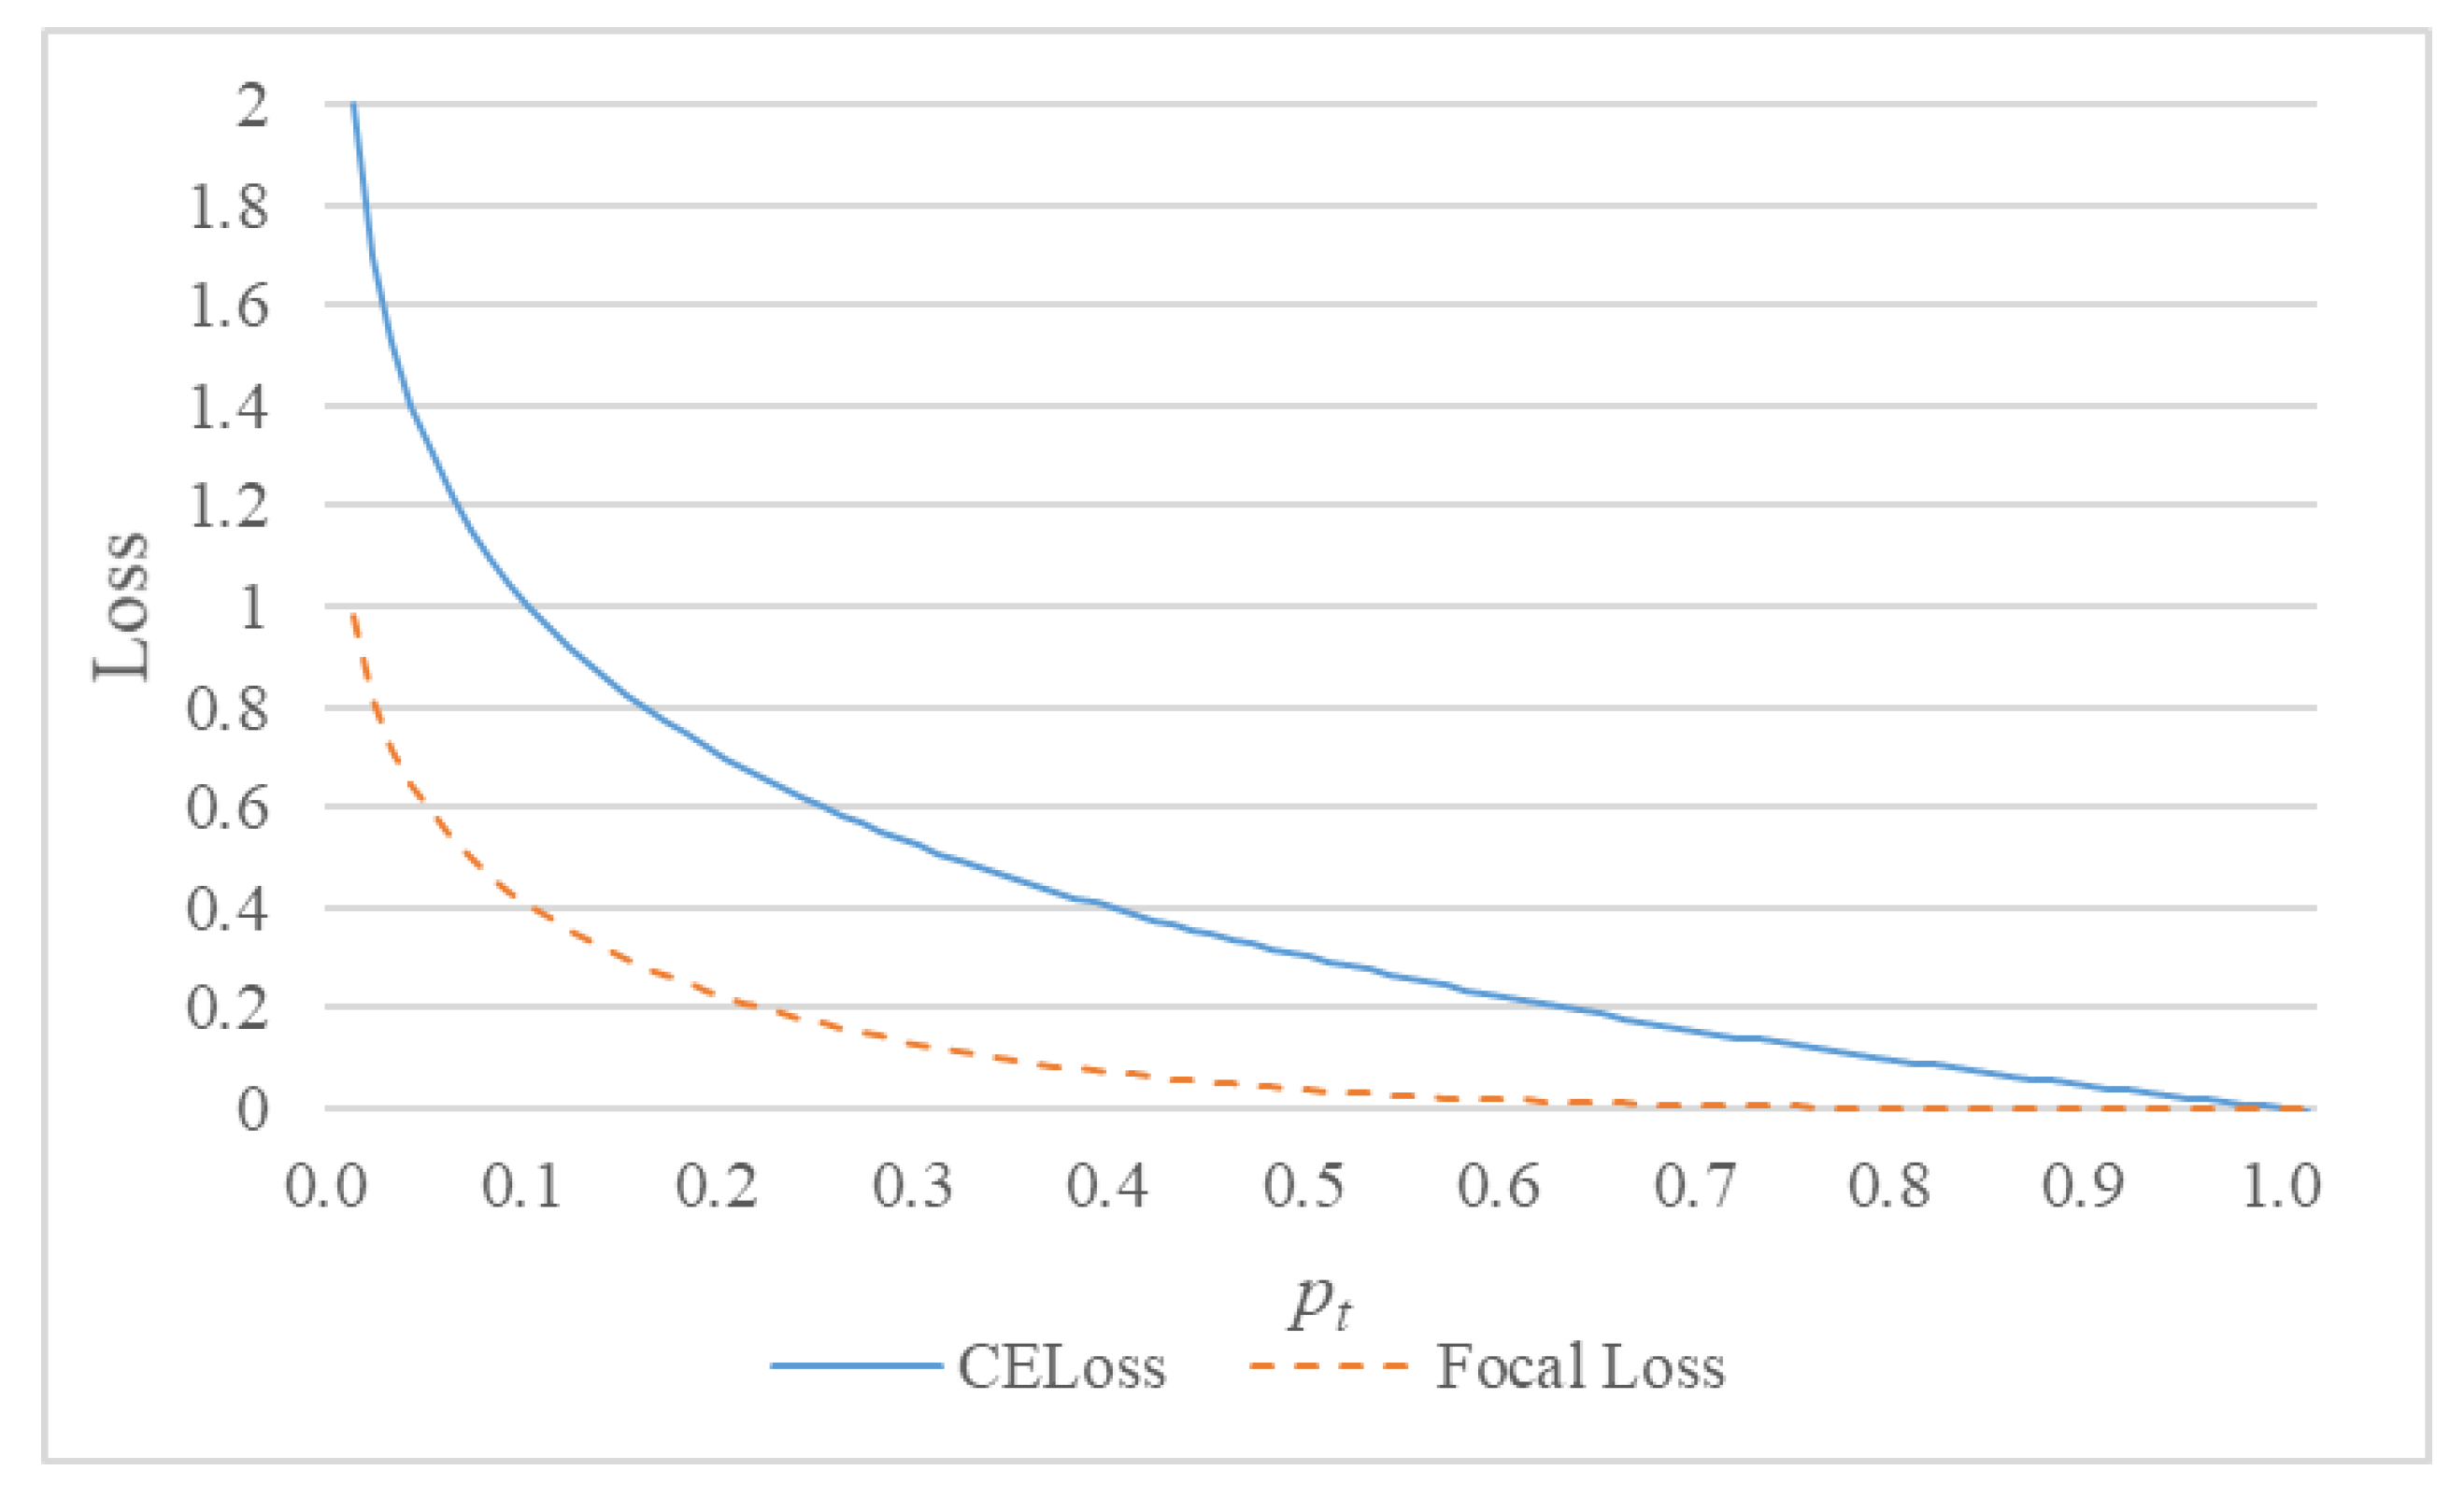
25]. Dense jump links are redesigned in order to effectively fuse feature information and reduce the semantic divide. Deep and shallow features are fused by two different attention mechanisms. In addition to this, the Focal Loss [26] method is introduced to the calculation of loss values. Training and test images of transverse sections of fir trees were compared with those of classical semantic segmentation models such as U-Net, UNet++, and DeepLabv3+. The Mean Intersection over Union (MIOU), Mean Pixel Accuracy (MPA), Pixel Accuracy (PA), and Recall of the segmented images using DAF-Net++ were higher than the classical semantic segmentation models. The results show that the DAF-Net++ proposed in this paper can effectively overcome the interference such as wormholes, nodes, cracks, etc., and is more suitable for binary classification problems with large positive and negative sample bias such as annual rings segmentation.

2. Related Work

Currently, semantic segmentation algorithms are widely used in various fields, such as medicine and geology. Related researchers have proposed different improvements for semantic segmentation algorithms. Wang Wenguan et al. (2021) [27] proposed a pixel comparison algorithm for semantic segmentation in a fully supervised environment. The method investigates the global semantic relations between pixels and has the complementary advantages of unary classification as well as structured metric learning. Available semantic segmentation algorithms are easily applied. It is a paradigm for pixel-by-pixel metric learning, which has a wide range of application prospects. However, because there are fewer pixels in the annual rings and more pixels in the background, this method is not applicable to the task of segmenting annual rings. Zhou Tianfei et al. (2022) [28] proposed a regional semantic comparison as well as aggregation (RCA) method with a regional memory library, whose superiority lies in its ability to obtain rich contextual semantic information using a large amount of weakly labeled training data. Excellent results were achieved in experiments on several public datasets. But the method requires a large number of datasets and is not suitable for the segmentation task of annual rings. Zhou Tianfei et al. (2022) [29] proposes a nonparametric alternative based on a non-learnable prototype. The method is able to directly shape pixels and embed them into corresponding positions to complete segmentation. Using such a nonparametric alternative means that the method has excellent generalization ability and breaks the limitation of parametric learning of traditional semantic segmentation models. However, this method is not applicable to this study due to the morphological characteristics of wood annual rings.
Although there are abundant studies on semantic segmentation algorithms, there are relatively few studies on semantic segmentation of CT images of wood annual rings and the segmentation results are mostly unsatisfactory. Fabijańska et al. (2018) [30] successfully used the U-Net network model to detect annual rings of different widths, structures, and orientations from the heartwood of three ring-hole wood species (Quercus sp., Fraxinus excelsior L., and Ulmus sp.); it is the beginning of annual rings segmentation by using U-Net networks. However, its segmentation accuracy is low. Ning Xiao et al. (2019) [31] proposed an image segmentation algorithm based on U-Net. This algorithm effectively segmented early wood, late wood, and bark, but poorly segmented at the pith and nodal scars. Pixels of localized regions were missing. The reason for this problem is that the U-Net model does not make full use of the global information. Liu Shuai et al. (2023) [32] improved U-Net++ by extending the model depth and adding an attention mechanism. Taking 1000 CT images of Chinese fir as the training set and 25 images as the test set, the PA was 95.9% and the MIoU was 79.4%, but the segmentation of the morphology and detail pixels of the annual rings remains to be solved. The main reasons for this are the loss of semantic information in the downsampling process and the lack of attention to the annual rings in the model training process.
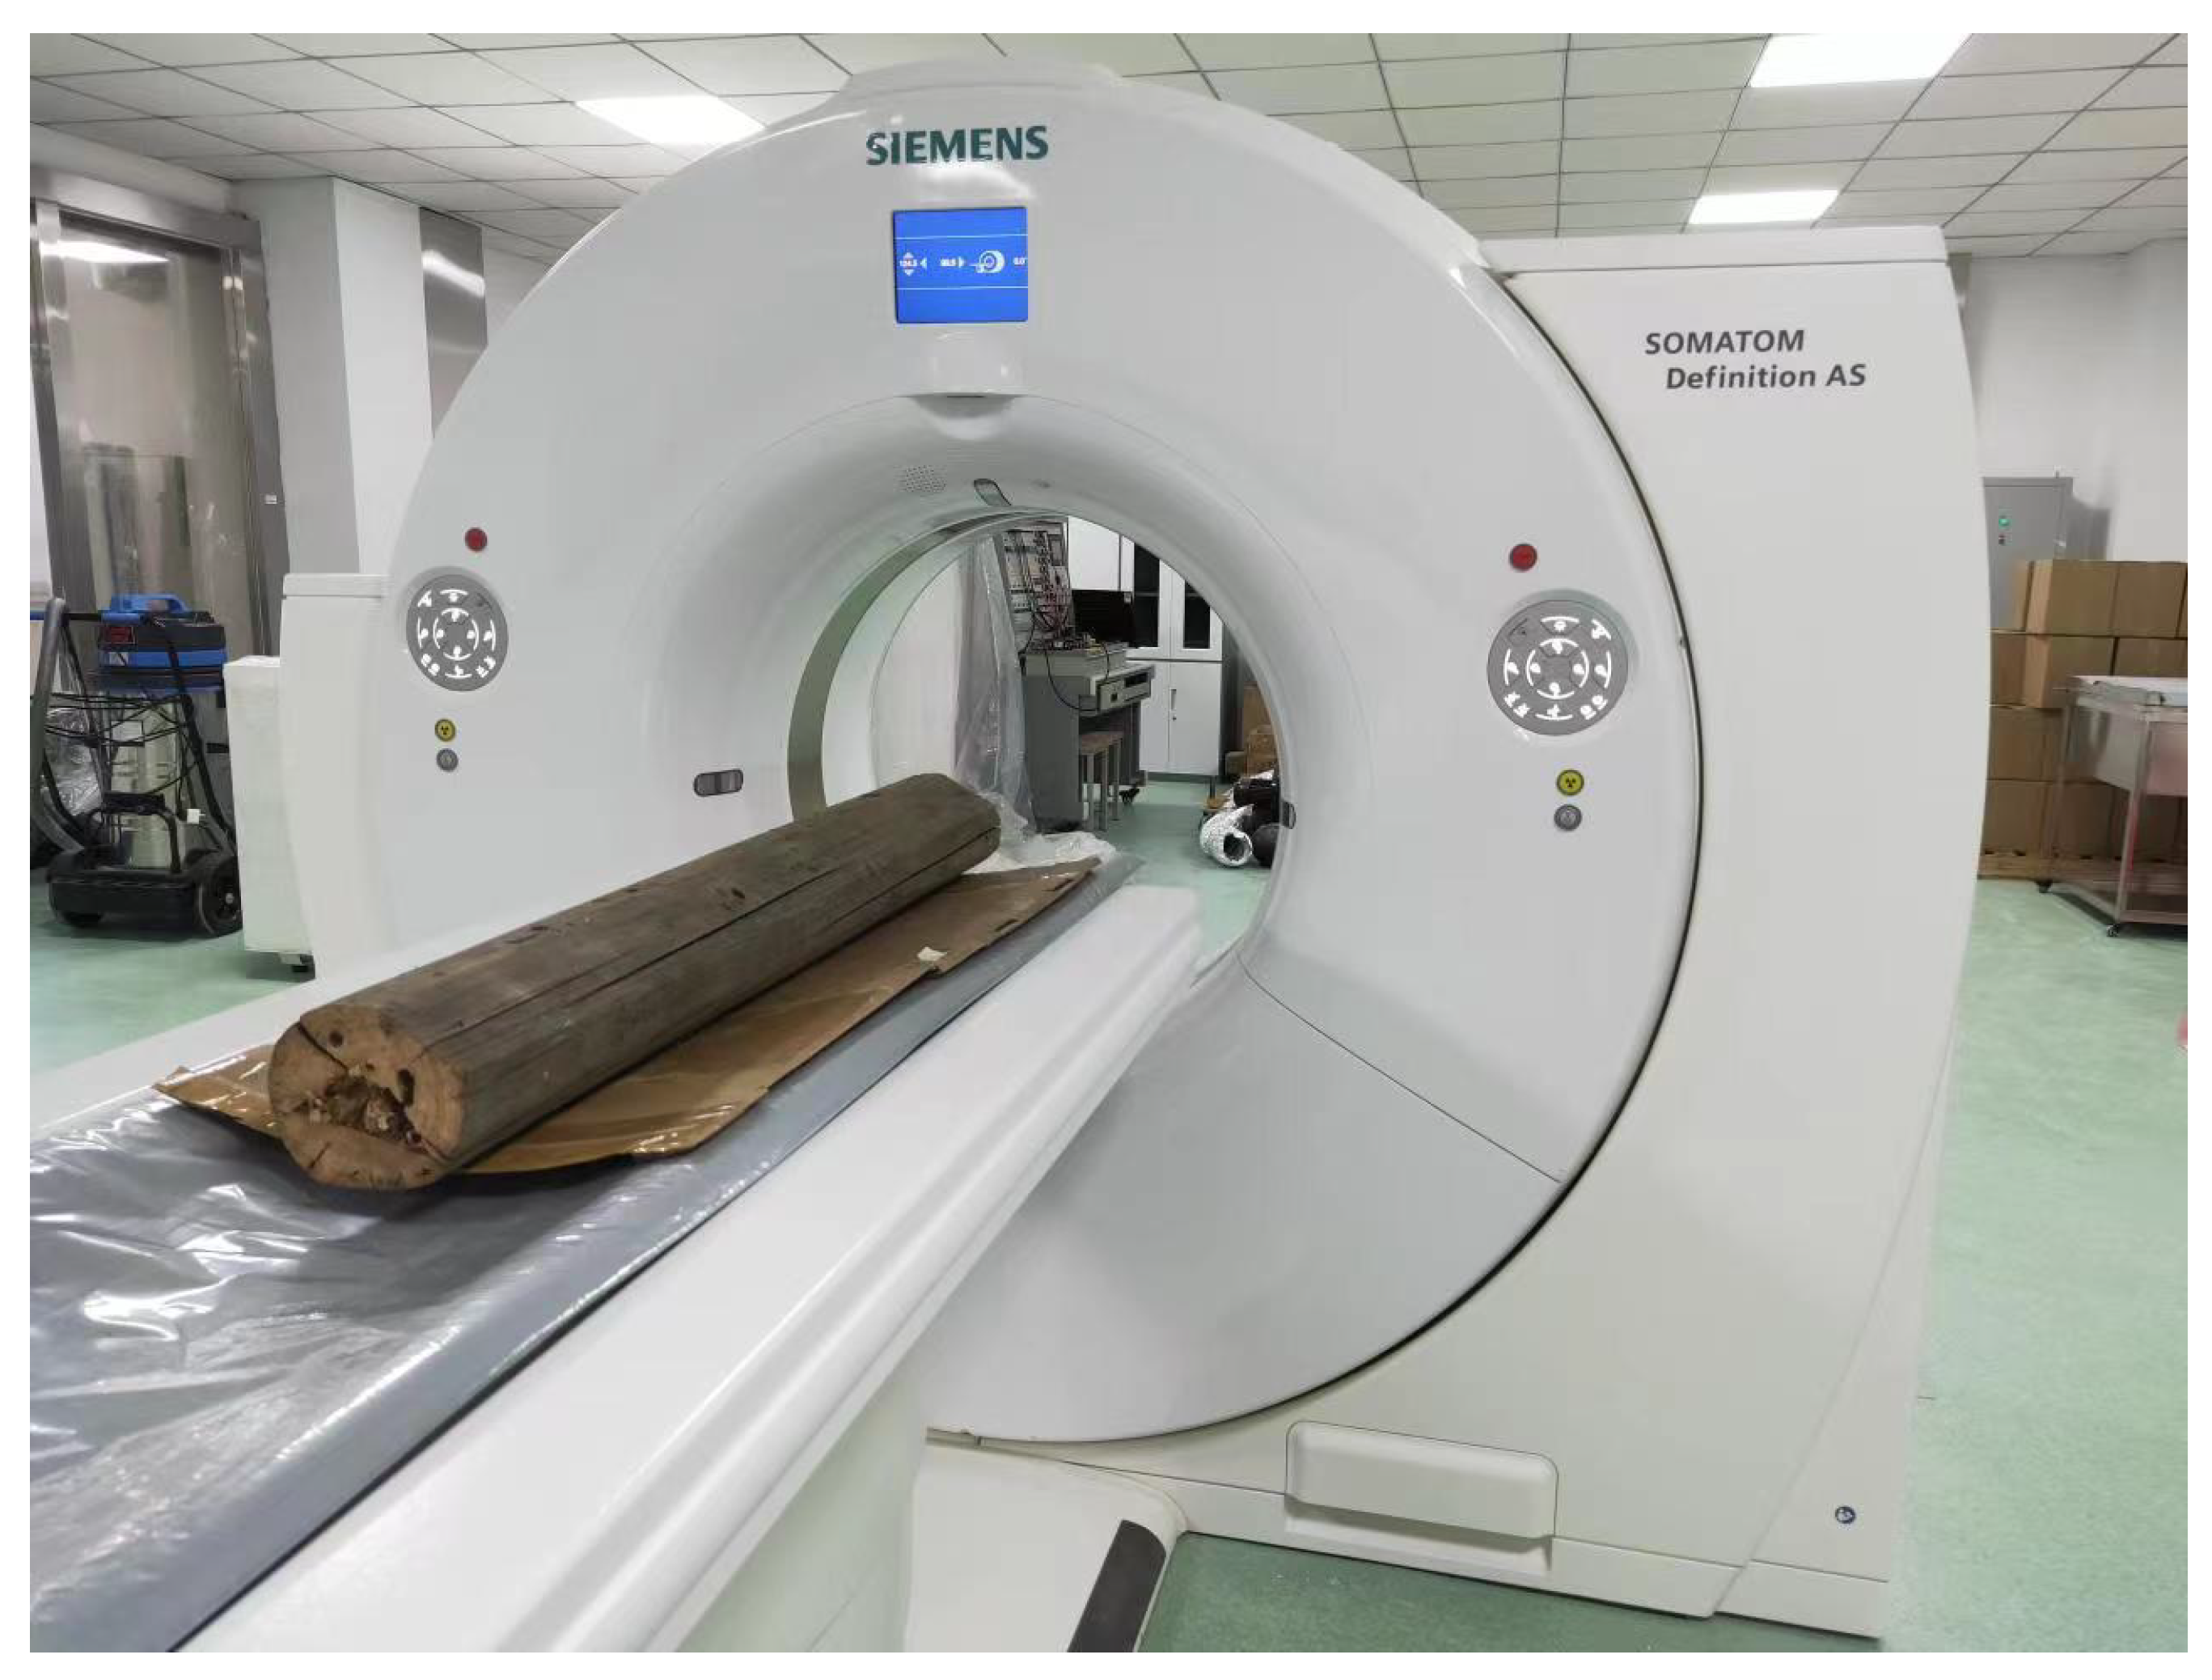
Therefore, an intelligent, automated, and high-precision segmentation algorithm for wood annual rings is urgently needed. In this paper, the DAF-Net++ model is proposed to address the technical challenges in the field of wood annual rings segmentation by using wood CT images as experimental samples.

3. Model Structure

3.1. Algorithm Research Framework

There are relatively few studies on semantic segmentation models for wood annual rings, especially for wood CT images. In addition, due to the difficulty during acquiring wood transverse section images and the marking process, the construction of a related dataset becomes a challenge. To address the above problems, this paper proposes the DAF-Net++ model to achieve automation and accuracy in annual rings segmentation. Its algorithm framework is shown in Figure 1. The CT image input into the model is firstly encoded by the backbone network with CBAM. Then, the decoding operation is carried out by the redesigned link path to realize the integration of information, and finally the segmentation result is output. The innovations of this paper are as follows:
  • In terms of experimental data acquisition, we creatively use medical CT equipment to scan wood to obtain nondestructive transverse section images. The wood image datasets containing insect holes, knots, and cracks are established. This provides the new methods for acquiring wood transverse section images.
  • In terms of network model, a Dual-input Channel Attention Mechanism (DCAM) is proposed to handle the underutilization of deep semantic information by traditional models. In addition, the feature maps obtained from each downsampling are feature-enhanced by the Convolutional Block Attention Module (CBAM) [33], which increases the weight of the target while keeping the number channels unchanged to avoid information loss after downsampling. Finally, the connection paths are redesigned to fill the U-Net with DCAM and CBAM and VGG16 is used as the backbone network to enhance the ability to extract features of wood transverse sectional CT images. In this way, the constructed DAF-Net++ model can weaken the interference of background information, so that the input information can be effectively utilized to further increase the weight of objects, capture more feature information, and improve the segmentation accuracy of annual rings [34].
Figure 1. Algorithm framework.
Electronics 12 03009 g001

3.2. U-Net Model with VGG16 as Backbone Network

In this paper, U-Net uses the VGG16 model as the backbone network, and its structure is shown in Figure 2. The model consists of five encoders, four decoders, four same-layer jump connections, and one 1 × 1 convolution operation. The Rectified Linear Unit (ReLU) linear rectification function is chosen as the activation function, which is most commonly used in deep learning [35]. Encoder1 contains two convolution operations (convolution kernel = 64), Encoder2 contains one downsampling and two convolution operations (convolution kernel = 128), Encoder3 contains one downsampling and three convolution operations (convolution kernel = 256), Encoder4 contains one downsampling and three convolution operations (convolution kernel = 512), and Encoder5 contains one downsampling and three convolution operations (convolution kernel = 512). Decoder1–Decoder4 each consist of one upsampling and two convolution operations with the same number of convolution kernels (512, 256, 128, and 64 for each decoder, respectively). The number of feature map channels is halved after each upsampling. The output of each encoder is spliced with the upsampled output from the decoder on the same layer as the encoder, so as to fuse the deep and shallow features. Finally, the output of Decoder1 is processed by 1 × 1 convolution (the number of convolution kernels is equal to the number of classifications) to obtain the objective image. In this experiment, the input image is 3 channels, and the dual-channel image is obtained after processing. The convolution operation in both the encoder and decoder above is 3 × 3. The detailed configuration of the encoder and decoder is shown in Table 1 and Table 2.

3.3. Attention Mechanisms

3.3.1. Convolutional Block Attention Module (CBAM)

CBAM combines the spatial attention mechanism with the channel attention mechanism, and its structure is shown in Figure 3. After inputting the feature maps, the maximum pooling and average pooling are first performed based on the width and height, respectively. The number of channels is kept constant and two feature maps of size 1 × 1 are output. The feature maps are processed by 1 × 1 convolution operation and ReLU activation function to obtain the attention weights of the channel dimensions. The attention weights are normalized through Sigmoid [36], after which the original feature maps are weighted channel-by-channel to complete the feature augmentation of the channel dimensions, and finally Features-C is obtained. Features-C is input into the spatial attention mechanism, and two single-channel feature maps are obtained after maximum pooling and average pooling based on the channel dimensions, respectively. Then, two single-channel feature maps are concatenated to obtain a dual-channel feature map. Finally, the dual-channel feature map is convolved to generate a single-channel feature map. This single-channel feature map is normalized by Sigmoid and then multiplied with Features-C to make the final feature map, which is feature-enhanced in both spatial and channel dimensions.

3.3.2. Dual-Input Channel Attention Mechanism (DCAM)

Attention mechanisms are widely used in the field of semantic segmentation, such as CBAM, SENet [37], ECA [38], etc. They have a low utilization of the whole information of the network because they only weigh the feature maps and do not make full use of the rich semantic information at the deeper level. To solve the above problems, this paper proposes a dual-input channel attention mechanism (DCAM), which uses deep semantic information for weighting guidance of shallow features, and its structure is shown in Figure 4. The inputs of DCAM are deep feature maps and shallow feature maps. For the deep feature maps, maximum pooling and average pooling are respectively performed in the spatial dimension to obtain two feature maps of size 1 × 1. Both the feature maps are first processed by a 1 × 1 convolution operation (the number of convolution kernels is half of the number of channels) and a ReLU activation function, and then a 1 × 1 convolution operation is processed (the number of convolution kernels is equal to the number of input channels) to ensure that the feature maps contain enough semantic information. Two 1 × 1 feature maps after convolution are fused and processed by Sigmoid to finally obtain the deep feature map with enhanced channel dimension. A 3 × 3 convolution operation with padding = 1 is performed on the shallow feature map so that it has the same number of channels, width, and height as the deep feature map. Finally, the output after Sigmoid processing is multiplied with the shallow feature map which is convolution-processed to complete the weighting guidance for the shallow features from the deep semantic information.

3.4. Dense Jump Links Combined with Attention Mechanisms

Using a dense jump link to fill the U-Net model and reconstruct image features through both deep and shallow information increases the utilization of deep information.However, the diversity of features is not considered, so the underutilization of global semantic information leads to poor edge detail segmentation [39,40].
For these problems, the DAF-Net++ model is proposed in this paper. The model, based on the U-Net, of which VGG16 is the backbone network, combines dense jump links with two attention mechanisms (CBAM, DCAM) to improve the utilization of global information. The relative weights of features are changed according to the annual ring objective to improve the segmentation effect of the model on details. The introduction of DCAM improves the utilization of global information. CBAM solves the problem of semantic information loss in the downsampling process. Replacing the original encoding path of U-Net with VGG16 can improve the feature extraction effect of the model. The DAF-Net++ model is shown in Figure 5. X i , j is the feature extraction module, and the specific structure is shown in Figure 6. The feature extraction module includes n times 3 × 3 convolution operations and one ReLU activation. n = 2 when i  ( 2 , 3 , 4 ) and j = 1, and n = 3 in other cases. CBAM is added after the first feature extraction module in each layer.
Firstly, the original image input to the network model is encoded by the feature extraction module, and the encoding process includes five downsamplings.The feature maps obtained after each downsampling are input into CBAM for feature enhancement, and then input to the next feature extraction module. Each feature extraction module is linked by nested dense jump links. The input of the feature extraction module consists of two parts, one is the output of the CBAM or feature extraction module of the same layer, and the other one is the result of the upsampling of the corresponding module from the next layer. Therefore, each feature extraction module is fused with the features of the foregoing layers. The iterating stops if there is no upsampling output from the next layer. The iterative formula is shown in Equation (1).
X i , j = C ( X i , j ) , C ( [ CBAM i , U ( CBAM ( i + 1 ) ) ] ) , C ( [ CBAM i , [ X i , m ] m = 2 j 1 , U ( X i + 1 , j 1 ) ] ) , j = 1 j = 2 j > 2
C(•) denotes feature extraction, CBAMi is the CBAM output of the i-th layer, [•] means the splicing of feature maps, and U(•) means upsampling.
Figure 5. DAF-Net++ network structure.
Electronics 12 03009 g005
Figure 6. A module for feature extraction.
Electronics 12 03009 g006
When the dense jump is linked to the feature extraction module at the end of this layer, the output of DCAM is input into the feature extraction module at the end of the same layer instead of the output of CBAM. The output of CBAM on the same layer and the output at the end of the next layer are the inputs to DCAM. Taking the two-layer structure and three-layer structure as examples, in the two-layer structure, the downsampling results of X 1 , 1 are input into X 2 , 1 after being processed by CBAM1. The output of X 2 , 1 is processed by CBAM2 and upsampling and then input into X 1 , 2 . The output of CBAM1 and CBAM2 are jointly input into DCAM, and the output of DCAM is input into X 1 , 2 . The two-layer structure is shown in Figure 5a. In the three-layer structure, the DCAM inputs of the first layer are CBAM1 and X 2 , 2 , and the DCAM inputs of the second layer are CBAM2 and CBAM3. Thus, the input of X 1 , 3 is the output of the DCAM of layer 1 and the upsampling result of the output of X 2 , 2 . The input of X 2 , 2 is the output of the DCAM of layer 2 and the upsampling result of the output of CBAM3 of layer 3. The three-layer structure is shown in Figure 5b. In the same manner, the connection of the five-layer structure is obtained, as shown in Figure 5c.

3.5. Focal Loss

Considering the annual rings as positive samples and the background as negative samples, the annual rings are fine-grained. The proportion of positive samples in the whole image is small, which leads to the imbalance of positive and negative samples in the image. This makes the change in loss values of negative samples dominate the model learning process, which makes the network focus less on positive samples. Therefore, in the semantic segmentation for annual rings, the cross-entropy (CE) loss function is improved to reduce the contribution of background loss value by introducing classification coefficients. It propels the learning of the network model to focus on positive samples that are difficult to classify [41]. The specific derivation process is shown in Equations (2)–(5).
C E ( p , y ) = l o g ( p ) , i f y = 1 l o g ( 1 p ) , o t h e r w i s e
p t = p , i f y = 1 1 p , o t h e r w i s e
Equations (2) and (3) are organized to obtain Equation (4).
C E ( p , y ) = C E ( p t ) = l o g ( p t )
Define Focal Loss (FL) as in Equation (5).
F L ( p t ) = α t ( 1 p t ) γ l o g ( p t )
α t is related to the number of categories to be classified and helps to address the imbalance of categories. p t means the probability of correct prediction, and a larger p t indicates that the predicted value is closer to the true value. ( 1 p t ) γ is the adjustment factor and γ is an adjustable focusing parameter ( γ ≥ 0). The method increases the loss contribution of hard-to-classify samples and makes the network learning more targeted. Several pre-experiments were conducted for FL with different parameters for wood annual rings. The final effect of the model was best only when α t = 0.5 and γ = 2. The change in loss values caused by the change in p t from 0.01 to 1 was recorded, as shown in Figure 7.

4. Experimental Preparation

4.1. Data Processing

The experimental material was Chinese fir taken from the eaves purlin of Wu’s home in Fengqi, Ningde, Fujian Province. A Medical CT was applied to acquire transverse sectional images of wood. The X-ray source voltage was set to 120 kV, the current was set to 30 mA, the data acquisition spacing was 0.6 mm, and the layer thickness was 0.4 mm. The inspection process was shown in Figure 8. Firstly, the object was placed on the inspection bed of the CT equipment, then it was slowly slid into the inspection hole with the bed. After that, the X-ray emitter and receiver rotated around the object to capture the X-ray energy passing through the object. The energy was converted into digital information in the CT equipment, and finally 1700 transverse section images by reconstruction algorithm were obtained. The image size was 512 px × 512 px, and the bitmap depth was 32, because there was a large black background in the original CT image, and the pixels in this background were useless information. Therefore, the image size was converted to 200 px × 170 px after removing the black background, and the bitmap depth was 24. The Labelme program was used to mark annual rings and output images. The pixel gray value of the annual rings was set as 1 and the background pixel gray value was 0. A total of 100 images were randomly selected as the training set. The remaining 20 were used as the test set to evaluate the performance of the model. The training set images as well as the corresponding labeled images were expanded by three 90° rotations, with vertical and horizontal mirroring. The final number of images was increased to 1000 for data enhancement purposes.

4.2. Training Hyper Parameters

The hardware configuration of the computer used in this experiment was as follows: Intel(R) Xeon(R) Gold 6136 CPU @ 3.00 GHz 2.99 GHz, 192 GB of RAM, and NVIDIA GeForce RTX 3090 GPU to accelerate the network training. The software configuration was as follows: the computer operating system was Windows 10 Professional, and the network was built by the Python language and the PyTorch dynamic development framework, the versions were Python 3.7 and CUDA 10.1. VGG16’s initialized pre-training weights were used for training. To fine-tune the weights, 50 rounds of freeze training were conducted initially with the learning rate of 0.0001. To modify the weights, 170 rounds of thaw training were performed with the learning rate of 0.00001. StepLR was the learning rate update strategy for both training methods, and Adam was chosen as optimizer. The training hyper parameters presented in this paper were the best found solution generated from a series of pre-experiments.

4.3. Comprehensive Evaluation Index

The target of this paper is only annual rings; therefore, k = 1 denotes the total number of pixels that actually belong to class i but are predicted to be class j. p i i denotes true positives, p i j denotes false positives, and p j i denotes false negatives.
The pixel accuracy (PA) is the ratio of the number of correctly classified pixel points to the total number of pixel points. This index reflects the accuracy of segmentation at the pixel level. The closer its value is to 1, the better the segmentation performance, and the formula is as in Equation (6).
P A = i = 0 k p i i i = 0 k j = 0 k p i j
The mean pixel accuracy (MPA) is the average of the ratio of correctly classified pixel points in each class to the total number of pixel points in that class. This index can reflect the average segmentation performance of the model when facing different targets. The closer its value is to 1, the better the segmentation performance, and the formula is as in Equation (7).
M P A = 1 k + 1 i = 0 k p i i j = 0 k p i j
Recall is the percentage of positive samples with correct predictions to all samples with correct predictions. This index can reflect the degree of targeting of the model to the segmented object. The closer its value is to 1, the better the segmentation performance, and the formula is as in Equation (8).
R e c a l l = i = 0 k p i i i = 0 k p i i + j = 0 k p j j
The Mean Intersection over Union (MIoU) is obtained by averaging the Intersection over Union (IoU) of each category. This index perfectly reflects the integrity of the segmentation area and the accuracy of the segmentation position. The formula is as in Equation (9).
M I o U = 1 k + 1 i = 0 k p i i j = 0 k p i j + j = 0 k p j i p i i

5. Results and Discussion

The DAF-Net++ model is generated by improving the U-Net with VGG16 as the backbone network, which can solve many segmentation problems of annual rings, such as fine shapes and many disturbances. The model uses a combination of DCAM, CBAM, and dense jump links and introduces the Focal Loss calculation method at the back-end of the network. A significant amount of information was recorded during the model improvement process, including training loss, comprehensive evaluation index, training time, and prediction time. DAF-Net++ was compared with different improved models as well as the classical semantic segmentation model. The different improvements of the models are shown in Table 3.

5.1. Training Results

The loss value represents the difference between the predicted value and the true value. The loss value is inversely proportional to the segmentation performance of the objective, which means that the smaller the loss value is, the better the segmentation performance of the model on the objective appears. Focal Loss is introduced on the basis of the U-Net model whose backbone network is VGG16 to form U-Net-F. Dense jump links are introduced to U-Net-F to form U-Net-FS. After that, DCAM is added to let the deep features provide weighting guidance for the shallow features, and U-Net-FSD is formed. Finally, DAF-Net++ is generated by adding CBAM to U-Net-FSD for the purpose of feature enhancement of the downsampling results. The effect of different methods on the loss values was explored by experimenting with the models in Table 3. The U-Net to U-Net-FSD training loss values converged to 0.1725, 0.094, 0.0849, and 0.0751, and the validation loss values converged to 0.1673, 0.0922, 0.0826, and 0.0748. The DAF-Net++ training loss value and validation loss value, respectively, converged to 0.0589 and 0.0624. The trends of the training loss values as well as the validation loss values of different improved models during the training process are shown in Figure 9 and Figure 10. From the trend of loss value, it can be seen that the loss values of DAF-Net++ decrease rapidly in the first 50 iterations, and tend to be steady and converge gradually after 100 iterations. Compared with the U-Net model, the convergence rate of DAF-Net++ is steadier and the loss values are smaller after convergence, which indicates that the model has the best segmentation effect.

5.2. Segmentation Results

The effects of different modules on the U-Net model were recorded. MIoU, MPA, PA, and Recall were used as comprehensive evaluation indices of the network model, and larger values indicated better model prediction. Compared with the U-Net model, whose backbone network is VGG16, the MIoU of DAF-Net++ increased by 3.62%, the MPA by 2.44%, the PA by 1.61% and the Recall by 2.44%. The results show that DAF-Net++ is more suitable for the segmentation of annual rings. The results of the comprehensive evaluation indices of the experiment are shown in Table 4.
Among the four comprehensive evaluation indices mentioned above, MIoU reflects the integrity of the segmentation area and the accuracy of the segmentation position. Therefore, it is used as the final evaluation index. Experiments are performed on 20 images from the test set with different improved U-Net models. The MIoU is compared individually, as shown in Figure 11. It is found that DAF-Net++ obtains the highest MIoU and has the best annual rings segmentation effect.
Comparing the labeled images and the segmented images of annual rings under different models, the results are shown in Figure 12. The results show that DAF-Net++ can effectively segment the densely arranged annual rings, and produces no mixed annual rings at the node edges. It has good recovery ability for the broken condition of annual rings. In addition, it can accurately segment the rings in the interstices of wormholes and reproduce the morphology of rings under the interference of wormhole defects. This fully illustrates that the introduction of the attention mechanism, dense jump links, and Focal Loss is very effective in improving the model segmentation ability.
Figure 11. MIoU of different improved models on test set images.
Electronics 12 03009 g011
Deep learning methods are closely related to experimental equipment. In general, the more complex the model is, the more demanding the experimental equipment needs. This leads to a larger final file weight, and takes more time for prediction. At present, the real-time performance of deep learning methods is an important indicator for solving practical production problems. The semantic segmentation task for the annual rings does not require high prediction speed. However, its prediction time, training time, and the number of weight file parameters are also factors greatly concerning scholars. The relevant data of model improvement are given in Table 5.
Table 3. Improvement methods of the model.
DCAMCDAMFocall LossSkip Connections
U-Net----
U-Net-F---
U-Net-FS--
U-Net-FSD-
DAF-Net++
As can be seen from Table 5, the introduction of Focal Loss does not increase the complexity of the model. It can improve the segmentation accuracy and optimize the prediction effect. The addition of dense jump links and attention mechanisms leads to larger model sizes and longer training and prediction time. Due to the combination of dense jump links with CBAM and DCAM, it increases the semantic information contained in the feature maps, enlarges the perceptual field, and improves the segmentation accuracy of the model. It also inevitably increases the computation requirement and time cost.

5.3. Algorithm Comparison

5.3.1. Comparison of Classical Algorithms

The loss values converged after 170 training sessions through DAF-Net++, and the model weights that performed best in training were used for segmentation experiments on 20 wood CT images. The results are compared with the best-performing model weights in training of current representative semantic segmentation models, including U-Net, U-Net++, HRNet [42], PSPNet [43], and DeepLabv3+ [44]. Comprehensive evaluation indices were recorded. MIoU is used to compare the model segmentation performance, which can reflect the integrity of the segmentation region and the accuracy of the segmentation position. Comparing with the MIoU of classical models, DAF-Net++ outperforms the current classical semantic segmentation models. The comprehensive evaluation indices are shown in Table 6.
Table 4. Comprehensive evaluation indices of the models.
MIoU (%)MPA (%)PA (%)Recall (%)
DAF-Net++93.67 96.7696.6396.76
U-Net-FSD92.3296.0695.8596.06
U-Net-FS91.7695.6695.5295.66
U-Net-F91.2395.3595.3495.35
U-Net90.0594.3295.0294.32
Cracks are the most common disturbance in wood CT images, which often work together with worm holes and knots to affect the segmentation effect. In this paper, we use the segmentation model in Table 6 to make comparative experiments for both cases of cracks and knots or cracks and wormholes. The CT images with knots interference were selected for prediction, and the results were visualized, as shown in Figure 13. The comparison shows that DAF-Net++ has the best segmentation effect at the knots, and the annual rings at the edges of the knots are rather clearly segmented and have no overlap. The whole outline of the annual rings segmented by PSPNet was blurred, HRNet segmented inaccurately in the dense area of the annual rings as well as in the node parts, DeepLabv3+ could not guarantee the integrity of the annual rings around the knots, while U-Net and U-Net++ produced overlaps of annual rings at the edges of knots.
The CT images with wormhole interference were selected for prediction, and the results were visualized, as shown in Figure 14. The cracks together with wormholes are disturbances that negatively affect the morphology of the annual rings around. When the wormholes are independent of and unconnected to each other, the worst segmentation is achieved by PSPNet. It only recognizes the faint outline of the annual rings. When the annual rings are between the individual wormholes, HRNet has a poor segmentation effect on the annual rings, producing broken annual rings. DeepLabv3+ was unable to segment the annual rings around the wormholes, indicating that the wormholes had a negative effect on the segmentation of the annual rings. The disadvantage of U-Net and U-Net++ is that they are unable to accurately segment the pixels of annual rings’ details. For large-scale defects such as multiple connected wormholes, the classical segmentation models provide poor segmentation. Large blanks appear in the predicted images. Ignoring pixels between dense defects leads to inaccurate segmentation of the annual rings near the defects. In contrast, DAF-Net++ segmentation works best against wormholes interference, and can effectively overcome many types of wormhole interference.
Six models were used to segment the annual rings of CT images that contained defects such as cracks, knots, and wormhole interference. The predicted images are summarized in Figure 15. Under various kinds of interference, the segmentation effects of different models are compared, and it can be concluded that PSPNet cannot accurately segment the annual rings under common interference. HRNet cannot recognize the annual rings at the edge of the knots, and a large blank appears in the predicted image when there are connected wormhole defects. With DeepLabv3+ it is easy to ignore the detailed pixels around wormhole defects at the pith of wood. U-Net and U-Net++ are not accurate enough for the segmentation of dense annual rings. In contrast, DAF-Net++ always has the best segmentation under various common interferences. It has apparent advantages in the reconstruction of the details and the morphology of annual rings. Meanwhile the PA, MPA, MIoU, and Recall of DAF-Net++ are better than the five classical semantic segmentation models. The above results show that DAF-Net++ is more suitable for difficult wood samples to segment for annual rings, and can effectively resist the interference of defects in wood images.

5.3.2. Comparison of the Latest Algorithms

To verify the superiority and novelty, the DAF-Net++ model was compared with the latest models of related researchers. The results show that the MIoU, MPA, PA, and Recall of the DAF-Net++ model are better than other models, as shown in Table 7. The comparison shows that the DAF-Net++ model has outstanding advantages over the latest segmentation models for segmentation of wood annual rings.
Table 5. Network time parameters.
Training Time (s)Predict Time (s/pic)Size of Model (KB)
DAF-Net++55,934.111.971197,394
U-Net-FSD53,426.211.083196,788
U-Net-FS16,638.401.46397,252
U-Net-F16,365.000.48797,247
U-Net16,638.600.48897,247
Table 6. Comparison of prediction results of different models.
ModelMIoU (%)MPA (%)PA (%)Recall (%)
DAF-Net++93.67 96.7696.6396.76
U-Net++92.6396.196.1496.1
U-Net90.0594.3295.0294.32
DeepLabv3+86.8993.7391.9993.73
HRNet86.6592.9692.492.86
PSPNet54.6766.569.0666.5
Table 7. Comparison of prediction results of latest models.
MethodMIoU (%)MPA (%)PA (%)Recall (%)Year
DAF-Net++93.6796.7696.6396.762023
Gargari et al. [45]92.6396.1096.1496.102022
Qin et al. [46]91.3294.5596.2994.552022
Wang et al. [47]90.0594.3295.0294.322021
Liu et al. [32]88.6394.6793.0894.672023
Ning et al. [31]86.8892.8792.7492.872023
Zhang et al. [40]78.9788.9186.8288.912022

6. Conclusions

For the wood annual rings, this paper proposes the DAF-Net++ model on the basis of improvement of the U-Net model. This model processes the deep and shallow feature maps with different attention mechanisms, respectively. DCAM uses deep semantic information for weighting guidance of shallow feature maps, and CBAM solves the problem of losing semantic information in downsampling. Deep and shallow features are fused by dense jump links to improve the gradient disappearance as well as the gradient explosion problem and to reduce the semantic divide. Obtaining more semantic information by increasing the number of channels in the feature maps allows the network to focus more on difficult classification objectives such as the annual rings during the training process. The feature maps of the CT images of each wood transverse section incorporate more semantic information and expand the sensory field. Therefore, the segmentation accuracy and optimization of the segmentation effect on annual rings mixed with cracks, knots, and the pith position of the wood are improved. The segmentation effect of DAF-Net++ is further enhanced by the introduction of Focal Loss at the back end of the network. The proposed DAF-Net++ model has 93.67% MIoU, 96.76% MPA, 96.63% Precision, and 96.76% Recall, and has better segmentation results compared with classical semantic segmentation models such as U-Net, U-Net++, DeepLabv3+, etc. However, it is very difficult to establish datasets and labels. On the one hand, wood samples with internal cracks, knots, and holes are needed to obtain transverse sectional images. On the other hand, to extract the annual rings from the complex background by image processing software is a huge workload. This led to an adequate experiment in this study only for fir trees. The DAF-Net++ model is fully applicable to a wide range of woods in terms of theoretical analysis. However, the experimental validation has not yet been performed because it is very difficult to obtain other wood species that meet the experimental conditions. The species diversity will be gradually enriched in future studies. In addition, the method increases the computation while increasing the semantic information, so it still needs to be improved in optimizing the training time. For example, updating hardware devices or making improvements in model structure. Chen Bing et al. [48] used the shallow ResNet-18 (Residual Network with 18 layers) network to replace the original deep backbone network of DeepLabv3+ to improve the segmentation speed. Zhu Lixue et al. [49] improved the model structure based on multi-scale serial dilated convolution to reduce the model computation. These studies provide inspiration for the team’s future research, which is of course a long process of exploration.

Author Contributions

All the authors contributed extensively to the manuscript. Z.G.: Contributed to algorithm development, programming, paper writing and revision. Z.Z.: Revisions and suggestions were made to the thesis. L.S.: Helped with formatting, review and editing of the paper. S.L.: Further optimization of experimental methods has been assisted. Y.G.: All materials used in the experiment were provided. Y.Z.: A major contribution to the advancement and development of the project. Q.S.: The grammar of the paper was checked and corrected. All authors have read and agreed to the published version of the manuscript.

Funding

This work was supported by the Natural Science Foundation of Shandong Province, China (Grant No. ZR2020QC174), the Application of Computed Tomography (CT) Scanning Technology to Damage Detection of Timber Frames of Architectural Heritage (Grant No. 2020ZCK206), and the Taishan Scholar Project of Shandong Province, China (Grant No. 2015162).

Acknowledgments

The authors are grateful for the youth project of the Shandong Natural Science funds, Project No. ZR2020QC174.

Conflicts of Interest

The authors declare no conflict of interest.

References

  1. Nakamura, T.; Masuda, K.; Miyake, F.; Nagaya, K.; Yoshimitsu, T. Radiocarbon Ages of Annual Rings from Japanese Wood: Evident Age Offset Based on IntCal09. Radiocarbon 2013, 55, 763–770. [Google Scholar] [CrossRef] [Green Version]
  2. Killingbeck, K.T. Tracking growth and age in the drought-deciduous shrub Fouquieria splendens (ocotillo) in the Chihuahuan Desert: The role of wood rings and stem segments. Southwest. Nat. 2016, 61, 217–224. [Google Scholar] [CrossRef]
  3. Fei, B.; Ruan, X. Effects of Temperature and Precipitation on Tree-ring and Wood Density of Ginkgo in Beijing. For. Res. 2001, 14, 176–180. [Google Scholar]
  4. Fan, Y.; Shang, H.; Yu, S.; Wu, Y.; Li, Q. Understanding the Representativeness of Tree Rings and Their Carbon Isotopes in Characterizing the Climate Signal of Tajikistan. Forests 2021, 12, 1215. [Google Scholar] [CrossRef]
  5. Ghalem, A.; Barbosa, I.; Bouhraoua, R.T.; Costa, A. Climate Signal in Cork-Ring Chronologies: Case Studies in Southwestern Portugal and Northwestern Algeria. Tree-Ring Res. 2018, 74, 15–27. [Google Scholar] [CrossRef]
  6. Grissino-Mayer, H.D.; Schneider, E.A.; Rochner, M.L.; Stachowiak, L.A.; Dennison, M.E. Tree-ring dating of timbers from Sabine Hill, home of General Nathaniel Taylor, Elizabethton, Tennessee, USA. Dendrochronologia 2017, 43, 33–40. [Google Scholar] [CrossRef]
  7. Arteau, J.; Boucher, T.; Poirier, A.; Widory, D. Historical smelting activities in Eastern Canada revealed by Pb concentrations and isotope ratios in tree rings of long-lived white cedars (Thuja occidentalis L.). Sci. Total Environ. 2020, 740, 139992. [Google Scholar] [CrossRef] [PubMed]
  8. Watmough, S.A.; Hutchinson, T.C. Historical changes in lead concentrations in tree-rings of sycamore, oak and Scots pine in north-west England. Sci. Total Environ. 2002, 293, 85–96. [Google Scholar] [CrossRef] [PubMed]
  9. Shao, X.; Huang, L.; Liu, H.; Liang, E.; Fang, X.; Wang, L. Reconstruction of precipitation variation from tree rings in recent 1000 years in Delingha, Qinghai. Sci. China 2005, 48, 939–949. [Google Scholar] [CrossRef] [Green Version]
  10. Arroyo-Morales, S.; Astudillo-Sanchez, C.C.; Aguirre-Calderon Oscar, A.; Villanueva-Diaz, J.; Soria-Diaz, L.; Martinez-Sifuentes, A.R. A precipitation reconstruction based on pinyon pine tree rings from the northeastern Mexican subtropic. Theor. Appl. Climatol. 2023, 151, 635–649. [Google Scholar] [CrossRef]
  11. Copes, D.L.; Oliver, D.M. The Relationship between Douglas-Fir Graft Compatibility and Wood Specific Gravity. J. For. 1970, 68, 726. [Google Scholar]
  12. Fabijanska, A.; Danek, M.; Barniak, J.; Piorkowski, A. Towards automatic tree rings detection in images of scanned wood samples. Comput. Electron. Agric. 2017, 140, 279–289. [Google Scholar] [CrossRef]
  13. Ning, X.; Zhao, P. Image segmentation of tree ring based on the random forest algorithm. J. For. Eng. 2018, 3, 125–130. [Google Scholar]
  14. Cheng, Y.; Li, Z.; Sun, Y. Detection Algorithm of Wood Rings Image Based on Texture Feature. For. Eng. 2018, 34, 46–49. [Google Scholar]
  15. Krizhevsky, A.; Sutskever, I.; Hinton, G.E. ImageNet Classification with Deep Convolutional Neural Networks. Commun. ACM 2017, 60, 84–90. [Google Scholar] [CrossRef] [Green Version]
  16. Long, J.; Shelhamer, E.; Darrell, T. Fully Convolutional Networks for Semantic Segmentation. IEEE Trans. Pattern Anal. Mach. Intell. 2015, 39, 640–651. [Google Scholar]
  17. Ronneberger, O.; Fischer, P.; Brox, T. U-net: Convolutional networks for biomedical image segmentation. In Medical Image Computing and Computer-Assisted Intervention—MICCAI 2015, Proceedings of the 18th International Conference, Munich, Germany, 5–9 October 2015; Springer: Berlin/Heidelberg, Germany, 2015; pp. 234–241. [Google Scholar]
  18. Norman, B.; Pedoia, V.; Majumdar, S. Use of 2D U-Net Convolutional Neural Networks for Automated Cartilage and Meniscus Segmentation of Knee MR Imaging Data to Determine Relaxometry and Morphometry. Radiology 2018, 288, 177–185. [Google Scholar] [CrossRef] [Green Version]
  19. Khorasani, A.; Kafieh, R.; Saboori, M.; Tavakoli, M.B. Glioma segmentation with DWI weighted images, conventional anatomical images, and post-contrast enhancement magnetic resonance imaging images by U-Net. Phys. Eng. Sci. Med. 2022, 45, 925–934. [Google Scholar] [CrossRef] [PubMed]
  20. Xue, L.Y.; Lin, J.W.; Cao, X.R.; Zheng, S.H.; Yu, L. A saliency and Gaussian net model for retinal vessel segmentation. Front. Inf. Technol. Electron. Eng. 2019, 20, 64–76. [Google Scholar] [CrossRef]
  21. Dai, Y.; Liu, W.; Dong, X.; Song, Y. U-Net CSF Cells Segmentation Based on Attention Mechanism. J. Northeast. Univ. (Nat. Sci.) 2022, 43, 944–950. [Google Scholar]
  22. Zhou, Z.; Siddiquee, M.M.R.; Tajbakhsh, N.; Liang, J. UNet plus plus: A Nested U-Net Architecture for Medical Image Segmentation. In Deep Learning in Medical Image Analysis and Multimodal Learning for Clinical Decision Support, Proceedings of the 4th International Workshop, DLMIA 2018, and 8th International Workshop, ML-CDS 2018, Held in Conjunction with MICCAI 2018, Granada, Spain, 20 September 2018; Springer: Berlin/Heidelberg, Germany, 2018; Volume 11045, pp. 3–11. [Google Scholar]
  23. Gao, Z.; Wang, X.; Li, Y. Automatic Segmentation of Macular Edema in Retinal OCT Images Using Improved U-Net++. Appl. Sci. 2020, 10, 5701. [Google Scholar] [CrossRef]
  24. Huang, H.; Lu, R.F.; Tao, J.L.; Li, Y.; Zhang, J.Q. Segmentation of Lung Nodules in CT Images Using Improved U-Net++. Acta Photonica Sin. 2021, 50, 73–83. [Google Scholar]
  25. Simonyan, K.; Zisserman, A. Very Deep Convolutional Networks for Large-Scale Image Recognition. arXiv 2014, arXiv:1409.1556. [Google Scholar]
  26. Lin, T.Y.; Goyal, P.; Girshick, R.; He, K.; Dollár, P. Focal Loss for Dense Object Detection. IEEE Trans. Pattern Anal. Mach. Intell. 2020, 42, 318–327. [Google Scholar] [CrossRef] [PubMed] [Green Version]
  27. Wang, W.; Zhou, T.; Yu, F.; Dai, J.; Gool, L.V. Exploring Cross-Image Pixel Contrast for Semantic Segmentation. In Proceedings of the IEEE/CVF International Conference on Computer Vision, Montreal, QC, Canada, 11–17 October 2021; pp. 7303–7313. [Google Scholar]
  28. Zhou, T.; Zhang, M.; Zhao, F.; Li, J. Regional Semantic Contrast and Aggregation for Weakly Supervised Semantic Segmentation. In Proceedings of the IEEE/CVF Conference on Computer Vision and Pattern Recognition (CVPR), New Orleans, LA, USA, 18–24 June 2022; pp. 4299–4309. [Google Scholar]
  29. Zhou, T.; Wang, W.; Konukoglu, E.; Van Gool, L. Rethinking Semantic Segmentation: A Prototype View. In Proceedings of the IEEE/CVF Conference on Computer Vision and Pattern Recognition (CVPR), New Orleans, LA, USA, 18–24 June 2022; pp. 2582–2593. [Google Scholar]
  30. Anna, F.; MałGorzata, D. DeepDendro—A tree rings detector based on a deep convolutional neural network. Comput. Electron. Agric. 2018, 150, 353–363. [Google Scholar]
  31. Ning, X.; Zhao, P. Segmentation algorithm of annual ring image based on U—Net convolution network. Chin. J. Ecol. 2019, 38, 1580–1588. [Google Scholar]
  32. Liu, S.; Ge, Z.; Liu, X.; Gao, Y.; Li, Y.; Li, M. Improved UNet++ for Tree Rings Segmentation of Chinese Fir CT Images. Comput. Eng. Appl. 2023, 1–11. [Google Scholar]
  33. Woo, S.; Park, J.; Lee, J.Y.; Kweon, I.S. CBAM: Convolutional Block Attention Module. Proc. Eur. Conf. Comput. Vis. 2018, 11211, 3–19. [Google Scholar]
  34. Zhang, J.; Yang, X.; Li, W.; Zhang, S.; Jia, Y. Automatic detection of moisture damages in asphalt pavements from GPR data with deep CNN and IRS method. Autom. Constr. 2020, 113, 103119. [Google Scholar] [CrossRef]
  35. Xu, B.; Wang, N.; Chen, T.; Li, M. Empirical Evaluation of Rectified Activations in Convolutional Network. arXiv 2015, arXiv:1505.00853. [Google Scholar]
  36. Badrinarayanan, V.; Kendall, A.; Cipolla, R. SegNet: A Deep Convolutional Encoder-Decoder Architecture for Image Segmentation. IEEE Trans. Pattern Anal. Mach. Intell. 2017, 39, 2481–2495. [Google Scholar] [CrossRef]
  37. Hu, J.; Shen, L.; Albanie, S.; Sun, G.; Wu, E. Squeeze-and-Excitation Networks. IEEE Trans. Pattern Anal. Mach. Intell. 2020, 42, 2011–2023. [Google Scholar] [CrossRef] [PubMed] [Green Version]
  38. Wang, Q.; Wu, B.; Zhu, P.; Li, P.; Hu, Q. ECA-Net: Efficient Channel Attention for Deep Convolutional Neural Networks. In Proceedings of the 2020 IEEE/CVF Conference on Computer Vision and Pattern Recognition (CVPR), Seattle, WA, USA, 13–19 June 2020; pp. 11534–11542. [Google Scholar]
  39. Xia, M.; Cui, Y.; Zhang, Y.; Xu, Y.; Liu, J.; Xu, Y. DAU-Net: A novel water areas segmentation structure for remote sensing image. Int. J. Remote Sens. 2021, 42, 2594–2621. [Google Scholar] [CrossRef]
  40. Zhang, Z.; Yao, Y.; Shi, Z.; Wang, H.; Qiao, Z.; Wang, S.; Qin, L.; Du, S.; Luo, F.; Liu, W. Deep learning for potential field edge detection. Chin. J. Geophys. 2022, 65, 1785–1801. [Google Scholar]
  41. Chen, X.; Zhao, C.; Xi, J.; Lu, Z.; Ji, S.; Chen, L. Deep Learning Method of Landslide Inventory Map with Imbalanced Samples in Optical Remote Sensing. Remote Sens. 2022, 14, 5517. [Google Scholar] [CrossRef]
  42. Wang, J.; Sun, K.; Cheng, T.; Jiang, B.; Xiao, B. Deep High-Resolution Representation Learning for Visual Recognition. IEEE Trans. Pattern Anal. Mach. Intell. 2020, 43, 3349–3364. [Google Scholar] [CrossRef] [Green Version]
  43. Zhao, H.; Shi, J.; Qi, X.; Wang, X.; Jia, J. Pyramid Scene Parsing Network. In Proceedings of the IEEE Conference on Computer Vision and Pattern Recognition 2017, Honolulu, HI, USA, 21–26 July 2017; pp. 6230–6239. [Google Scholar]
  44. Chen, L.C.; Zhu, Y.; Papandreou, G.; Schroff, F.; Adam, H. Encoder-Decoder with Atrous Separable Convolution for Semantic Image Segmentation. In Proceedings of the European Conference on Computer Vision (ECCV), Munich, Germany, 8–14 September 2018; pp. 833–851. [Google Scholar]
  45. Safarkhani, G.M.; Hojjat, S.M.; Mehdi, A. Segmentation of Retinal Blood Vessels Using U-Net++ Architecture and Disease Prediction. Electronics 2022, 11, 3516. [Google Scholar]
  46. Xuebin, Q.; Zichen, Z.; Chenyang, H.; Masood, D.; Martin, J. U2-Net: Going deeper with nested U-structure for salient object detection. Pattern Recognit. 2020, 106, 107404. [Google Scholar]
  47. Xiangyu, W.; Haisheng, L.; Lijun, L.; Danfeng, H.; Ziqiang, W. Segmentation of Cucumber Target Leaf Spot Based on U-Net and Visible Spectral Images. Spectrosc. Spectr. Anal. 2021, 41, 1499–1504. [Google Scholar]
  48. Bing, C.; Sheng, H.; Jian, L.; Shengfeng, C.; Enhui, L. Weld Structured Light Image Segmentation Based on Lightweight DeepLabv3+ Network. Chin. J. Lasers 2023, 50, 49–58. [Google Scholar]
  49. Lixue, Z.; Rongda, W.; Genping, F.; Shiang, Z.; Chenyu, Y.; Tianci, C.; Peichen, H. Segmenting banana images using the lightweight UNet of multi-scale serial dilated convolution. Trans. Chin. Soc. Agric. Eng. 2022, 38, 194–201. [Google Scholar]
Figure 2. U-Net model with VGG16 as backbone network.
Electronics 12 03009 g002
Figure 3. CBAM structure.
Electronics 12 03009 g003
Figure 4. DCAM structure.
Electronics 12 03009 g004
Figure 7. Change of loss value obtained by different loss function.
Electronics 12 03009 g007
Figure 8. Data are collected through CT equipment.
Electronics 12 03009 g008
Figure 9. Change in training loss value.
Electronics 12 03009 g009
Figure 10. Change in validation loss value.
Electronics 12 03009 g010
Figure 12. Visualization comparison of prediction images with wormholes.
Electronics 12 03009 g012
Figure 13. Visualization comparison of prediction images with knots.
Electronics 12 03009 g013
Figure 14. Visualization comparison of prediction images with wormholes.
Electronics 12 03009 g014
Figure 15. Predicted images by different models.
Electronics 12 03009 g015
Table 1. Table of encoder configurations.
NumberMax PoolKernel SizeNumber of KernelsConvolutional TimesActivation Function
Encoder1-3 × 3conv642ReLu
Encoder2Max pool 2 × 23 × 3conv1282ReLu
Encoder3Max pool 2 × 23 × 3conv2563ReLu
Encoder4Max pool 2 × 23 × 3conv5123ReLu
Encoder5Max pool 2 × 23 × 3conv5123ReLu
Table 2. Table of decoder configurations.
NumberUp-ConvKernel SizeNumber of KernelsConvolutional TimesActivation Function
Decoder1-3 × 3conv642ReLu
Decoder2Up-Conv 2 × 23 × 3conv1282ReLu
Decoder3Up-Conv 2 × 23 × 3conv2562ReLu
Decoder4Up-Conv 2 × 23 × 3conv5122ReLu
Disclaimer/Publisher’s Note: The statements, opinions and data contained in all publications are solely those of the individual author(s) and contributor(s) and not of MDPI and/or the editor(s). MDPI and/or the editor(s) disclaim responsibility for any injury to people or property resulting from any ideas, methods, instructions or products referred to in the content.

