1. Introduction
Recent years have brought a major change in terms of electrical energy generation, which is the turn towards renewable energy sources (RES). Climate change, along with new legal directives, forced an increase in participation in RES, so-called green sources in power systems [
1,
2,
3,
4]. One of the very popular groups among these devices are photovoltaic (PV) systems [
5,
6,
7]. The second very important group is energy generation systems utilizing wind turbines [
8,
9] as well as hybrid PV–wind systems [
10]. Wind turbines can be located both onshore and offshore, and they are very important elements in the context of transition to green energy production [
11,
12,
13].
Nowadays, a very popular method of connecting offshore wind farms with onshore power grids is to use direct current (DC) links, which cannot operate without converters [
14,
15]. This leads to an unequivocal conclusion that the increase in the number of offshore wind farms connected to power systems entails an increase in the number of converters, especially voltage source converters (VSCs). As it is known, VSCs have the unique ability to exchange active and reactive power independently. This ability could possibly be used to influence the alternating current (AC) grid’s voltage levels using a specific VSC’s operation mode [
16,
17,
18].
Many studies were conducted throughout the years, whose goals were to analyse VSC impact on the power system in different manners. In [
19], a three-phase VSC model is used to determine the steady-state operating characteristics of a VSC, taking into account the harmonic interactions. Steady-state operating conditions are also considered in [
20]. A detailed computer model of a VSC is presented in [
21]. Direct and vector control have been implemented to control the degrees of freedom related to the VSC transmission system. The author of the paper in [
22] describes a predictive-corrective control method of the VSC system. Two variants of space vector pulse width modulation (PWM) methods for VSC systems are investigated. The operation of VSC is analyzed for the model of VSC with a three-value transistor branch state function. Power system state estimation with the use of the generalized steady state multi-terminal VSC model is performed in paper [
23]. The effectiveness of the proposed state estimation algorithm is demonstrated. The authors of paper [
24] consider the high-voltage DC link’s converter substation for a reactive power regulator in the power system. It has been shown that there is a possibility of specific activation of the converter to both limit and increase the amount of consumed reactive power. In [
25], a sequential AC/DC power flow algorithm is implemented to solve networks containing multi-terminal VSC high-voltage DC system. In the analyses, the authors also took the converter losses into account using a generalized converter loss model. They underlined that this problem is often neglected or not taken into account in a proper way in VSC high-voltage DC power flows. Detailed analysis of the VSC high-voltage DC power system with the use of the model including reactor and converter losses is conducted in [
26]. Various control modes of converters and losses reduction have been investigated. The paper [
27] estimates the conversion power losses in the VSC converters as well as power losses occurring in DC cables, coupling transformer and filters. Taking these factors into account enables researchers to calculate the efficiency of the VSC high-voltage DC transmission links. A complete and unified DC power grid steady-state model is proposed in [
28]. This model includes a VSC inverter, DC bus, DC line, DC/DC converters. An AC/DC power flow algorithm is developed and validated by application to the CIGRE B4-58 DC power test system. The authors of the paper in [
29] discuss a nonlinear dynamic model for VSC-based high-voltage DC links. This model is composed of the main physical elements and is controlled by proportional integral (PI) controllers with antiwindup.
Generally, the published papers are focused on the operating area of the VSC converter in separation from the influence of the power system to which it is connected, which has some disadvantages. The active power–reactive power (P-Q) area constraints are then derived from the limits of currents, voltages, and modulation factor, and a ‘textbook’, symmetrical, idealised operating area is obtained. Using only a fixed theoretical P-Q area/curve can lead to an incorrect assessment of the impact of the converter on the power system. Consideration of the properties of the power system and its demand for active and reactive power indicates that the converter’s operating area may change depending on the current operating state of the system. Therefore, procedures for calculating load flow in the power grid should take into account not a rigidly defined converter operating area dependent on active power, reactive power, and voltage level, but the actual equations defining these constraints. This can be realised iteratively, as presented in the paper. The purpose of this work is to present a consistent VSC model, that fulfils its actual P-Q capability curve. The second goal is the analysis and evaluation of VSCs’ capabilities to impact the AC power system. The conducted analysis focuses on the whole VSC capability curve and the different operation points’ influence on AC grid behaviour. The results obtained in this work contribute to the knowledge and, thanks to them, the operation of VSC systems can be modelled more accurately, which is important as the number of converters connected to the power systems is growing rapidly. The DIgSILENT PowerFactory software was used to model the VSC systems [
30]. In the simulation studies, the guidelines contained in [
31,
32,
33] have been taken into account.
The paper is organized as follows.
Section 2 comments on the P-Q capability curve.
Section 3 describes the proposed VSC model. In
Section 4, the structure of the grid model for simulation tests, along with the research procedure, is presented. Results of the simulations and discussion are provided in
Section 5. Final conclusions are presented in
Section 6.
2. VSC P-Q Capability Curve
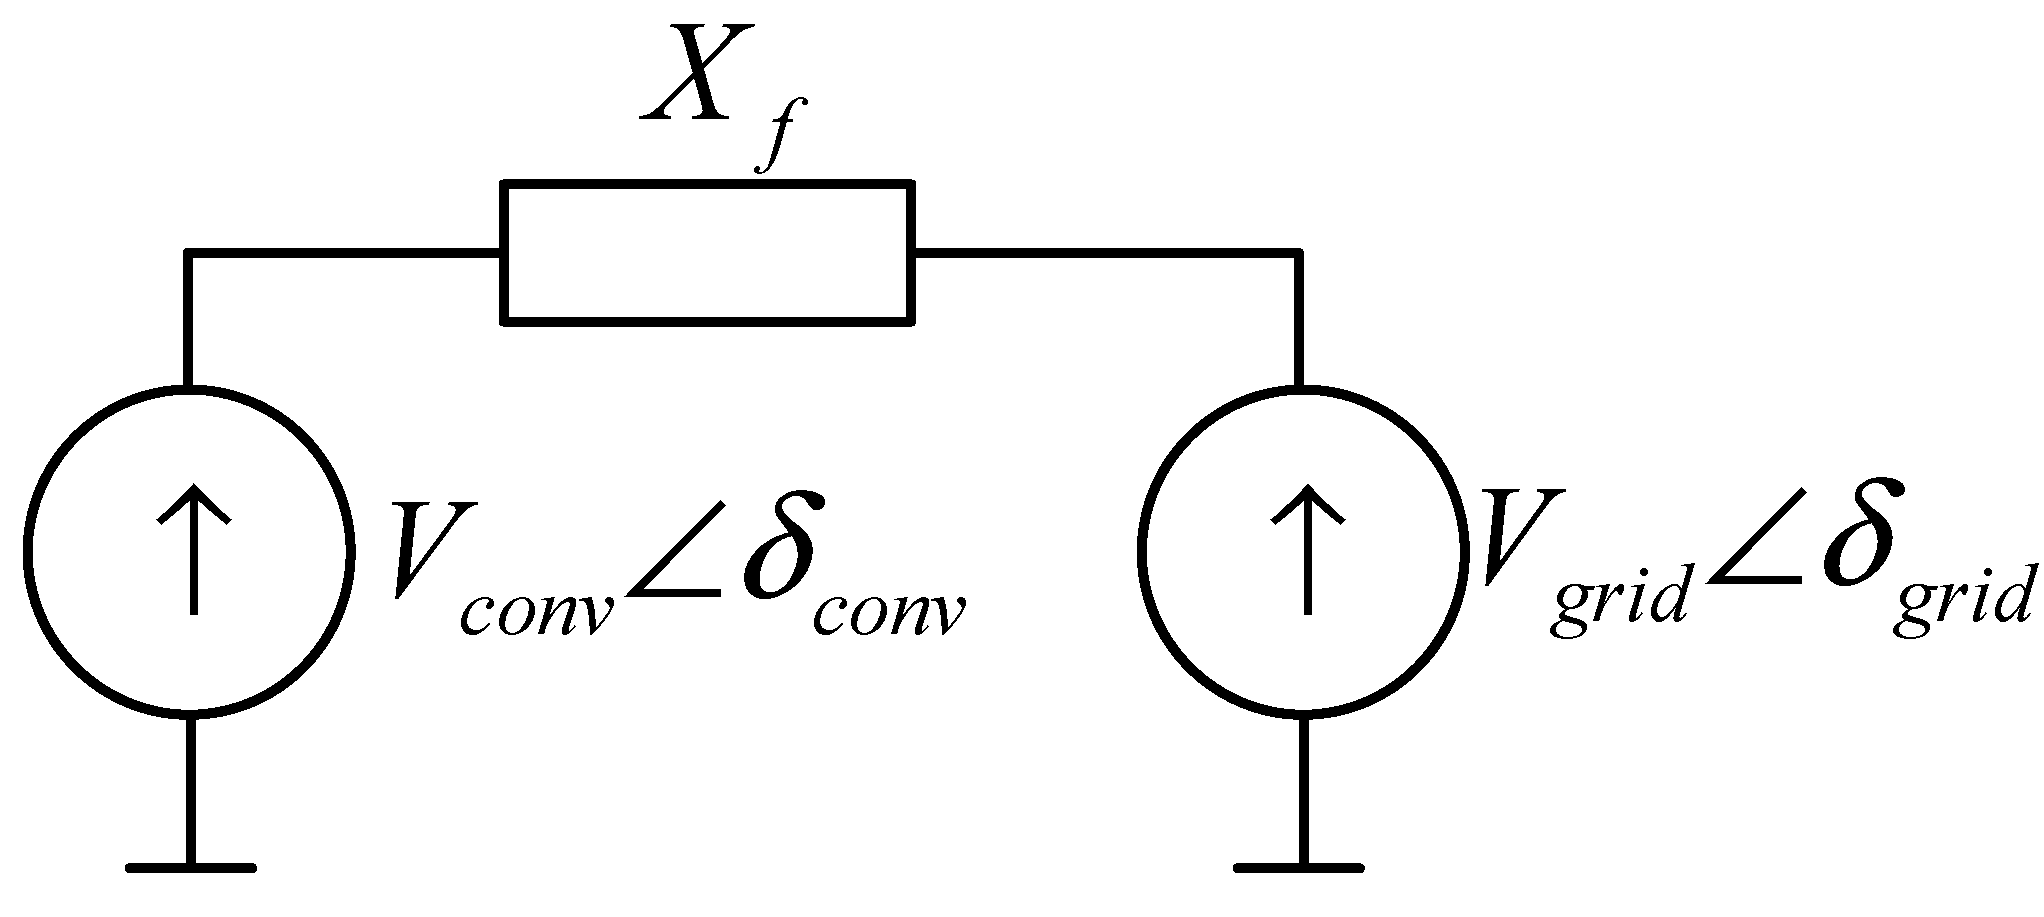
The VSC active and reactive power exchanged with the power grid depends on the voltage and phase difference between the converter and the power system. A simplified diagram of VSC connection to the grid is presented in
Figure 1.
The exchanged power is described using Equations (1) and (2), as follows:
where
PVSC is the VSC active power,
QVSC is the VSC reactive power,
Vgrid is the AC grid voltage,
Vconv is the VSC output AC voltage,
δ is the phase difference between
Vgrid and
Vconv, (
δ = δconv—δgrid), and
Xf is the coupling reactance.
Equations (1) and (2) indicate that the VSC’s active power mainly depends on the phase shift between the grid and VSC’s voltages, whereas the converter’s reactive power mainly depends on the differences between mentioned voltages. However, the values of the power exchanged with the grid cannot be arbitrary, as they are limited by the design parameters of the converter.
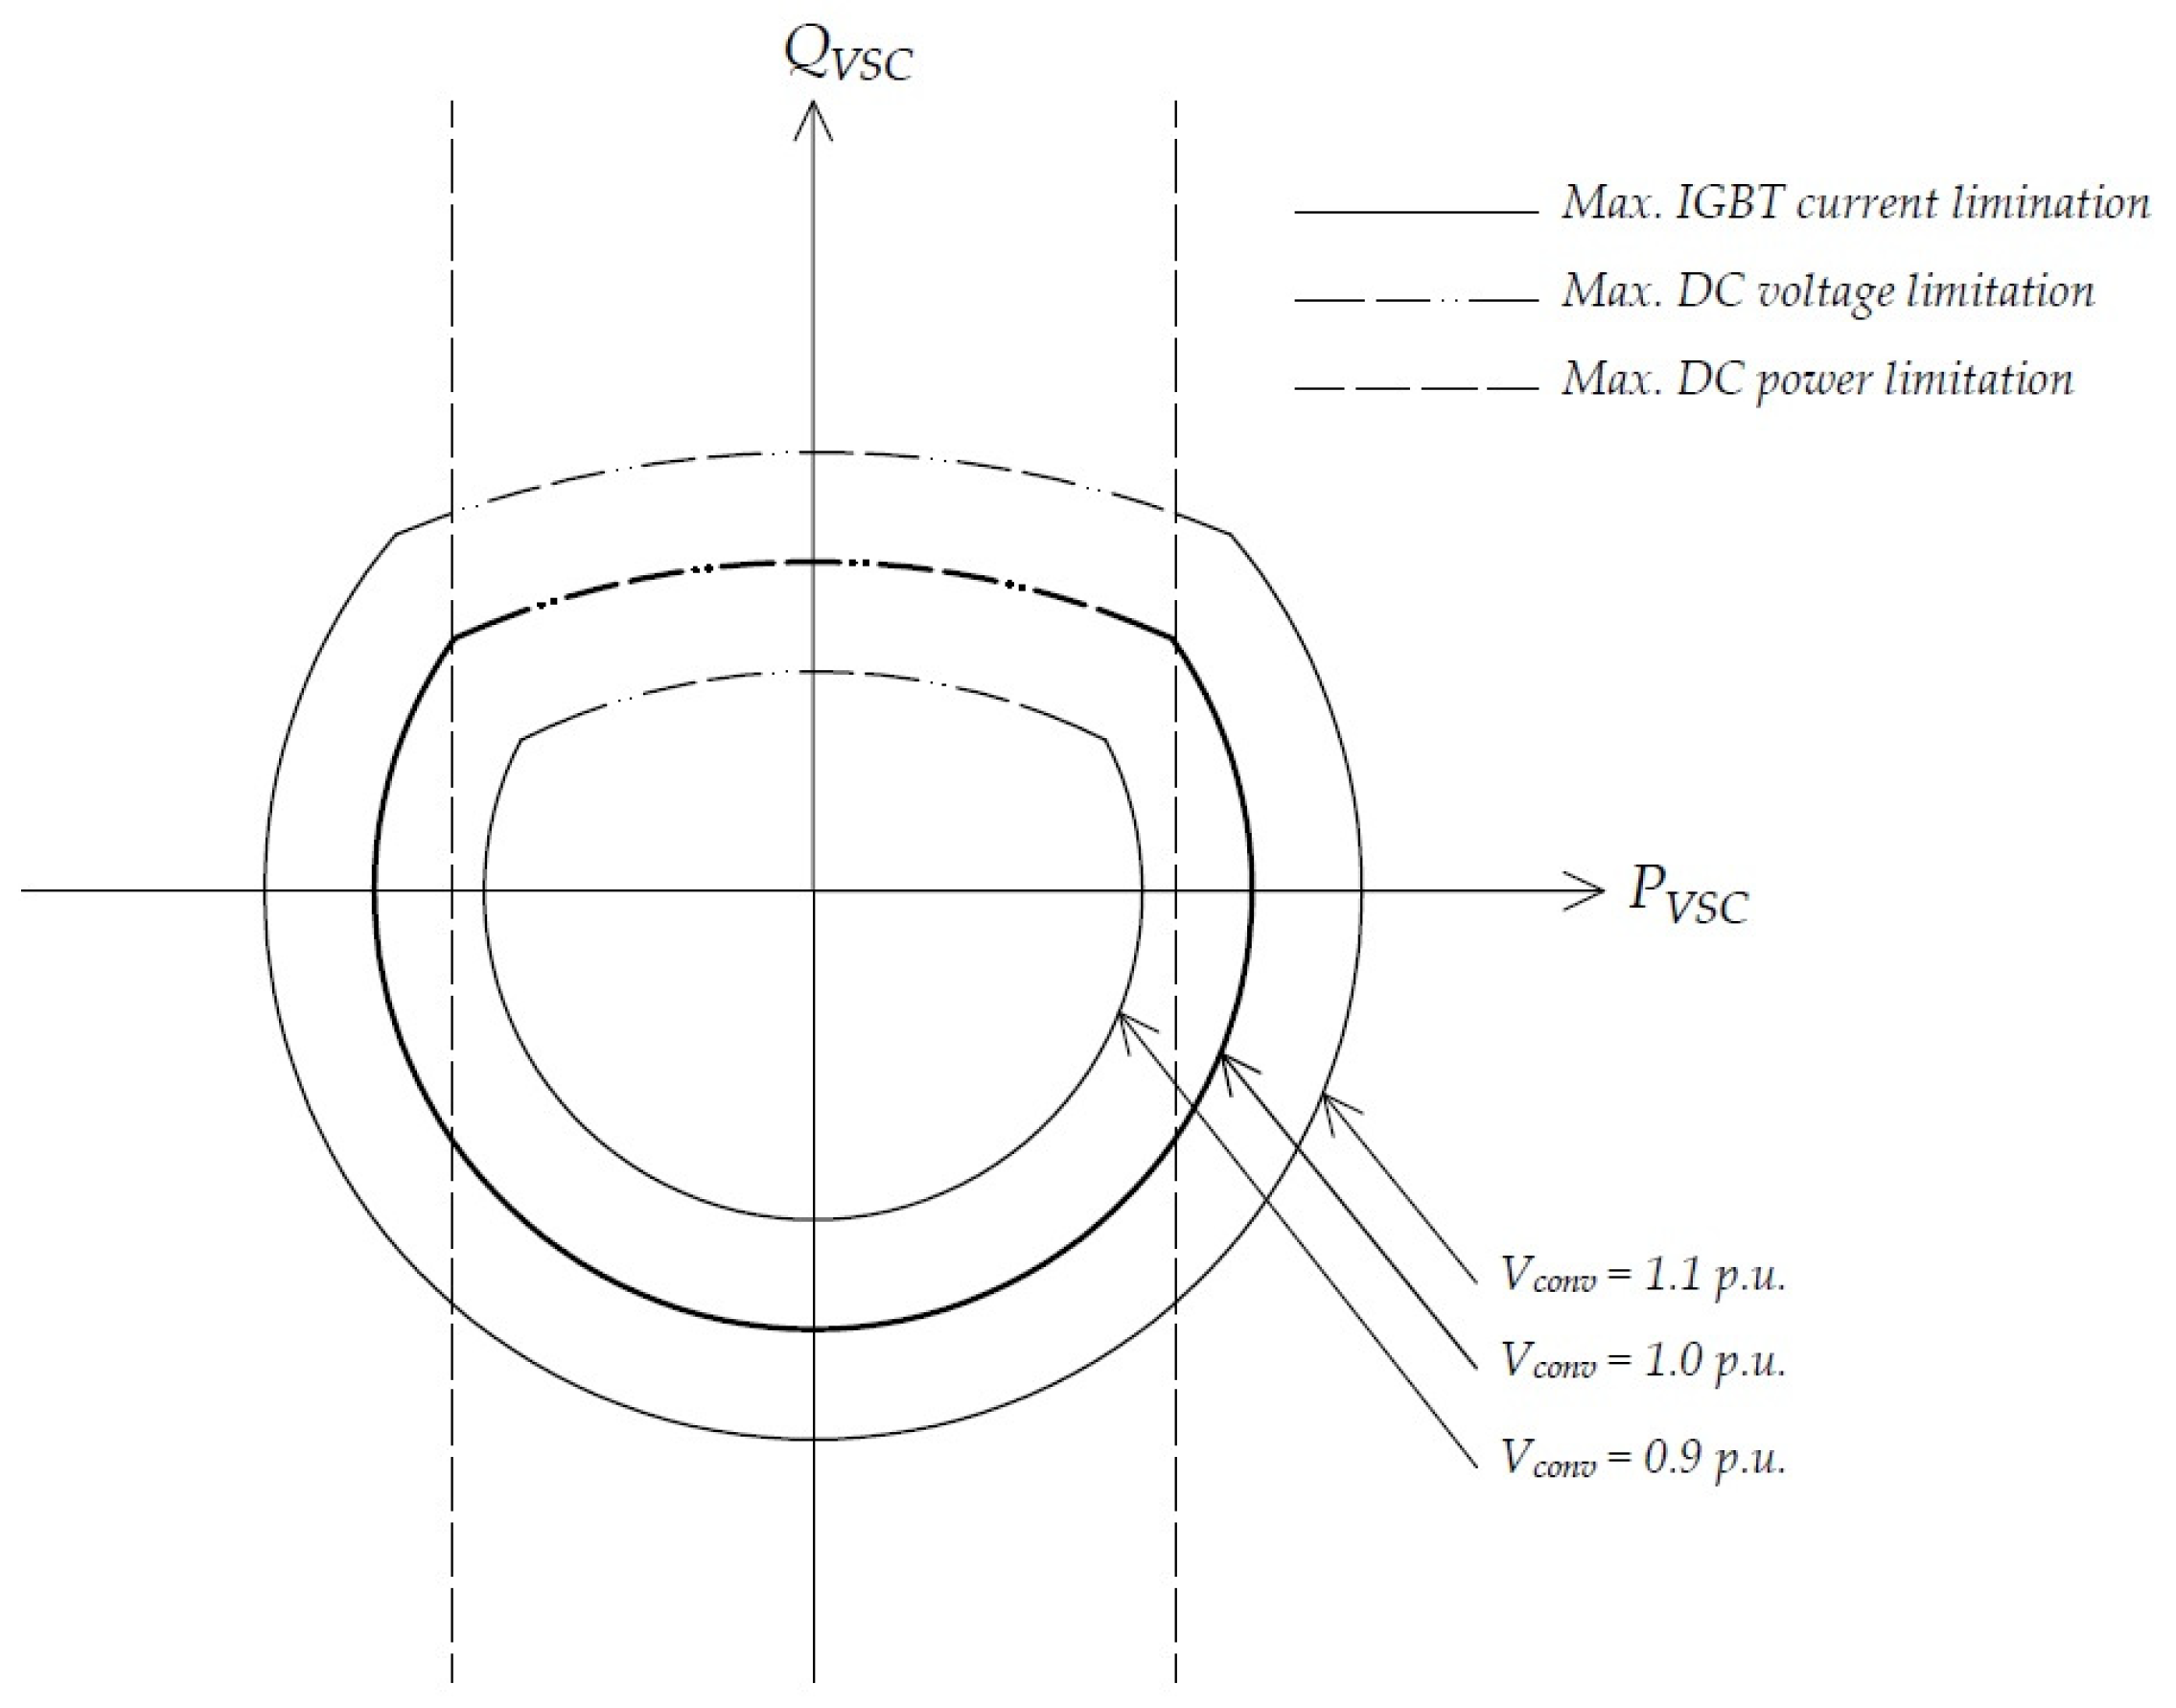
The first limitation, related to VSC power generation capabilities, derives from the IGBT maximum current capacity. The maximum power value is limited by the permissible transistor’s current capacity, but it also depends on the voltage level. Therefore, a shrinking of the operating area is observed at reduced voltage (
Vconv = 0.9 in
Figure 2), and an area expansion at increased voltage (
Vconv = 1.1 in
Figure 2) can be observed.
The second limitation derives from DC-side voltage. The DC voltage level is crucial for VSC capabilities in terms of reactive power generation. Higher levels of capacitive reactive power require higher DC voltage levels, which may exceed admissible levels. The third and final limitation is a consequence of maximum DC-side power, which is often lower than the VSC rated apparent power.
Active and reactive power ranges of the VSC are typically described by its P-Q capability curve, for which a classic example [
16] is presented in
Figure 2.
3. VSC Model
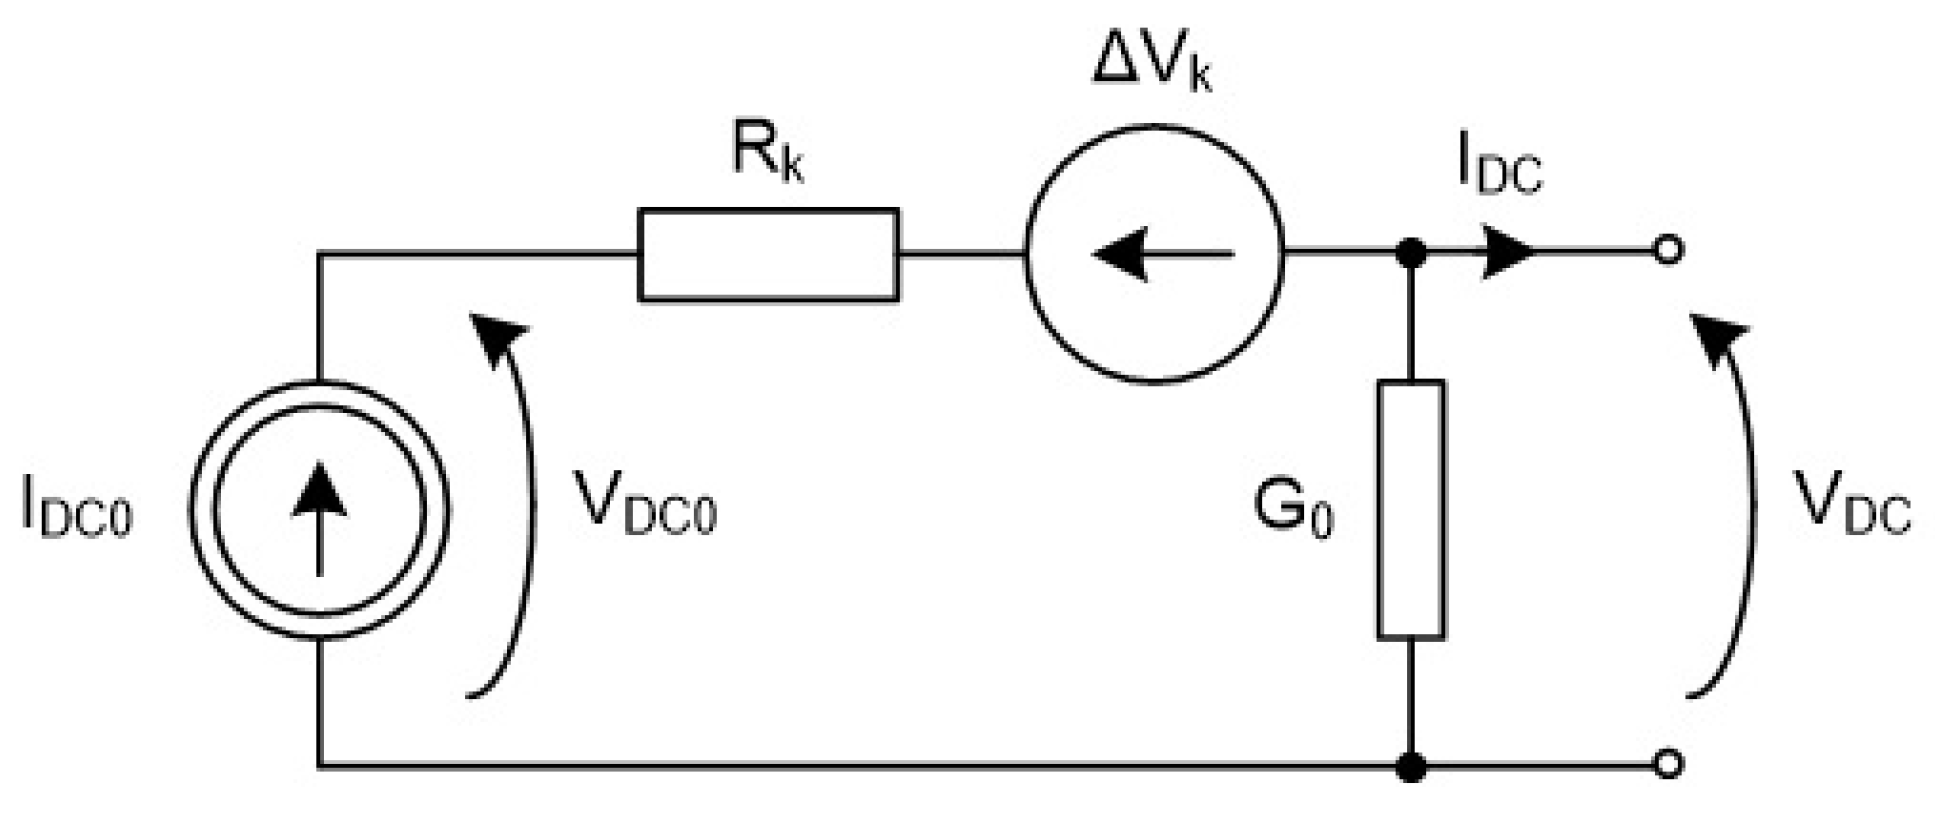
The model used for all analyses was designed in the DIgSILENT PowerFactory software. It was based on a VSC model with singular DC and AC connections, which was improved with several parameters, e.g., conducting losses.
Figure 3 illustrates the structure of the PowerFactory library-based VSC model, while
Table 1 presents crucial parameters of the whole converter substation (VSC along with the converter transformer).
The VSC P-Q capability curve control was implemented to the model using a scripting tool, which is built in PowerFactory. It is based on the DIgSILENT programming language (DPL), an original programming language used for automating calculations and analysis conducted with PowerFactory. Implementing VSC P-Q capability curve to the model was a phased process, which improved control and “on-line” verification of the limitations’ implementation.
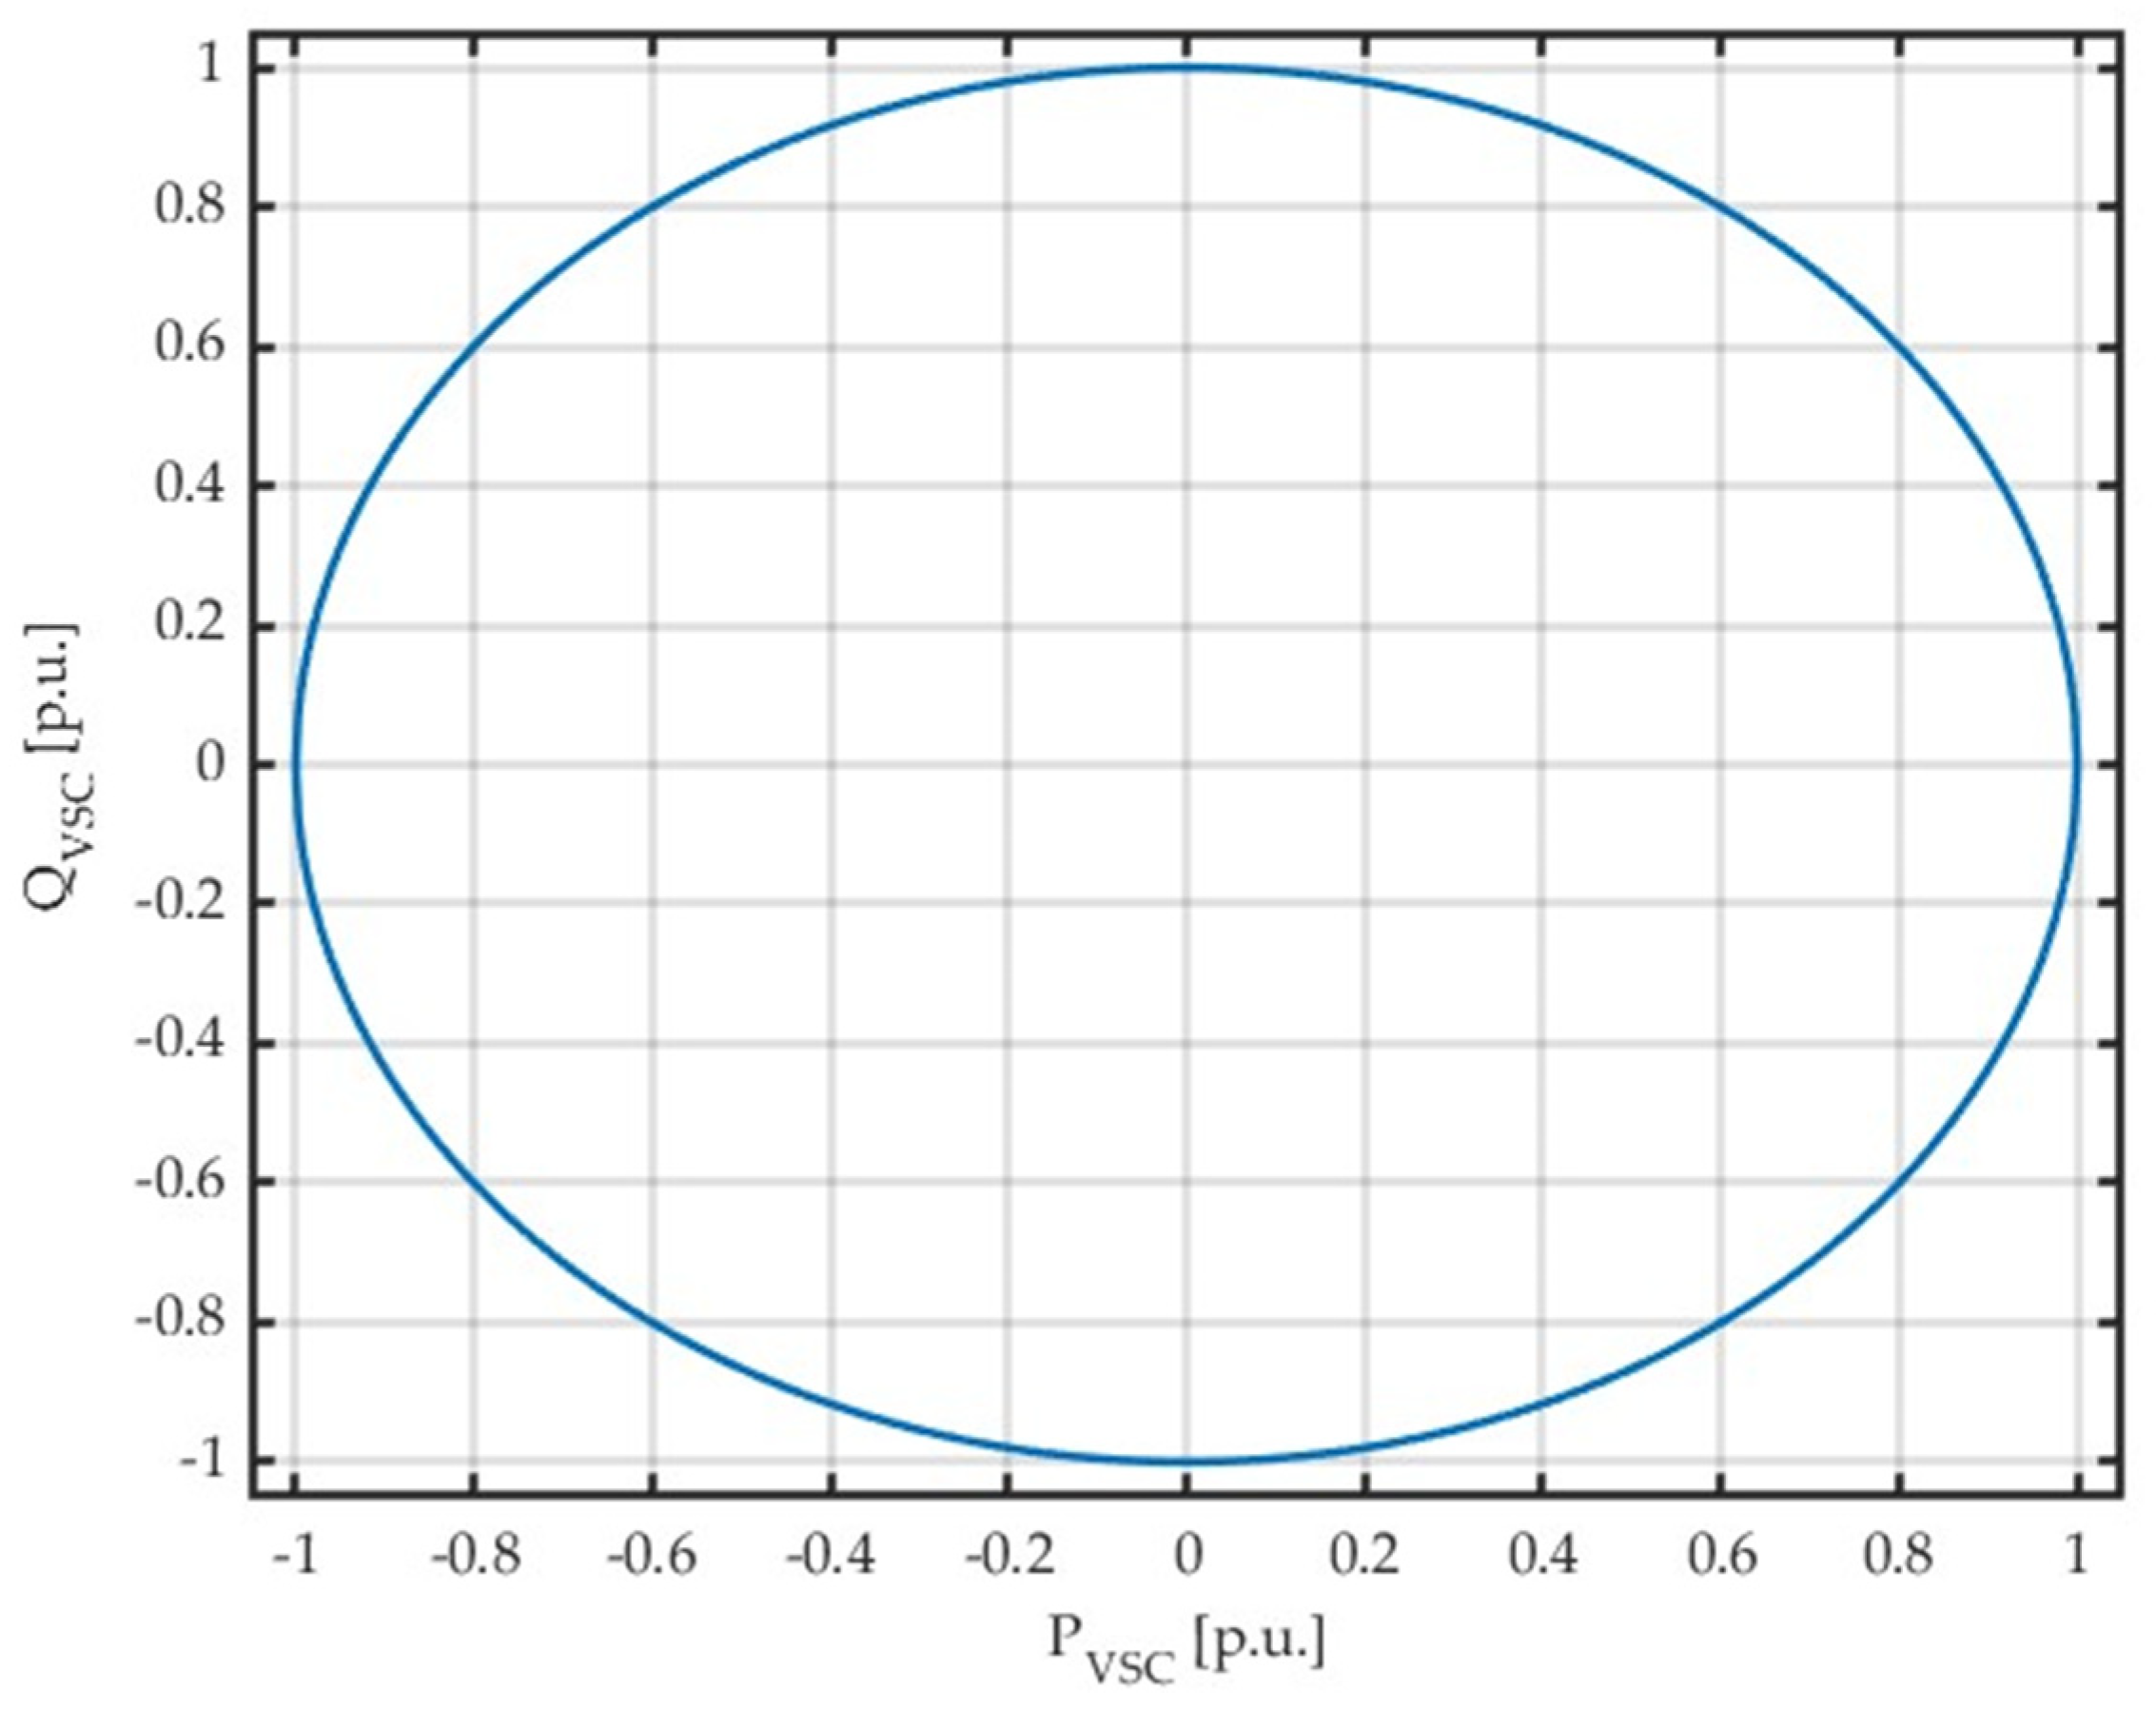
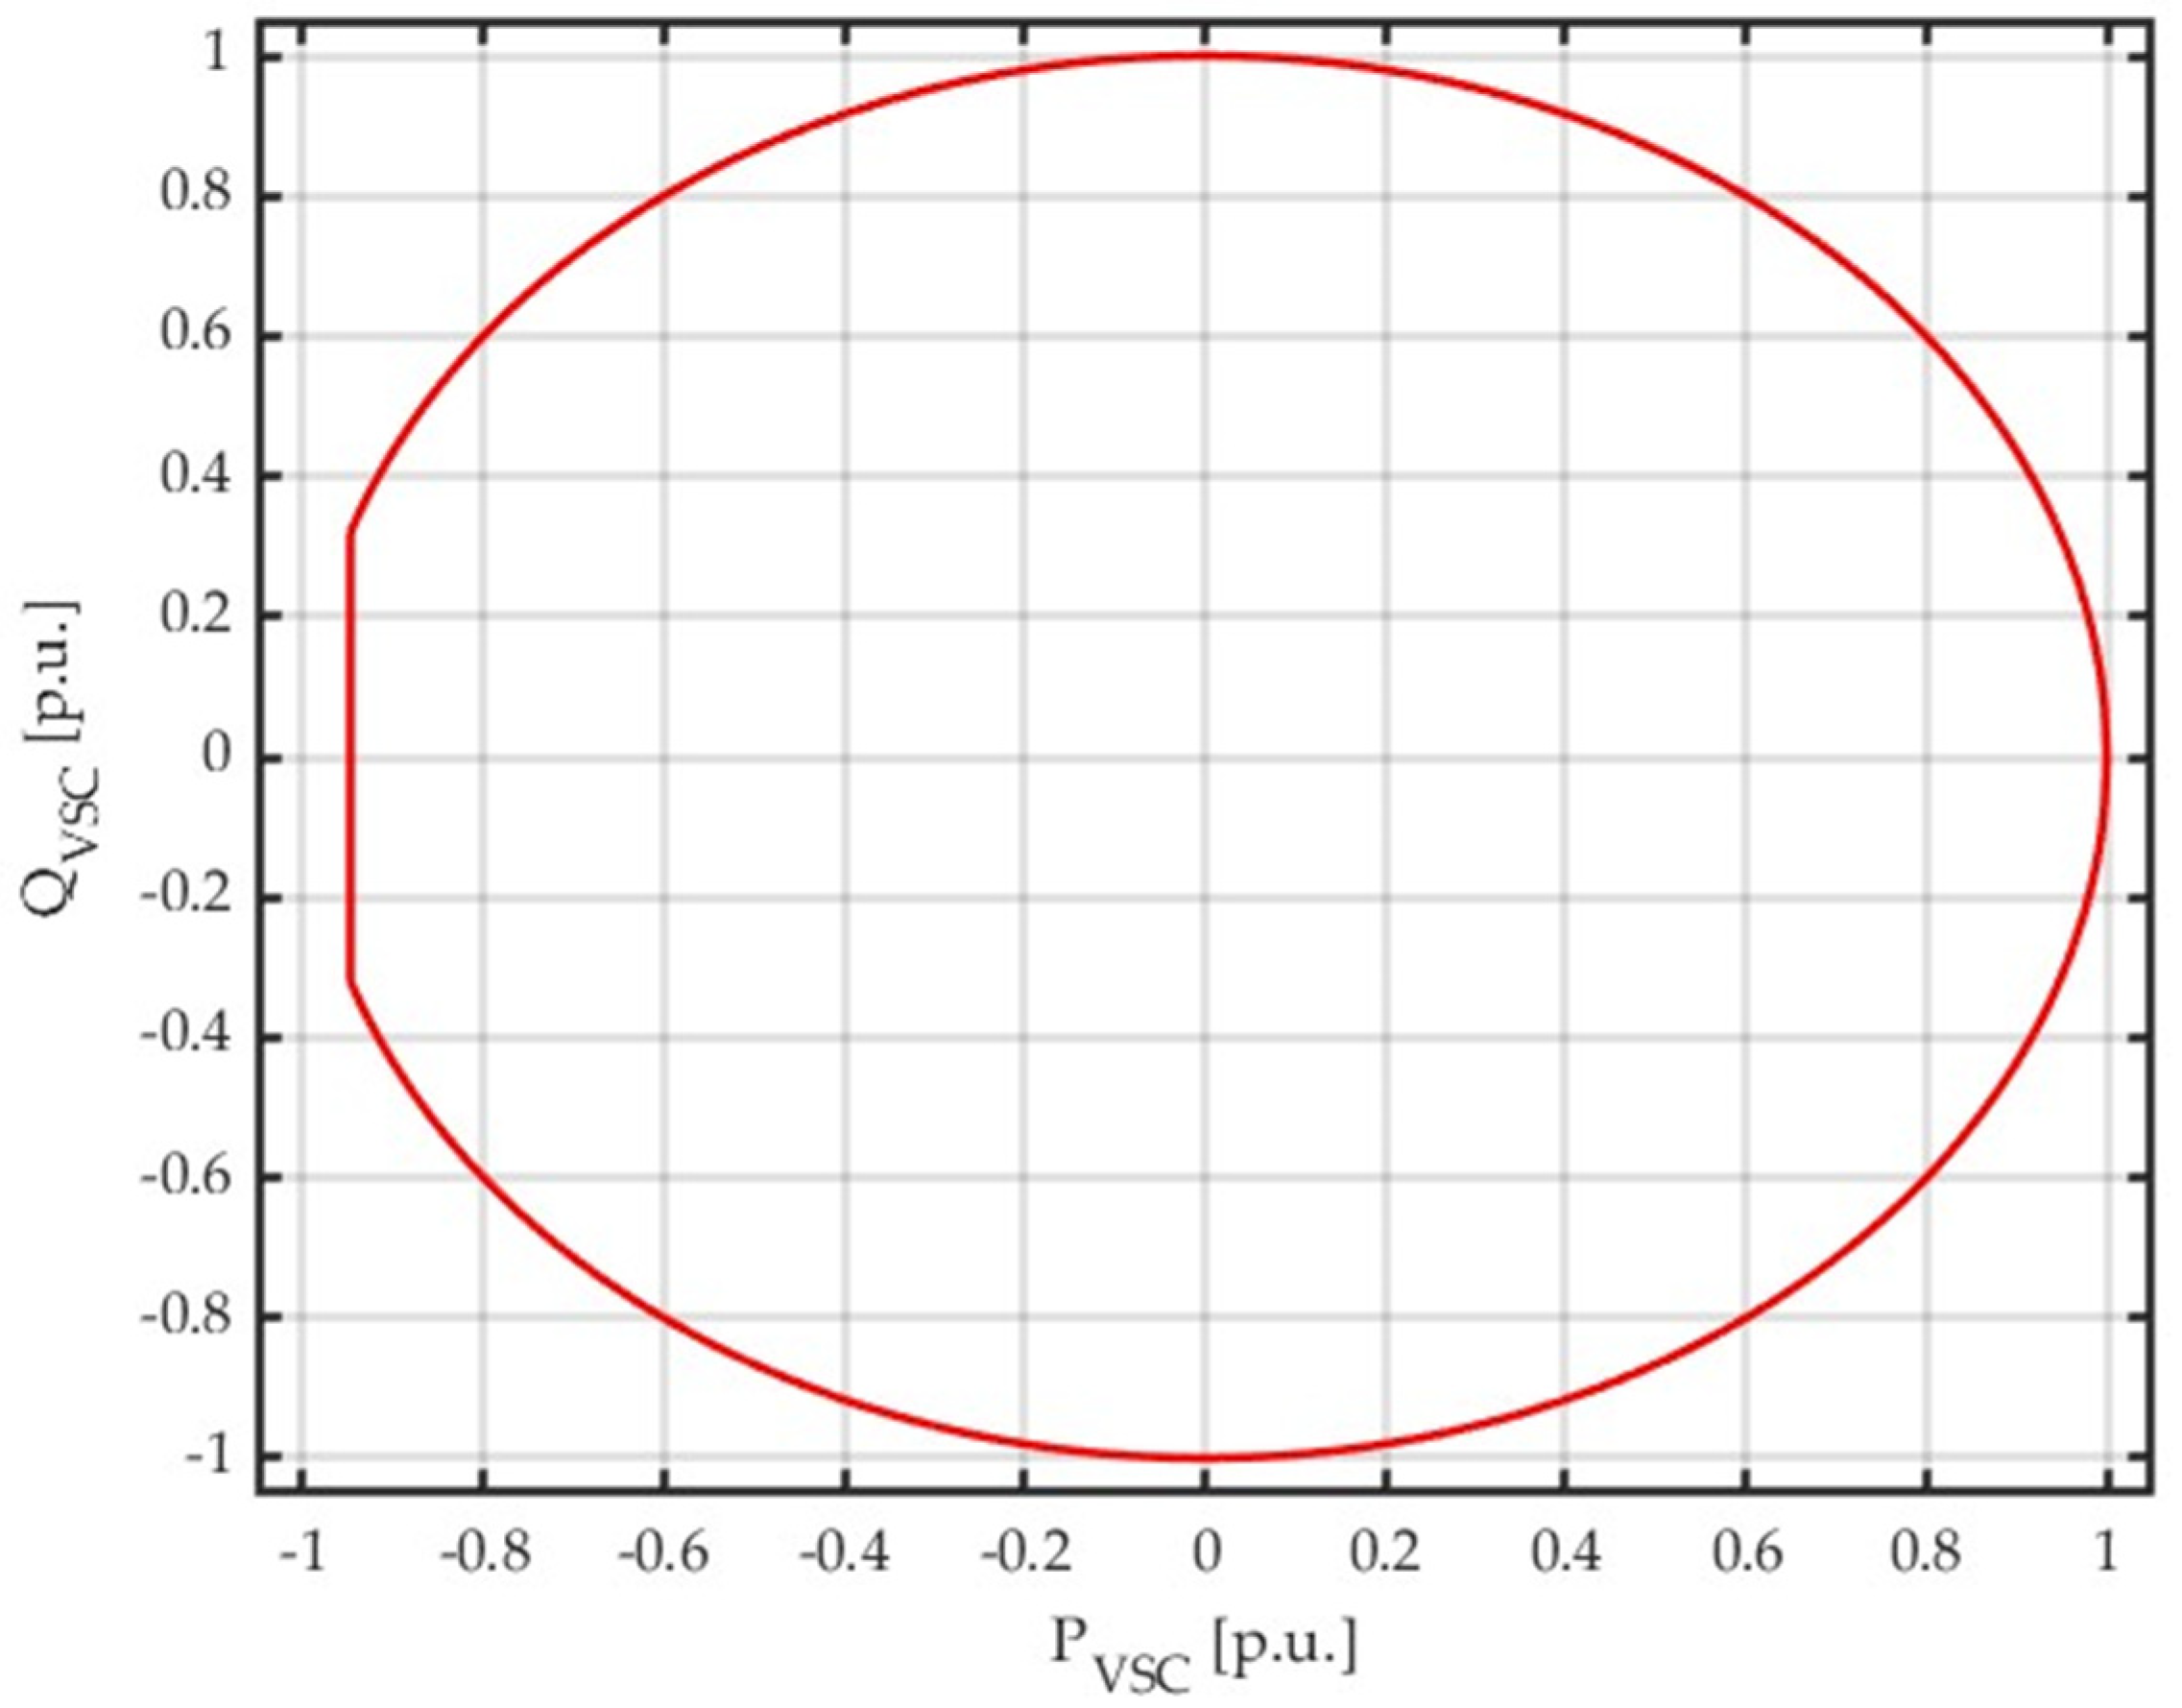
The first and basic stage of modelling was to calculate the VSC P-Q curve based on the rated apparent power with no additional limitations included, as follows:
where
SrCv is VSC’s rated apparent power (
Table 1).
Given that (3) is in fact a transformed circle equation, the resulting P-Q curve is a circle with a radius deriving from the VSC rated apparent power (
SrCv), assuming that both the active and reactive power maximum values are equal to
SrCv. The achieved P-Q capability curve fulfils these assumption, which can be observed in
Figure 4.
In this paper, the authors use relative units (per units) commonly used in electrical power engineering. The base value to which the presented results refer is the apparent rated power of the converter (SrCv). The relative units allow us to easily assess how much the operating area of the converter changes.
The resultant curve was obtained as a result of iterative calculations, which fulfilled the condition based on (3). At each step, the VSCs’ active power was set, and adequate reactive power was calculated, both generated and consumed. Initial DC- and AC-side voltage levels were set to rated values.
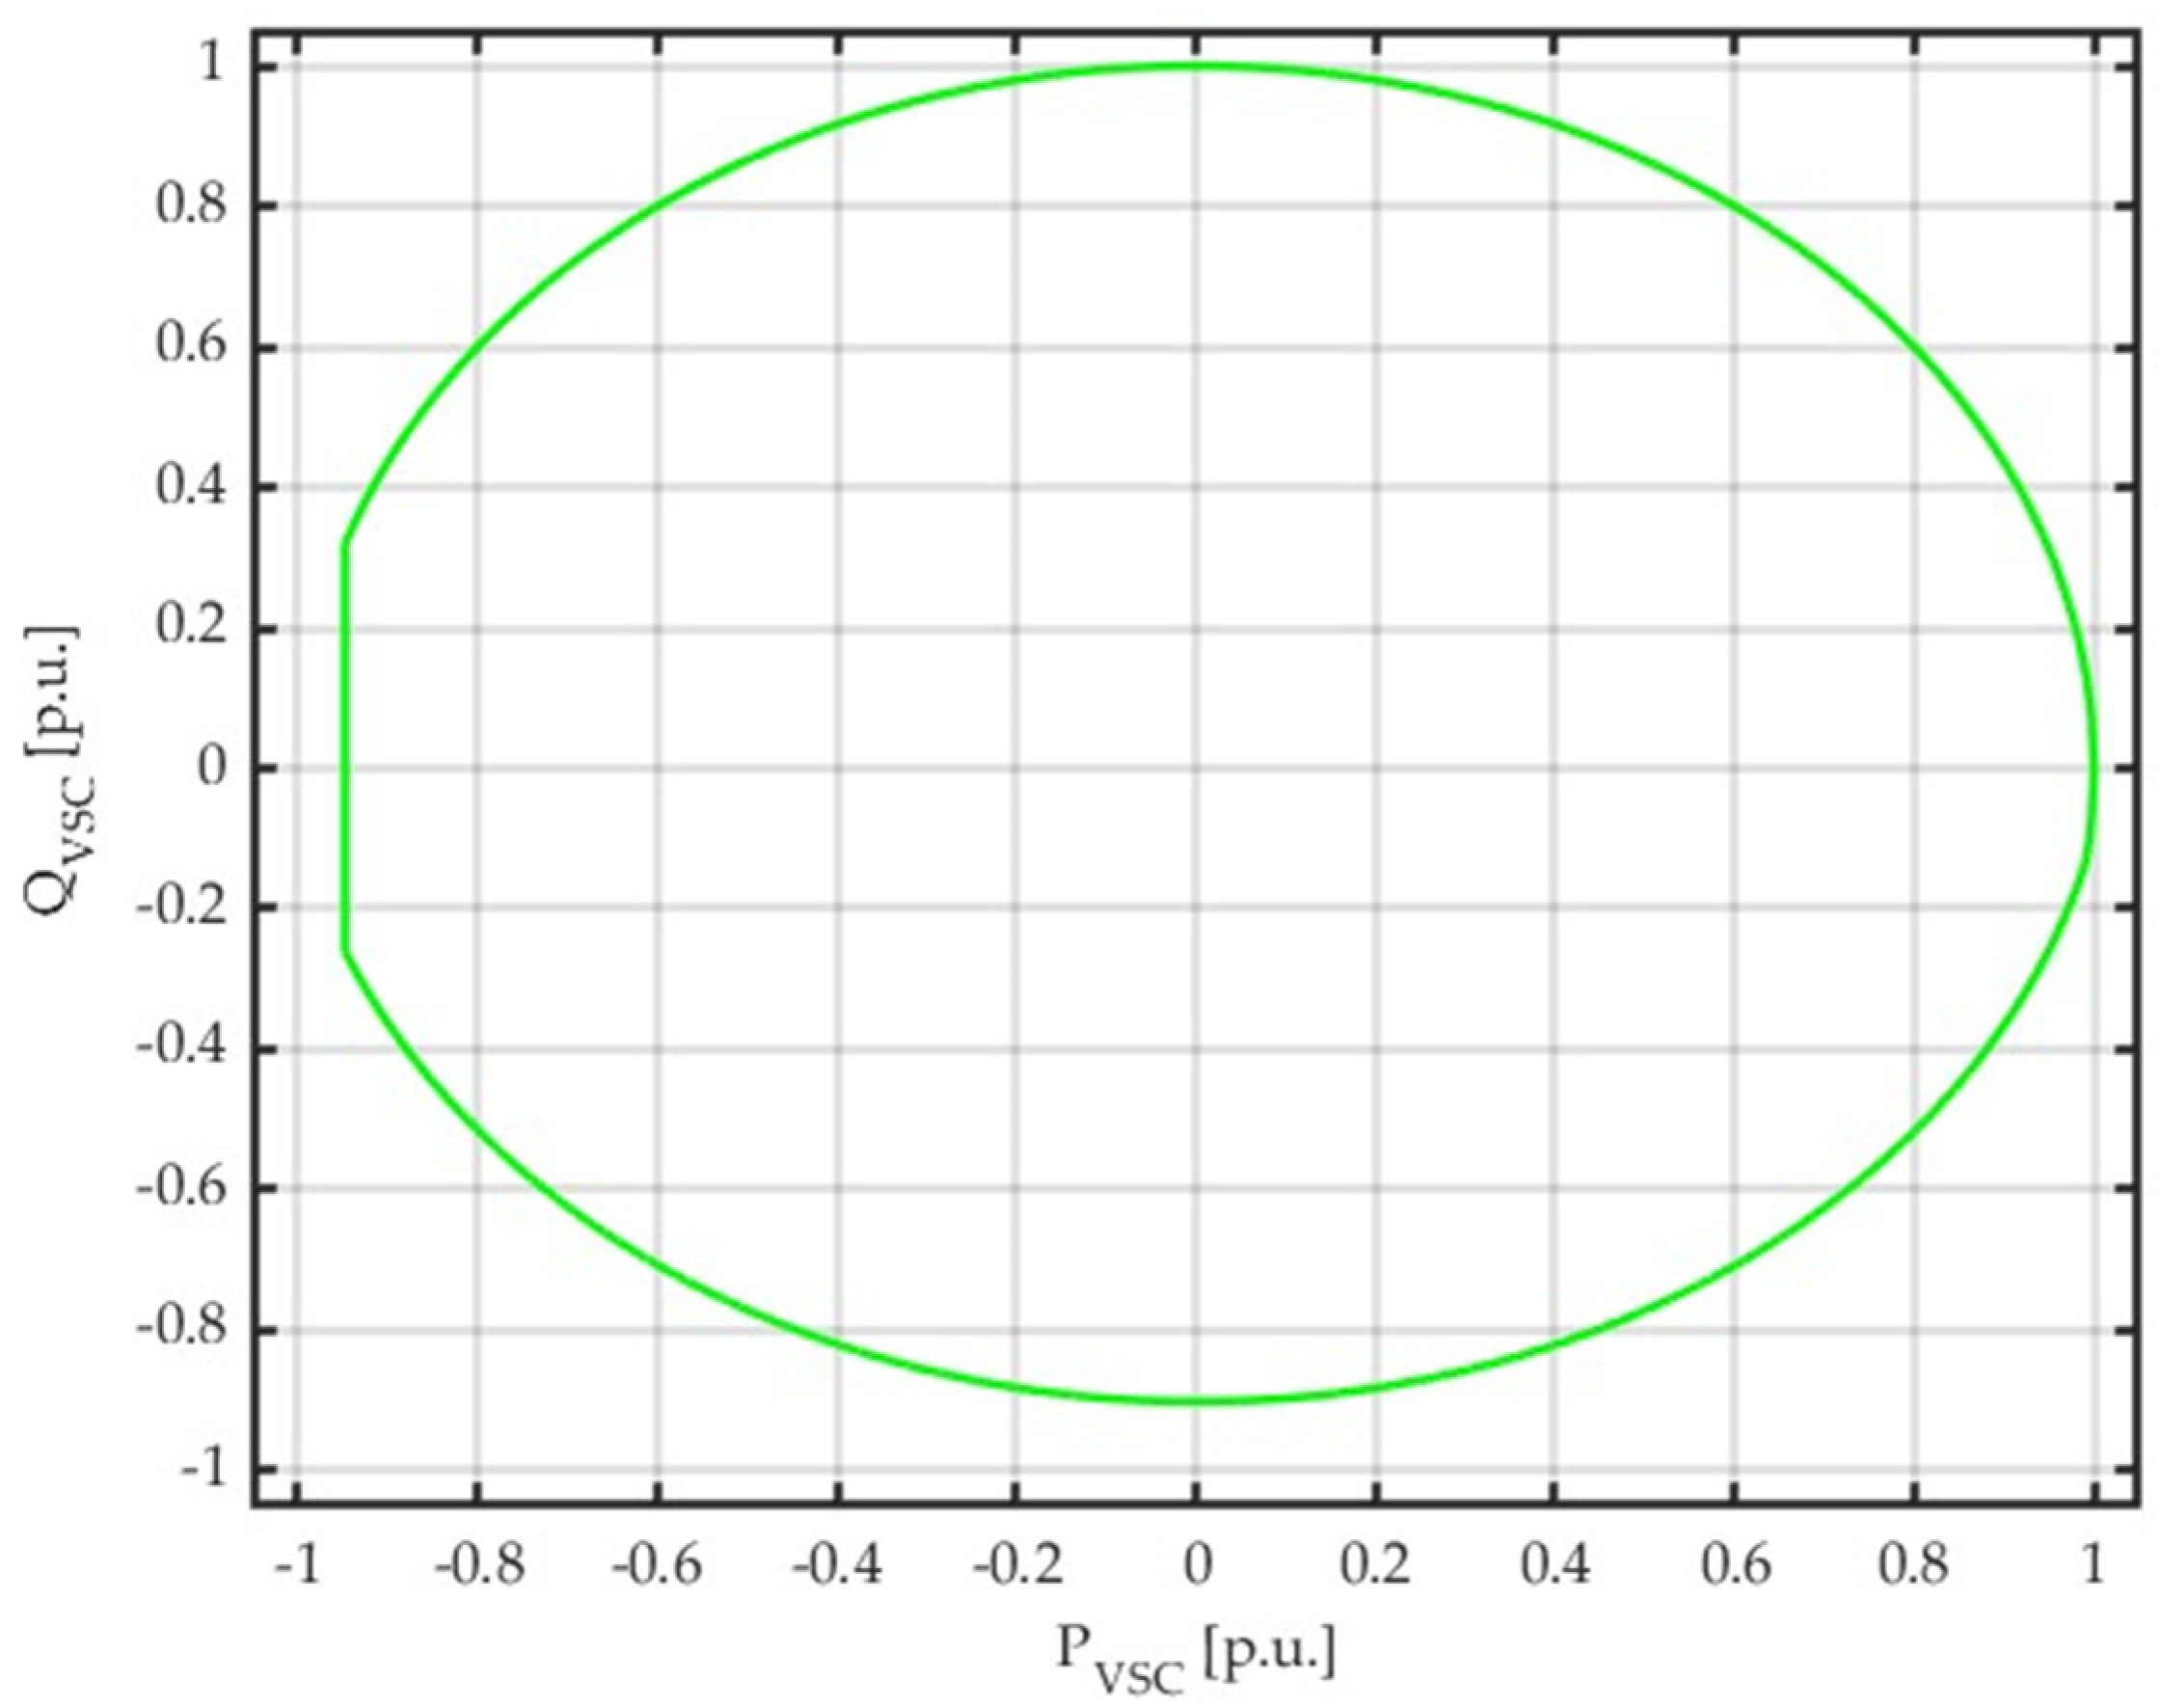
The next step was implementing maximum DC power limitation
PCvDC (
Table 1) to the model. It was completed by adding a converter maximum DC current control loop, because the DC power limitation, at certain voltage levels, depends on the converter current. When a DC current transgression was detected, the model began a loop of reducing the converter’s active power to an acceptable level. The achieved P-Q capability curve with DC power (current) limitation is presented in
Figure 5.
As can be seen, the included limitations affected only the inverter side of the P-Q curve (flattening on the left side of the curve). This comes from the fact that the inverter-type operation of the converter results in decreasing DC-side voltage, which implicates an increase in current which is limited by the VSC transistor’s thermal capabilities. Rectifier-type operation of the converter results in increasing DC-side voltage, which implicates a reduction in current, and the power level is not limited.
The third step consisted of adding an AC current limitation along with a DC current limitation. The updated P-Q curve is illustrated in
Figure 6. The AC current limitation value results from the apparent power rating and AC voltage rating are given in
Table 1.
This limitation implementation was achieved similarly to the former addition of the DC current control loop (the curve at the bottom does not reach the value −1; reactive power consumption is limited). When AC current transgression was detected, a loop of reducing the converter’s reactive power began. When the measured AC current value dropped below rated level, the admissible operation point was noted.
The final stage was implementing the control of DC-side voltage. This improvement needed a bit more workload, as the link between the reactive power and DC voltage is not directly stated. Firstly, there is a relationship between AC- and DC-side voltages, described by Equation (4), as follows:
where
VAC is the AC-side voltage,
VDC is the DC-side voltage,
m is the modulation index (max permissible value 0.8), and
k0 is the modulation type-dependent coefficient.
AC-side voltage stated as
VAC in (4) is in fact the value of
Vconv present in (1) and (2). Using this along with assuming sinusoidal-type modulation, (4) can be rewritten into (5), as follows:
While (2) can be transformed into (6), as follows:
A comparison of Equations (5) and (6) leads to the conclusion that the VSC’s reactive power limitation seen in
Figure 2 not only derives from the DC voltage level, but also from the modulation index. Thus, implementation of the VSC’s P-Q curve to the model comes down to controlling several parameters’ values, namely the AC- and DC-side voltages and currents and the modulation index.
The modulation index control loop was included similarly as in former steps—when a transgression of the modulation index maximum value had been detected, the model entered the loop of additional reactive power reduction. This loop overlapped the former condition of keeping the AC current in a proper range. At first, reactive power is reduced until the AC current meets admissible value, and after that the reduction is continued if the modulation index exceeds the limitation.
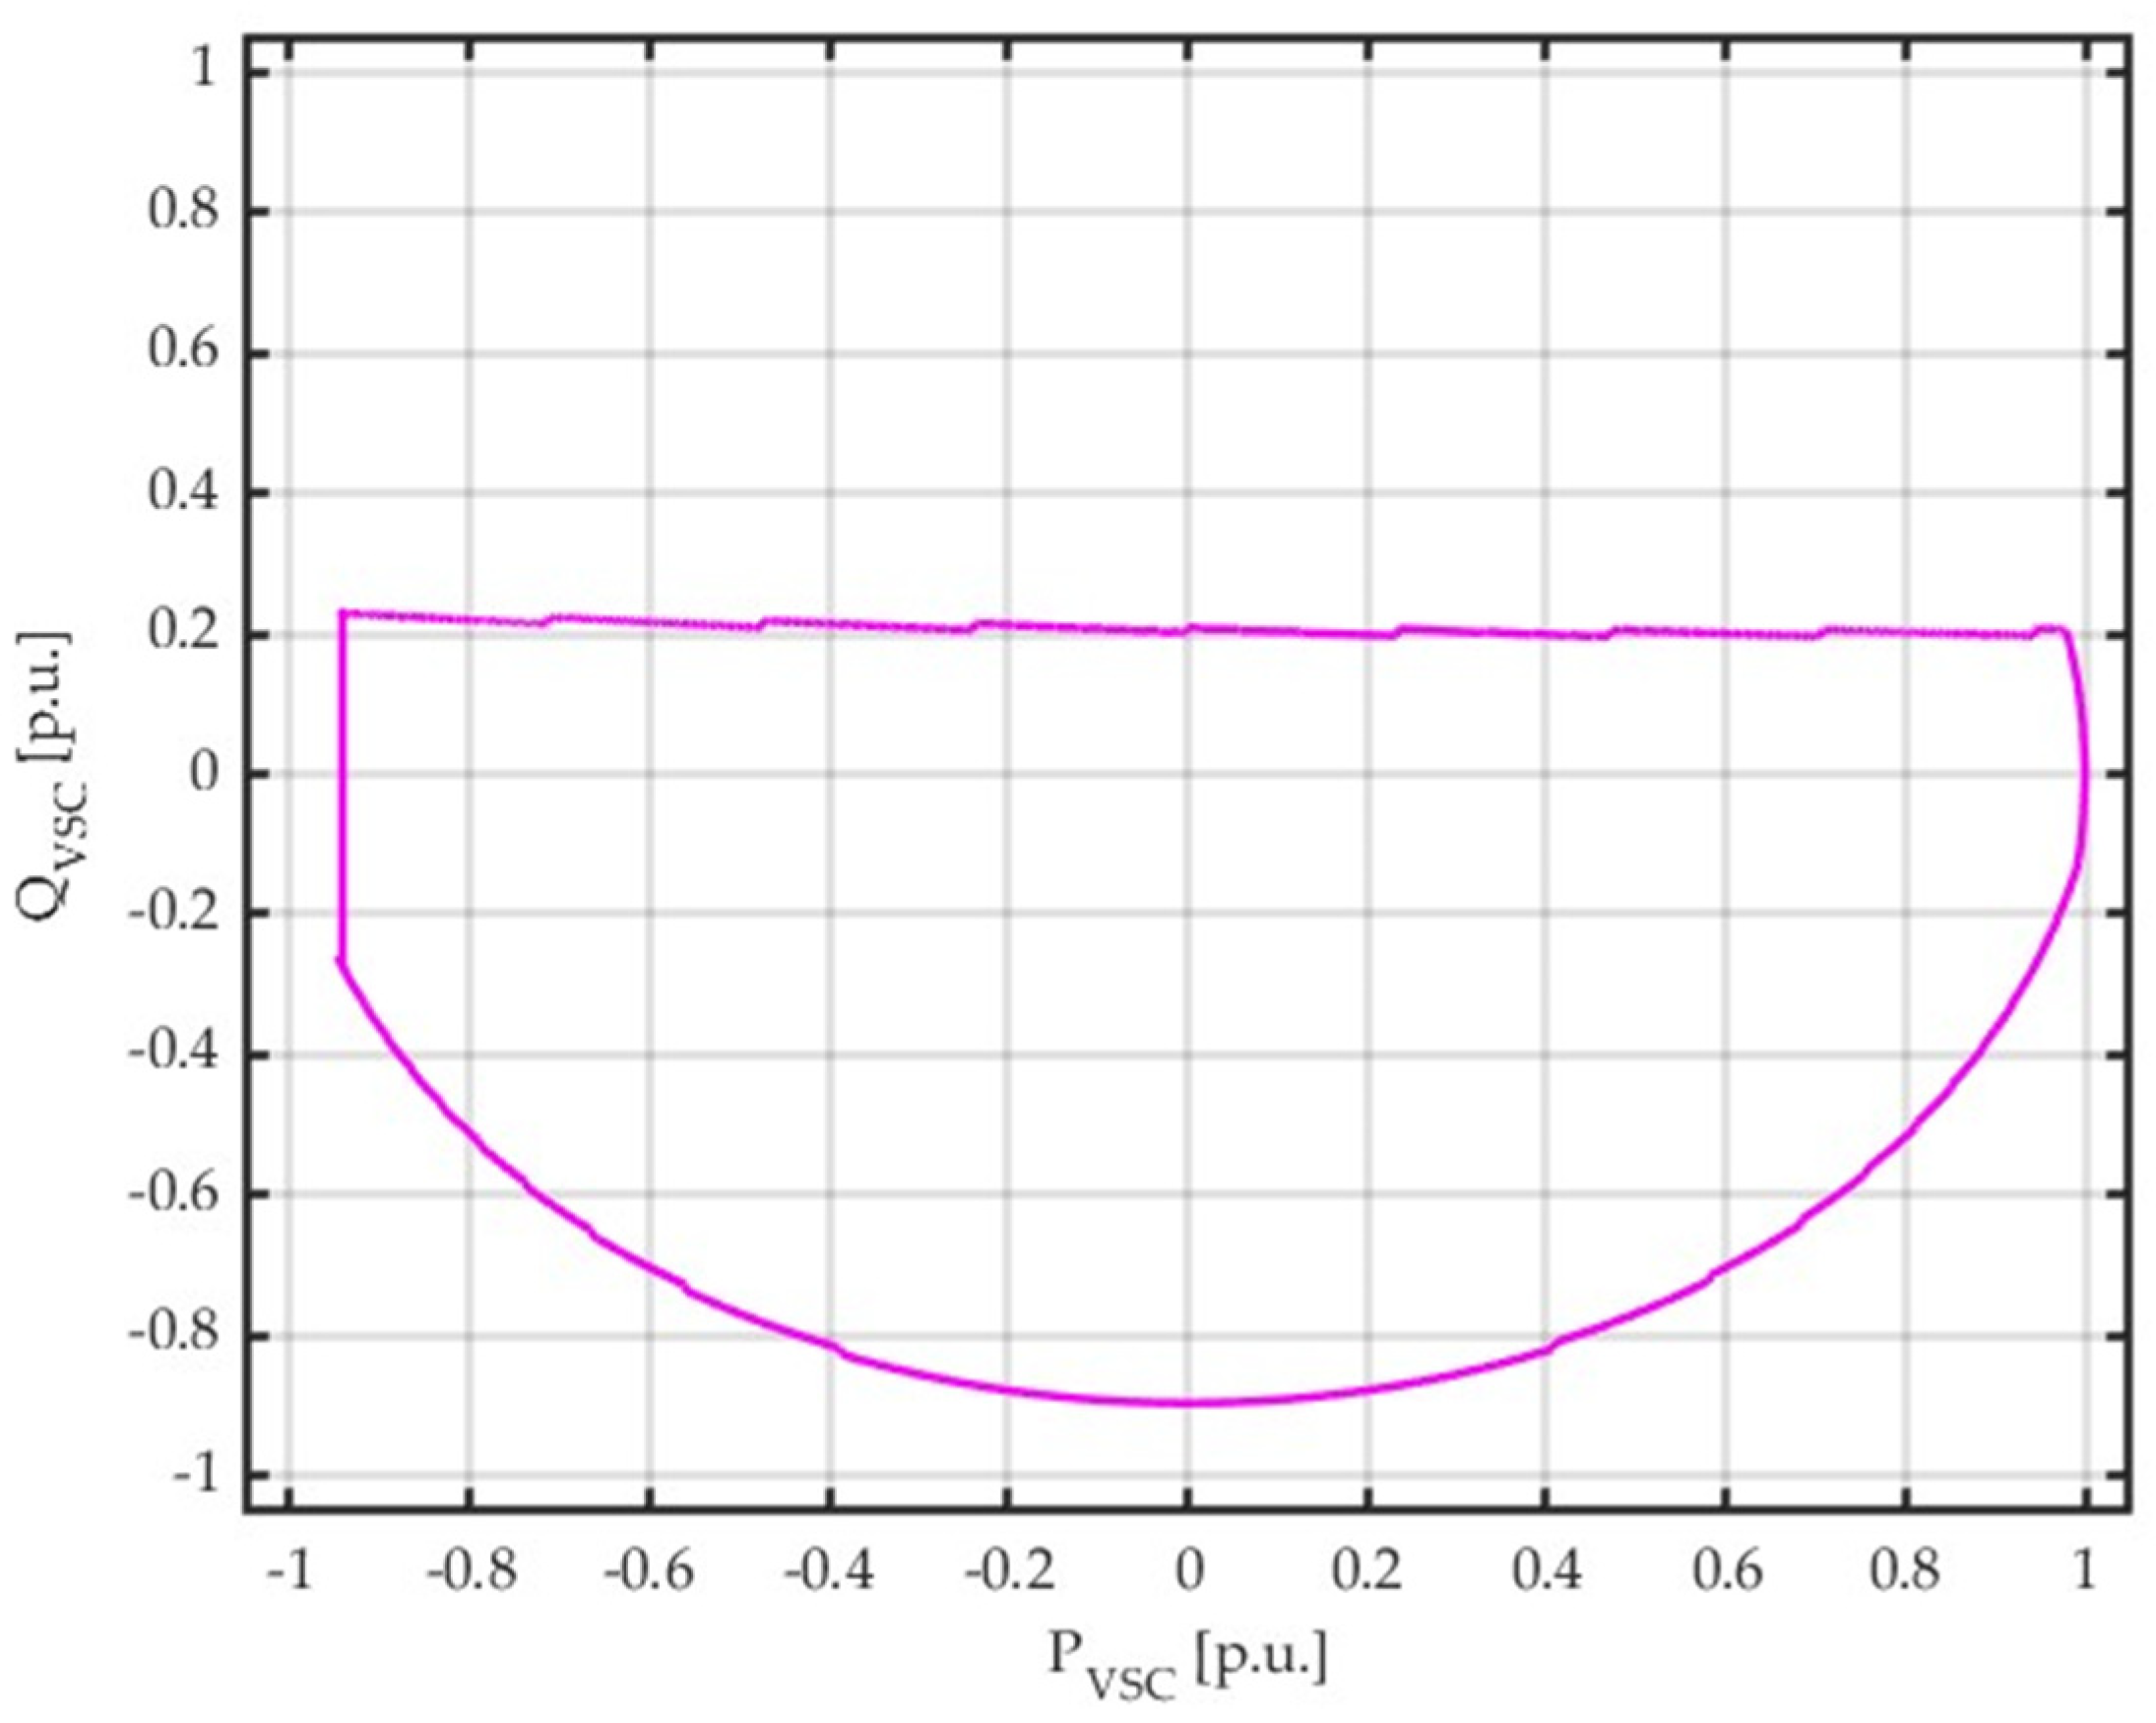
Figure 7 shows the final shape of the VSC P-Q capability curve with all limitations included.
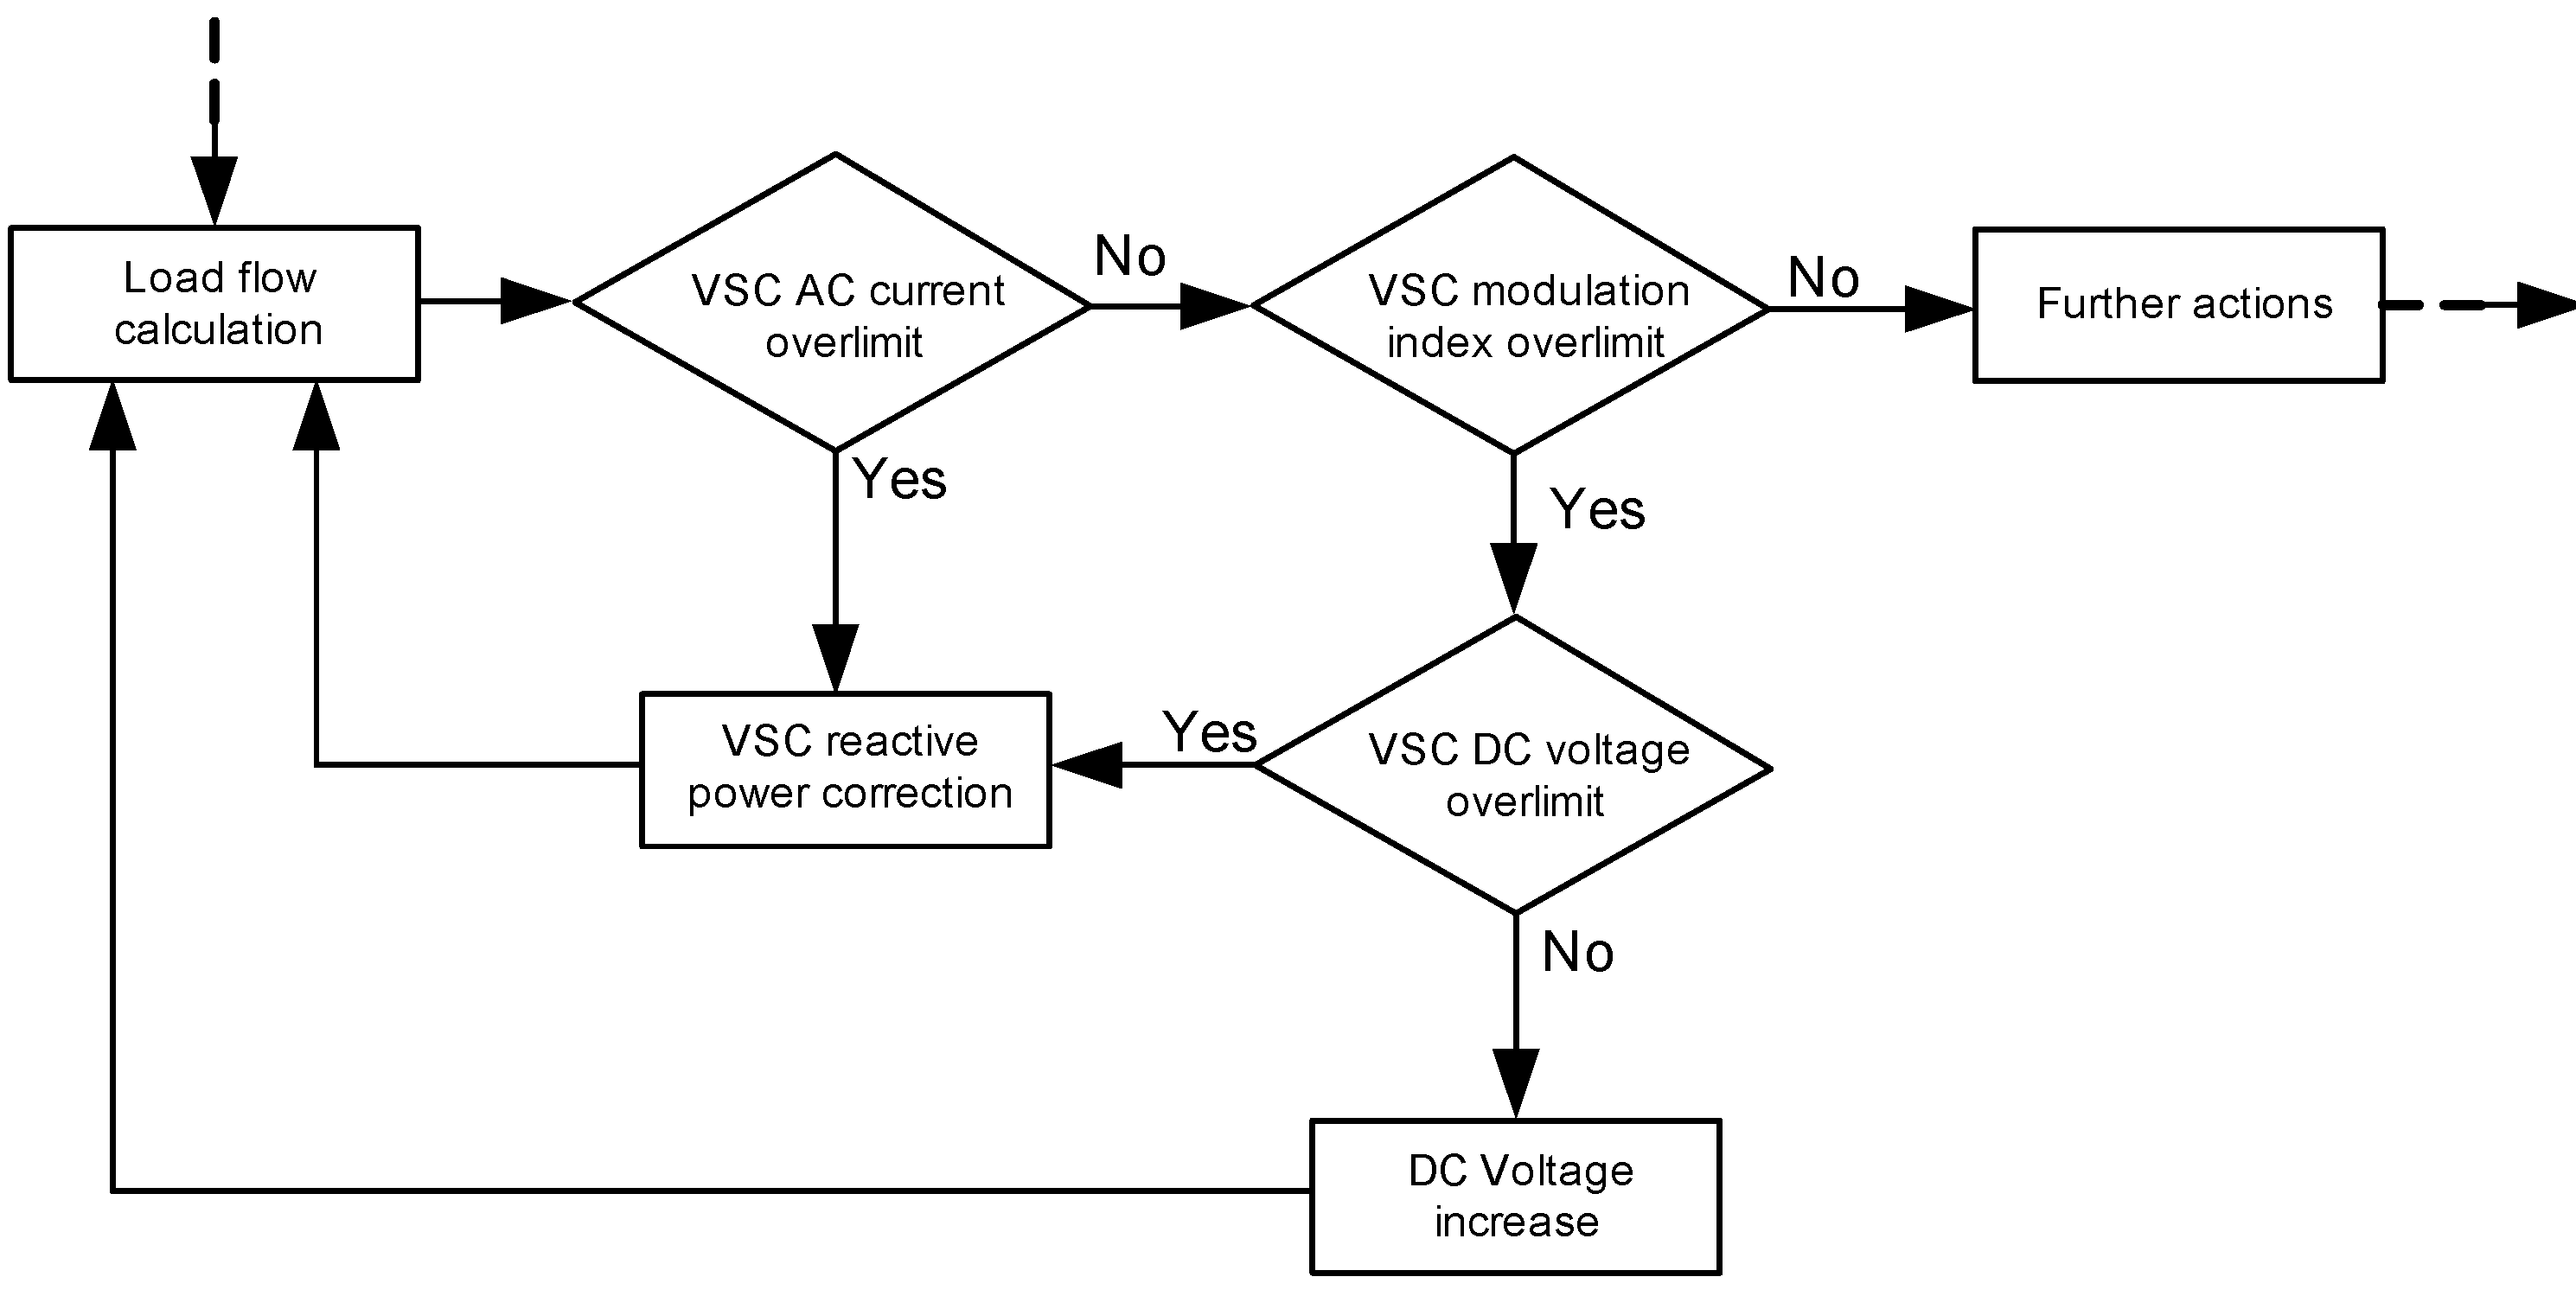
A general flowchart of the VSC P-Q capability curve implementation into the load–flow procedure is presented in
Figure 8.
The iteration loop shown in
Figure 8 is a part of larger script that controls the whole load flow calculations performed using the model. The steps concerning DC current limitation was omitted in the chart, as it is a part of an active power control loop. The first step after load flow calculation (followed by preliminary checking and eliminating possible transgressions except those concerning voltage levels) is the control of VSC’s AC current. If it exceeds the limit, then the VSC’s reactive power is immediately corrected by decreasing its absolute value. If the AC current is within the admissible range, the loop goes on to check the VSC’s modulation index value. If it exceeds designated value, then the correction process is taken. First, the value of the VSC’s DC voltage is checked. If it is not over the limit, then its value is increased. If the DC voltage reaches its limitation and the modulation index is still over the limit, then the VSC’s reactive power is decreased. After setting the VSC’s operation point, the script moves on to execute further actions.
4. Research Procedure
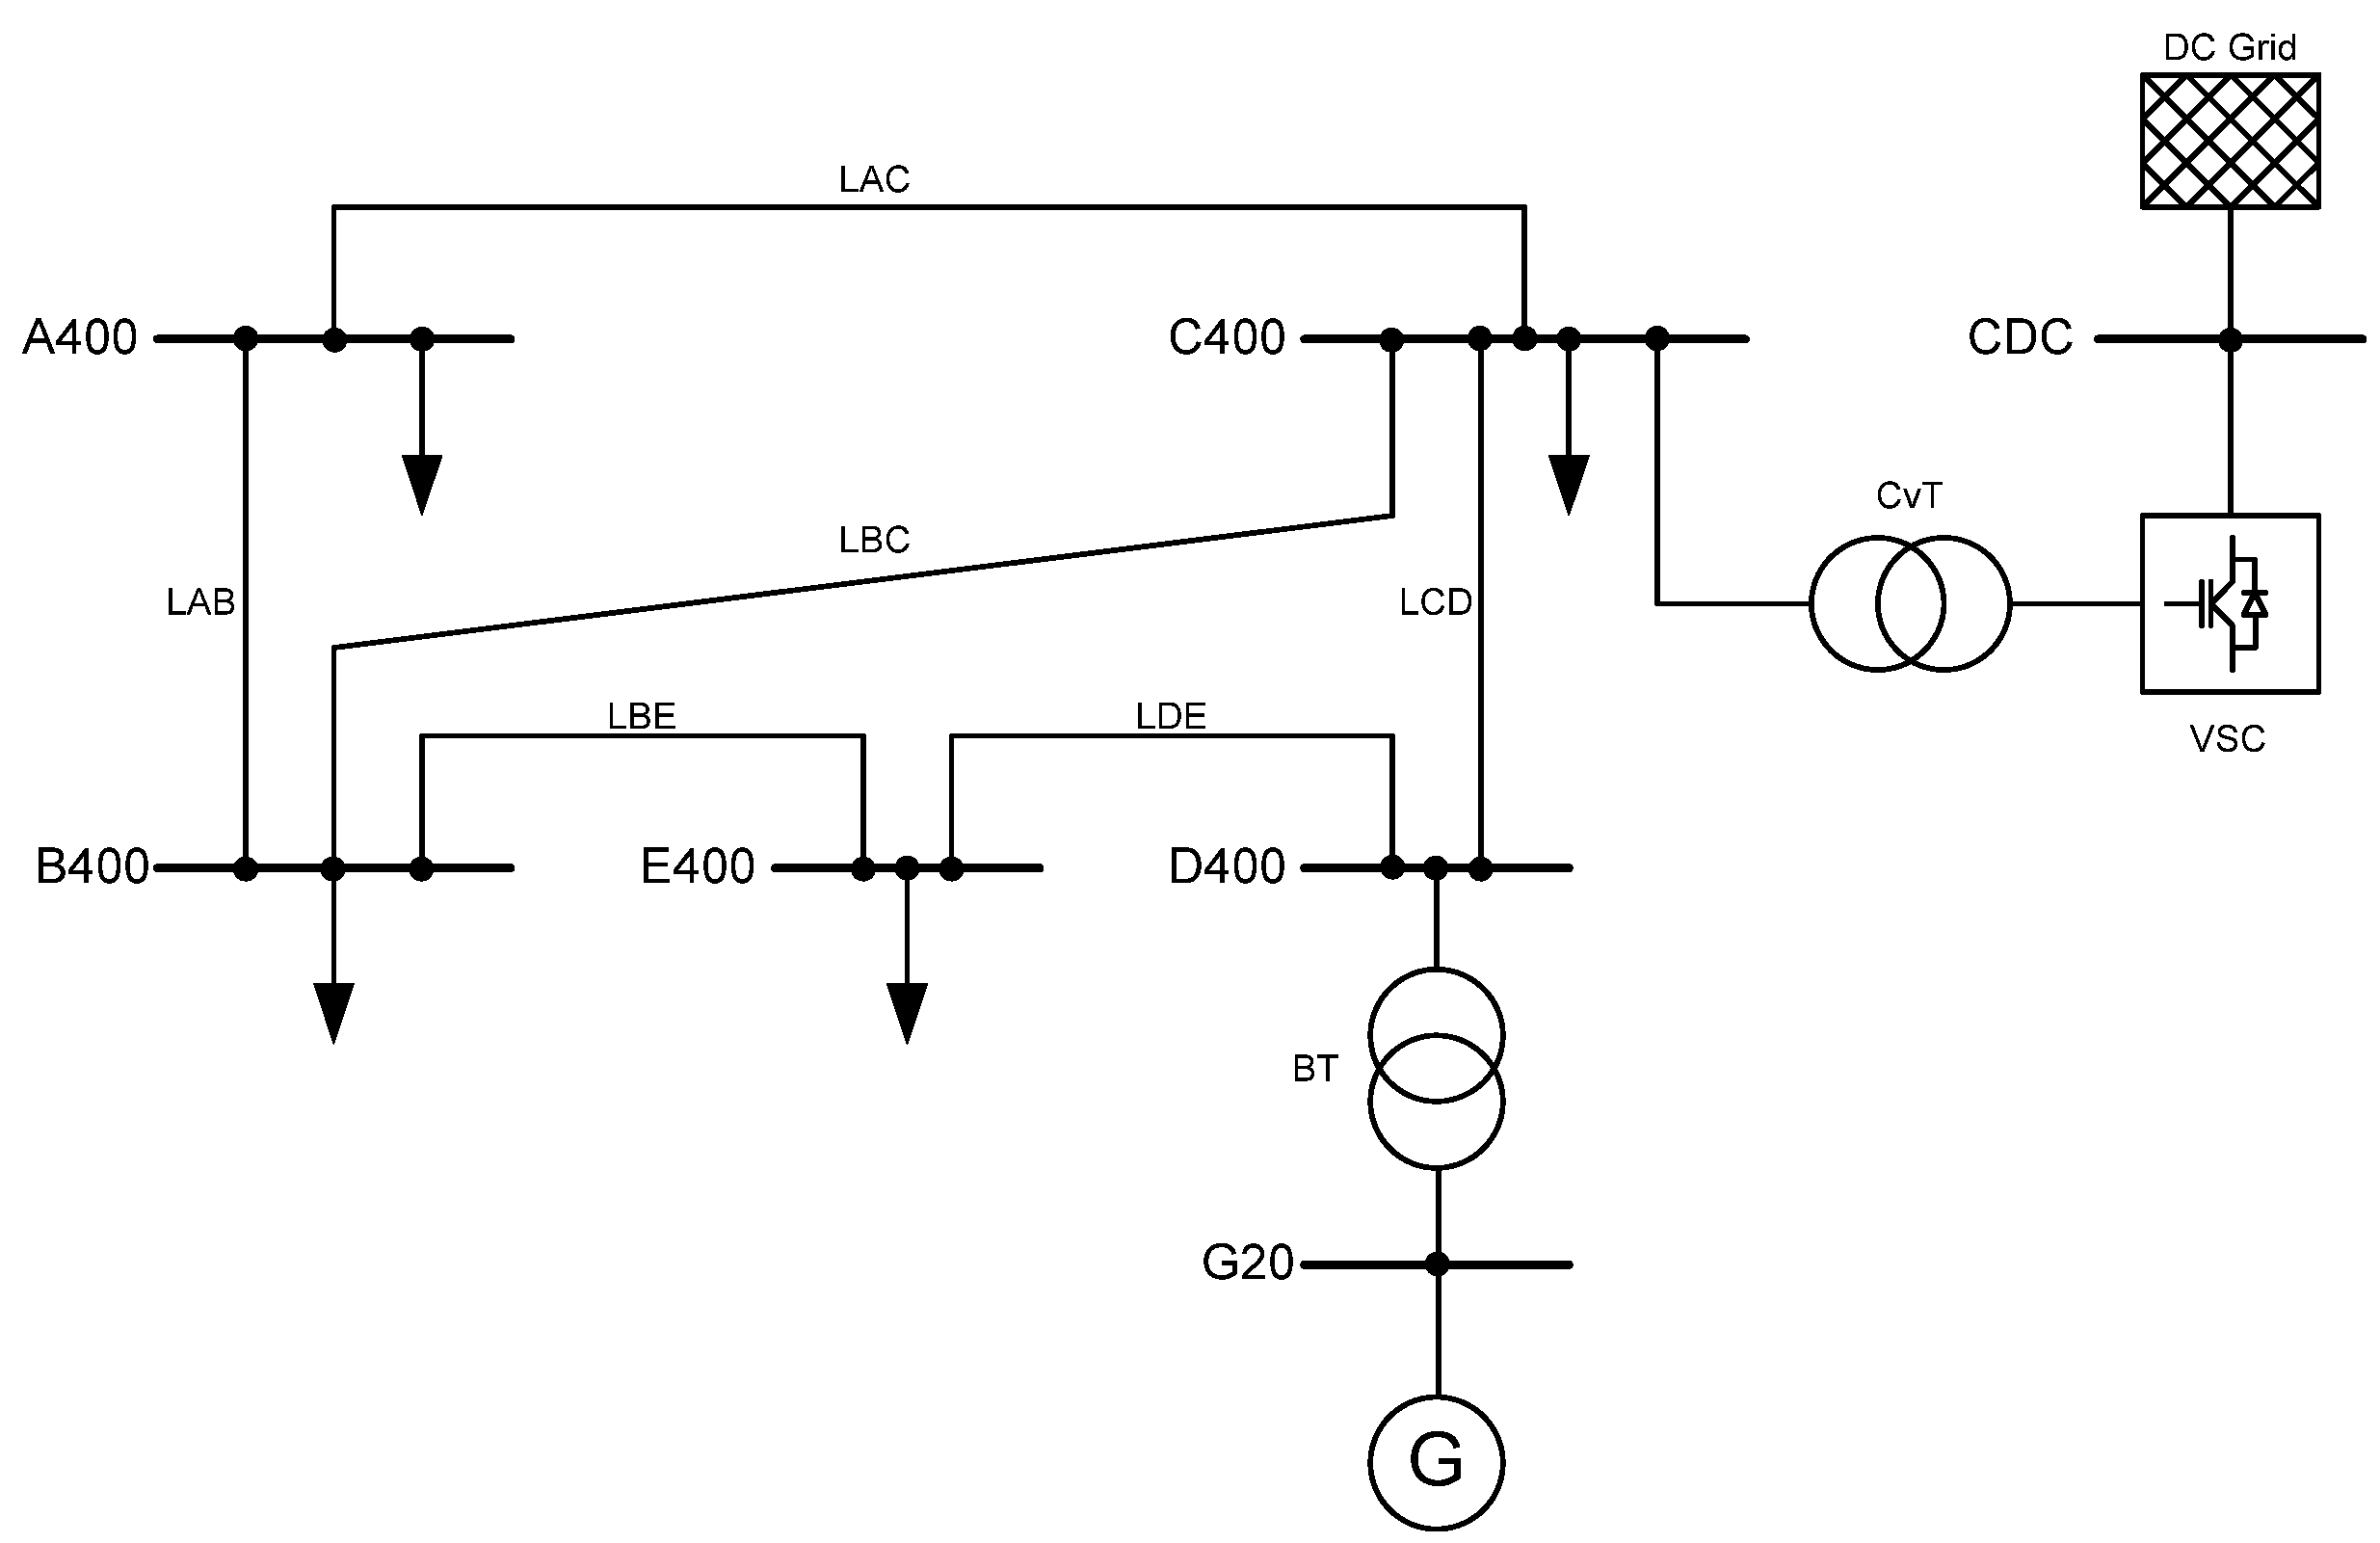
All studies were conducted using a test grid model designed in PowerFactory. The structure of the grid is presented in
Figure 9.
The VSC model previously described is supplied by an equivalent DC subsystem (DC grid). The DC grid is modelled using a single DC voltage source with specified internal resistance enabling its voltage level deviation. The VSC converter is connected to one of the power system terminals (C400) via a converter transformer (CvT). This allows sufficient representation of the VSC-type converter substation. The model consists of four PQ-type terminals feeding the loads’ models (A400, B400, C400, E400). All loads are constant impedance type models. The thermal power plant model consists of two elements—a synchronous generator (G) and unit step-up transformer (BT). All overhead lines’ (LAC, LBC, LAB, LBE, LDE, LCD) model parameters are calculated for aluminum conductor steel-reinforced (ACSR) with a nominal cross-section area 525 mm2.
The aim of the studies was to verify the possible VSC power capabilities based on its P-Q capability curve. This should have led to achieving extreme points in a power system operation including different VSC operating conditions. All analysis were iterative, including different power system loading and different levels of VSC active power. The range of examined power system loadings was 40%, 50%, 60%, 70%, 80%, 90%, which refers to the rated power plant loading. At each power system loading, the whole load-flow analysis was conducted. Firstly, the VSC active power level was set and the adequate reactive power was calculated, using Equation (3). After that, the control of all designated parameters took place. Both active and reactive power were reduced when needed if any transgression was detected.
5. Results and Discussion
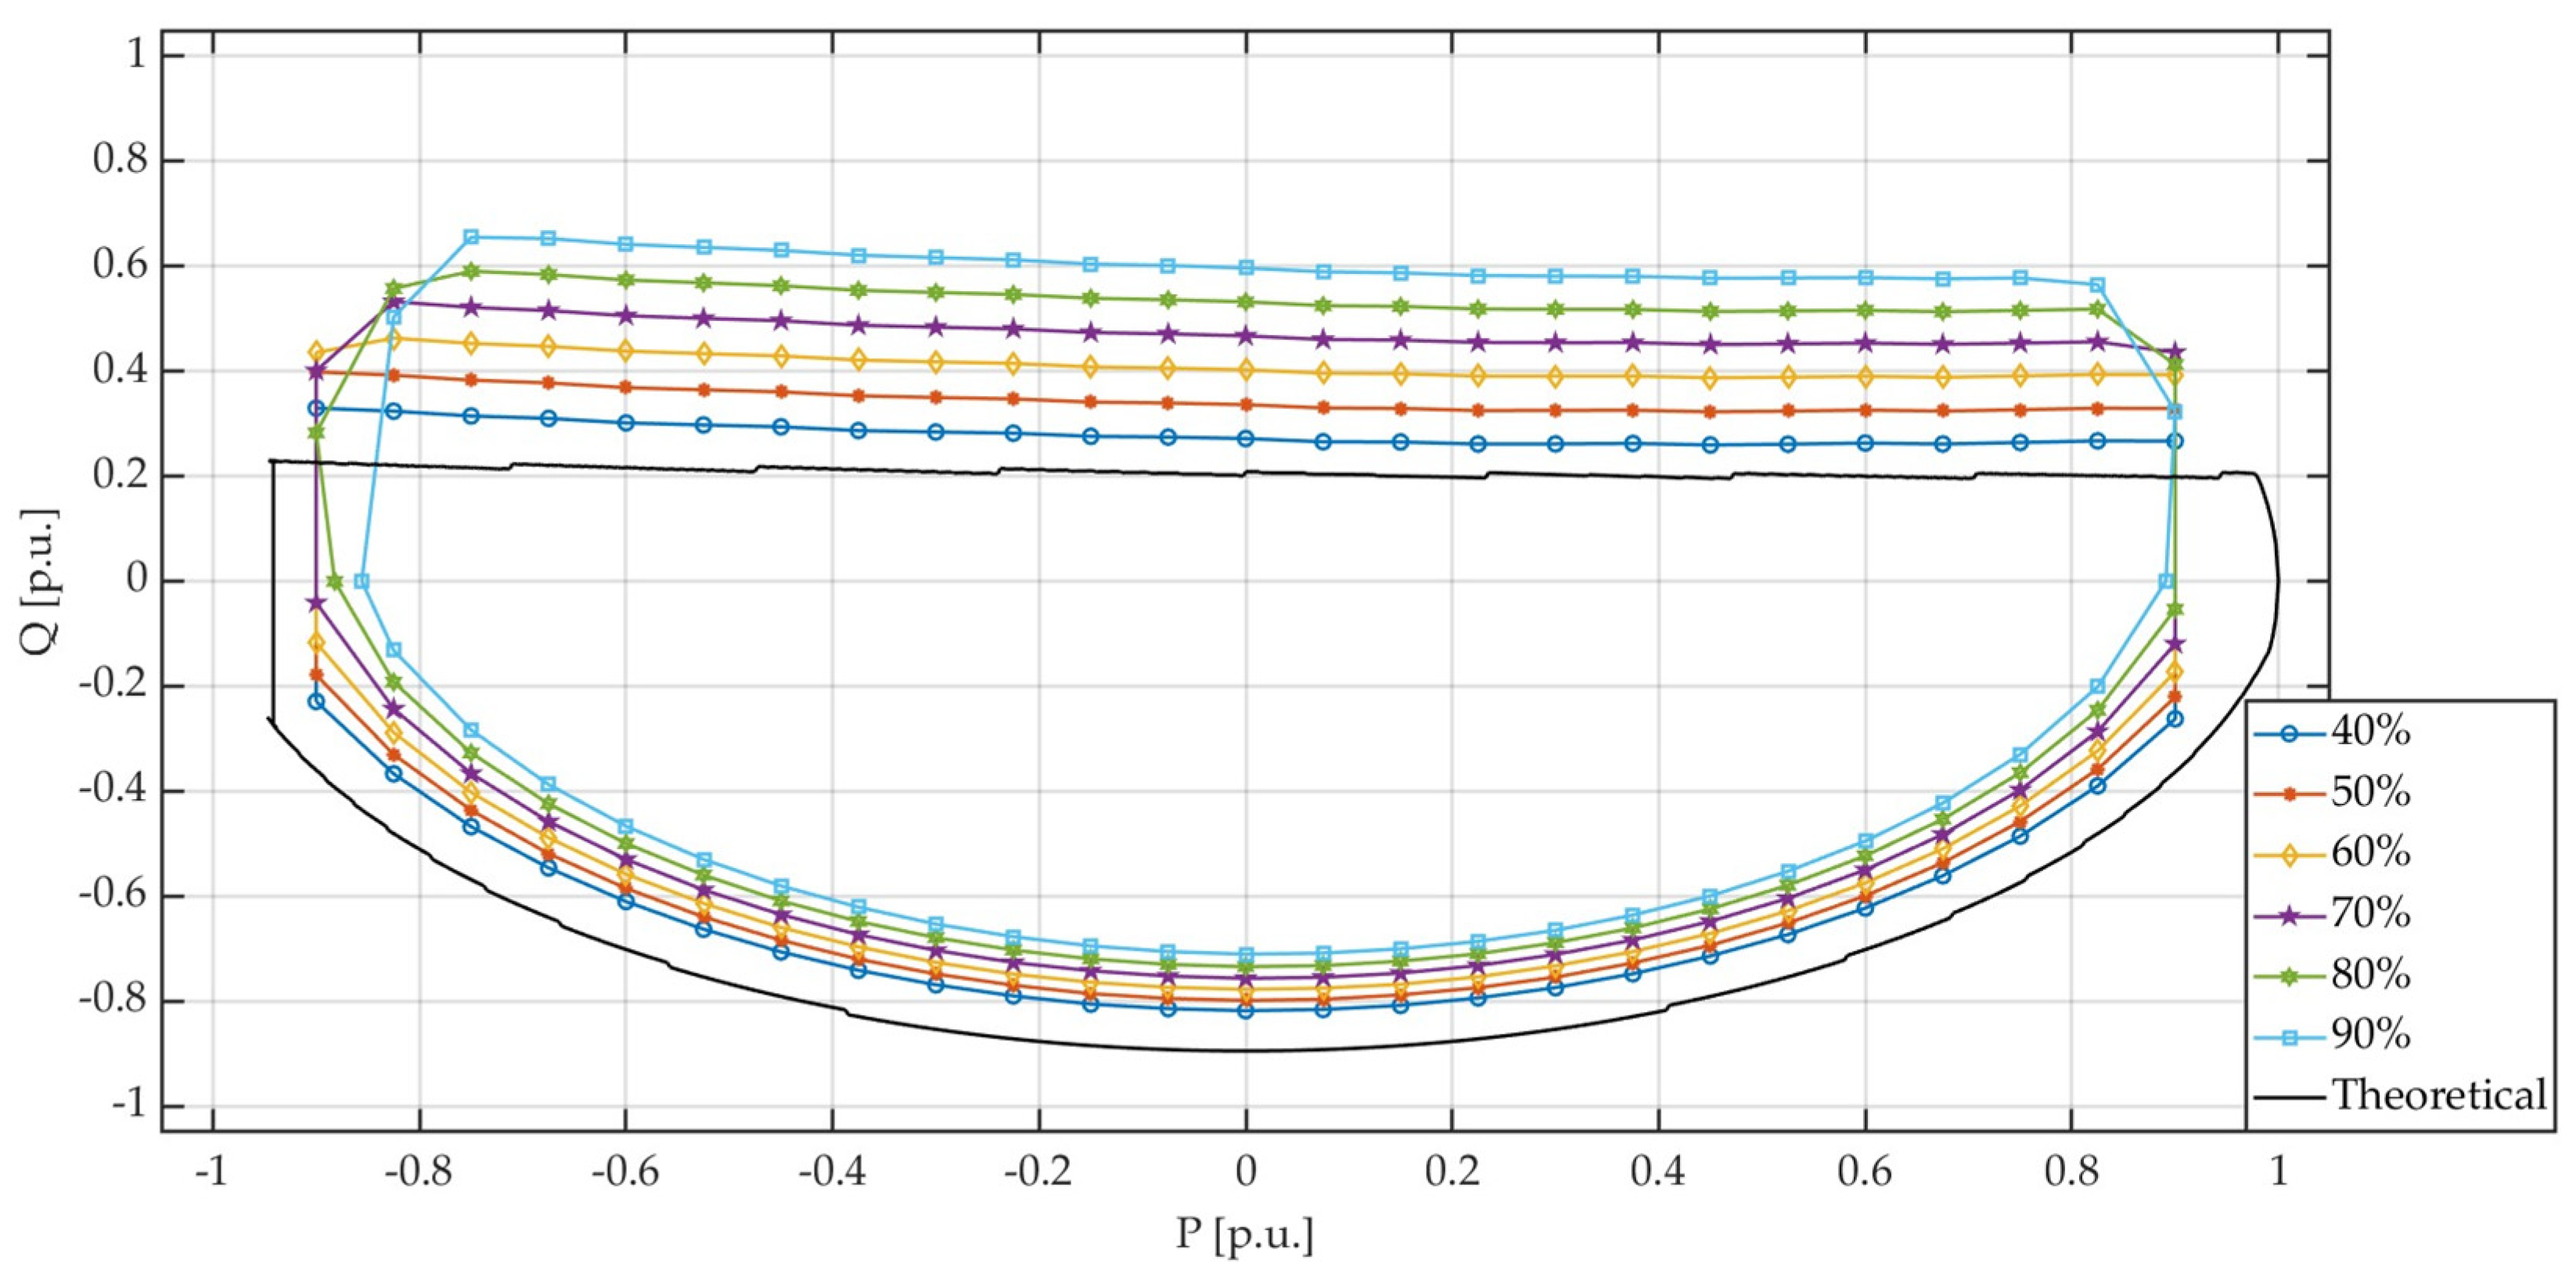
Taking into account the above-presented assumptions, various P-Q capability curves have been obtained (
Figure 10).
The curves presented in
Figure 10 indicate that the VSC’s admissible operation area in terms of reactive power strongly depends on power system loading level. Although the shape of the curve for individual percentage load 40–90% does not significantly change, it becomes moved upwards along with the AC grid loading increase. Thus, VSC capabilities in terms of generating additional reactive power are wider for higher power system loadings (the highest for 90%). At higher loadings, the VSC is capable of operating more like an additional reactive power source, whereas at lower loadings it is capable of acting more like a reactive power receiver. Reactive power generation capabilities are also less dependent on the VSC’s active power. As far as reactive power consuming is concerned, VSC has more to offer within lower power system loadings. This is a major advantage, as low loadings often cause problems with reactive power surplus (due to lines’ charging power) when high loadings result in its deficiency (due to increased reactive power losses caused by heavier loading). Having that, VSC seems to act as a perfect compensator both in terms of inductive and capacitive reactive power.
It should also be mentioned that generating reactive power allows the VSC to operate with a slightly larger active power export, as the voltage on the converter substation’s terminal increases. As far as active power import is concerned, neither reactive power generation nor drain have any impact on the VSC active power level (apart from at the highest analyzed loading level of 90%).
According to the fact that the VSC is able to affect the power system both in terms of active and reactive power, the grid’s response may differ and depends on the power exchange level provided by the VSC. Taking into account that both aforementioned powers exchanged at the same time can influence one another, a more accurate way of analysing data should consider the VSC P-Q capability area as a combined parameter, rather than as separate variables (P or Q).
The theoretical P-Q capability curve, calculated earlier from converter parameters (
Table 1) and presented in
Figure 7, has also been included in
Figure 10. As can be seen, the theoretical capabilities of the VSC differ from real cases. The shape of the curves remains the same, but the operating area is different. VSC operation is inseparable from the power grid it is connected to. Thus, the power grid properties affect the capabilities provided by the VSC device.
Figure 10 indicates that different power systems’ loading significantly enlarge VSC’s capabilities in terms of reactive power generation, whereas the reactive power consumption capabilities are slightly narrowed. This comparison illustrates the effect and importance of the presented work. Using only a fixed theoretical P-Q curve can lead to an incorrect assessment of the impact of the converter on the power system. The actual operating capability of the converter may be overestimated or underestimated.
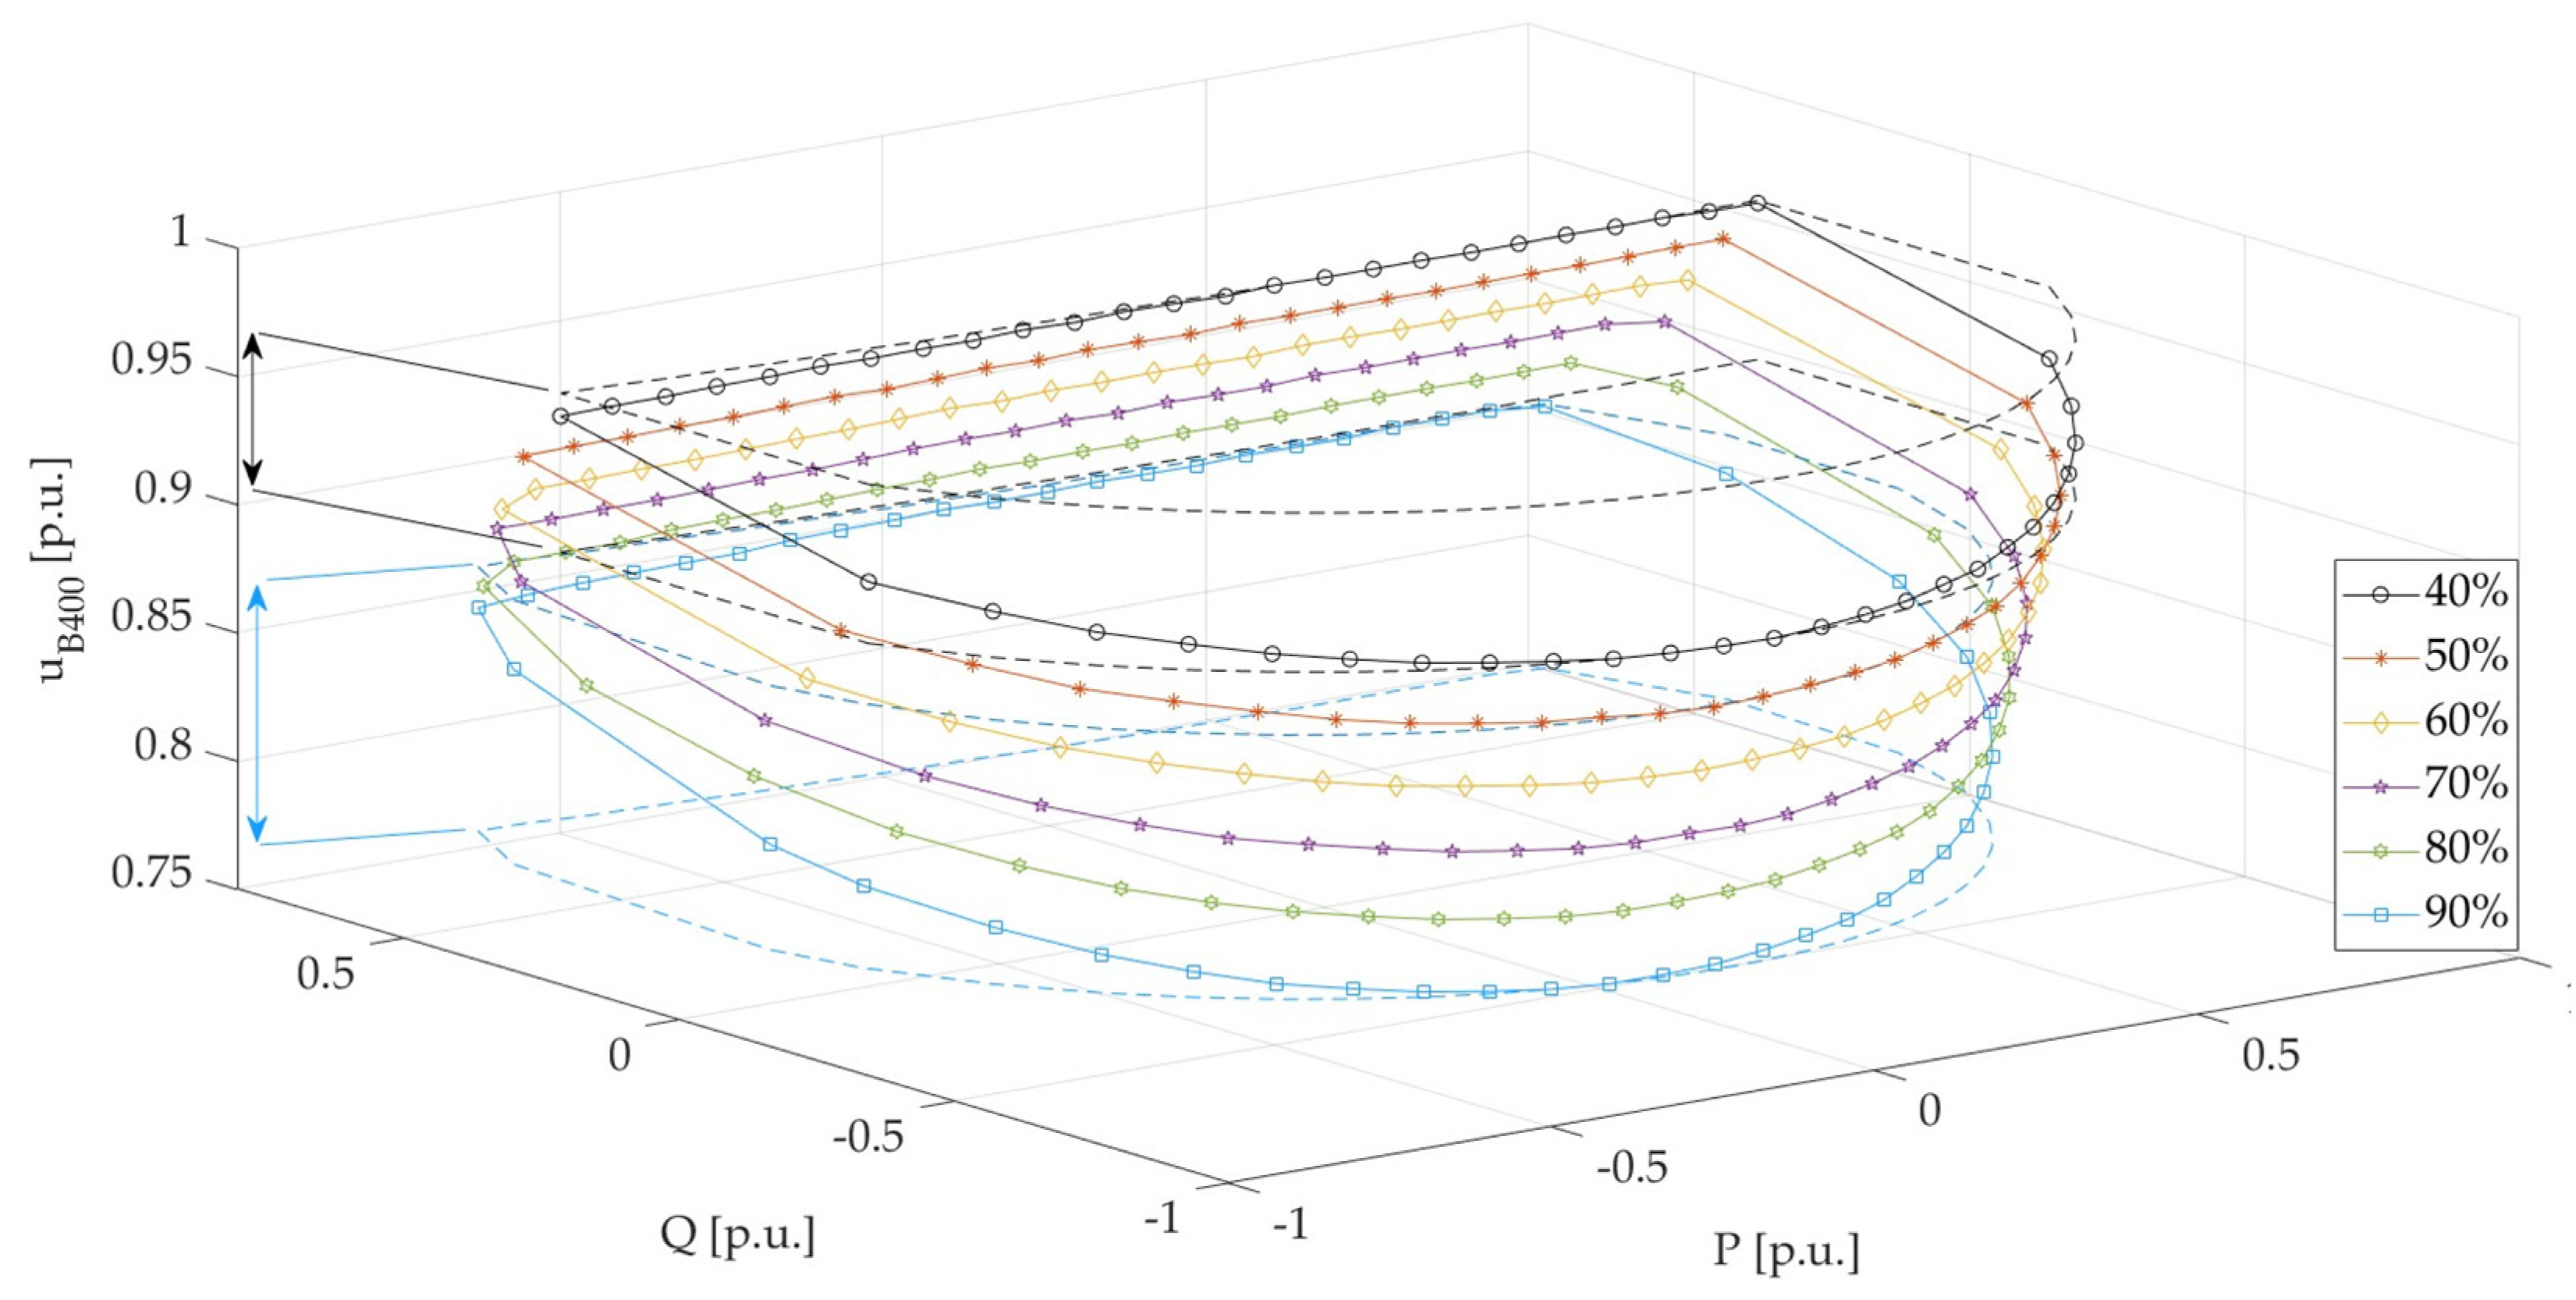
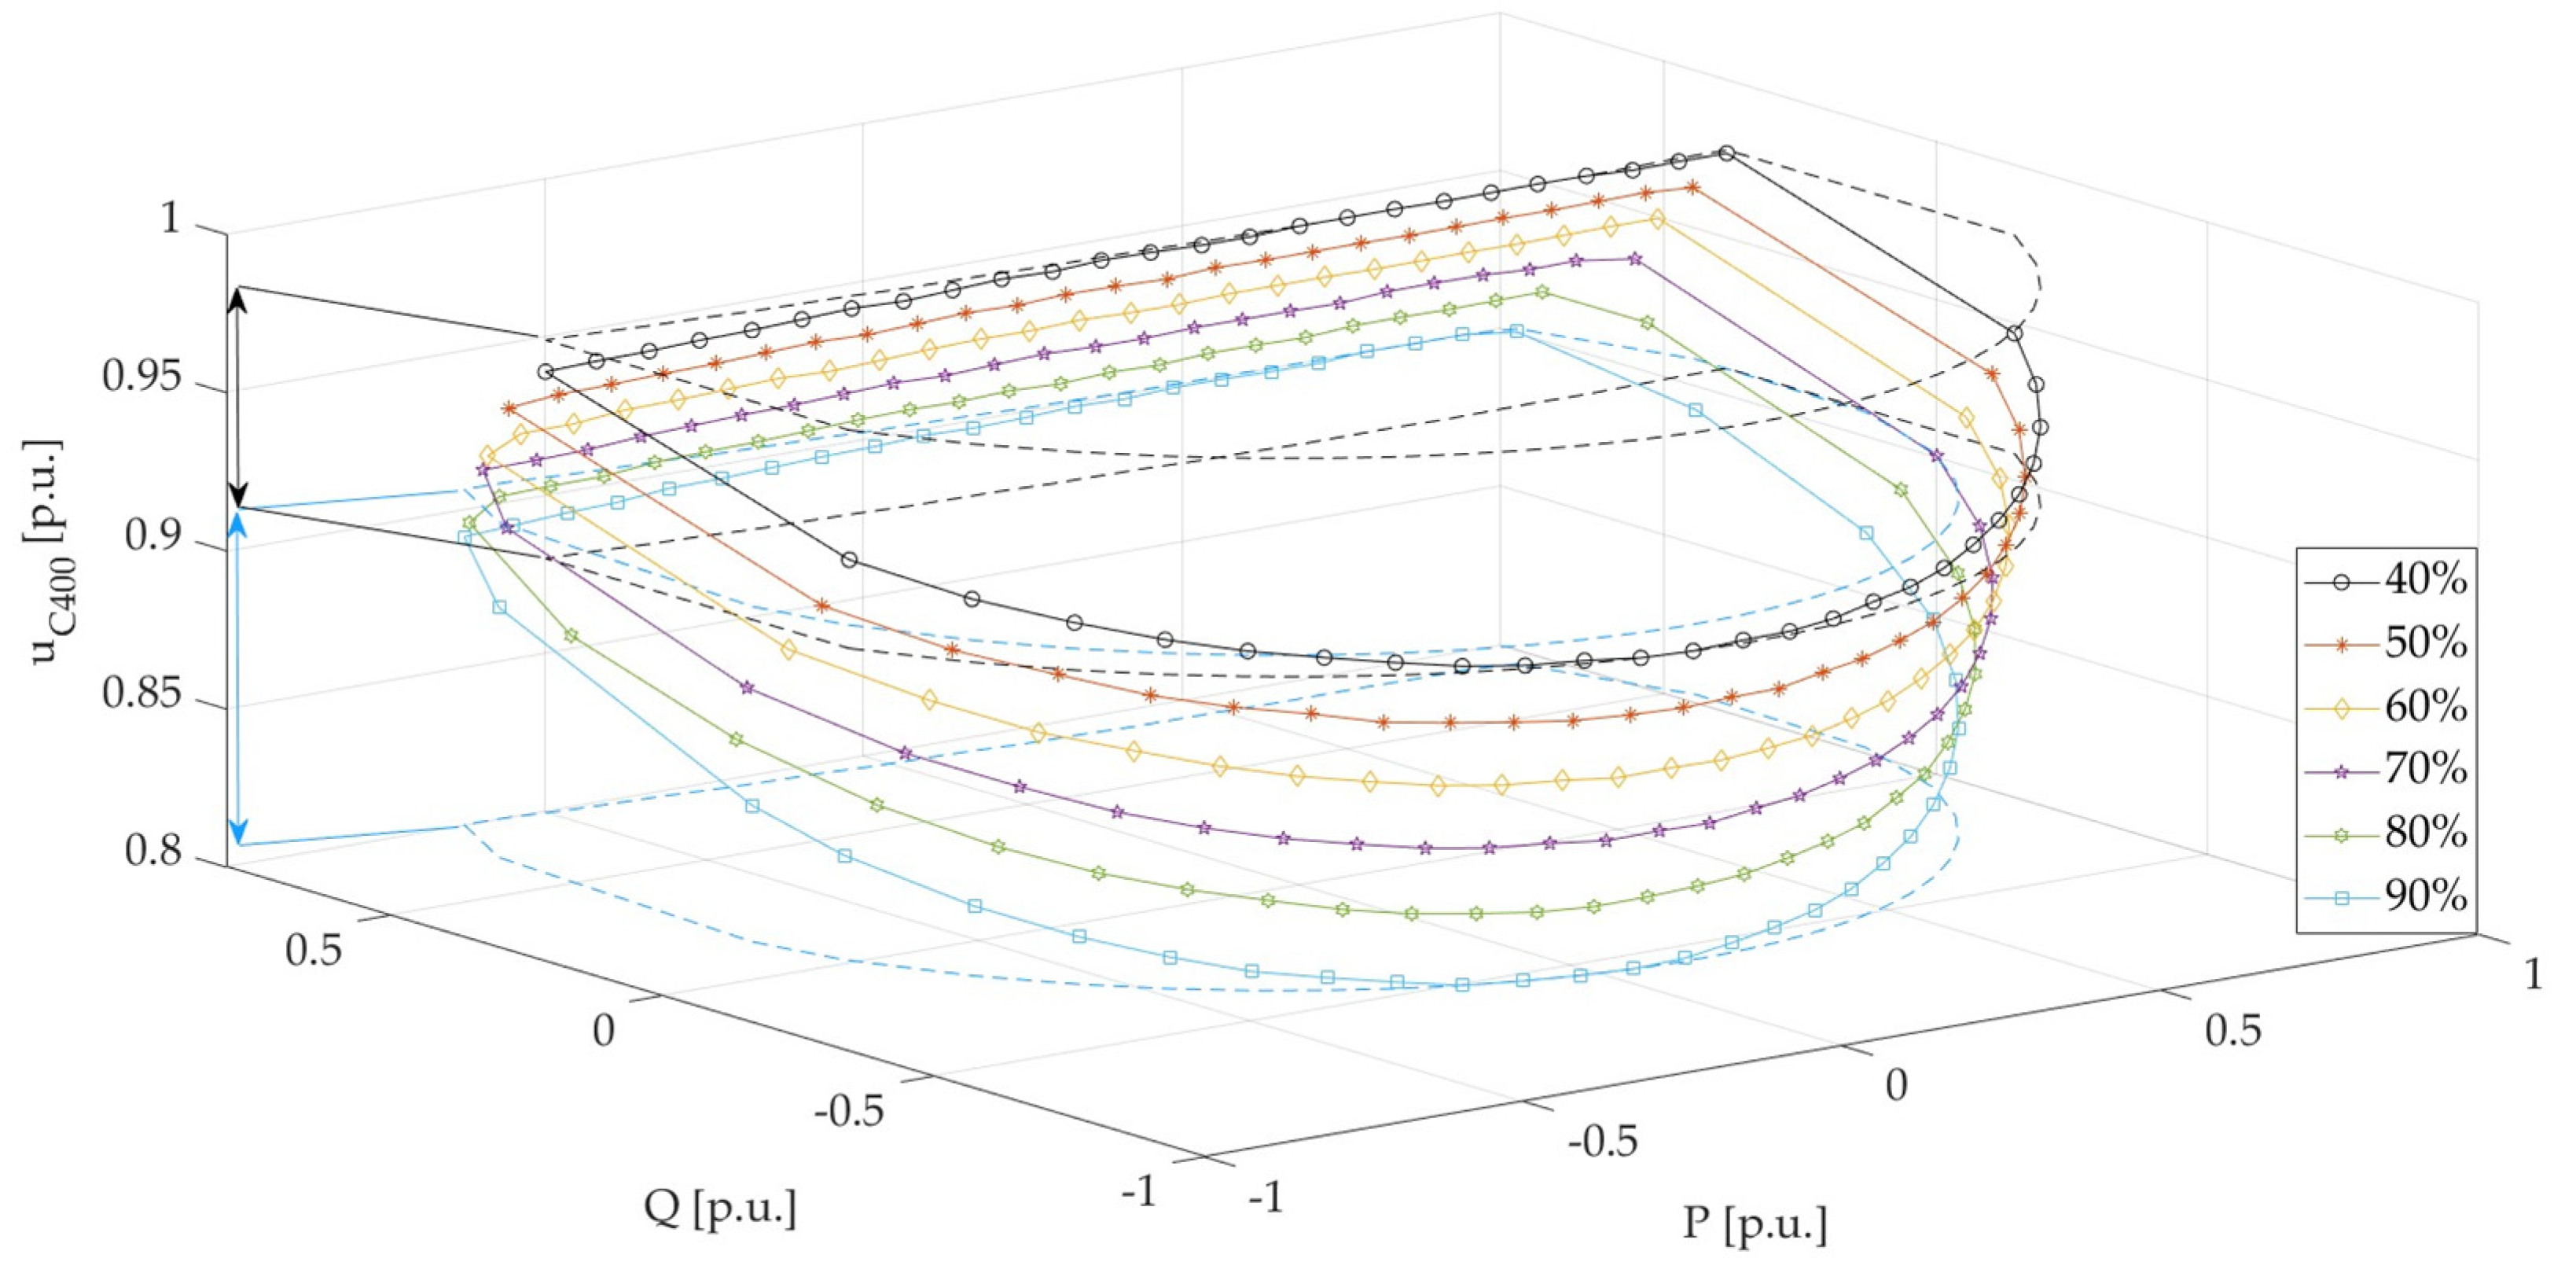
Figure 11 and
Figure 12 present voltage levels in two chosen grids’ terminals, respectively, as a function of the converter’s P-Q capability curve. Terminal B400 is the farthest from the converter substation coupling point, whereas terminal C400 is at this point itself. The results are also presented with connected point curves (area/surface boundaries) as they show the limitations of the VSC’s P-Q capability curve at each power system’s loading. Thus, all the operating points within the designated areas are admissible.
Figure 11 and
Figure 12 indicate that the converter’s active and reactive power generation/consumption strongly influences the voltage in the grid. The voltage range at terminals B400 and C400 shows a significantly stronger sensitivity to the converter’s reactive power (Q) change than to the active power (P) change. This is an expected result, as voltage and reactive power form a pair of interrelated parameters. However, when both powers (active and reactive) are taken into consideration, there is a wide range of voltage levels variability to be obtained.
A strong connection with global power system loading can also be observed. Operating within a low loadings range result in a narrower range of voltage levels, which extends along with the global loading increase. The lowest and highest voltage levels for the extreme power system loadings are marked with dotted lines in
Figure 11 and
Figure 12, and voltage levels’ variability are indicated with arrows. At the 40% loading level, the potential voltage level variability range reaches about 5% (black line with arrows), whereas at the 90% loading level this range was about 10% wide (blue line with arrows). Another thing worth mentioning is that the shape of the curves in different terminals does not change, which means that the converter affects all of them the same way. They only change in position with respect to the voltage level axis, which is a natural effect of voltage drops occurring within transmission lines.
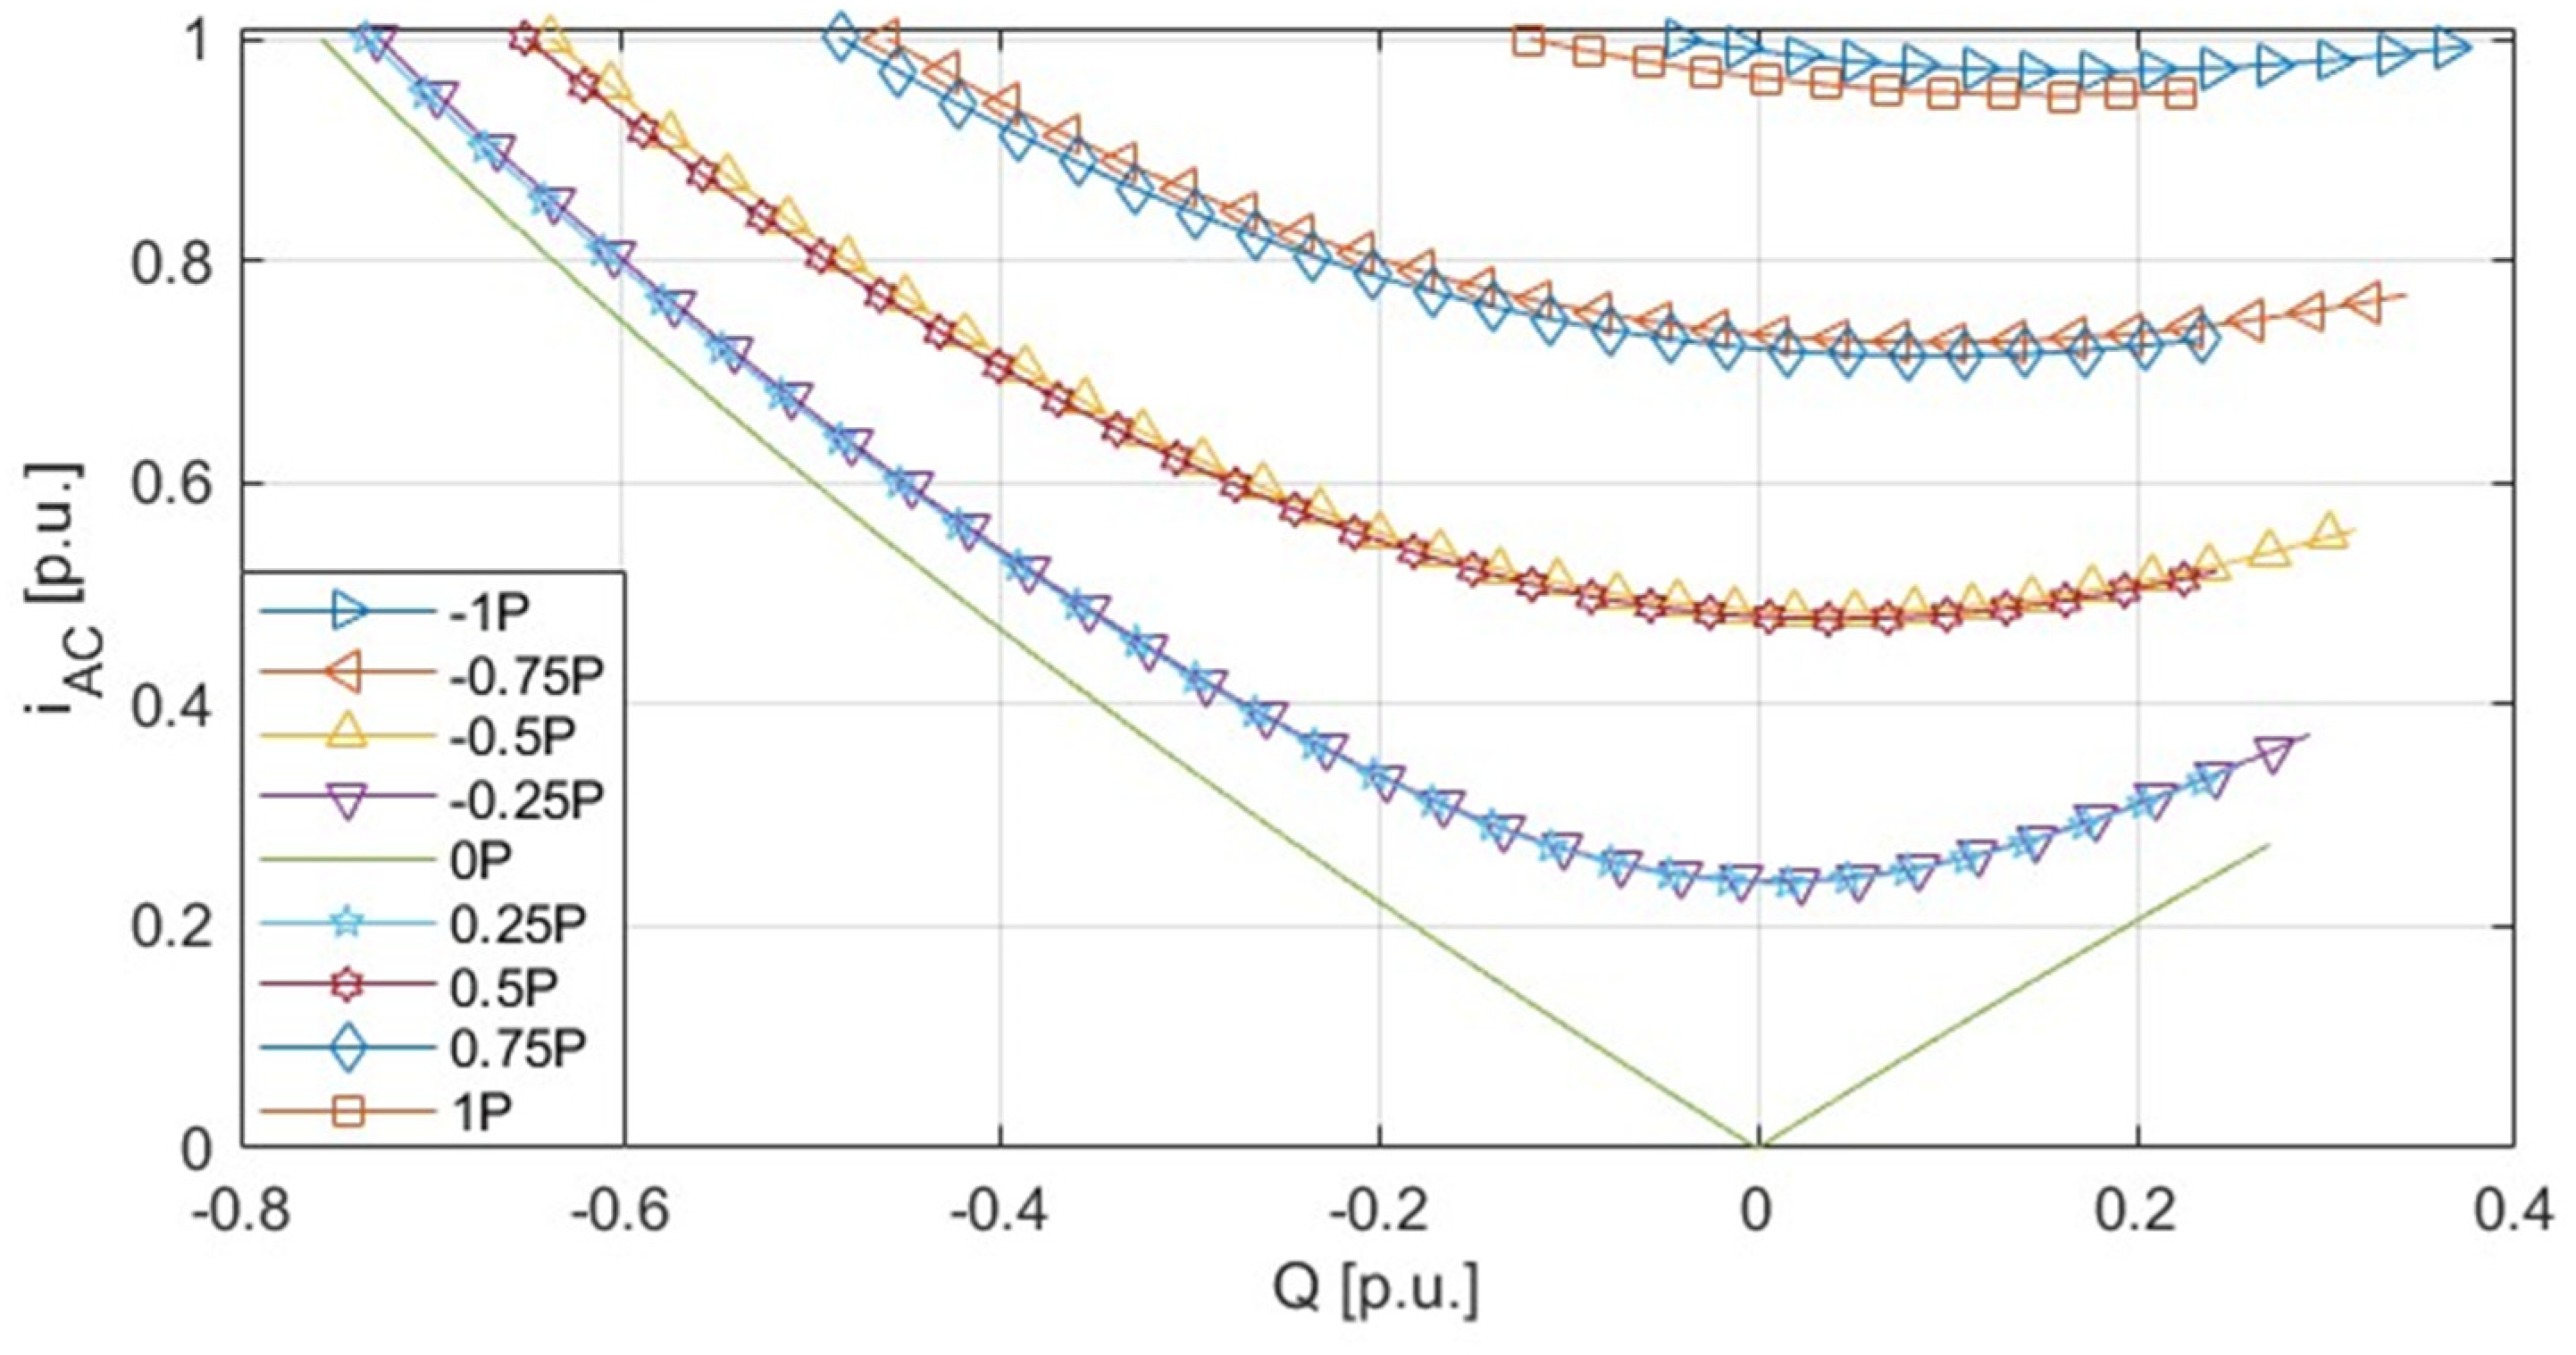
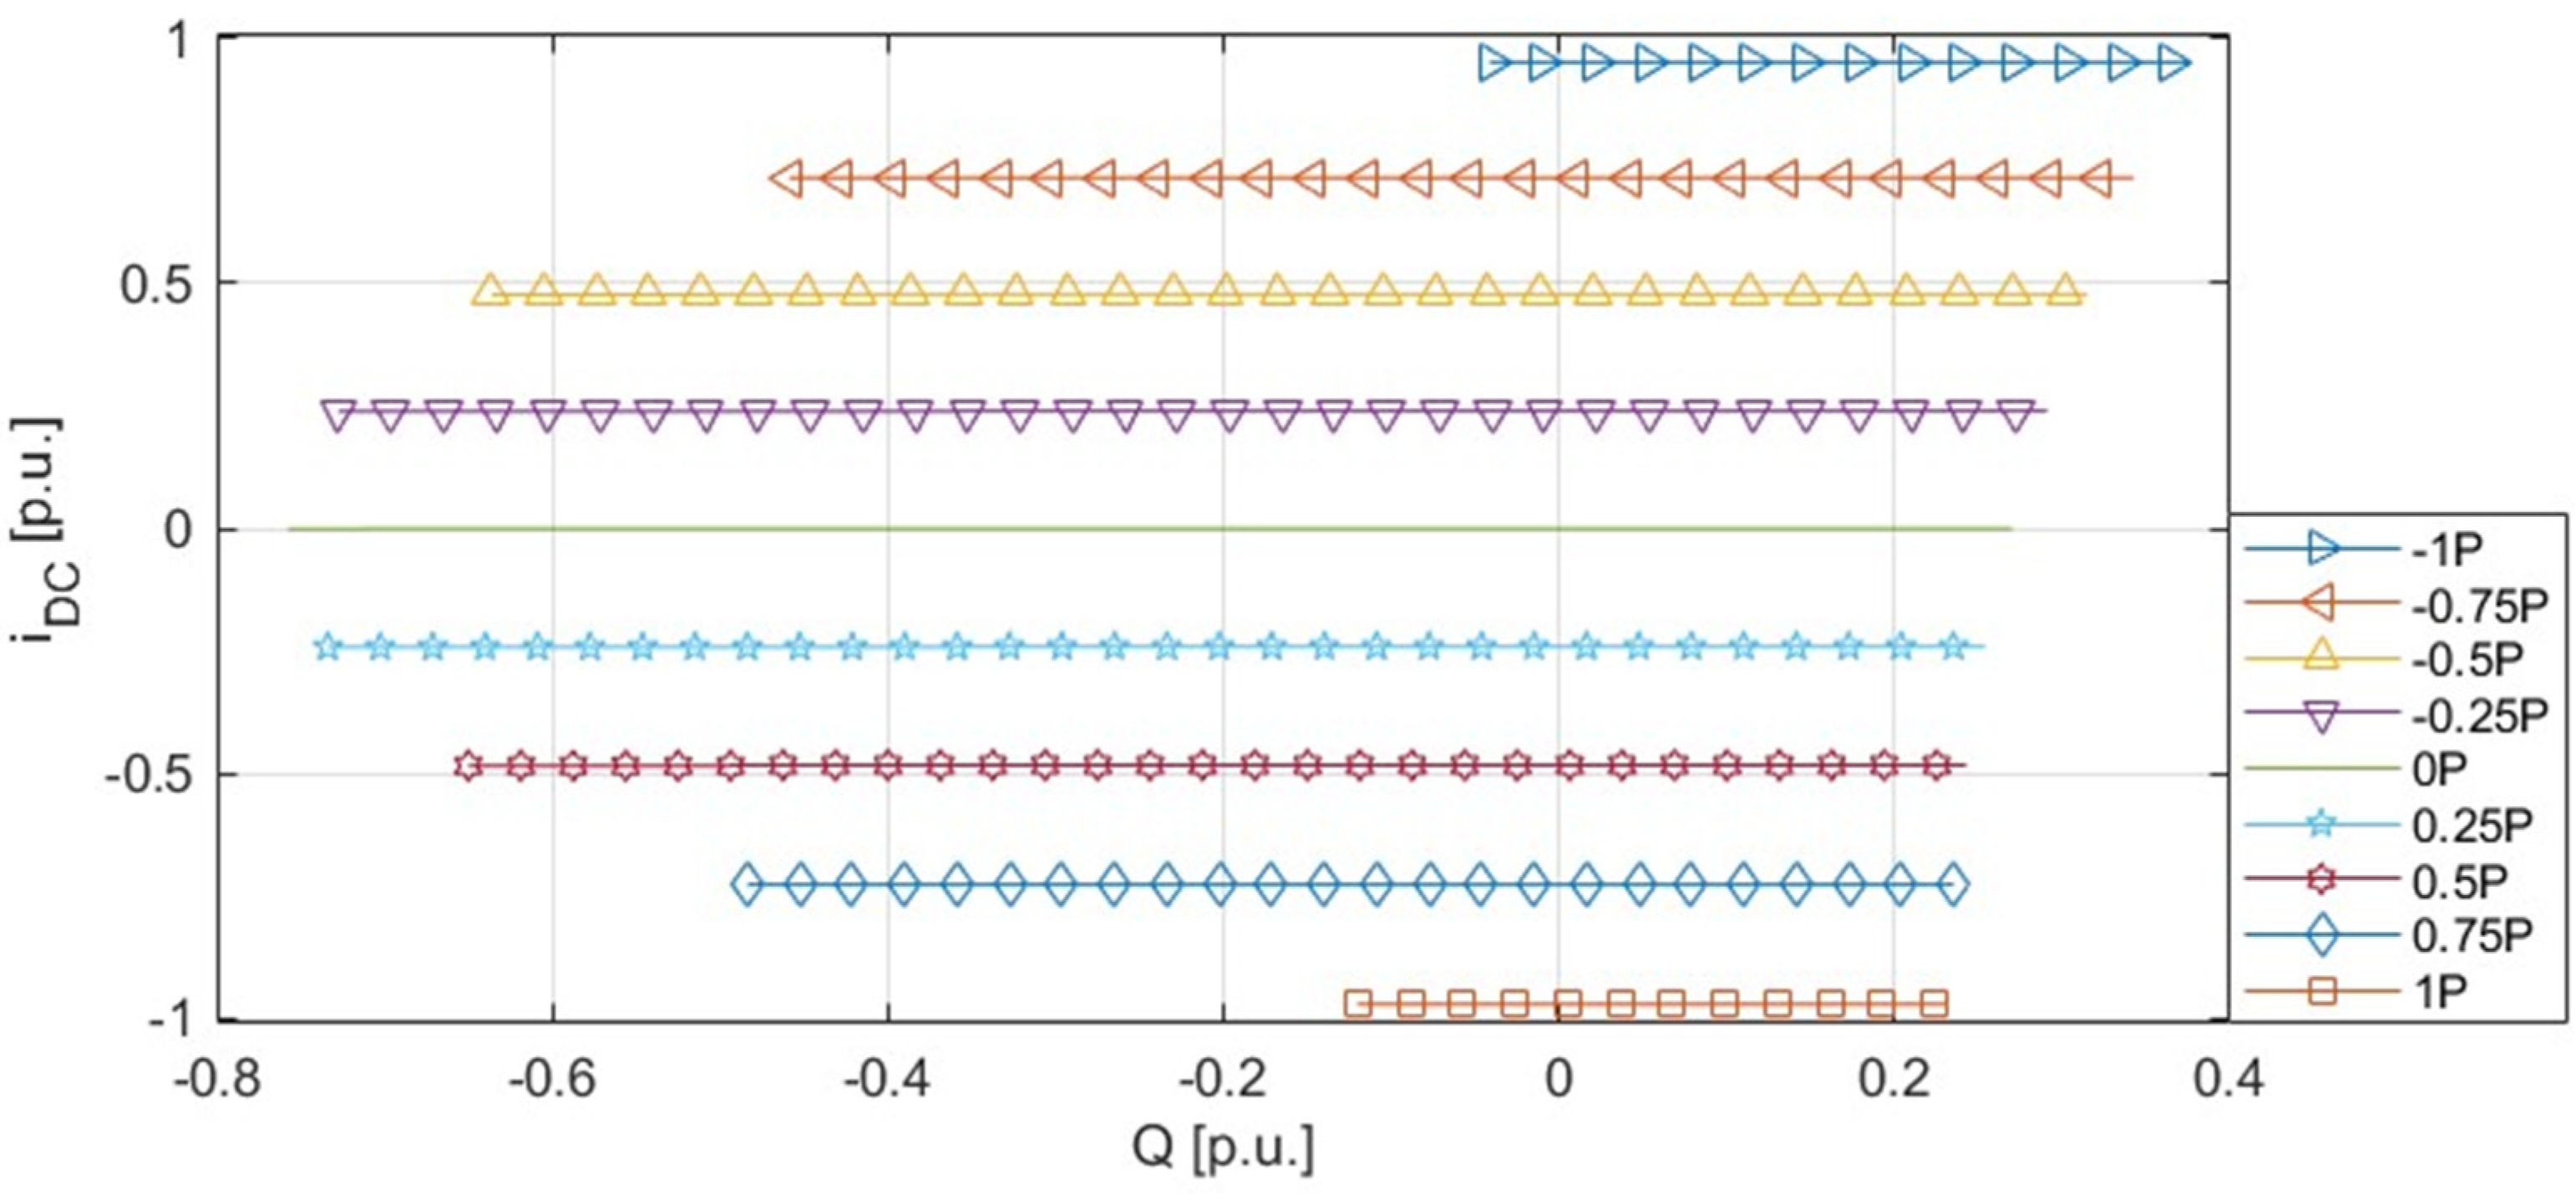
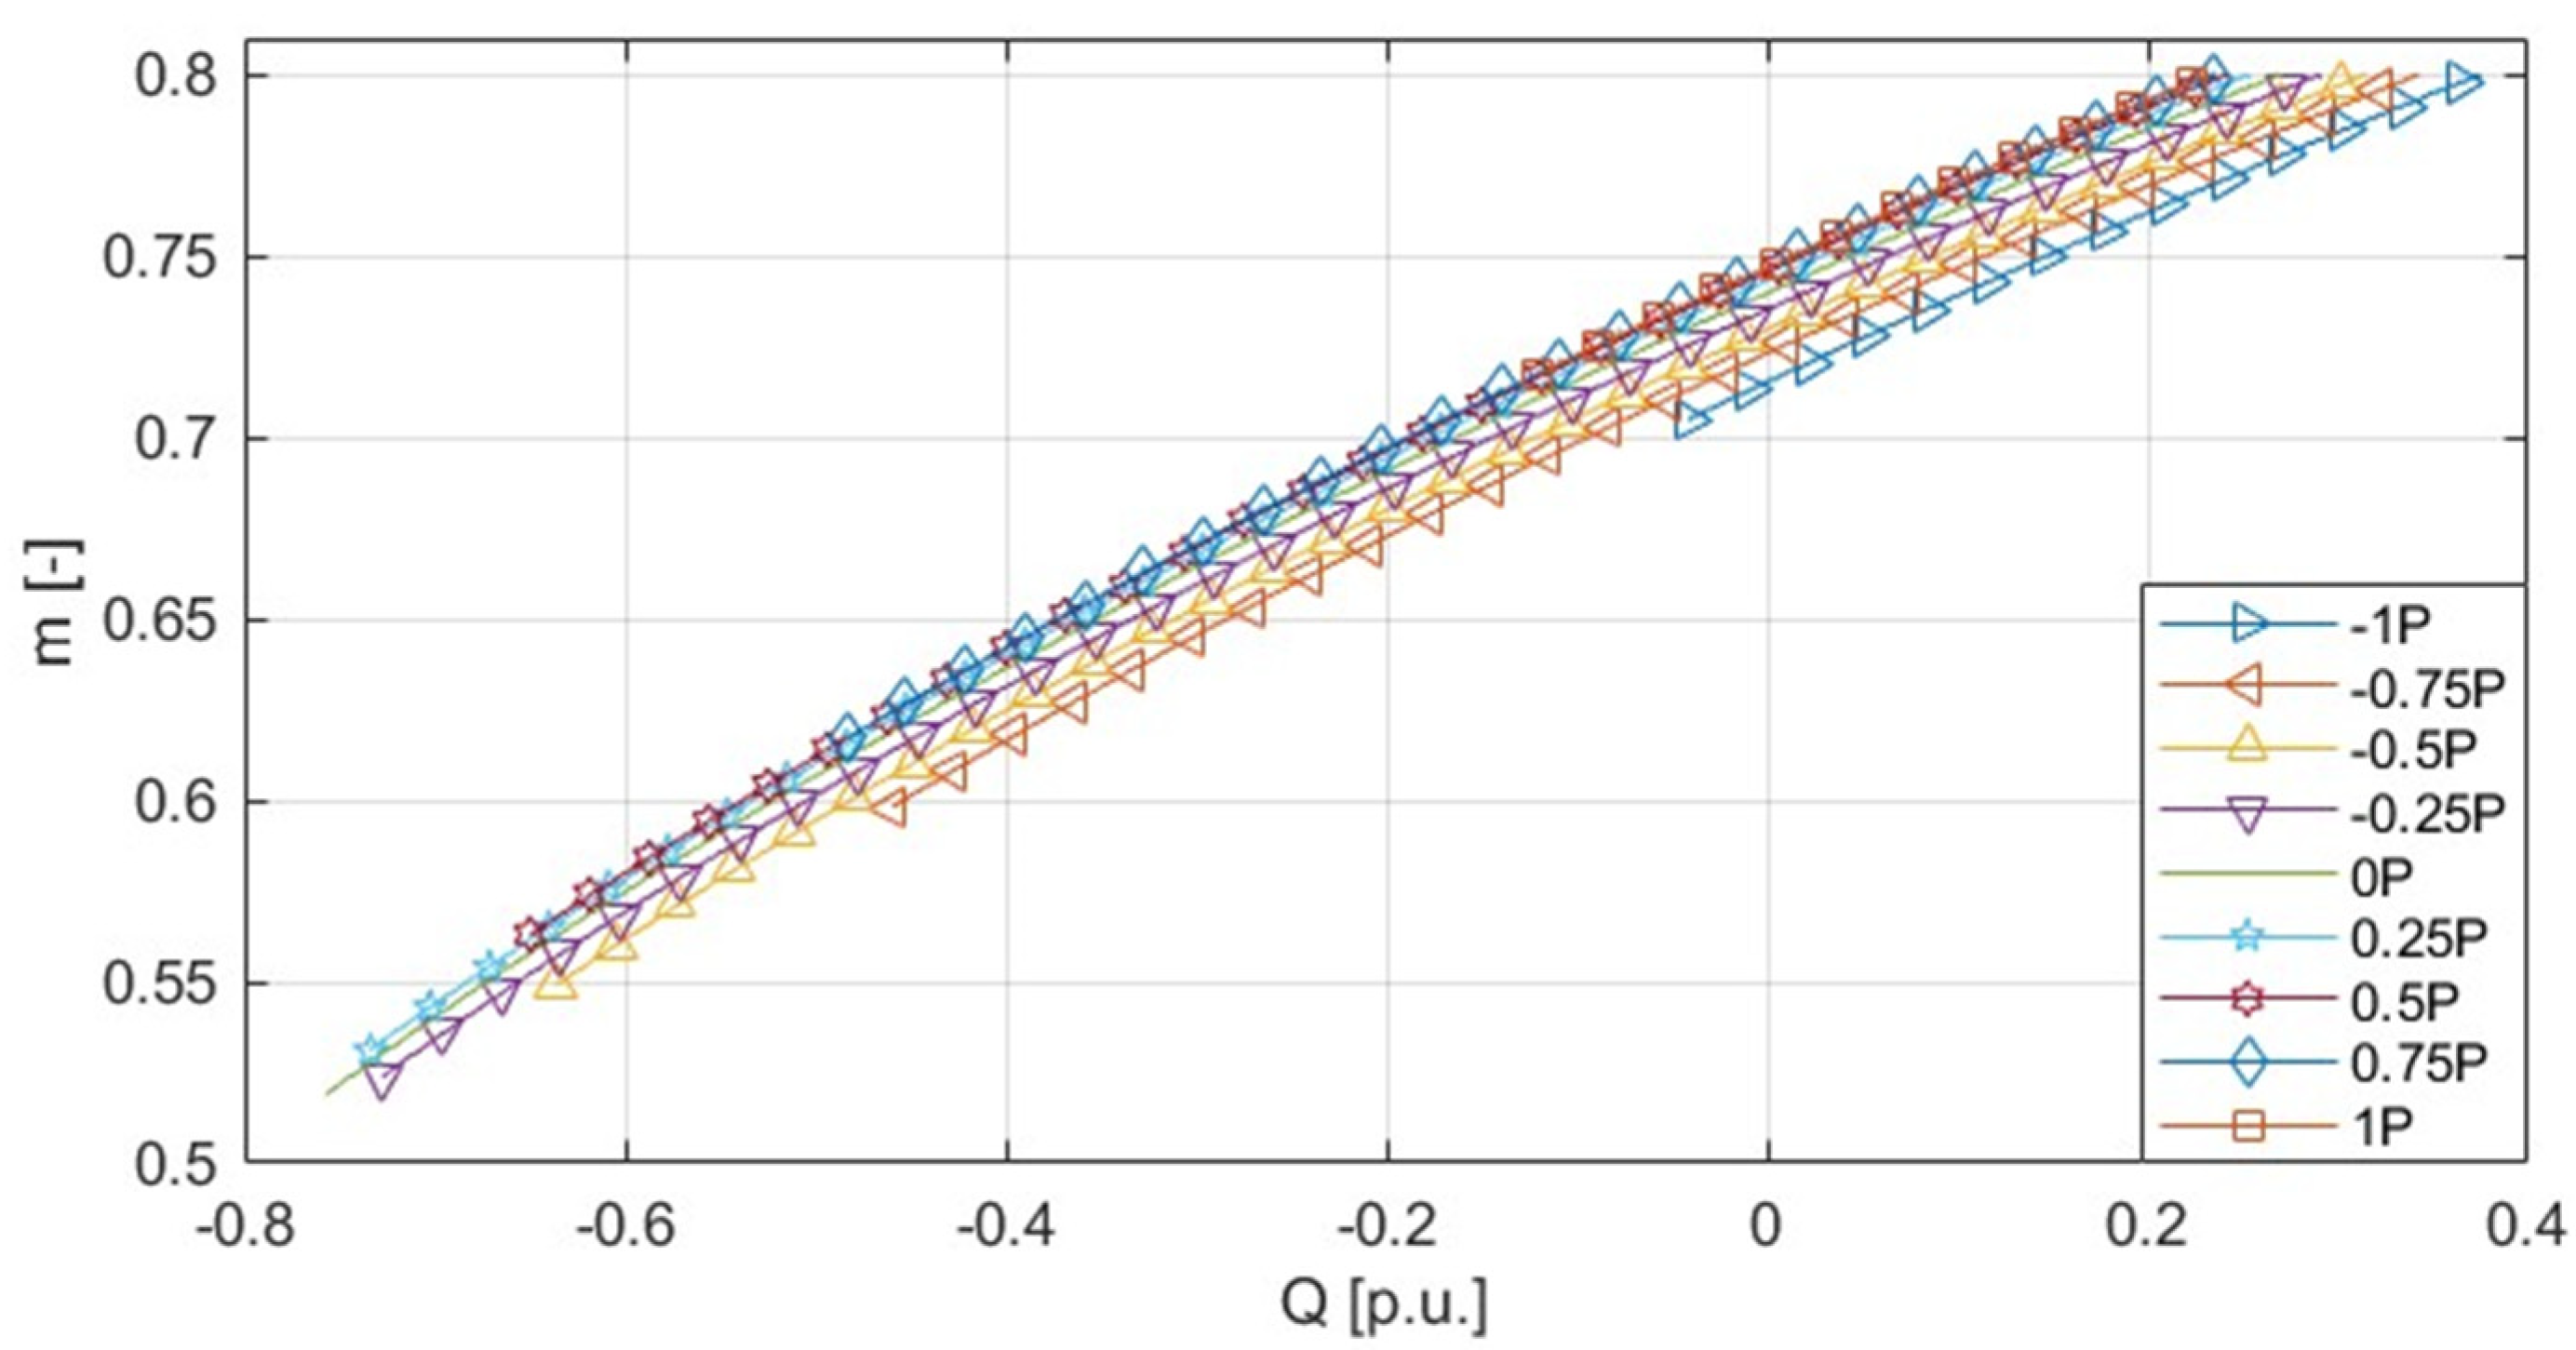
Another issue that must be taken under consideration is the potential influence of reactive power variability on other VSC crucial parameters, in terms of AC current, DC current, and modulation index. These values, as a function of the converter’s reactive power, are illustrated in
Figure 13,
Figure 14 and
Figure 15.
Figure 13,
Figure 14 and
Figure 15 indicate that limitations included in the proposed VSC model are adequate and fill initially stated assumptions. As can be seen in
Figure 13, the converter’s AC current values limit its capabilities of reactive power exchange at each designated active power set-point (−1P,…, 0P,…, 1P). What is also worth mentioning is that the direction of active power flow through the converter (generation and consumption) does not significantly change its compensative capabilities.
The converter’s DC current shows no dependence on its reactive power (
Figure 14), which means that the active power exchange realised by the converter remains undisturbed. In other words, the reactive power control provided by the converter can be performed with no negative impact on other operation conditions.
The converter’s modulation index curves also indicate (
Figure 15) that the value of this index does not exceed 0.8, which is the maximum permissible value as stated in Equation (4). Its value was kept within designated range for all obtained points of operation. It can be seen that the reactive power generation results in AC voltage increase, corresponding with Equation (6). Such operation forces the converter to operate with higher DC voltage or at higher values of the modulation index, corresponding with Equation (4).
Table 2 present a summary of the converter’s parameters and power system nodes’ voltage levels for extreme reactive power values.
The main conclusion coming from the
Table 2 analysis is that the VSC’s reactive power exchange capabilities depend on two parameters: the AC current “i
AC” and modulation index “m”, and their max permissible values are reached. The maximum reactive power that can be drained from the power system by the VSC is limited by its AC current (the AC current reached a value of 1 p.u.), whereas the maximum reactive power generation is limited by the modulation index (the modulation index reached a value of 0.8 p.u.). The fact that these capabilities do not interfere with active power exchange is a major advantage. Obviously, the widest possible reactive power exchange range (from −0.758 p.u. to 0.27 p.u.) occurred for no active power exchange.
6. Conclusions
The achieved outcomes indicate that the presented VSC model is adequate and operates properly. All included limitations fulfil the assumptions and make the model’s operation closer to reality, along with being simple and flexible in terms of the implementation.
This model provides the possibility to test and analyse different VSC operation points and their influence on the power system. It has been shown that the actual active and reactive power generation capability of the converter, with all the constraints on converter operation, can deviate from the initial (ideal) characteristics of the converter. This is due to the interaction between the converter and the power system. Therefore, an ideal, fixed P-Q characteristic determined in isolation from the real operating conditions of the converter should not be used for power system planning and development.
As has been presented, the converter provides a wide range of possible influence on voltage levels within the AC grid. As the VSC’s active and reactive power can be set independently, they both, however, influence the interaction with the power system. Thus, it seems advisable to analyse the crucial grid’s parameters as a function of the VSC P-Q capability curve, rather than its active and reactive power separately.
From the power system managing point of view, VSCs should be considered as elements of voltage and reactive power control within the grids. Considering lower power system loadings, the VSC is able to drain more reactive power that can be used, e.g., to eliminate its surpluses caused by lines operating with lower loadings. When power system loading increases, VSCs’ P-Q capability curve moves upwards relative to the Q axis, meaning that its generative capabilities increase. What is more, the noted possible voltage regulation range for 90% power system loading was about 10%, being significantly wider in comparison to the approximately 5% noted for 40% power system loading. This proves that VSC, in terms of its compensative capabilities, becomes more flexible and useful within higher power system loadings.
Further presented results indicate (
Figure 14,
Table 2) that the described process of reactive power control has no impact on the active power transmitted by the VSC. The VSC’s compensative capabilities (range of reactive power exchange) are obviously limited along with the active power transmission increase.
The approach presented by the authors can be used in any power flow calculation software that allows the calculation to be automated on the basis of a user script. Most of today’s power system analysis tools have the ability to implement this method.
The authors intend to conduct further analyses of the use of the proposed method on more complex multi-node power system models. The authors also want to assess what differences there will be when using the classical approach with fixed converter characteristics against the proposed method in a large-scale power system model.
The increasing number of converters connected to the power system (wind turbines, photovoltaic sources, HVDC systems) requires certainty of results as a basis for the development and operation of the power grid, and the approach presented by the authors increases this certainty.


