Article

Long Short-Term Memory Network-Based HVDC Systems Fault Diagnosis under Knowledge Graph

1
EHV Power Transmission Company of China Southern Power Grid Co., Ltd., Guangzhou 510530, China
2
China Southern Power Grid Co., Ltd., Guangzhou 510530, China
3
EHV Power Transmission Company of China Southern Power Grid Co., Ltd., Dali Bureau, Dali 671000, China
4
Maintenance and Test Center of CSG EHV Power Transmission Company of China Southern Power Grid Co., Ltd., Guangzhou 510530, China
*
Author to whom correspondence should be addressed.
Electronics 2023, 12(10), 2242; https://doi.org/10.3390/electronics12102242
Submission received: 25 April 2023 / Revised: 11 May 2023 / Accepted: 12 May 2023 / Published: 15 May 2023

Abstract

:
To enhance the precision of fault diagnosis for high-voltage direct-current (HVDC) systems by effectively extracting various types of fault characteristics, a fault diagnosis method based on the long short-term memory network (LSTM) is proposed in this paper. The method relies on a knowledge graph platform and is developed using measured data from four fault types in an HVDC substation located in southwest China. Firstly, a knowledge graph for the HVDC systems is constructed, then the fault waveform data is preprocessed and divided into a training set and a test set. Various optimizers are employed to train and test the LSTM. The proposed strategy’s accuracy is calculated and compared with recurrent neural network (RNN), eXtreme Gradient Boosting (XGBoost), support vector machine (SVM), Naive Bayes classifier, probabilistic neural networks (PNN), and classification learner (CL), which are commonly used in fault diagnosis. Results indicate that the proposed method achieves an accuracy of over 95%, which is 30% higher than RNN, 8% higher than XGBoost, 4% higher than SVM, 7% higher than Naive Bayes, 40% higher than PNN, and 42% higher than classification learner (CL), respectively; the method also has the minimum time cost, fully demonstrating its superiority and effectiveness compared to other methods.

1. Introduction

With the accentuation of the world’s energy problems and the development of new energy generation, energy transmission methods are being transformed [1,2]. High-voltage direct-current (HVDC) transmission systems in long-distance transmission have numerous advantages; e.g., no inductive resistance, no synchronization, etc., compared to the traditional high-voltage AC transmission method, which is an important guarantee for the construction of long-distance, large-scale, large-capacity grid interconnection and power exchange. The fault diagnosis of HVDC systems is different from the traditional transmission method, so it is momentous to quickly and safely diagnose the fault of HVDC systems. In recent years, many fault diagnosis methods have been developed and applied to HVDC systems. For example, Reference [3] studied the impact of the lightning current peak and grounding resistance on shielding fault flashover in Yunnan to Guizhou 500 kV high-voltage direct current transmission systems. Reference [4] analyzed the mechanism of high short circuit current in the DC near areas caused by converter transformer during single-phase grounding faults. Work [5] focused on studying lightning overvoltage at the neutral point of the HVDC converter transformer to ensure the safe and stable operation of the HVDC system. Additionally, work [6] analyzed the grounding mode of the neutral point of the converter transformer to improve the stability of the 800 kV HVDC system.
With the change of power grid structure, higher requirements are increasingly put on the table for the performance of power grid operation. Along with the popularization of information technology, fault prediction and diagnosis methods based on the Internet of things and artificial intelligence have begun to be applied. Artificial intelligence can learn and adapt to people’s processing experience and realize human-machine collaborative operation, so it can also be solved well in the face of complex and diverse problems. Artificial neural networks have started to be used well in power systems fault diagnosis in recent years due to their efficient processing of noisy data. The literature [7] uses a support vector machine (SVM) that can implement nonlinear classification and regression, which have been applied in some data modeling fields. Currently, the problems in the development of SVM are low accuracy and poor utilization of hidden information of data. Moreover, a convolutional neural network (CNN)-based fault diagnosis method for power grids is presented in the literature [8]. The network is gradually tested by filtering and layer-by-layer incremental stacking construction, and then the network parameters are adjusted using a network layer optimization strategy, and the deep fault features are mined to minimize cross-entropy. In the literature [9], considering the effect of random noise on the measurement results, a collaborative filter is used to filter the output of the HVDC systems, and then virtual faults are introduced according to the state equation of the HVDC to construct a fault tracking estimator. Work [10] applies eXtreme Gradient Boosting (XGBoost) to fault diagnosis in actual HVDC systems, providing a reliable tool for classifying fault data sets in power grids. Study [11] applies classification learner (CL) to the operation and maintenance of intelligent distribution system equipment to improve the intelligence level of detection, significantly improving detection efficiency and the distribution network equipment management level. The effective use of the above-mentioned artificial intelligence methods has ensured the safe operation of the power systems to a certain extent and has been superior to the earlier diagnostic methods [12,13].
In recent years, knowledge graph-based fault diagnosis methods for power systems have been continuously proposed and have had an active effect on the fault diagnosis of power systems [14,15]. With four characteristics of dynamism, spatiality, correlation, and knowledge dependency, the knowledge graph can not only visualize knowledge in the form of directed graphs and obtain the relationships among them through visualization models, but can also complete the accurate search of massive knowledge information in a very short time through the search function of computers and perform statistical analysis on them [16,17]. By combining database technology and data mining methods, the connections and rules between data can be discovered, thus improving the various performances of fault diagnosis. When a large amount of data is accumulated to a certain extent, after analyzing and processing these data people can find effective information of interest from these data [18,19].
The fault knowledge graph of HVDC systems is a normal domain knowledge graph with vivid concepts and relationship models, which can realize the continuous accumulation of power systems knowledge. The key knowledge elements extracted from the fault data collected by various means can be effectively integrated through standardized representation and various relationships, thus continuously expanding the scope of domain knowledge, and also providing basic elements for intelligent application and the visual display of knowledge [20,21]. The literature [22] proposed a knowledge graph-based intelligent fault diagnosis method for substation equipment, which established a fault diagnosis framework consisting of five stages, i.e., fault data governance, domain dictionary construction, knowledge graph construction, distributed vector representation, and fault relationship inference. In the literature [22], a knowledge graph-based knowledge base construction method for power equipment faults is proposed for complex power equipment and its operation and maintenance involving a large amount of data such as equipment information, fault information, real-time monitoring information, and maintenance information.
The distributed word vector representation of natural language words provides a new basis for the application of different artificial intelligence methods in natural language processing. Knowledge graph relational reasoning is effective for knowledge validation, prediction, and inference. This research aims to develop a fault diagnosis technology framework based on small sample machine learning and multi-parameter fusion to address the lack of collection carriers and intelligent means for fault anomaly analysis in HVDC systems.
This paper raises a fault diagnosis strategy for HVDC systems based on the LSTM under the knowledge graph and classifies faults into four categories, i.e., single-phase faults of DC-side transmission lines, phase-to-phase faults of DC-side transmission lines, faults of converter valve arms, and faults of converter valve groups [20]. The advantages of neural networks in data classification applications include high classification accuracy and fast running speed [18,19]. By extracting the fault characteristics of fault waveforms, the LSTM network can be applied to quickly and accurately classify various types of faults and compare them with recurrent neural network (RNN) [20], XGBoost, SVM [23], Naive Bayes [24], probabilistic neural networks (PNN) [25], and classification learner (CL) [26]; this solves the shortcomings of RNN that tend to forget earlier fault information when the fault sequence is too long, and solves the poor performance of SVM in multi-classification situations. Consequently, the test results show that the raised strategy has excellent behavior and high accuracy in the fault diagnosis of HVDC systems.

2. Knowledge Graph of HVDC Systems

The knowledge graph is a kind of abandonment of traditional text-based matching search, which displays structured entity information corresponding to the retrieved content after understanding the user’s search intent. The knowledge graph is a knowledge base with a directed graph structure that allows the representation of natural language in a structured graph for the storage, management, and representation of the knowledge base [27,28].
Knowledge graphs form graph-structured fact databases with nodes and edges between nodes. The nodes refer to entities or concepts in the data source, and the edges represent the relationships between entities or concepts. They work by extracting the semantic and structured data from textual information and expressing the information in the data in the form of an “entity-relationship-entity” knowledge triad. Finally, a web-like knowledge structure is built, which can store knowledge and express semantics more accurately at the same time [29]. This structure has the advantages of easy understanding and presentation.
As shown in Figure 1, the construction of HVDC systems knowledge graphs includes four steps: knowledge extraction, knowledge fusion, knowledge computing, and knowledge application.
Knowledge data mainly includes some power industry standards and specifications, as well as some fault data [30,31]. Knowledge extraction is a process of searching and extracting needed data from massive, disorganized data with different sources in an automated way. Knowledge fusion is to integrate the description information of the same entity or concept from multiple data sources and eliminate the connotation conflict. Knowledge computing is a dynamic process which requires the quality assessment of the integrated new knowledge to add the part that meets the requirements into the knowledge base, conduct knowledge reasoning, expand the existing knowledge, and obtain new knowledge. The knowledge graph focuses on the realization of knowledge visualization based on data visualization, so that the knowledge in complex data relations can be intuitively represented. In practical application, the concrete form of visualization is often combined with the characteristics of the problem to be solved to carry out the diversified design.
Knowledge application is the main goal of knowledge graph construction. Through knowledge application, fault characteristics can be analyzed quickly and accidents can be located accurately. By combining fault data with the knowledge graph, fault causes can be rapidly discovered and solved, which greatly improves the management, operation, and maintenance level and efficiency.
Combining artificial intelligence techniques with traditional databases can constitute a knowledge graph. It is an intelligent database that allows knowledge to be managed according to a certain structure [32]. By introducing a knowledge graph in HVDC systems, relevant data from fault data information can be mined and useful information can be extracted. It is also possible to aggregate the scattered knowledge, thus improving the ability to analyze data. By developing and constructing industry-leading bottom-up human-machine collaborative DC knowledge systems based on large models and driven by big data, the scale, quality, and construction efficiency of the knowledge graph can be significantly improved compared with the traditional top-down graph construction technology [33,34], as shown in Figure 2.
Here, the DC knowledge source is to accumulate massive DC source data, including systems and standards, operation and maintenance information, engineering information, major technical research information, etc. The DC knowledge base is DC knowledge for business personnel to query, browse and learn, which is produced by fragmented reorganization based on DC knowledge sources and expert experience precipitation. The DC knowledge graph is the DC knowledge for machine understanding and reasoning application, which is produced by the latest bottom-up human-machine collaborative graph construction technology [35].
In HVDC systems, knowledge comes from a wide range of sources. One part is the production data in the operation and maintenance process, and the other part is the technical update to continuously enrich the HVDC knowledge systems. As the knowledge comes from a wide range of sources and in various formats, it is necessary to sort out the knowledge to better explore the application value of knowledge. The construction is to create a graph by collecting and processing relevant knowledge and exploring the relationship between knowledge, which can quickly retrieve relevant information according to keywords and enhance the efficiency of fault diagnosis.
To address the lack of data collection carriers and intelligent means for fault and abnormality analysis in DC transmission systems, and to develop a fault diagnosis method, risk analysis, and decision-making technology for systems, the article uses small sample machine learning and multi-parameter fusion to build a fault diagnosis technology architecture. Figure 3 illustrates the knowledge graph-based framework for fault handling and risk analysis in the Tianshengqiao-Guangzhou system. The high accuracy and security requirements for fault diagnosis in this system are efficiently met with the help of the knowledge graph. The knowledge graph also allows for rapid fault treatment.
The abnormalities are recorded in the Sequence of Events Record (SER) data, which is unstructured document data. The relevant information on the equipment is stored in the resource management library, which is structured data. Meanwhile, each manufacturer has product documentation and alarm descriptions, which are semi-structured data [36,37]. Based on these data, we extract and fuse them to build the knowledge graph and extract the knowledge elements from the data and store them in the pattern layer and data layer of the knowledge base [38]. The knowledge graph model of HVDC systems fault diagnosis is constructed for fault discrimination and analysis. By establishing the knowledge graph, one can directly access the graph information, which can significantly enhance the capability and efficiency of the system in troubleshooting, and improve the stable operation of the system.
The article raises a fault diagnosis strategy based on LSTM under the knowledge graph of DC transmission systems and realizes intelligent fault diagnosis through artificial intelligence technology [39], which provides an important guarantee for stable operation and efficient management of HVDC systems.
The construction of the knowledge graph has greatly promoted the development of the power system [40]. Fault diagnosis is a core purpose of the knowledge graph [41], as shown in Figure 4. By diagnosing various faults and integrating them into the system, future similar faults can be quickly and accurately analyzed, greatly improving the intelligence of power system operation management.

3. Long Short-Term Memory Network

LSTM is a special recurrent neural network structure [42]. LSTM has a memory function and is suitable for modeling sequential data. When the individual sequence used for training is too long, the traditional RNN will easily forget the information from the previous more distant period, which largely limits the application of RNN. Therefore, LSTM corrects the traditional RNN by designing gating units. The structure of LSTM cyclic units is shown in Figure 5.
LSTM solves the problem of long-term dependence, which is common in general recurrent neural networks, by setting forgetting gates, input gates, and output gates to flexibly transfer and express information in a long-term sequence without causing useful information from long ago to be forgotten. The LSTM long-term control structure [42] is shown in Figure 6.
Longer time series of model inputs need to be considered when using the training model for the following reasons:
(1) Due to the high reliability of HVDC systems and few fault samples, previous data should be considered in model training, which is conducive to improving the accuracy of model training;
(2) The HVDC systems record the voltage U and the current I. Failures at different locations of the HVDC systems will affect the voltage U and the current I at subsequent recording locations. To ensure the accuracy of network training, it is necessary to consider the input of a longer time series.
The LSTM proposed in this paper solves the problem of long-term dependence, which is common in general recurrent neural networks, by setting forgetting gates, input gates, and output gates to flexibly transfer and express information in long-time sequences and to not cause useful information from long ago to be forgotten [43]. At the same time, the proposed fault diagnosis method based on the LSTM model does not require feature extraction and screening, which not only reduces the difficulty of using machine learning for fault diagnosis training, but also avoids fault prediction caused by improper feature selection. Therefore, it is very suitable for HVDC systems fault diagnosis.
In this paper, the sigmoid function is used as the activation function of the gating unit, and the inverse hyperbolic tangent function is designed as the activation function of the unit state and output [44].

4. Fault Diagnosis Method of HVDC Systems Based on Long Short-Term Memory Network under Knowledge Graph

LSTM is used to diagnose faults in HVDC systems based on all stored fault data by the China Southern Power Grid. The project in question is the Tianshengqiao (Guangxi Province, China)-Guangzhou (Guangdong Province, China) power transmission project, with a voltage level of ±500 kV, a length of 960 km, and a rated power of 1800 MW. Figure 7 shows the circuit diagram of the HVDC project, while Figure 8 shows the specific electrical diagram of fault points and types in the HVDC system.
Table 1 summarizes fault types corresponding to each point number. The original data set includes waveform data for 15 cycles before and after each fault, totaling 0.5 s. The data preprocessing involves concatenating 11 channel data of each sample for each fault type and stacking them to create a full fault data set. Next, 80% of the data is randomly selected for training and 20% for testing.
In the extraction of the recorded data, 11 representative signal channels are collected, and the specific signal meaning descriptions are shown in Table 2. Note that the sign “n.s.” in Table 2 indicates not specified.
The fault diagnosis strategy of HVDC systems based on LSTM under the knowledge graph is used for fault diagnosis [45,46], and the validation of the presented method is confirmed; the LSTM flow is shown in Figure 9.
The specific implementation process: first, the full failure data set is extracted according to the fault waveform, and then the 11 channels of each fault data sample are concatenated in turn, and stacked according to the number of samples to form a full fault data set. The collected fault data are processed in the format of [datatem, target], where datatem is the collected fault data and target is the various fault type labels corresponding to the fault category to which the fault data in datatem belongs [47].
After preprocessing the data, the sample data are randomly divided into 20% and 80% of the test and training sets. By continuously learning the training set, the model can mine the intrinsic relationship between the systems fault data and the fault categories and thus can predict the type of faults on the test set. For instance, 11 channel data waveforms corresponding to the four types of faults about HVDC systems are shown in Figure 10.

5. Case Studies

All simulation experiments in this paper are run under the Python Constant Source Cloud_GPUSHARE environment on a personal computer configured with a 2.90 GHz Intel (R) Core (TM) i5-9400 CPU, 32.0 GB RAM, and 64-bit Windows 10.

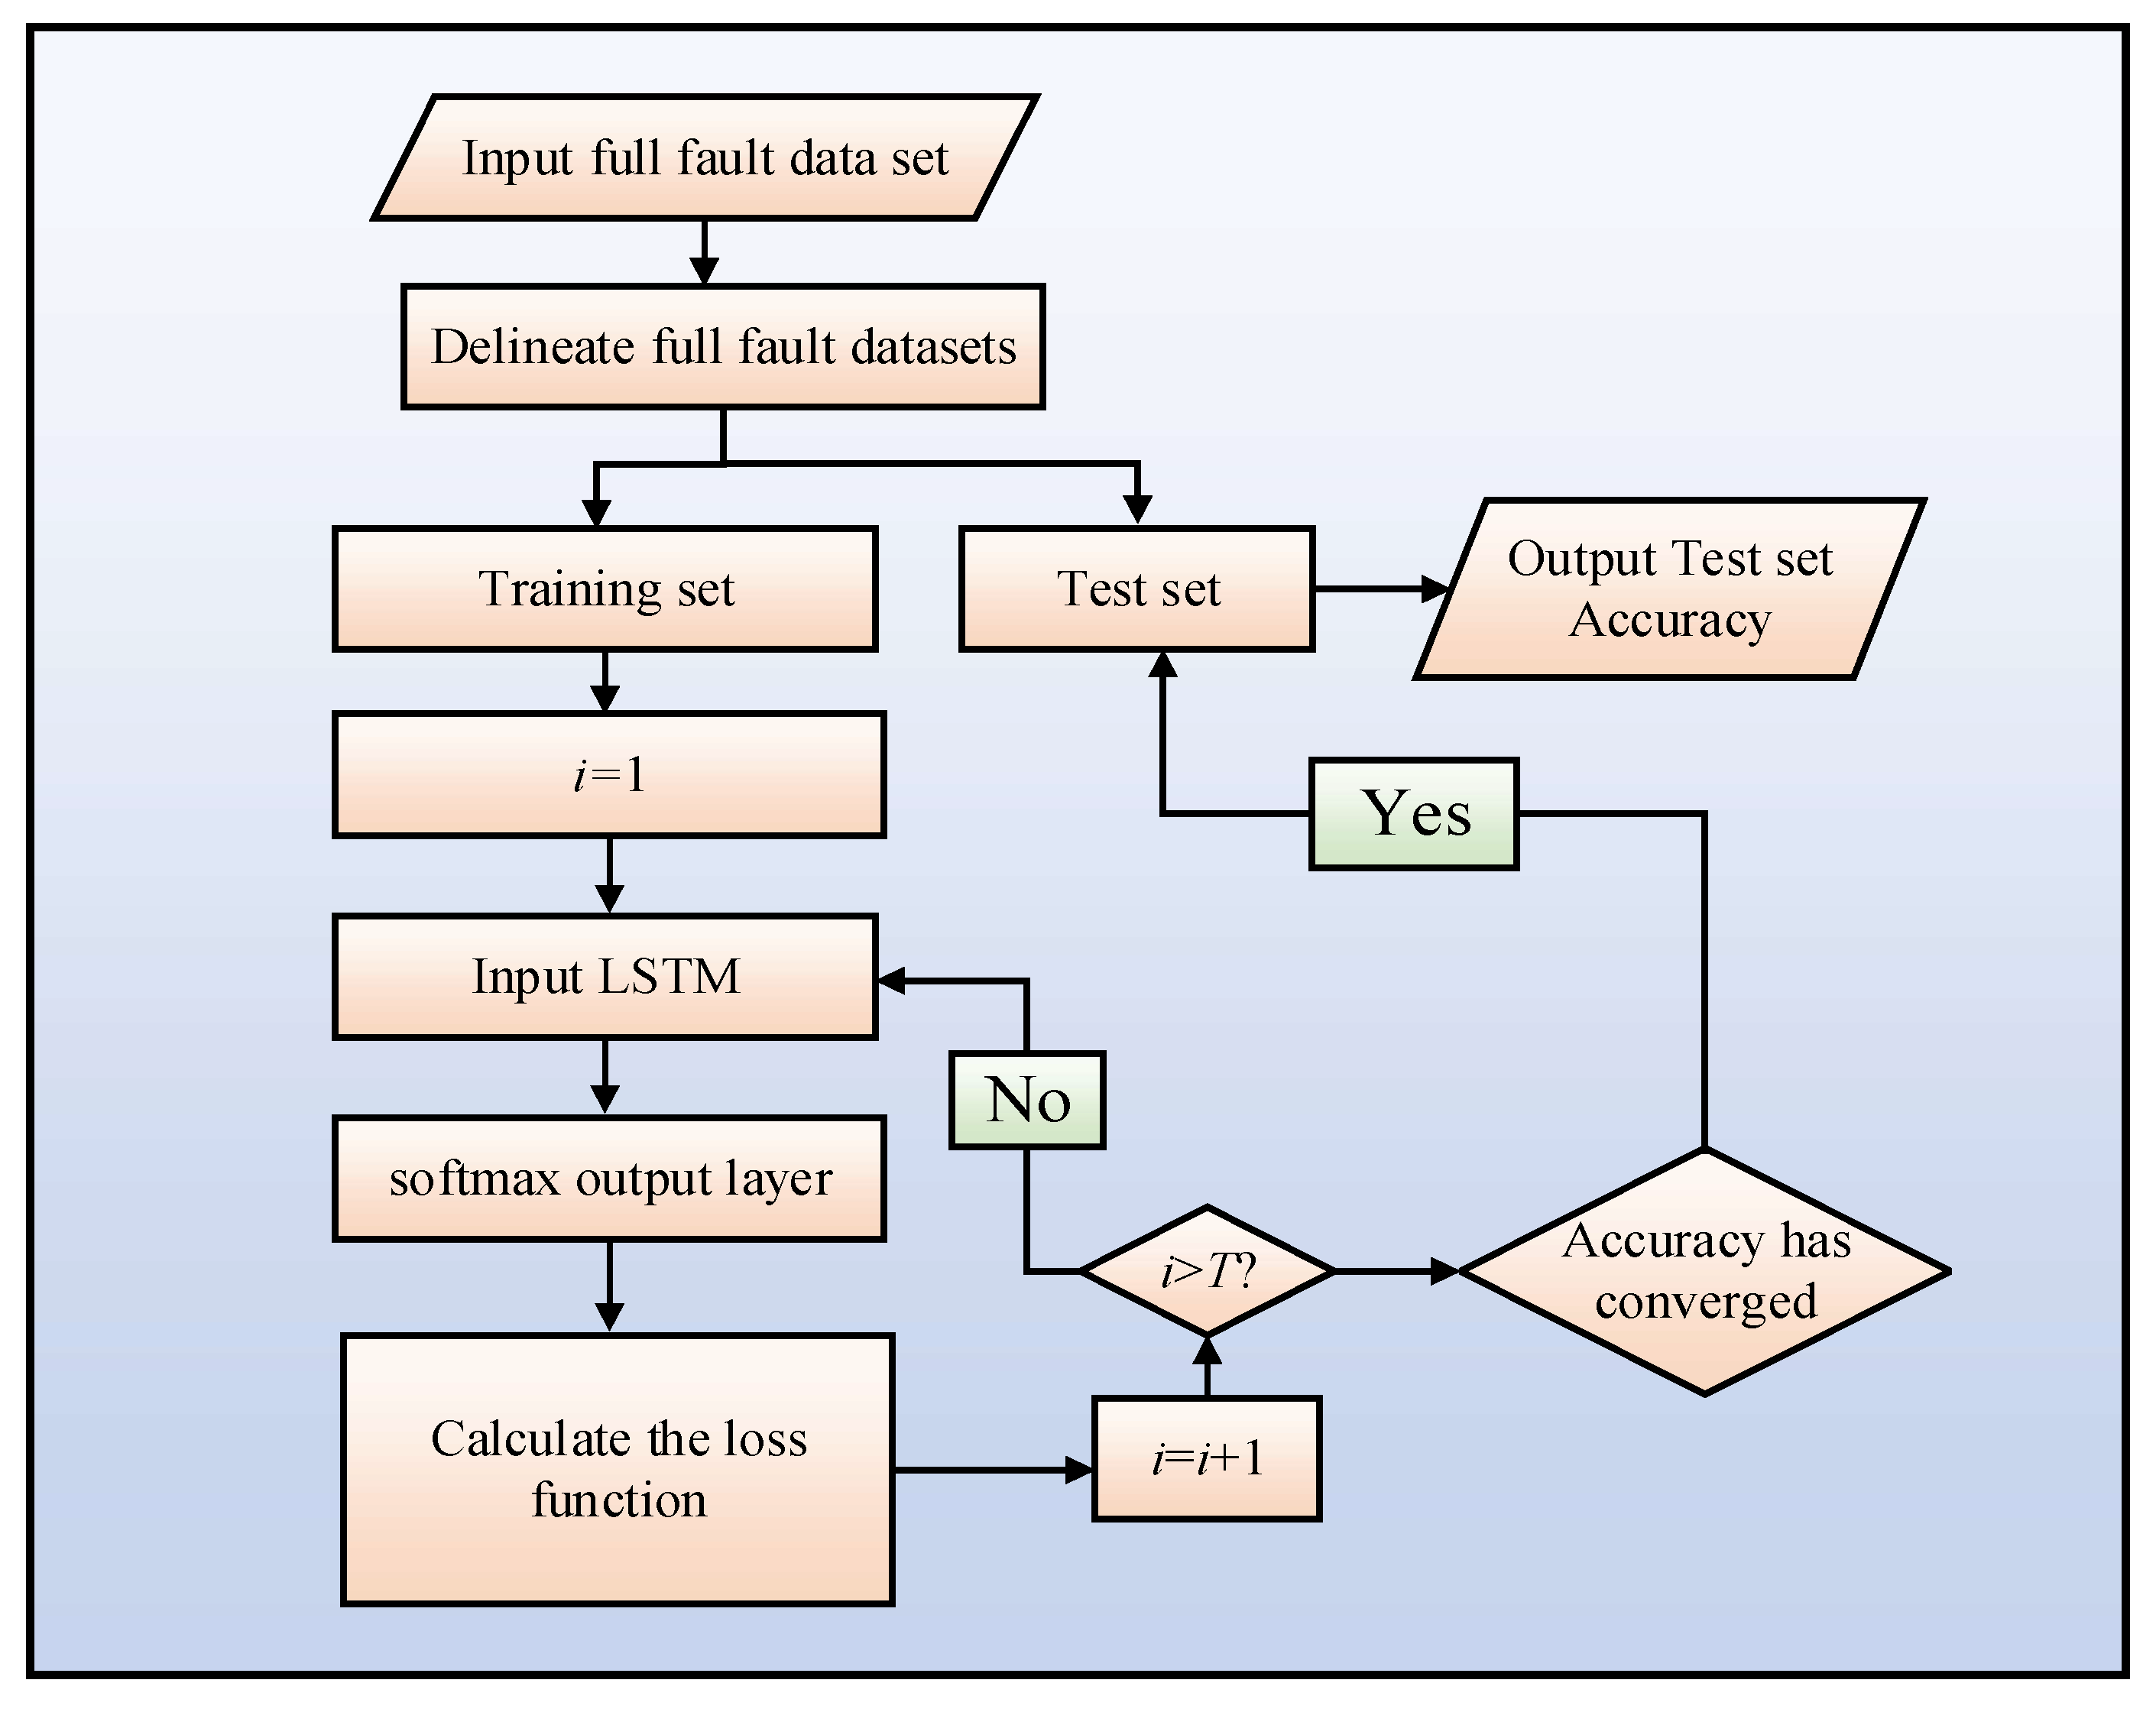
5.1. LSTM Network Parameter Settings

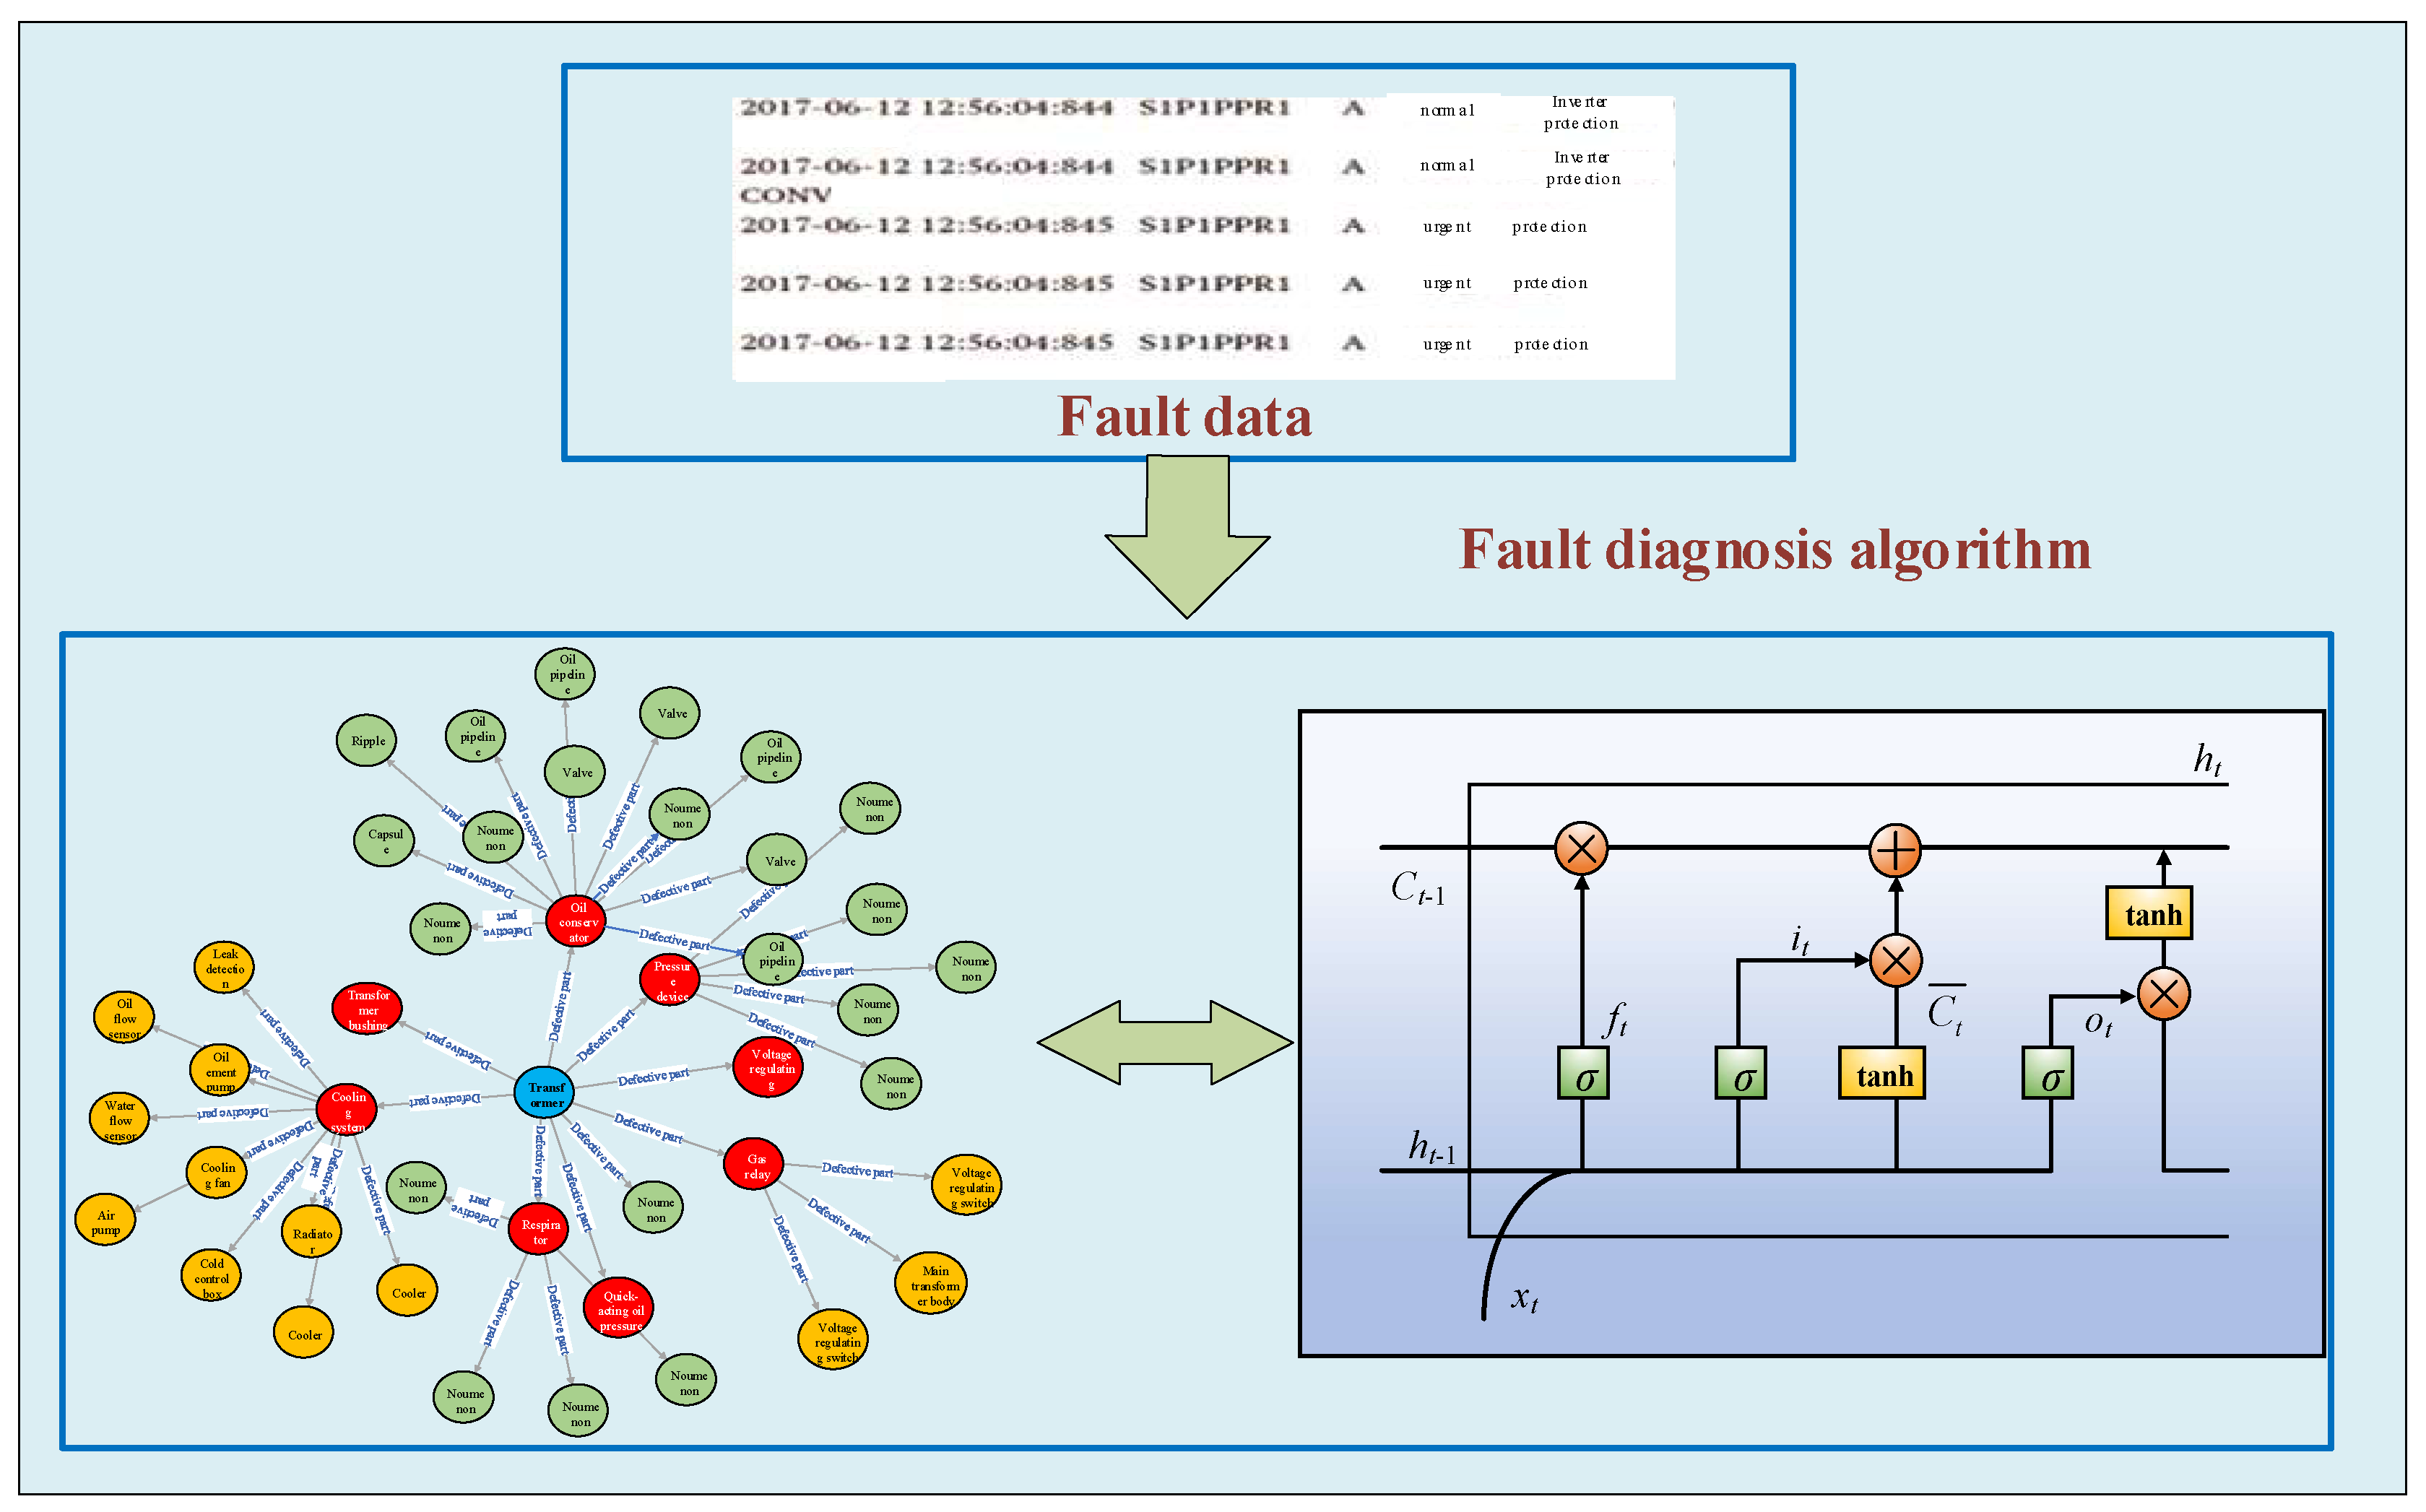
The fault data is substituted into the knowledge graph to analyze and process the fault data. The fault data is then divided into 409 samples with 33,000 dimensions and combined with the probability of previous failures in the knowledge graph database; the data is divided into training data sets and test data sets with the optimal solution; four fault types are extracted according to the knowledge graph; and the output target dimension is set as [1,2,3,
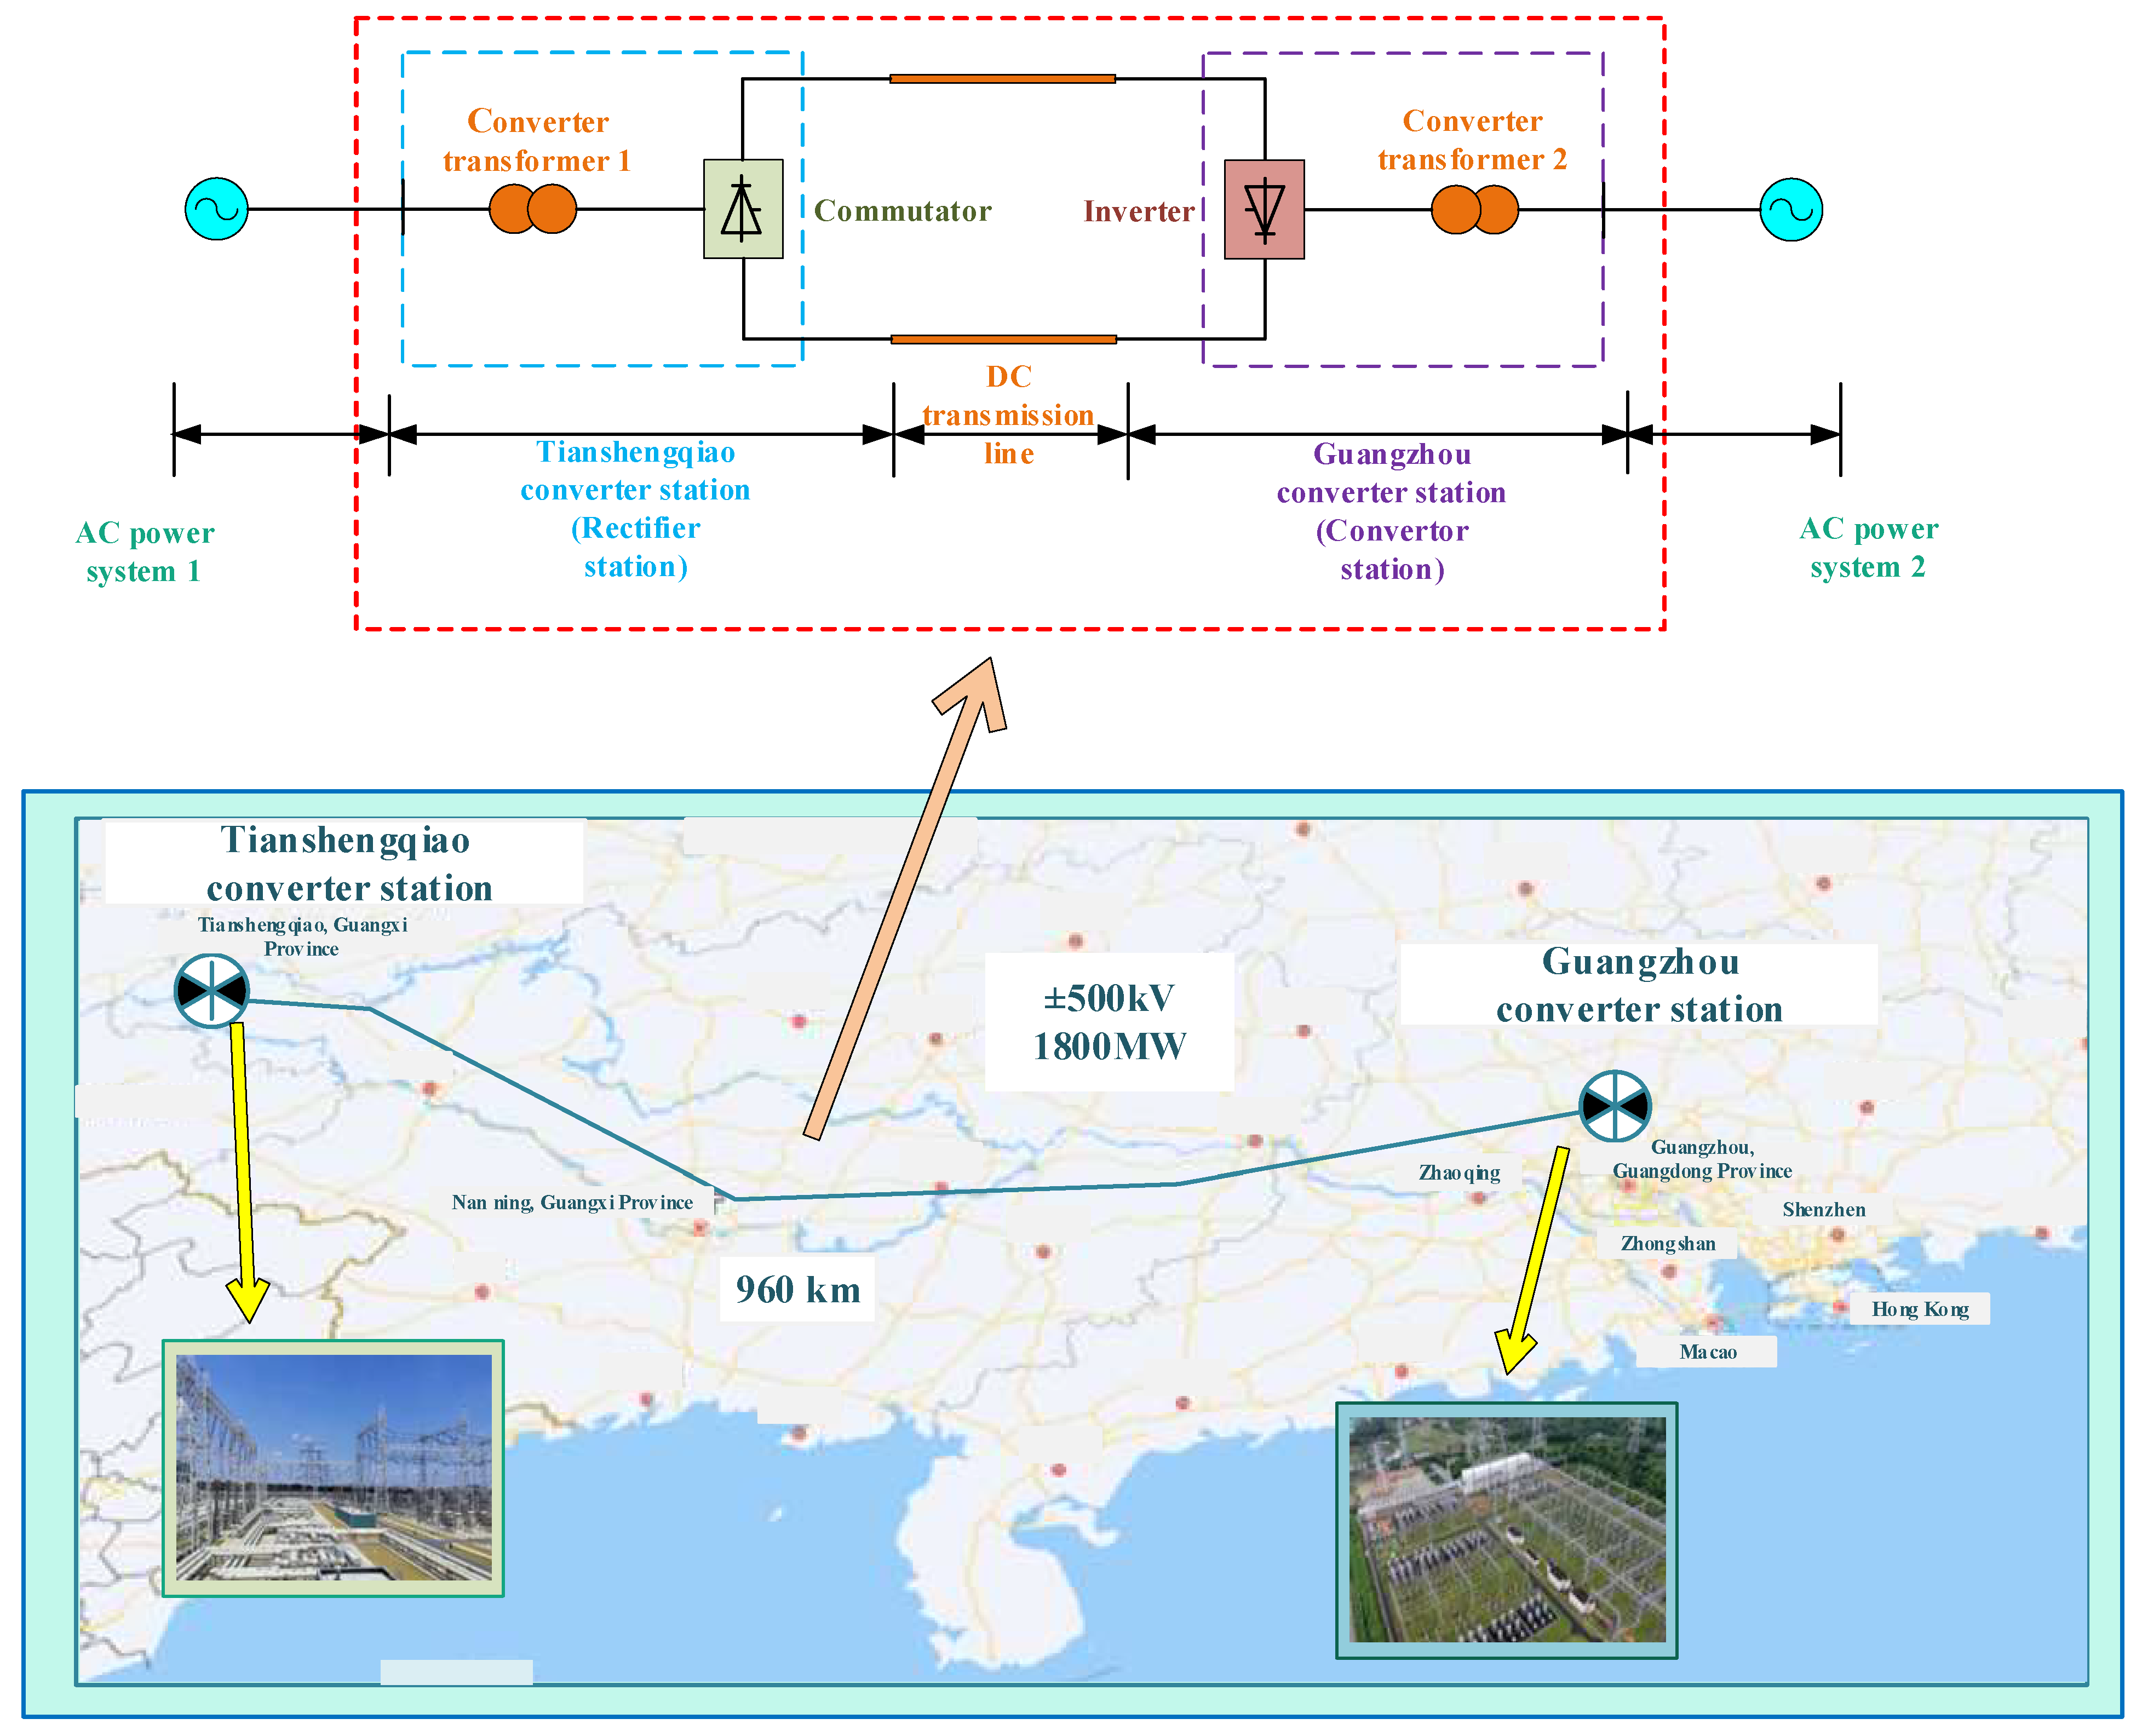
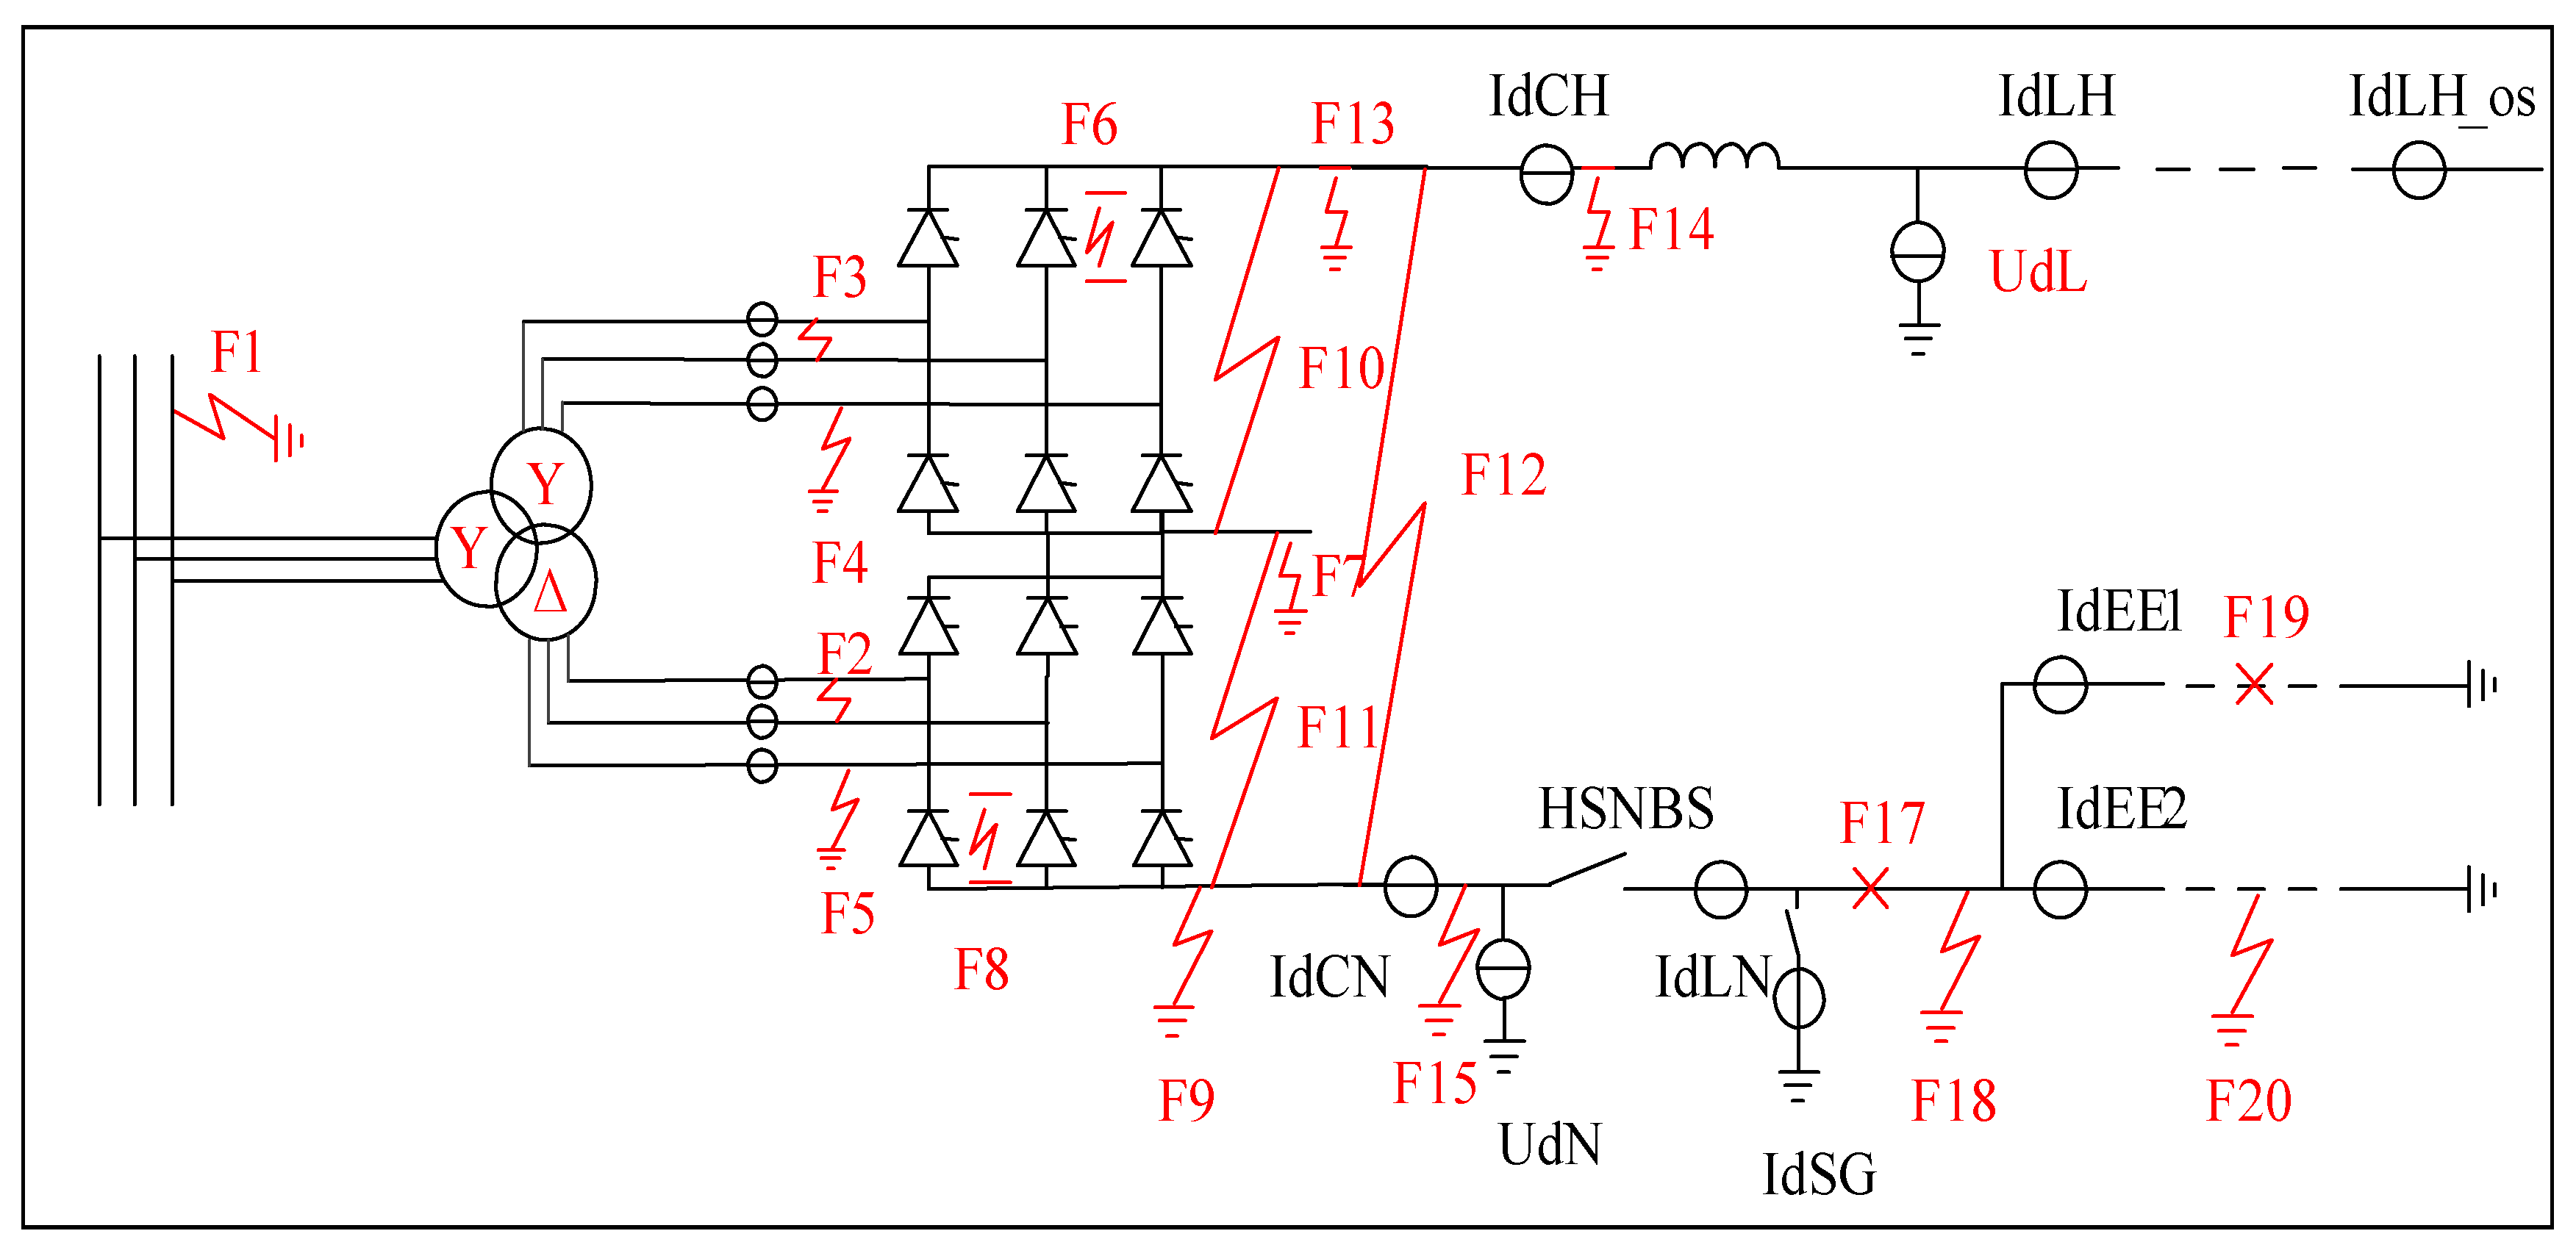
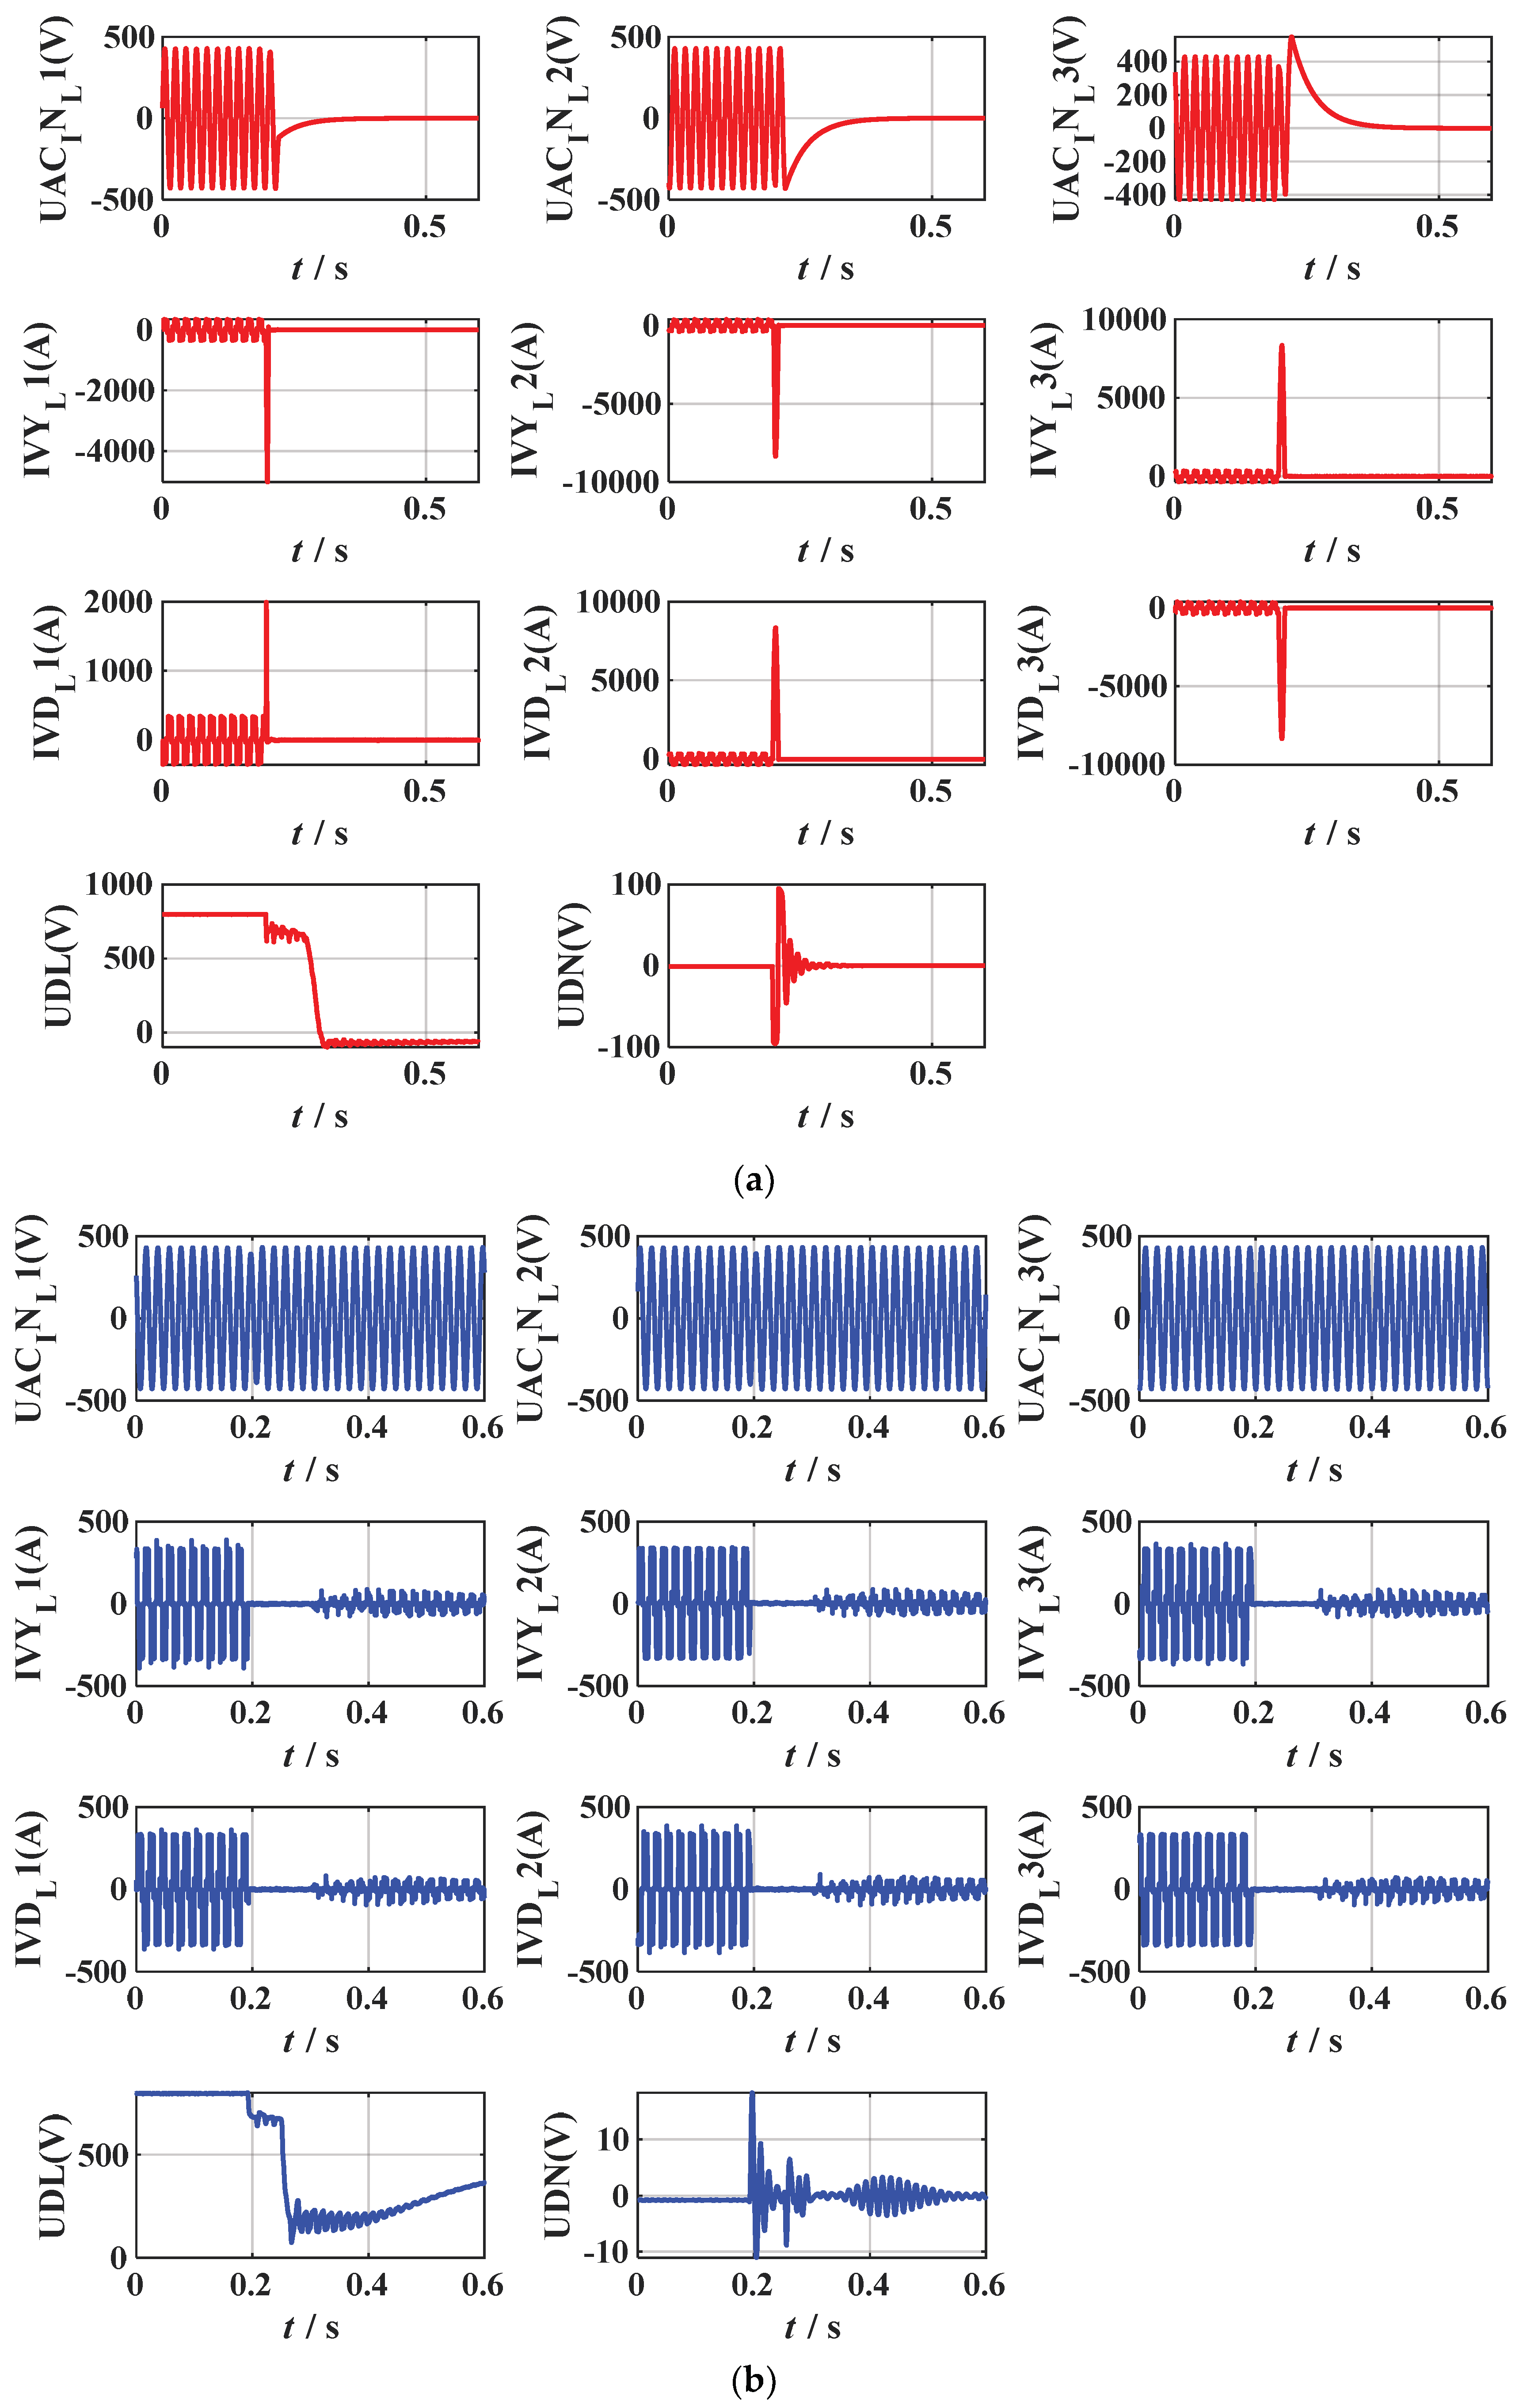
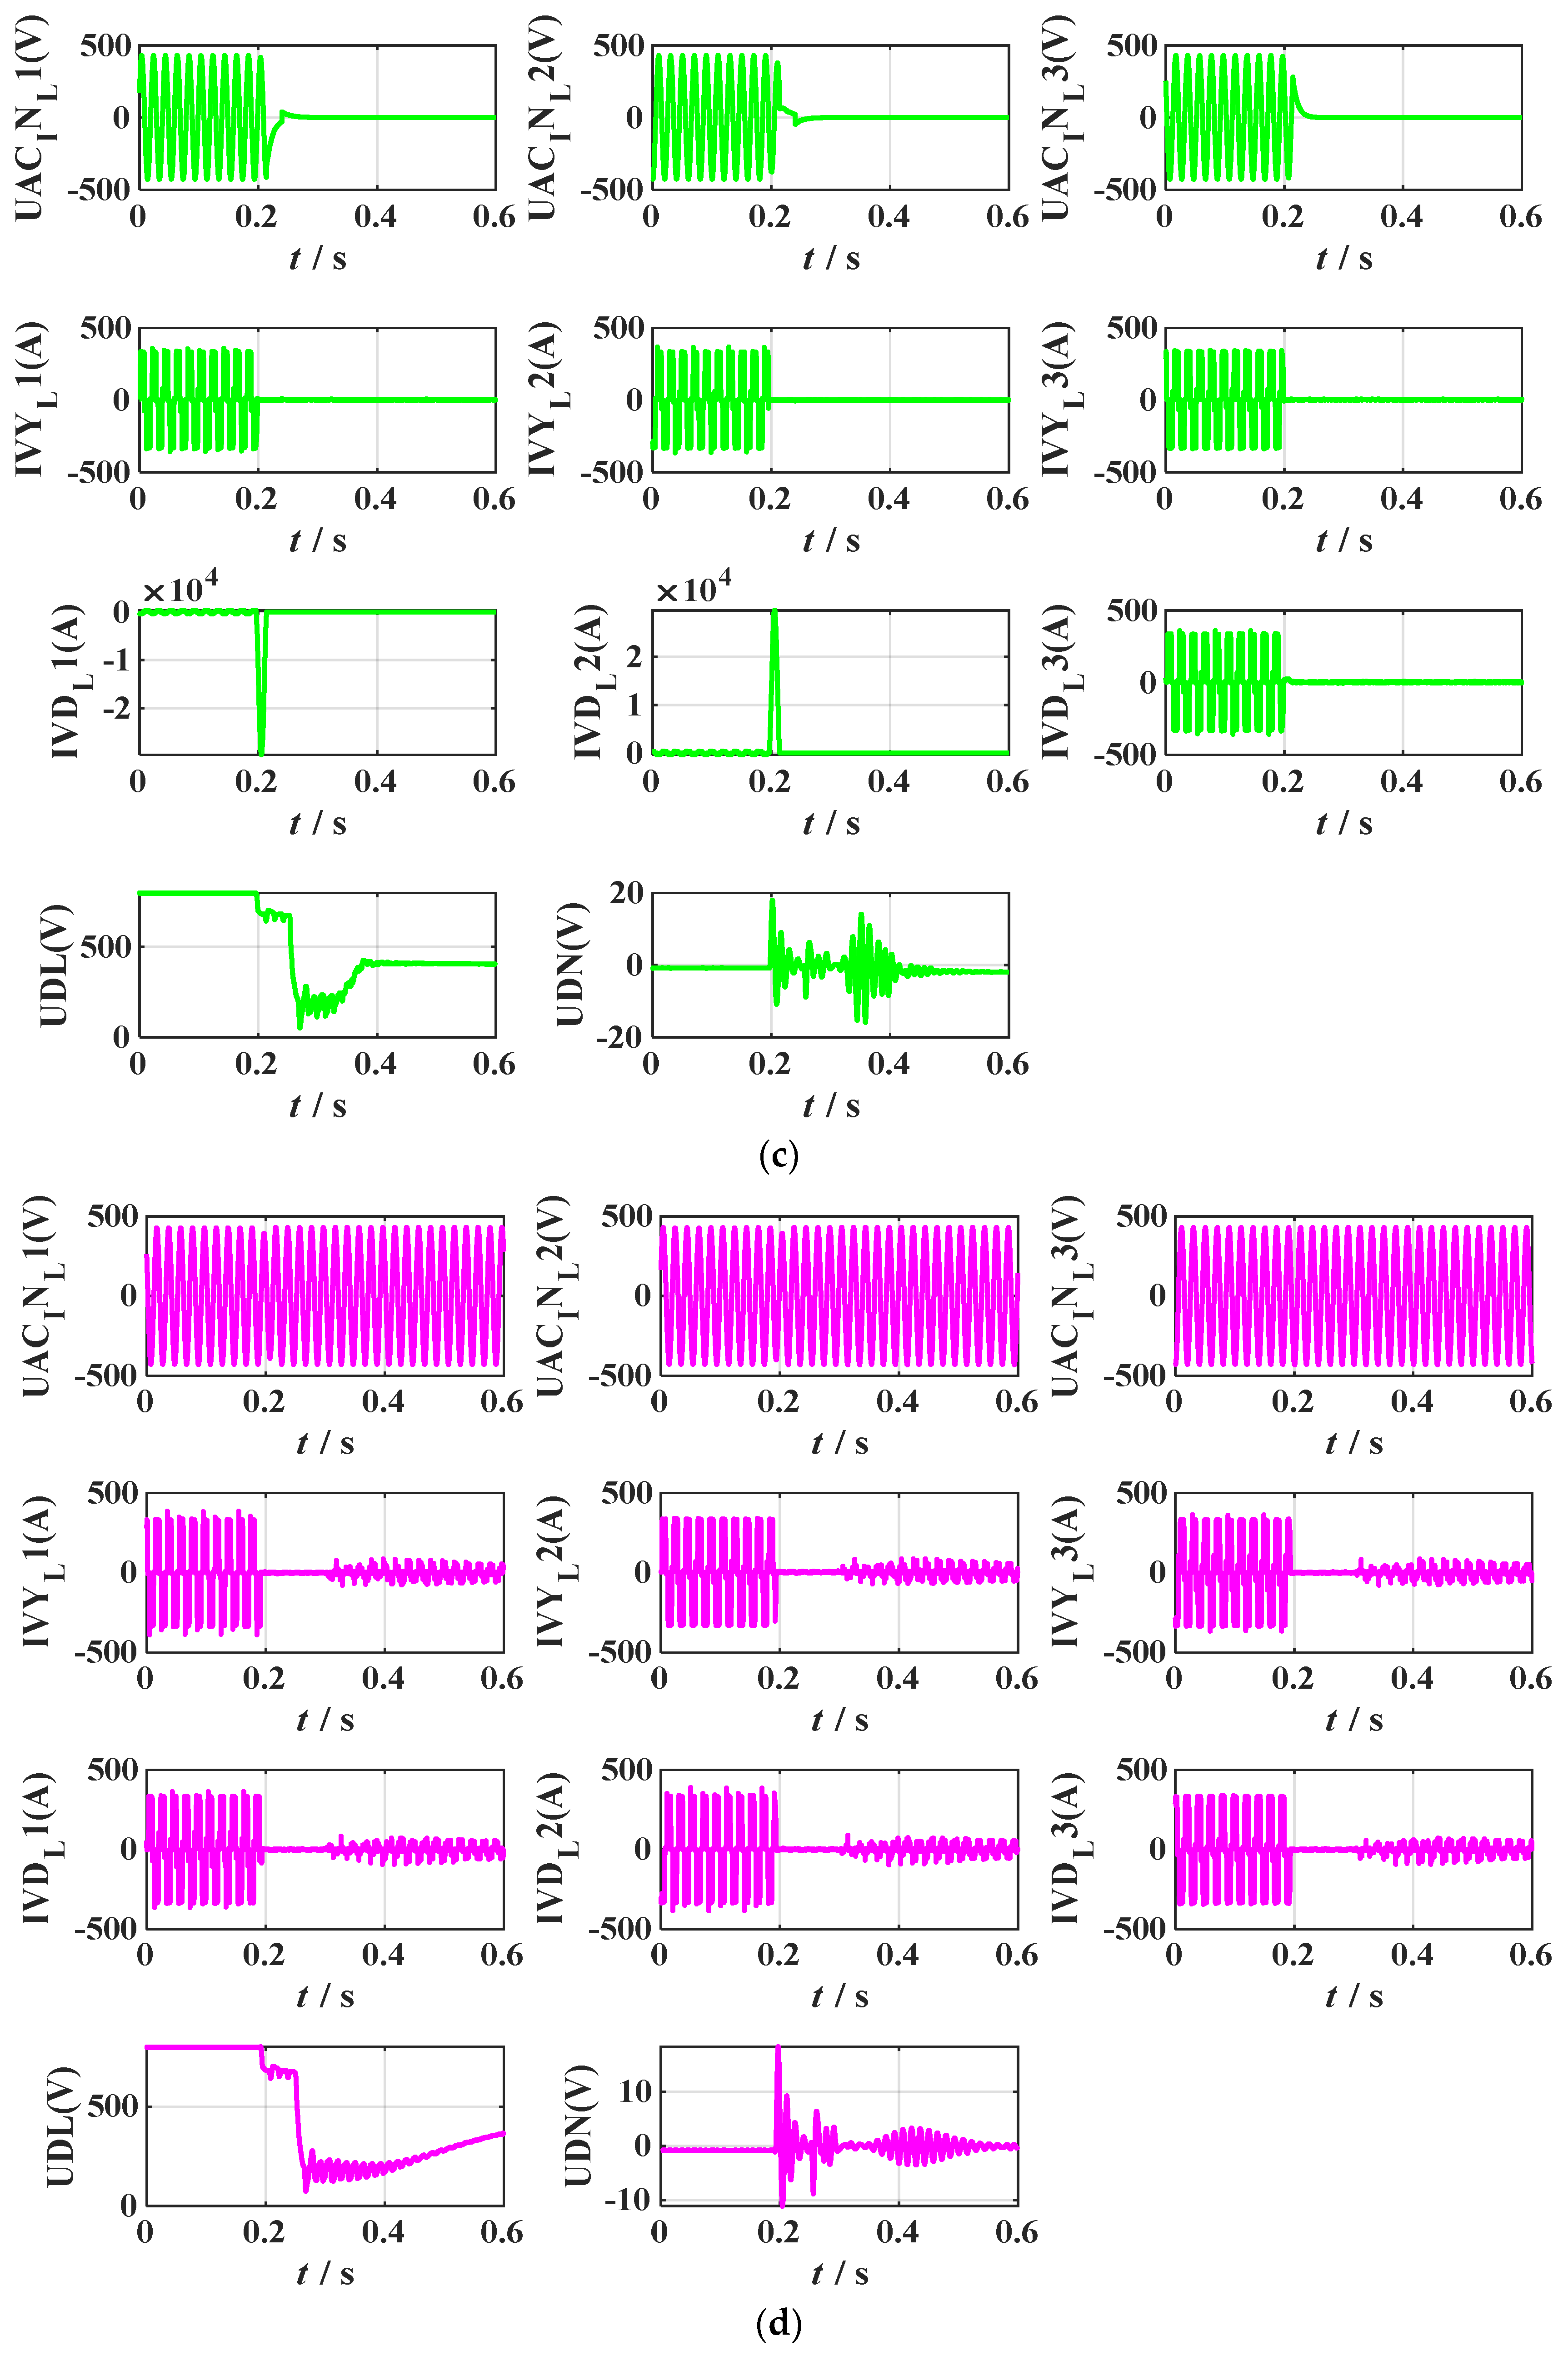
4], where 1, 2, 3, 4 represent single-phase faults of DC-side transmission lines, faults of converter valve arms, faults of converter valve groups, and phase-to-phase faults of DC-side transmission lines, respectively. Among these, the test data set will be used to verify its performance. In addition, 11 channel data waveforms measured from the fault recording device installed along the transmission line of Tianshengqiao-Guangzhou and the converter station (Niucong and Xindong) fault data from 2018–2022, which correspond to four types of faults in HVDC systems, are shown in Figure 11. It can be seen from the graph that the waveform diagrams of the four types of faults are very inconsistent and all have their unique characteristics. The setting of the hidden layer parameters is crucial to the training of the network and will directly determine the final fault classification performance, and overfitting and underfitting may also occur if improperly chosen.
In the training process of the LSTM network, the hyper-parameters that have a significant impact on the fault classification accuracy are learning rate, training times, and optimizer. By adjusting these parameters, the fault prediction accuracy is finally obtained after continuous iterations.
The batch size affects the training speed and model optimization. The variance of the gradient is expressed as:
V a r g = V a r 1 m i = 1 m g x i , y i = 1 m 2 V a r g x 2 , y 2 + g x 2 , y 2 + + g x m , y m
where m is the value set by the batch size.
The increasing batch size can reduce the gradient variance. If the batch size is set as the total number of fault samples, it is equivalent to directly training the entire sample data set. This will lead to a long training time, but the gradient is more accurate, so it is only suitable for small sample training. If the batch size is set too small, the gradient change fluctuates greatly, and the network is not easy to converge.
Since the input LSTM fault data set is relatively large, this paper set batch size = 64 through the trial-and-error method. At the same time, to achieve higher training network accuracy, the epoch is increased appropriately, thus increasing the training time.
There is usually no definite selection method for the setting of LSTM parameters, which can be set by empirical formulas and continuous experiments; the specific parameter settings in this paper are shown in Table 3.

5.2. Performance Comparison of Optimizers on Diagnostic Results

There are many kinds of optimization algorithms for neural networks, mainly based on gradient descent type, such as root mean square prop (RMSprop), adaptive moment estimation (Adam), stochastic gradient descent (SGD), etc.
To improve the accuracy and convergence of the model, various gradient optimization algorithms are employed to optimize the neural network. Specifically, we selected three optimizers, namely RMSprop, Adam, and SGD to optimize the weight coefficients and bias coefficients of the LSTM. Through experimentation, we evaluated the effectiveness of each optimizer in terms of fault diagnosis accuracy, as presented in Table 4.
The best optimizer sought should make the loss function of the LSTM model converge fast and have high classification accuracy. As shown in Table 4, it can be seen that for various optimizers, Adam has a better optimization effect, faster convergence speed, and higher fault diagnosis accuracy, so it is chosen as the optimizer of the LSTM model proposed in this paper.

5.3. Analysis of Diagnostic Results and Comparison of Programs

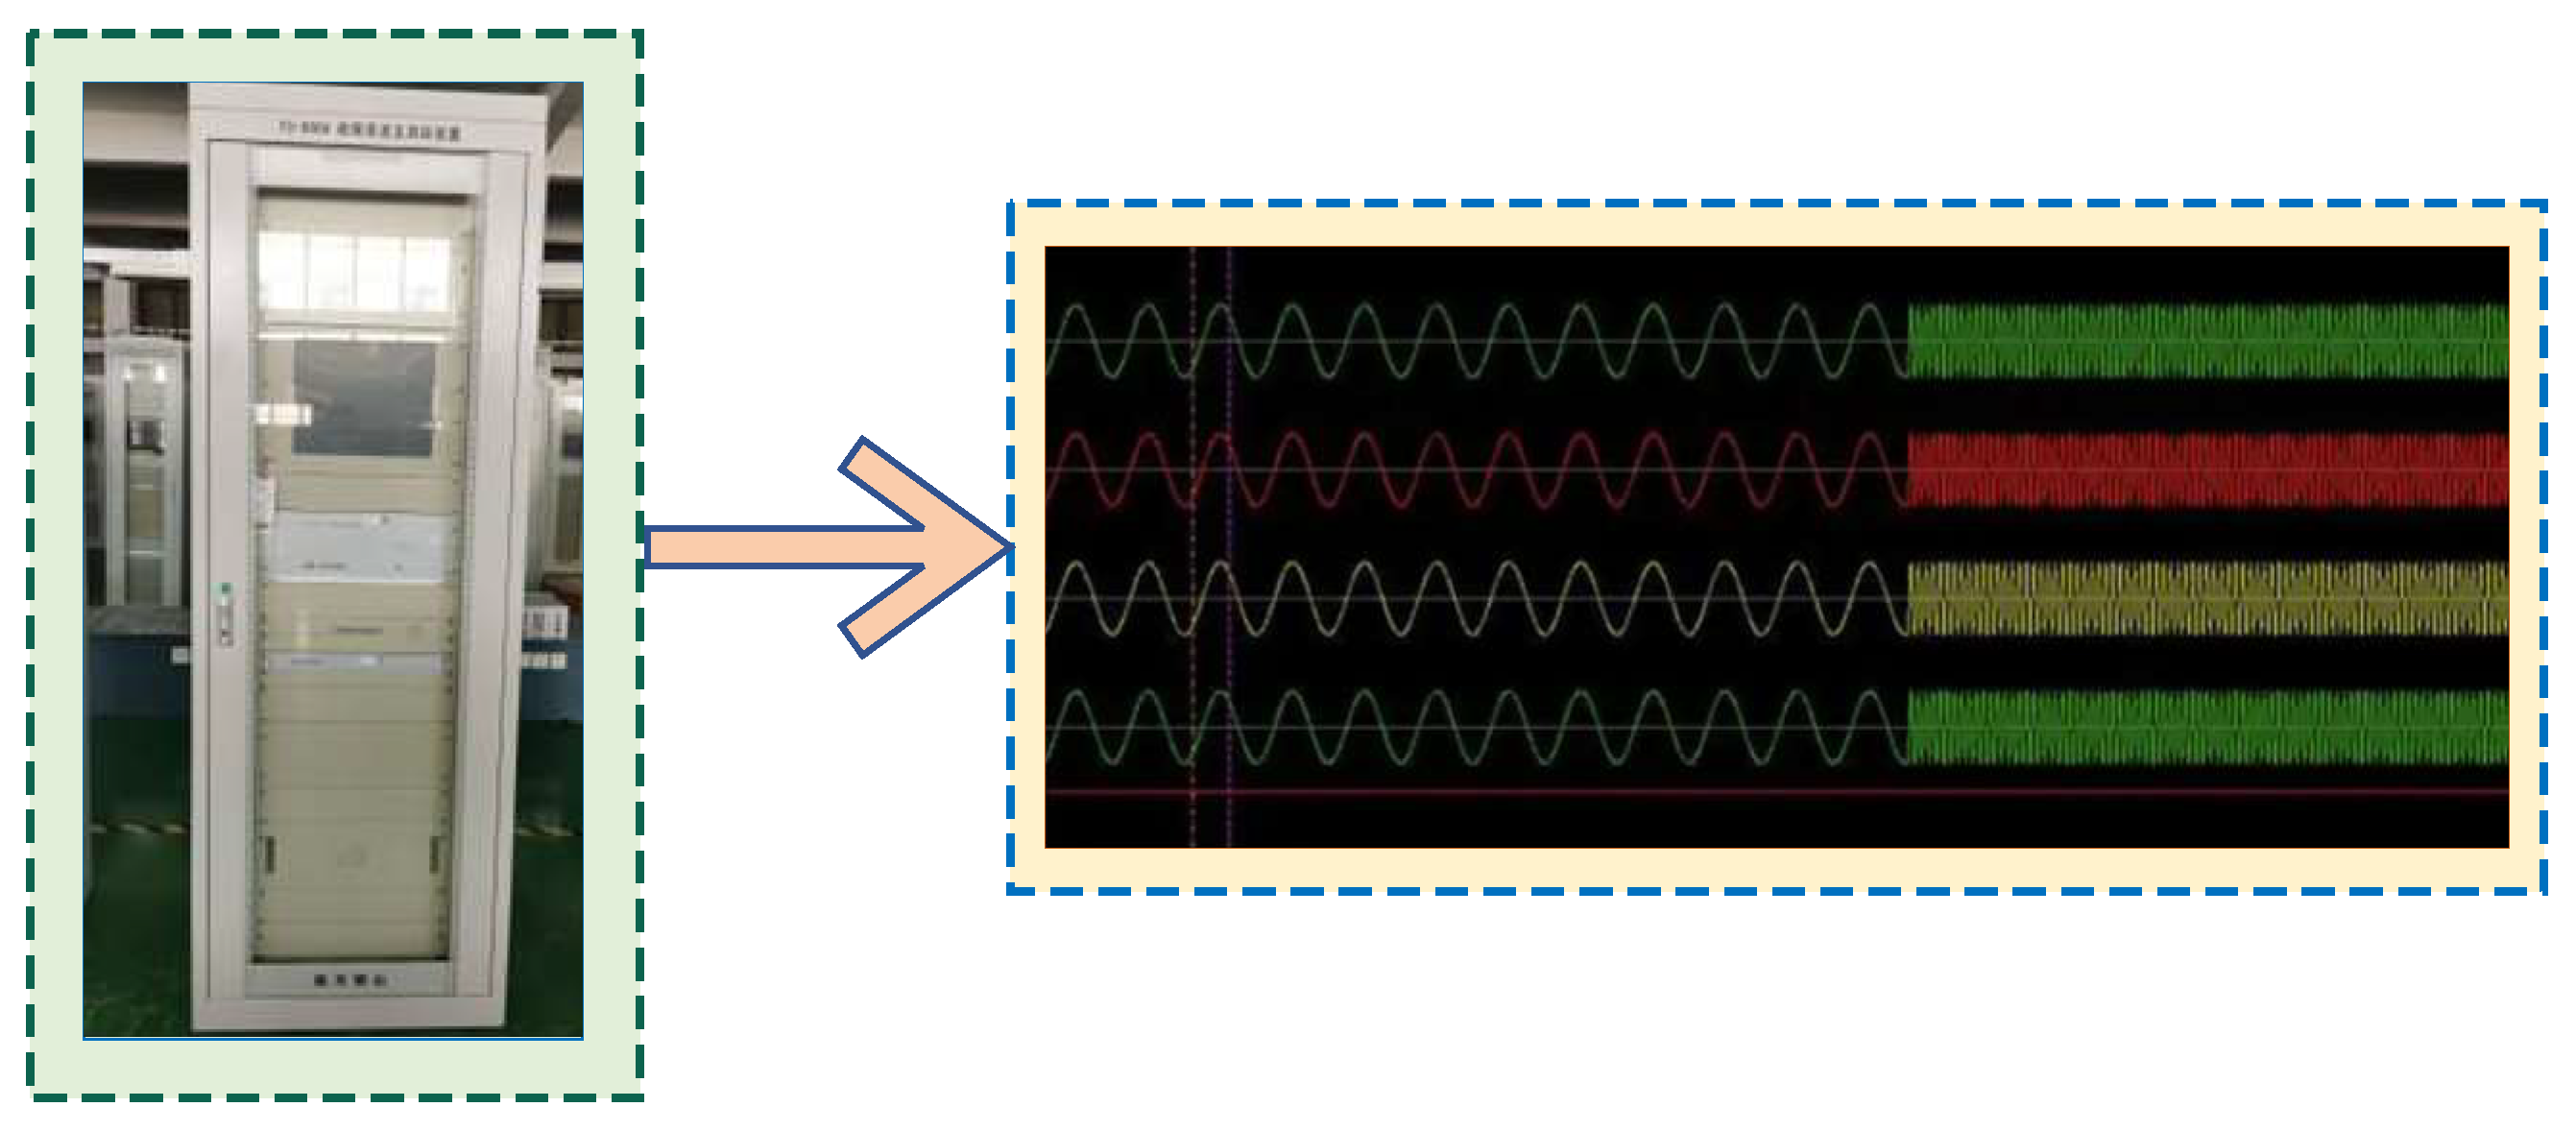
In this section, all stored fault data of the Tianshengqiao-Guangzhou HVDC transmission project is used as the input of LSTM, which contains 409 fault samples. The input fault samples are the voltage and current waveform after the failure, and the length of each fault sample sequence is 33,000.
To prove the efficiency of the fault diagnosis, RNN, XGBoost, SVM, Naive Bayes classifier, PNN, and CL are taken to compare the effect of fault diagnosis, and the parameter settings of RNN, XGBoost [10], SVM, Naive Bayes classifier, PNN, and CL are shown in Table 5, Table 6, Table 7, Table 8 and Table 9.
It is worth noting that the total measured fault data, e.g., from 2018–2022, are all used to better train LSTM and other alternatives (these data are all the stored fault data collected from the Tianshengqiao transmission project of the China Southern Power Grid).
For fault 1, 84 samples were trained and 20 samples were tested. Additionally, the overall training set and test set are summarized in Table 10.
Note that because the fault data set is relatively small, the selection of hyper-parameters in the seven methods used in this study is the optimal result after adjustment using the uniform design method [48].
The RNN, XGBoost, SVM, Naive Bayes, PNN, and CL are trained using the same training data set, and the same test data set is used for accuracy testing after training. The diagnostic accuracies of the seven methods are shown in Table 11. The five evaluating indicators of F1-score, precision score, recall score, AUC score, and test time are shown in Table 12.
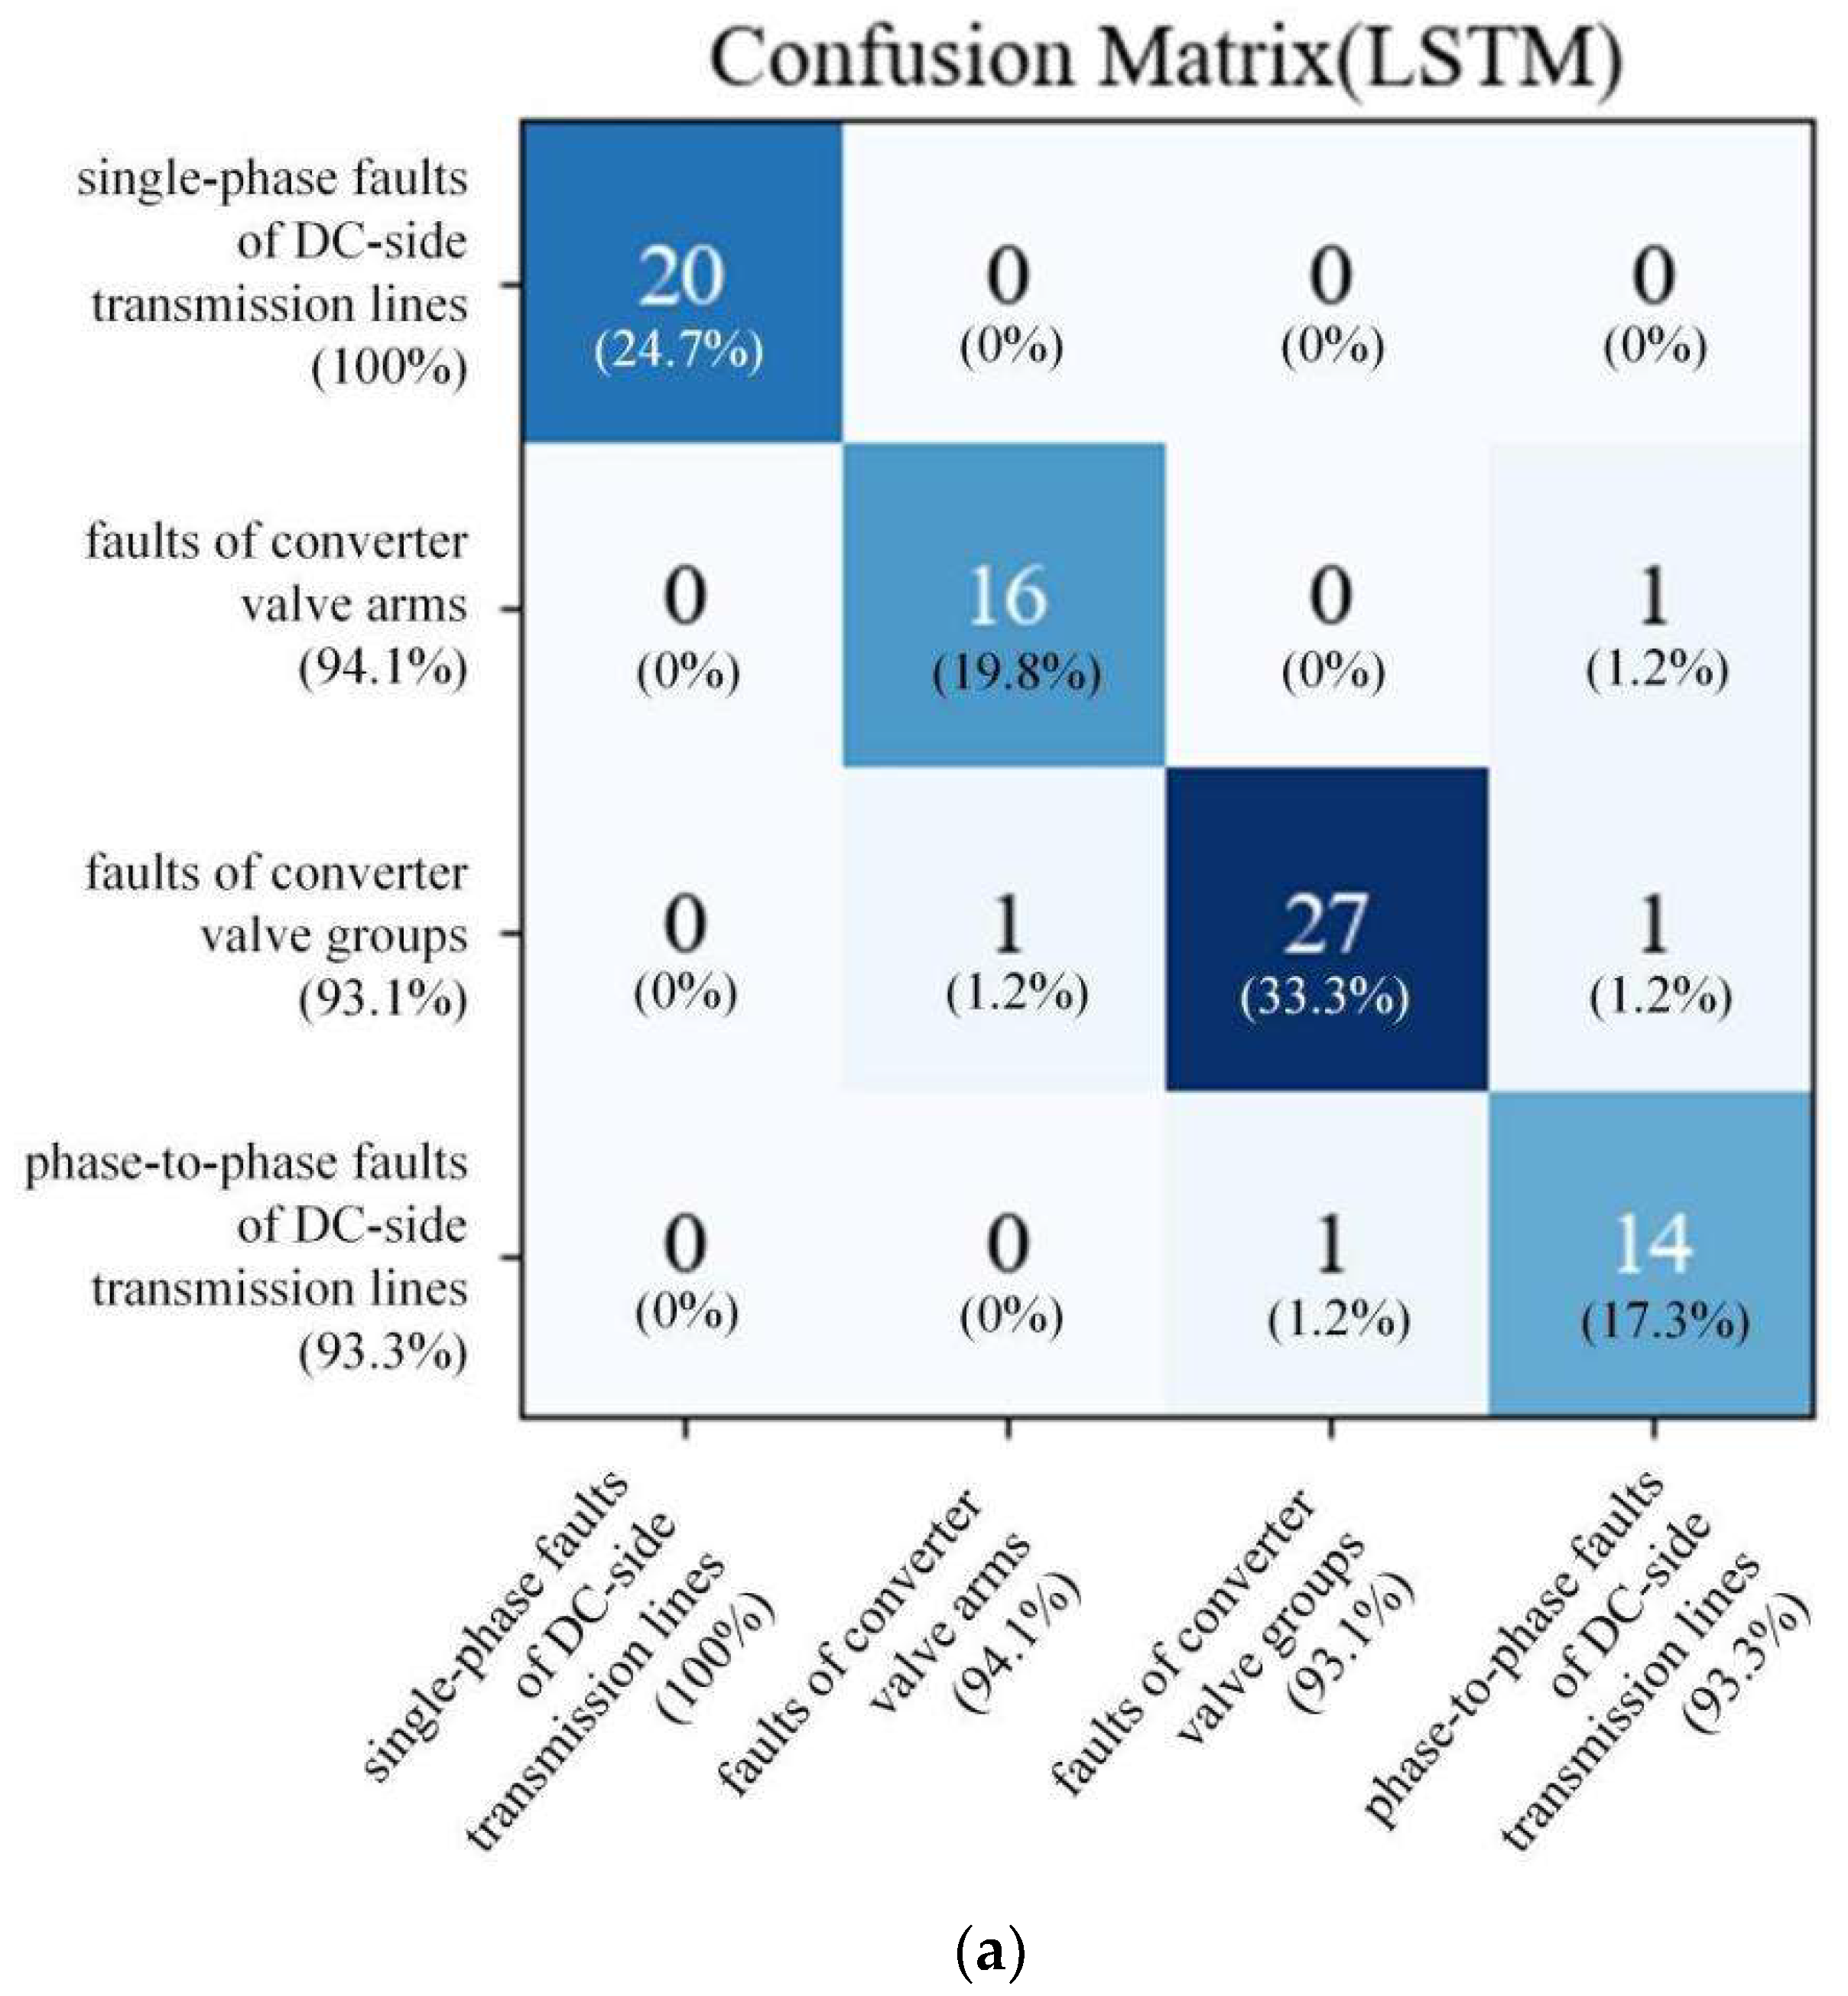
To visualize the fault diagnosis accuracy of the test, the confusion matrix is used for analysis. The fault diagnosis results of the seven methods are shown in Figure 12. Although the seven methods are subject to misdiagnosis, the misdiagnosis rate of the LSTM method is significantly lower than that of the other methods.
It can be observed from Figure 12a that 1 misdiagnosis data appears in faults of converter valve arms, 2 misdiagnosis data appear in faults of converter valve groups, and 1 misdiagnosis data appears in phase-to-phase faults of DC-side transmission lines in the results of the LSTM method. Furthermore, for the results of the RNN method in 
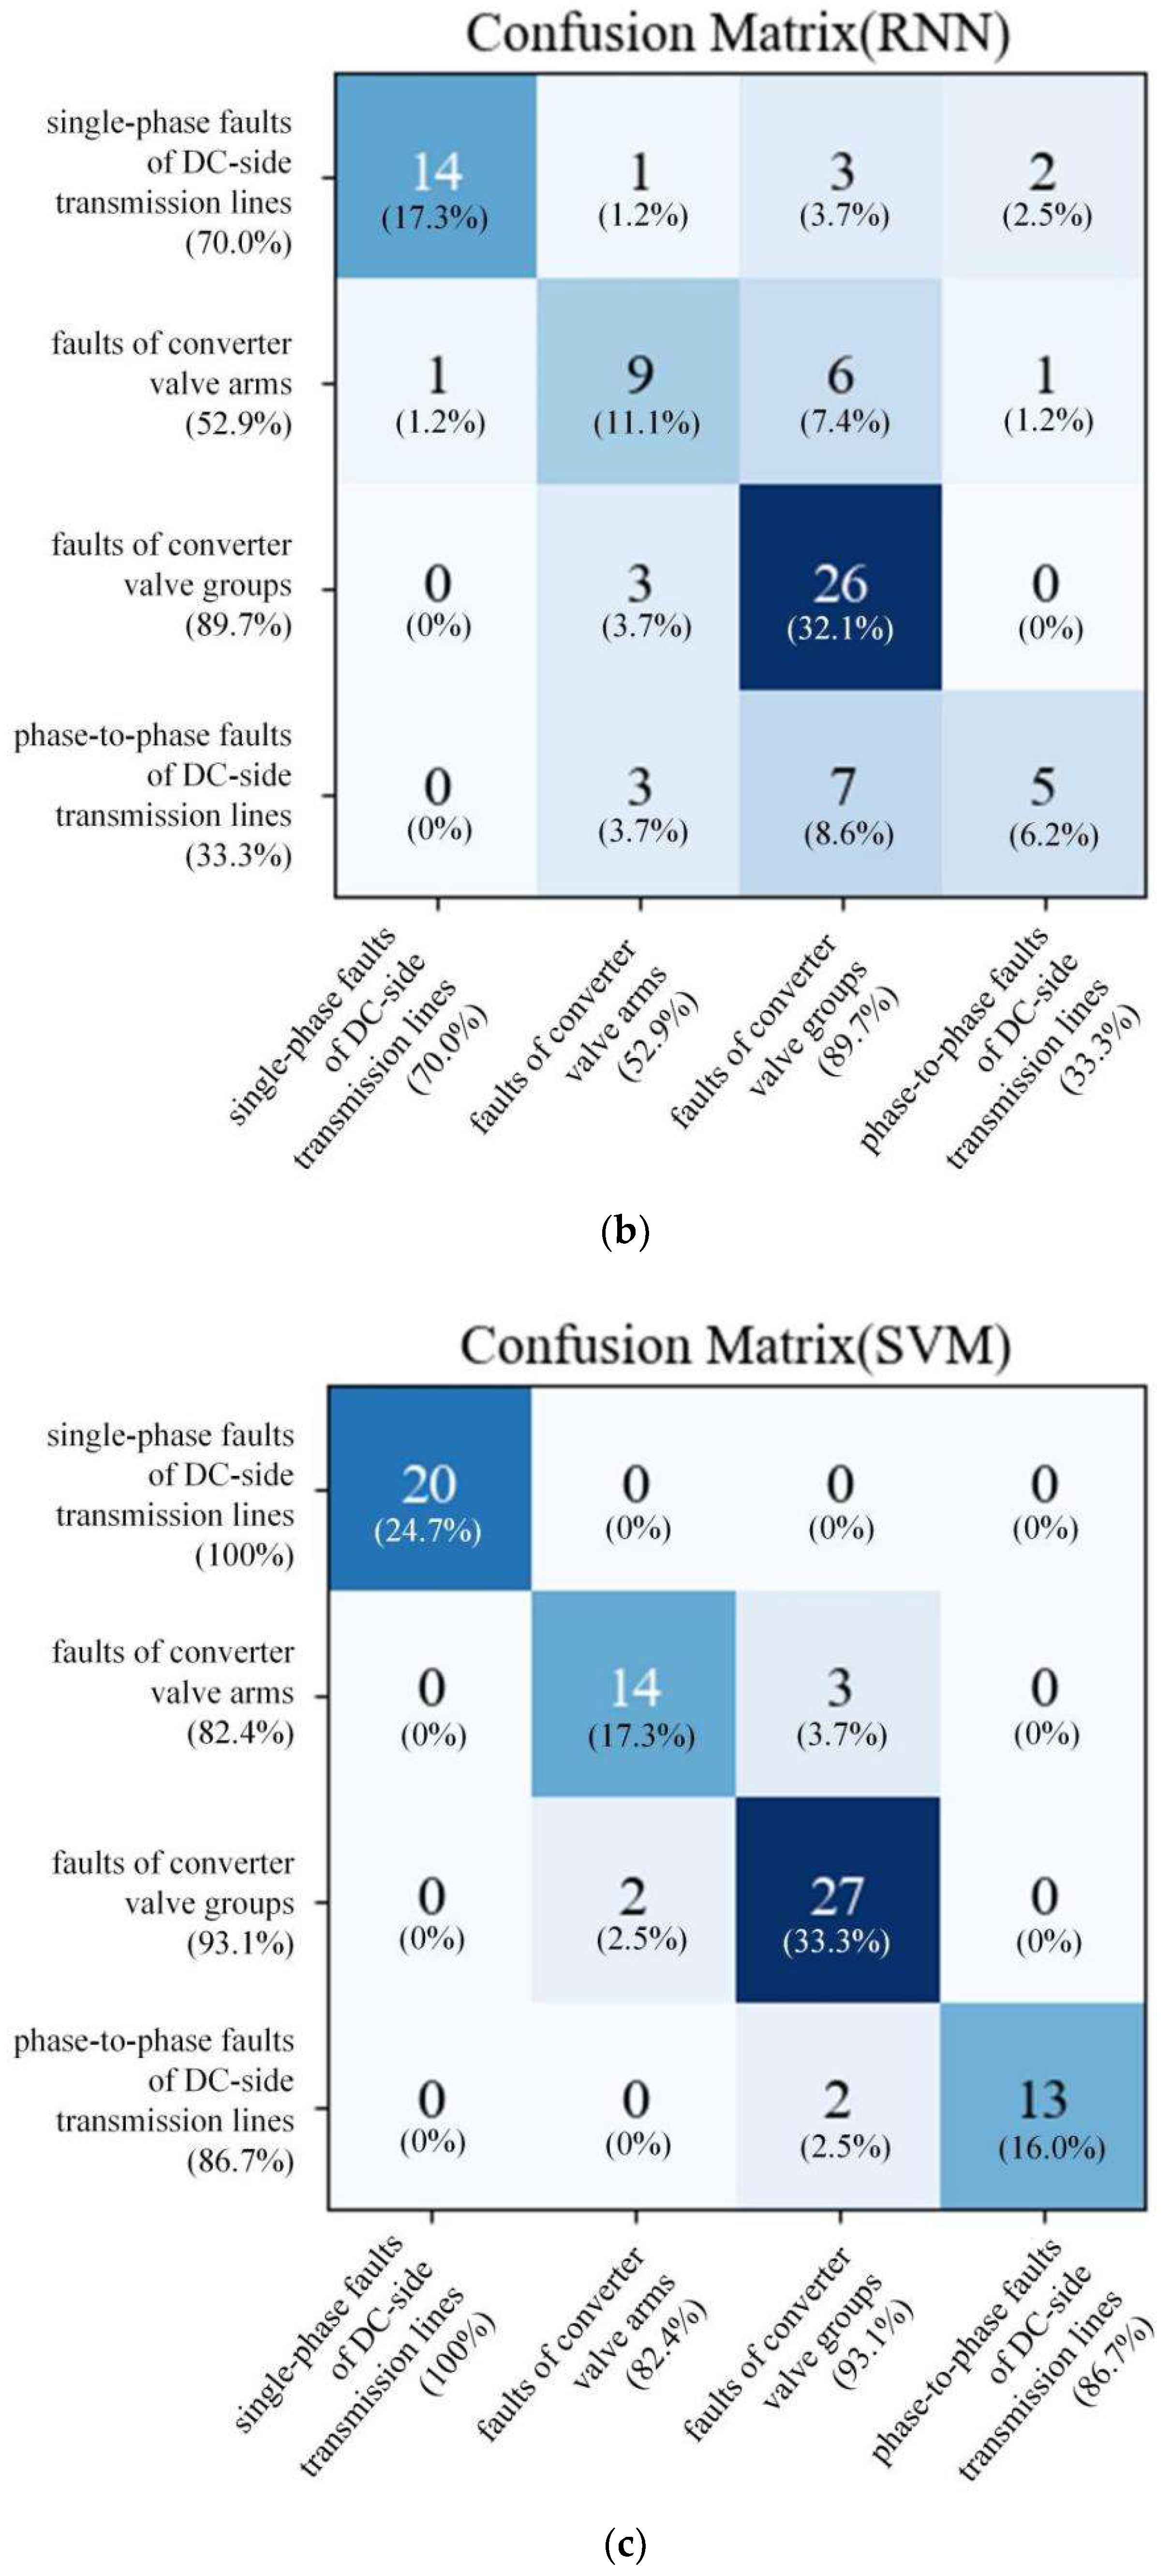
Figure 12b, 6 misdiagnosis data appear in single-phase faults of DC-side transmission lines, 8 misdiagnosis data appear in faults of converter valve arms, 3 misdiagnosis data appear in faults of converter valve groups, and 10 misdiagnosis data appear in phase-to-phase faults of DC-side transmission lines. In addition, from the result of the SVM method in Figure 12c, 3 misdiagnosis data appear in faults of converter valve arms, 2 misdiagnosis data appear in faults of converter valve groups, and 2 misdiagnosis data appear in phase-to-phase faults of DC-side transmission lines. Then it can be observed from 
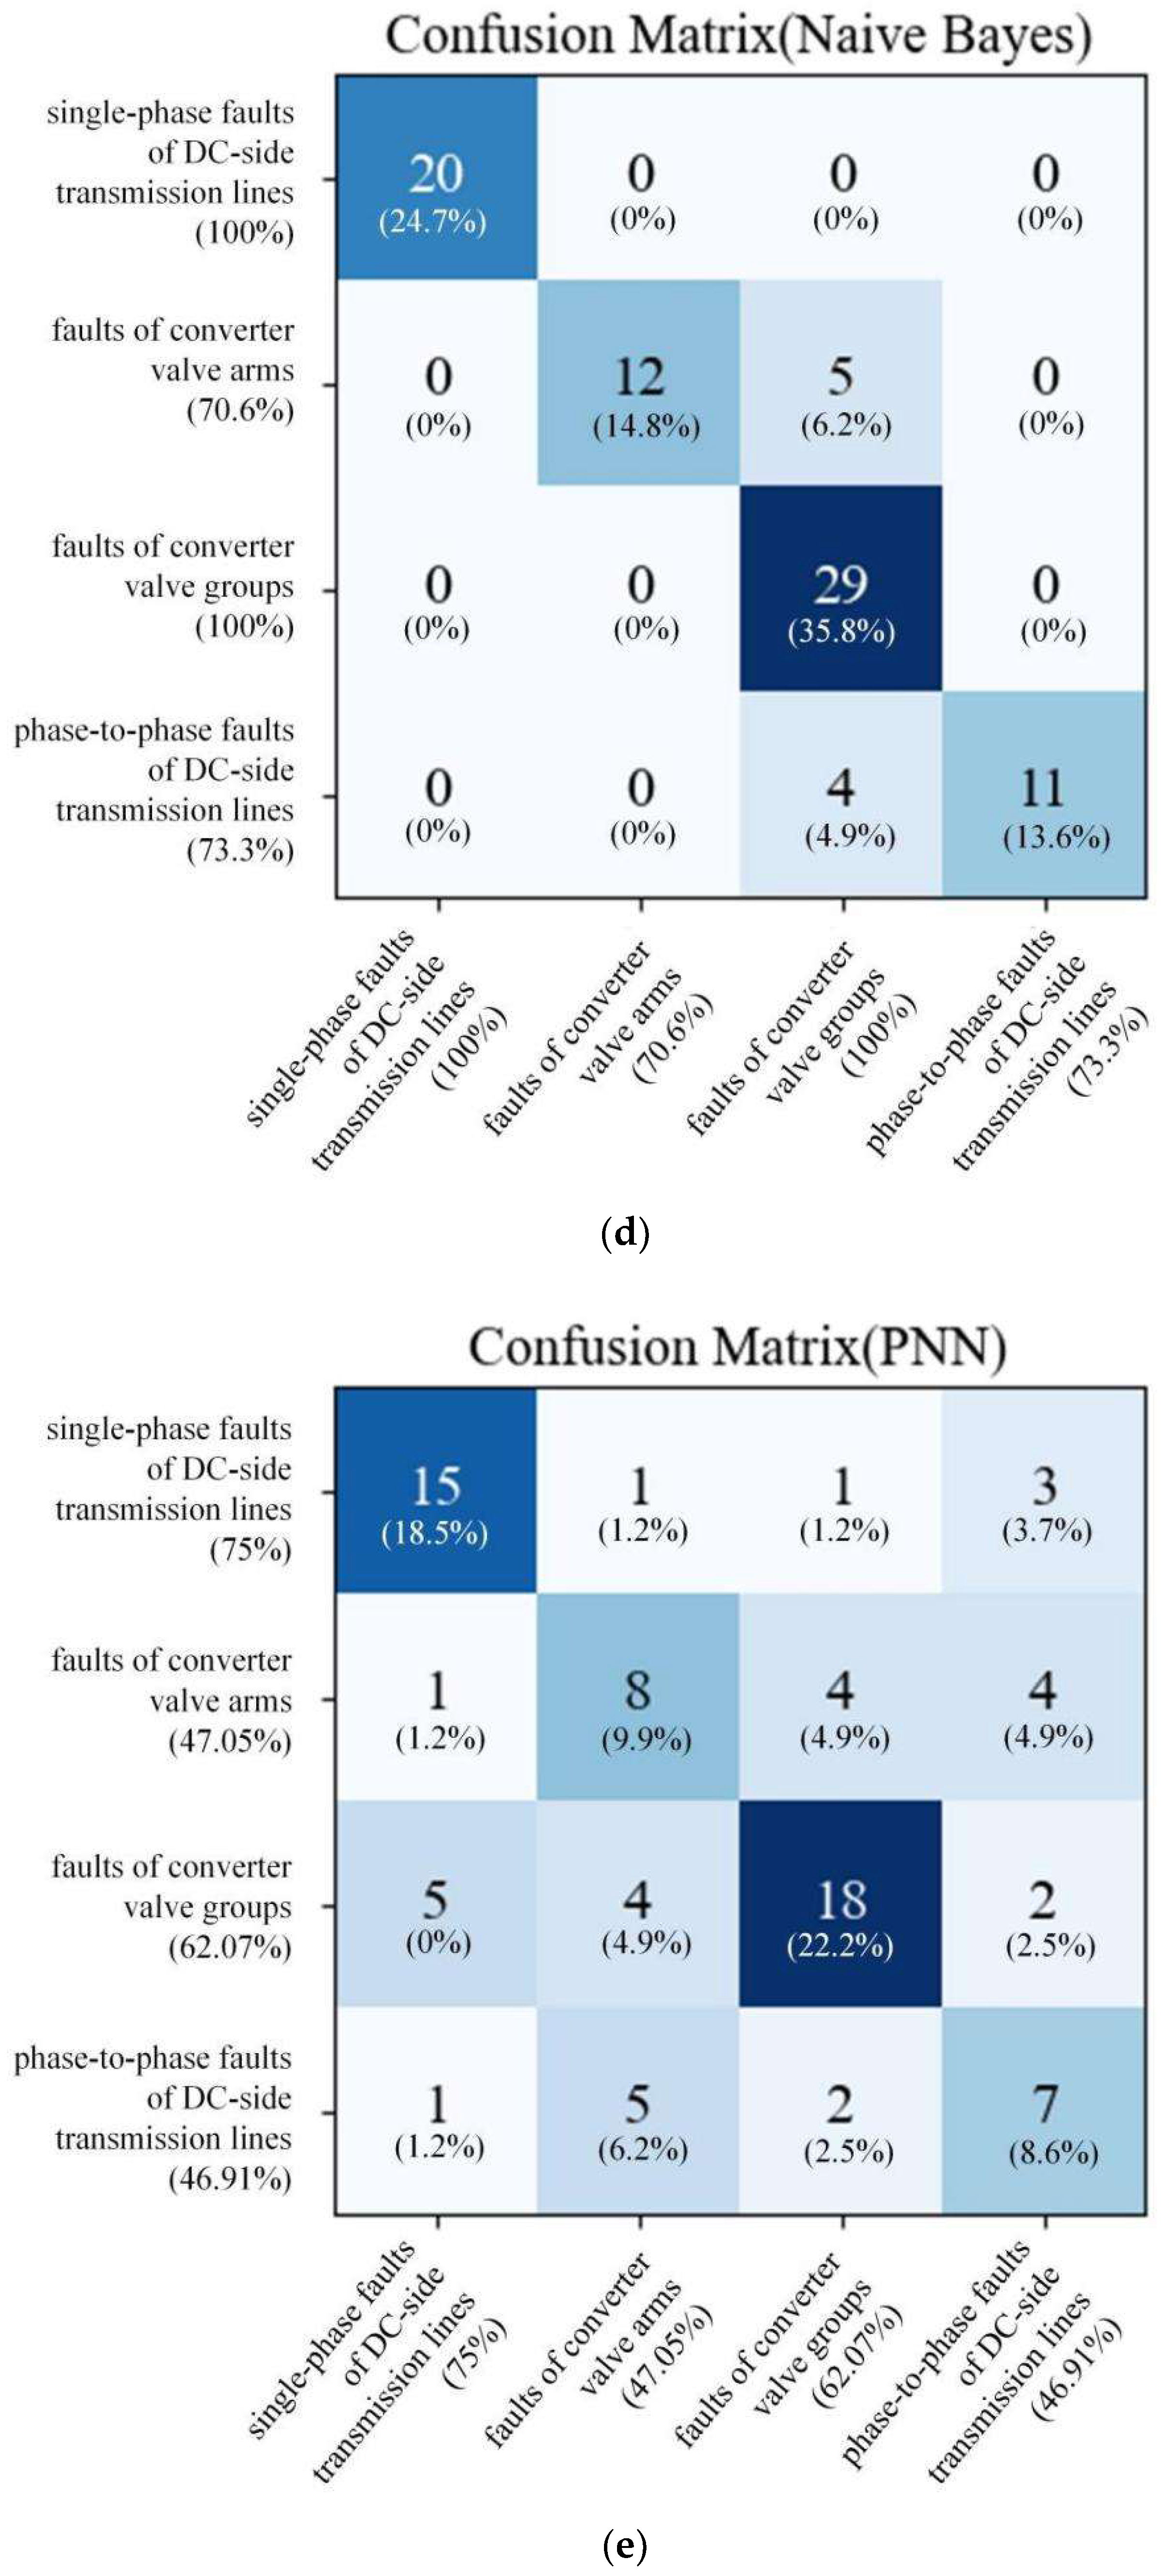
Figure 12d that 0 misdiagnosis data appear in single-phase faults of DC-side transmission lines, 5 misdiagnosis data appear in faults of converter valve arms, 0 misdiagnosis data appear in faults of converter valve groups, and 4 misdiagnosis data appear in phase-to-phase faults of DC-side transmission lines in the Naive Bayes method. After that, from the result of the PNN method in Figure 12e, 5 misdiagnosis data appear in single-phase faults of DC-side transmission lines, 9 misdiagnosis data appear in faults of converter valve arms, 11 misdiagnosis data appear in faults of converter valve groups, and 8 misdiagnosis data appear in phase-to-phase faults of DC-side transmission lines. From the results of the SVM method in 
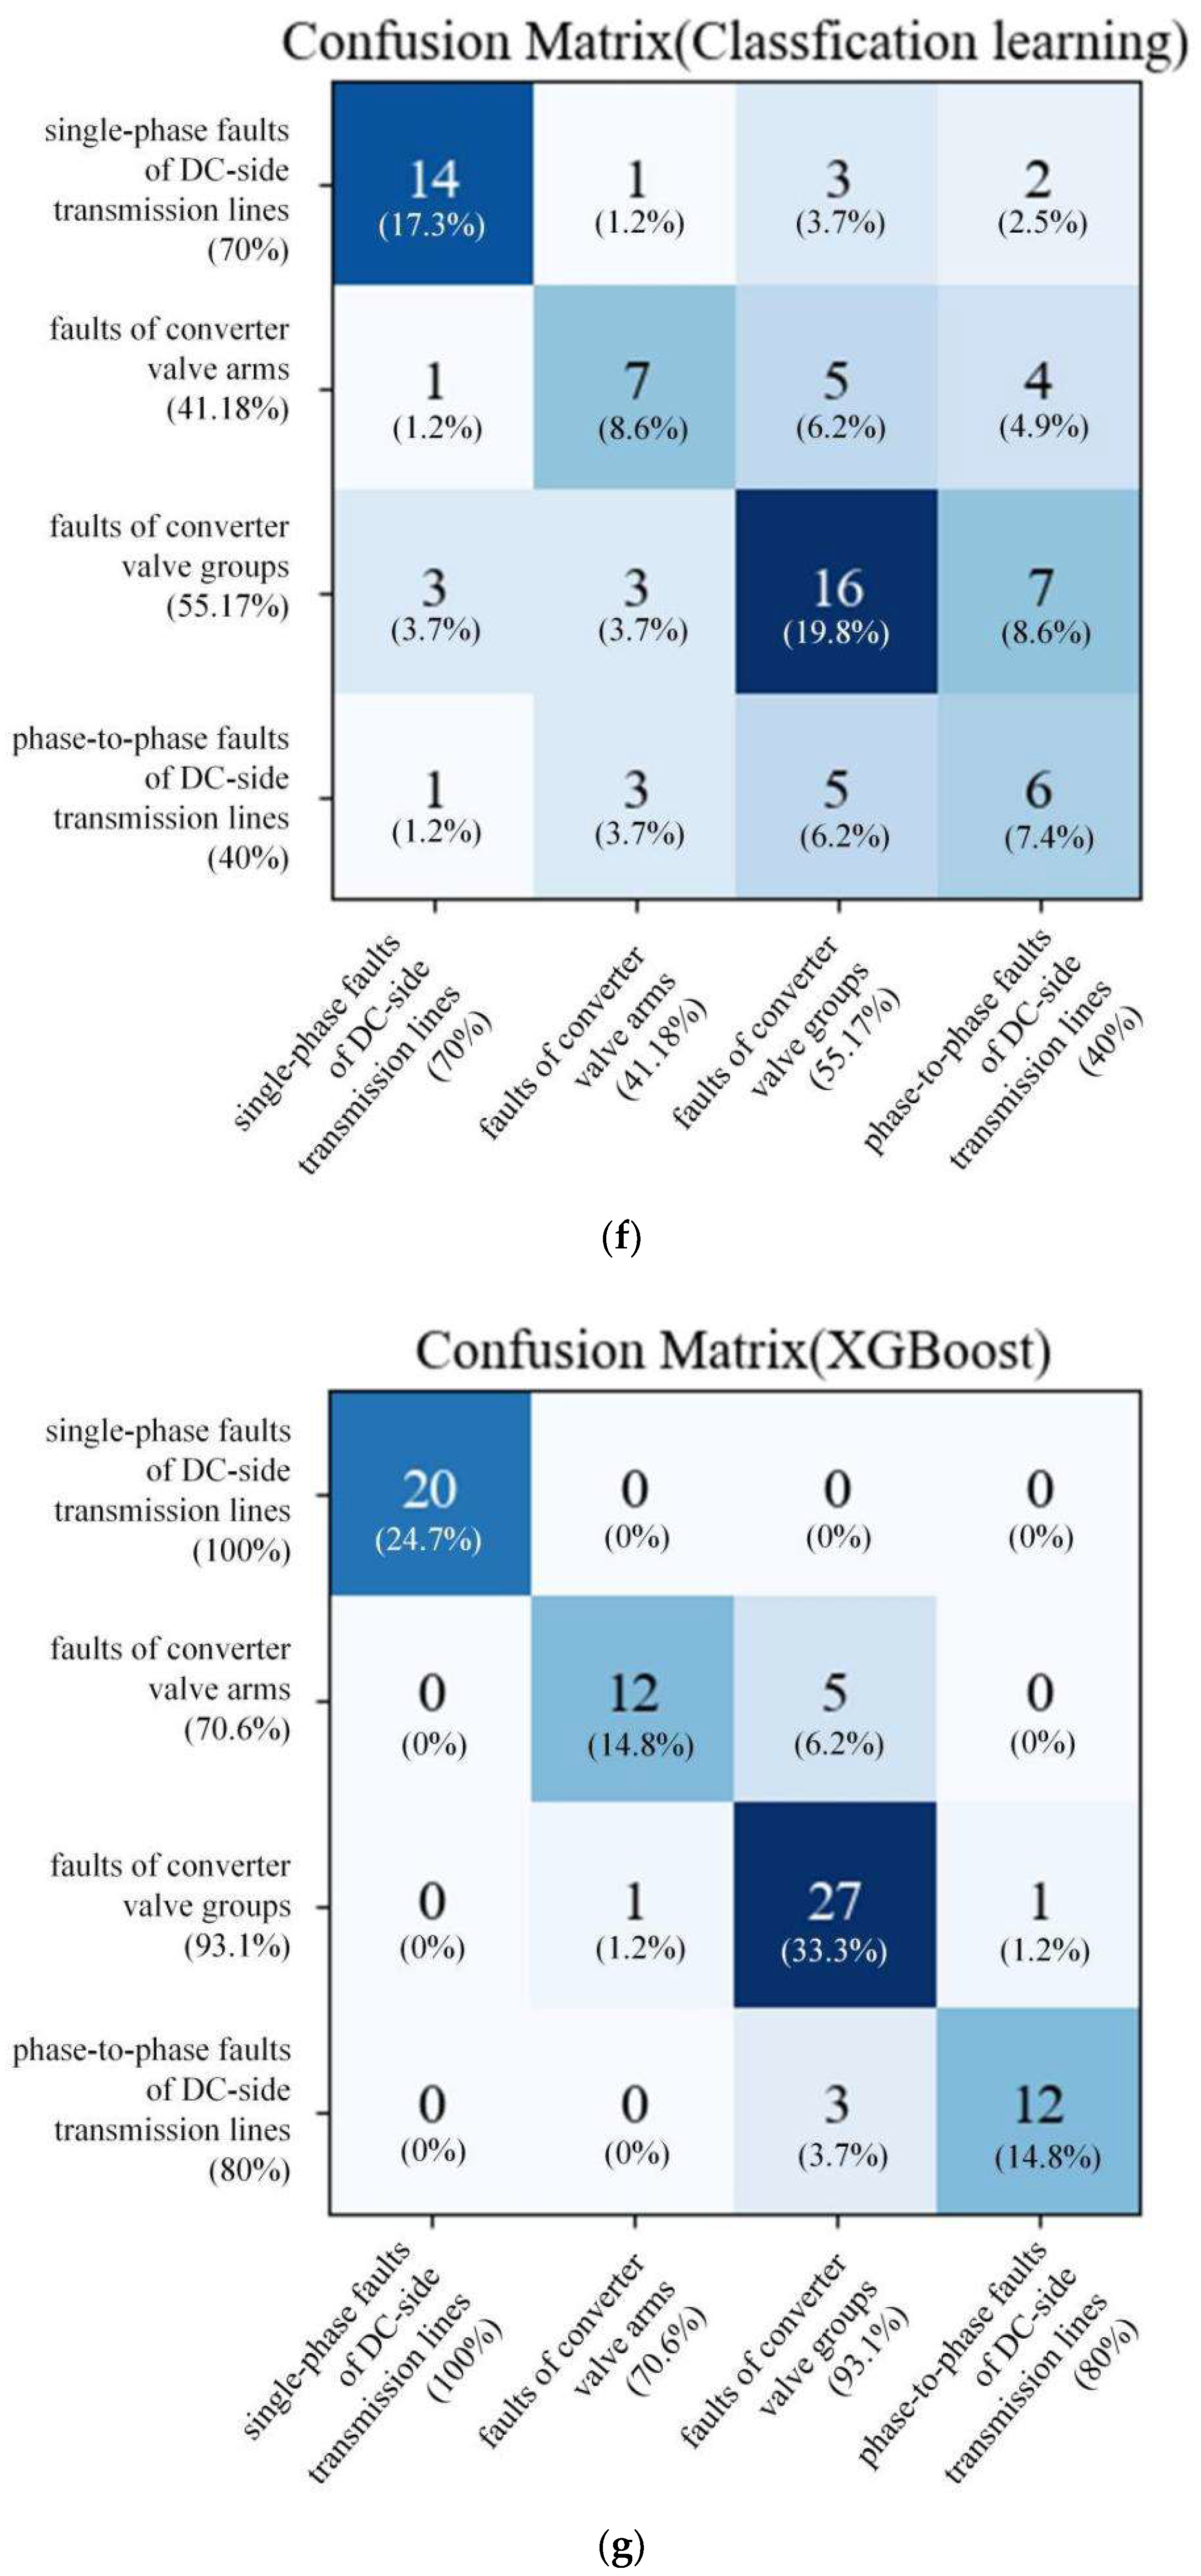
Figure 12f, 6 misdiagnosis data appear in single-phase faults of DC-side transmission lines, 10 misdiagnosis data appear in faults of converter valve arms, 13 misdiagnosis data appear in faults of converter valve groups, and 9 misdiagnosis data appear in phase-to-phase faults of DC-side transmission lines. Lastly, for the results of the XGBoost method in Figure 12g, 0 misdiagnosis data appear in single-phase faults of DC-side transmission lines, 5 misdiagnosis data appear in faults of converter valve arms, 2 misdiagnosis data appear in faults of converter valve groups, and 3 misdiagnosis data appear in phase-to-phase faults of DC-side transmission lines.
The parameters of the seven methods were optimized, and the results showed that the diagnostic accuracy of the LSTM method is 95.06%.
Because RNN is prone to gradient disappearance, it cannot process a long input sequence, so traditional RNN easily forgets the information of the previous relatively distant period, resulting in the failure of training accuracy convergence. This limits the use of RNN to a large extent. Therefore, the diagnostic accuracy of the RNN method is limited to 66.67%, and it is difficult to improve the diagnostic accuracy.
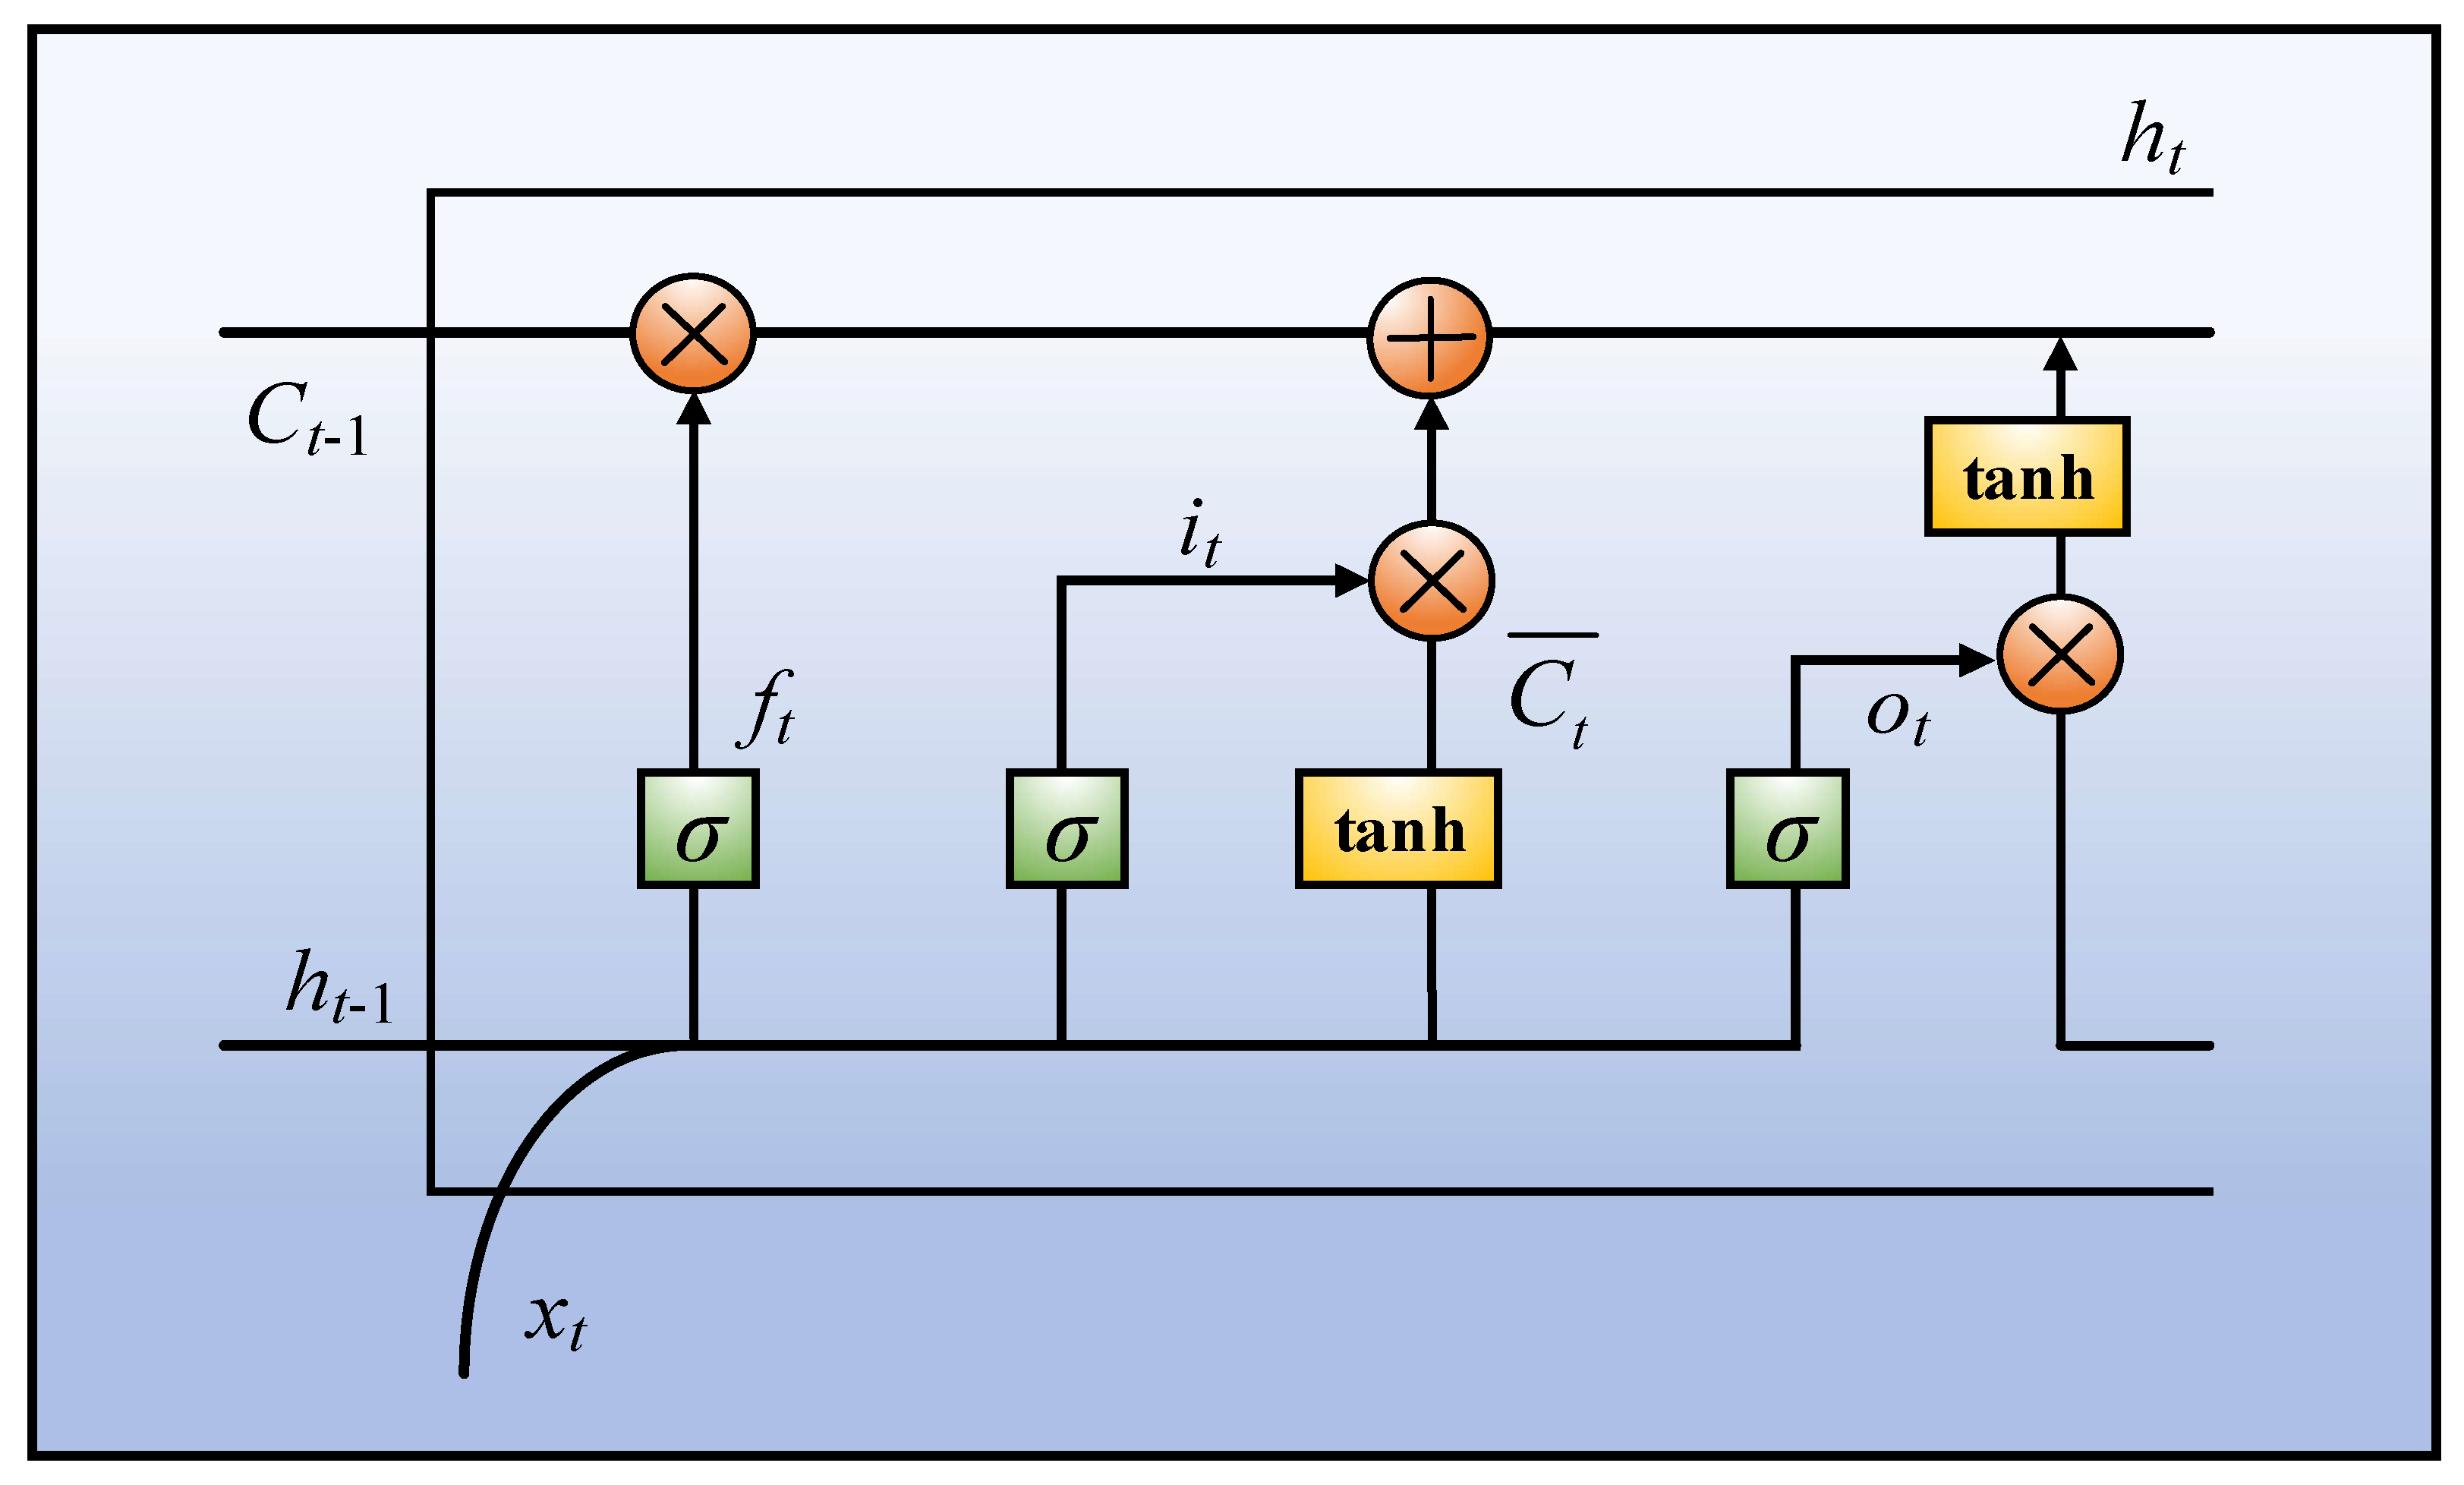
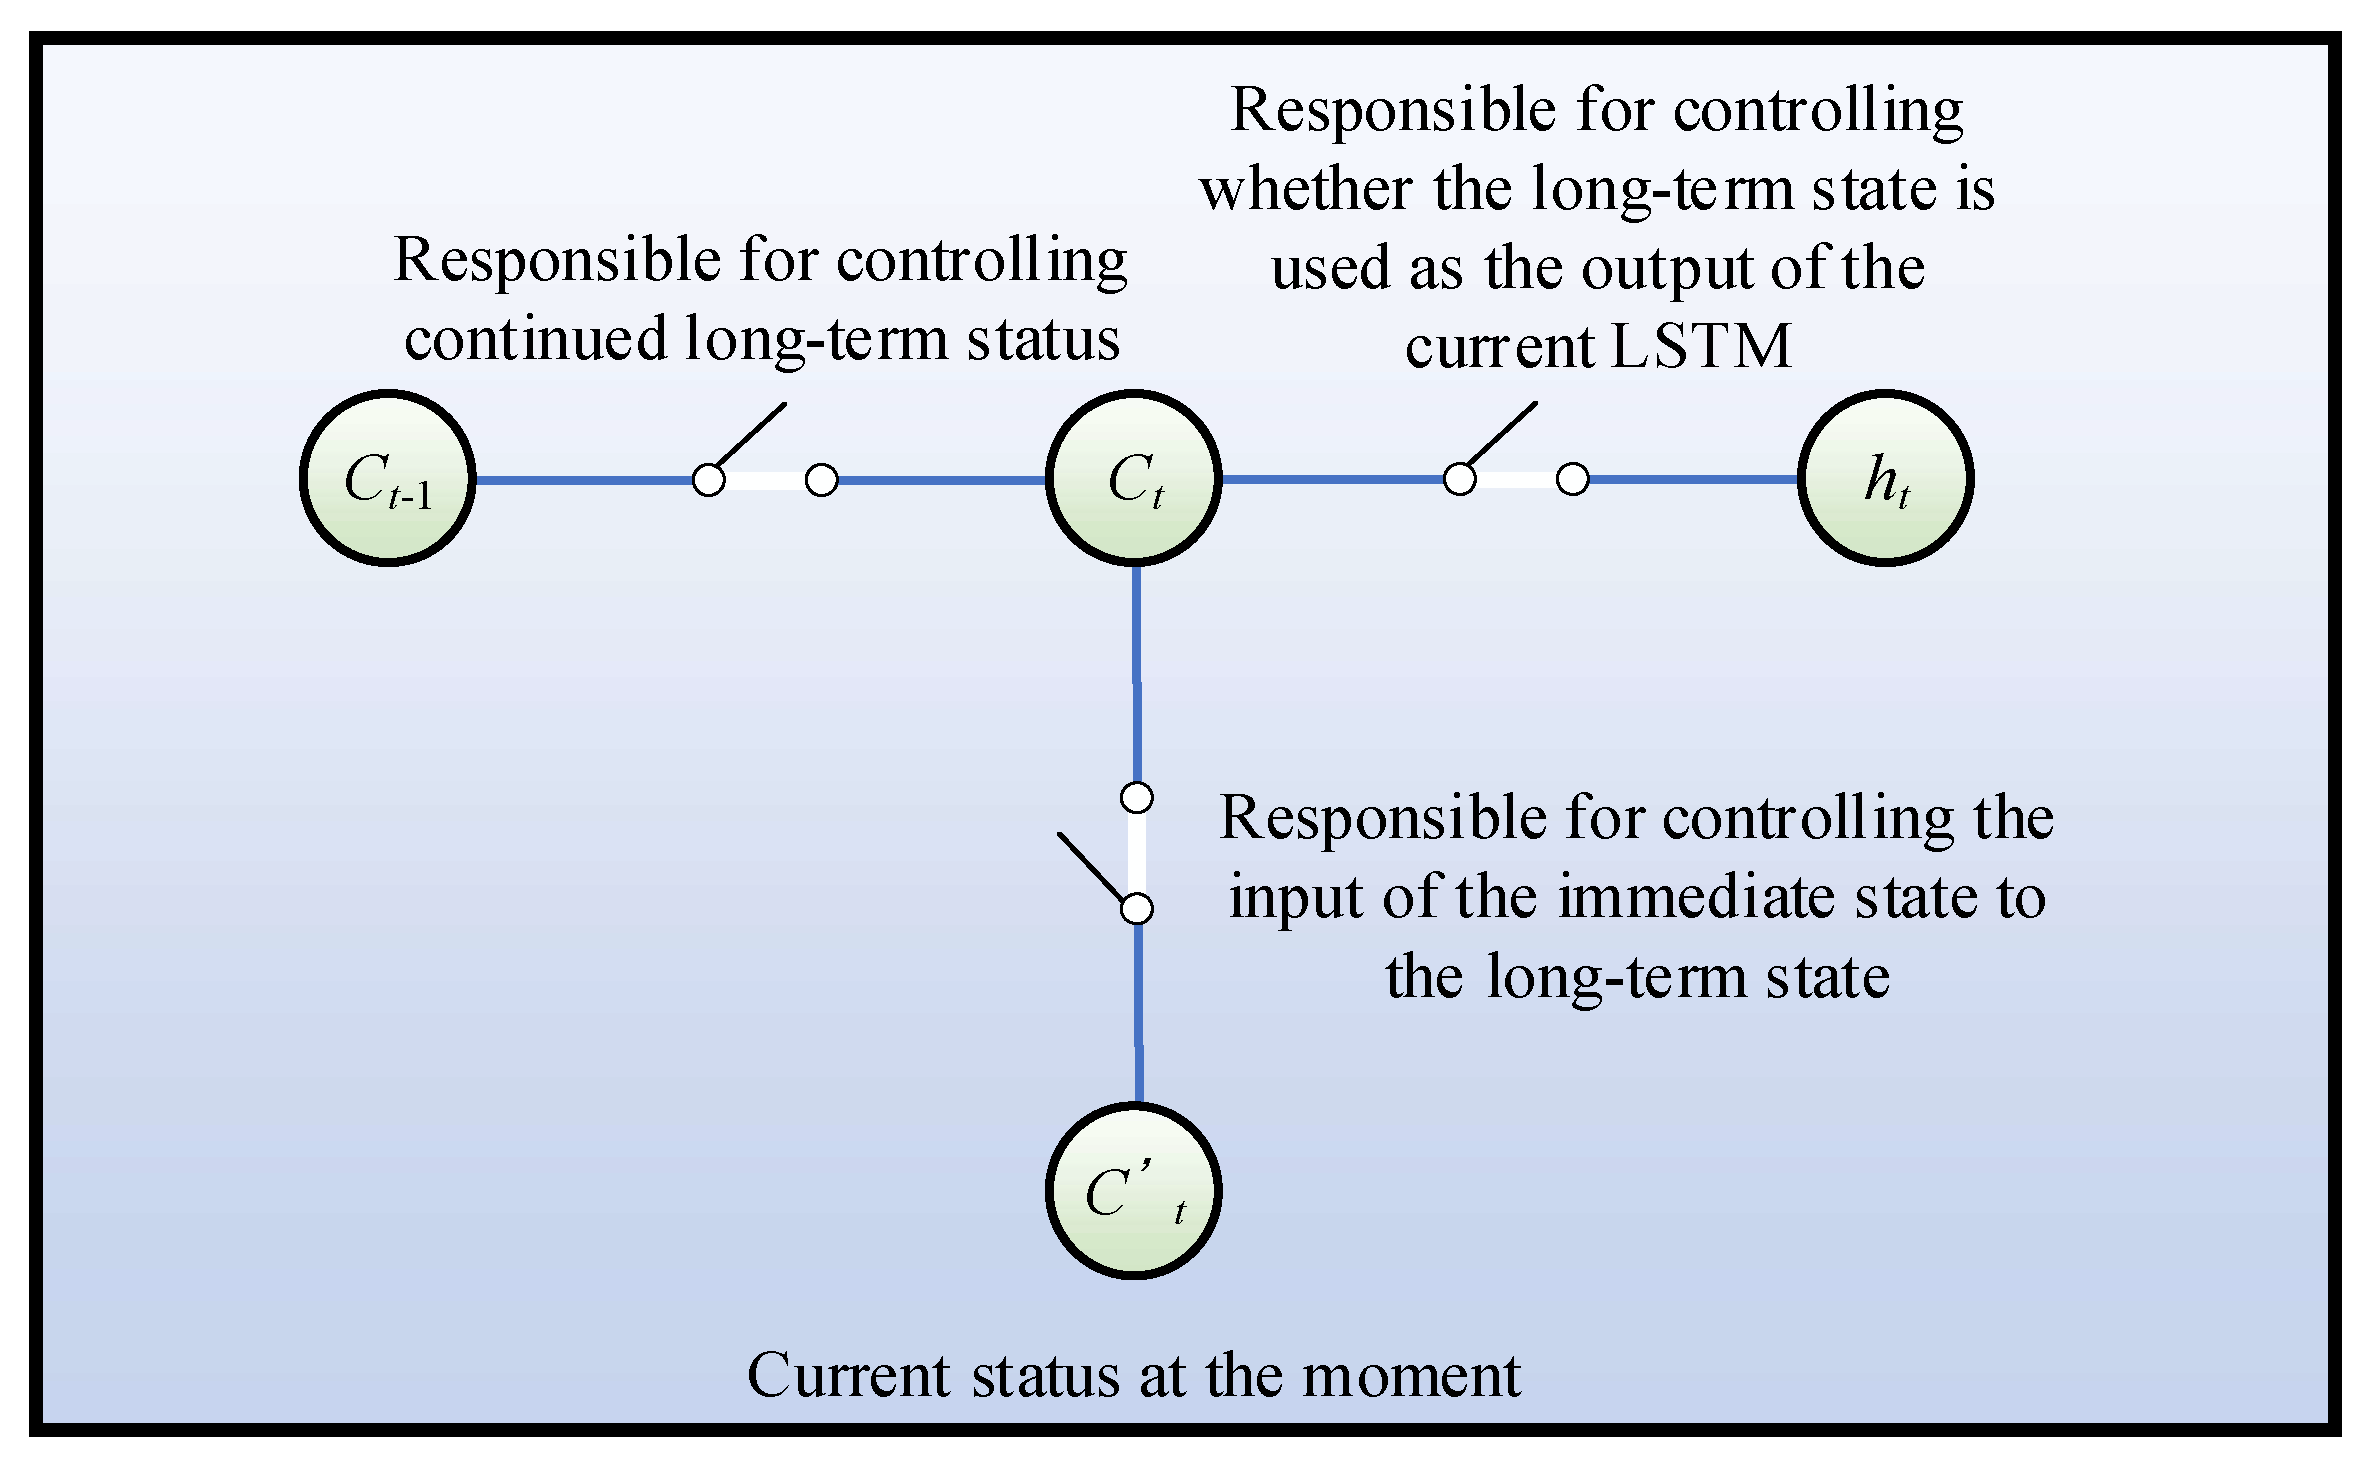
LSTM corrects the traditional RNN by designing a gated unit, solves the problem of long-term dependence common in general cyclic neural networks, and enables information to be transmitted and expressed flexibly in a long time series, without causing useful information from long ago to be forgotten, which is suitable for modeling sequential data. At the same time, the proposed fault diagnosis method based on the LSTM model does not require feature extraction and screening, which not only reduces the difficulty of using machine learning for fault diagnosis training, but also avoids fault prediction caused by improper feature selection.
The accuracy of XGBoost, SVM, Naive Bayes, PNN, and CL is 87.65%, 91.36%, 88.89%, 46.91%, and 53.07%, respectively, but it is still lower than that of the LSTM method. Therefore, this paper puts forward the advanced fault diagnosis method of HVDC systems.

6. Discussion and Limitation

6.1. Discussion

The research data is based on the fault monitoring data of the Tianshengqiao-Guangzhou transmission project of the China Southern Power Grid; the fault data is all the stored fault data collected from the HVDC system (from 2018–2022). During fault diagnosis, it is very obvious that when the data set used for training is larger, the final diagnostic results will be more accurate. Therefore, the number of fault samples is very important for fault diagnosis. In future research on fault diagnosis, it is essential to collect data and use reasonable methods for data preprocessing, which is also a new direction for future research in this field. Because of the large number of data samples needed to train the LSTM network to ensure high accuracy of fault diagnosis, the accuracy of the raised LSTM-based fault diagnosis strategy is limited to 95.06%. However, the actual system power supply reliability of the HVDC systems is very high—about 99.7116% [49]. The fault probability of HVDC systems is very low, so few HVDC systems fault data samples can be used to train LSTM, which will affect the accuracy of the fault diagnosis method proposed, to some extent. However, compared with six comparison methods, LSTM-based fault diagnosis accuracy is still very high. At the same time, with the increase of using time, more and more fault data samples of trained LSTM can further enhance the accuracy of fault diagnosis of HVDC systems based on LSTM. In addition, the study is aimed at the fault diagnosis of an actual HVDC system project. This research has high accuracy and is very suitable for fault diagnosis in actual power systems. It can replace some traditional fault diagnosis methods in power systems, such as traditional neural networks RNN, Naive Bayes, etc.
By combining the fault diagnosis with the knowledge graph technology, the detected fault data can be directly transmitted to the knowledge graph, which is analyzed and processed, and the fault solution can be obtained, thus realizing the visualization of the fault diagnosis technology in the HVDC systems. At the same time, fault diagnosis technology is one of the core technologies of the knowledge graph, so its combination with the knowledge graph leads to the continuous improvement and development of the knowledge graph.

6.2. Limitations

HVDC systems fault diagnosis is a problem of small sample data. The fault data samples were divided into 80% training set and 20% test set with the optimal solution. LSTM requires a large amount of data for training, so if the training samples are too small, the training results will be unsatisfactory and the final fault diagnosis accuracy will be affected. If the proportion of training set is too large and the proportion of test set is too small, the reliability of the final fault diagnosis accuracy will decrease. When the ratio of the training set and test set is 8:2, the training accuracy can converge to a higher level in the training process; thus, the ratio of the training set and test set is 8:2, which is very appropriate.
At the same time, the fault data set only includes four types of faults, but does not cover all types of faults, such as transformer faults and generator faults in HVDC systems, which affects the accuracy of fault diagnosis to a certain extent, meaning the proposed method has certain limitations for some special fault prediction.

7. Conclusions and Perspectives

Relying on the knowledge graph platform, the article raises a fault diagnosis method based on the LSTM network under the knowledge graph, using the fault data of four kinds of faults in a southwest HVDC substation as the data set. The method can accurately classify each type of fault in tests, showing better fault diagnosis performance, and the specific contributions are summarized as follows:
(1) The knowledge graph of HVDC systems is established. By diagnosing various types of faults and blending them in the system, the fault analysis can be carried out quickly when faults appear in the future, which improves the efficiency of power system operation management;
(2) A fault diagnosis strategy of HVDC systems based on LSTM networks is proposed, which overcomes the shortcomings of traditional RNN that tend to forget earlier fault information when the fault sequence is too long; and the method can achieve accurate classification of all kinds of faults;
(3) Using the RNN, XGBoost, SVM, Naive Bayes, PNN, and CL for comparison, the results show that the accuracy of the LSTM method is as high as 95.06%, and the accuracy of the RNN, XGBoost, SVM, and Naive Bayes, PNN, and CL is 66.67%, 87.65%, 91.36%, 88.89%, 46.91%, and 53.07%, respectively. The test results show that the LSTM-based fault diagnosis is more accurate and can effectively improve the reliability of HVDC operation.
On the basis of the LSTM-based fault diagnosis model for HVDC systems, future research will be conducted as follows:
(1) The function of the fault diagnosis model for fault location will be developed, and will strive to locate the fault point more quickly;
(2) In practice, to further improve the accuracy of LSTM, more fault data sets need to be used for training. At the same time, there are many fault types in the HVDC systems. To improve the feasibility, the amount of data and fault types will be further increased;
(3) The fault diagnosis research in this article can be directly applied to other HVDC systems, such as VSC-HVDC systems;
(4) The development of smart grids, the knowledge graph and the fault diagnosis research in this article can not only be applied to HVDC systems in the future, but also provide a reference for fault research for the entire power system.

Author Contributions

Q.C.: writing the original draft and editing. J.W., Q.L., X.G. and B.Y.: conceptualization. R.Y., J.G. and G.P.: visualization and contributed to the discussion of the topic. All authors have read and agreed to the published version of the manuscript.

Funding

This research was funded by key science and technology projects of the China Southern Power Grid grant number (CGYKJXM20210309, CGYKJXM20220343).

Acknowledgments

The authors gratefully acknowledge the support of key science and technology projects of the China Southern Power Grid (CGYKJXM20210309, CGYKJXM20220343).

Conflicts of Interest

Authors Qiang Li, Qian Chen, and Jiyang Wu are employed by EHV Power Transmission Company of China Southern Power Grid Co., Ltd.; the remaining authors declare that the research was conducted in the absence of any commercial or financial relationships that could be construed as a potential conflict of interest.

References

  1. Yang, B.; Liu, B.; Zhou, H.; Wang, J.; Yao, W.; Wu, S.; Shu, H.; Ren, Y. A critical survey of technologies of large offshore wind farm integration: Summarization, advances, and perspectives. Prot. Control Mod. Power Syst. 2022, 7, 17. [Google Scholar] [CrossRef]
  2. Yang, B.; Li, Y.; Li, J.; Shu, H.; Zhao, X.; Ren, Y.; Li, Q. Comprehensive summarization of solid oxide fuel cell: Control: A state-of-the-art review. Prot. Control Mod. Power Syst. 2022, 7, 36. [Google Scholar] [CrossRef]
  3. Zalhaf, A.; Zhao, E.; Han, Y.; Yang, P.; Almaliki, A.; Aly, R. Evaluation of the transient overvoltages of HVDC transmission lines caused by lightning strikes. Energies 2022, 15, 1452. [Google Scholar] [CrossRef]
  4. Zhao, E.; Han, Y.; Liu, Y.; Zalhaf, A.; Wang, C.; Yang, P. Feasibility analysis of neutral grounding by small reactor of HVDC converter transformer. Energy Rep. 2022, 8, 392–399. [Google Scholar] [CrossRef]
  5. Hu, Z.; Han, Y.; Yang, P.; Wang, C.; Zalhaf, A. Evaluation of lightning overvoltage at neutral point of HVDC converter transformer based on EMTP. Energy Rep. 2022, 8, 274–283. [Google Scholar] [CrossRef]
  6. Fu, J.; Han, Y.; Yang, P.; Wang, C.; Zalhaf, A. Analysis of fault current and overvoltage at the neutral point of ±800 kV high-voltage DC converter transformer. Energy Rep. 2022, 8, 292–300. [Google Scholar] [CrossRef]
  7. Ma, L. Support vector machine algorithms in nonlinear classification and regression based problems. J. Tianshui Norm. Coll. 2009, 29, 44–47. [Google Scholar]
  8. Ding, J.; Shao, Q.; Qi, Z.; Xie, M.; Gao, B.; Yu, Y. Migration learning based convolutional neural network for grid fault diagnosis. Sci. Technol. Eng. 2022, 22, 5653–5658. [Google Scholar]
  9. Yan, B.; Liu, X.; Tian, Z.; Shi, S.; Yu, F. Application of co-filter and support vector machine in HVDC system fault diagnosis. Chin. J. Electr. Eng. 2008, 28, 23–29. [Google Scholar]
  10. Li, Q.; Chen, Q.; Wu, J.; Qiu, Y.; Zhang, C.; Huang, Y.; Jian, B.; Yang, B. XGBoost-based intelligent decision making of HVDC system with knowledge graph. Energies 2023, 16, 2405. [Google Scholar] [CrossRef]
  11. Chen, J.; Li, Y.; Chen, J.; Liu, D.; Yang, Y. Identification of typical partial discharge defects of distribution system equipment based on classification learner. In Proceedings of the 2022 7th Asia Conference on Power and Electrical Engineering (ACPEE), Hangzhou, China, 15–17 April 2022; pp. 2025–2029. [Google Scholar]
  12. Fan, Q.; Zhang, J.; Wang, G.; Ren, W. Research on intelligent fault diagnosis of substation based on knowledge graph. Electron. Technol. Softw. Eng. 2022, 20, 109–112. [Google Scholar]
  13. Chen, Y.; Yang, B.; Guo, Z.; Wang, J.; Zhu, M.; Li, Z.; Yu, T. Dynamic reconfiguration for TEG systems under heterogeneous temperature distribution via adaptive coordinated seeker. Prot. Control Mod. Power Syst. 2022, 7, 38. [Google Scholar] [CrossRef]
  14. Liu, J.; Du, N.; Xu, J.; Liu, X.; Song, Y.; Qiu, L.; Zhao, Y.; Sun, M. Application and research of knowledge graph in electric power field. Power Inf. Commun. Technol. 2020, 18, 60–66. [Google Scholar] [CrossRef]
  15. Mohan, M. A comprehensive review of DC fault protection methods in HVDC transmission systems. Prot. Control Mod. Power Syst. 2021, 6, 1. [Google Scholar]
  16. Sebastian, P.; Benjamin, S.; Dirk, W.; Johannes, K. Revealing interactions between HVDC cross-area flows and frequency stability with explainable AI. Prot. Control Mod. Power Syst. 2022, 5, 46. [Google Scholar]
  17. Xing, J.; Bian, J.; Kang, J.; Qi, K.; Feng, P. Hot spots and trends of domestic and international network security assessment research--a visual analysis of knowledge graph based on citespace. Comput. Knowl. Technol. 2022, 18, 37–40. [Google Scholar]
  18. Niri, M.F.; Bui, T.M.; Dinh, T.Q.; Hosseinzadeh, E.; Yu, T.F.; Marco, J. Remaining energy estimation for lithium-ion batteries via gaussian mixture and markov models for future load prediction. J. Energy Storage 2020, 28, 101271. [Google Scholar] [CrossRef]
  19. Niri, M.F.; Dinh, T.Q.; Yu, T.F.; Marco, J.; Bui TM, N. State of power prediction for lithium-ion batteries in electric vehicles via Wavelet-Markov load analysis. IEEE Trans. Intell. Transp. Syst. 2021, 22, 5833–5848. [Google Scholar] [CrossRef]
  20. Zhang, D.; Zhang, X.; Sun, H.; He, J. Fault diagnosis of AC/DC transmission system based on convolutional neural network. Autom. Electr. Power Syst. 2022, 46, 132–145. [Google Scholar]
  21. Gong, Y.; Li, B.; Li, D.; Yang, X.; Chen, Q. A knowledge base construction method for fault knowledge base of power equipment based on knowledge graph. Electron. Prod. Reliab. Environ. Test. 2021, 39, 72–77. [Google Scholar]
  22. Guo, Z.; Yang, M. Application of RNN diagnosis method to motor bearing and misalignment compound fault. J. Nanjing Univ. Aeronaut. Astronaut. 2022, 54, 87–93. [Google Scholar]
  23. Truong, M.; Nicolas, H.; Truong, Q. Baseline strategy for remaining range estimation of electric motorcycle applications. In Proceedings of the 2022 25th International Conference on Mechatronics Technology, Kaohsiung, Taiwan, 18–21 November 2022; pp. 1–4. [Google Scholar]
  24. Shu, Y.; Guo, W.; Fan, B.; Kang, J.; Xu, S. Based on the instance and electrical fault attribute weighted Naive Bayes classification study. Comput. Meas. Control 2022, 30, 169–180. [Google Scholar]
  25. Yang, X. Review of performance metrics of classification learning algorithms. Comput. Sci. 2021, 48, 209–219. [Google Scholar]
  26. Cheng, Y.; Zuo, G. Research on fault diagnosis system of CVT hydraulic system based on PNN. Small Intern. Combust. Engine Veh. Technol. 2018, 47, 18–21. [Google Scholar]
  27. Wang, C.; Li, Y.; Fei, C.; Huang, X. A review of knowledge graph platforms. Comput. Appl. Res. 2022, 39, 3201–3210. [Google Scholar]
  28. Pu, T.; Tan, Y.; Peng, G.; Xu, H.; Zhang, Z. Construction and application of knowledge graph in electric power domain. Power Grid Technol. 2021, 45, 2080–2091. [Google Scholar]
  29. Wang, Q.; Zhang, Z. Knowledge graph-based fault diagnosis method for signal equipment. Railw. Stand. Des. 2022, 66, 149–156. [Google Scholar]
  30. Gao, H.; Miao, L.; Liu, J.; Liu, J.; Lin, X.; Dong, K.; He, X. A review of research on knowledge graph and its application in power system. Guangdong Electr. Power 2020, 33, 66–76. [Google Scholar]
  31. Lu, F.; Leng, Y. Knowledge graph data indexing and compressed storage algorithm supported by RDF graph model. J. Bohai Univ. (Nat. Sci. Ed.) 2021, 42, 277–282. [Google Scholar]
  32. Deng, Z. Artificial intelligence-based knowledge graph construction techniques and applications. Radio Eng. 2022, 52, 766–774. [Google Scholar]
  33. Li, Z.; Dong, X.; Zhou, D.; Tong, T. Research on human-machine collaborative construction method and application of knowledge graph in adaptive learning system. Mod. Educ. Technol. 2019, 29, 80–86. [Google Scholar]
  34. Guo, R.; Yang, Q.; Liu, S.; Li, W.; Yuan, X.; Huang, X. Research and application of knowledge graph construction for power grid fault disposal. Power Grid Technol. 2021, 45, 2092–2100. [Google Scholar]
  35. Liu, Q.; Li, Y.; Duan, H.; Liu, Y.; Qin, Z. A review of knowledge graph construction techniques. Comput. Res. Dev. 2016, 53, 582–600. [Google Scholar]
  36. Jiang, T.; Xie, J.; Hu, J.; Ding, S.; Liu, G.; Xie, Q. Analysis and processing of chaotic timing of event sequence records in intelligent substations. Yunnan Electr. Power Technol. 2021, 49, 9–12. [Google Scholar]
  37. Zhang, C. Resolution of power system event sequence records and detection of real-time signals of component actions. Power Grid Technol. 1991, 4, 38–43. [Google Scholar]
  38. Li, J.; Zhang, C.; Zhao, H.; Huang, T.; Wan, Y.; Wang, X. Knowledge graph construction for technical supervision of power grid equipment based on multi-source data fusion. Electr. Eng. Electr. 2021, 9, 60–63. [Google Scholar]
  39. Yang, B.; Sang, Y.; Shi, K.; Yao, W.; Jiang, L.; Yu, T. Design and real-time implementation of perturbation observer based sliding-mode control for VSC-HVDC systems. Control Eng. Pract. 2016, 56, 13–26. [Google Scholar] [CrossRef]
  40. Yang, B.; Jiang, L.; Yao, W.; Wu, Q. Perturbation observer based adaptive passive control for damping improvement of multi-terminal voltage source converter-based high voltage direct current systems. Trans. Inst. Meas. Control 2017, 39, 1409–1420. [Google Scholar] [CrossRef]
  41. Yang, B.; Yu, T.; Zhang, X.; Huang, L.; Shu, H.; Jiang, L. Interactive teaching-learning optimizer for parameter tuning of VSC-HVDC systems with offshore wind farm integration. IET Gener. Transm. Distrib. 2018, 12, 678–687. [Google Scholar] [CrossRef]
  42. Zhao, Y.; Sun, S.; Liu, X.; Nie, Y. Improved CNN-LSTM-based wide-band oscillation identification for power systems. Intell. Power 2022, 50, 96. [Google Scholar]
  43. Pang, C.; Zhang, B.; Yu, J. Short-term electric load forecasting based on LSTM recurrent neural network. Power Eng. Technol. 2021, 40, 175–180, 194. [Google Scholar]
  44. Yang, J.; Xiao, D.; Li, H.; Yu, M.; Yi, B. 1000 kV extra high voltage line loss prediction based on improved gray correlation analysis and LSTM. Electr. Technol. 2020, 19, 131–136. [Google Scholar]
  45. Wang, Y.; Liu, B.; Li, Y. An LSTM neural network-based method for electric load forecasting. Lab. Res. Explor. 2020, 39, 41–45. [Google Scholar]
  46. Shao, Q.; Guo, L.; Liu, Y.; Xie, M.; Dai, C.; Wang, T.; Zhang, J.; Cong, Z. Single-phase ground fault identification method for distribution network based on LSTM model. Guangdong Electr. Power 2019, 32, 100–106. [Google Scholar]
  47. Yang, B.; Jiang, L.; Yu, T.; Shu, H.; Zhang, C.; Yao, W.; Wu, Q. Passive control design for multi-terminal VSC-HVDC systems via energy shaping. Int. J. Electr. Power Energy Syst. 2018, 98, 496–508. [Google Scholar] [CrossRef]
  48. Pang, Y.; Zhou, X.; He, W.; Zhong, J.; Hui, O. Uniform design-based gaussian process regression for data-driven rapid fragility assessment of bridges. J. Struct. Eng. 2021, 147, 04021008. [Google Scholar] [CrossRef]
  49. National Power Reliability Report in the First Half of 2020. Available online: http://prpq.nea.gov.cn/gzdt/4638.html (accessed on 18 September 2020).
Figure 1. Steps of knowledge graph construction.
Electronics 12 02242 g001
Figure 2. Diagram of construction of DC knowledge systems.
Electronics 12 02242 g002
Figure 3. Fault handling and risk analysis framework based on knowledge graph of DC transmission systems.
Electronics 12 02242 g003
Figure 4. Application of knowledge graph in fault diagnosis.
Electronics 12 02242 g004
Figure 5. Structure of LSTM network unit.
Electronics 12 02242 g005
Figure 6. LSTM long-term state control structure diagram.
Electronics 12 02242 g006
Figure 7. Schematic diagram of Tianshengqiao-Guangzhou HVDC project.
Electronics 12 02242 g007
Figure 8. Main fault points of a substation in the southwest power grid of China.
Electronics 12 02242 g008
Figure 9. Flow chart of LSTM-based fault diagnosis algorithm.
Electronics 12 02242 g009
Figure 10. Diagnosis waveform of HVDC four fault types. (a) DC-side transmission line single-phase fault; (b) fault of converter valve arm; (c) fault of converter valve group; and (d) DC-side transmission line interphase fault.
Electronics 12 02242 g010aElectronics 12 02242 g010b
Figure 11. Fault recording device diagram.
Electronics 12 02242 g011
Figure 12. Confusion matrix of the diagnosis results of the seven methods. Results of: (a) LSTM method; (b) RNN method; (c) SVM method; (d) Naive Bayes method; (e) PNN method; (f) CL method; and (g) XGBoost method.
Electronics 12 02242 g012aElectronics 12 02242 g012bElectronics 12 02242 g012cElectronics 12 02242 g012d
Table 1. Fault type of a substation fault point in Southwest Power Grid.
Fault PointFault TypeFault PointFault Type
F1single-phase ground short circuitF1Three-phase grounding short circuit
F1Interphase short circuitF3Interphase short circuit
F2Interphase short circuitF4single-phase short circuit to ground
F5single-phase short circuit to groundF6Y1 bridge short circuit
F6Y2 bridge short circuitF6Y3 bridge short circuit
F6Y4 bridge short circuitF6Y5 bridge short circuit
F6Y6 bridge short circuitF8D1 bridge short circuit
F8D2 bridge short circuitF8D3 bridge short circuit
F8D4 bridge short circuitF8D5 bridge short circuit
F8D6 bridge short circuitF9outlet fault at high-pressure side of Y valve
F10Y valve short circuitF11D valve short circuit
F12valve short circuitF13outlet fault at high-pressure side of Y valve
F14high voltage bus faultF14high voltage bus fault
F15neutral bus faultF16line ground fault
F17neutral busbar disconnectionF18neutral bus grounding
F19ground electrode line disconnectionF20grounding electrode line grounding
Table 2. Signal name and meaning description.
Signal NameSignal Meaning DescriptionSignal NameSignal Meaning Description
UAC_IN_L1A-phase AC voltage, VIVD_L1AC at valve side A of bridge D, A
UAC_IN_L2B-phase AC voltage, VIVD_L2AC at valve side B of bridge D, A
UAC_IN_L3C-phase AC voltage, VIVD_L3AC at valve side B of bridge D, A
IVY_L1A-phase AC at Y-bridge valve side, AUDLDC line voltage, V
IVY_L2B-phase AC at Y-bridge valve side, AUDNNeutral bus voltage, V
IVY_L3C-phase AC at Y-bridge valve side, An.s.n.s.
Table 3. LSTM parameter settings.
ParametersValues
Matrix size of input fault data 409 by 33,000
The number of hidden layers2
Output labels[1–4]
OptimizerAdaptive moment estimation (Adam)
Epoch200
Number of neurons128
Activation functionSigmoid and inverse hyperbolic tangent
Batch size64
Table 4. The final classification accuracy of the three optimizers.
OptimizersPrediction Accuracy
Adam95.06%
RMSprop90.43%
SGD87.37%
Table 5. RNN parameter settings.
ParametersValues
The number of hidden layers2
Output labels[1–4]
OptimizerAdam
Epoch200
Hidden layer100
Dropout probability0.1
Activation functionSigmoid and inverse hyperbolic tangent
Batch size64
Table 6. Parameter settings for XGBoost.
ParametersValues
gamma0.4
max_depth8
reg_lambda2
subsample0.7
colsample_bytree0.7
min_child_weight3
eta0.1
seed1000
N-thread4
Table 7. Parameter settings for SVM.
ParametersValues
Multi-Classification Support Vector Machine ModelOne-versus-One
Kernel functionquadratic
Nuclear scalesAutomatic
Box Constraint Level1
Table 8. Parameter settings for Naive Bayes.
Parameter NameParameter Values
Kernel functionGaussian kernel
SupportNo Borders
Table 9. Parameter settings for PNN and CL.
MethodParameter NameParameter Setting
PNNspread1.5
CLMax_split tree100
Table 10. Split of the fault data set.
Fault TypeFault LabelsTraining SetTest Set
DC-side transmission line single-phase faults18420
faults in the converter valve arm26417
faults in the converter valve bank311829
DC-side transmission line phase-to-phase faults46215
Table 11. Comparison of diagnostic accuracy among LSTM, RNN, XGBoost, SVM, Naive Bayes, PNN and CL.
Fault TypeLSTMRNNXGBoostSVMNaive BayesPNNCL
single-phase faults of DC-side transmission lines100%70.00%100%100%100%75.00%70.00%
faults of converter valve arms94.10%52.90%70.60%82.40%70.60%47.05%41.18%
faults of converter valve groups93.10%89.70%93.10%93.10%100%62.07%55.17%
phase-to-phase faults of DC-side transmission lines93.30%33.30%80.00%86.70%73.30%46.67%40.00%
total95.06%66.67%87.65%91.36%88.89%46.91%53.07%
Table 12. Performance comparison of 7 methods.
MethodLSTMRNNXGBoostSVMNaive BayesPNNCL
Evaluating Indicator
F1-score0.860.520.840.450.610.530.55
AUC score0.880.530.830.480.640.590.61
Precision score0.900.590.890.490.620.470.51
Recall score0.820.560.810.460.650.610.63
Test time73.04 s78.04 s75.03 s97.64 s85.77 s122.33 s270.69 s
Disclaimer/Publisher’s Note: The statements, opinions and data contained in all publications are solely those of the individual author(s) and contributor(s) and not of MDPI and/or the editor(s). MDPI and/or the editor(s) disclaim responsibility for any injury to people or property resulting from any ideas, methods, instructions or products referred to in the content.

