
Predictive Maintenance for Distribution System Operators in Increasing Transformers’ Reliability
 ,
, 
Abstract
:1. Introduction
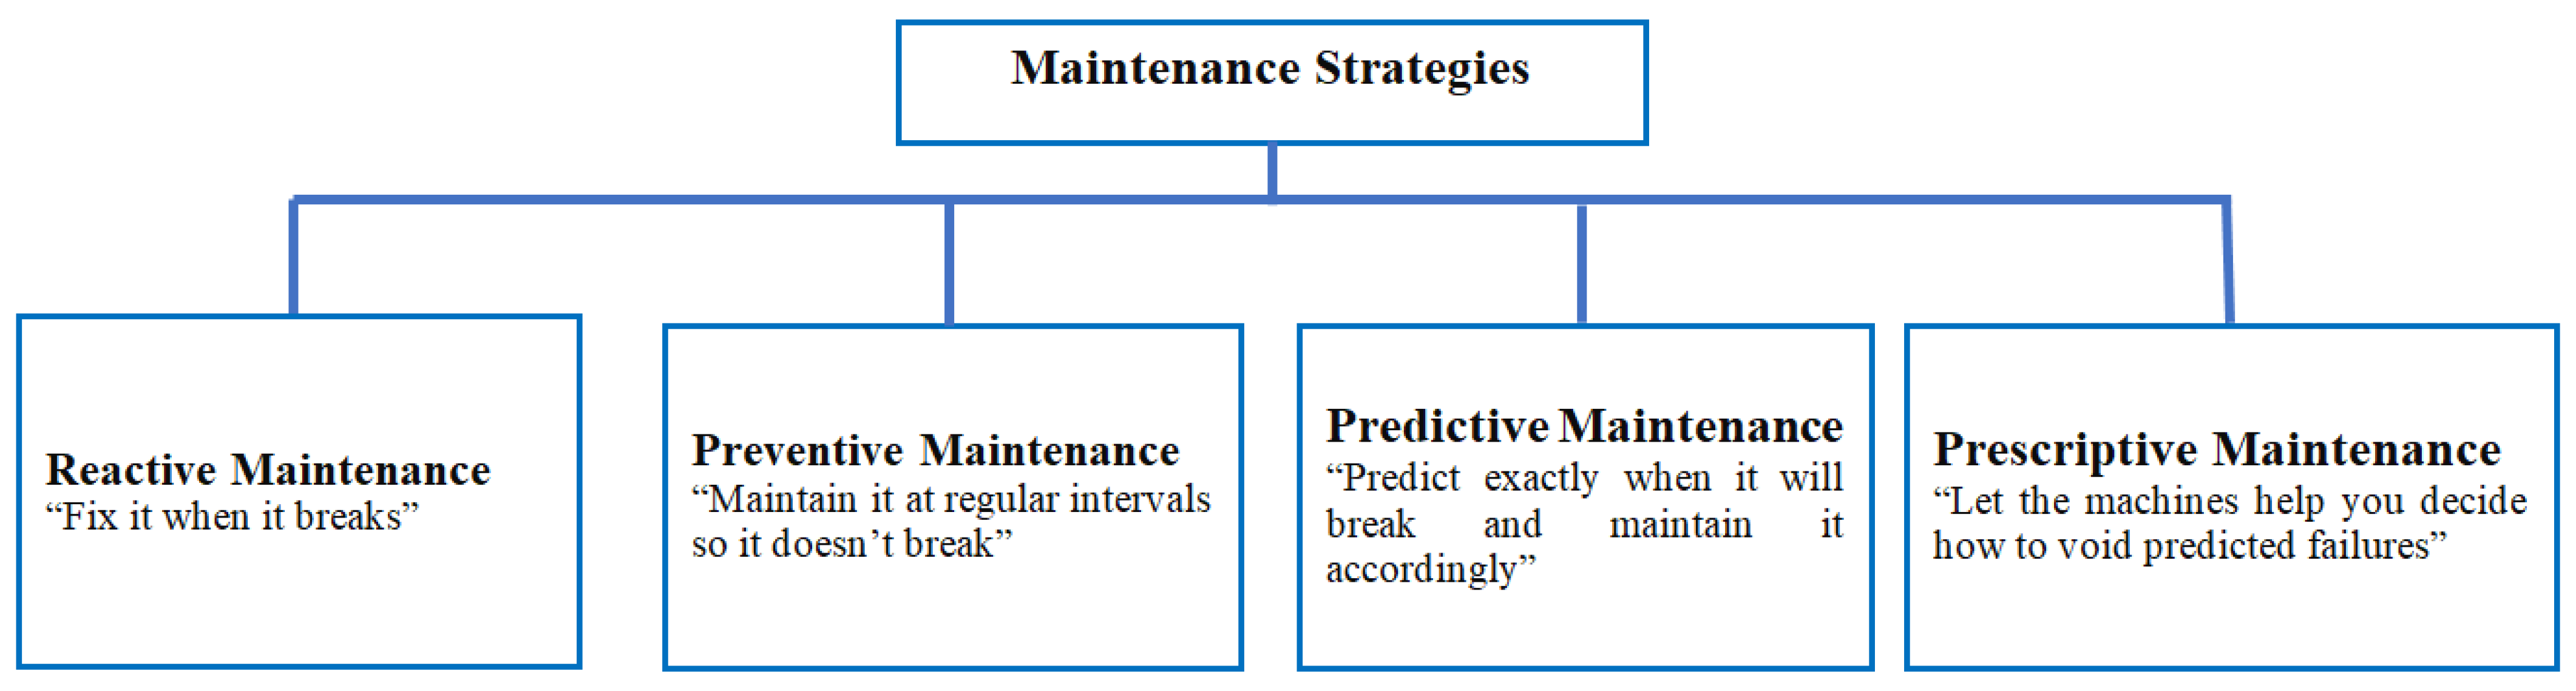
- Introducing a predictive maintenance approach for distribution system operators to increase the reliability of transformers;
- Proposing a novel model for predicting transformer failures that outperforms existing models;
- Demonstrating the effectiveness of the proposed approach through a case study on an existing distribution network.
- Increased accuracy: Models can often predict transformer failures with higher accuracy than traditional rule-based approaches.
- Early detection: Models can detect potential failures before they occur, enabling distribution system operators to perform preventive maintenance to avoid outages and costly repairs.
- Scalability: Models can be applied to large-scale distribution networks to identify potential failures across many transformers simultaneously.
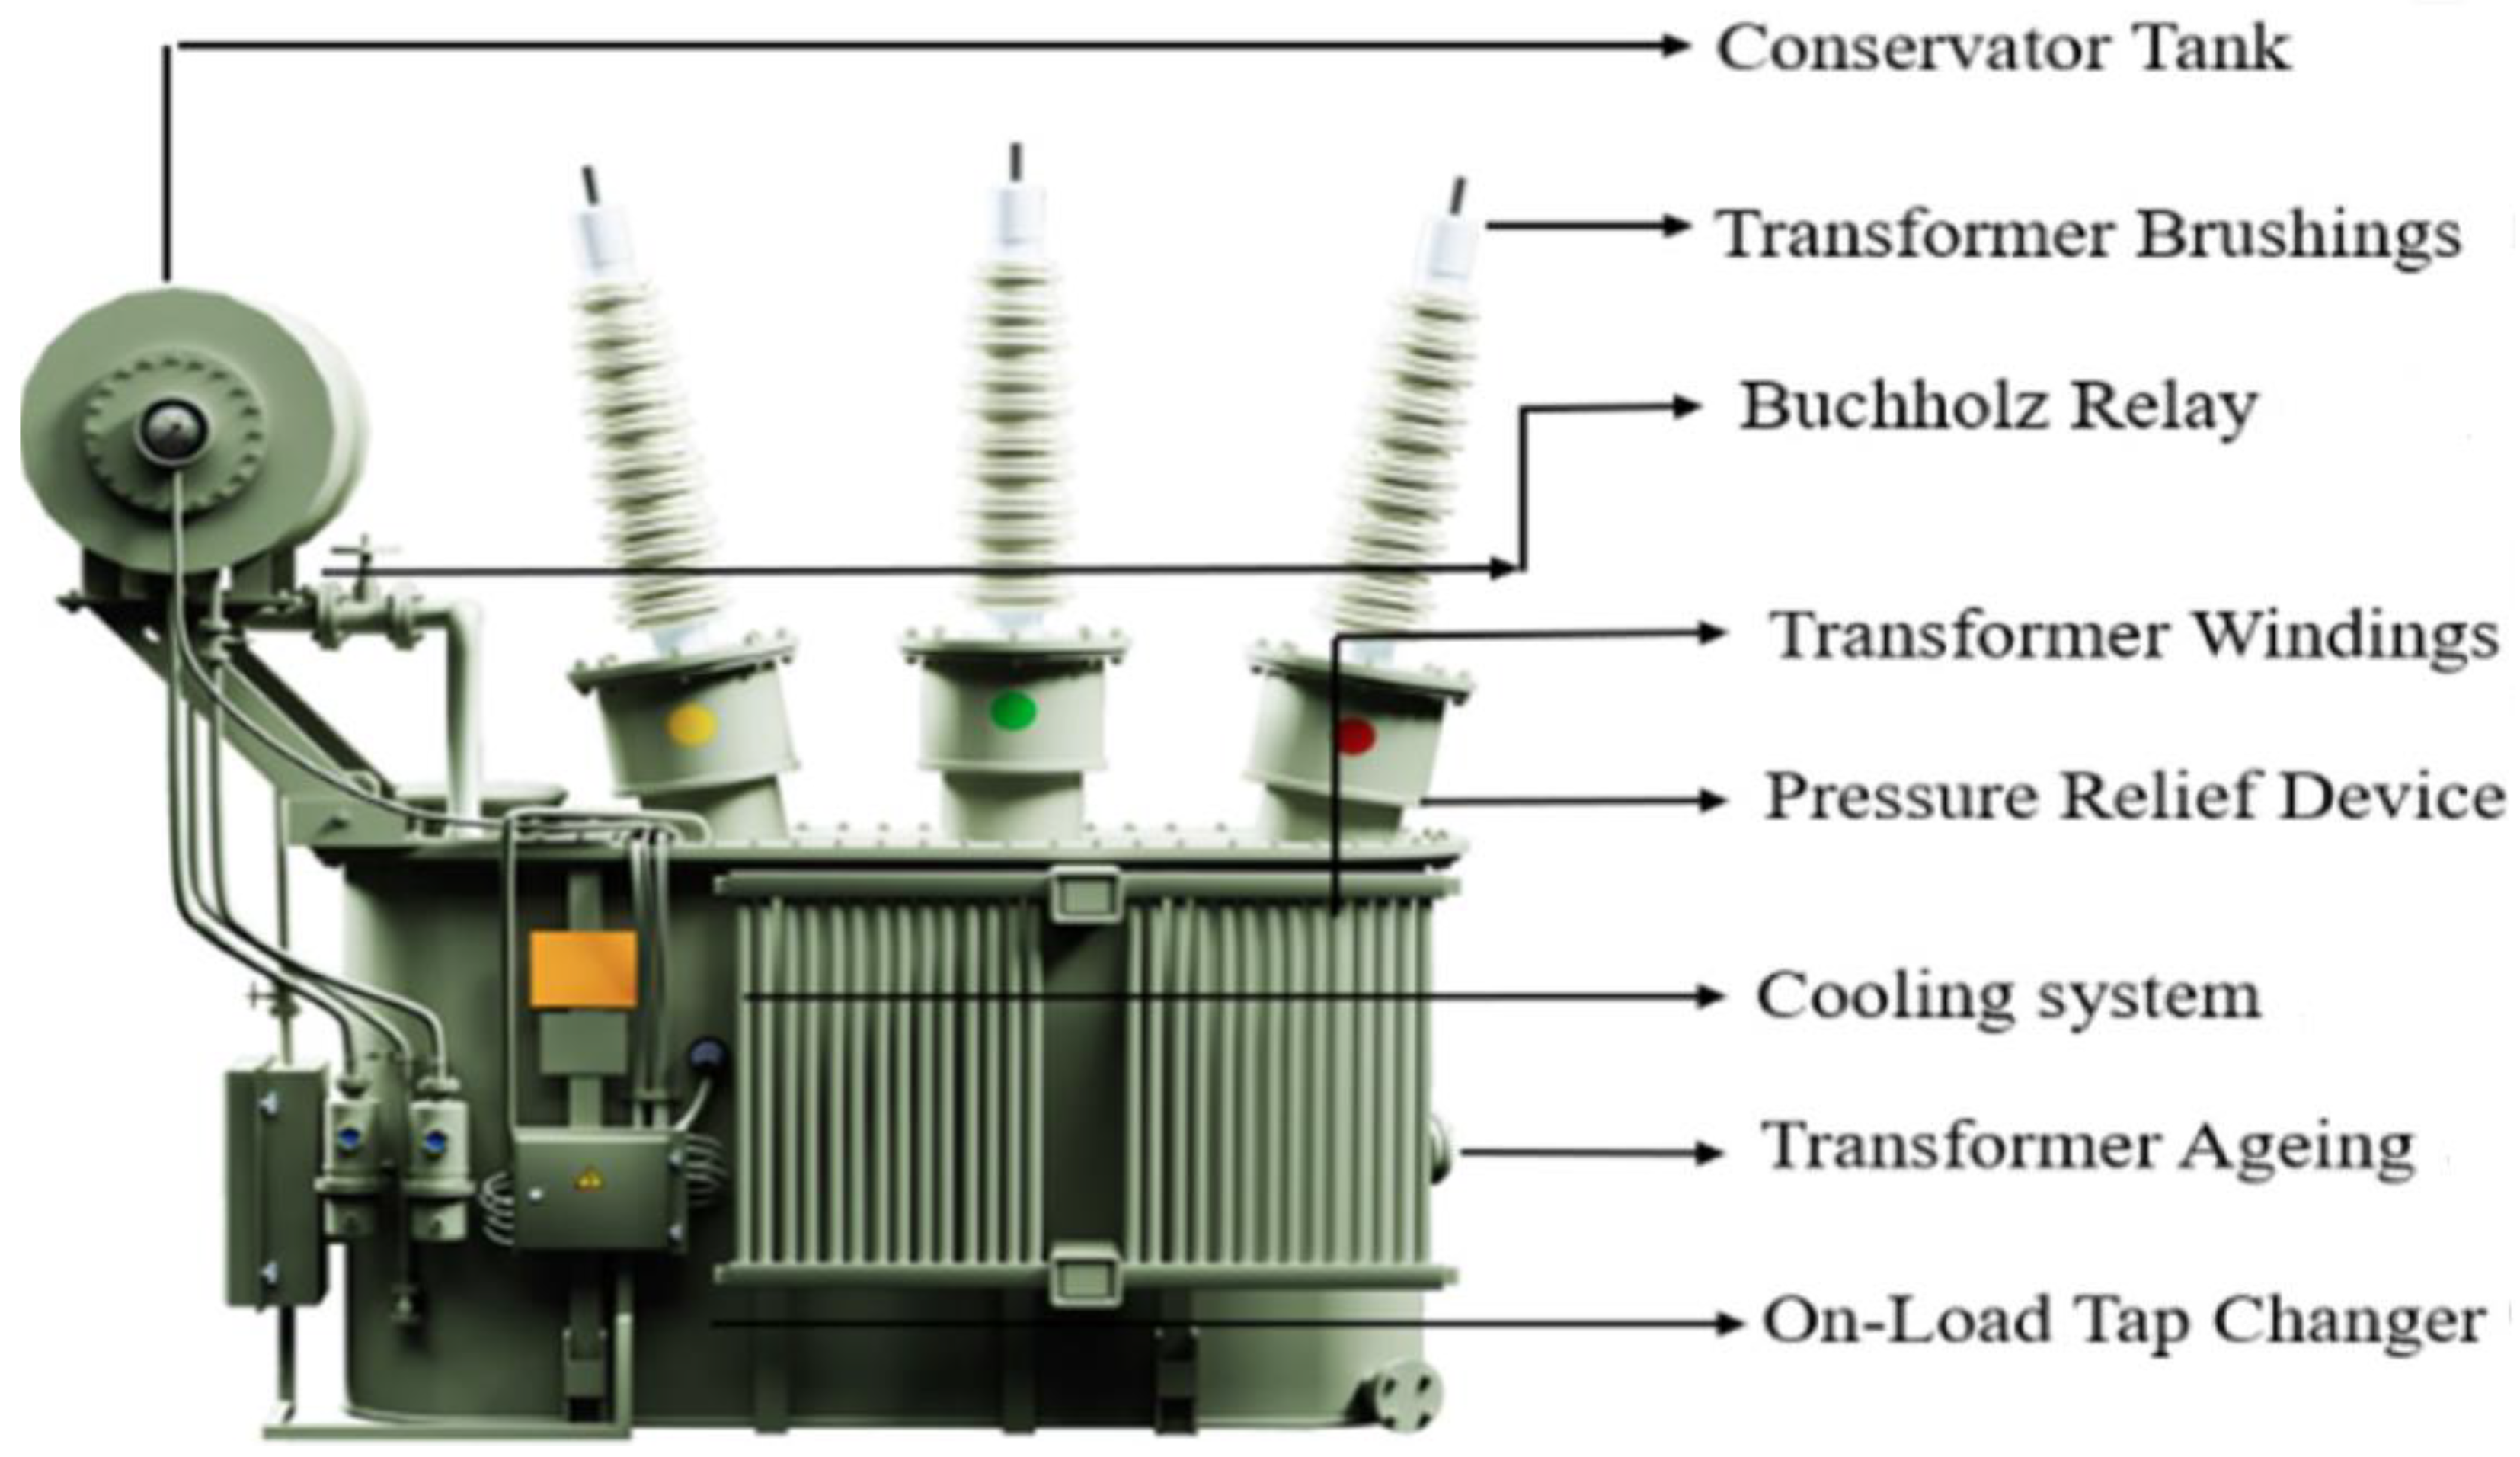
2. Common Transformer Failures
2.1. Core
2.2. Winding
2.3. Tank
2.4. Solid Insulation
2.5. Insulation Oil
2.6. Bushings
3. Model Description
- Regression algorithms: Linear and non-linear regression algorithms can be used to predict when a transformer component is likely to fail using multiclass classification [55] or ANN [56]. These algorithms can analyze historical data from sensors and other sources to identify patterns that indicate a component is nearing the end of its useful life.
- Deep Learning: Deep learning algorithms, such as convolutional neural networks and recurrent neural networks, can be used to analyze sensor data and predict when a transformer component is likely to fail [61]. These algorithms can learn to detect patterns in the data that are not visible to humans [62].
- Anomaly Detection: Unsupervised ML algorithms such as One-Class SVM, Isolation Forest, and Autoencoder can be used to detect anomalies in the data, indicating a failure [63]. These algorithms can detect patterns in the data that are not visible to humans.
- Predictive modeling: Predictive modeling algorithms such as the Markov Chain Monte Carlo (MCMC) [64] and Bayesian networks [65] can be used to predict the remaining useful life of transformer components. These algorithms use probabilistic models to estimate the likelihood of a failure occurring [66].
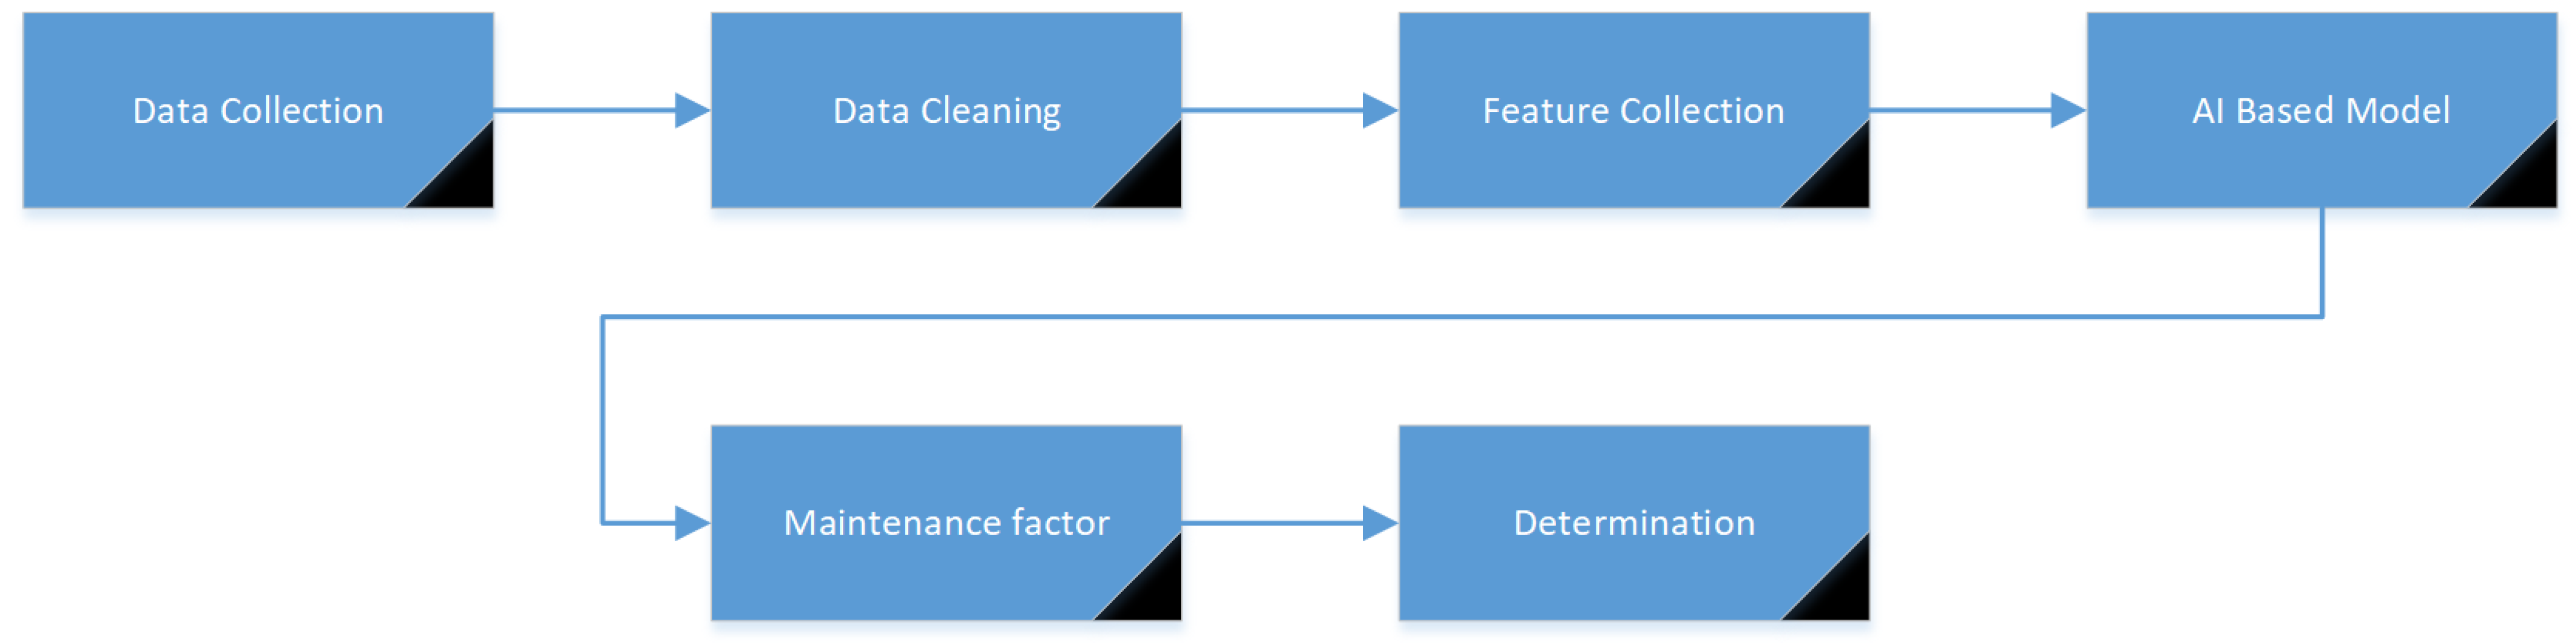
- Data collection: Collect data from sensors and other sources that can be used to train the k-means clustering algorithm. This data could include information about the transformer’s operating conditions, such as temperature, voltage, and current, as well as information about the transformer’s components, such as the age and condition of the components. Additionally, these data could include the transformer’s type, the location of its installation, the environmental conditions to which it is exposed, etc.
- Data preprocessing: Prepare the data for use in the k-means clustering algorithm by cleaning and preprocessing them. This includes removing missing or duplicate data, normalizing the data, and transforming them into a format that can be used by the algorithm.
- Feature selection: Select the features that will be used by the k-means clustering algorithm to group similar transformer components together. This includes selecting a subset of the available features or creating new features by combining or transforming existing features.
- Clustering: Apply the k-means clustering algorithm to the preprocessed data to group similar transformer components together. The algorithm partitions the data into k clusters, where k is the number of clusters chosen.
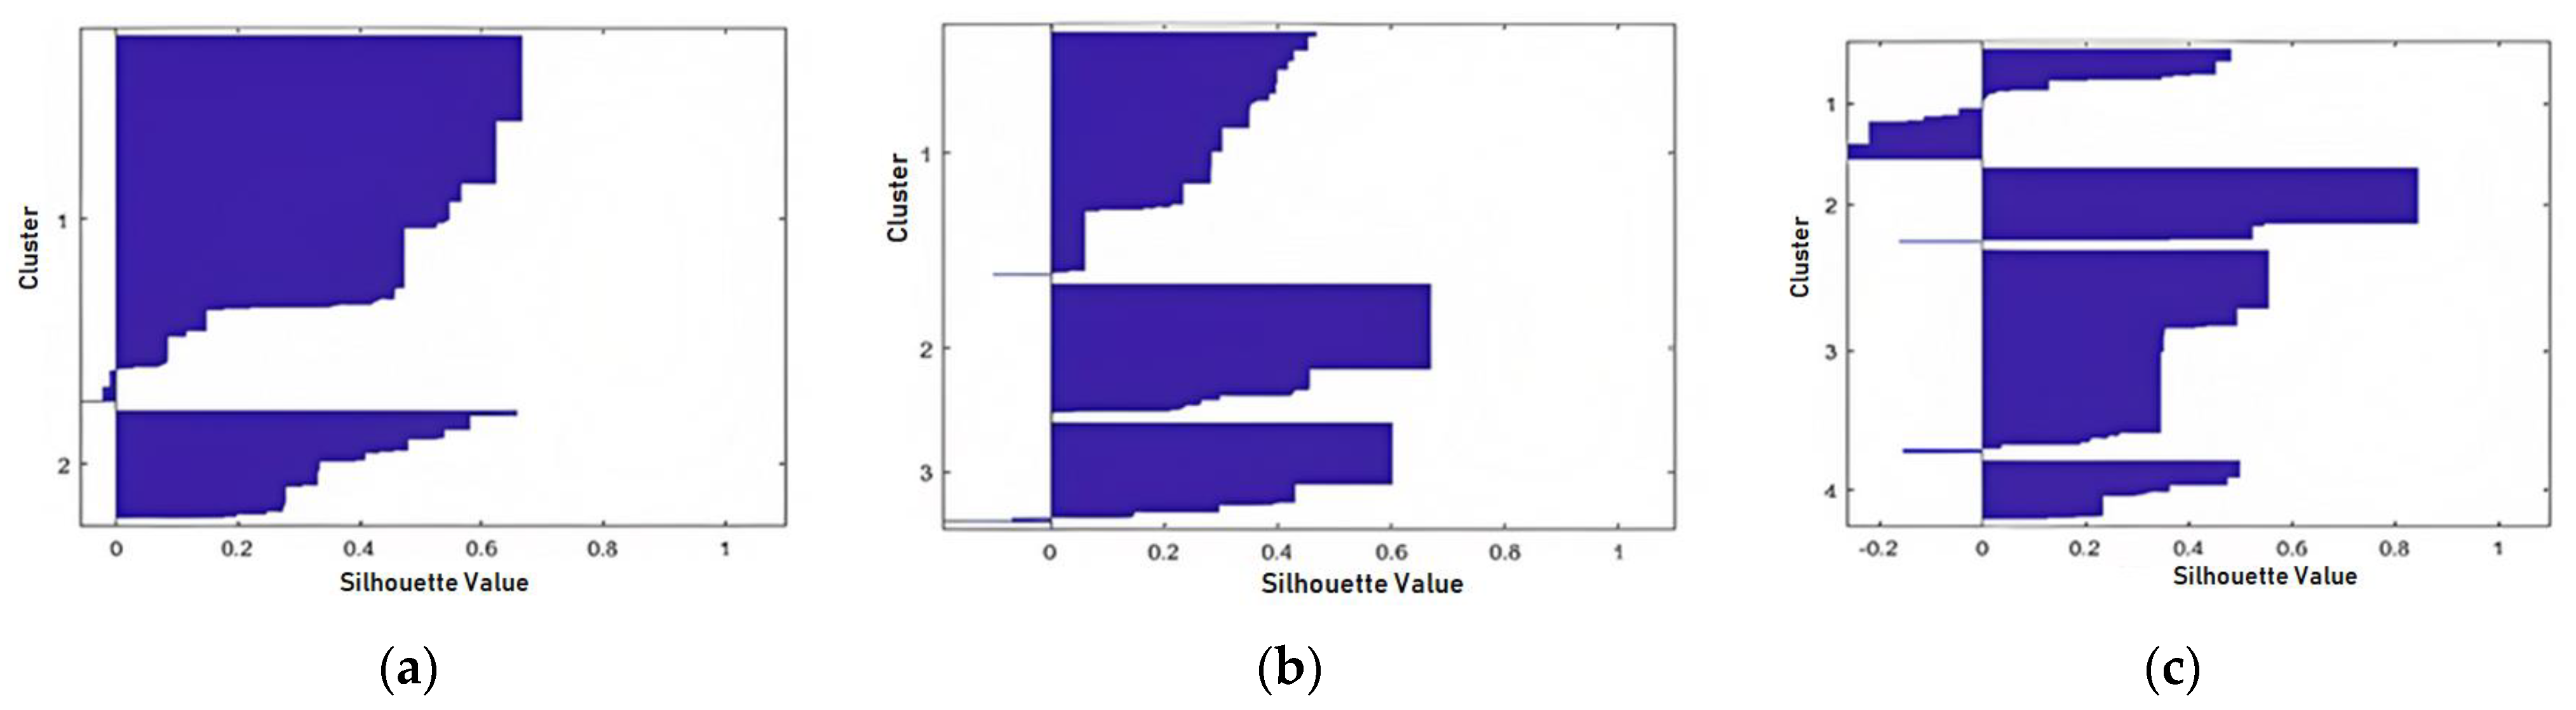
- Cluster evaluation: Evaluate the performance of the k-means clustering algorithm. This can be performed by measuring the quality of the clusters, such as by using the silhouette score, or by comparing the clusters to the labeled data if available.
- Model deployment: Once the model has been trained and evaluated, it is deployed for use in the predictive maintenance process. This includes using the clusters to identify groups of similar transformer components that are likely to fail at the same time, and scheduling maintenance accordingly.
- Model retraining: Retrain the model over time to account for new data and changes in the transformer’s operating conditions. This helps to improve the accuracy of the predictions over time.
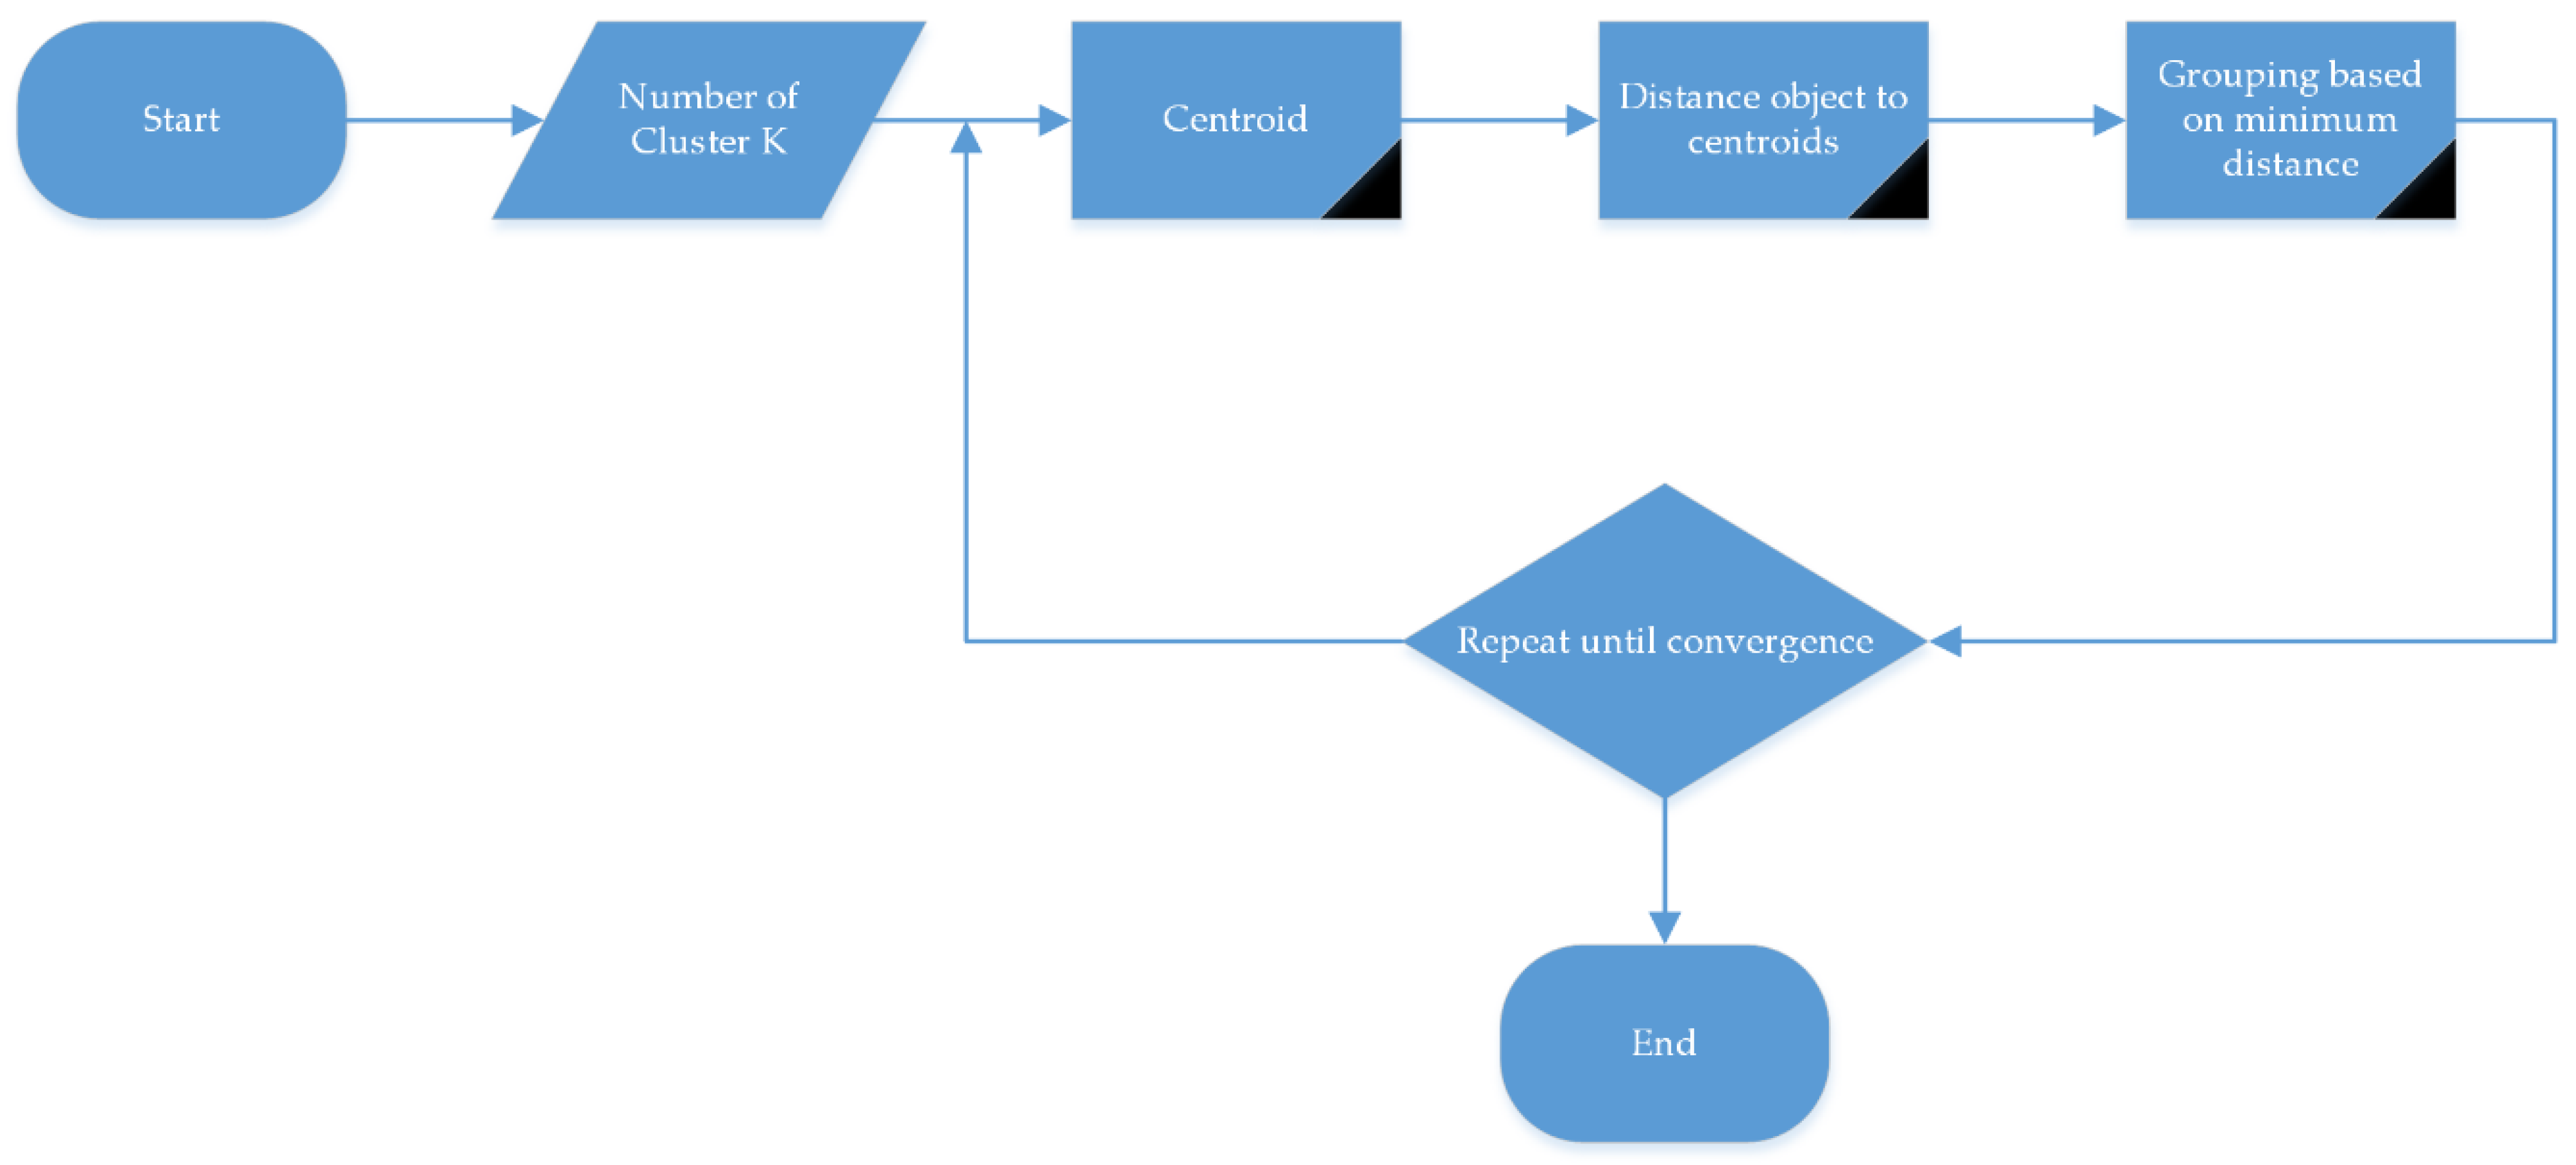
- Initialization: Randomly select k data points as initial centroids.
- Assignment: Assign each data point to the nearest centroid.
- Recalculation: Recalculate the centroid of each cluster.
- Iteration: Repeat steps 2 and 3 until convergence.
- Initialize k centroids randomly: The k centroids are initialized randomly from the data points.
- Assign each data point to the nearest centroid: Each data point is assigned to the cluster whose centroid is closest to it. This can be completed by calculating the Euclidean distance between the data point and each centroid.
- Update the centroids: The centroid of each cluster is updated by taking the mean of all the data points assigned to that cluster.
- Repeat steps 2 and 3 until the centroids do not change anymore or a stopping criterion is reached.
- Initially, k centroids are chosen randomly from the data points. Let the k centroids be represented by c1, c2, …, ck
- Assign each data point x to the closest centroid, which can be represented by:
- Update the centroids by taking the mean of all the data points assigned to that cluster.
- Repeat steps 2 and 3 until the centroids do not change anymore or a stopping criterion is reached.
- Non-linear relationships: The SVM algorithm can capture non-linear relationships between the input features and the output labels, which is useful when dealing with complex systems like transformers.
- Scalability: k-means clustering is computationally efficient and can handle large datasets, making it suitable for industrial applications with large amounts of data.
- Interpretable results: k-means clustering provides interpretable results that can be visualized in the form of clusters, which can help engineers understand the underlying patterns in the data.
- Feature engineering: The performance of the SVM algorithm is highly dependent on the quality and relevance of the input features. This requires significant effort and expertise in feature engineering, which may not be available in all applications.
- Sensitivity to hyperparameters: Both k-means clustering and SVM require tuning of hyperparameters, such as the number of clusters and regularization parameter, respectively. The performance of the model can be sensitive to these hyperparameters, and selecting optimal values requires careful experimentation.
- Limited to labeled data: The SVM algorithm is a supervised learning method and requires labeled data for training. This can be a limitation in applications where labeled data are scarce or expensive to obtain.
4. Distribution Transformers Data at Cauca Department of Colombia
5. AI Methods for Early Transformer Issue Detection
5.1. Support Vector Machines (SVMs)
5.2. k-Means Clustering
6. Maintenance Scheduling for 2021
7. Discussion and Limitations
8. Conclusions
Author Contributions
Funding
Conflicts of Interest
References
- Kulkarni, S.V.; Khaparde, S.A. Transformer Engineering Design, Technology, and Diagnostics, 2nd ed.; CRC Press: Boca Raton, FL, USA, 2013. [Google Scholar]
- Fotis, G.; Vita, V.; Maris, T.I. Risks in the European Transmission System and a Novel Restoration Strategy for a Power System after a Major Blackout. Appl. Sci. 2023, 13, 83. [Google Scholar] [CrossRef]
- Vita, V.; Fotis, G.; Pavlatos, C.; Mladenov, V. A New Restoration Strategy in Microgrids after a Blackout with Priority in Critical Loads. Sustainability 2023, 15, 1974. [Google Scholar] [CrossRef]
- Zafeiropoulou, M.; Mentis, I.; Sijakovic, N.; Terzic, A.; Fotis, G.; Maris, T.I.; Vita, V.; Zoulias, E.; Ristic, V.; Ekonomou, L. Forecasting Transmission and Distribution System Flexibility Needs for Severe Weather Condition Resilience and Outage Management. Appl. Sci. 2022, 12, 7334. [Google Scholar] [CrossRef]
- Forcina, A.; Silvestr, I.L.; Di Bona, G.; Silvestri, A. Reliability allocation methods: A systematic literature review. Qual. Reliab. Eng. Int. 2020, 36, 2085–2107. [Google Scholar] [CrossRef]
- Di Bona, G.; Forcina, A.; Falcone, D. Maintenance strategy design in a sintering plant based on a multicriteria approach. Int. J. Manag. Decis. Mak. 2018, 17, 29–49. [Google Scholar] [CrossRef]
- Di Bona, G.; Cesarotti, V.; Arcese, G.; Gallo, T. Implementation of Industry 4.0 technology: New opportunities and challenges for maintenance strategy. Procedia Comput. Sci. 2021, 180, 424–429. [Google Scholar] [CrossRef]
- Rajendra Prasad, U.; Vyjayanthi, C.; Jaison, K. Modeling and Detection of Inter-turn Faults in Distribution Transformer. In Proceedings of the 2019 8th International Conference on Power Systems (ICPS), Jaipur, India, 20–22 December 2019. [Google Scholar]
- Hashemnia, N.; Abu-Siada, A.; Islam, S. Improved power transformer winding fault detection using FRA diagnostics—Part 1: Axial displacement simulation. IEEE Trans. Dielectr. Electr. Insul. 2015, 22, 556–563. [Google Scholar] [CrossRef]
- Hashemnia, N.; Abu-Siada, A.; Islam, S. Improved power transformer winding fault detection using FRA diagnostics—Part 2: Radial deformation simulation. IEEE Trans. Dielectr. Electr. Insul. 2015, 22, 564–570. [Google Scholar] [CrossRef] [Green Version]
- Rolim, J.R.; Morais, D.R. A hybrid tool for detection of incipient faults in transformers based on the dissolved gas analysis of insulating oil. IEEE Trans. Power Deliv. 2006, 21, 673–680. [Google Scholar]
- Sarkar, S.; Sharma, T.; Baral, A.; Chatterjee, B.; Dey, D.; Chakravorti, S. An expert system approach for transformer insulation diagnosis combining conventional diagnostic tests and PDC, RVM data. IEEE Trans. Dielectr. Electr. Insul. 2014, 21, 882–891. [Google Scholar] [CrossRef]
- Tenbohlen, S.; Coenen, S.; Djamali, M.; Müller, A.; Samimi, M.; Siegel, M. Diagnostic Measurements for Power Transformers. Energies 2016, 9, 347. [Google Scholar] [CrossRef]
- N’cho, J.; Fofana, I.; Hadjadj, Y.; Beroual, A. Review of physicochemical-based diagnostic techniques for assessing insulation condition in aged transformers. Energies 2016, 9, 367. [Google Scholar] [CrossRef]
- Kunicki, M.; Cichon, A.; Borucki, S. Measurements on partial discharge in on-site operating power transformer: A case study. IET Gener. Transm. Distrib. 2018, 12, 2487–2495. [Google Scholar] [CrossRef]
- Christina, A.J.; Salam, M.A.; Rahman, Q.M.; Wen, F.; Ang, S.P.; Voon, W. Causes of transformer failures and diagnostic methods—A review. Renew. Sustain. Energy Rev. 2018, 82, 1442–1456. [Google Scholar]
- Tang, X.; Wang, W.; Zhang, X.; Wang, E.; Li, X. On-Line Analysis of Oil-Dissolved Gas in Power Transformers Using Fourier Transform Infrared Spectrometry. Energies 2018, 11, 3192. [Google Scholar] [CrossRef] [Green Version]
- Faiz, J.; Soleimani, M. Assessment of Computational Intelligence and Conventional Dissolved Gas Analysis Methods for Transformer Fault Diagnosis. IEEE Trans. Dielectr. Electr. Insul. 2018, 25, 1798–1806. [Google Scholar] [CrossRef]
- Agarwal, S. Data Mining: Data Mining Concepts and Techniques. In Proceedings of the 2013 International Conference on Machine Intelligence and Research Advancement, Katra, India, 21–23 December 2013. [Google Scholar] [CrossRef]
- Jiang, Y.; Cukic, B.; Ma, Y. Techniques for evaluating fault prediction models. Empir. Softw. Eng. 2008, 13, 561–595. [Google Scholar] [CrossRef]
- Kesavaraj, G.; Sukumaran, S. A study on classification techniques in data mining. In Proceedings of the 4th International Conference on Computing, Communications and Networking Technologies (ICCCNT), Tiruchengode, India, 4–6 July 2013. [Google Scholar] [CrossRef]
- Gill, P. Electrical Power Equipment Maintenance and Testing, 2nd ed.; CRC Press: Boca Raton, FL, USA, 2009. [Google Scholar]
- Shayesteh, E.; Hilber, P. Reliability-centered asset management using component reliability importance. In Proceedings of the International Conference on Probabilistic Methods Applied to Power Systems (PMAPS), Beijing, China, 16–20 October 2016. [Google Scholar] [CrossRef]
- Biswal, S.; Sabareesh, G.R. Design and development of a wind turbine test rig for condition monitoring studies. In Proceedings of the International Conference on Industrial Instrumentation and Control (ICIC), Pune, India, 28–30 May 2015; pp. 891–896. [Google Scholar]
- Çınar, Z.M.; Abdussalam Nuhu, A.; Zeeshan, Q.; Korhan, O.; Asmael, M.; Safaei, B. Machine Learning in Predictive Maintenance towards Sustainable Smart Manufacturing in Industry 4.0. Sustainability 2020, 12, 8211. [Google Scholar] [CrossRef]
- Erl, T.; Khattak, W.; Buhler, P. Big Data Fundamentals Concepts, Drivers & Techniques; Pearson Education Limited: New York, NY, USA, 2016. [Google Scholar]
- Peres, R.S.; Dionisio Rocha, A.; Leitao, P.; Barata, J. Idarts towards intelligent data analysis and real-time supervision for industry 4.0. Comput. Ind. 2018, 101, 138–146. [Google Scholar] [CrossRef] [Green Version]
- Zhang, K.; Yuan, F.; Guo, J.; Wang, G. A Novel Neural Network Approach to Transformer Fault Diagnosis Based on Momentum-Embedded BP Neural Network Optimized by Genetic Algorithm and Fuzzy c-Means. Arab. J. Sci. Eng. 2016, 41, 3451–3461. [Google Scholar] [CrossRef]
- Yi, J.-H.; Wang, J.; Wang, G.-G. Improved probabilistic neural networks with self-adaptive strategies for transformer fault diagnosis problem. Adv. Mech. Eng. 2016, 8, 1687814015624832. [Google Scholar] [CrossRef] [Green Version]
- Naresh, R.; Sharma, V.; Vashisth, M. An integrated neural fuzzy approach for fault diagnosis of transformers. IEEE Trans. Power Deliv. 2008, 23, 2017–2024. [Google Scholar] [CrossRef]
- Freund, Y.; Schapire, R.E. Experiments with a new boosting algorithm. In Proceedings of the 13th International Conference on International Conference on Machine Learning, ICML, Bari, Italy, 3–6 July 1996; Morgan Kaufmann Publishers: San Francisco, CA, USA; pp. 148–156. [Google Scholar]
- Diego-A Bravo, M.; Laura-I Alvarez, Q.; Carlos-A Lozano, M. Dataset of distribution transformers for predictive maintenance. Data Brief 2021, 38, 107454. [Google Scholar] [CrossRef]
- Alvarez Quiñones, L.I.; Lozano-Moncada, C.A.; Bravo Montenegro, D.A. Machine learning for predictive maintenance scheduling of distribution transformers. J. Qual. Maint. Eng. 2022, 29, 188–202. [Google Scholar] [CrossRef]
- Sambhi, S.; Sharma, H.; Bhadoria, V.; Kumar, P.; Chaurasia, R.; Chaurasia, G.S.; Fotis, G.; Vita, V.; Ekonomou, L.; Pavlatos, C. Economic Feasibility of a Renewable Integrated Hybrid Power Generation System for a Rural Village of Ladakh. Energies 2022, 15, 9126. [Google Scholar] [CrossRef]
- Sun, P.; Sima, W.; Yang, M.; Lan, X.; Wu, J. Study on voltage-number characteristics of transformer insulation under transformer invading non-standard lightning impulses. IEEE Trans. Dielectr. Electr. Insul. 2015, 22, 3582–3591. [Google Scholar] [CrossRef]
- Chen, Z.; Zhou, Q.; Du, B.; Zhang, Y.; Ding, L. Electromagnetic Transient Calculation and Protective Measures of Transformers Under Lightning Overvoltage. IEEE Trans. Dielectr. Electr. Insul. 2022, 29, 718–726. [Google Scholar] [CrossRef]
- Christodoulou, C.A.; Ekonomou, L.; Fotis, G.; Harkiolakis, N.; Stathopulos, I.A. Optimization of Hellenic overhead high voltage transmission lines lightning protection. Energy J. 2009, 34, 502–509. [Google Scholar] [CrossRef]
- Christodoulou, C.A.; Vita, V.; Ekonomou, L. Studies for the more effective protection of MV/LV substations against lightning overvoltages. Int. J. Circuits Electron. 2017, 2, 11–15. [Google Scholar]
- Ekonomou, L.; Fotis, G.; Vita, V.; Mladenov, V. Distributed Generation Islanding Effect on Distribution Networks and End User Loads Using the Master-Slave Islanding Method. J. Power Energy Eng. 2016, 4, 1–24. [Google Scholar] [CrossRef] [Green Version]
- Naim, W.; Hilber, P.; Shayesteh, E. Impact of geomagnetic disturbances on power transformers: Risk assessment of extreme events and data availability. Life Cycle Reliab. Saf. Eng. 2022, 11, 11–18. [Google Scholar] [CrossRef]
- Abi-Samra, N.C.; Forsten, K.R.; Entriken, R. Sample Effects of extreme weather on power systems and components part I: Sample effects on distribution systems. In Proceedings of the IEEE PES General Meeting, Minneapolis, MN, USA, 25–29 July 2010; pp. 1–3. [Google Scholar] [CrossRef]
- Adewumi, O.B.; Fotis, G.; Vita, V.; Nankoo, D.; Ekonomou, L. The Impact of Distributed Energy Storage on Distribution and Transmission Networks’ Power Quality. Appl. Sci. 2022, 12, 6466. [Google Scholar] [CrossRef]
- Linhjell, D.T.; Painter, J.; Lundgaard, L.E.; Hansen, W. Aging of oil impregnated paper in power transformers. IEEE Trans. Power Deliv. 2004, 19, 230–239. [Google Scholar] [CrossRef]
- Muhamad, N.A.; Phung, B.T.; Blackburn, T.R.; Lai, K.X. Comparative Study and Analysis of DGA Methods for Transformer Mineral Oil. In Proceedings of the IEEE Lausanne Power Tech, Lausanne, Switzerland, 1–5 July 2007; pp. 45–50. [Google Scholar] [CrossRef]
- Fotis, G.; Vita, V.; Ekonomou, L. Machine Learning Techniques for the Prediction of the Magnetic and Electric Field of Electrostatic Discharges. Electronics 2022, 11, 1858. [Google Scholar] [CrossRef]
- Fotis, G.; Ekonomou, L.; Maris, T.I.; Liatsis, P. Development of an artificial neural network software tool for the assessment of the electromagnetic field radiating by electrostatic discharges. IEE Proc. Sci. Meas. Technol. 2007, 1, 261–269. [Google Scholar] [CrossRef]
- Christodoulou, C.A.; Vita, V.; Voglitsis, D.; Milushev, G.; Ekonomou, L. A heuristic method for the reduction of the outage rate of high-voltage substations due to atmospheric overvoltages. Appl. Sci. 2018, 8, 273. [Google Scholar] [CrossRef] [Green Version]
- Venkataswamy, R.; Rao, K.U.; Meena, P. Internet of things-based metaheuristic reliability centered maintenance of distribution transformers. In IOP Conference Series: Earth and Environmental Science; IOP Publishing Ltd.: Bristol, UK, 2020; Volume 463. [Google Scholar]
- Sarajcev, P.; Jakus, D.; Vasilj, J. Optimal scheduling of power transformers preventive maintenance with Bayesian statistical learning and influence diagrams. J. Clean. Prod. 2020, 258, 120850. [Google Scholar] [CrossRef]
- Abbasi, M.K.; Dezfuli, H. Smart Maintenance Planning for Distribution Transformers Using Discrete-time Markov Chain. In Proceedings of the 26th International Electrical Power Distribution Conference (EPDC), Tehran, Iran, 11–12 May 2022; pp. 8–17. [Google Scholar]
- Xie, H.; Yingjie, T.; Zhu, W.; Zhongyu, H. Heavy overload forecasting of distribution transformers based on neural network. In Proceedings of the 2019 International Conference on Computer Science Communication and Network Security (CSCNS2019), Sanya, China, 22–23 December 2019; Volume 309. [Google Scholar]
- Yang, Z.; Liu, J.; Chen, Z. Numerical analysis of transformer temperature based on computational fluid dynamics. J. Eng. Thermophys. 2018, 39, 2187–2191. [Google Scholar]
- Ameli, A.; Agheb, M.; Jafari, M. Assessment of transformer insulation life using finite element method. IEEE Trans. Dielectr. Electr. Insul. 2019, 26, 1234–1244. [Google Scholar]
- Babaei, E.; Rashidi, R. A numerical model for predicting partial discharge inception voltage in power transformers. High Volt. 2019, 4, 154–159. [Google Scholar]
- Huang, G.; Zhou, H.; Ding, X.; Zhang, R. Extreme Learning Machine for Regression and Multiclass Classification. IEEE Trans. Syst. Man Cybern. Part B Cybern. 2012, 42, 513–529. [Google Scholar] [CrossRef] [PubMed] [Green Version]
- Xiao, Z.; Liang, S.; Wang, J.; Chen, P.; Yin, X.; Zhang, L.; Song, J. Use of General Regression Neural Networks for Generating the GLASS Leaf Area Index Product from Time-Series MODIS Surface Reflectance. IEEE Trans. Geosci. Remote Sens. 2014, 52, 209–223. [Google Scholar] [CrossRef]
- Scornet, E. Random forests and Kernel methods. IEEE Trans. Inf. Theory 2016, 62, 1485–1500. [Google Scholar] [CrossRef] [Green Version]
- Breiman, L. Random forests. Mach. Learn. 2001, 45, 5–32. [Google Scholar] [CrossRef] [Green Version]
- Natekin, A.; Knoll, A. Gradient boosting machines, a tutorial. Front. Neurorobotics 2013, 7, 21. [Google Scholar] [CrossRef] [Green Version]
- Li, X.; Bai, R.B. Freight Vehicle travel time prediction using gradient boosting regression tree. In Proceedings of the 2016 15th IEEE International Conference on Machine Learning and Applications, Anaheim, CA, USA, 18–20 December 2016; IEEE: Piscataway, NJ, USA, 2016; pp. 1010–1015. [Google Scholar]
- LeCun, Y.; Bengio, Y.; Hinton, G. Deep learning. Nature 2015, 521, 436–444. [Google Scholar] [CrossRef]
- Espadoto, M.; Hirata, N.S.T.; Telea, A.C. Deep learning multidimensional projections. Inf. Vis. 2020, 19, 247–269. [Google Scholar] [CrossRef]
- Mokhtari, S.; Abbaspour, A.; Yen, K.K.; Sargolzaei, A. A Machine Learning Approach for Anomaly Detection in Industrial Control Systems Based on Measurement Data. Electronics 2021, 10, 407. [Google Scholar] [CrossRef]
- López-Gonzales, J.L.; Castro Souza, R.; Leite Coelho da Silva, F.; Carbo-Bustinza, N.; Ibacache-Pulgar, G.; Calili, R.F. Simulation of the Energy Efficiency Auction Prices via the Markov Chain Monte Carlo Method. Energies 2020, 13, 4544. [Google Scholar] [CrossRef]
- Nam, S.; Hur, J. Probabilistic Forecasting Model of Solar Power Outputs Based on the Naïve Bayes Classifier and Kriging Models. Energies 2018, 11, 2982. [Google Scholar] [CrossRef] [Green Version]
- Mosavi, A.; Salimi, M.; Faizollahzadeh Ardabili, S.; Rabczuk, T.; Shamshirband, S.; Varkonyi-Koczy, A.R. State of the Art of Machine Learning Models in Energy Systems, a Systematic Review. Energies 2019, 12, 1301. [Google Scholar] [CrossRef] [Green Version]
- Mohanty, S.; Subudhi, B. A critical appraisal of performance metrics for machine learning based predictive models: A survey. Artif. Intell. Rev. 2019, 51, 93–129. [Google Scholar]
- Saxena, A.; Celaya, J.R.; Saha, B. Machine learning-based remaining useful life prediction techniques for equipment maintenance: A review. Mech. Syst. Signal Process. 2018, 104, 799–834. [Google Scholar]
- Kovalenko, I.; Bozhko, S. Fault diagnosis of power transformers based on artificial neural networks. Electr. Eng. 2019, 101, 943–952. [Google Scholar]
- Tsai, M.F.; Lin, C.Y.; Chen, Y.C. Estimation of the remaining life of transformers using an adaptive neuro-fuzzy inference system. Energies 2014, 7, 2925–2937. [Google Scholar]
- Bravo, M.; Diego, A.; Lozano, C.; Alvarez, L. Dataset of Distribution Transformers at Cauca Department (Colombia). Mendeley Data 2021, 4. [Google Scholar] [CrossRef]


| Name of Variable | Type of Variable | Short Description | |||
|---|---|---|---|---|---|
| Binary | Continuous | Categorical | |||
| 1 | 0 | ||||
| Location | Urban area | Rural area | - | - | Location of the transformer |
| Power [kVA] | - | - | X | - | Transformer capacity |
| Self-protection | Self-protected | Not self-protected | - | - | Inbuilt switch for low voltage (LV) protection in the transformer or not |
| Average earth discharge density [Rays/km2 year] | - | - | X | - | Typical annual rate of lightning strikes per km2 |
| Maximum earth discharge density [Rays/km2 year] | - | - | X | - | The annual average for lightning strikes per km2 |
| Burning rate | - | - | X | - | The quantity of component failures per unit of recording time. |
| Keraunic level criticality | High risk | Low risk | - | - | Variable product of a prior study conducted by other parties on behalf of the distribution company |
| Detachable connectors | There are detachable connectors | No detachable connectors | - | - | Removable medium voltage connectors for easy repair of the transformer |
| Type of clients | - | - | X | Residential, commercial, or industrial consumers | |
| Number of users | - | - | X | - | Number of clients the particular transformer is supplying |
| Electric power not supplied [kWh] | - | - | X | - | The energy that the DSO ceases to sell when the transformer is out of service. |
| Installation type | - | - | X | Indicates whether the installed transformer is in a cabin, in a H-type structure, if it has a macro with an anti-fraud net, if it is a pad mounted type, if it is in a simple pole-type structure, an anti-fraud net pole, a metal tower or others | |
| Air network | Aerial type | Non aerial type | - | - | Identifies if the LV network of the transformers is of the aerial type or not |
| Circuit queue | Position in the terminal | Position in a passing point | - | - | Shows whether the transformer is situated at a circuit’s terminal point within the medium voltage network |
| Length of network [km] | - | - | X | - | Length of the distribution lines that the transformer feeds |
| Burned transformers | Burned | Not burned | - | - | Shows whether the transformer has burned this year |
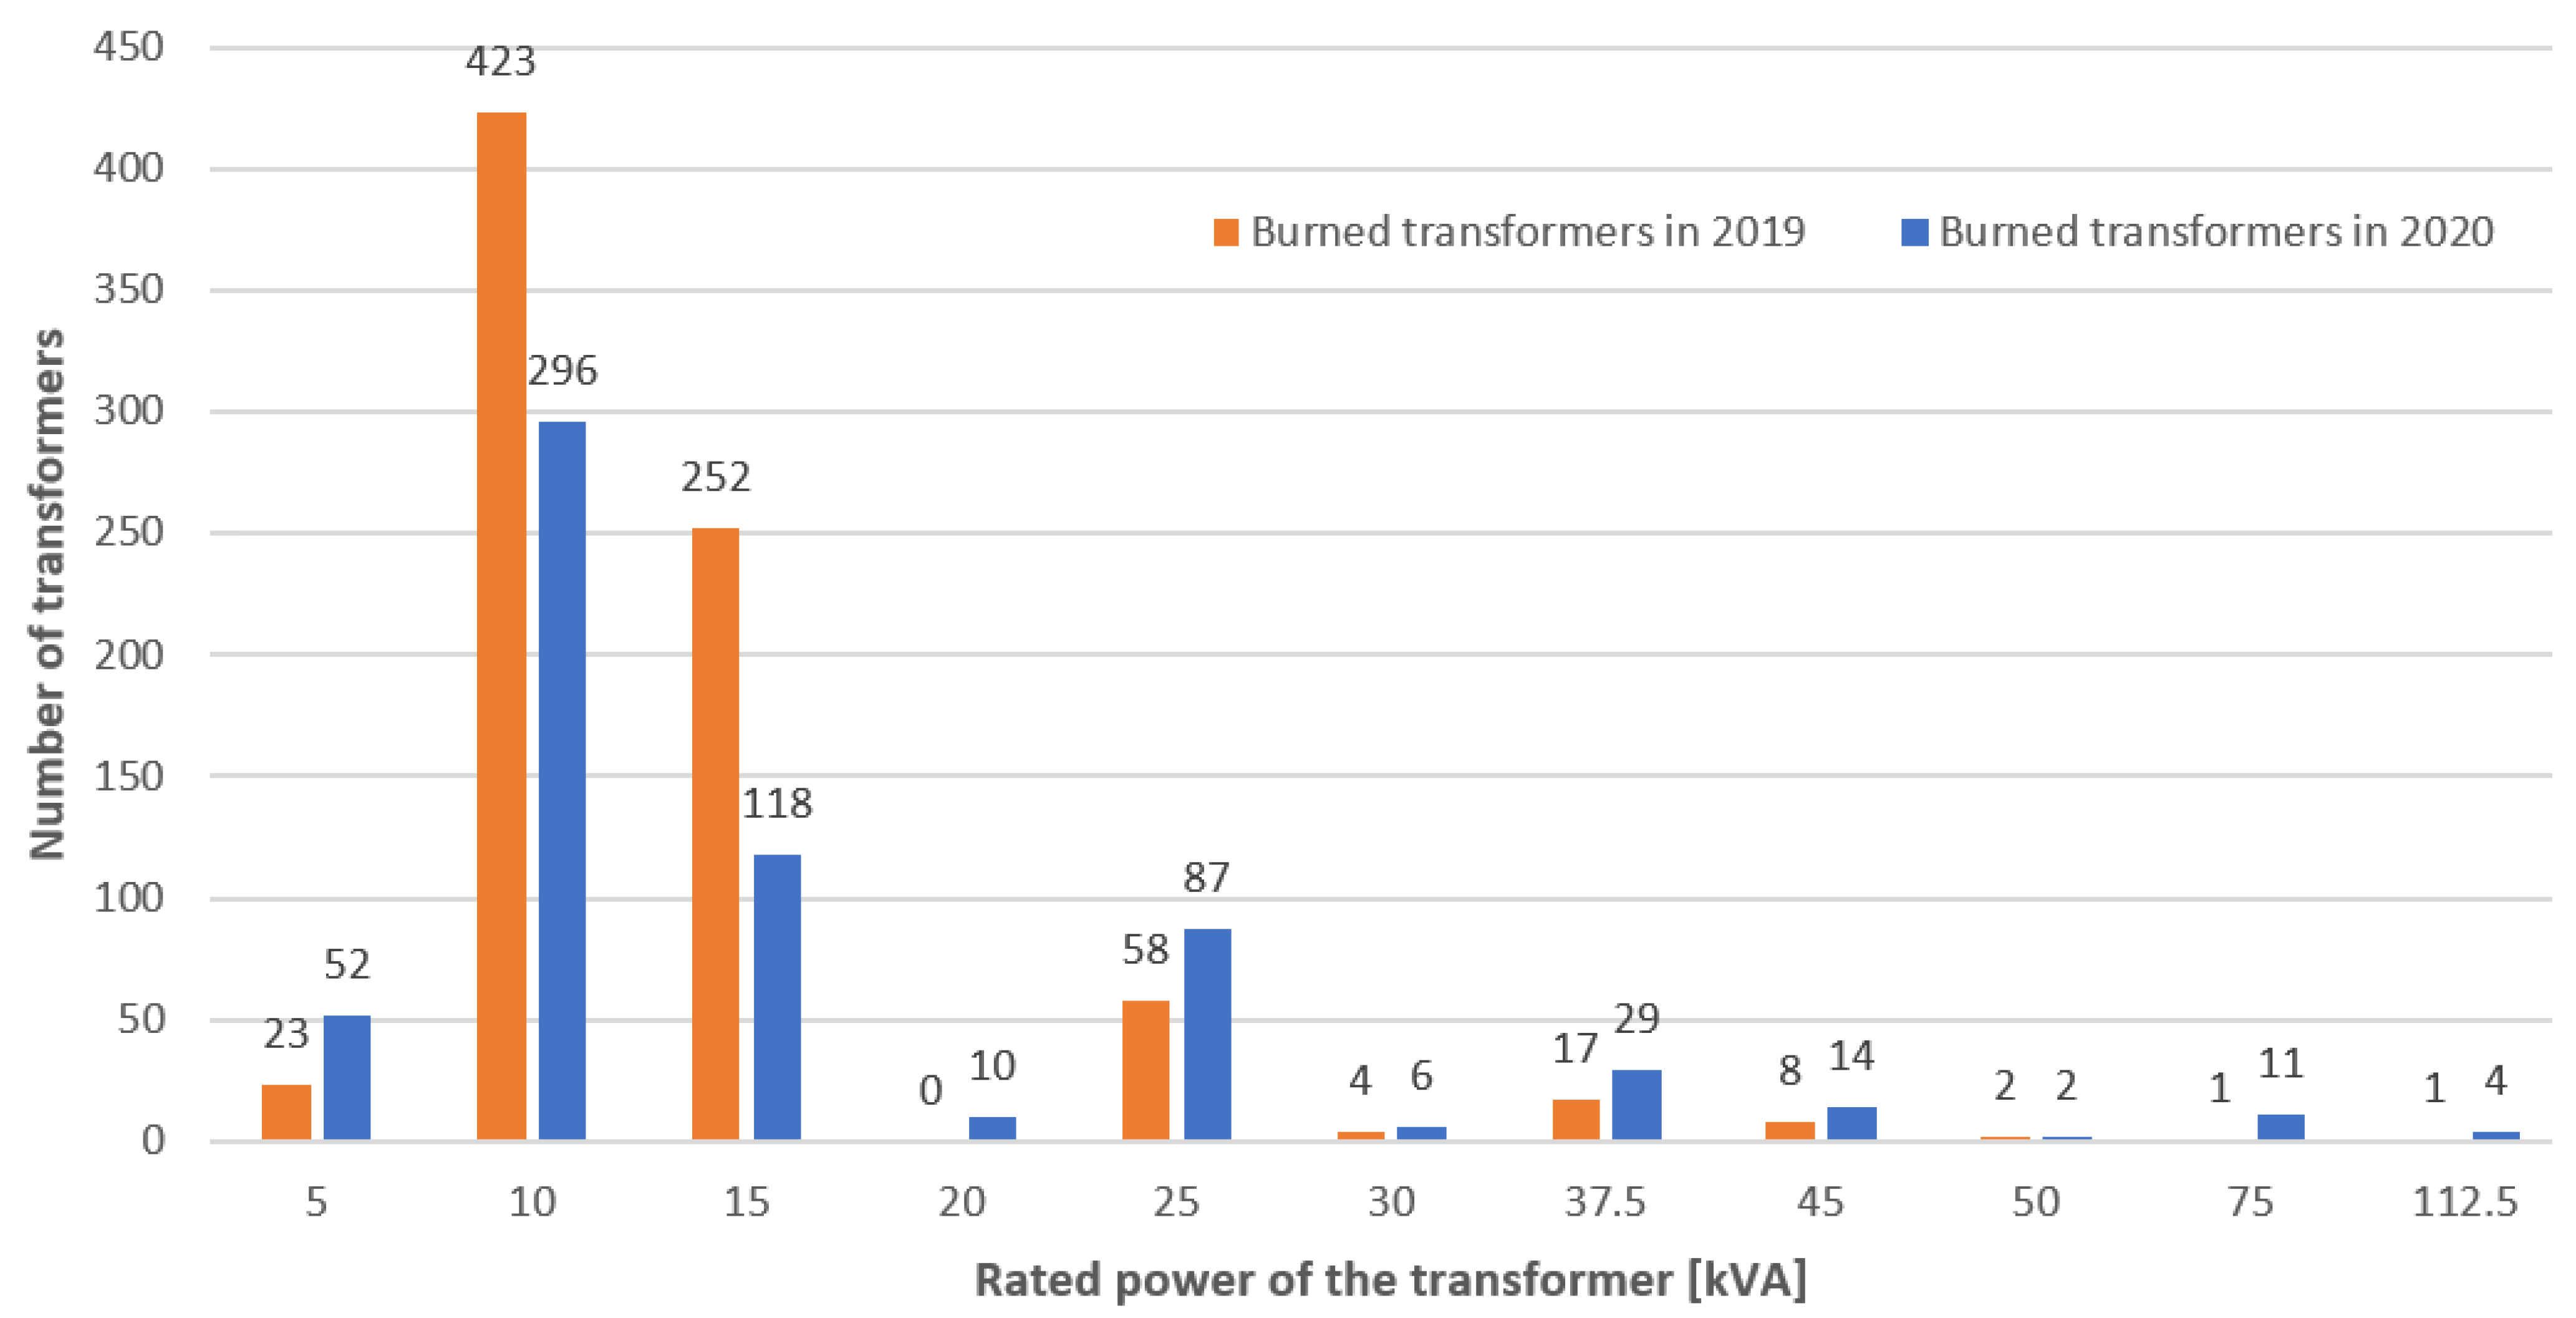
| Rated Power [kVA] | Number of Transformers | Damaged Transformers in 2019 | Damaged Transformers in 2020 |
|---|---|---|---|
| 5 | 1571 | 23 | 52 |
| 10 | 3511 | 423 | 296 |
| 15 | 3981 | 252 | 118 |
| 20 | 13 | 0 | 10 |
| 25 | 2651 | 58 | 87 |
| 30 | 322 | 4 | 6 |
| 37.5 | 1057 | 17 | 29 |
| 45 | 686 | 8 | 14 |
| 50 | 305 | 2 | 2 |
| 75 | 1134 | 1 | 11 |
| 100 | 4 | 0 | 0 |
| 112.5 | 576 | 1 | 4 |
| 125 | 4 | 3 | 0 |
| 150 | 27 | 0 | 0 |
| 200 | 2 | 0 | 0 |
| 225 | 14 | 0 | 0 |
| 250 | 1 | 0 | 0 |
| 300 | 5 | 0 | 0 |
| 400 | 1 | 0 | 0 |
| 500 | 1 | 0 | 0 |
| 630 | 3 | 0 | 0 |
| 1000 | 1 | 0 | 0 |
| 1125 | 1 | 0 | 0 |
| 1250 | 1 | 0 | 0 |
| 2000 | 1 | 0 | 0 |
| Total | 15,873 | 792 | 629 |
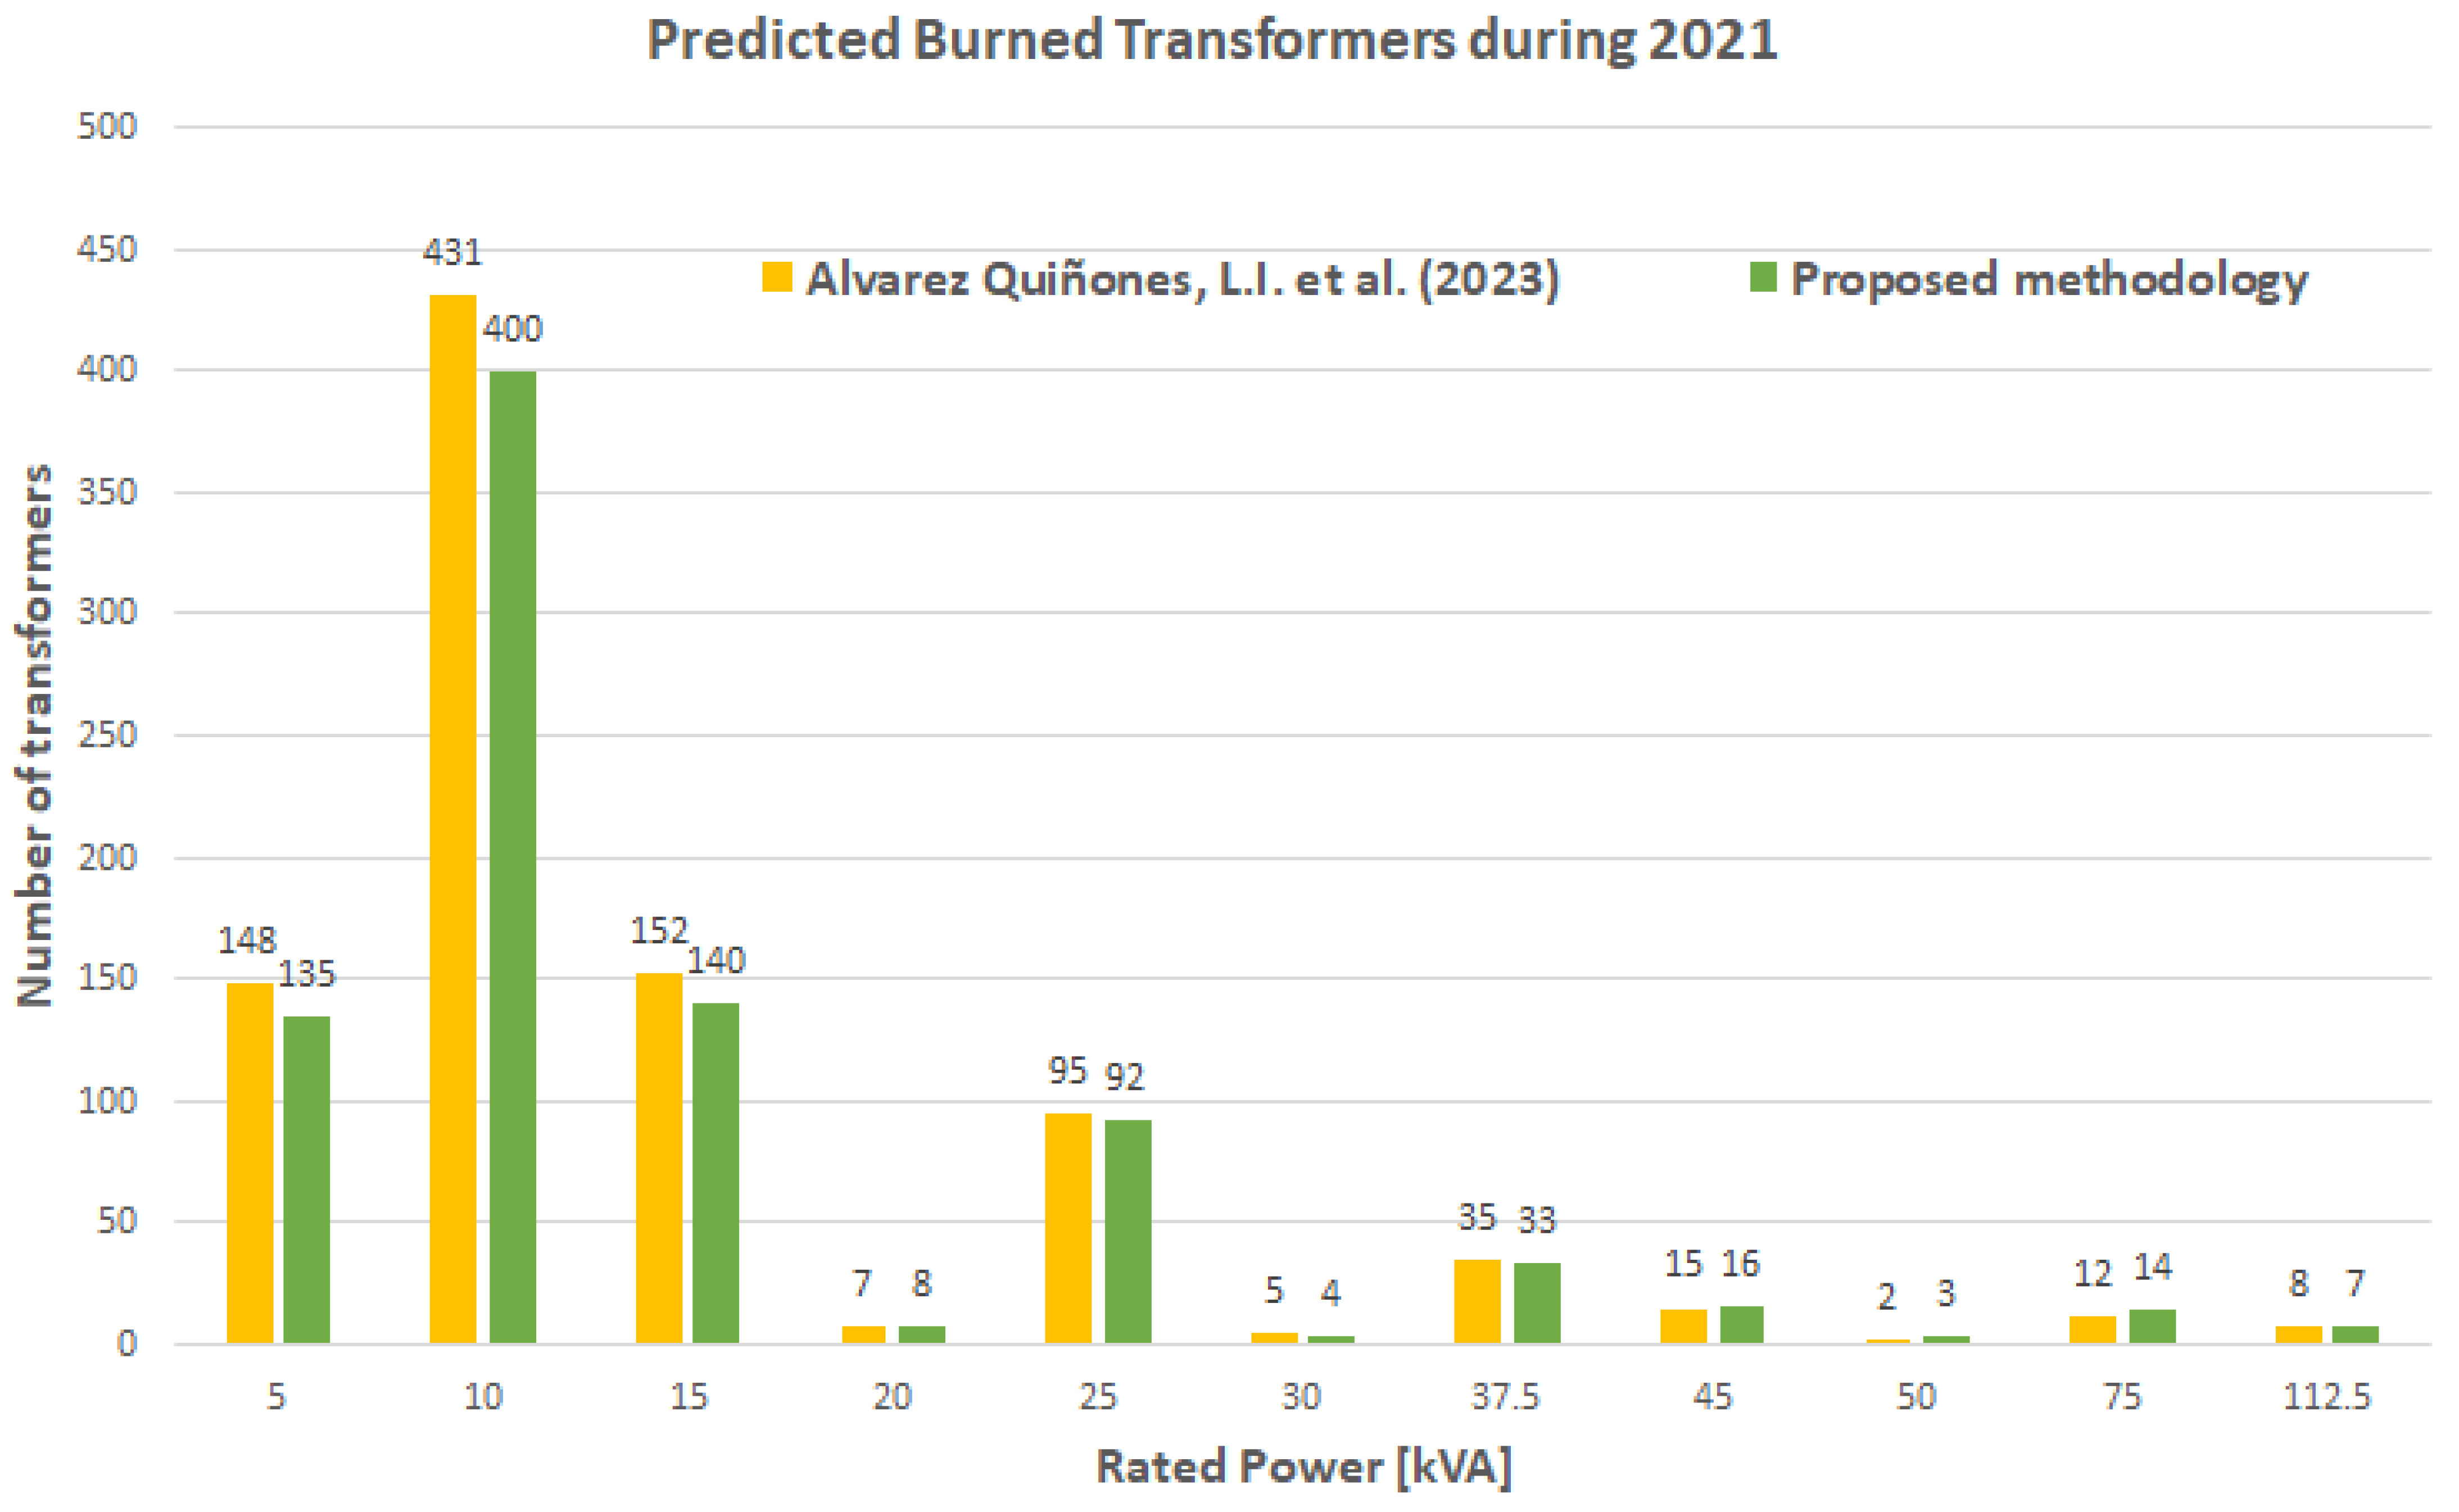
| Rated Power [kVA] | Number of Transformers | Number of Predicted Burned Transformers | |||
|---|---|---|---|---|---|
| Methodology in [33] | Proposed Methodology | ||||
| [%] * | [%] * | ||||
| 5 | 1571 | 148 | 0.93 | 135 | 0.85 |
| 10 | 3511 | 431 | 2.72 | 400 | 2.52 |
| 15 | 3981 | 152 | 0.96 | 140 | 0.88 |
| 20 | 13 | 7 | 0.04 | 8 | 0.05 |
| 25 | 2651 | 95 | 0.60 | 92 | 0.58 |
| 30 | 322 | 5 | 0.03 | 4 | 0.03 |
| 37.5 | 1057 | 35 | 0.22 | 33 | 0.21 |
| 45 | 686 | 15 | 0.09 | 16 | 0.10 |
| 50 | 305 | 2 | 0.01 | 3 | 0.02 |
| 75 | 1134 | 12 | 0.08 | 14 | 0.09 |
| 100 | 4 | 0 | 0.00 | 0 | 0.00 |
| 112.5 | 576 | 8 | 0.05 | 7 | 0.04 |
| 125 | 4 | 0 | 0.00 | 0 | 0.00 |
| 150 | 27 | 0 | 0.00 | 0 | 0.00 |
| 200 | 2 | 0 | 0.00 | 0 | 0.00 |
| 225 | 14 | 0 | 0.00 | 0 | 0.00 |
| 250 | 1 | 0 | 0.00 | 0 | 0.00 |
| 300 | 5 | 0 | 0.00 | 0 | 0.00 |
| 400 | 1 | 0 | 0.00 | 0 | 0.00 |
| 500 | 1 | 0 | 0.00 | 0 | 0.00 |
| 630 | 3 | 0 | 0.00 | 0 | 0.00 |
| 1000 | 1 | 0 | 0.00 | 0 | 0.00 |
| 1125 | 1 | 0 | 0.00 | 0 | 0.00 |
| 1250 | 1 | 0 | 0.00 | 0 | 0.00 |
| 2000 | 1 | 0 | 0.00 | 0 | 0.00 |
| Total | 15,873 | 910 | 5.73 | 852 | 5.37 |
Disclaimer/Publisher’s Note: The statements, opinions and data contained in all publications are solely those of the individual author(s) and contributor(s) and not of MDPI and/or the editor(s). MDPI and/or the editor(s) disclaim responsibility for any injury to people or property resulting from any ideas, methods, instructions or products referred to in the content. |
© 2023 by the authors. Licensee MDPI, Basel, Switzerland. This article is an open access article distributed under the terms and conditions of the Creative Commons Attribution (CC BY) license (https://creativecommons.org/licenses/by/4.0/).
Share and Cite
Vita, V.; Fotis, G.; Chobanov, V.; Pavlatos, C.; Mladenov, V. Predictive Maintenance for Distribution System Operators in Increasing Transformers’ Reliability. Electronics 2023, 12, 1356. https://doi.org/10.3390/electronics12061356
Vita V, Fotis G, Chobanov V, Pavlatos C, Mladenov V. Predictive Maintenance for Distribution System Operators in Increasing Transformers’ Reliability. Electronics. 2023; 12(6):1356. https://doi.org/10.3390/electronics12061356
Chicago/Turabian StyleVita, Vasiliki, Georgios Fotis, Veselin Chobanov, Christos Pavlatos, and Valeri Mladenov. 2023. "Predictive Maintenance for Distribution System Operators in Increasing Transformers’ Reliability" Electronics 12, no. 6: 1356. https://doi.org/10.3390/electronics12061356