Article

A Machine Learning-Based Robust State of Health (SOH) Prediction Model for Electric Vehicle Batteries

1
Beijing Collaboration & Innovation Center for Electric Vehicles, National Engineering Laboratory for Electric Vehicles, School of Mechanical Engineering, Beijing Institute of Technology, Beijing 100081, China
2
Department of Electronics Engineering, Fatima Jinnah Women University Rawalpindi, Old Presidency, Rawalpindi 46000, Pakistan
3
Department of Electrical and Computer Engineering, Memorial University of Newfoundland, 240 Prince Phillips Drive, St. John’s, NL A1B 3X5, Canada
*
Author to whom correspondence should be addressed.
Electronics 2022, 11(8), 1216; https://doi.org/10.3390/electronics11081216
Submission received: 5 March 2022 / Revised: 4 April 2022 / Accepted: 8 April 2022 / Published: 12 April 2022

Abstract

:
The car industry is entering a new age due to electric energy as a fuel in the contemporary era. Electric batteries are being more widely used in the automobile sector these days. As a result, the inner workings of these battery systems must be fully comprehended. There is currently no accurate model for predicting an electric car battery’s state of health (SOH). This study aims to use machine learning to develop a reliable SOH prediction model for batteries. A correct optimal method was also constructed to drive the modeling process in the right direction. Extensive simulations were performed to verify the accuracy of the suggested methodology. A state of health method for data processing was developed. The method involves a complex data-driven model combining Big Data, Artificial Intelligence (A.I.), and the Internet of Things (IoT) technologies. To establish the most effective technique for certifying the actual condition of real-life battery health, researchers compared the accuracy and performance of several states of health models. For improved understanding and prediction of the condition of health behavior, data-driven modeling has certain significant advantages over older methodologies. The methods used in this study can be seen as a revolutionary low-cost, high-accuracy, and dependable approach to understanding and analyzing the state of health of batteries. At first, an intelligent model was created using a data-driven modeling strategy. Secondly, the concurrent battery data are qualified using the data-driven model. The machine learning (ML) method creates a very accurate and dependable model for forecasting battery health in real-world scenarios. Third, the previously established ML model was used to develop a knowledge-based online service for battery health. This web service can be used to test battery health, monitor battery behavior, and perform a variety of other tasks. A variety of similar solutions for diverse systems can be derived using the same technique. The default efficiency of the ML algorithmic module, R-Squared (R2), and Mean Square Error (MSE) were also utilized as performance measures. The R2 as a standard is used to examine the effectiveness of a fit. The result is a value between 0 and 1, with 1 indicating a better model fit. MSE stands for mean squared error. A lower MSE number implies superior model performance, since it reflects how close the parameter estimates are to the actual values. The training set of the battery model had a score of 0.9999, whereas the testing set had a score of 0.9995. The R2 score was one, with an M.S.E. of 0.03. As a result of these three indicators, the data-driven ML model used in this study proved to be accurate.

1. Introduction

The environment is facing major challenges, such as global warming, exacerbated by the widespread use of conventional gasoline in automobiles, which releases tons of CO2 each year [1]. Furthermore, the rising price of crude oil is creating a serious hindrance to the automobile sector, necessitating the development of alternative fueled vehicles. Understanding these challenges and implementing EVs has received a lot of attention and is quickly becoming a useful solution among academic researchers and automotive experts, because they have the potential to lower greenhouse gas (GHG) emissions [2]. The mode of transportation is changing as the number of electric vehicles (EVs) on the road grows. EVs are gaining a lot of popularity due to their success and efficiency in recent years. As many electric car models have only been on the road for a few years, gaining driver trust will take time. Research into the underlying technology of battery management systems (BMSs) has garnered a lot of attention, as electric cars (EVs) have risen in popularity. A battery management system (BMS) was developed to prevent malfunctions and, eventually, catastrophic failures in batteries [3]. The complicated physical–chemical process, on the other hand, is preventing BMSs from being widely used. To improve battery efficiency, the state of charge (SOC), the state of operation (SOF), and the state of health (SOH) should all be continuously monitored in the BMS [4]. Estimating battery capacity is without a doubt one of the most crucial duties for BMS. [5]. Range anxiety, which is induced by the battery’s variable state of health (SOH) and remaining useful life (RUL), is one of the key factors limiting the adoption of electric cars (EVs). In the BMS, these two components are crucial. To begin with, the BMS should be able to estimate battery state-of-charge (SOC), swift power availability, and battery state-of-health (SOH) metrics, such as power fade, energy decline, and response to changing cell characteristics when the battery cells package change.
A battery management system requires an accurate assessment of battery states. SOH has been defined in various ways, including calendar life, cycle life, power fading, and so on [6]. The SOH of the battery is affected by several factors. The magnitude of the charge/discharge current, ambient temperature, discharge depth, charge control system, over-charge and over-discharge, storage type, and length are all considered. A few experiments have been conducted to determine the battery SOH in the literature. In some research, the impedance calculation approach was used [7], whereas, in others, the battery power was calculated to evaluate the battery SOH [8]. The usage of rechargeable batteries in EV applications has gained popularity in recent years [9]. Lithium-ion batteries are believed to be the most promising energy source due to their high capacity and energy density [10]. In addition to their high energy density (23–70 Wh/kg), Li-ion batteries have very high performance (about 90%) and a reasonable cycle life (3000 cycles at 80 percent depth of discharge). During both cycling and storage, battery capacity fades, and resistance increases as happens with most battery systems. This technology, however, is still fragile and is impeded by a host of aspects, including protection [11], cost [12], recycling, and infrastructure charges. Understanding battery aging mechanisms, as well as safety concerns, is critical for more accurate lifetime forecasts and increased battery efficiency [13]. The most difficult task is to discover aging mechanisms. Many influences from the environmental atmosphere, as well as the charge and discharge modes, interact to produce different aging results. This makes aging comprehension a great challenge, and several studies have attempted to investigate the evidence over the years [14].
The most common method is “coulomb counting,” which involves a simple integration of current over time to estimate SOH [15]. It necessitates periodic calibration, which cannot be accomplished in real time [16]. The aging estimation problem was modeled with Equation (1), with an input ‘u’ (state vector) and an output ‘y’ (voltage), both dependent on variables ‘x’.
{ x = A x + B u y = C x }
This research focuses on applying an optimal Machine Learning (ML) technique to create and develop a robust model based on experimental battery data. This study’s method is sufficient to demonstrate the suggested battery model’s accuracy and robustness over existing models. Contributions include the following:
I.
The electric battery’s SOH model is resilient as a result of this research.
II.
The model behavior is accurate.
III.
Real-world battery systems can be analyzed and monitored using the model.
The rest of the study is organized as follows.
In Section 2, we present the proposed method in detail. Discussions of the comparative results are provided in Section 3. Section 4 concludes the study and suggests options for future research.

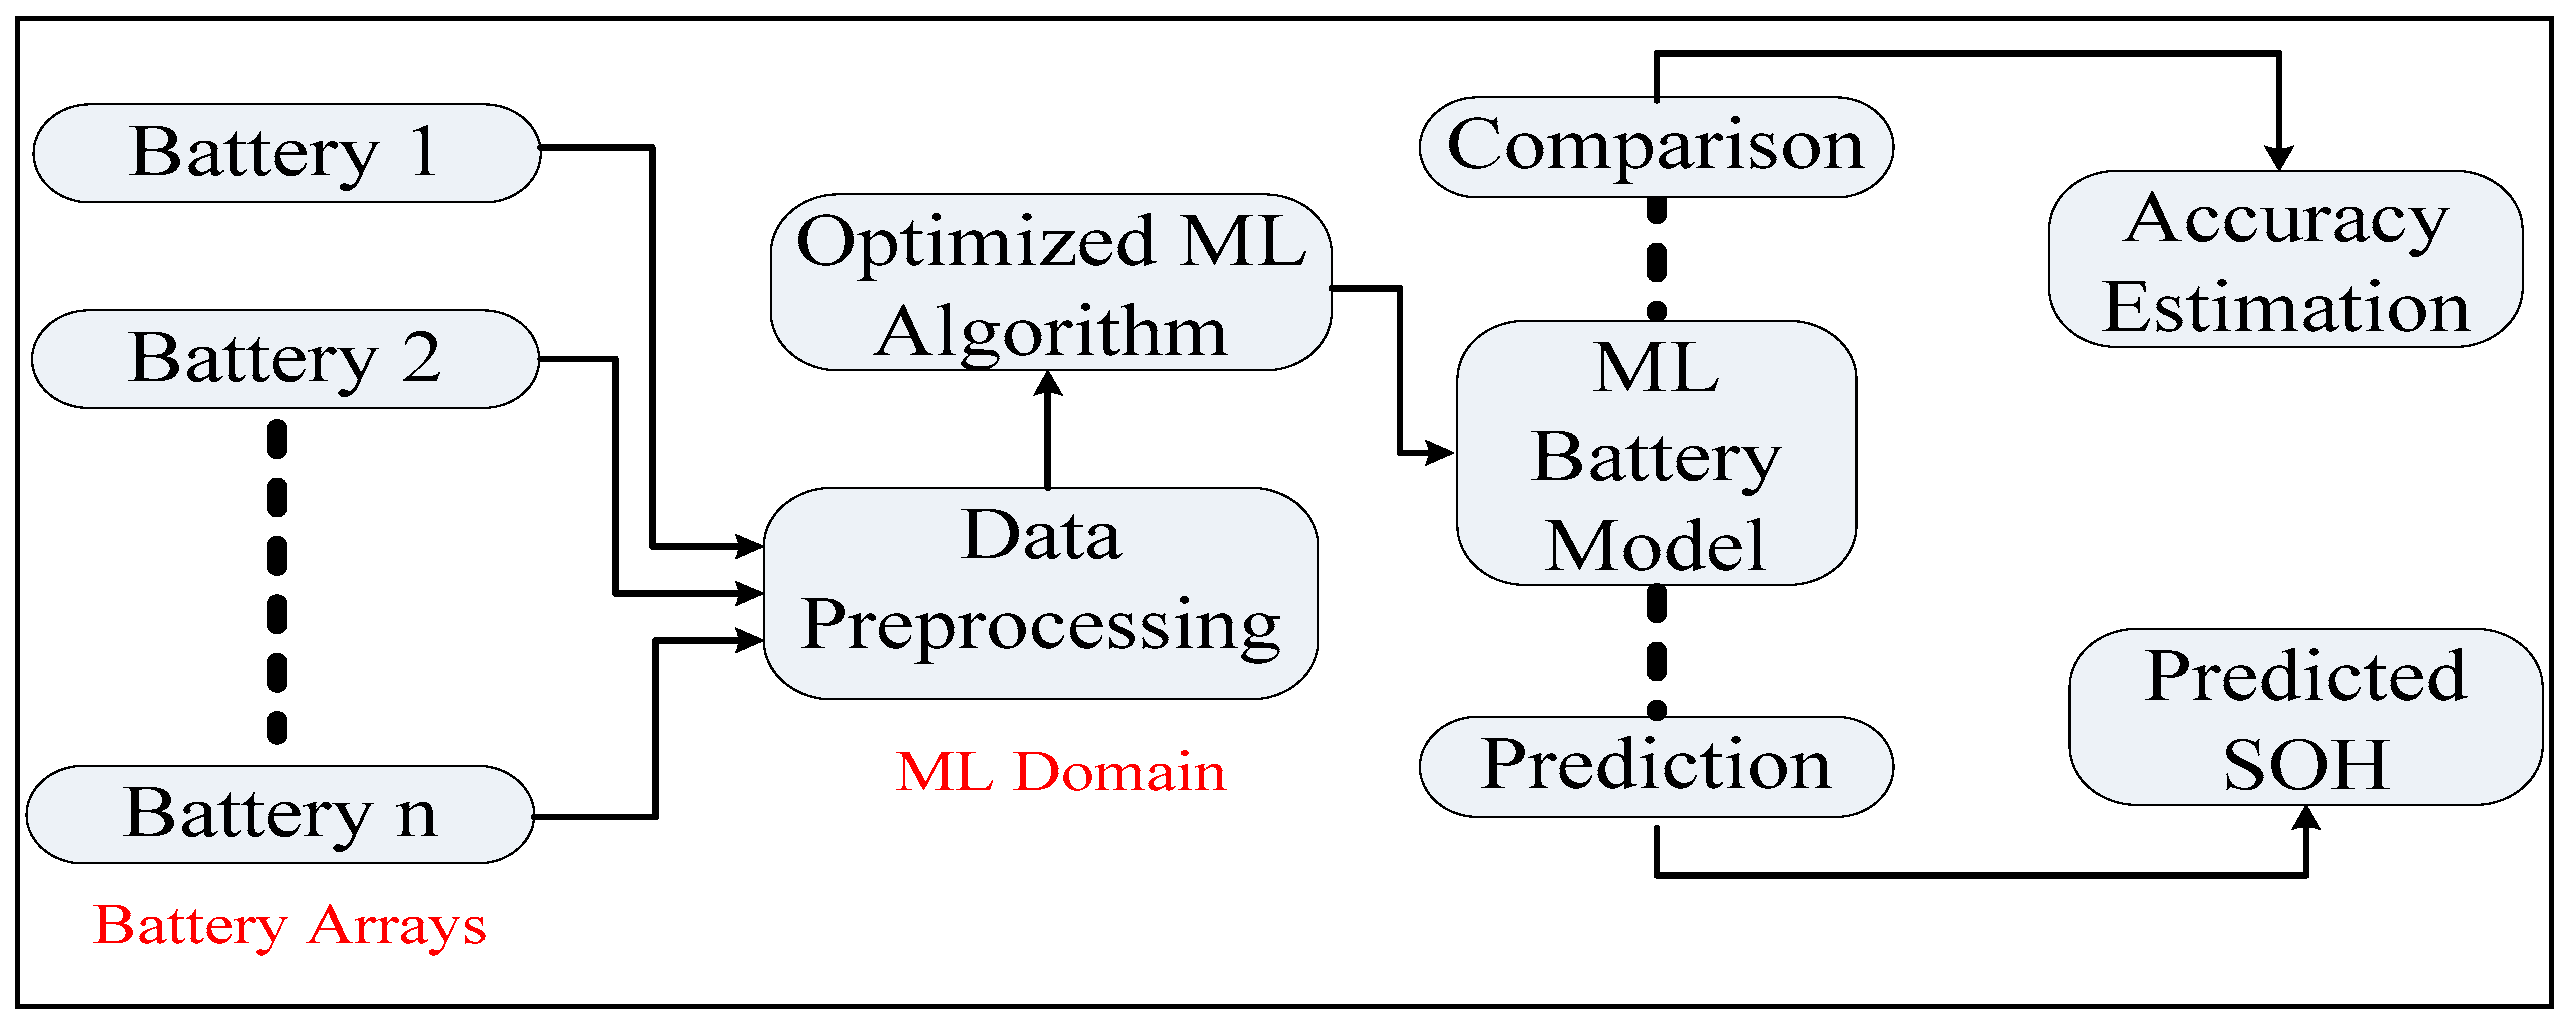
2. An Overview of the Proposed Method
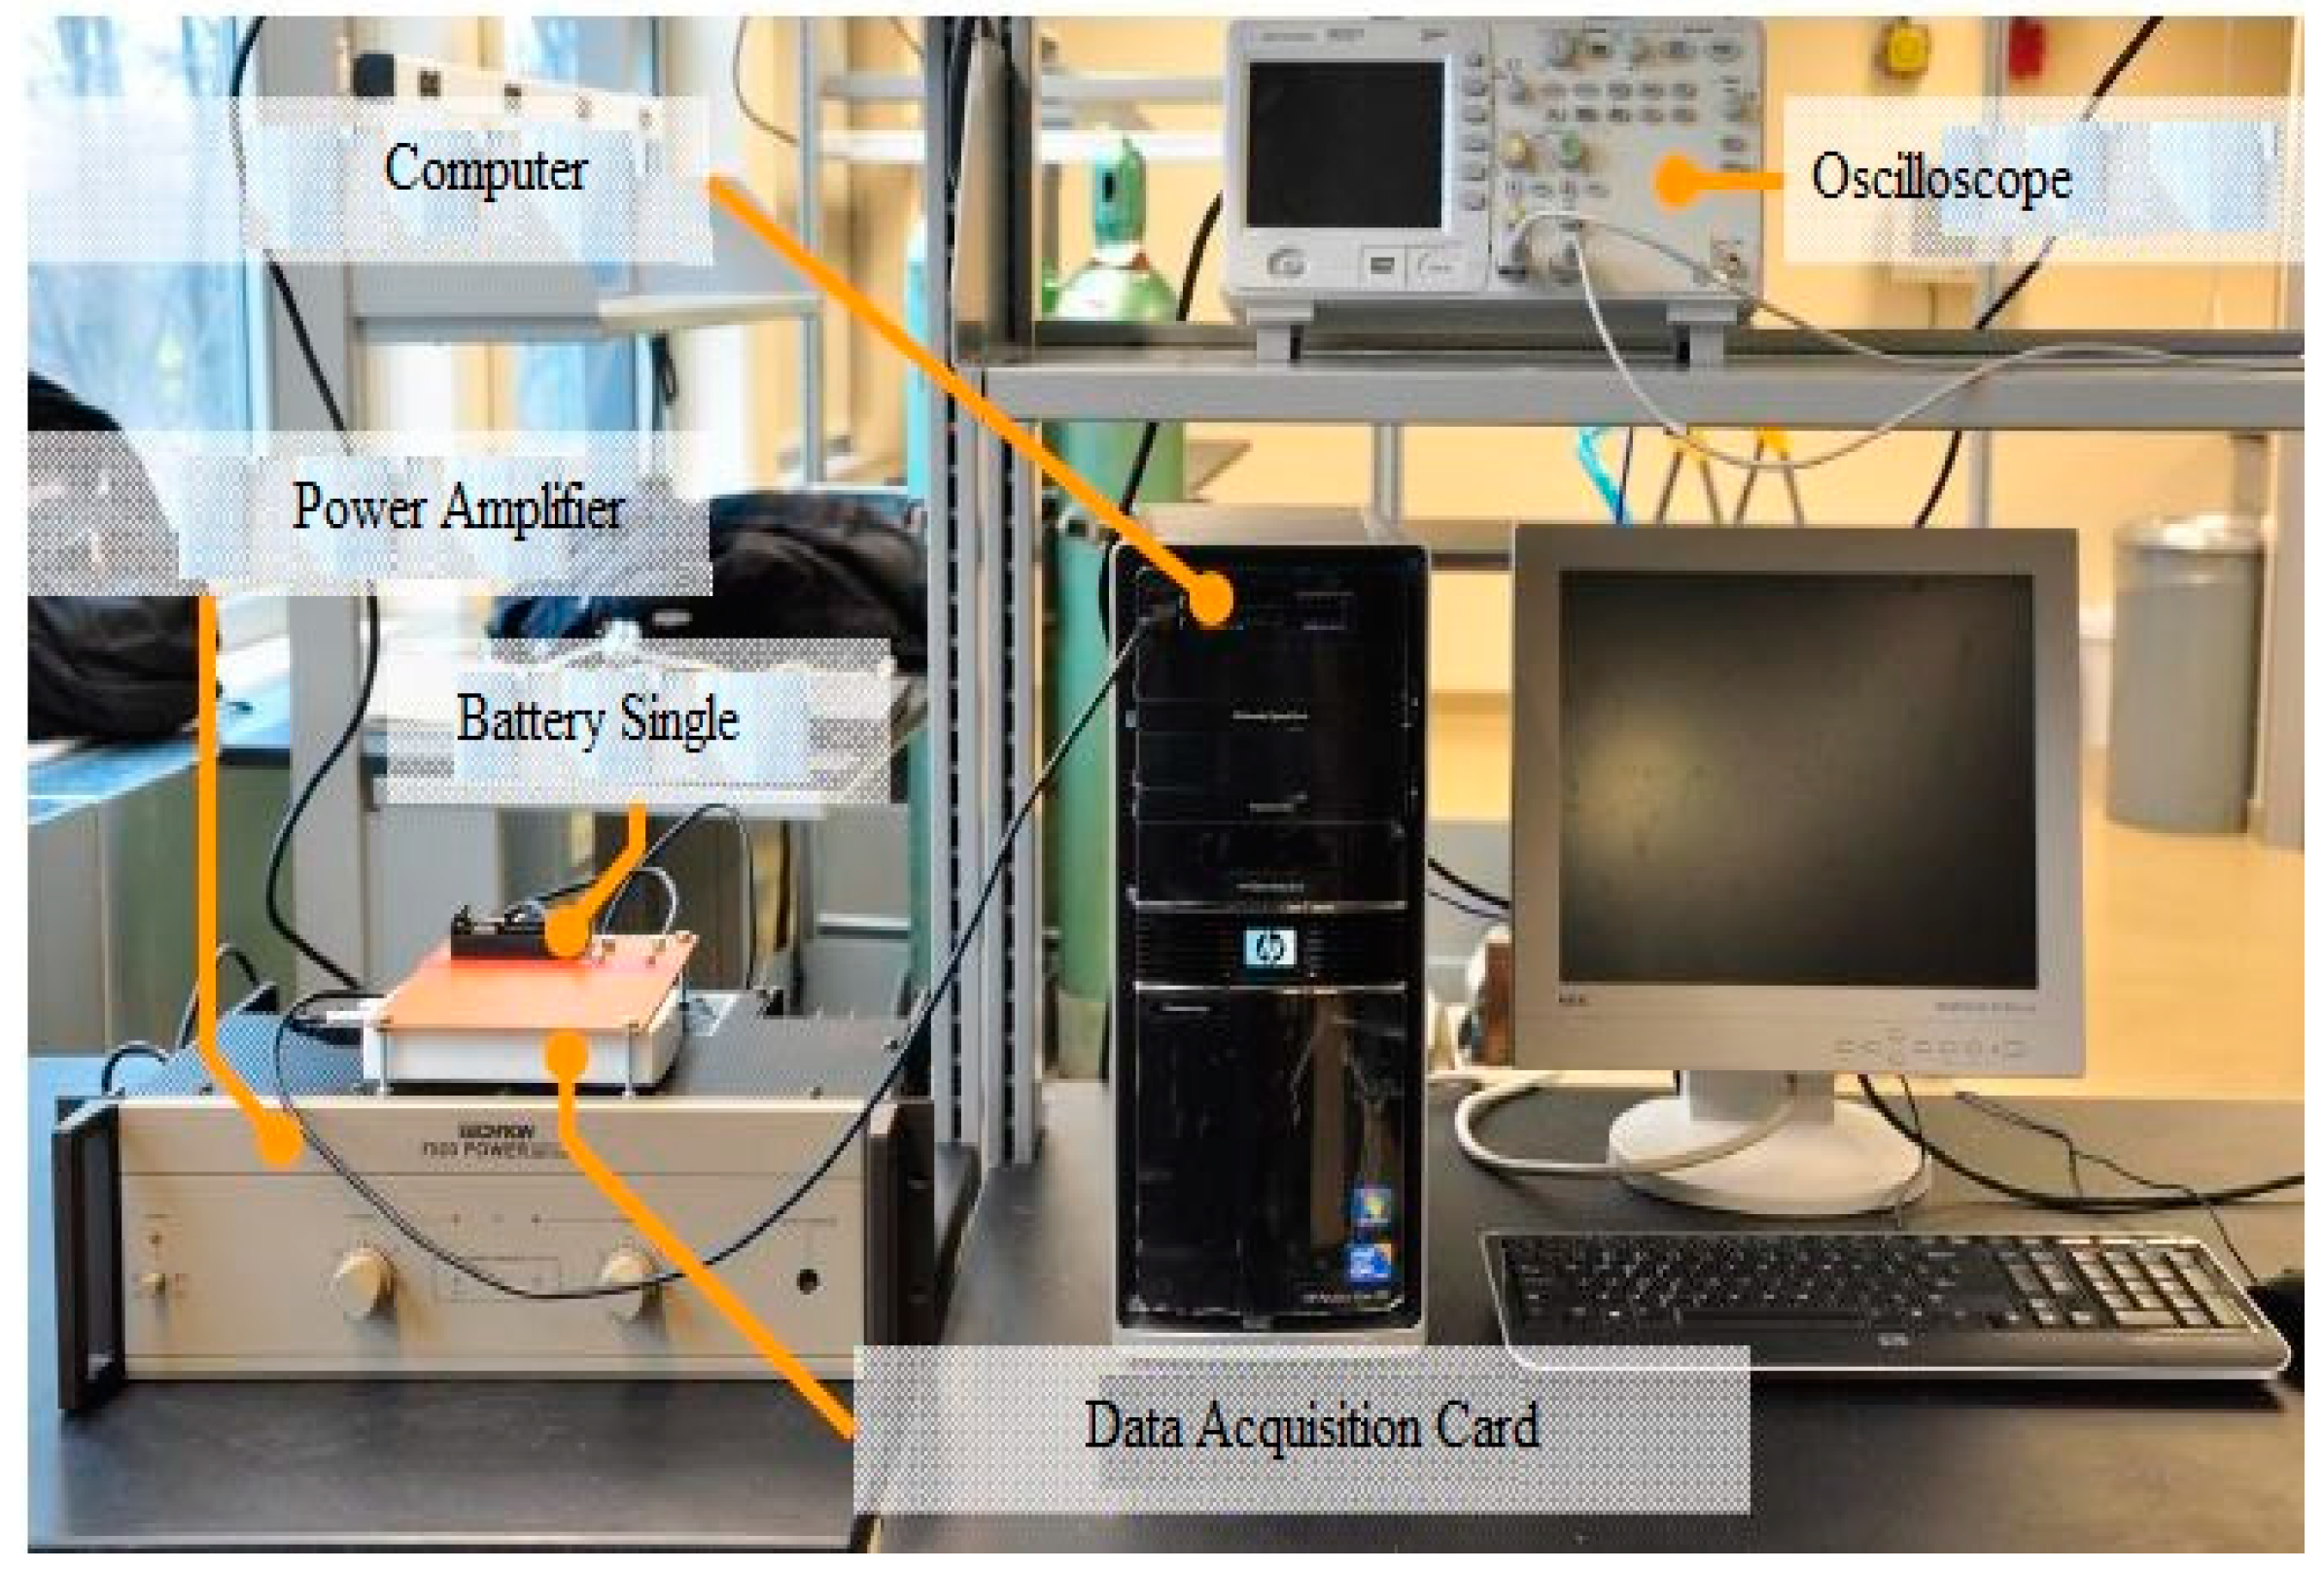
This study helps to identify a novel approach toward rapid data modeling employing a data-driven ML-based approach. With experimental, realtime, or simulated results, the output models are reliable in robust battery state of health prediction. Resources including a high-end computer, battery testing data, and ML systems were used to construct the SOH model for the battery system. The schematic of the ML modeling procedure is shown in Figure 1. The algorithm guided the overall process, and the following is a complete description of the implementation approach.

2.1. Hardware

A computer with an i5 7th generation processor with 8 CPUs, NVIDIA GeForce G.T.X. 850Ti GPU, and 8 G.B. of RAM was used to conduct the ML process. This computer acted as the data accumulator server and data processor.

2.2. Battery Arrays

The battery arrays mentioned in this study were retrieved from the data source [University of Michigan]. In this study, battery 25, 26, and 27 data were used to build the model. A respective model was created to understand their behavior in the battery systems. A compact model was also developed to understand their combined behavior in the system.

2.3. Machine Learning (ML) Domain

The ML domain represented the whole ML system. The ML system consisted of a built-in data preprocessing unit and ML algorithmic module. This study used the optimized algorithm from a set of algorithms available in the ML module. The algorithm optimization system found the algorithm to create the model from battery data.

2.3.1. Data Preprocessing

A customized data preprocessing system was also developed in this study. The SOH data were not experimentally generated. A relevant script was written to derive SOH data from the charging capacity of the experimental data. The SOH was calculated using Equation (2), given below.
SOH j = Q m a x j Q r a t e d
where SOH j , Q m a x j and Q r a t e d are the state of health, the maximum capacity in specific cycle j, and the rated capacity, respectively.

2.3.2. ML Algorithm Optimization

To use algorithms on a trial and test basis from the ML algorithmic domain, it is wise to test the algorithm’s performance capability against the data available before using it. This study used algorithmic optimization techniques to obtain the best algorithm from the ML module. The optimization process is an online process for model development. A proper script was written by the author to find the optimum algorithm. The optimization process yielded Classification and Regression Trees (CART) [17] as the optimum algorithm against the battery data used in this study. Thus, the CART algorithm was used to build a model and further the prediction of battery data. The formal definition of the CART algorithm can be given as follows:
Given training vectors x i R n , i = 1 , , I, and a label vector y R i , a decision tree recursively partitions the feature space such that the samples with the same labels or similar target values are grouped together.
Let the data at node m be represented by Q m   and   N m samples. For each candidate split θ = ( j , t m ) consisting of a feature j and threshold t m , we partition the data into Q m l e f t ( θ ) and Q m r i g h t ( θ ) subsets.
Q m l e f t ( θ ) = { ( x , y ) | x j < = t m }
Q m r i g h t ( θ ) = Q m \ Q m l e f t ( θ )
The quality of a candidate split of a node m was then computed using an impurity function or loss function H( ), the choice of which depended on the task being solved (classification or regression)
G ( Q m , θ ) = N m l e f t N m H ( Q m l e f t ( θ ) ) + N m r i g h t N m H ( Q m r i g h t ( θ ) )
We selected the parameters that minimized the impurity
θ = arg min θ G ( Q m , θ )
We recursed for subsets Q m l e f t ( θ ) and Q m r i g h t ( θ ) until the maximum allowable depth was reached, N m < min s a m p l e s or N m = 1 .

2.4. ML Battery Model

After successful execution of the algorithm written for ML battery data, the respective ML model for each battery was produced. These ML models were the logical counterpart of the real battery. This model had the capability to show the same behavior as the same battery used in the experiment. The prediction capability was tested and assessed, as described in the following sections.

2.4.1. Prediction

This module tested the prediction capability for the newly built ML battery models. Several prediction tests were performed to obtain the visualization of different criteria. Both SOH and charging capacity were visualized to show their relationship.

2.4.2. Comparison

This module compared the experimental results with the ML model predicted results. A thorough comparison was conducted to assess the error and accuracy of the prediction results. The following Equations (2) and (3) were used to calculate the accuracy and errors involved in each cycle.
CA = 100% modulus (mean (EMLBat)) %
EMLBat = DExp − DPred
where the CA is the comparative accuracy-related the ML battery model, EMLBat is the error involved in the ML battery model, DExp are the battery data taken from the source experiment, and DataPred are the predicted data by the ML battery mode.

2.5. The Operational Algorithm

The proposed data-driven alternative model was based on experimental data from the batteries CH25, CH26, and CH27, and it learned from the data using the machine learning approach. The ML procedures in this work were carried out using Algorithm 1. The machine learning procedure began with loading new datasets into the machine learning application and finished with the export of the ML model and results. Several machine learning algorithms were accessible, but none of them were acceptable for a particular dataset. The algorithm’s suitability and applicability depended on the dataset’s intrinsic values. As a result, before using an algorithm, it was necessary to choose one that would be efficient. A variety of linear and nonlinear techniques, ranging from Linear Regression (LR) to Extra Trees (ET), were investigated in this study. The Boosting Method (BM) was shown to have the best performance versus the experimental datasets, which is why it was chosen for further processing of experimental data. The optimum approach for battery datasets was the Decision Tree Regress (DTR), which was obtained using the BM method.
It was necessary to divide the dataset into two parts, the training set, and the test set, to conduct machine learning. Using the test set, the computer learned from the training set and assessed its learning performance. In this study, 80 percent of the data was utilized for training, and the remaining 20% was used for testing. After that, data were scaled to make them more regular in nature, and the model was generated using the specified technique. Therefore, the model was fitted to the test set to determine accuracy and error rates. Finally, the developed model was applied to forecast new data points for CH25, CH26, and CH27. The constructed model accurately predicted data points identical to CH25, CH26, and CH27 experimental data. The data prediction reliability was so good that the error score was in the range of 10−2. This minimal score in data prediction validated the output data.
The whole operation of the ML modeling process was pivoted by Algorithm 1. This algorithm tied the custom scripts written for this study together with a built-in ML algorithmic module. The details of the algorithm are given below.
Algorithm 1
1:obtain (battery data)
2:calculate (SOH from Charge Capacity)
3:while (data in each datasets) do
4:   divide (data)
5:   invoke (best ML algorithm)
6:   create (model), verify (model)
7:   return (model)
8:   print (results)
9:end while
10: end of execution

2.6. In-Field Vehicle Testing

To obtain battery performance data from a vehicle, a field test was conducted. We used an electric A0 class car with 32,000 km on the odometer and over 300 charge cycles under its belt. The traction batteries were lithium nickel manganese cobalt oxide batteries with a graphite anode.
The nominal capacity of the battery cell was 52 Ah, and the typical voltage measurement was 3.7 V, according to the datasheet. The lower and upper cutoff voltages were 3.0 V and 4.1 V, respectively. An estimated 18.5 kWh of energy could be stored in the battery package, which was made up of 97 batteries.
For battery cells, the BMS voltage measurement precision was one mV, while the current sensing precision was 0.1 percent. Signals such as cell voltage, current, and temperature were monitored and sent to a CAN data recorder with a 2 Hz sampling rate through CAN (Controller Area Network). The only criterion was that the car stopped intermittently to deliver a charging pulse to the batteries, which were driven by three different test drivers.
This work used three driving cycles of three different batteries with identical battery temperatures to assess battery properties identified from distinct driving cycles. There are some cycle statistics shown in Table 1.
Cell 01′s measured terminal voltage was the lowest of the 97 cells while in operation, owing to the fact that cell 01′s state of charge was slightly lower than the other batteries after 32,000 miles of service without equalization. Because cell 01 was always the first to reach the lower cutoff voltage of 3.0 V, other batteries were not allowed to totally discharge; hence, cell 01 was chosen for analysis and for SoH estimation in the next section. Table 1 indicates that different driving techniques and random factors affected the energy recovery rate and mileage. Despite this, the difference between the charged capacity from the power grid after the driving cycle and the discharged capacity during the driving cycle was relatively constant.
That means that around 99 percent of the charged capacity could be discharged during driving, resulting in a charging and discharging efficiency of about 99.5 percent. Additionally, it indicated a vital fact: ampere-hour counting within a single driving cycle was exceptionally precise and reliable, in spite of 0.5 s time steps, and with a great deal of dynamic current. Table 2 illustrates the battery driving cycle information.
The impedance test equipment, which included a data recording device for signal generation and data acquisition, a power amplifier for signal amplification, and two Series resistors for current measurement, was used to record the battery’s impedance performance at various excitation frequencies. Excitation employing sinusoidal voltage was used to measure impedance. Recording and storing with a DC bias, sinusoidal voltages and currents were generated, and their complex quotients were computed to determine the battery’s impedance. To decrease measurement noise, a convolution-based approach was used to determine impedance phase delay, which was paired with Parseval’s theorem for amplitude computation [27]. The sinusoidal input’s DC bias was accurately controlled to avoid charging or discharging the battery during the impedance test. The sinusoidal input’s DC bias was accurately controlled to avoid charging or discharging the battery during the impedance test. The sampling frequency was connected to the input signal frequency and varied from 0.025 to 5 kHz. The following were some of the most essential aspects of an impedance test system: sinusoidal voltage excitation frequency range: 0.025 to 5 kHz, sinusoidal voltage excitation DC compensation range: −5 V to 5 V, and sinusoidal voltage excitation AC amplitude: 100 mV. Figure 2 depicts the physical layout of the battery testing system.

3. Results and Discussion

This section provides the complete visualizations of ML battery model outcomes. For fair representation, results were categorized as ML model predicted, error estimation, and accuracy results.

3.1. Findings from the ML Method

The results showed an impressive agreement between the experimental data and the data produced by the ML battery model. The capacity and SOH prediction results OF battery 25, battery 26 and battery 27 are shown in Figure 3, Figure 4 and Figure 5, respectively.
Figure 3, Figure 4 and Figure 5 show the capacity plots of batteries 25, 26, and 27 predicted and experimentally confirmed. The experimental capacity was presented with the red dashed line and the predicted capacity with the blue dashed line. Similarly, the SoH plot of the predicted and experimental cases for respective batteries is shown in Figure 6, Figure 7 and Figure 8, respectively. The experimental SOH was shown with the red dashed line and predicted SOH with the blue dashed line. The results were subdivided and are described below based on their types.

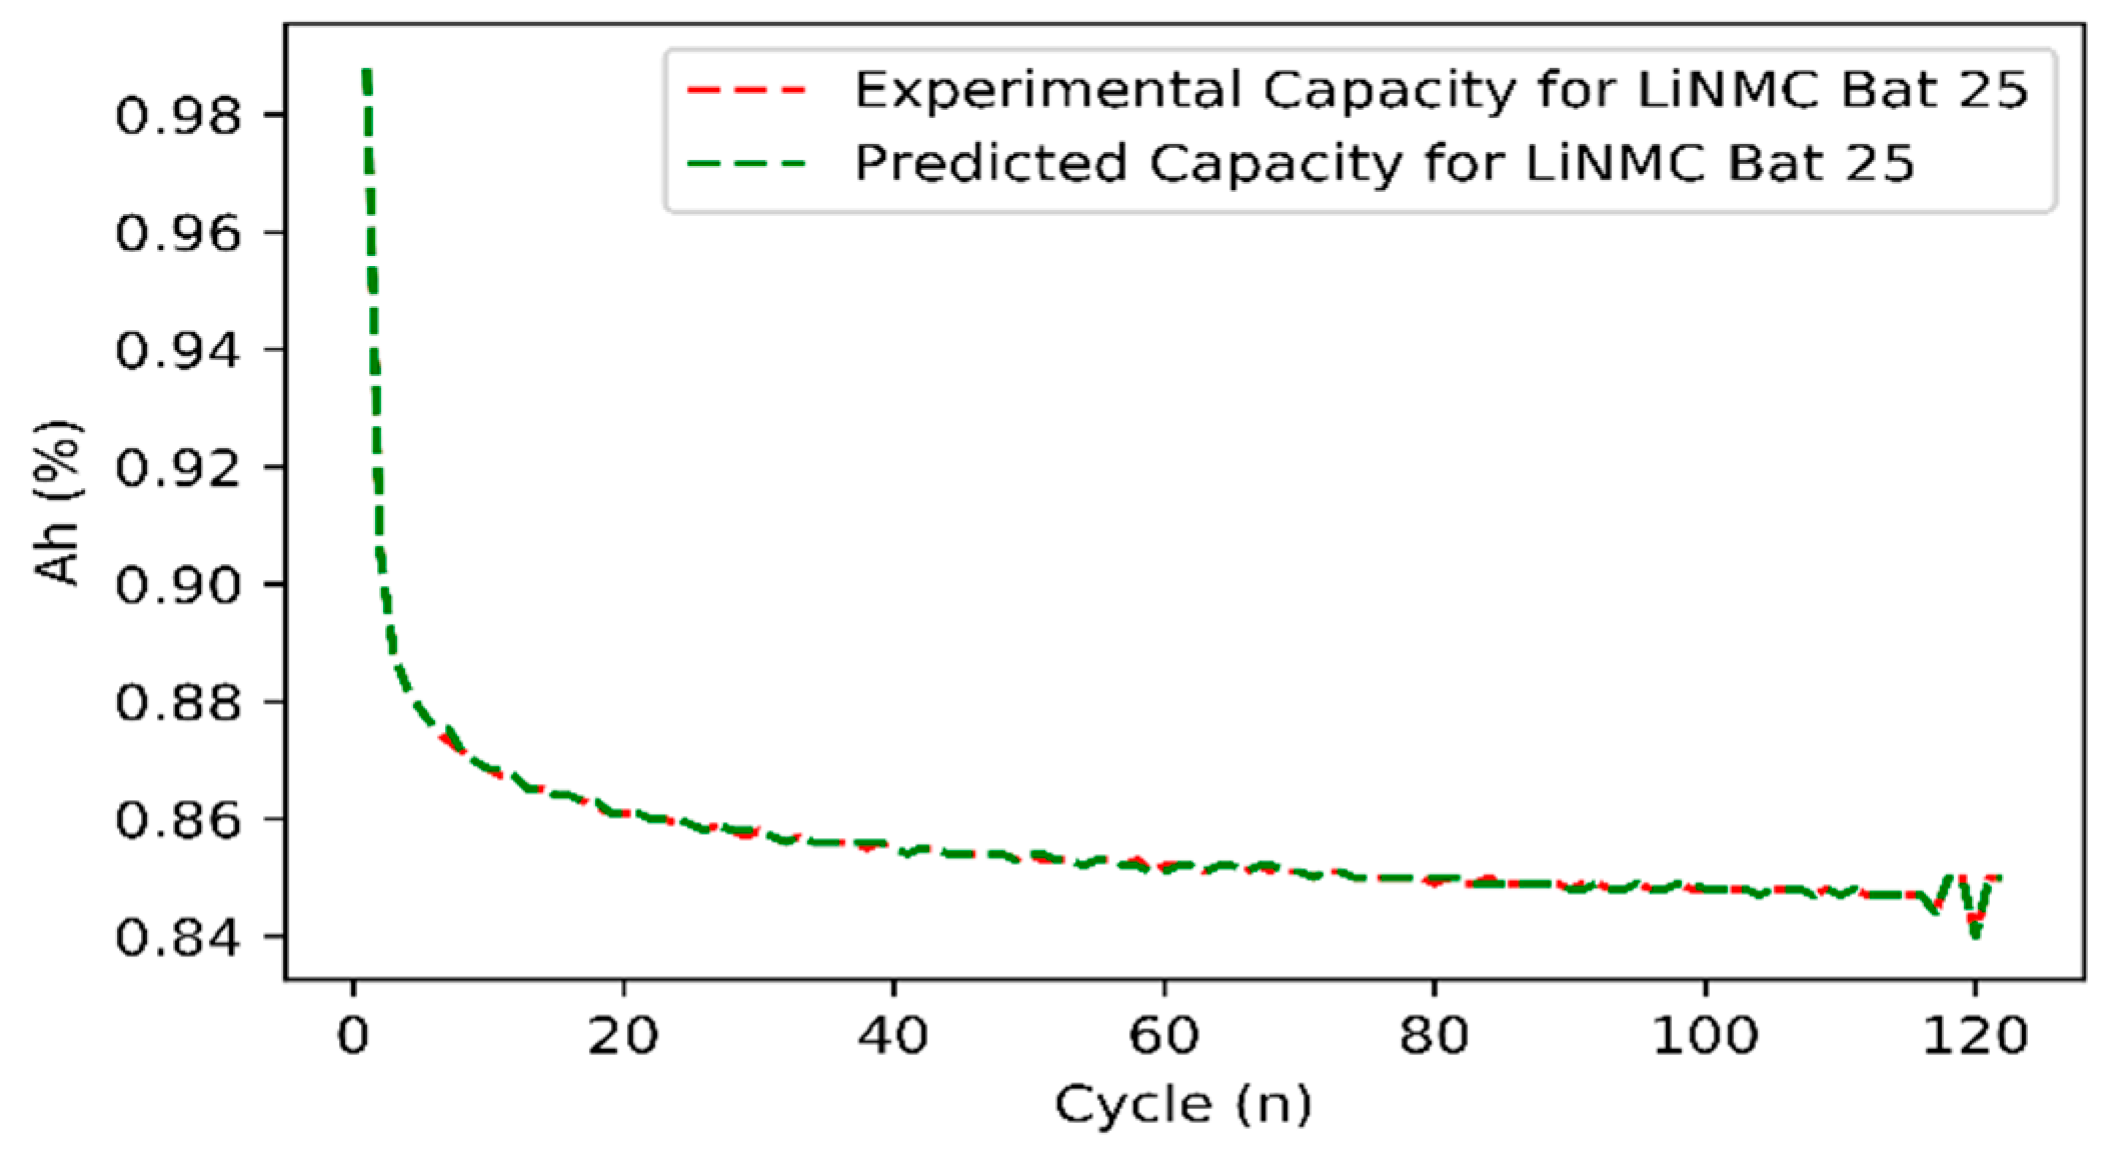
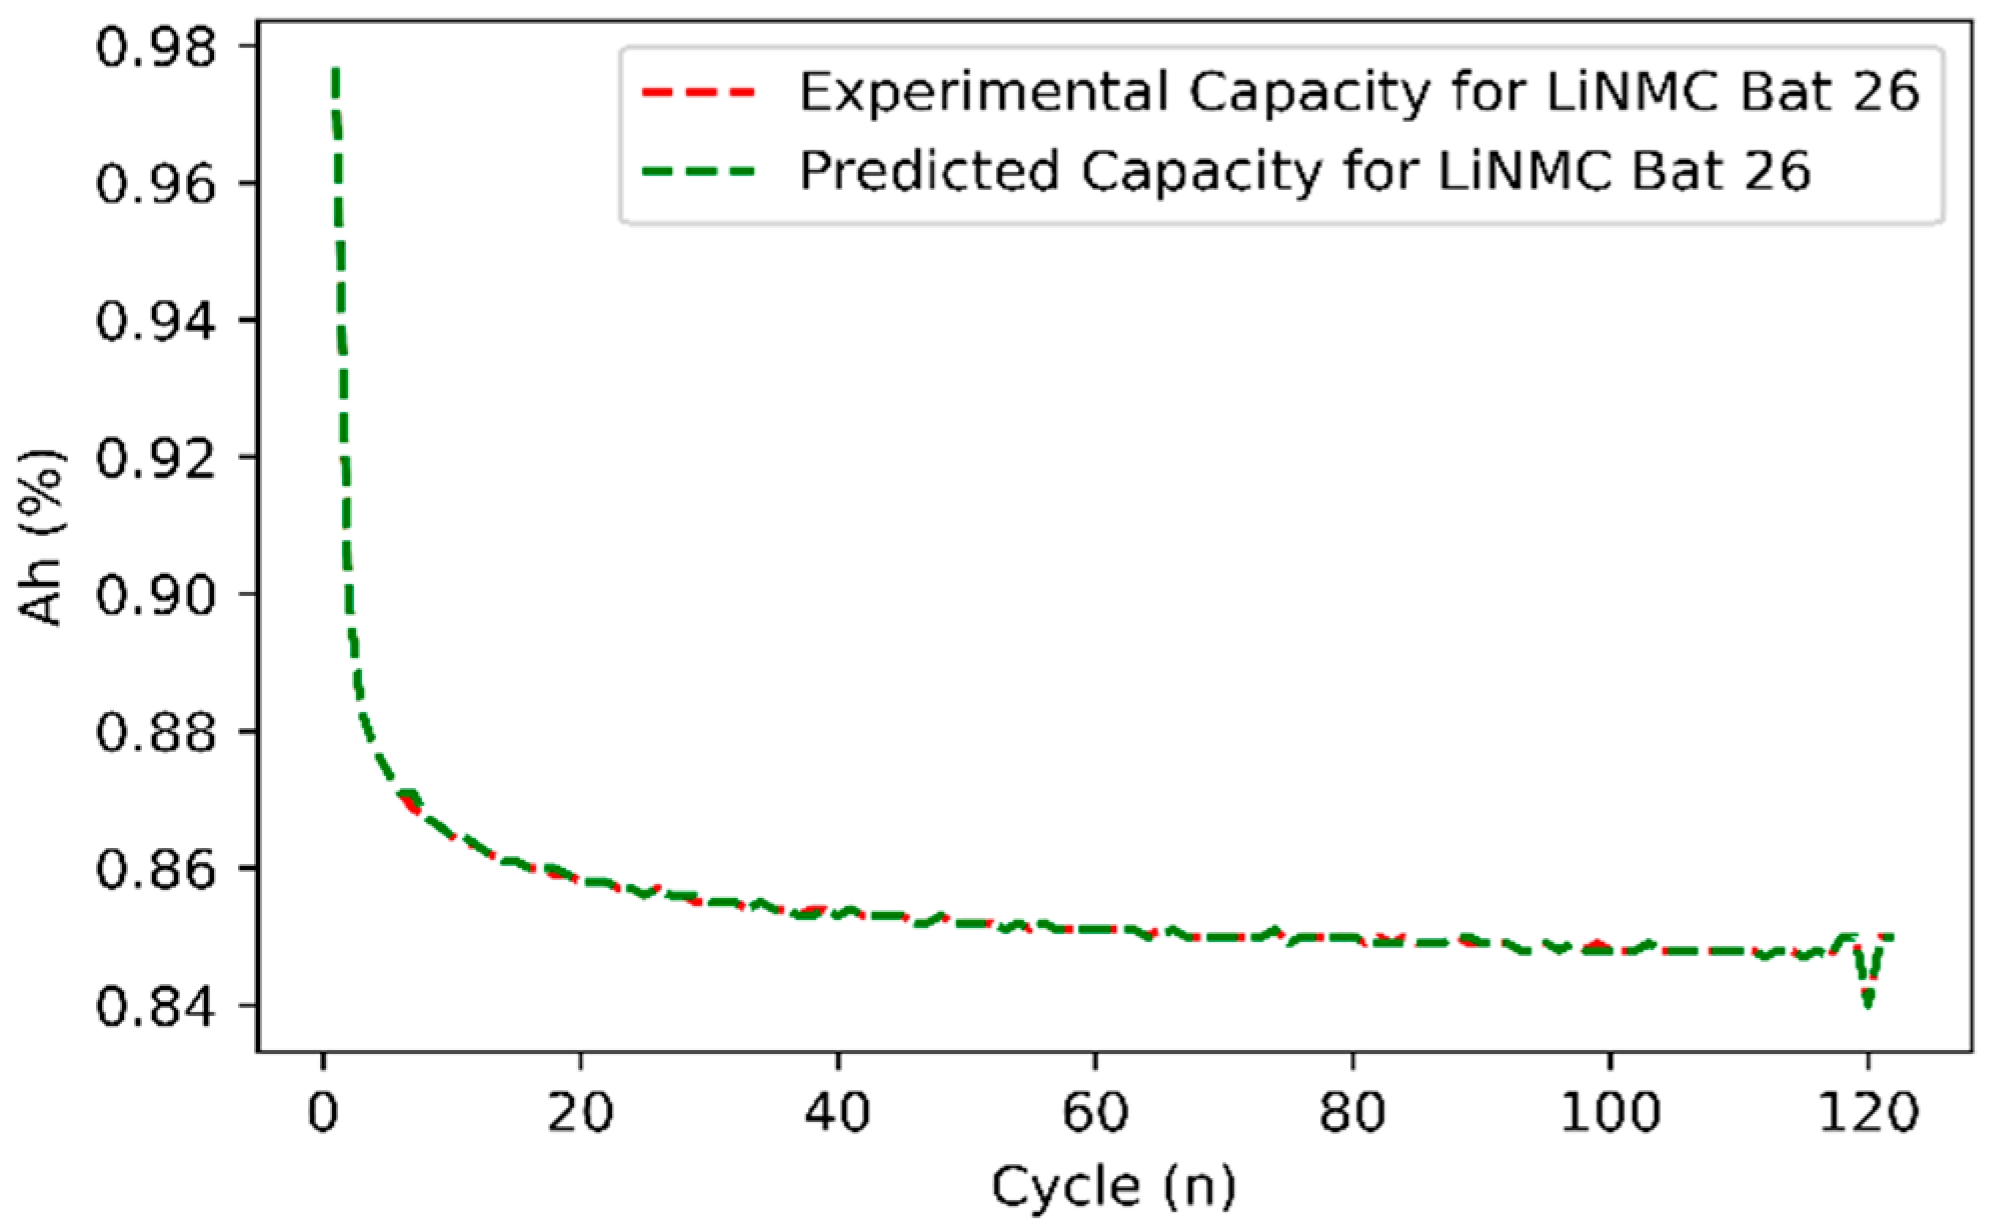
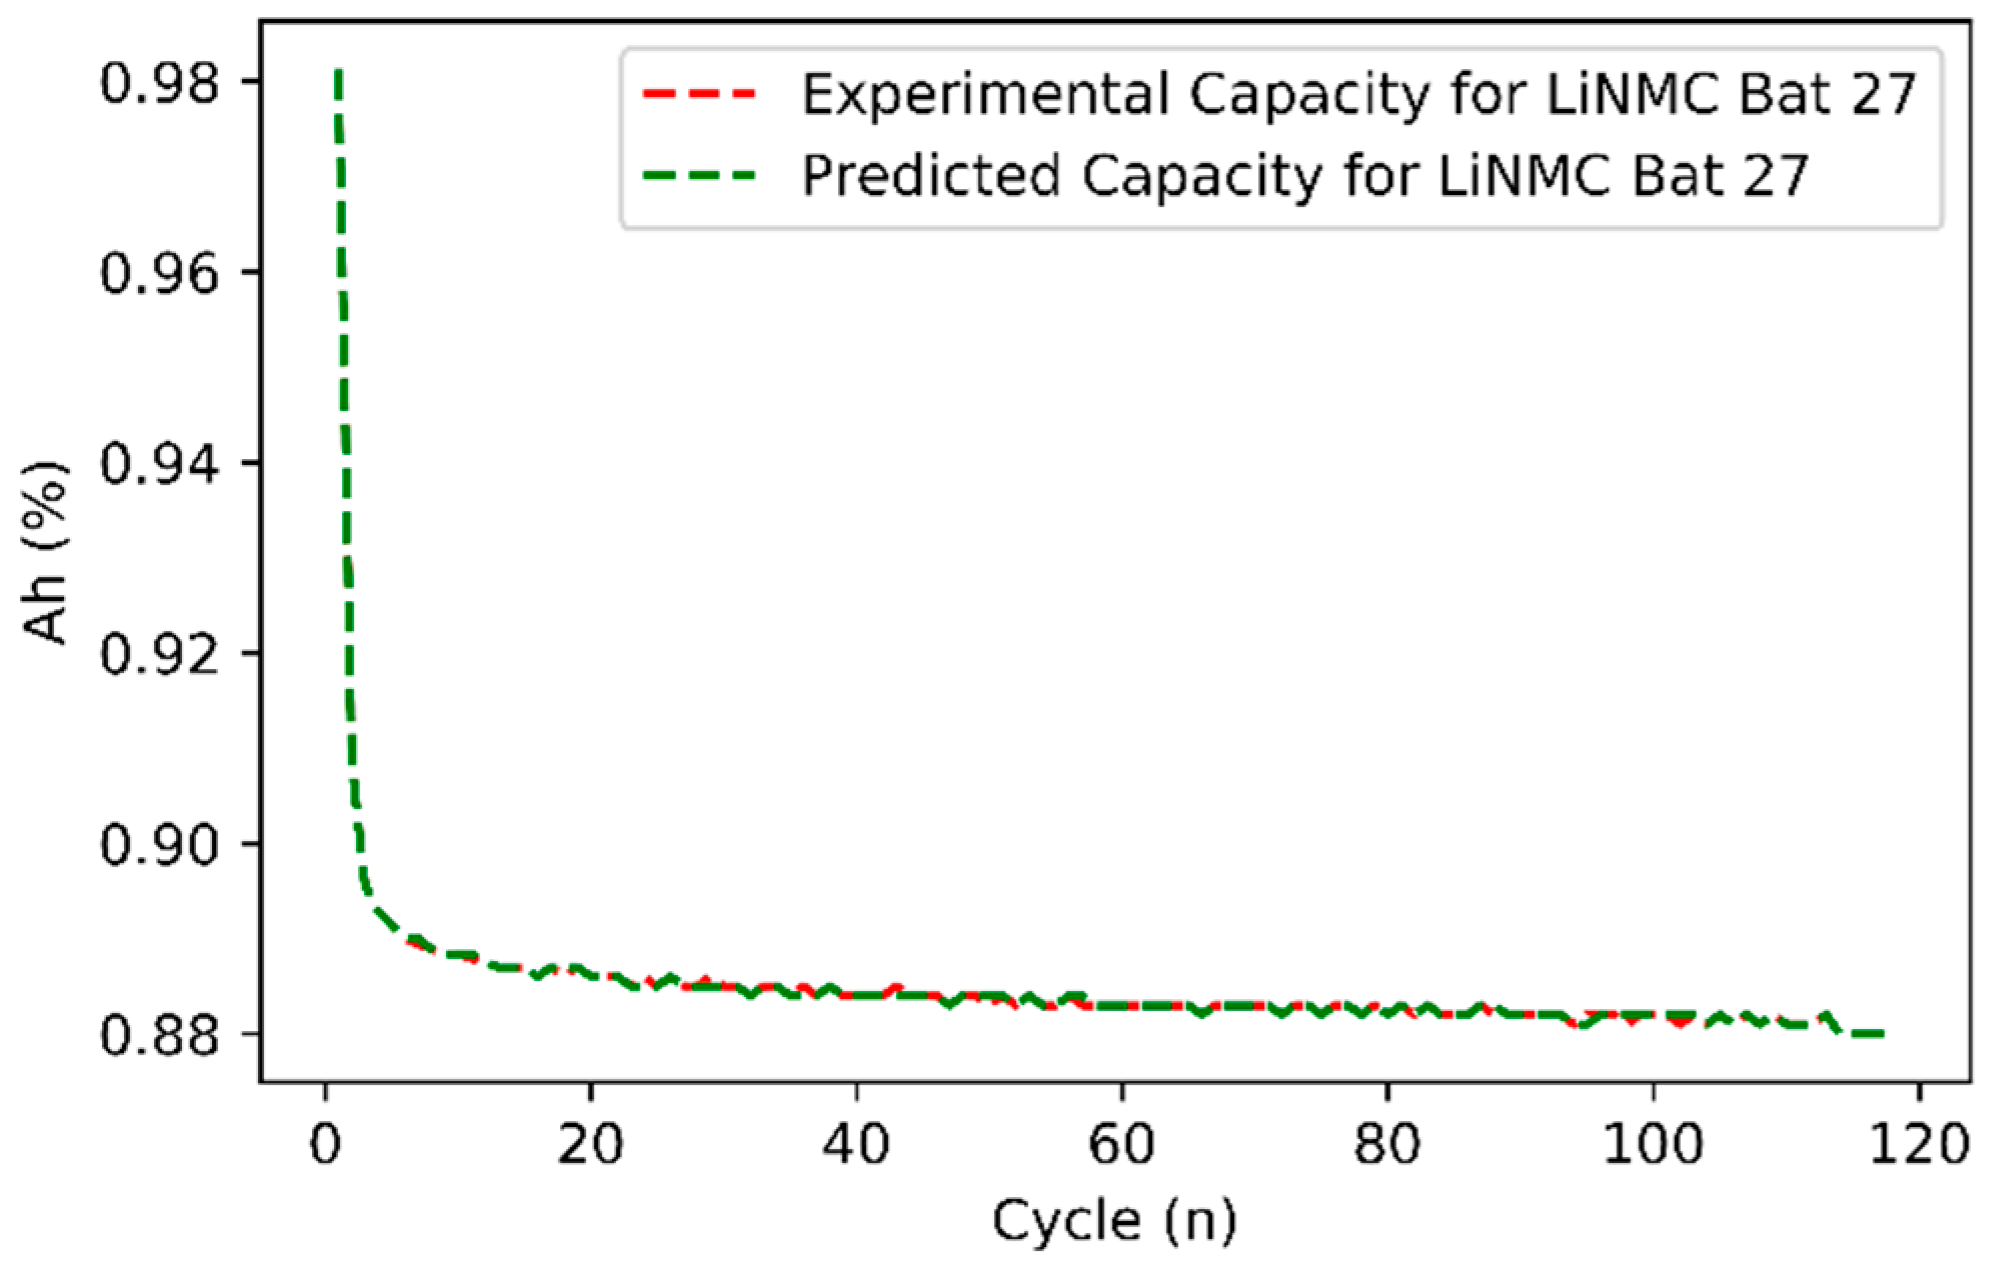
3.2. Results Related to Derived Capacity

As mentioned above, the charging capacity was derived from the aging data. The respective capacity data and model-predicted data are visualized below.
As shown in Figure 3, Figure 4 and Figure 5, for each case of capacity prediction, the ML battery model had a fine prediction capability to reproduce and trace the experimental behavior of the battery. There was a tiny deviation from the capacity trend, so the result was expected to be reasonably accurate.

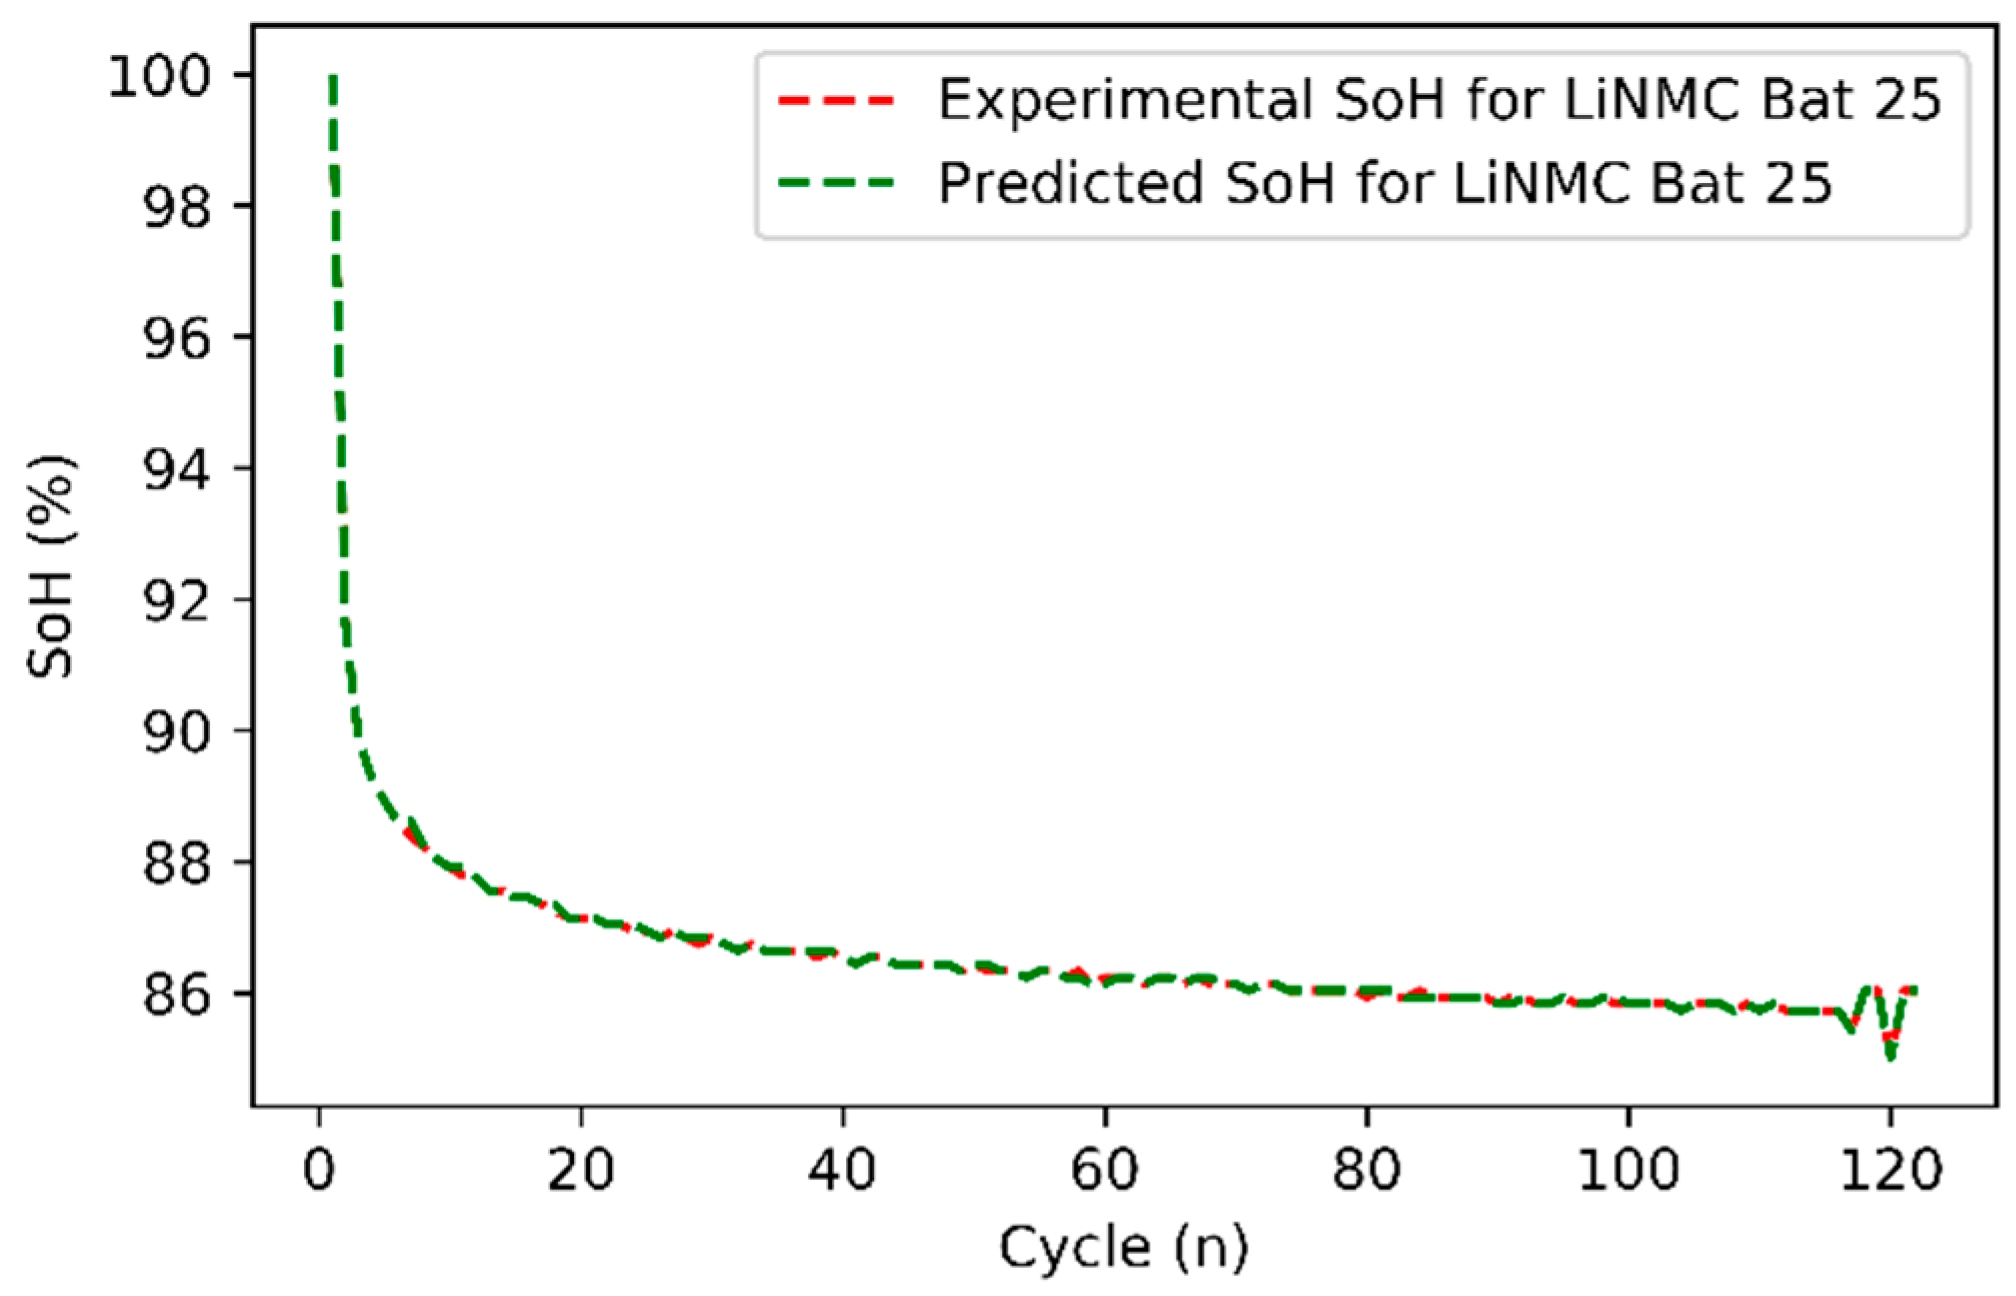
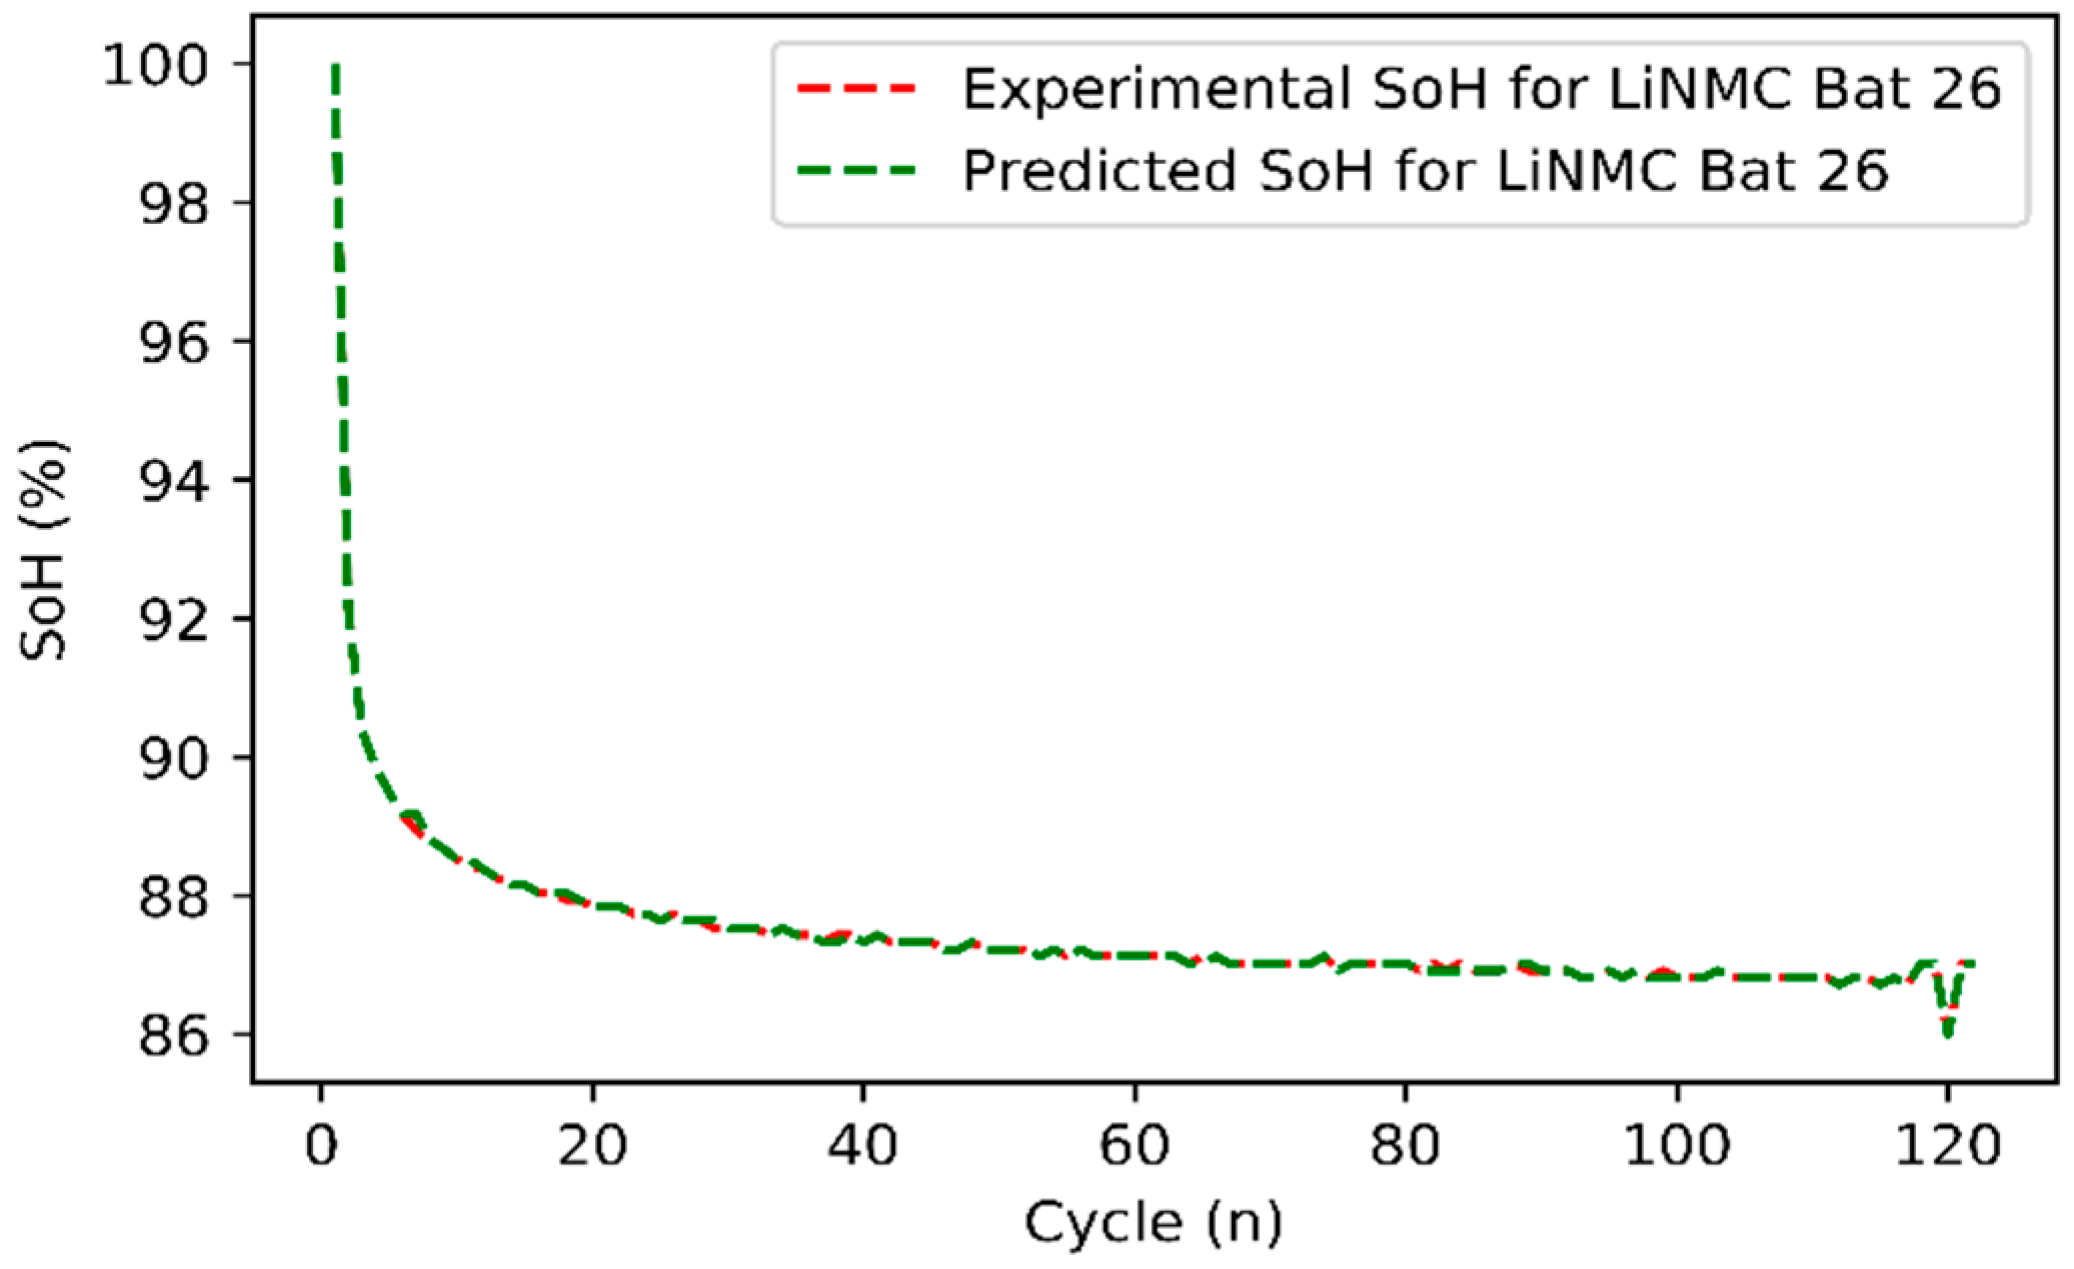
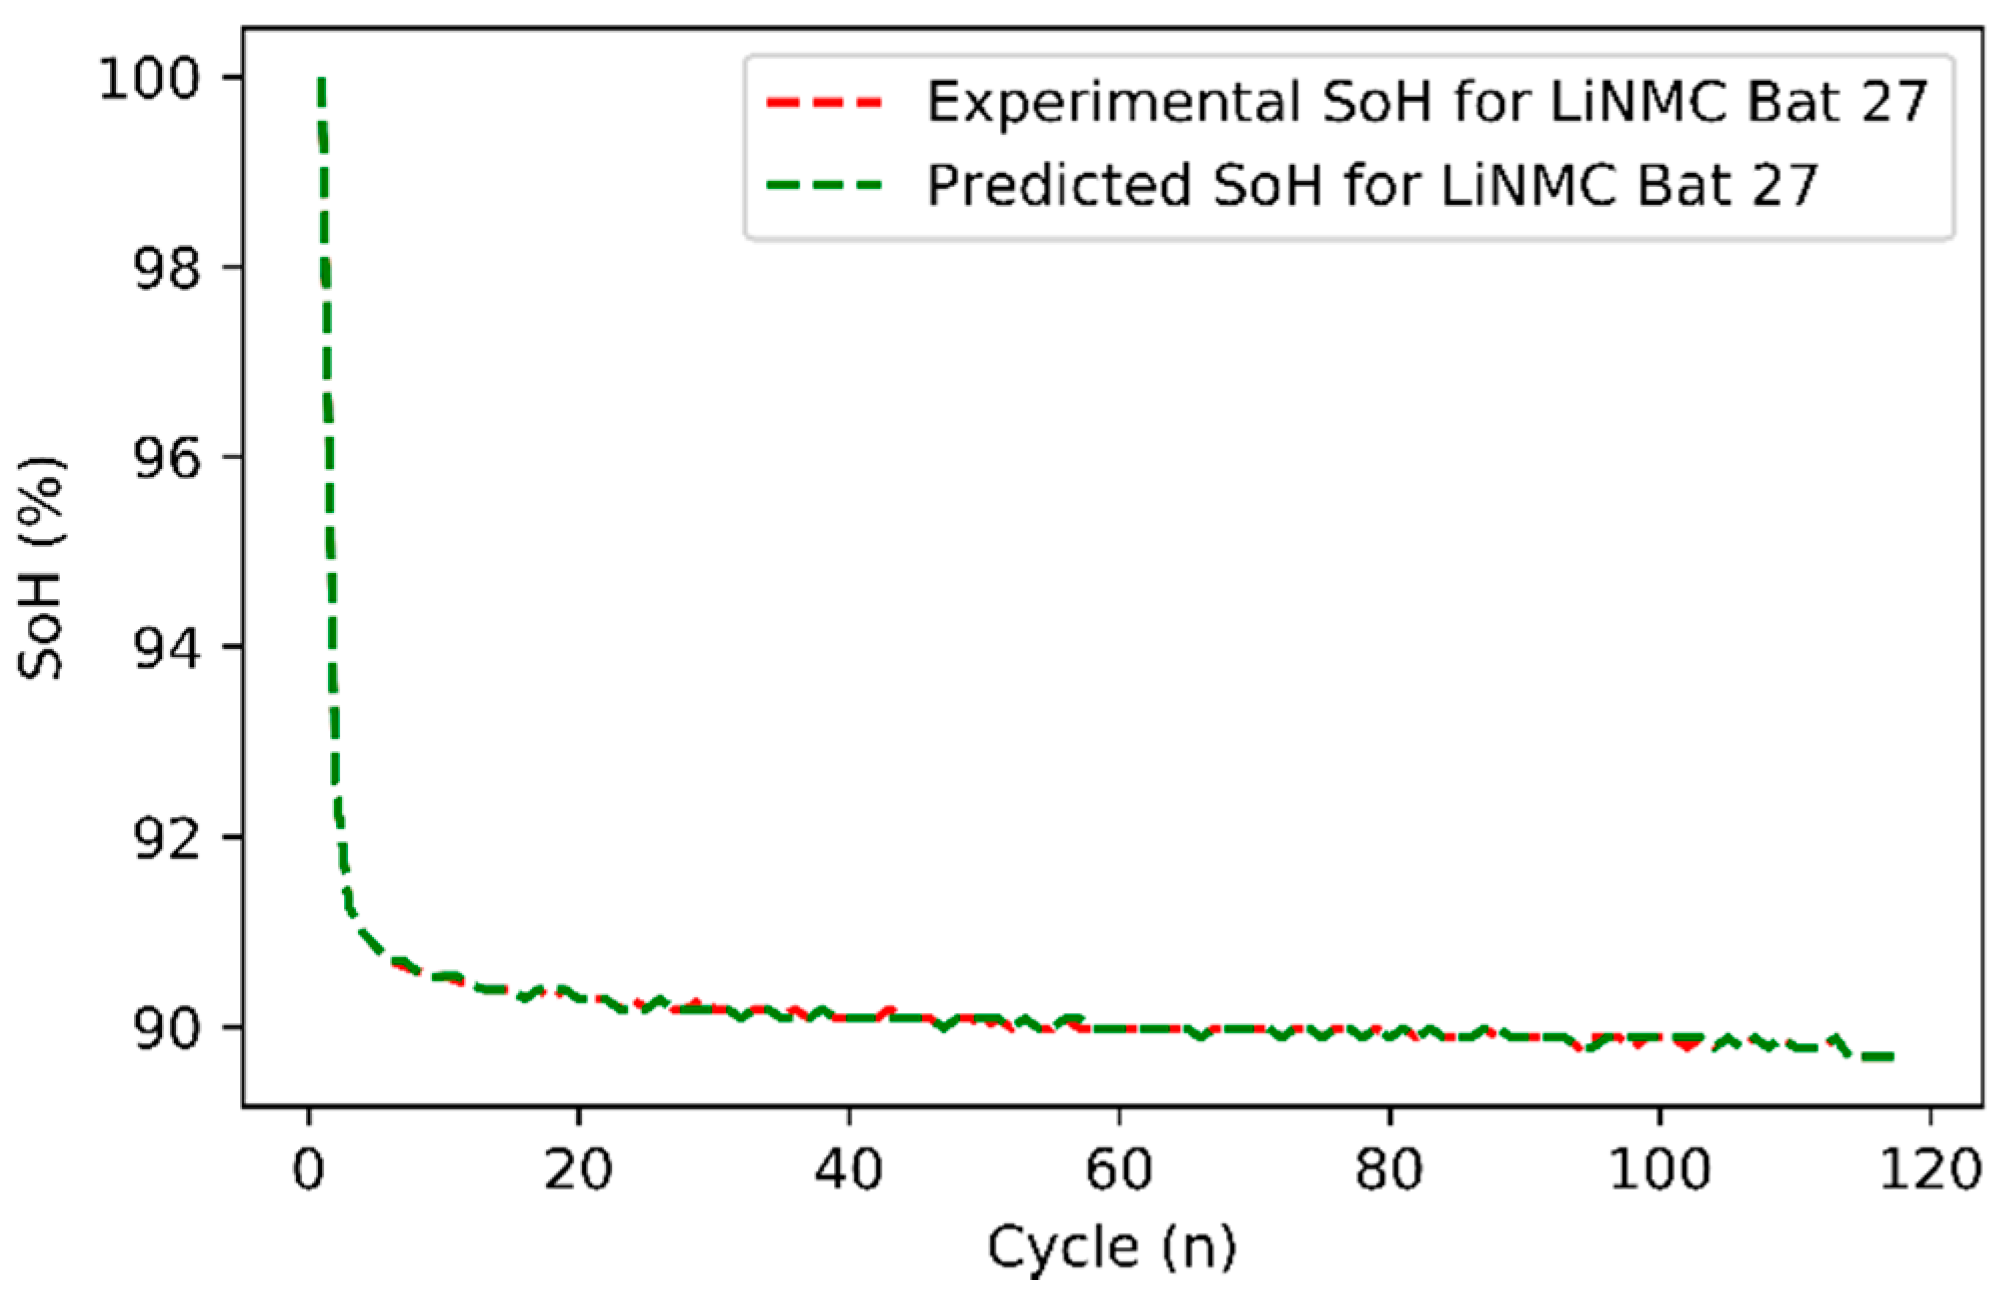
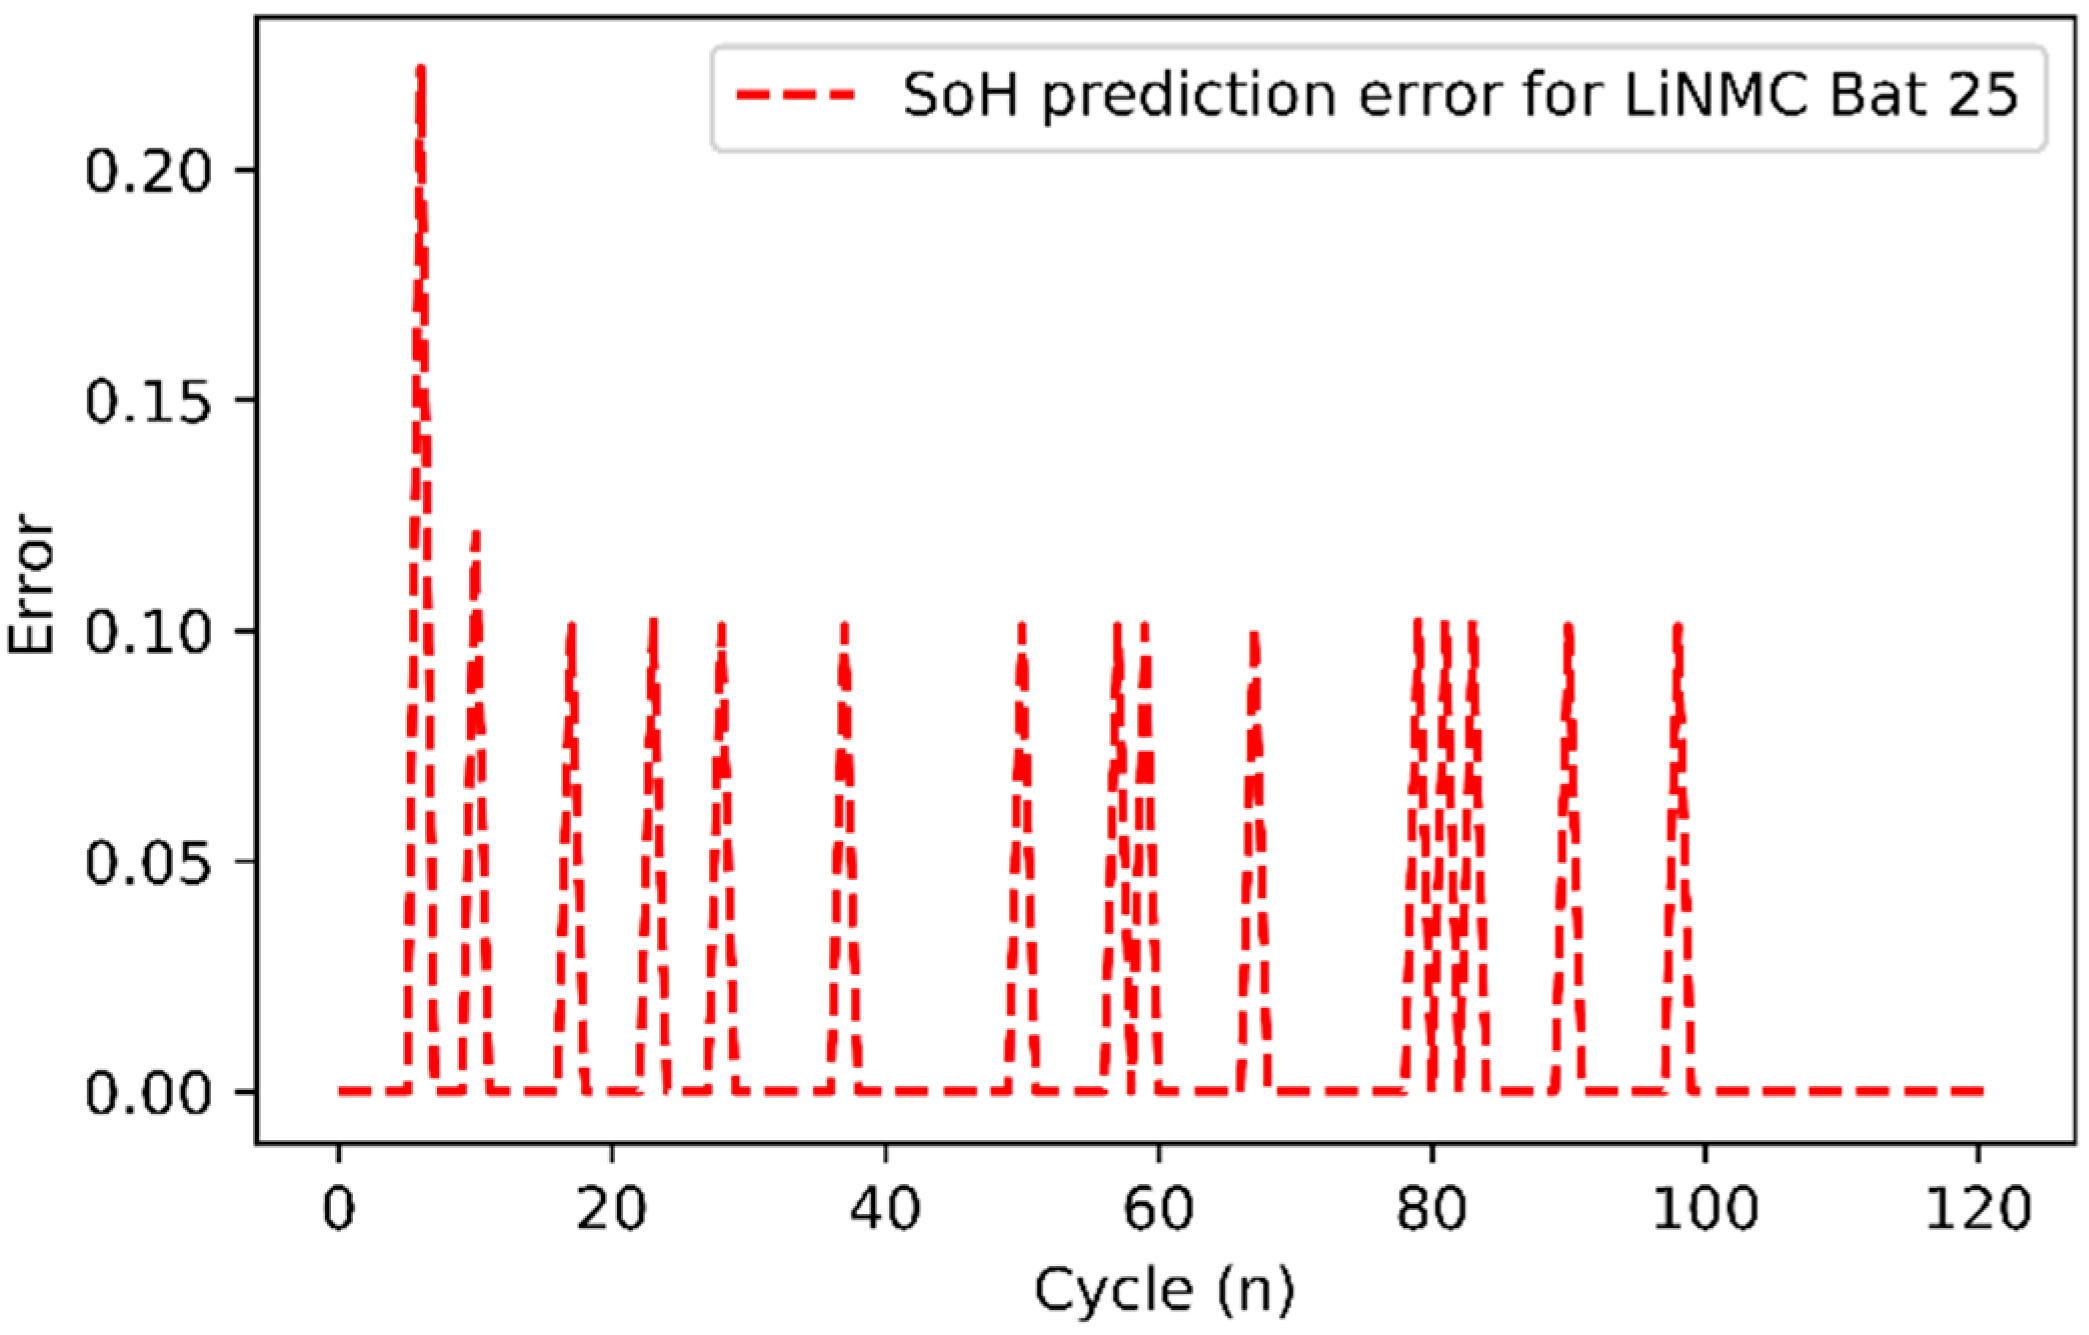
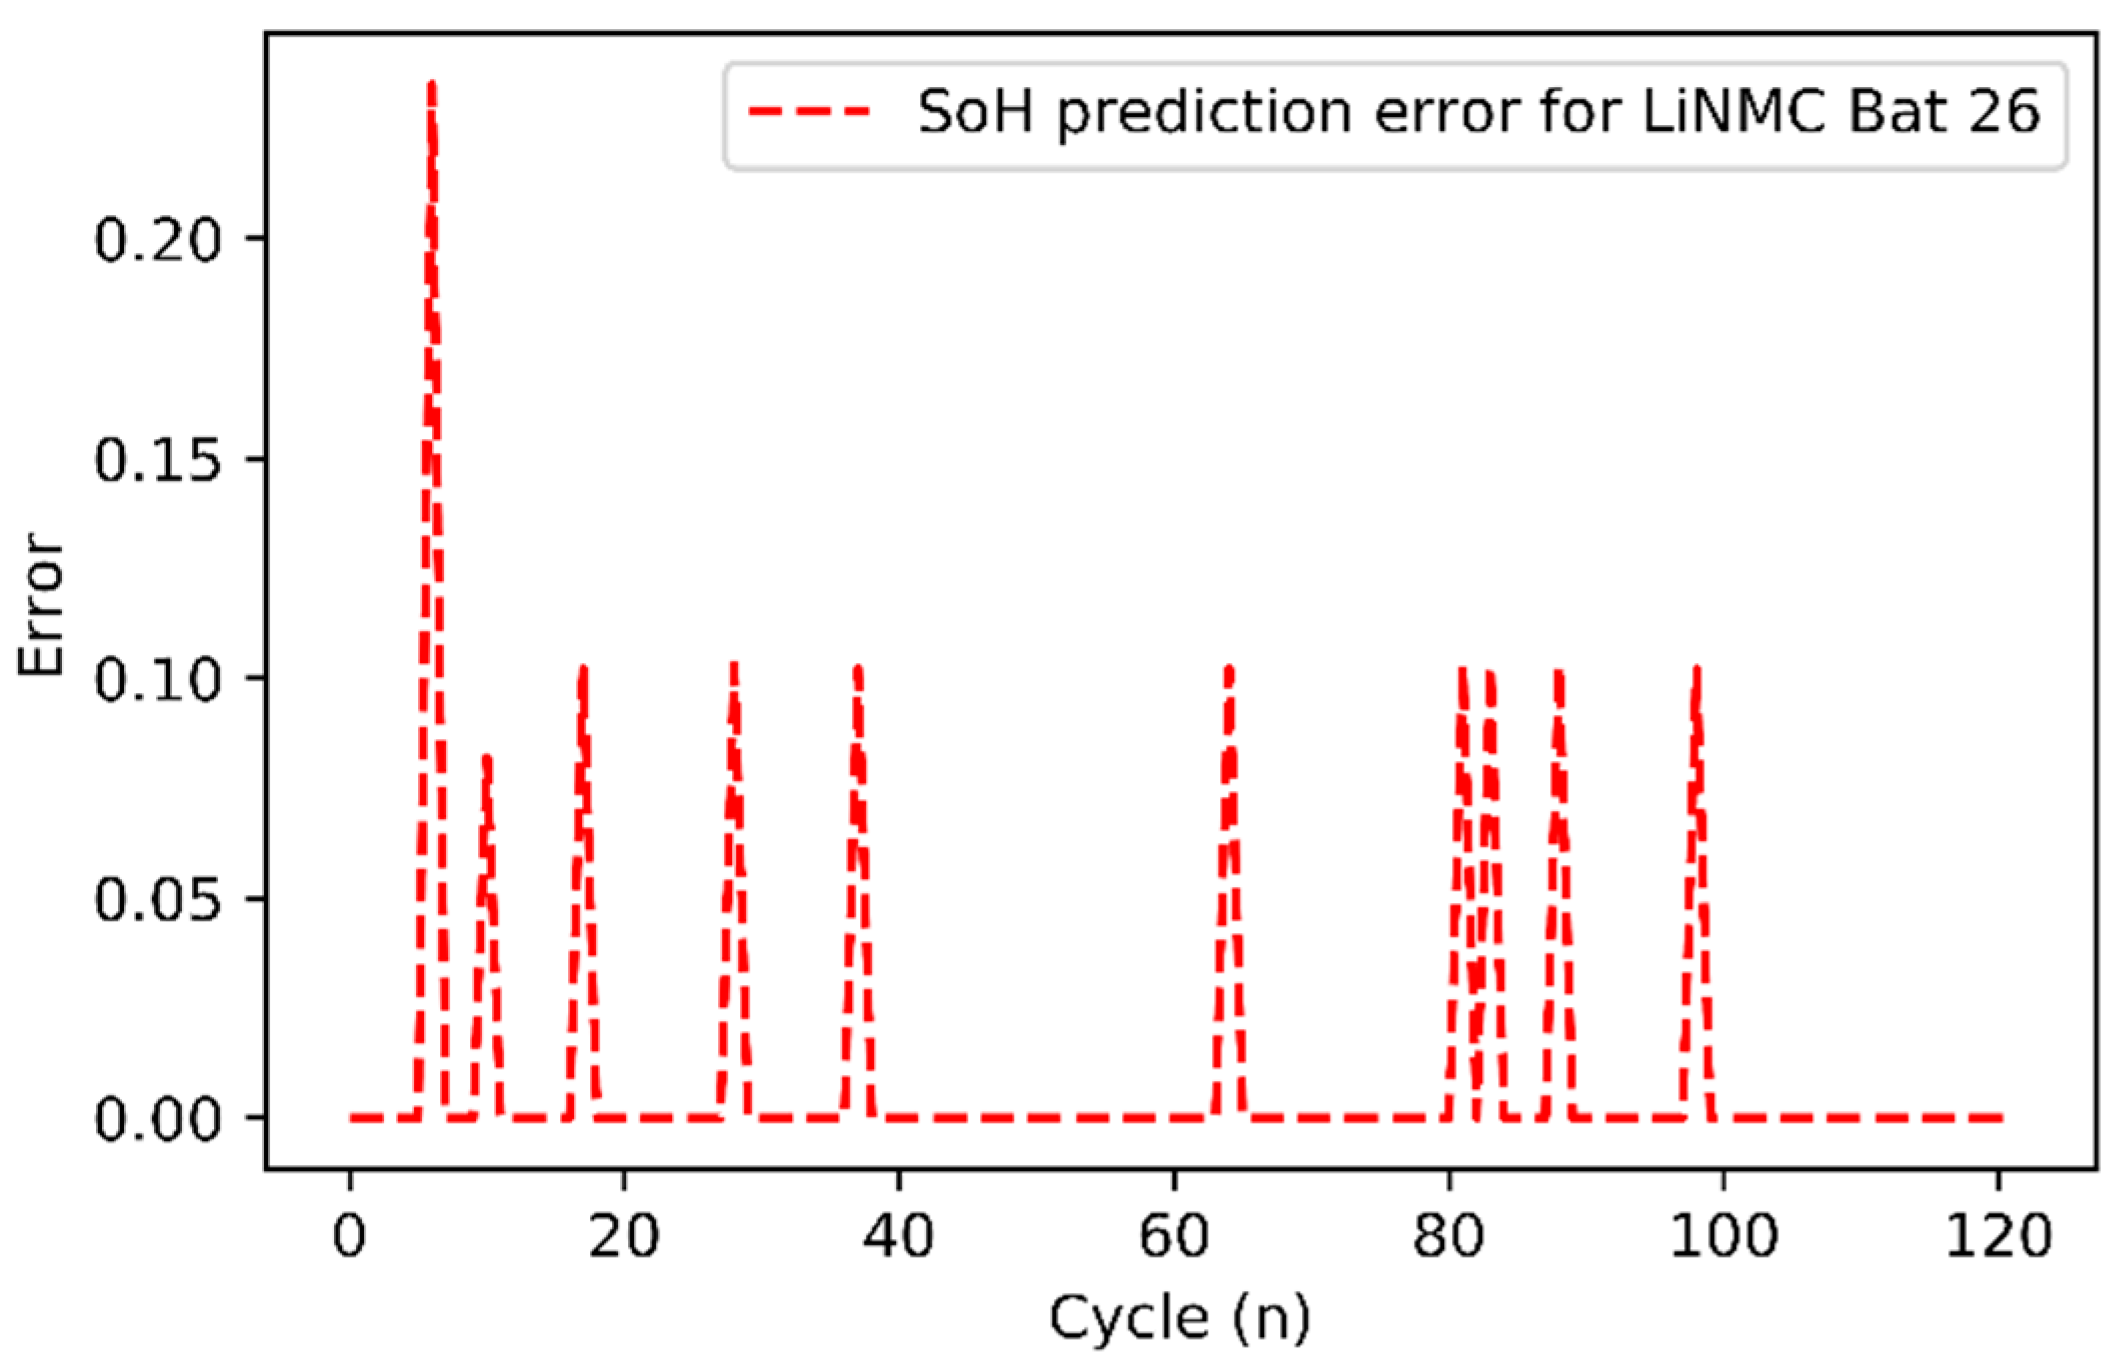
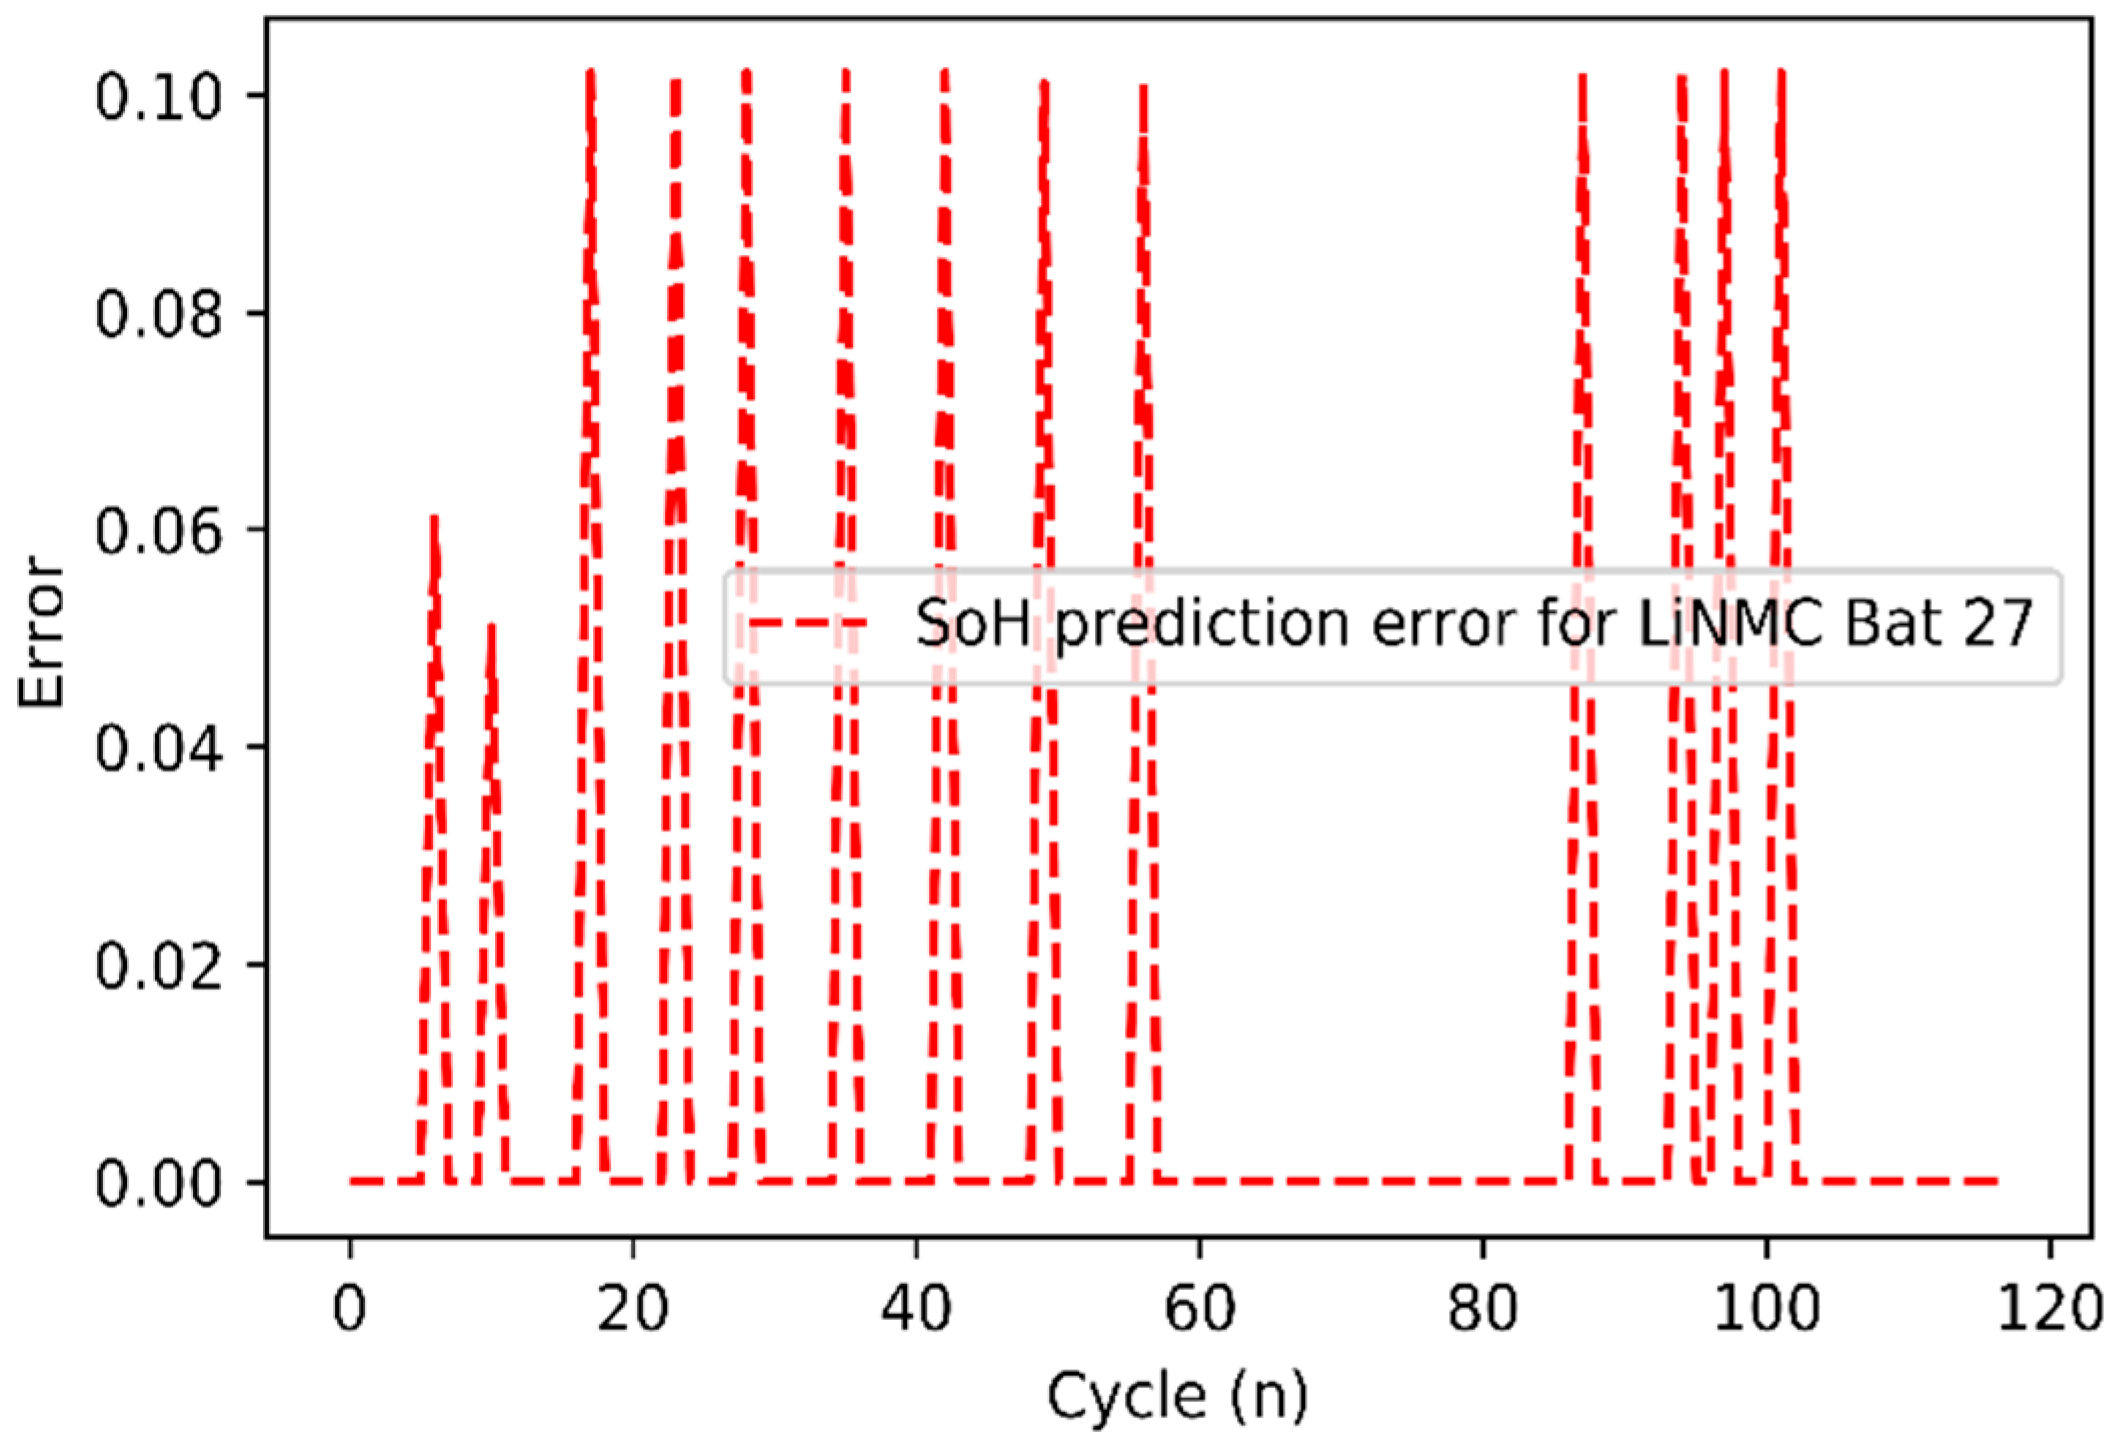
3.3. Results Related to SoH

The comparative plots of calculated SOH and battery model predicted SOH are presented in Figure 6, Figure 7 and Figure 8. The ML model prediction findings agreed with the experimental results. The results mean that the battery model is reasonably accurate. Vehicle batteries can be studied experimentally or in real time using these results. As seen in Figure 6, Figure 7 and Figure 8, the battery model had a higher agreement with the calculated SOH from experimental data for every snap of SOH prediction.

Error Estimation Results

Equation (3) was used to assess the modeling error. The ML battery error involved the prediction of experimental values using the ML battery model. Errors are shown in Figure 9, Figure 10 and Figure 11.
As seen from Figure 9, Figure 10 and Figure 11, for every scenario of SOH error calculation, the minimum error ranged from 0 to 0.10, and the height error was 0.10 to 0.24. These error calculation results mean that the model was fairly accurate. This minimum error in the SOH prediction is the key to the finer agreement with the experimental data.
The battery ML model had healthier agreement due to learning from the data and adjusting to new data. This showed the power of ML-based modeling.

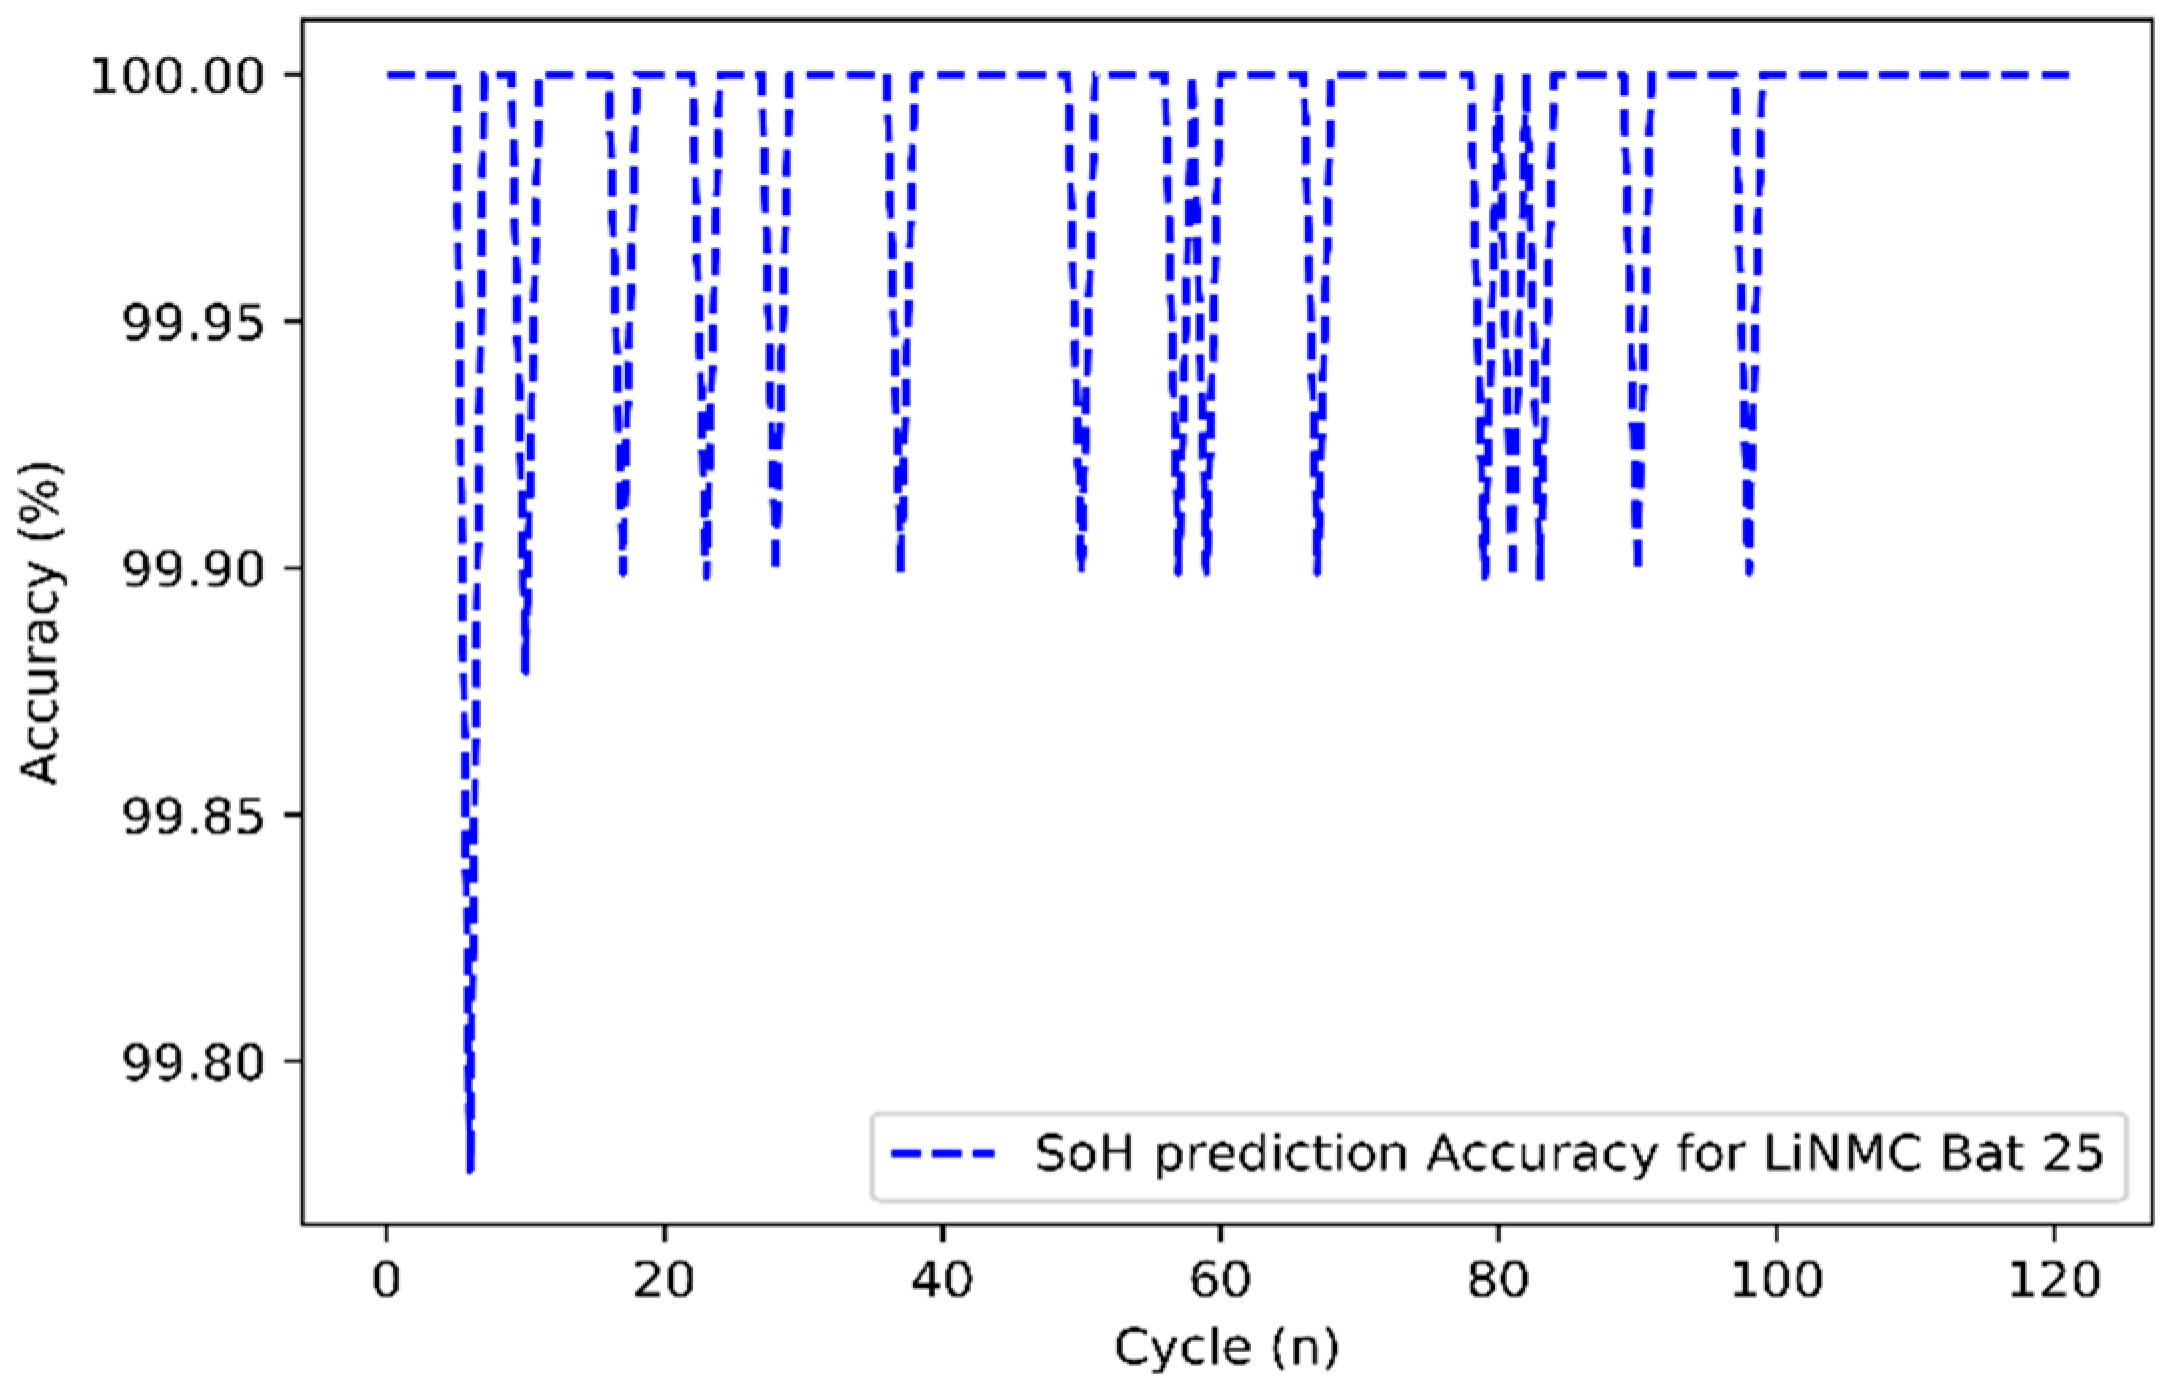
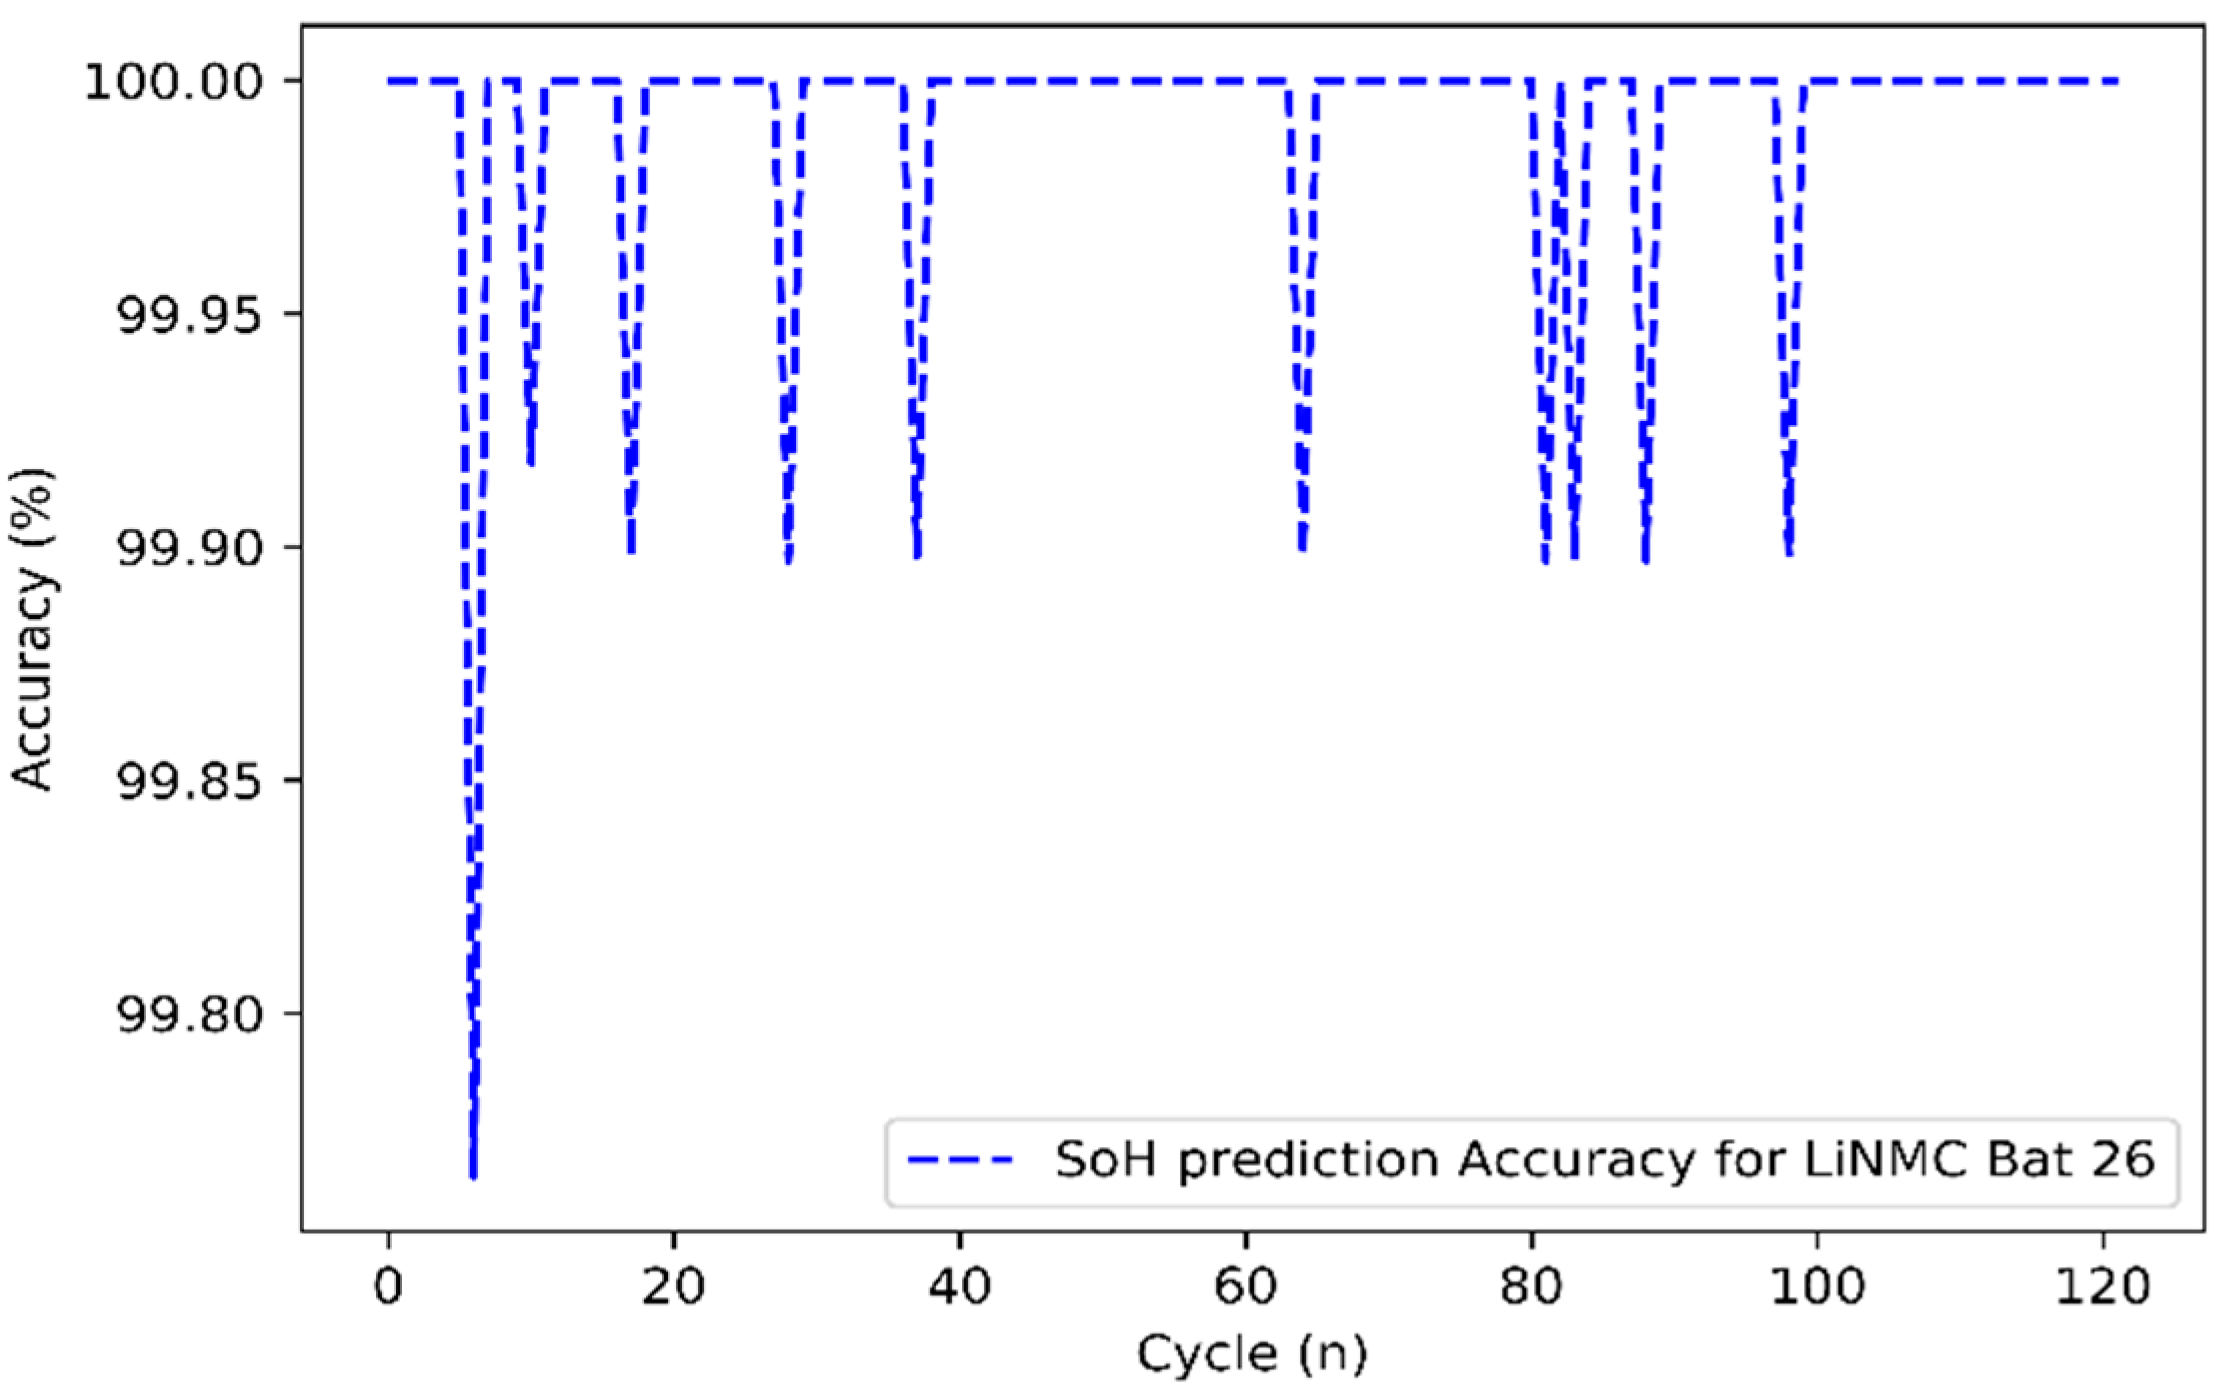
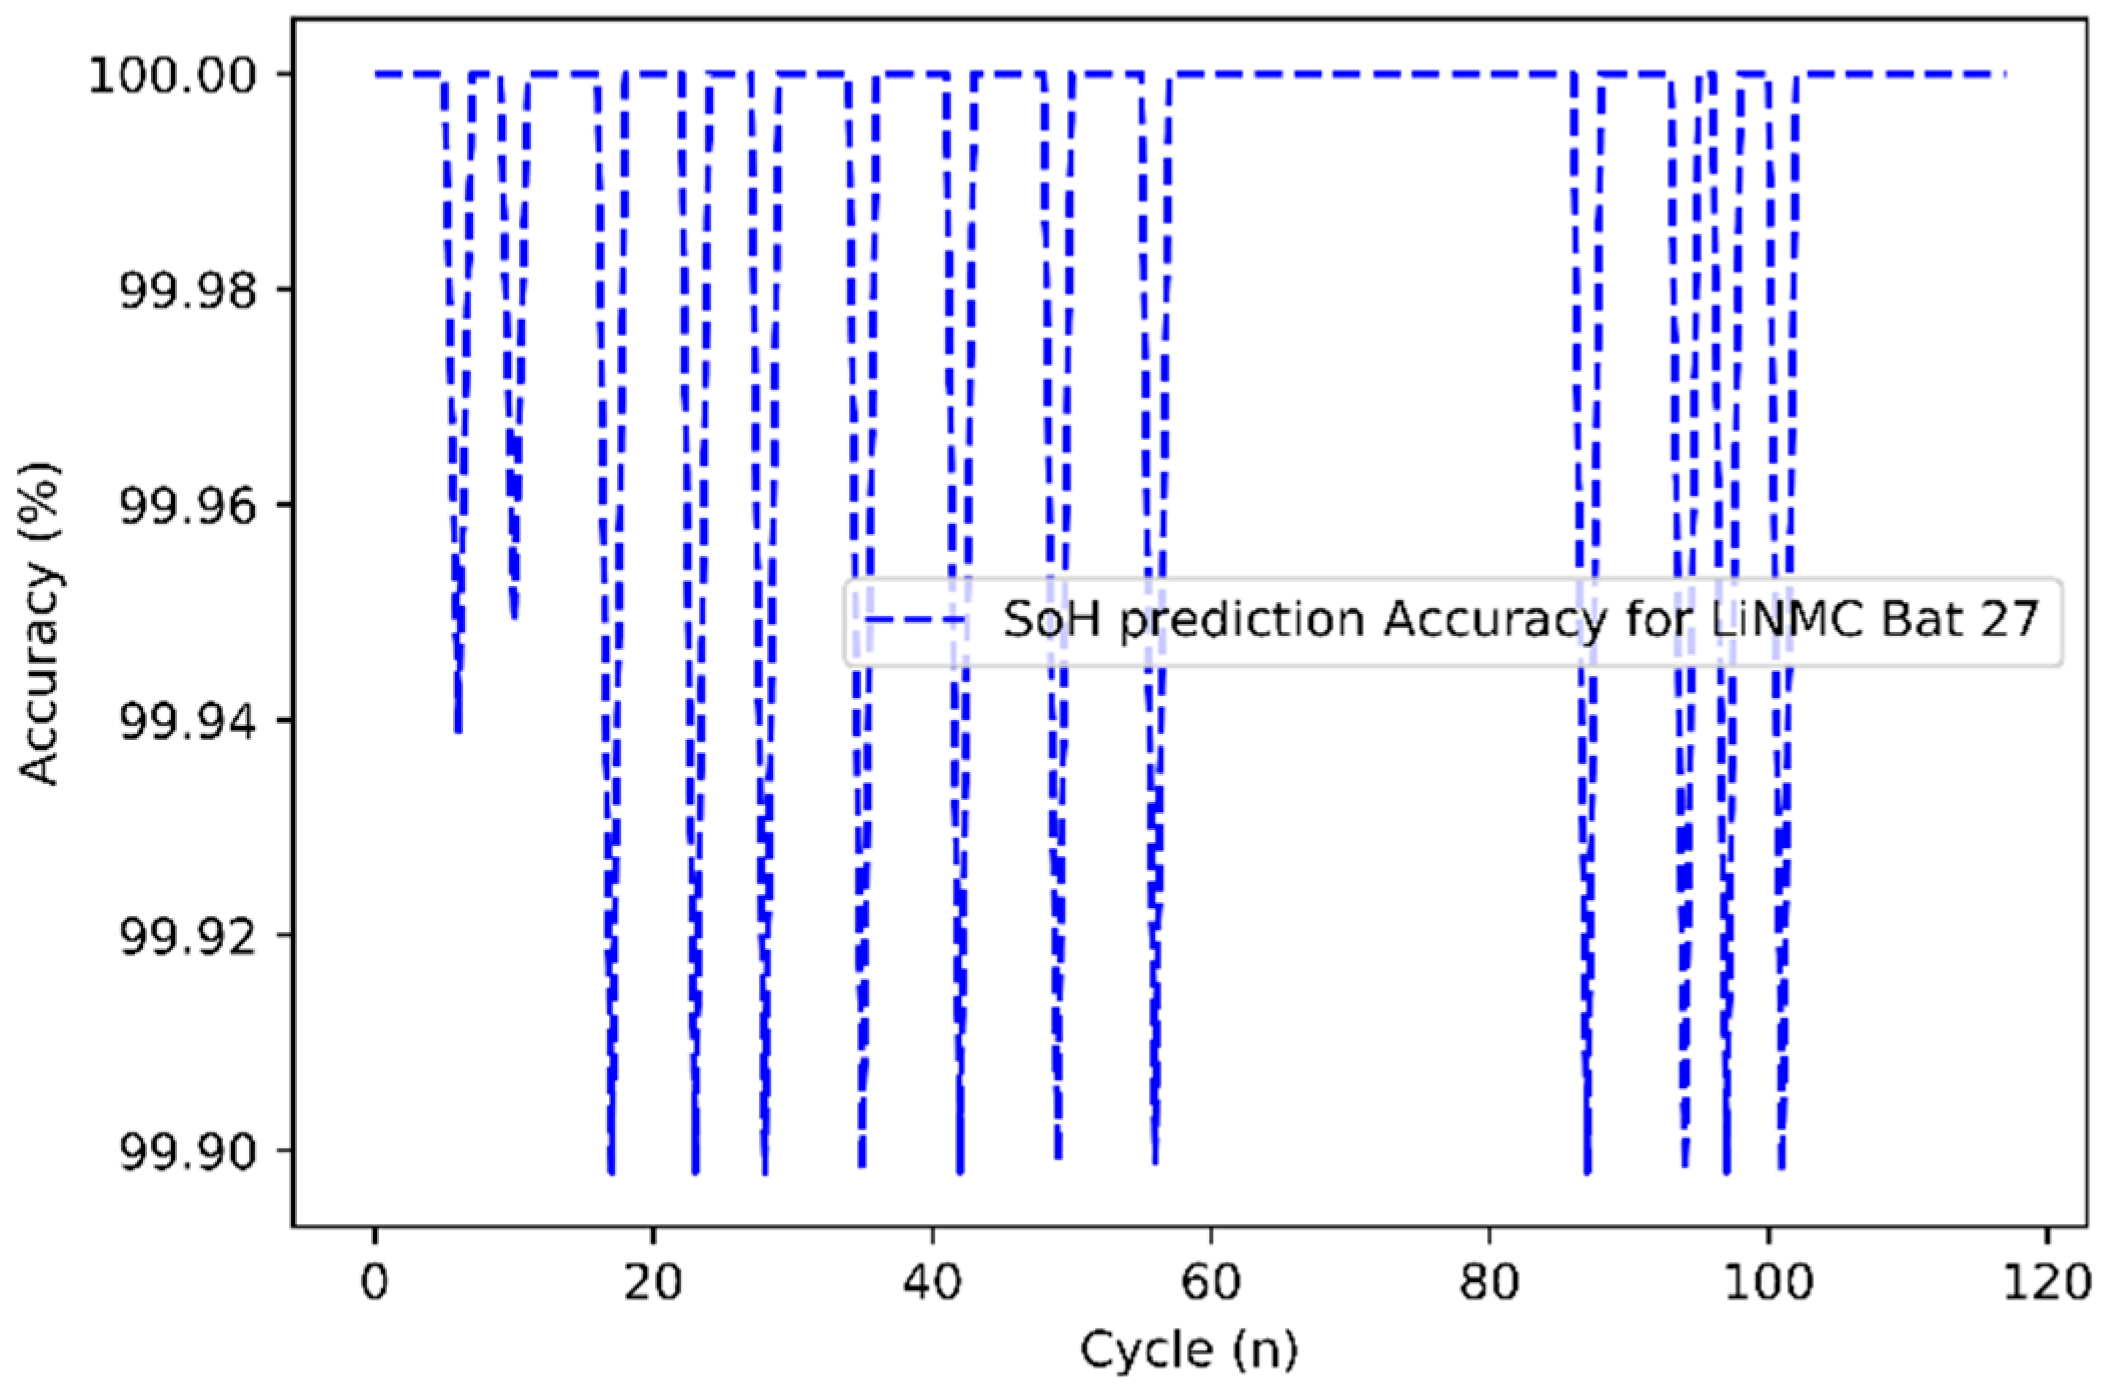
3.4. Accuracy Results

Two different methods were used to define accuracy. The first was the accuracy formula defined in this study in Equation (2), and the second was the accuracy metrics related to the default ML algorithmic domain. All of the accuracy metrics showed that the ML-based battery model was accurate.
It is seen from Figure 12, Figure 13 and Figure 14 for every scenario of SOH prediction, the ML battery model had the lowest accuracy of 99.8%, along with the highest possible accuracy of 99.99%. Whatever accuracy it had was above 99%.
Secondly, the ML algorithmic module’s default accuracy, R-Squared (R2) and Mean Square Error (MSE) were used as another accuracy metric. The R2 metric measures the goodness of a fit. The value ranges from 0 to 1; 1 indicates a better model fit. MSE is the mean of the squared errors. The MSE indicates how close the predicted values are to the actual values; hence, a lower MSE value signifies good model performance. The accuracy score of the training set of the battery model was 0.9999, and the testing set was 0.9995. The overall R2 score was one, and the MSE was 0.03. Hence, these three measures implied that the data-driven ML model used in this study was accurate. Furthermore, the built-in accuracy results were consistent with the calculated accuracy results.

4. Conclusions and Future Work

Throughout this paper, an ML-based battery model was built, compared, and verified. The results showed that the created model could well predict the variation of capacity and SOH during the working process of electric vehicle batteries as in the experiment. The comparative analysis also showed the battery model’s ultimate accuracy of 99.98% and the bottom average error of 0.02. In summary, the following contributions were made:
  • An accurate SOH prediction model was successfully demonstrated.
  • The ML-based battery model was accurate and error-free.
  • The created model had the same quality of data; it can be substituted for the costly experimental process. It can act as an intelligent monitoring system for vehicle battery health. The above discussion and graphical representation conclude that the ML-based battery model to predict SOH from capacitive data was successful, and it was an accurate model. This work is a novel specimen in predicting battery SOH.

Author Contributions

Conceptualization, K.A. and Y.Z.; methodology, K.A.; software, K.A.; validation, K.A., Y.Z.; formal analysis, K.A.; investigation, K.A., Q.A. and M.J.A.B.; resources, Y.Z. and M.J.; data curation, K.A.; writing—original draft preparation, K.A.; writing—review and editing, K.A., Q.A., M.J.A.B. and M.J.; visualization, K.A.; supervision, Y.Z. and M.J.; project administration, Y.Z. and M.J.; funding acquisition, Y.Z., M.J. All authors have read and agreed to the published version of the manuscript.

Funding

1. This research was funded by [NSF of China, NSF-DFG Project] grant number [51861135301]. Project Name: Multi-Domain Modeling and Optimization of Integrated Renewable Energy and Urban Electric Vehicle Systems (moreEVS). 2. This research was also funded by [Memorial University of Newfoundland, Canada] grant number [20211214-Seed Fund]. Project Name: Proof-of-Concept Prototype for Robust Intelligent Battery Management for Electric Vehicles.

Acknowledgments

The authors also would like to thank Huei Peng with University of Michigan for sharing the battery aging experiment and Xiaosong Hu State Key Lab for Mechanical Transmissions, Chongqing University for sharing test data photo. The authors named M.J.A.B. and M.J. would also like to thank Memorial University of Newfoundland, Canada for providing the funding and necessary support to conduct the research.

Conflicts of Interest

The authors declare no conflict of interest.

Nomenclature

ICurrent
UVoltage
QBattery capacity
QnomNominal capacity
QactActual capacity
LIBLithium-ion battery
SOCState of charge
SOHState of health
BMSBattery management system
EVElectric vehicles
RCResistance-capacitance
C-rateCharge- and discharge rate
OCVOpen circuit voltage
CC-CVConstant current-constant voltage
ECMEquivalent circuit mode
EMElectrochemical model
IRInternal resistance
JCost or error function
mSize of the data set
θVector containing model parameter
yDenotes the cycle number
x1 and x2Vectors representing
ANNArtificial neural networks
nPositive integer
Uoc (SOC)Internal voltage of battery
Up1 and Up2Voltage across RC parallel

References

  1. Sulaiman, N.; Hannan, M.A.; Mohamed, A.; Majlan, E.H.; Wan Daud, W.R. A Review on Energy Management System for Fuel Cell Hybrid Electric Vehicle: Issues and Challenges. Renew. Sustain. Energy Rev. 2015, 52, 802–814. [Google Scholar] [CrossRef]
  2. Abdul-Manan, A.F.N. Uncertainty and Differences in GHG Emissions between Electric and Conventional Gasoline Vehicles with Implications for Transport Policy Making. Energy Policy 2015, 87, 1–7. [Google Scholar] [CrossRef]
  3. Rahimi-Eichi, H.; Ojha, U.; Baronti, F.; Chow, M.Y. Battery Management System: An Overview of Its Application in the Smart Grid and Electric Vehicles. IEEE Ind. Electron. Mag. 2013, 7, 4–16. [Google Scholar] [CrossRef]
  4. Xu, J.; Cao, B.; Chen, Z.; Zou, Z. An Online State of Charge Estimation Method with Reduced Prior Battery Testing Information. Int. J. Electr. Power Energy Syst. 2014, 63, 178–184. [Google Scholar] [CrossRef]
  5. Farmann, A.; Waag, W.; Marongiu, A.; Sauer, D.U. Critical Review of On-Board Capacity Estimation Techniques for Lithium-Ion Batteries in Electric and Hybrid Electric Vehicles. J. Power Sources 2015, 281, 114–130. [Google Scholar] [CrossRef]
  6. Rong, P.; Pedram, M. An Analytical Model for Predicting the Remaining Battery Capacity of Lithium-Ion Batteries. In Proceedings of the Proceedings-Design, Automation and Test in Europe, DATE, Brussels, Belgium, 19 February 2003; pp. 1148–1149. [Google Scholar]
  7. Bhangu, B.S.; Bentley, P.; Stone, D.A.; Bingham, C.M. Nonlinear Observers for Predicting State-of-Charge and State-of-Health of Lead-Acid Batteries for Hybrid-Electric Vehicles. IEEE Trans. Veh. Technol. 2005, 54, 783–794. [Google Scholar] [CrossRef] [Green Version]
  8. Herrmann, F.; Rothfuss, F. Introduction to Hybrid Electric Vehicles, Battery Electric Vehicles, and off-Road Electric Vehicles. In Advances in Battery Technologies for Electric Vehicles; Elsevier: Amsterdam, The Netherlands, 2015; pp. 3–16. ISBN 9781782423980. [Google Scholar]
  9. Shareef, H.; Islam, M.M.; Mohamed, A. A Review of the Stage-of-the-Art Charging Technologies, Placement Methodologies, and Impacts of Electric Vehicles. Renew. Sustain. Energy Rev. 2016, 64, 403–420. [Google Scholar] [CrossRef]
  10. Han, X.; Ouyang, M.; Lu, L.; Li, J. A Comparative Study of Commercial Lithium Ion Battery Cycle Life in Electric Vehicle: Capacity Loss Estimation. J. Power Sources 2014, 268, 658–669. [Google Scholar] [CrossRef]
  11. Doughty, D.; Roth, E.P. A General Discussion of Li Ion Battery Safety. Electrochem. Soc. Interface 2012, 21, 37–44. [Google Scholar] [CrossRef] [Green Version]
  12. Lajunen, A.; Suomela, J. Evaluation of Energy Storage System Requirements for Hybrid Mining Loaders. IEEE Trans. Veh. Technol. 2012, 61, 3387–3393. [Google Scholar] [CrossRef]
  13. Stiaszny, B.; Ziegler, J.C.; Krauß, E.E.; Schmidt, J.P.; Ivers-Tiffée, E. Electrochemical Characterization and Post-Mortem Analysis of Aged LiMn2O4-Li(Ni0.5Mn0.3Co0.2)O2/Graphite Lithium Ion Batteries. Part I: Cycle Aging. J. Power Sources 2014, 251, 439–450. [Google Scholar] [CrossRef]
  14. Barré, A.; Deguilhem, B.; Grolleau, S.; Gérard, M.; Suard, F.; Riu, D. A Review on Lithium-Ion Battery Ageing Mechanisms and Estimations for Automotive Applications. J. Power Sources 2013, 241, 680–689. [Google Scholar] [CrossRef] [Green Version]
  15. Ng, K.S.; Moo, C.S.; Chen, Y.P.; Hsieh, Y.C. Enhanced Coulomb Counting Method for Estimating State-of-Charge and State-of-Health of Lithium-Ion Batteries. Appl. Energy 2009, 86, 1506–1511. [Google Scholar] [CrossRef]
  16. Alvarez Anton, J.C.; Garcia Nieto, P.J.; Blanco Viejo, C.; Vilan Vilan, J.A. Support Vector Machines Used to Estimate the Battery State of Charge. IEEE Trans. Power Electron. 2013, 28, 5919–5926. [Google Scholar] [CrossRef]
  17. Huang, S.C.; Tseng, K.H.; Liang, J.W.; Chang, C.L.; Pecht, M.G. An Online SOC and SOH Estimation Model for Lithium-Ion Batteries. Energies 2017, 10, 512. [Google Scholar] [CrossRef]
  18. Lee, H.; Park, J.; Kim, J. Incremental Capacity Curve Peak Points-Based Regression Analysis for the State-of-Health Prediction of a Retired LiNiCoAlO2 Series/Parallel Configured Battery Pack. Electronics 2019, 8, 1118. [Google Scholar] [CrossRef] [Green Version]
  19. Liu, Z.; Zhao, J.; Wang, H.; Yang, C. A New Lithium-Ion Battery SOH Estimation Method Based on an Indirect Enhanced Health Indicator and Support Vector Regression in PHMs. Energies 2020, 13, 830. [Google Scholar] [CrossRef] [Green Version]
  20. Ma, C.; Zhai, X.; Wang, Z.; Tian, M.; Yu, Q.; Liu, L.; Liu, H.; Wang, H.; Yang, X. State of Health Prediction for Lithium-Ion Batteries Using Multiple-View Feature Fusion and Support Vector Regression Ensemble. Int. J. Mach. Learn. Cybern. 2019, 10, 2269–2282. [Google Scholar] [CrossRef]
  21. Dai, H.; Zhao, G.; Lin, M.; Wu, J.; Zheng, G. A Novel Estimation Method for the State of Health of Lithium-Ion Battery Using Prior Knowledge-Based Neural Network and Markov Chain. IEEE Trans. Ind. Electron. 2019, 66, 7706–7716. [Google Scholar] [CrossRef]
  22. Pan, H.; Lü, Z.; Wang, H.; Wei, H.; Chen, L. Novel Battery State-of-Health Online Estimation Method Using Multiple Health Indicators and an Extreme Learning Machine. Energy 2018, 160, 466–477. [Google Scholar] [CrossRef]
  23. Wu, J.; Wang, Y.; Zhang, X.; Chen, Z. A Novel State of Health Estimation Method of Li-Ion Battery Using Group Method of Data Handling. J. Power Sources 2016, 327, 457–464. [Google Scholar] [CrossRef]
  24. Khumprom, P.; Yodo, N. A Data-Driven Predictive Prognostic Model for Lithium-Ion Batteries Based on a Deep Learning Algorithm. Energies 2019, 12, 660. [Google Scholar] [CrossRef] [Green Version]
  25. Xu, H.; Peng, Y.; Su, L. Health State Estimation Method of Lithium Ion Battery Based on NASA Experimental Data Set. IOP Conf. Ser. Mater. Sci. Eng. 2018, 452, 032067. [Google Scholar] [CrossRef]
  26. Chen, Z.; Sun, M.; Shu, X.; Shen, J.; Xiao, R. On-Board State of Health Estimation for Lithium-Ion Batteries Based on Random Forest. Proc. IEEE Int. Conf. Ind. Technol. 2018, 1754–1759. [Google Scholar] [CrossRef]
  27. Proakis, J.G.; Manolakis, D.G. Digital Signal Processing: Principles, Algorithms, and Applications. 1996. Available online: https://www.amazon.com/Digital-Signal-Processing-Principles-Applications/dp/002396815X (accessed on 5 February 2022).
Figure 1. The ML battery modeling schematic.
Electronics 11 01216 g001
Figure 2. The physical layout of the battery testing system.
Electronics 11 01216 g002
Figure 3. The capacity prediction of battery 25.
Electronics 11 01216 g003
Figure 4. The capacity prediction of battery 26.
Electronics 11 01216 g004
Figure 5. The capacity prediction of battery 27.
Electronics 11 01216 g005
Figure 6. The SOH prediction of battery 25.
Electronics 11 01216 g006
Figure 7. The SOH prediction of battery 26.
Electronics 11 01216 g007
Figure 8. The SOH prediction of battery 27.
Electronics 11 01216 g008
Figure 9. The error in predicting the SOH for battery 25.
Electronics 11 01216 g009
Figure 10. The error in predicting the SOH for battery 26.
Electronics 11 01216 g010
Figure 11. The error in predicting the SOH for battery 27.
Electronics 11 01216 g011
Figure 12. The accuracy in prediction of SOH for battery 25.
Electronics 11 01216 g012
Figure 13. The accuracy in prediction of SOH for battery 26.
Electronics 11 01216 g013
Figure 14. The accuracy in prediction of SOH for battery 27.
Electronics 11 01216 g014
Table 1. A comparison of several machine learning methods for estimating SOH.
Method #VariantsRef.Battery Chemistry Training Data SizeEstimationError
LRHuang et al. [17]1.1 Ah LCO1/4 cellsMultiple<2.6% RMSE
LRLee et al. [18]2.0 Ah NCA1/12 cellsMultiple<1% AE
SVMLiu et al. [19]2 Ah NMC120/168 cyclesSingle0.24% RMSE
LS-SVMDeng et al. [20]10 Ah LFP75% cyclesSingle0.6% RMSE
ANN #FFNNDai et al. [21]LFP135/168 CyclesSingle<1.7% MaxE
ANN #ELMPan et al. [22]NMCAll cyclesMultiple2.22% MaxE
DL #DNNWu et al. [23]LFP60% cyclesSingle<5% MAE
DL #DNNKhumprom et al. [24]NMCAll cyclesMultiple3.43% RMSE
EL #RFXu et al. [25]NMC75% cyclesMultiple2% RMSE
EL #RFChen et al. [26]NMCAll cyclesMultiple2% MaxARE
Table 2. Driving cycle information.
Battery DataCurrent (A)Voltage (V)Charge Capacity (Ah)Discharge Capacity (Ah)Cycles
CH data 251.10022.51330.988621.9706122
CH data 261.09992.50470.977381.9557122
CH data 271.10032.51310.98191.5356118
Publisher’s Note: MDPI stays neutral with regard to jurisdictional claims in published maps and institutional affiliations.

