
Feasibility Prediction for Rapid IC Design Space Exploration


Department of Computer Science and Electrical Engineering, University of Maryland Baltimore County, Baltimore, MD 21250, USA
Electronics 2022, 11(7), 1161; https://doi.org/10.3390/electronics11071161
Submission received: 20 February 2022
/
Revised: 30 March 2022
/
Accepted: 5 April 2022
/
Published: 6 April 2022
(This article belongs to the Section Circuit and Signal Processing)
Abstract
:The DARPA POSH program echoes with the research community and identifies that engineering productivity has fallen behind Moore’s law, resulting in the prohibitive increase in IC design cost at leading technology nodes. The primary reason is that it requires many computing resources, expensive tools, and even many days to complete a design implementation. However, at the end of this process, some designs could not meet the design constraints and become unroutable, creating a vicious circuit design cycle. As a result, designers have to re-run the whole process after design modification. This research applied a machine learning approach to automatically identify design constraints and design rule checking (DRC) violation issues and help the designer identify design constraints with optimal DRCs before the long detailed routing process through iterative greedy search. The proposed algorithm achieved up to 99.99% design constraint prediction accuracy and reduced 98.4% DRC violations with only a 6.9% area penalty.
1. Introduction
In recent years, information technology is experiencing tremendous growth due to the remarkably low sensor price and a sea of devices connected to the internet, including mobile phones, wristwatches, TVs, cars, washing machines, etc. [1,2,3]. On the other hand, computational power has increased significantly, and researchers are struggling to meet the market demand at low-cost, especially at low-technology nodes (i.e., below 20 nm technologies) [4,5]. The primary reasons are the increasing number of design rules, design complexity, high-performance, and lower area budget. After considering all those issues, implementing a design rule checking (DRC) violations clean design is exceptionally challenging. The primary reason is the existing global routing-based congestion maps do not adequately correlate with the DRC violations maps after the detailed routing phase [6].
1.1. Motivation
The conventional IC design flow uses hardware descriptive language and then uses logic synthesis and place and route tools for implementation. Depending on the size of a design, this implementation process may take several days to weeks [7]. Moreover, the DRC violations are only visible to designers after the final step of the design and require critical technical expertise to resolve those with specific instructions or manually. Moreover, meeting several design constraints can lead to many implementation iterations and consequently increasing the chip price.
At low-technology nodes, researchers identified several issues such as compact design rules, constraint in via placements, and metal routing orientations [8]. The severity of those issues could lead to design to a point where the benefits of technology scaling even could diminish. Furthermore, there are several reasons why high-end process technology developers cannot accurately measure sophisticated IC design rules. One of the crucial reasons is electronic design automation (EDA) companies allow only close co-development with customers resulting in a long time-consuming process that creates a vicious cycle. In addition, the library exchange format (LEF) standards are not consistent among different vendors. All those factors again increase design and development time. As a result, research started applying machine learning approaches in the IC design process [9].
1.2. Related Work
Machine learning (ML) algorithms have widespread use in every abstraction layer of computation, including edge computing [10], cloud computation [11], internet of things (IoTs), conventional feature space exploitation for performance estimation [12]. However, ML applications on EDA have a much more significant impact due to electronics in every aspect of our life. Researchers primarily consider standard design layout features that have a significant impact on DRC violations. A congestion predictor uses pin shape layouts and their density to identify local routing hotspots [13]. Researchers use a supervised machine learning approach to improve detailed routing considering global routing features [14]. Chan et al. [6] proposed a supervised machine learning-based white space allocation approach at the detailed routing stage to improve routability and reduce the number of DRC violations. However, this approach requires additional legalization after new cell placements. Islam et al. [15] used unsupervised machine learning algorithms for clock tree synthesis (CTS). Kahng et al. proposed a multi-armed bandit (MAB) algorithm considering the area, slack time, and the number of tool runs thresholds to reduce tool noise and increase profitability [16]. However, this method requires an exhaustive tool run to identify the optimal frequency of a design.
A deep learning approach uses a convolutional neural network (CNN) for DRC hotspots prediction [17]. This approach uses trial route and pin density features and constructs a single tensor image size of . However, the CNN approach suffers from low prediction accuracy. Another J-Net-based CNN architecture predicts DRC hotspots using high-resolution pin configuration images and low-resolution tile-based feature maps [18]. However, this approach also suffers from low prediction accuracy. Another attractive deep learning-based model uses pin-related features to identify metal-related issues in the layouts. However, this approach ignores issues related to other physical properties of a layout [19].
1.3. Contributions
This research used ensemble ML methods and heuristic greedy algorithms to improve synthesis tool performance by predicting optimal design constraints and DRC violations. A large dataset was collected using extremely time-consuming industrial synthesis and implementation tools. The proposed EDA synthesis flow can target both application-specific integrated circuit (ASIC) and field-programmable gate array (FPGA) implementations. In particular, the key contributions in this work are:
- To the best of the author’s knowledge, this is the first-ever approach to improving synthesis tool performance by combining ensemble learning algorithms and a greedy approach.
- To the best of the author’s knowledge, this is the first-ever approach to guide inexperienced designers with efficient design choices to reduce the precious design time.
- This research collected 74 design features from layouts and identified the design constraints those influence DRC violations.
2. Background
Figure 1 shows the vicious cycle of EDA tools flow, since each stage of tools flow creates tremendous stress to the circuit designer in order to optimize the Pareto optimal parameters such as performance, power, area, cost, and design time to launch the implemented design [20,21,22]. At the beginning of the traditional system on chip (SoC) hardware design flow, the behavioral description of the design systems needs to be written using the hardware description language [7], which is the register transfer level (RTL) of abstraction. Recently, due to the increasing popularity of hardware accelerators, the abstraction level is rising from RTL to the algorithmic level, which is described using high-level languages such as C, C++, SystemC, or Simulink and then followed by an automated high-level synthesis (HLS) flow to synthesize these descriptions to generate RTL [23,24,25,26]. These multiple processes of system description allow designers to evaluate multiple alternatives, which is known as design space exploration (DSE) [27,28]. Then, to meet the functional requirements of design, we need to run the functional simulation until it meets the requirements.
After successful RTL translation from the behavior description, we resort to EDA tools to translate RTL to gate-level netlist through a logical synthesizer for formal verification [29]. The translated gate-level netlist contains timing information in terms of basic gates. Such information helps EDA tools to perform static timing analysis for checking several design constraints such as setup and hold times, process corners variation, temperature variations, and interconnect variations [30]. Failure to meet these criteria requires tedious effort to fix the HDL description of the given design.
After successful gate-level synthesis, EDA tools initiate the physical design steps, where partitioning is the first step. In the partitioning step, EDA tools separate the whole gate-level netlist into different partitions in order to facilitate parallel implementation of each sub-system. However, this partitioning introduced several constraints in the design, such as communication cost among the sub-system, timing budgets, and inter-dependency among the sub-system [31]. Hence, several optimization techniques, as well as the machine learning model, were introduced to deal with these constraints [31,32,33].
After partitioning, EDA tools perform floorplanning to estimate the rough area of the logic cells and modules, power network, and I/O pads through optimization of several constraints such as minimization of area, limitation of aspect ratio, reducing routing, minimum voltage islands, and distribution of heat map throughout the chip. After estimating the rough area, EDA tools perform clock tree synthesis (CTS), routing, DRC violation cleaning, and Layout Versus Schematic (LVS) in the placement step before sending it for fabrication.
3. Proposed Methodology
In order to correlate design choices with the layout features, this research considers empirical design constraints. For example, clock period (CP), aspect ratio (AR), total wire length (TWL), total area (TA), core utilization (CU), etc. All those features have a significant impact on the routability of a design and help us to build a large dataset. The proposed methodology automatically identifies the set of optimal design constraints for the designer to reduce design time by ensuring routability of a design before the most expensive detailed routing phase, as shown in Figure 2.
First of all, the proposed algorithm uses a decision tree regression (DTR) algorithm to predict CU, AR, TA, CP, the number of DRC, and TWL. The DTR is a standard supervised learning algorithm used for both classification and regression [34,35,36,37]. The decision tree considers an independent set of rules, and the top-down approach is the ensemble of many attribute tests from root to each leaf node. This method uses a criterion function considering either mean squared error (MSE) or mean absolute error (MAE).
Unlike existing block-based or grid-based DRC violation prediction, the proposed method predicts design constraints and violations in a design. From many design implementations () and design features (), we can define objective or cost functions to determine the optimal model. When we want to maximize two features and , our objective function will try to maximize . Similarly, when we want to minimize two features, the objective function will try to maximize . On the contrary, when we try to increase one feature and decrease the other, then the objective function tries to increase the differences using .
Algorithm 1 shows the optimal design cost computation model. This algorithm uses a set of designs, a set of associated features, and an optimization type () as inputs and returns the optimal cost. The algorithm iterates through each design from and associated features from and computes the maximization, minimization, and maximum difference using , , and functions, respectively, from Line 5 to Line 24. It is worth mentioning that depending on the only one of the conditional blocks (i.e., Line 7 or Line 12 or Line 17) will be true. Then Algorithm 1 returns the optimal cost in Line 25.
| Algorithm 1 Optimal design cost algorithm |
|
Once the proposed methodology computes the optimal cost function associated with an optimal design, it can guide the researchers to set the right set of constraints for their design using the proposed greedy approach. The proposed iterative greedy search (IGS) algorithm correlates the features with the results in optimal design constraints and the number of DRC. To be precise, it used an iterative method to identify the optimal set of design constraints.
The proposed IGS takes a set of features and a feature priority list as inputs and returns the optimal design constraints, as shown in Algorithm 2. The function iteratively computes the optimized results depending on the Cartesian product of x and y pairs and given the priority list in Line 6, utilizing Algorithm 1. The function computes the optimal design constraints in Line 8. Finally, Algorithm 2 returns the efficient design constraints in Line 9. For n number of feature constraints; the for loop in Line 5 uses iterations. However, the proposed methodology has a limited number of feature constraints, so the algorithm is very time-efficient.
| Algorithm 2 Iterative greedy search algorithm |
|
4. Experimental Results and Discussion
4.1. Experimental Setup
The proposed methodology considered the open-source implementation of arithmetic cores, cryptographic cores, processors, co-processors, memory cores, ECC cores, communications and system controllers, DSP cores, video controllers from OpenCore [38]. It varied in its different high-level features and implemented 589 designs, and each design contained 74 features, resulting in ∽60.8 K data.
This research used a Synopsys Design Compiler for logic synthesis and an IC Compiler for placing and routing with a 28 nm CMOS technology library. For synthesis and placing and routing, it used our custom tool command language (TCL) script. This research considered 80% data for training and 20% data for the test. In addition, it used the Python programming language to implement the proposed algorithms on an Intel Xeon(R) Silver 3.2 GHz 20-core processor with 48 GB random access memory (RAM).
4.2. Results
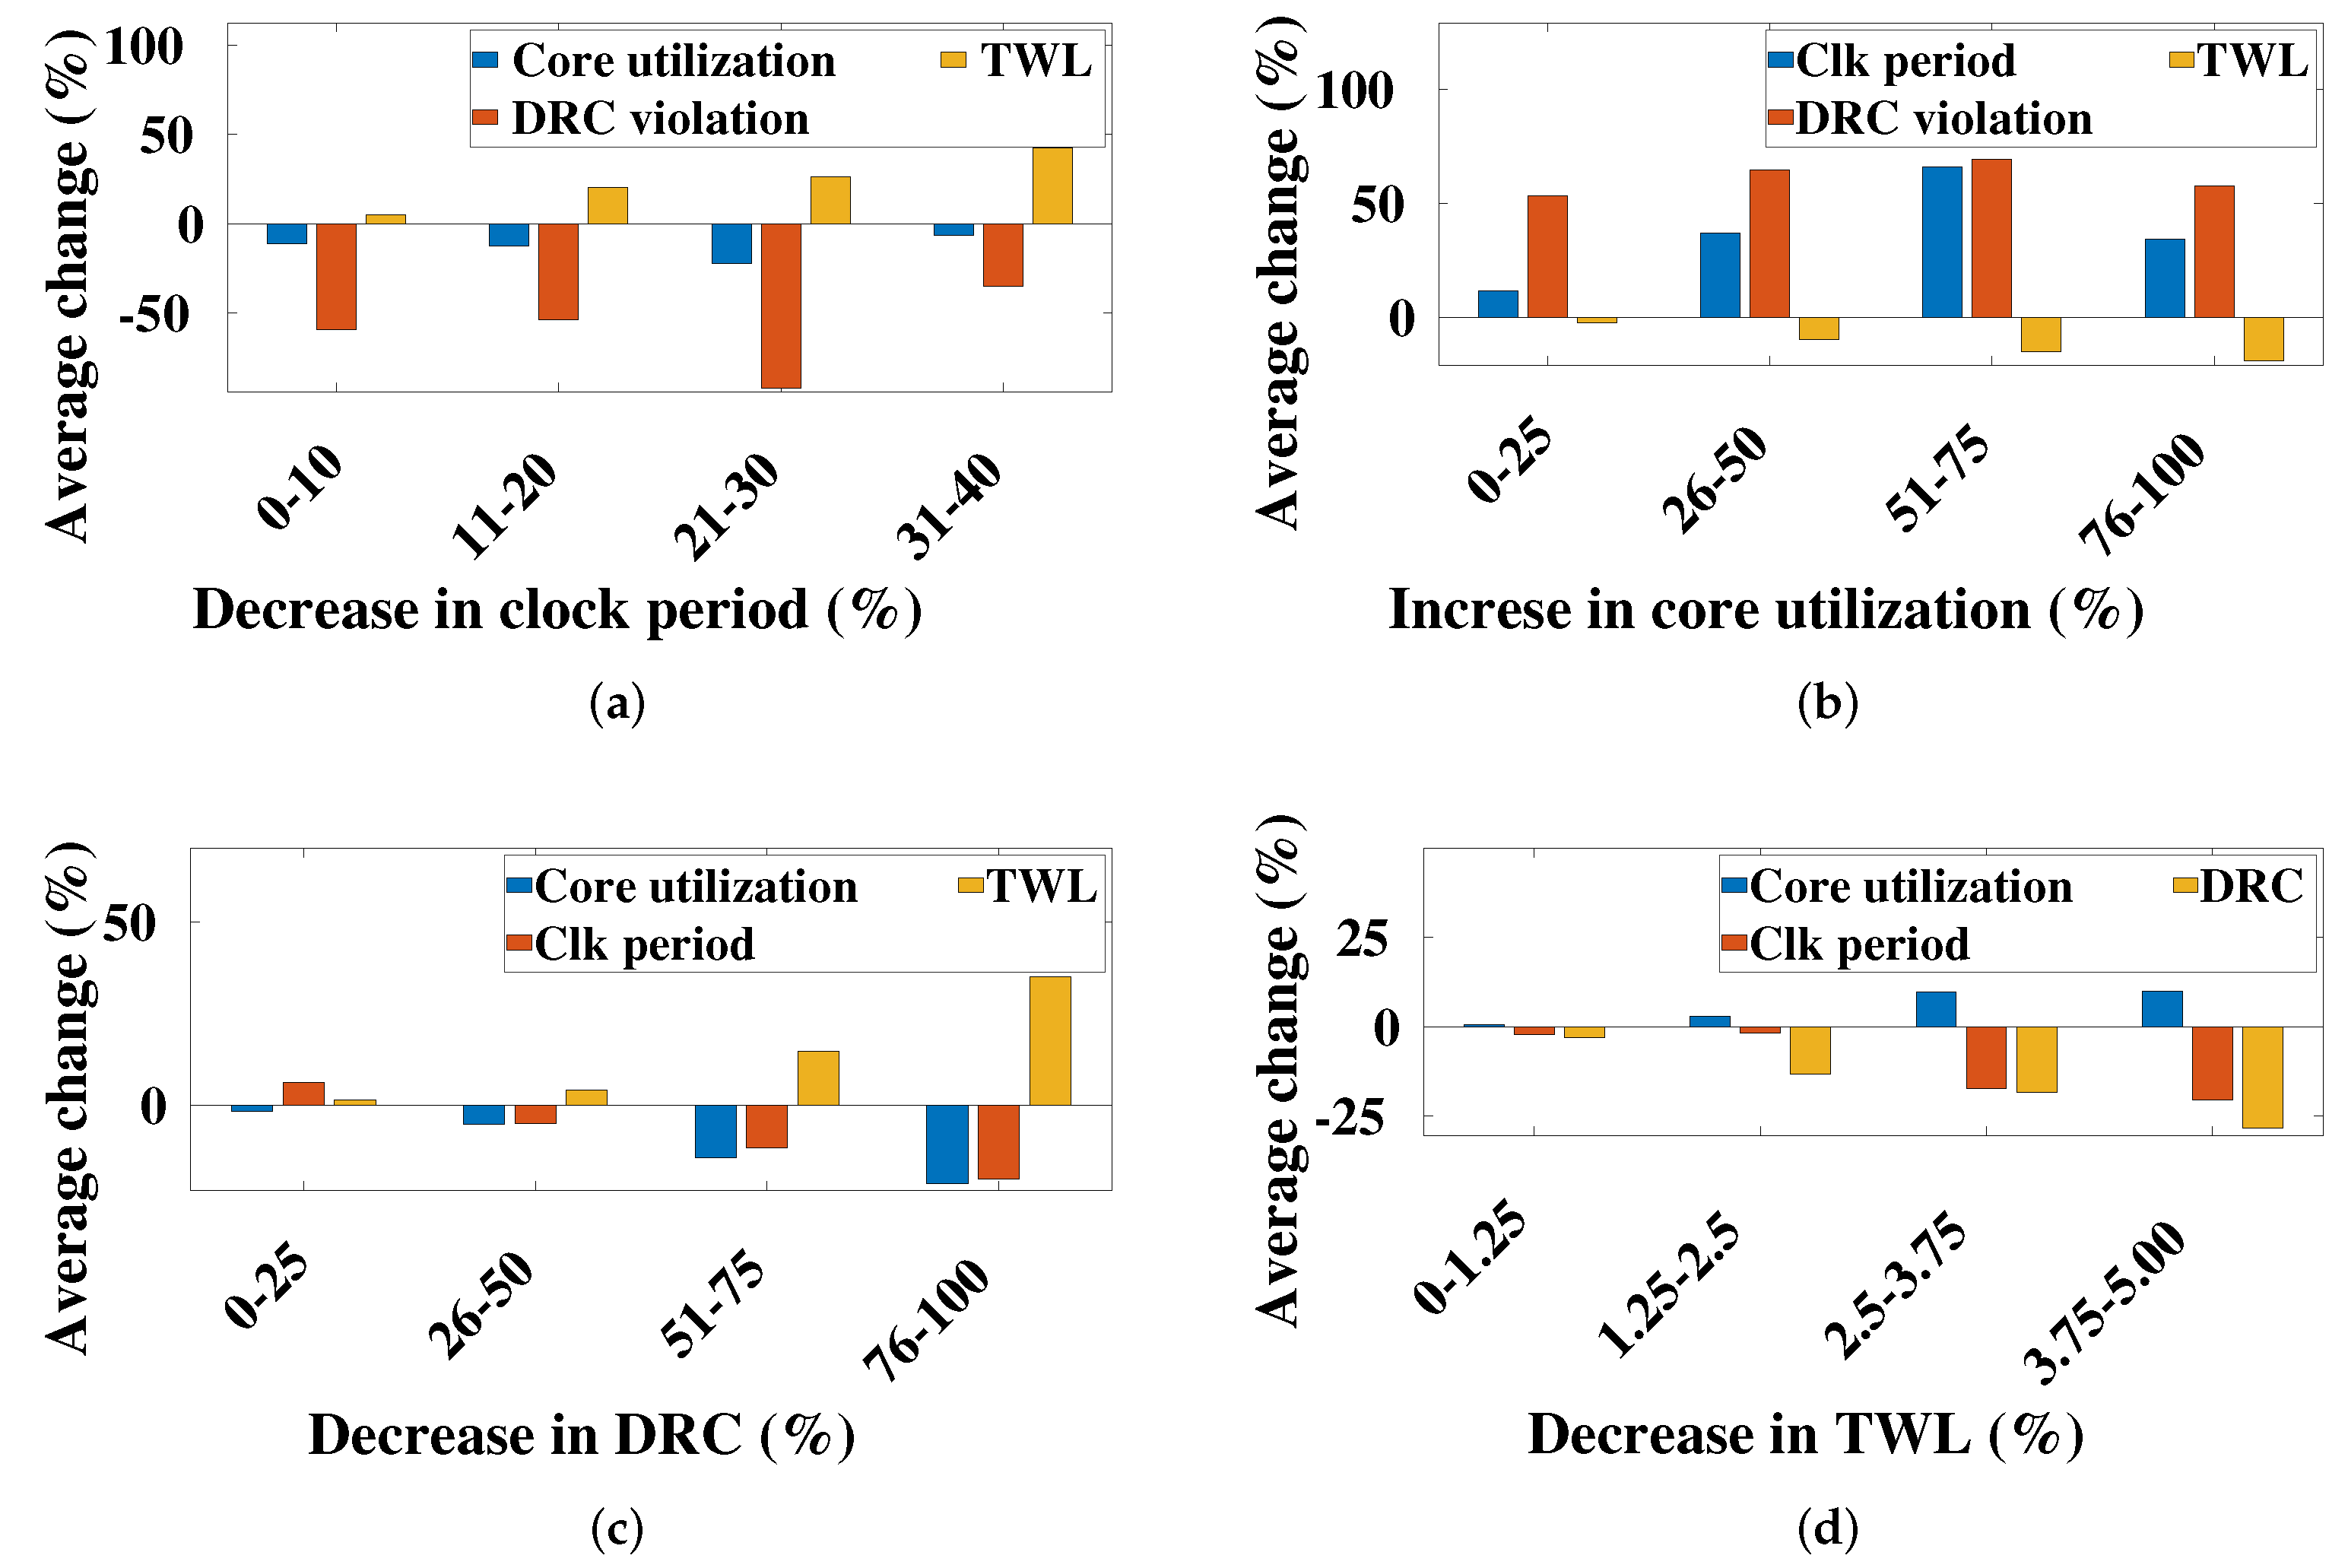
To determine design feature dependencies, we consider several design constraints including, CP, CU, DRC violations, and TWL, as shown in Figure 3a, Figure 3b, Figure 3c, and Figure 3d, respectively. Empirically, clock period variation has a non-linear relationship with CU and DRC violation and mostly worsens DRC issues. However, the proposed algorithm identifies the best suitable CU, DRC violations, and TWL for a specific CP. The best solutions exhibit that reduction in CP reduces the CU and DRC violation, but it increases the TWL. A 21–30% reduction in CP resulted in a significant 53% reduction in DRC violations. The increase in core utilization had an adverse impact on DRC violations and CP, as shown in Figure 3b. In general, a decrease in DRC violations requires a reduction in CU and an increase in TWL, as shown in Figure 3c. An increase in TWL reduces the DRC violations. However, it improves the clock frequency and confirms the non-linear relationship among those constraints, as shown in Figure 3d, resulting in a non-trivial task in the designer hand.
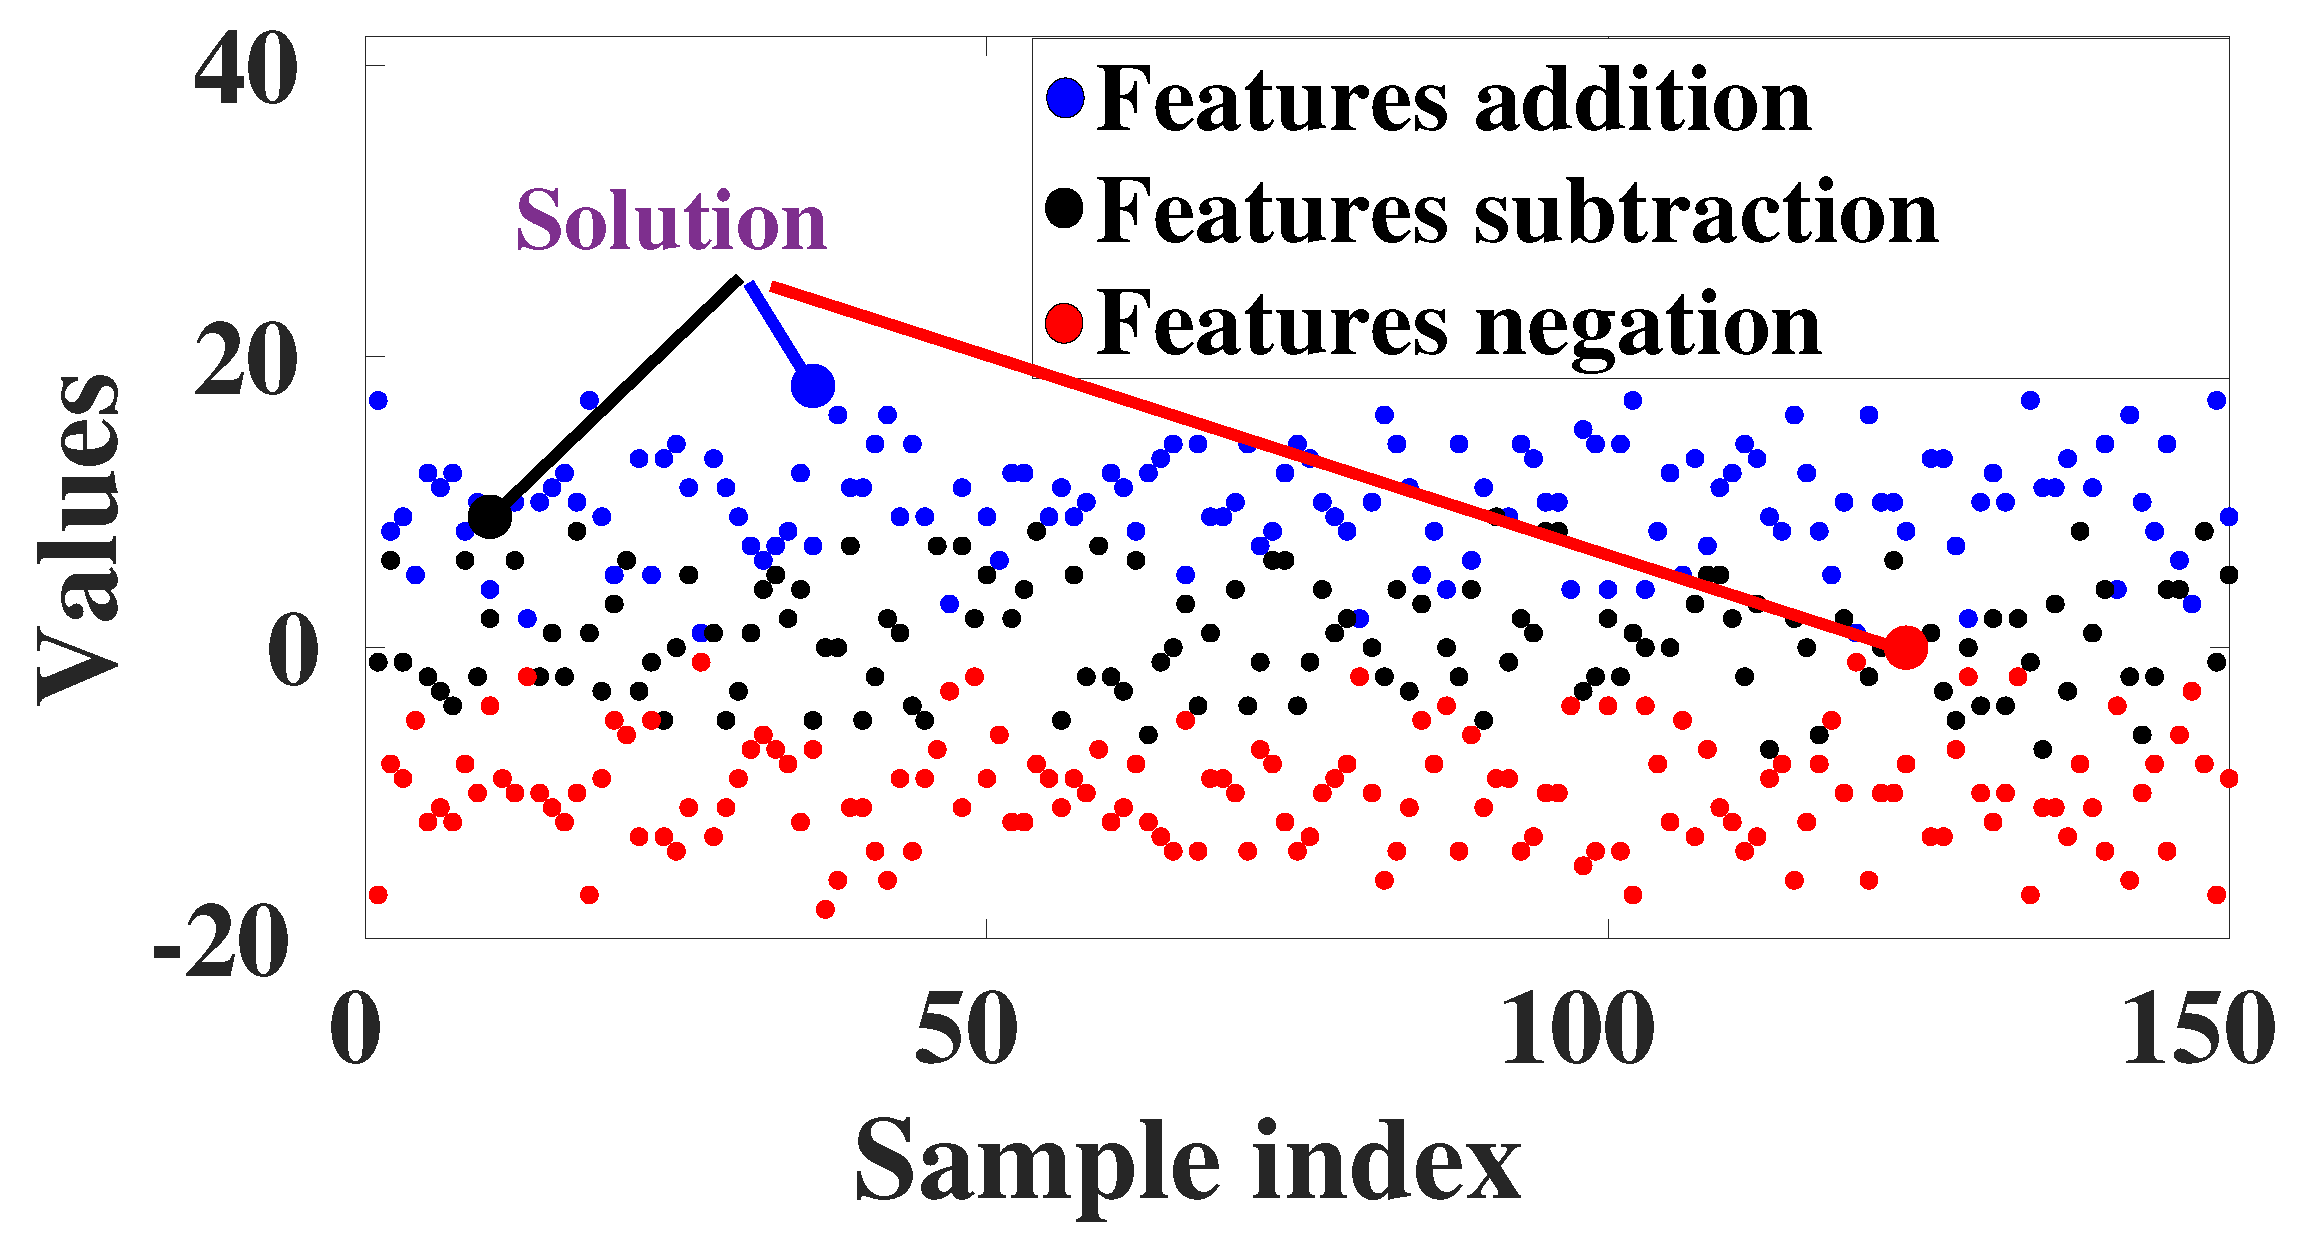
The proposed methodology performed analysis considering our maximization, minimization, and differentiation functions, as shown in Figure 4. The optimal solutions are represented by the largest blue, red, and black circles, considering maximization, minimization, and subtraction functions, respectively.
This research defines the constraints prediction problem as a DTR algorithm. In this analysis, it considered 42 random_state for the splitting and MSE criteria function.
The proposed algorithm predicted the CU, AR, TA, CP, number of DRC violations, and TW using the DTR algorithm, as shown in Table 1. The proposed methodology has a prediction accuracy of 99.99%, 99.57%, 99.99%, 99.44%, 88.9%, and 99.96% for CU, AR, TA, CP, DRC violations, and TW, respectively.
Table 1 shows the greedy-based design-space exploration algorithm results. It compared these research results with the existing industry-standard synthesis tools (baseline). Each pair of rows of results uses single priority constraints (bold fonts). For example, when one sets CU as a priority, the proposed method shows 11.2% CU improvement and 75.8% DRC reduction. Similarly, the proposed algorithm reduces 98.4% DRC violations with only a 6.9% area penalty.
4.3. Discussion
Following an ensemble DTR algorithm, we proposed a optimal design cost algorithm (i.e., IGS) that used physical design-related features and performance-related features to identify the optimal set of design parameters. A priority-based design space-exploration allow designers to capture best solutions for a given set of constraints. The proposed DTR algorithm exhibits 88.9% DRC hotspot prediction accuracy compared to existing CNN-based model’s [17] 73% prediction accuracy.
The proposed DTR algorithm has a training time complexity of n, where is dimensions or features, and n is the data points. The testing time complexity of the proposed DTR algorithm is , where is the depth of the tree. The performance of Algorithm 1 is almost constant in time due to the use of a limited number of designs and design features. The proposed DTR algorithm requires 31.8 ms training time and 0.72 ms inference time, while the existing J-Net-based CNN model [18] has 2 h of training time and 1 min of inference time.
The inclusion of the proposed methodology with the existing EDA tools has the potential to reduce days of engineering costs. In addition, it will pave the designer’s way to building a better constraint model for area and performance optimizations.
5. Conclusions
This paper proposed a searching algorithm by combining both ensemble and heuristic greedy search methods to explore the design space quickly and efficiently in order to improve the synthesis tool flow performance. To explore large search space as well as to illustrate the efficacy of proposed algorithm, this research collected a large number of features (i.e., 74) from various designs and identified the features those influence DRC violations. The proposed algorithm achieved up to 99.99% design constraint prediction accuracy before tedious detailed-routing and reduced 98.4% DRC violations with only a 6.9% area penalty.
Funding
This research was funded in part by UMBC start up grant, Rezonent Inc. award number: CORP-0061, National Science Foundation (NSF) award number: 2138253, and Office of Naval Research (ONR) award number: N00014-21-1-2531.
Institutional Review Board Statement
Not applicable.
Informed Consent Statement
Not applicable.
Data Availability Statement
Not applicable.
Acknowledgments
We acknowledge M. K. Devnath and M. Galib’s contributions to data analysis and figure generations.
Conflicts of Interest
The author declares no conflict of interest.
References
- Bahar, R.; Jones, A.K.; Katkoori, S.; Madden, P.H.; Marculescu, D.; Markov, I.L. Workshops on Extreme Scale Design Automation (ESDA) Challenges and Opportunities for 2025 and Beyond. arXiv 2020, arXiv:2005.01588. [Google Scholar]
- Sinha, S.; Xu, X.; Bhargava, M.; Das, S.; Cline, B.; Yeric, G. Stack up your chips: Betting on 3D integration to augment Moore’s Law scaling. arXiv 2020, arXiv:2005.10866. [Google Scholar]
- Lopera, D.S.; Servadei, L.; Kiprit, G.N.; Hazra, S.; Wille, R.; Ecker, W. A Survey of Graph Neural Networks for Electronic Design Automation. In Proceedings of the 2021 ACM/IEEE 3rd Workshop on Machine Learning for CAD (MLCAD), Raleigh, NC, USA, 30 August–3 September 2021; pp. 1–6. [Google Scholar]
- Ji, Z.; Chen, H.; Li, X. Design for reliability with the advanced integrated circuit (IC) technology: Challenges and opportunities. Sci. China Inf. Sci. 2019, 62, 1–4. [Google Scholar] [CrossRef] [Green Version]
- Hou, C. 1.1 A smart design paradigm for smart chips. In Proceedings of the 2017 IEEE International Solid-State Circuits Conference (ISSCC), San Francisco, CA, USA, 5–9 February 2017; pp. 8–13. [Google Scholar]
- Chan, W.T.; Ho, P.H.; Kahng, A.; Saxena, P. Routability Optimization for Industrial Designs at Sub-14nm Process Nodes Using Machine Learning. In Proceedings of the 2017 ACM on International Symposium on Physical Design, Portland, OR, USA, 19–22 March 2017; pp. 15–21. [Google Scholar]
- Taraate, V. ASIC Design Flow. In ASIC Design and Synthesis; Springer: Berlin/Heidelberg, Germany, 2021; pp. 13–26. [Google Scholar]
- Han, K.; Kahng, A.B.; Lee, H. Evaluation of BEOL design rule impacts using an optimal ILP-based detailed router. In Proceedings of the ACM/EDAC/IEEE Design Automation Conference, San Francisco, CA, USA, 8–12 June 2015; pp. 1–6. [Google Scholar]
- Mirhoseini, A.; Goldie, A.; Yazgan, M.; Jiang, J.; Songhori, E.; Wang, S.; Lee, Y.-J.; Johnson, E.; Pathak, O.; Bae, S.; et al. Chip Placement with Deep Reinforcement Learning. arXiv 2020, arXiv:cs.LG/2004.10746. [Google Scholar]
- Li, X.; Ma, Z.; Zheng, J.; Liu, Y.; Zhu, L.; Zhou, N. An Effective Edge-Assisted Data Collection Approach for Critical Events in the SDWSN-Based Agricultural Internet of Things. Electronics 2020, 9, 907. [Google Scholar] [CrossRef]
- Mohammad, A.S.; Pradhan, M.R. Machine learning with big data analytics for cloud security. Comput. Electr. Eng. 2021, 96, 107527. [Google Scholar] [CrossRef]
- Ferianc, M.; Fan, H.; Manocha, D.; Zhou, H.; Liu, S.; Niu, X.; Luk, W. Improving Performance Estimation for Design Space Exploration for Convolutional Neural Network Accelerators. Electronics 2021, 10, 520. [Google Scholar] [CrossRef]
- Taghavi, T.; Li, Z.; Alpert, C.; Nam, G.; Huber, A.; Ramji, S. New placement prediction and mitigation techniques for local routing congestion. In Proceedings of the IEEE/ACM International Conference on Computer-Aided Design, San Jose, CA, USA, 7–11 November 2010; pp. 621–624. [Google Scholar]
- Qi, Z.; Cai, Y.; Zhou, Q. Accurate prediction of detailed routing congestion using supervised data learning. In Proceedings of the IEEE International Conference on Computer Design (ICCD), Seoul, Korea, 19–22 October 2014; pp. 97–103. [Google Scholar]
- Islam, R.; Guthaus, M.R. HCDN: Hybrid-Mode Clock Distribution Networks. IEEE Trans. Circuits Syst. I Regul. Pap. 2019, 66, 251–262. [Google Scholar] [CrossRef]
- Kahng, A.B.; Kumar, S.; Shah, T. A No-Human-in-the-Loop Methodology Toward Optimal Utilization of EDA Tools and Flows. In Proceedings of the ACM/EDAC/IEEE Design Automation Conference, San Francisco, CA, USA, 24–29 June 2018; pp. 1–6. [Google Scholar]
- Li, L.; Cai, Y.; Zhou, Q. An Efficient Approach for DRC Hotspot Prediction with Convolutional Neural Network. In Proceedings of the IEEE International Symposium on Circuits and Systems, Daegu, Korea, 22–28 May 2021; pp. 1–5. [Google Scholar] [CrossRef]
- Liang, R.; Xiang, H.; Pandey, D.; Reddy, L.; Ramji, S.; Nam, G.J.; Hu, J. DRC Hotspot Prediction at Sub-10 nm Process Nodes Using Customized Convolutional Network; Association for Computing Machinery: New York, NY, USA, 2020; pp. 135–142. [Google Scholar]
- Tabrizi, A.F.; Darav, N.K.; Rakai, L.; Kennings, A.; Behjat, L. Detailed routing violation prediction during placement using machine learning. In Proceedings of the International Symposium on VLSI Design, Automation and Test, Hsinchu, Taiwan, 24–27 April 2017; pp. 1–4. [Google Scholar]
- Givargis, T.; Vahid, F.; Henkel, J. System-level exploration for pareto-optimal configurations in parameterized systems-on-a-chip. In Proceedings of the IEEE/ACM International Conference on Computer Aided Design. ICCAD 2001. IEEE/ACM Digest of Technical Papers (Cat. No. 01CH37281), San Jose, CA, USA, 4–8 November 2001; pp. 25–30. [Google Scholar]
- Palesi, M.; Givargis, T. Multi-objective design space exploration using genetic algorithms. In Proceedings of the Tenth International Symposium on Hardware/Software Codesign, Estes Park, CO, USA, 8 May 2002; pp. 67–72. [Google Scholar]
- Barbareschi, M.; Barone, S.; Mazzocca, N. Advancing synthesis of decision tree-based multiple classifier systems: An approximate computing case study. Knowl. Inf. Syst. 2021, 63, 1577–1596. [Google Scholar] [CrossRef]
- Qamar, A.; Muslim, F.B.; Iqbal, J.; Lavagno, L. LP-HLS: Automatic power-intent generation for high-level synthesis based hardware implementation flow. Microprocess. Microsyst. 2017, 50, 26–38. [Google Scholar] [CrossRef] [Green Version]
- Muslim, F.B.; Qamar, A.; Lavagno, L. Low power methodology for an ASIC design flow based on high-level synthesis. In Proceedings of the 2015 23rd International Conference on Software, Telecommunications and Computer Networks (SoftCOM), Split, Croatia, 16–18 September 2015; pp. 11–15. [Google Scholar]
- Liu, H.Y.; Carloni, L.P. On learning-based methods for design-space exploration with high-level synthesis. In Proceedings of the 50th Annual Design Automation Conference, Austin, TX, USA, 29 May 2013; pp. 1–7. [Google Scholar]
- Ravi, S.; Joseph, M. High-level test synthesis: A survey from synthesis process flow perspective. ACM Trans. Des. Autom. Electron. Syst. (TODAES) 2014, 19, 1–27. [Google Scholar] [CrossRef]
- Cong, J. From design to design automation. In Proceedings of the 2014 on International Symposium on Physical Design, Petaluma, CA, USA, 30 March–2 April 2014; pp. 121–126. [Google Scholar]
- Deshwal, A.; Jayakodi, N.K.; Joardar, B.K.; Doppa, J.R.; Pande, P.P. MOOS: A Multi-Objective Design Space Exploration and Optimization Framework for NoC Enabled Manycore Systems. ACM Trans. Embed. Comput. Syst. 2019, 18, 1–23. [Google Scholar] [CrossRef]
- Zaki, M.H.; Tahar, S.; Bois, G. Formal verification of analog and mixed signal designs: A survey. Microelectron. J. 2008, 39, 1395–1404. [Google Scholar] [CrossRef] [Green Version]
- Kahng, A.B. New directions for learning-based IC design tools and methodologies. In Proceedings of the 2018 23rd Asia and South Pacific Design Automation Conference (ASP-DAC), Jeju, Korea, 22–25 January 2018; pp. 405–410. [Google Scholar] [CrossRef]
- Kahng, A.B. Reducing time and effort in IC implementation: A roadmap of challenges and solutions. In Proceedings of the 55th Annual Design Automation Conference, San Francisco, CA, USA, 24–29 June 2018; pp. 1–6. [Google Scholar]
- Ren, H. Toward Intelligent Physical Design: Deep Learning and GPU Acceleration. In Proceedings of the 2019 International Symposium on Physical Design, San Francisco, CA, USA, 14–17 April 2019; pp. 91–92. [Google Scholar]
- Kahng, A.B.; Lienig, J.; Markov, I.L.; Hu, J. VLSI Physical Design: From Graph Partitioning to Timing Closure; Springer Science & Business Media: Berlin/Heidelberg, Germany, 2011. [Google Scholar]
- Islam, R.; Shahjalal, M.A. Soft Voting-Based Ensemble Approach to Predict Early Stage DRC Violations. In Proceedings of the 2019 IEEE 62nd International Midwest Symposium on Circuits and Systems (MWSCAS), Dallas, TX, USA, 4–7 August 2019; pp. 1081–1084. [Google Scholar] [CrossRef]
- Somvanshi, M.; Chavan, P.; Tambade, S.; Shinde, S.V. A review of machine learning techniques using decision tree and support vector machine. In Proceedings of the 2016 International Conference on Computing Communication Control and automation (ICCUBEA), Pune, India, 12–13 August 2016; pp. 1–7. [Google Scholar] [CrossRef]
- Islam, R.; Shahjalal, M.A. Predicting DRC Violations Using Ensemble Random Forest Algorithm. In Proceedings of the Annual Design Automation Conference 2019, Las Vegas, NV, USA, 2–6 June 2019; ACM: New York, NY, USA, 2019; pp. 1–2. [Google Scholar]
- Onan, A.; Korukoğlu, S.; Bulut, H. A multiobjective weighted voting ensemble classifier based on differential evolution algorithm for text sentiment classification. Expert Syst. Appl. 2016, 62, 1–16. [Google Scholar] [CrossRef]
- OpenCores: Open Source IP-Cores. Available online: http://www.opencores.org (accessed on 10 November 2018).
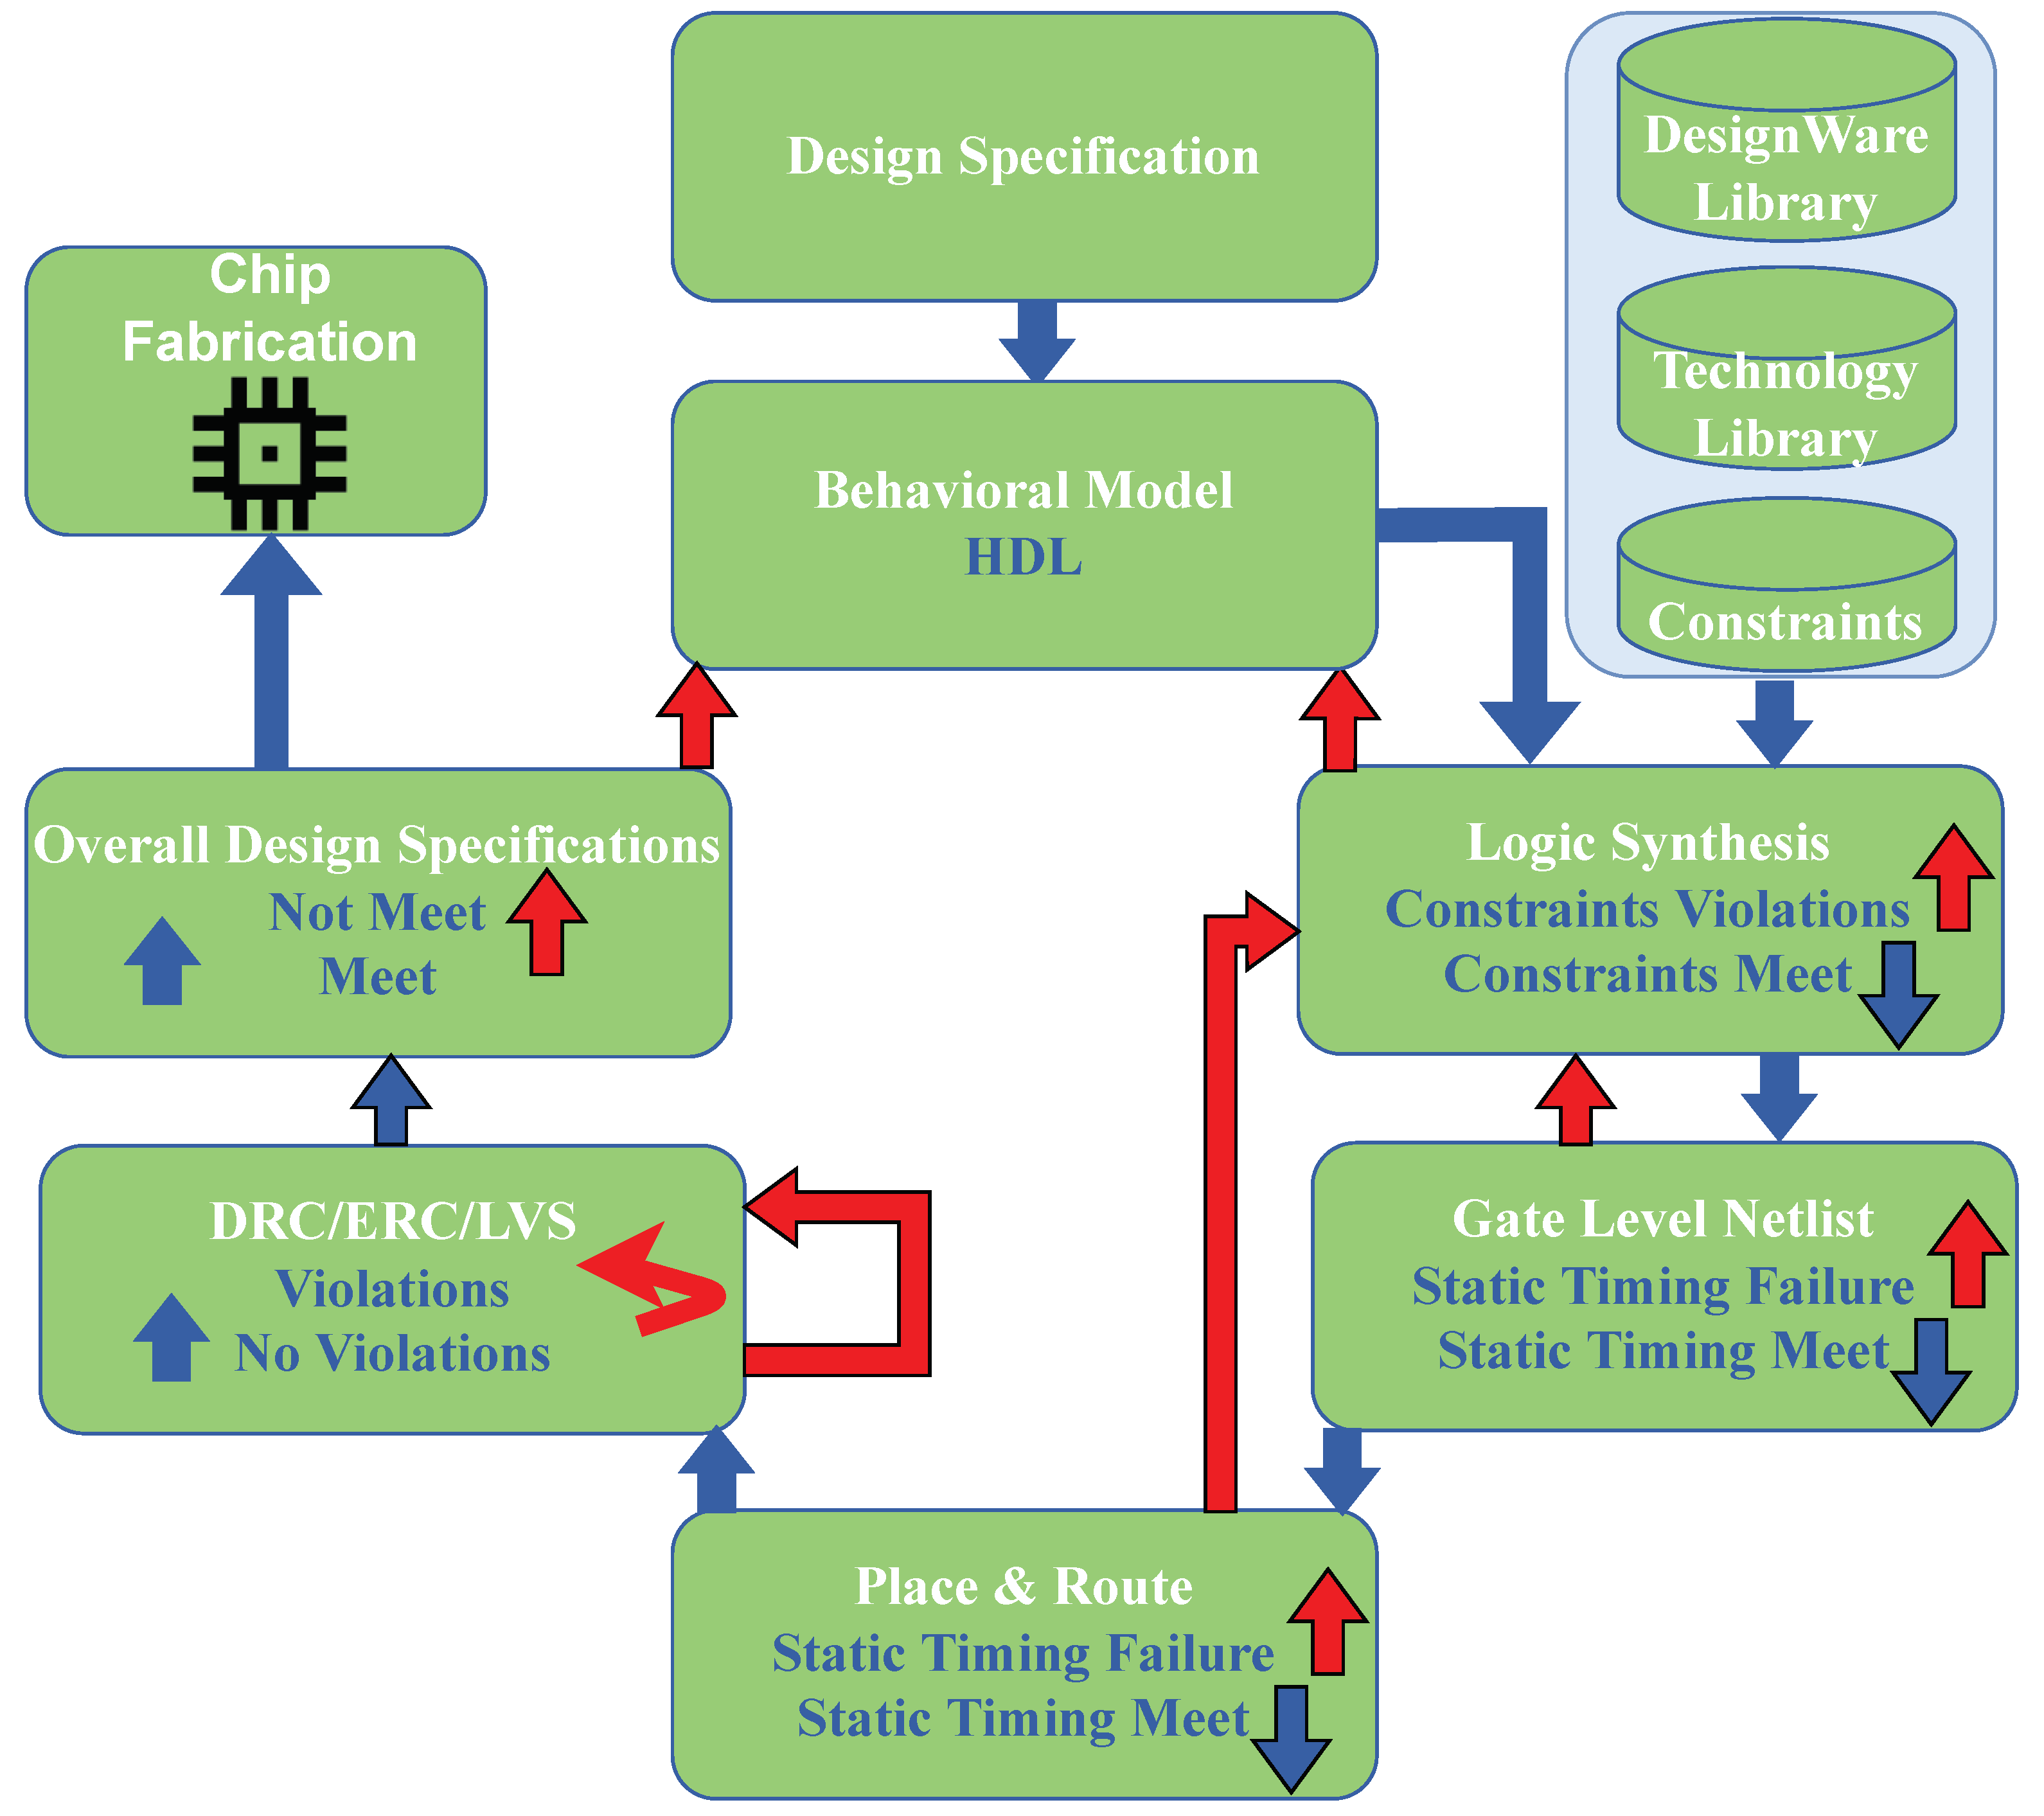
Figure 1.
A vicious cycle in circuit design often begins with a hardware description of a new design and end-up after sending the tape-out to the fabrication lab by addressing several stressful iterative processes to meet the complex design rules, high-performance, and low area budget.
Figure 1.
A vicious cycle in circuit design often begins with a hardware description of a new design and end-up after sending the tape-out to the fabrication lab by addressing several stressful iterative processes to meet the complex design rules, high-performance, and low area budget.

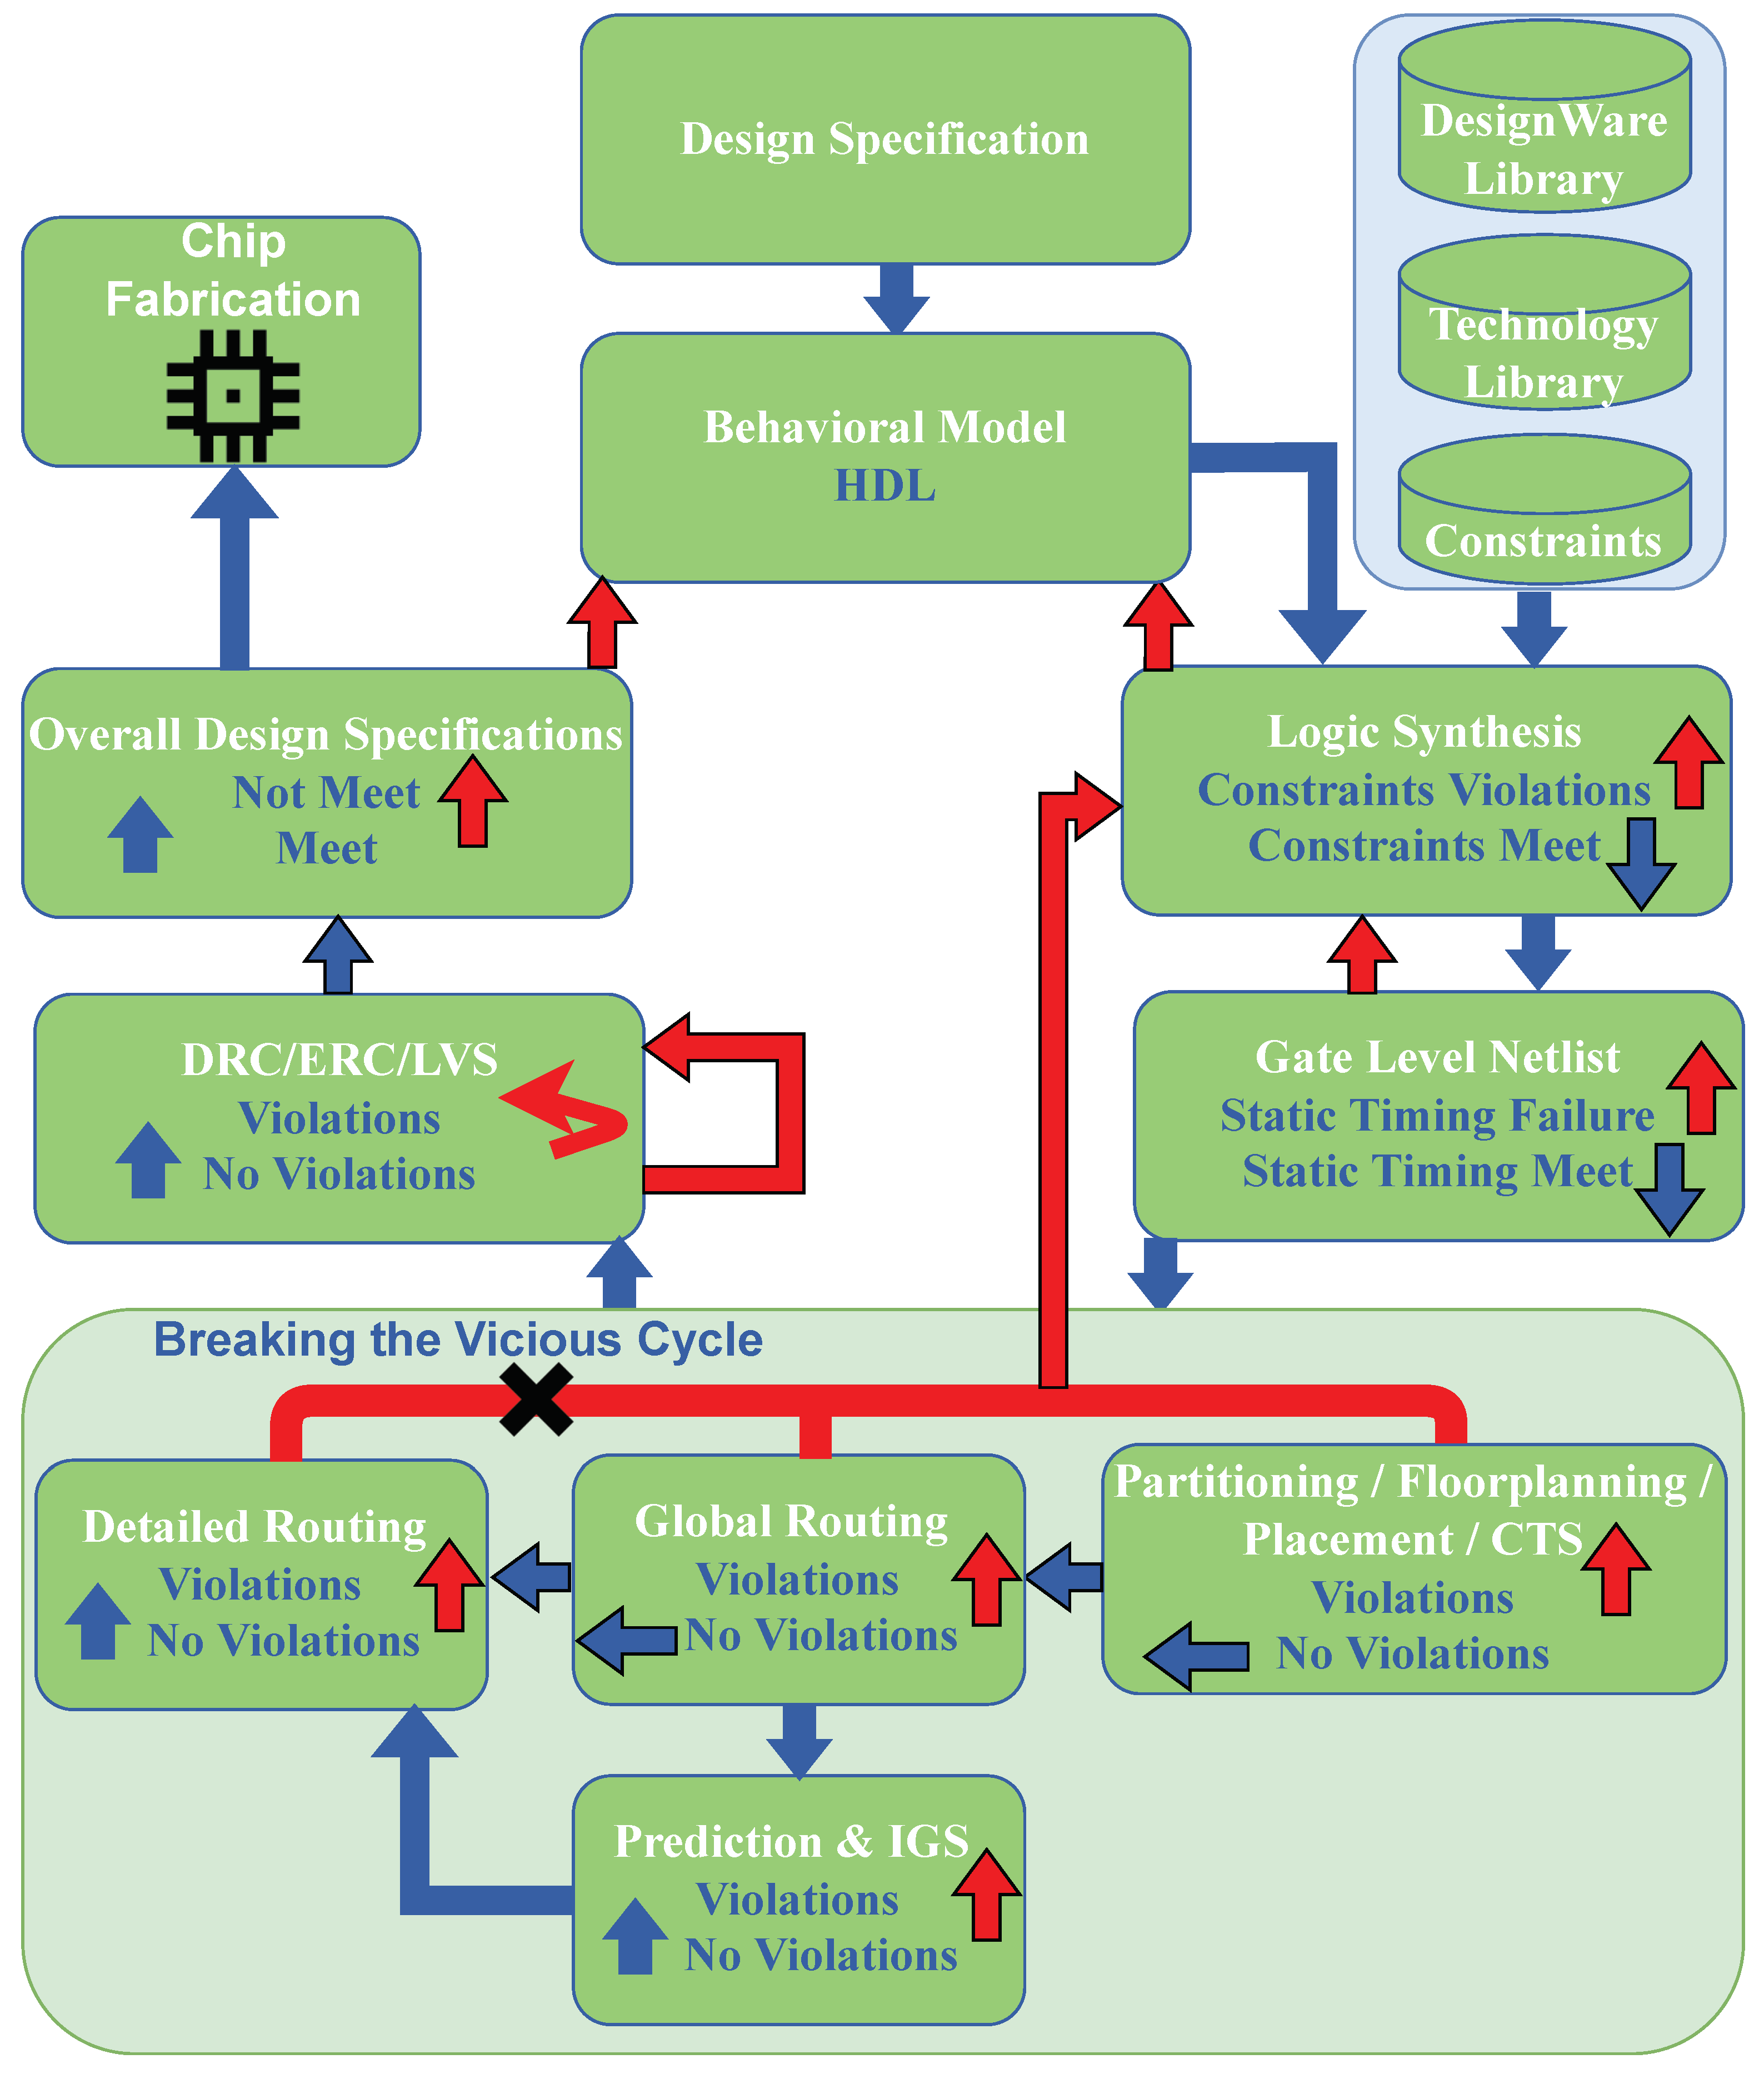
Figure 2.
The proposed ML-based prediction and IGS methodology integrated with the existing EDA synthesis flow breaks the most expensive vicious cycle path from detailed routing to the behavioral algorithm.
Figure 2.
The proposed ML-based prediction and IGS methodology integrated with the existing EDA synthesis flow breaks the most expensive vicious cycle path from detailed routing to the behavioral algorithm.

Figure 3.
Illustration of inter-dependency among several constraints of EDA tool flow, varying one constraint while observing the effect on others, (a) performance variation, (b) area variation, (c) DRC variation, and (d) total wire length variation.
Figure 3.
Illustration of inter-dependency among several constraints of EDA tool flow, varying one constraint while observing the effect on others, (a) performance variation, (b) area variation, (c) DRC variation, and (d) total wire length variation.

Figure 4.
Objective evaluation based on various feature combinations, where the enlarged circle represents the solution for a particular objective.
Figure 4.
Objective evaluation based on various feature combinations, where the enlarged circle represents the solution for a particular objective.


Table 1.
For the 589 input designs, using the proposed technique and suggested design constraint, a designer can reduce up to 87% DRC violations with only a 2.6% extra TWL.
Table 1.
For the 589 input designs, using the proposed technique and suggested design constraint, a designer can reduce up to 87% DRC violations with only a 2.6% extra TWL.
| Type | CU | CU | AR | AR | TA (m) | TA (m) | CP (ns) | CP (ns) | # of DRC | # of DRC | TWL (m) | TWL (m) |
|---|---|---|---|---|---|---|---|---|---|---|---|---|
| (Predicted) | (Actual) | (Predicted) | (Actual) | (Predicted) | (Actual) | (Predicted) | (Actual) | (Predicted) | (Actual) | (Predicted) | (Actual) | |
| baseline | 0.80 | 0.80 | 1.00 | 1.00 | 355.777.23 | 355.777.23 | 0.75 | 0.75 | 320 | 368 | 2,374,846.70 | 2,374,846.70 |
| proposed | 0.90 | 0.90 | 0.50 | 0.50 | 336,415.23 | 336,415.23 | 0.80 | 0.80 | . 41 | 89 | 2,040,688.31 | 2,040,688.31 |
| baseline | 0.80 | 0.80 | 0.50 | 0.50 | 307,640.32 | 307,640.32 | 0.70 | 0.70 | 167 | 127 | 2,050,751.55 | 2,050,751.55 |
| proposed | 0.60 | 0.60 | 1.00 | 1.00 | 310,037.22 | 310,037.22 | 1.00 | 1.00 | 10 | 27 | 2,328,562.86 | 2,328,562.86 |
| baseline | 0.70 | 0.70 | 1.17 | 1.17 | 5111.52 | 5112.64 | 0.74 | 0.50 | 0 | 0 | 19,698.92 | 19,698.92 |
| proposed | 0.99 | 0.99 | 0.48 | 0.48 | 4634.52 | 4636.42 | 0.90 | 0.90 | 8 | 8 | 18,114.38 | 18,114.38 |
| baseline | 0.70 | 0.70 | 1.17 | 1.17 | 5112.64 | 5112.64 | 0.74 | 0.70 | 0 | 0 | 19,698.92 | 19,698.92 |
| proposed | 0.56 | 0.56 | 1.73 | 1.73 | 4678.47 | 4678.47 | 0.50 | 0.50 | 8 | 8 | 21,622.39 | 21,622.39 |
| baseline | 1.00 | 1.00 | 1.50 | 1.50 | 313,209.11 | 313,209.11 | 0.90 | 0.90 | 1398 | 1969 | 1,957,889.80 | 1,957,889.80 |
| proposed | 0.80 | 0.80 | 0.50 | 0.50 | 336,415.23 | 336,415.23 | 0.70 | 0.70 | 32 | 32 | 2,120,044.18 | 2,120,044.18 |
| baseline | 0.80 | 0.80 | 0.50 | 0.50 | 6306.32 | 6306.32 | 0.80 | 0.80 | 1 | 0 | 25,689.45 | 25,689.45 |
| proposed | 0.71 | 0.71 | 0.49 | 0.49 | 4636.42 | 4636.42 | 0.65 | 0.65 | 8 | 9 | 21,005.49 | 21,005.49 |
Publisher’s Note: MDPI stays neutral with regard to jurisdictional claims in published maps and institutional affiliations. |
© 2022 by the author. Licensee MDPI, Basel, Switzerland. This article is an open access article distributed under the terms and conditions of the Creative Commons Attribution (CC BY) license (https://creativecommons.org/licenses/by/4.0/).
Share and Cite
MDPI and ACS Style
Islam, R. Feasibility Prediction for Rapid IC Design Space Exploration. Electronics 2022, 11, 1161. https://doi.org/10.3390/electronics11071161
AMA Style
Islam R. Feasibility Prediction for Rapid IC Design Space Exploration. Electronics. 2022; 11(7):1161. https://doi.org/10.3390/electronics11071161
Chicago/Turabian StyleIslam, Riadul. 2022. "Feasibility Prediction for Rapid IC Design Space Exploration" Electronics 11, no. 7: 1161. https://doi.org/10.3390/electronics11071161
Note that from the first issue of 2016, this journal uses article numbers instead of page numbers. See further details here.