Article

Integrated Equipment for Parkinson’s Disease Early Detection Using Graph Convolution Network

Key Laboratory for Biomedical Engineering of Ministry of Education, Zhejiang University, Hangzhou 310027, China
*
Author to whom correspondence should be addressed.
Electronics 2022, 11(7), 1154; https://doi.org/10.3390/electronics11071154
Submission received: 14 March 2022 / Revised: 1 April 2022 / Accepted: 3 April 2022 / Published: 6 April 2022

Abstract

:
There is an increasing need to diagnose Parkinson’s disease (PD) in an early stage. Existing solutions mainly focused on traditional ways such as MRI, thus suffering from the ease-of-use issue. This work presents a new approach using video and skeleton-based techniques to solve this problem. In this paper, an end-to-end Parkinson’s disease early diagnosis method based on graph convolution networks is proposed, which takes patients’ skeletons sequence as input and returns the diagnosis result. The asymmetric dual-branch network architecture is designed to process global and local information separately and capture the subtle manifestation of PD. To train the network, we present the first Parkinson’s disease gait dataset, PD-Walk. This dataset consists of 95 PD patients and 96 healthy people’s walking videos. All the data are annotated by experienced doctors. Furthermore, we implement our method on portable equipment, which has been in operation in the First Affiliated Hospital, Zhejiang University School of Medicine. Experiments show that our method can achieve 84.1% accuracy and achieve real-time performance on the equipment in the real environment. Compared with traditional solutions, the proposed method can detect suspicious PD symptoms quickly and conveniently. Integrated equipment can be easily placed in hospitals or nursing homes to provide services for elderly people.

Graphical Abstract

1. Introduction

Parkinson’s disease (PD) is a common neurodegenerative disease, especially among the elderly. Thus far, the pathogenesis of PD is not fully understood and there is no effective method to treat this disease. What is worse, PD is becoming increasingly troublesome. According to a study, there will be 4.94 million Parkinson’s disease patients in China by 2030 [1]. Early diagnosis and early treatment of PD patients is of great importance.
Nowadays, different brain imaging methods, such as PET, SPECT, and MRI, are the mainstream diagnosis methods for PD [2]. Although these methods can guarantee the high accuracy of diagnosis, they are expensive and inconvenient. As a typical characteristic of PD patients, dyskinesia provides us with another approach to diagnose PD [3,4]. Some researchers analyzed the gait features of PD patients, and the results showed that, even in the early stage of PD, dyskinesia can be present [5]. It indicates that motion analysis can be a reliable and simpler way for PD diagnosis.
There are two main types of methods to analyze human motion features: sensor-based approaches and skeleton-based approaches. Sensor-based methods mentioned in [6] use pressure or acceleration sensors to capture human motion data and use statistical analysis to extract motion features. PhysioNet is a widely used dataset that collects walkers’ gait signals through 16 pressure sensors placed on the foot. Many studies [7,8,9,10,11,12] have reported encouraging results on this kind of dataset. There is no doubt that using a sensor-based method to detect PD is feasible. Some researchers [13,14,15] even developed wearable systems to recognize PD symptoms. However, this type of approach is intrusive, requiring patients to wear specific sensors.
In recent years, human pose estimation has achieved great success. High-precision human pose estimation algorithms such as OpenPose [16], AlphaPose [17], HRNet [18], and MGHumanParsing [19] were continuously proposed. The success of these algorithms contributes to the thriving of human motion analysis methods. Previous studies have proved that skeletons estimated from RGB images are efficient in identifying people’s emotions [20,21,22,23], actions [24,25,26,27,28], and health problems [29,30]. Among them, the most influential work is ST-GCN [24], which combines graph convolution network and temporal convolution network to extract spatial-temporal features of a person. The human skeleton can be simplified as body joints and bones, which is consistent with the graph structure. Thus, using graph convolution networks to model human skeletons is intuitive. Although skeleton-based methods have made great success in human motion analysis, it is still a big challenge to apply them to PD detection. There are mainly three reasons. Firstly, there are no public skeleton datasets of PD patients. Collecting videos of PD patients is a time-consuming and laborious task that requires the assistance of professional doctors. Secondly, for some early stage PD patients, motor abnormalities are not obvious. Existing methods are not designed to capture detailed and PD-specific information. Thirdly, some normal elderly people have abnormal gaits, which brings great interference to the identification of PD.
In this paper, a novel skeleton-based method to detect PD is proposed. Motivated by previous work on human motion analysis, PD detection is treated as a special motion recognition task. While following prior motion analysis methods, especially ST-GCN, to extract features from the skeletons of patients walking, we highlight the importance of velocity, acceleration, and global information to identify PD symptoms and solve three major challenges mentioned above. Our main contributions are as follows:
  • We present the world’s first Parkinson patients’ gait dataset PD-Walk, which consists of 191 people’s walking videos (with extracted skeletons). It is worth mentioning that all the data were annotated by doctors from top hospitals.
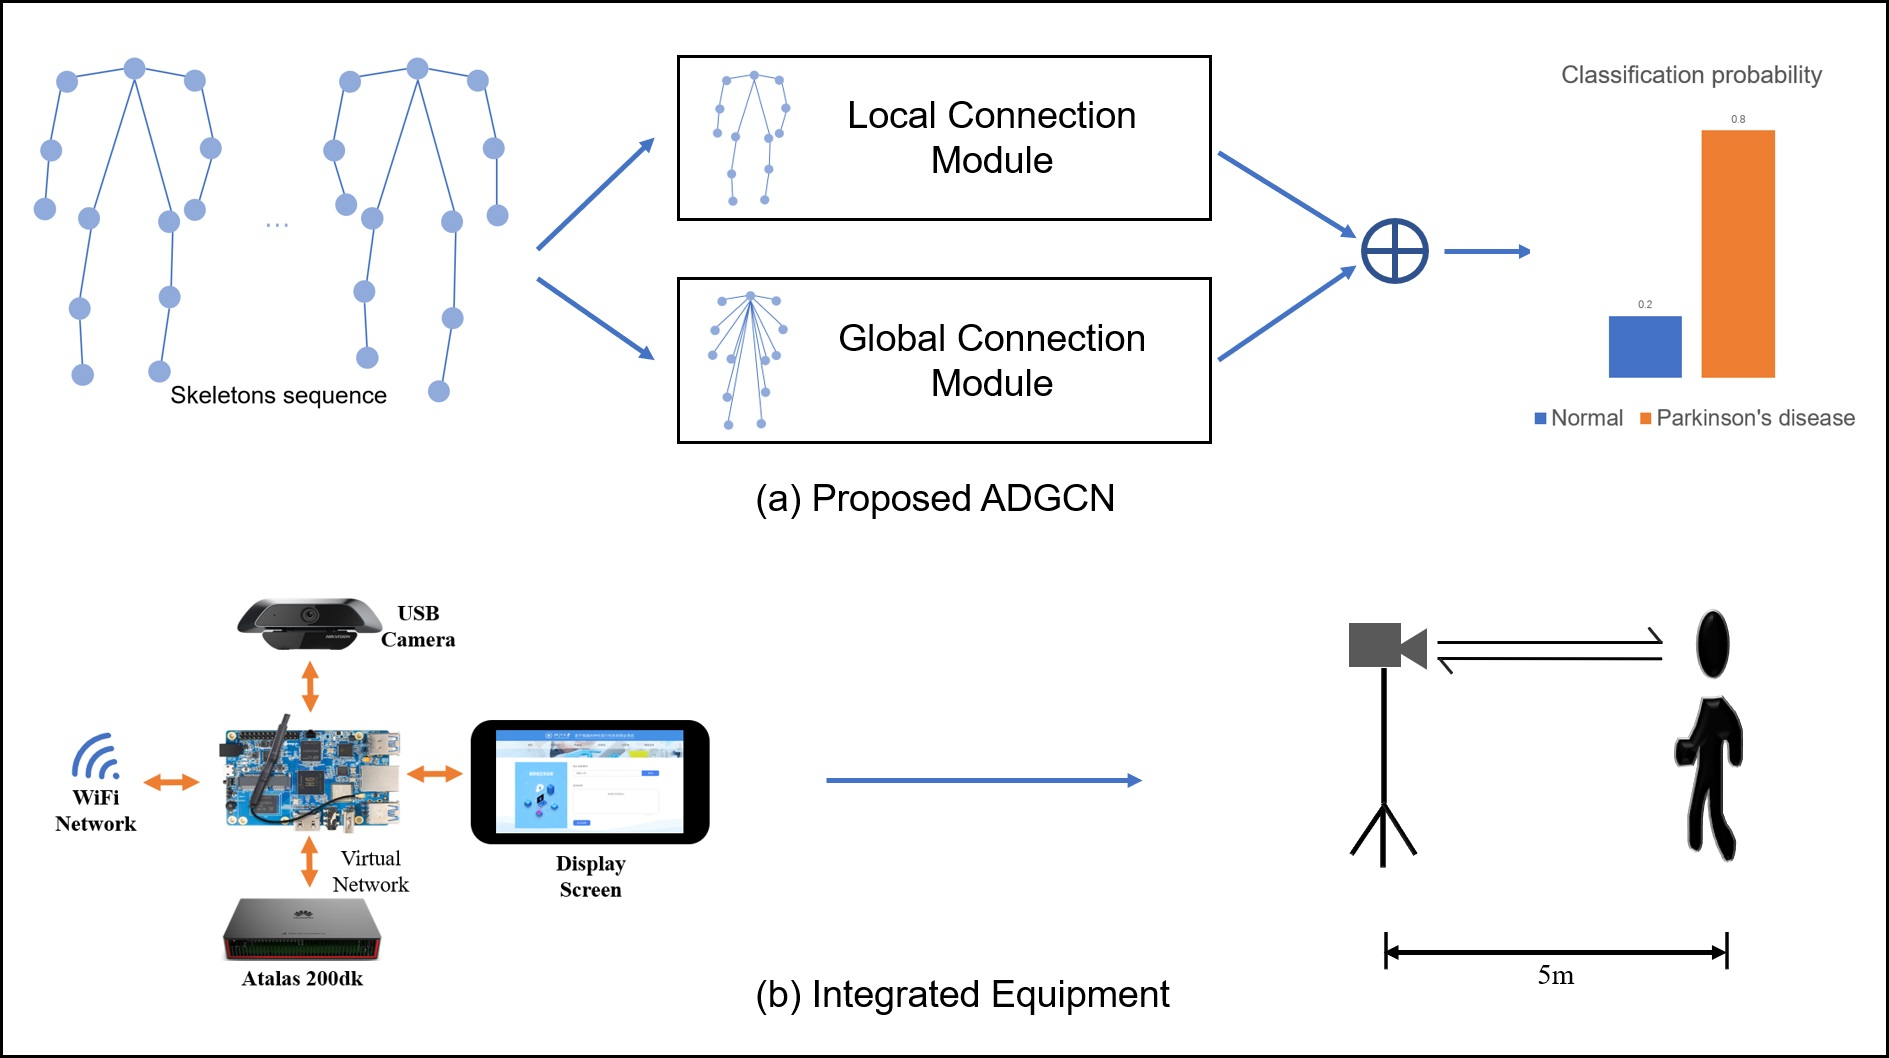
  • A strengthened asymmetric dual-stream graph convolution network (ADGCN) is proposed, which can catch the slight difference in gait between Parkinson’s disease patients and healthy people.
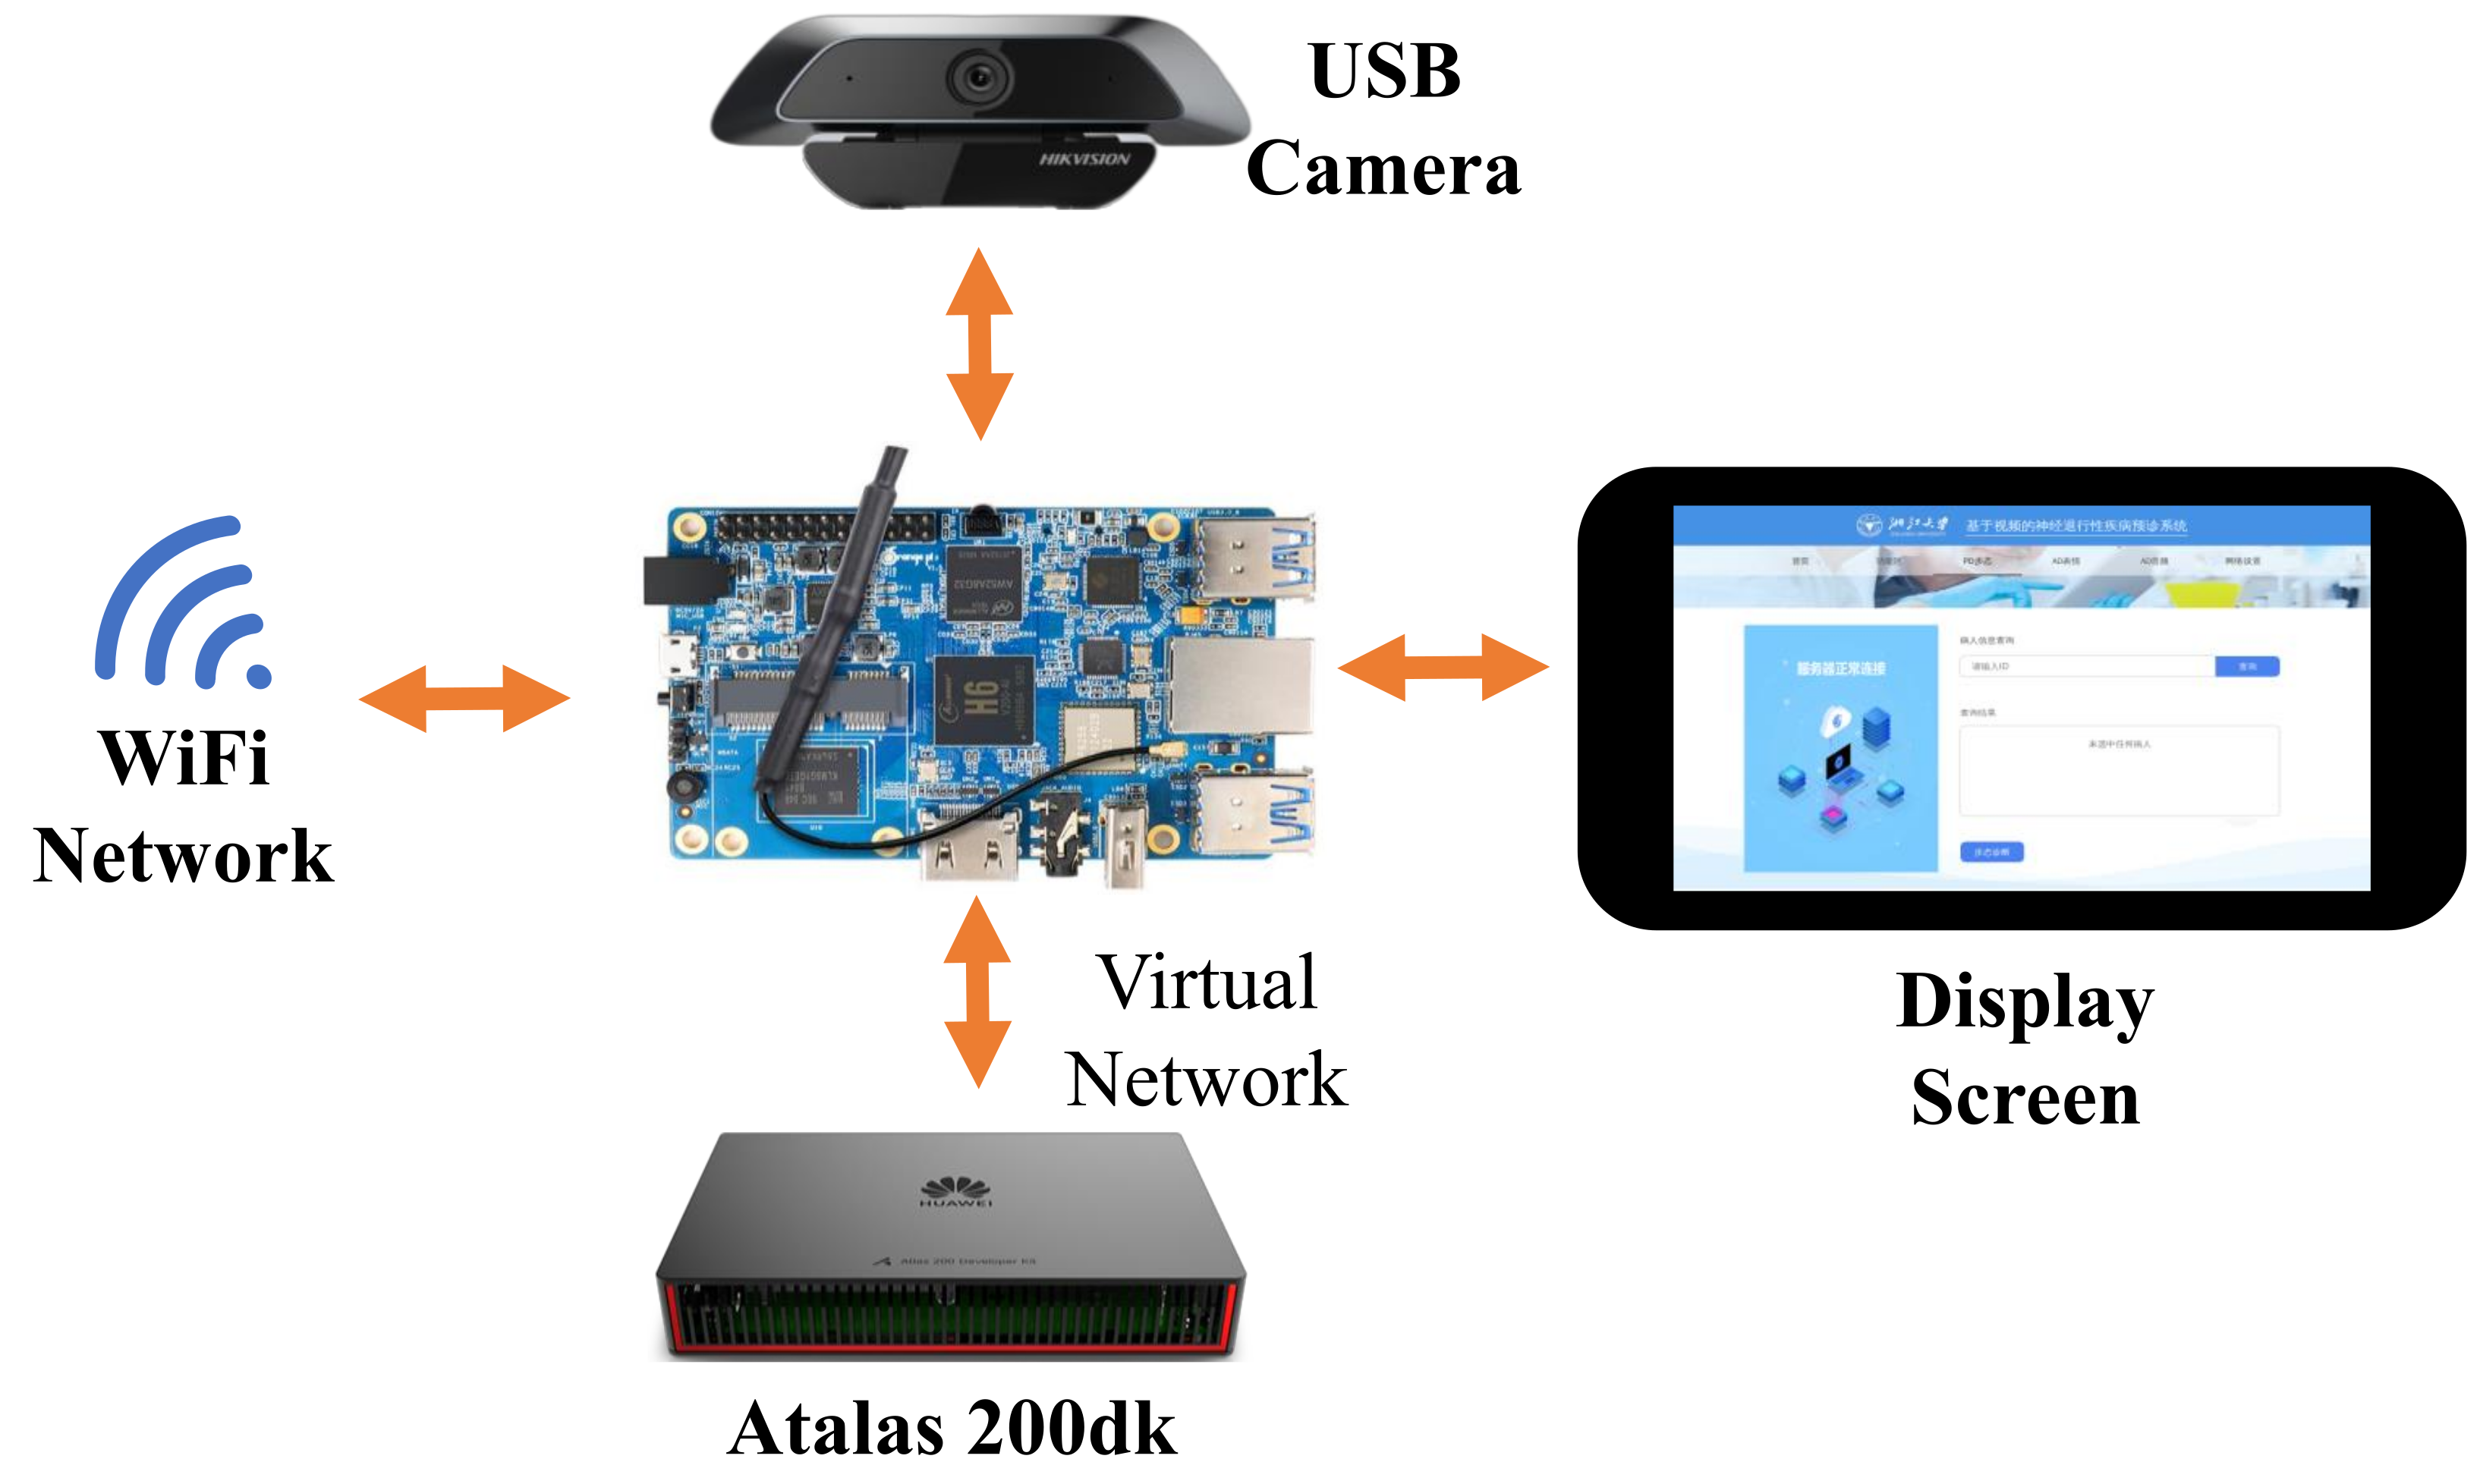
  • For the first time, we deploy our method on low-power integrated equipment and test it in a real-world environment in hospital.

2. Related Work

2.1. Graph Neural Networks

Graph is a common data structure in many fields. Graph neural network makes it possible to use neural network to process the topological information of a graph structure and has been widely used in many fields, such as a recommendation system [31], molecular chemistry [32], and human action recognition [24]. Recently, GNN can even be applied in nonstructural scenarios such as images. For instance, Ref. [33] applied GNN in the image to recognize and locate the interaction between human and object; Ref. [34] devised a GNN for image semantic mining. Our work follows the spirit of [24] and constructs a GNN for Parkinson’s disease detection.

2.2. Parkinson’s Disease Detection

The traditional detection methods of Parkinson’s disease are brain imaging and scale analysis. These methods have the disadvantages of high cost and inconvenience. The dyskinesia of Parkinson’s disease provides researchers with a new approach to its detection, such as arm swing dysfunctions [4] and tremor [15]. Compared with predecessors, we take a different approach that uses vision information to analyze the gait disorder of Parkinson’s disease.

3. Dataset

In this section, we elaborate on the process of collecting data and the establishment of our PD-Walk dataset, which is shown in Figure 1. Then, we construct a simple classification model using hand-crafted motion features as our baseline. The study protocol was approved by the Research Ethics Committee of the First Affiliated Hospital, College of Medicine, Zhejiang University. The dataset is available at figshare (https://figshare.com/articles/dataset/PD-Walk_rar/19196138 (accessed on 19 February 2022)).

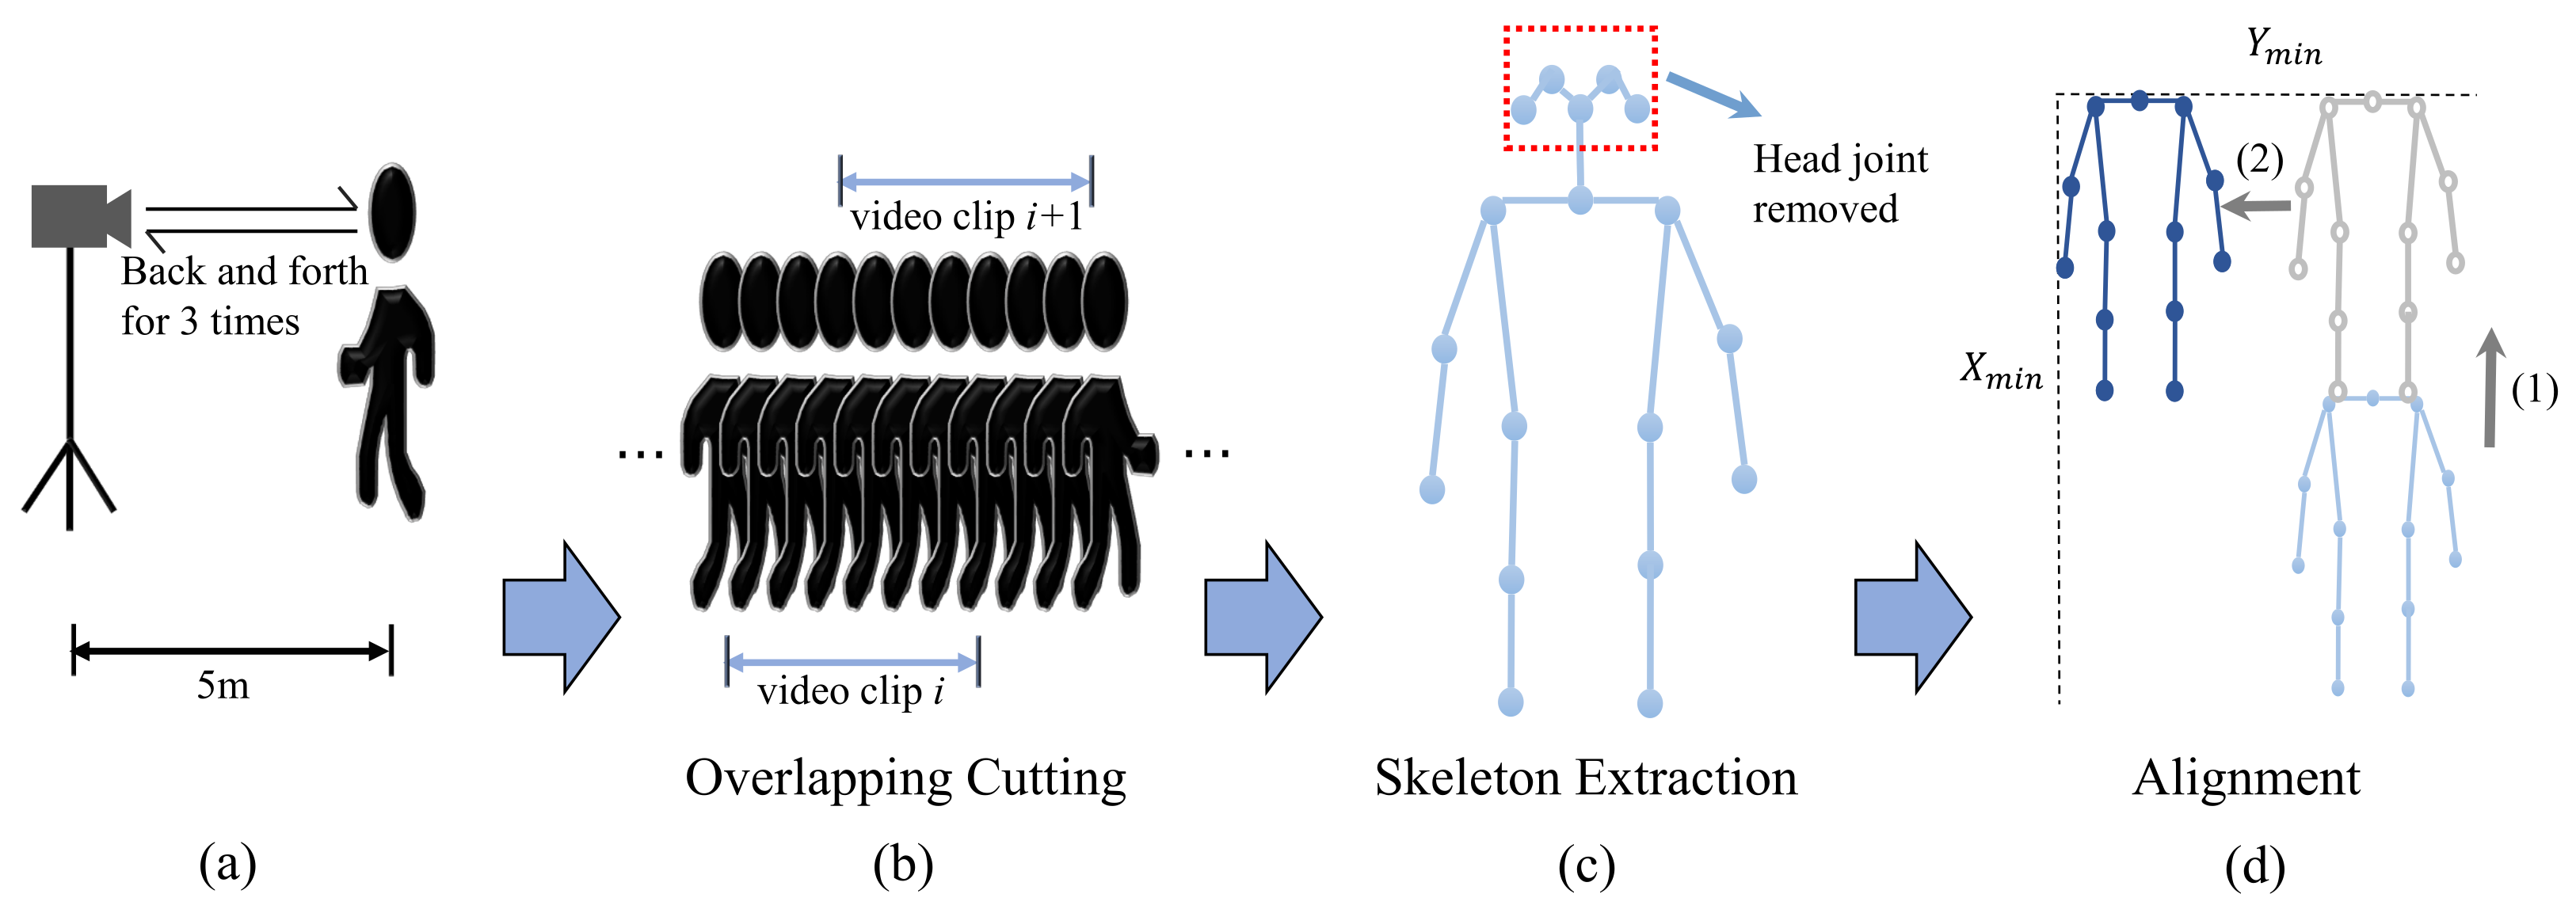
3.1. Data Collection

In this work, the PD patients’ walking videos are collected in the First Affiliated Hospital of Zhejiang University (FAHZU) and the healthy people’s walking videos are collected both in the hospital and community. All the videos are annotated by experienced doctors with a 0–1 label, where 0 represents healthy people and 1 represents PD patients.
All the participants are required to walk back and forth 3 times for about 5 m, and a camera will record their walking. For practicability, all the participants are required to walk freely, and the video shooting distance, angle, and lighting conditions are not strictly limited. Finally, we collect a total of 96 PD patients and 95 healthy people’s walking videos.

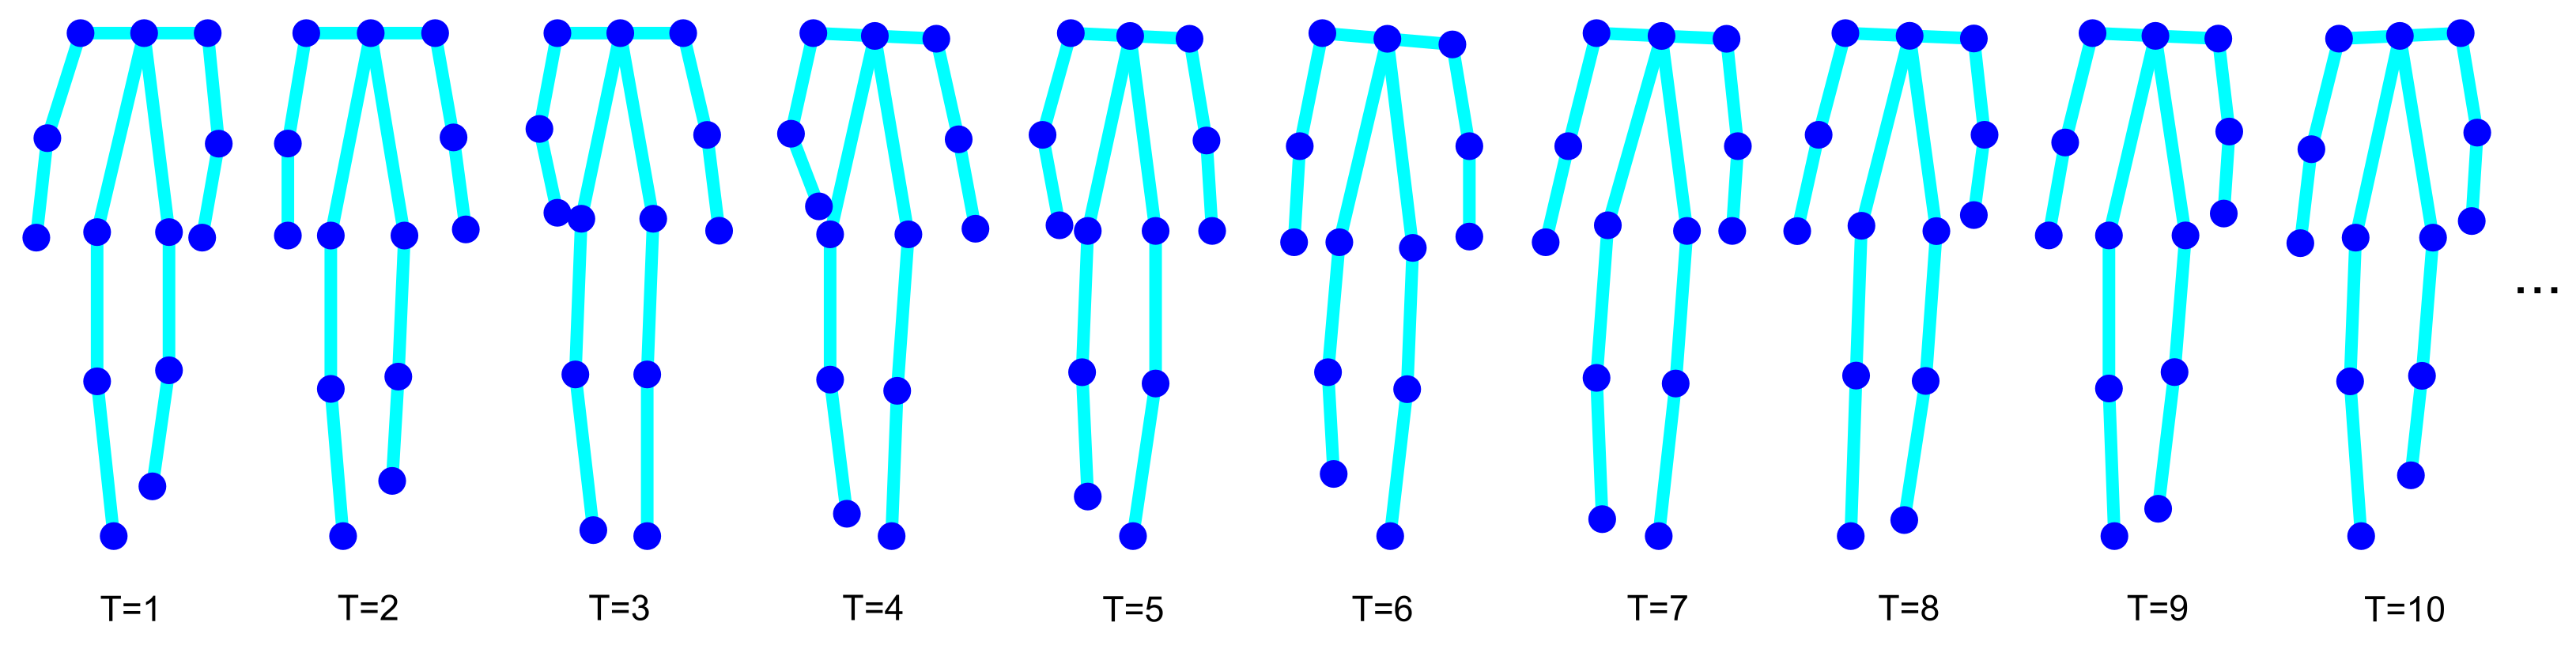
3.2. Data Preprocess

Different videos have different lengths, but the model requires fixed-size input, so they have to be cut to the same length. To make full use of the dataset, overlapping cutting is used. The adjacent video clips overlap by three quarters.
After video cutting, HRNet [18] is used to extract human skeletons from each video clip. Considering the joint that stands for the head is not related to gait disorders, they are removed to prevent overfitting. After finishing the above operations, we will obtain a skeleton tensor M T × V × C from each video clip, where T stands for video frames, V indicates the number of joints, and C represents the location coordinate dimension. Specifically, we have T = 72, V = 13, and C = 2 (i.e., x and y).
Different video shooting distance enlarges the sample space, which makes it hard to fit a model. To solve these problems, all the skeletons are aligned in the spatial domain according to Equation (1):
A c = min c ( M ) M t , v , c = ( M t , v , c A c ) / H
A c is the minimum value of a coordinate in the whole sequence. In this work, H is set as the height of the first skeleton in a skeleton sequence. After alignment, all the participants’ spatial positions are aligned according to the minimum coordinate A c , and all the skeleton sequences are resized to have the same scale with their first skeletons. This operation eliminates the influence of camera shake and distance variation.
After data preprocess, PD-Walk dataset is established. A visualization of a data sample is shown in Figure 2.

3.3. Simple Baseline

In this part, hand-crafted motion features are used to construct a simple SVM classifier. The main clinical manifestations of PD include myotonia, retardation, and postural instability. In order to model these characteristics, we extracted spatial-temporal features from the 2D skeletons sequences. Features can be classified into 5 groups:
  • Angle: For some PD patients, it is hard to swing the arm. In this work, the angles around the elbow and shoulder are calculated in each frame. The mean and variance of the same angle in time domain are used to measure the difficulty of swinging arms.
  • Bone length: In the 2D space, the calculated bone length is the result after projection. The different postures of a walker will generate different bone lengths. The bone length feature is considered to model the walker’s posture information.
  • Symmetry: The gait of a healthy person is symmetrical. For PD patients, due to the rigidity of muscles, it is hard to walk symmetrically. As shown in Equation (2), the symmetry features are computed by comparing the angles a and bone lengths b on the left and right sides of the human body.
    e a = μ t ( a l ) μ t ( a r ) d a = σ t ( a l ) σ t ( a r ) e b = μ t ( b l ) μ t ( b r ) d b = σ t ( b l ) σ t ( b r )
    where l means left, r means right, μ t and σ t denote computing expectation and variance along the time domain.
  • Speed: We calculate the first order difference of the body joints and average it in the time domain.
  • Acceleration: Acceleration contains rich motion information. The joints’ acceleration is computed by the first order difference of the joints’ speed.
After combining these features, a vector F m o t i o n is obtained. This feature vector is used to construct the SVM classifier. In this paper, the classification accuracy of the SVM is regarded as the baseline.

4. Proposed Methods

As mentioned in Section 1, the motor abnormalities of some PD patients are not obvious or even subtle, thus making it difficult for common neural networks to detect. To solve this problem, we present an asymmetric dual-branch network to extract local features and global features separately. In addition, the velocity and acceleration information, which are very important for PD detection, are also input into two branches, respectively, to detect detailed motion features. The structure of our network is shown in Figure 3.

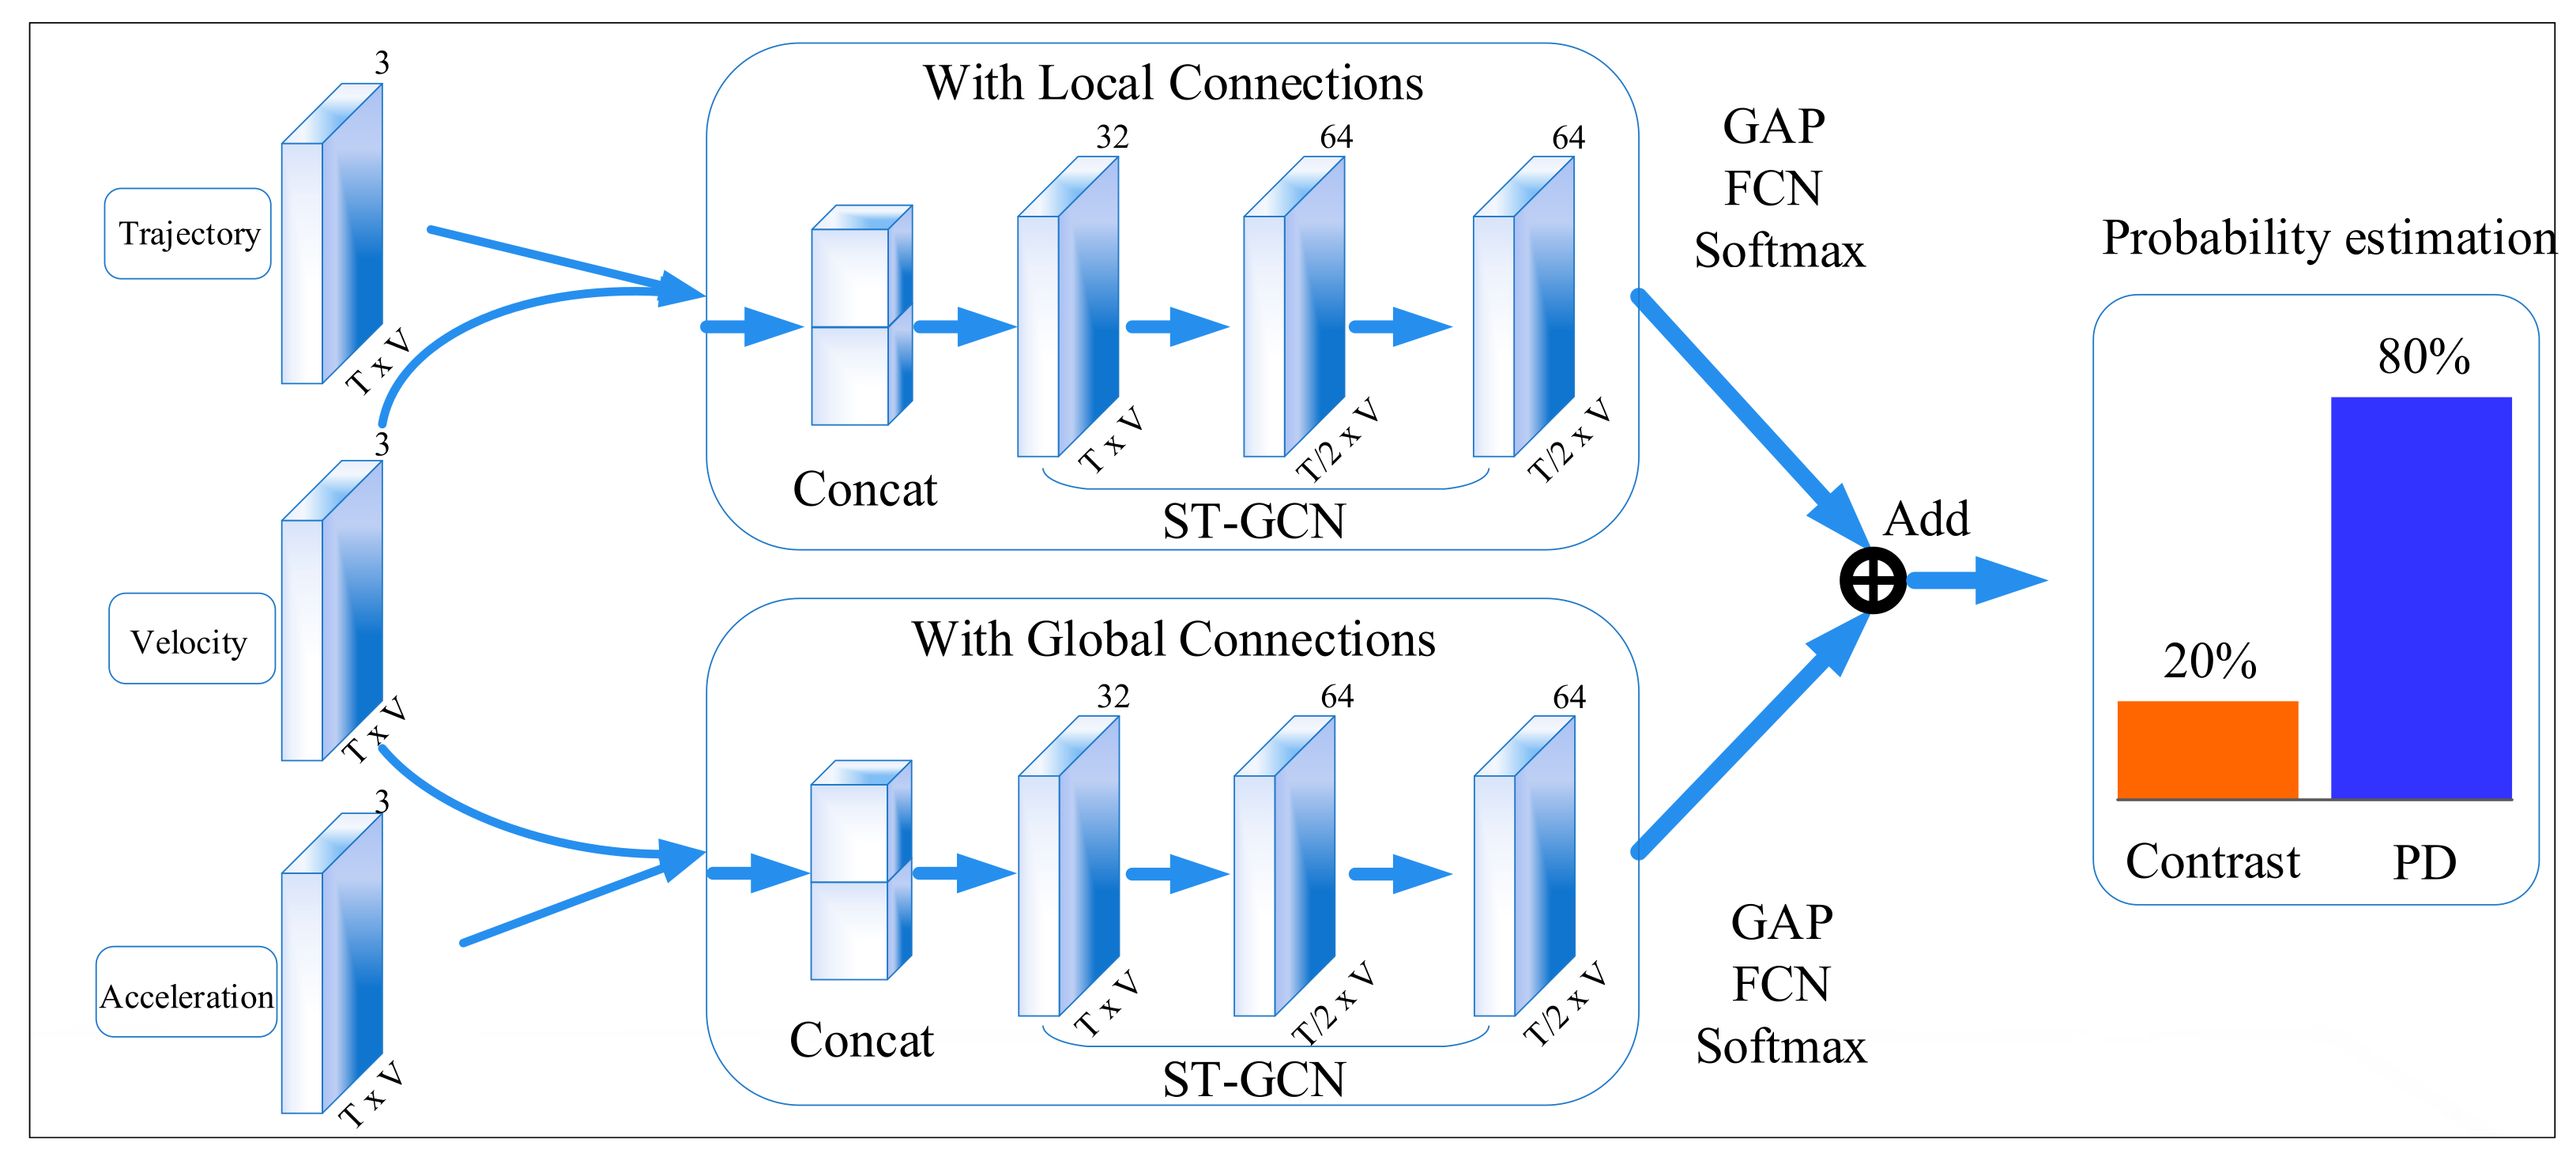
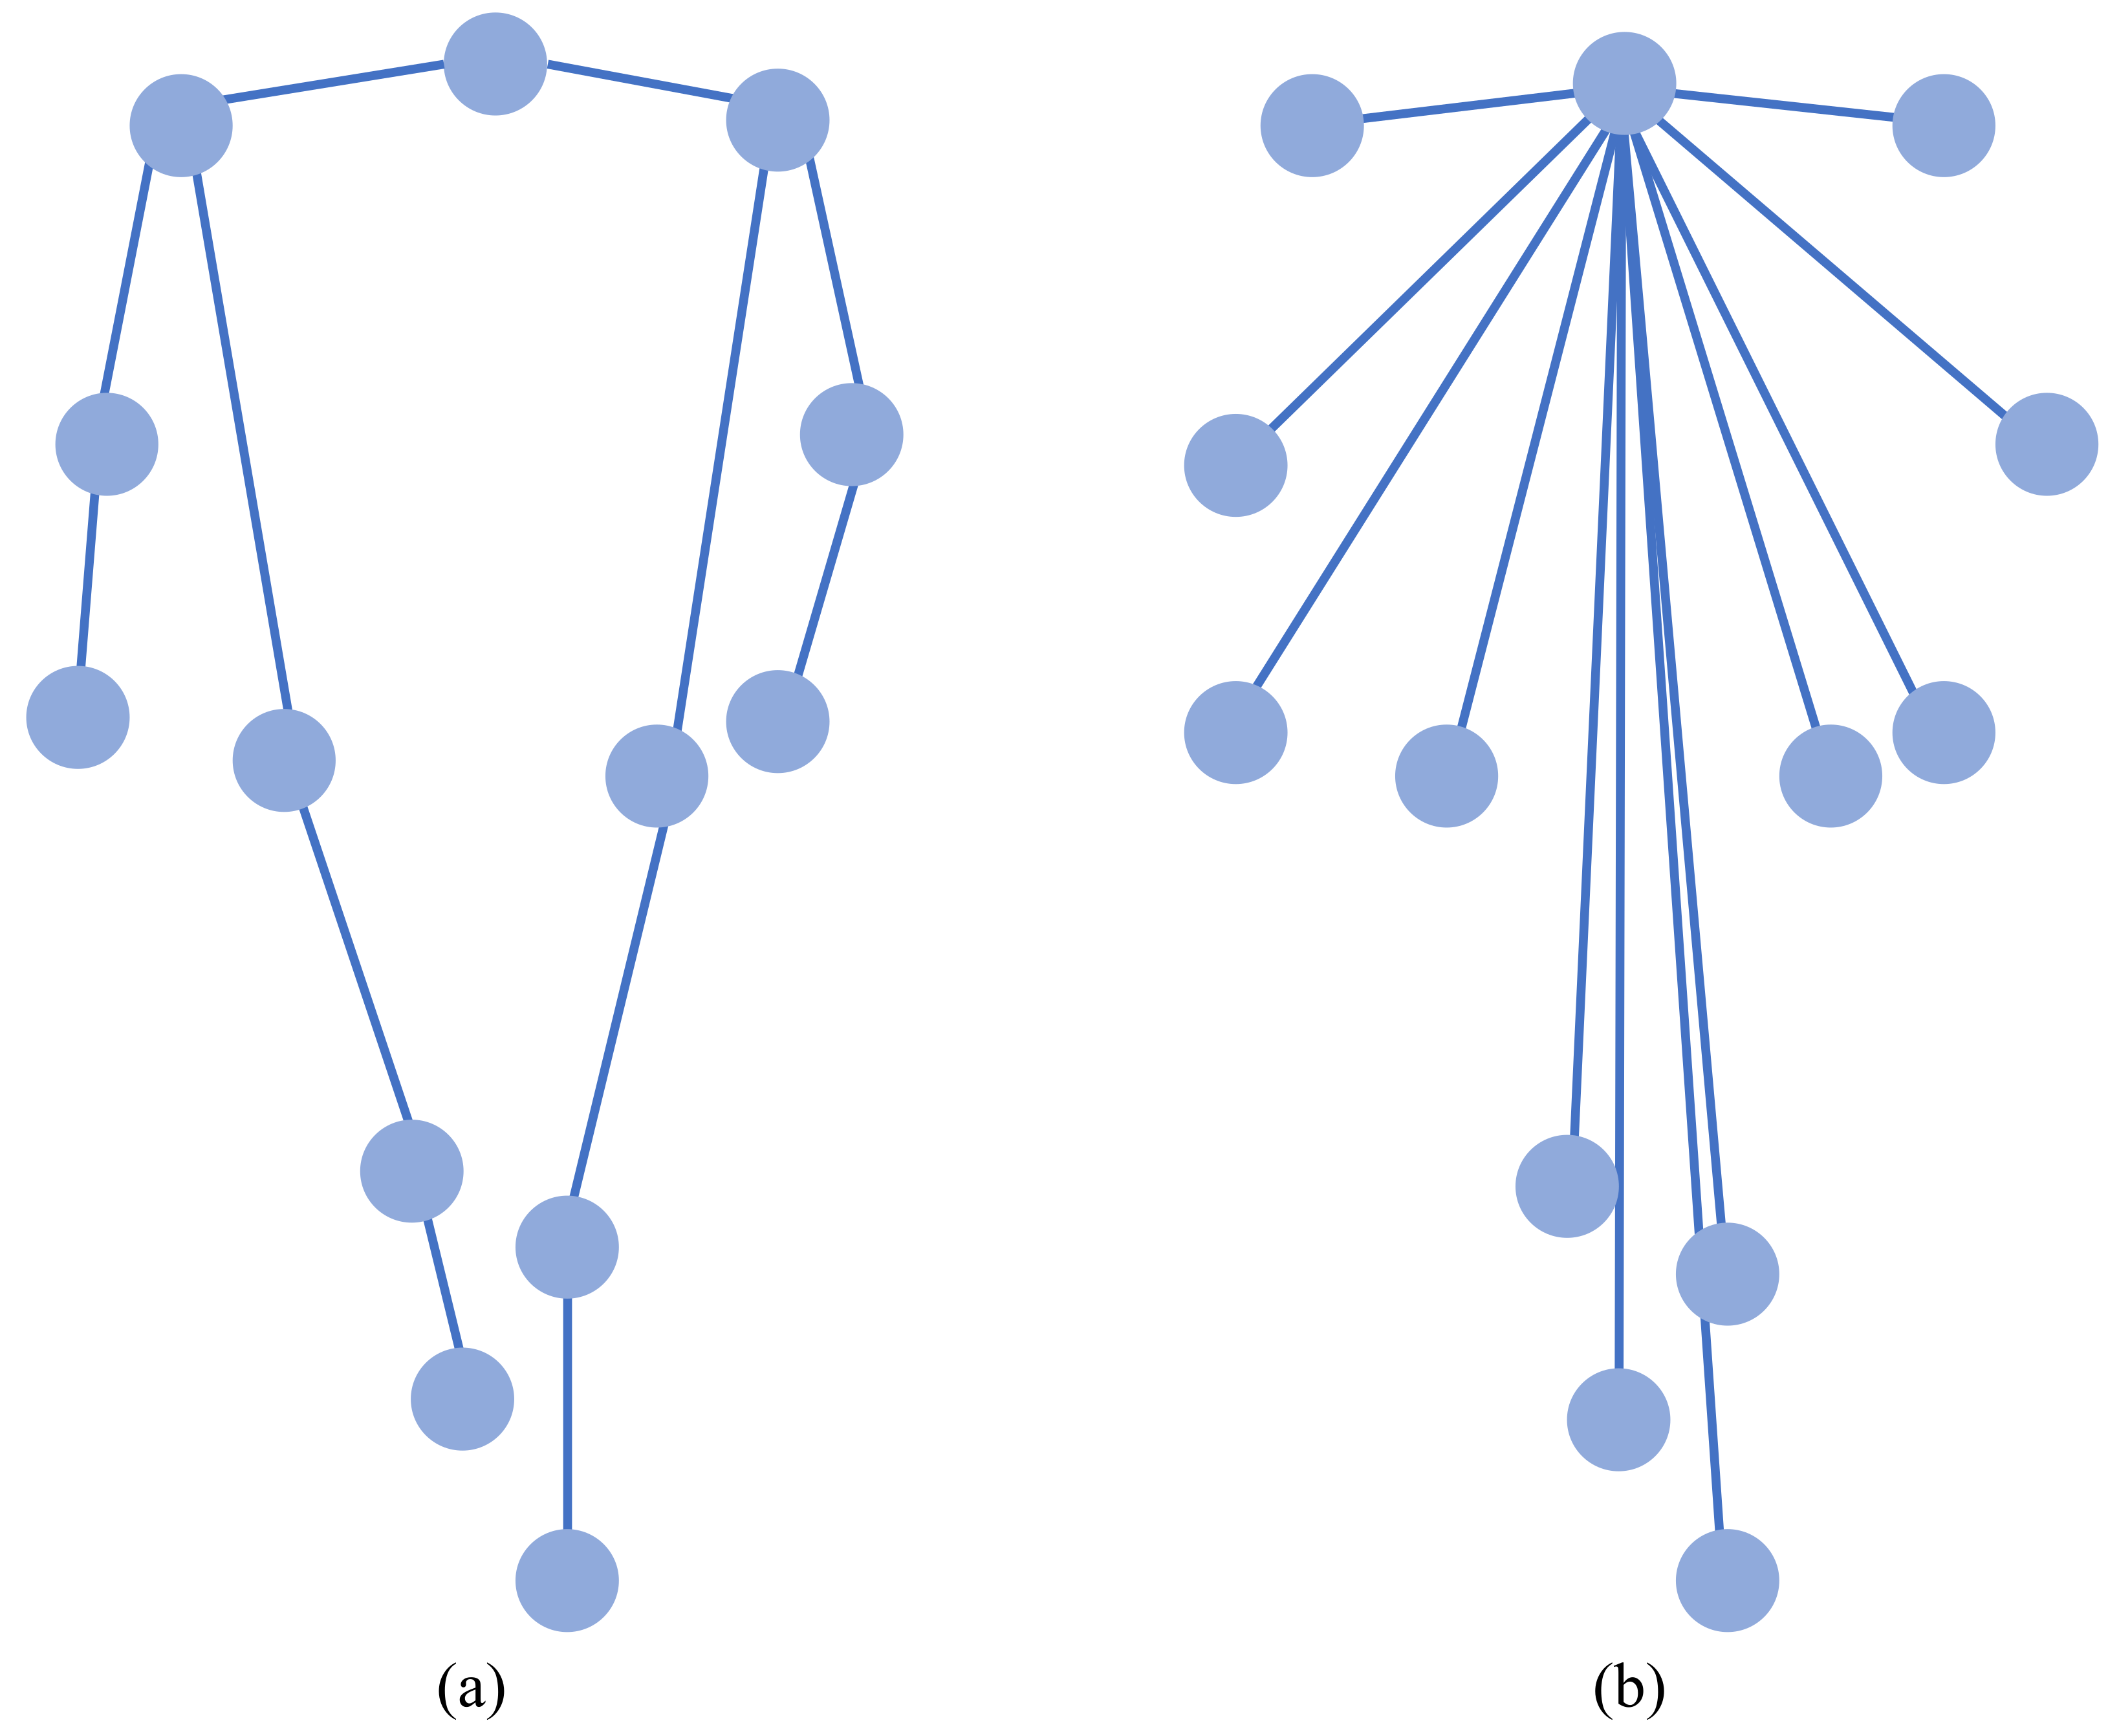
4.1. Local and Global Connections

The original ST-GCN constructs the spatial graph according to the physical connection of human joints, which is natural and empirical. In this case, each joint is only connected to the physically adjacent joint, so we call it local connection. However, one overlooked issue is the receptive field. The receptive field has a very important meaning for convolution networks. Researchers have made great efforts to increase the receptive field, such as pooling layer and dilated convolution [35]. In natural connections, a joint point only has edge connections with its naturally adjacent nodes, which undoubtedly limits the receptive field of each node after convolution. For example, the movement of the ankle position can only be perceived by the knee in a convolution because this is the only neighbor in natural connection. On the issue of Parkinson’s disease, many of the physical manifestations occur at the ends of the limbs, such as limb tremors (commonly seen in the fingers). In this case, natural connections limit the ability of the neural network to extract features. Inspired by G-GCSN [23], we adopt global connections that connect all the joints to the center of the body. Unlike G-GCSN, we propose a two-branch network to handle local connections and global connections separately. Figure 4 shows the difference between local connections and global connections.
In the first branch, natural connections of body skeletons are used to construct the spatial graph. This branch is designed to extract local features, while in the second branch, the neck joint is selected as the center joint, and all the other joints are connected to it. Compared with natural connection, this connection allows the network to pay more attention to the key areas with high incidences of abnormal Parkinson’s disease actions, and at the same time, it is more convenient to perceive global information because the information between key areas is not restricted by natural connections.
In G-GCSN [23], global connections are directly added to natural connections. This operation makes the skeleton graph rather complex, and experiment results show that adopting two branch networks to handle natural connections and global connections separately improves the recognition accuracy of PD.

4.2. Position and Motion Information

Walking speed [30] and acceleration [36] information has significant impact on gait disorder detection. Previous work such as STEP [21] or G-GCSN only model the position information of human joints, which may be insufficient for the detection of detailed motion features. As shown in Figure 3, to make full use of joint data, velocity and acceleration information are explicitly used in our work.
Given a joint’s moving trajectory J, the first order difference D and second order difference A in the time domain are computed according to Equation (3):
D t = J t J t 1 A t = D t D t 1 = J t + J t 2 2 J t 1
Since the interval between video frames is isochronous, the first order difference of the joint’s trajectory is proportional to the joint’s velocity and the second order difference represents the acceleration.
In this work, the joints’ moving trajectory, velocity, and acceleration are taken as input of the two branch network. In the first branch, joint trajectory and velocity are processed to extract local features. In the second branch, velocity and acceleration information are processed to extract global features. In this way, the network can capture not only local and global features but also more detailed motion features. For more details about network input configuration, please refer to Section 5.3.3.

4.3. Loss Function

To force the model to pay more attention to the data that are difficult to classify, which is the data of PD patients, we replaced the cross-entropy loss function with focal loss [37], which is given by
L ( p t ) = α t ( 1 p t ) γ log ( p t )
where α is a weight according to different classes and ( 1 p t ) γ is the modulating factor. If p t is small, which means the sample is hard to classify, the modulating factor would be greatly increased. In this way, the loss calculated from the normal data will be reduced, PD data will contribute most of the loss and determine the direction of optimization.

4.4. Integrated Equipment

To further verify the feasibility and efficiency of our method in real-world applications, we implemented our model on Atlas200DK, which has an octa-core ARM Cortex-A55 and a dual-core AI processor within 20 watts of power consumption. In this work, device is implemented in FAHZU, which is the top hospital in China. With such low power, it can also be deployed in other places where it is needed, such as communities, nursing homes, etc. However, we still have to ensure that the accuracy and inference speed remain barely unchanged compared with that on the server.
In order to maintain the accuracy, we adopt two ways to make our Pytorch model compatible with Compute Architecture for Neural Networks (CANN), which is the AI software stack in Atlas devices. For models that consist of only basic operators, we directly use Pytorch API to export them in ONNX format. For those which contain custom operators, we convert them to Caffe since it is an open-source framework, which means we can implement our desired operators in it. Both ONNX and Caffe are acceptable for CANN software stack. Finally, we utilize TVM [38] to enable the entire model to be executed at its best on hardware.
Keeping real-time performance can be a challenge for devices with limited computing resources. Therefore, we made several optimizations to bridge the performance gap, including from video decoding to the inference of the model. Instead of using OpenCV to decode videos, which is the universal way, we make full use of hardware codecs to accelerate decoding. Meanwhile, we adopt operator fusion which combines a couple of operators without storing the intermediate result to reduce memory footprint. Data layout transformation adapts the data to the characteristics of the AI processor and thus improves hardware utilization.
Finally, we integrate the Atlas device with other electronic components into a single piece of equipment, which can record patients’ gait videos, analyze them, and return results within a few seconds. The structure of our equipment is shown in Figure 5 and the detail is demonstrated in Section 5.1. We designed our equipment to be easy to use so that no extra tech support or doctors are needed while using it. As far as we know, there have been few studies that put their research into practice or deploy into real-world equipment. In contrast, our equipment is already in operation in FAHZU hospital and is connected to its Hospital Information System (HIS), which makes our research more practical.

5. Experiment

5.1. Implementation Details

The implementation of our proposed method can be separated into two stages: the training stage and the deployment stage.
In the training stage, we use Pytorch framework to implement our network. To make full use of the PD-Walk dataset, we use 5-fold cross-validation and report the average results. The model is trained from scratch without a pre-trained model. Adam, with the initial learning rate of 3 × 10 4 and the weight decay of 5× 10 6 , is used as the optimizer, and the cosine annealing algorithm is utilized to automatically update the learning rate. All experiments use a batchsize of 32 and train for 32 epochs.
In the deployment stage, we implement our code on the Atlas200DK with CANN (version 3.3.0). We use an additional OrangePi3, which is connected to Atlas200DK through the network interface and connects to the screen through HDMI. With the touch screen, it is easy for users to control the entire equipment.

5.2. Main Results

In this part, we evaluate three different methods on the PD-Walk dataset, as shown in Table 1. The result of SVM using hand-crafted motion features is used as the baseline. With almost the same configuration as the first branch of our proposed network, the ST-GCN is constructed according to the local connections. As shown in the table, ST-GCN achieves a better result than baseline, which proves the effectiveness of modeling the human body as a graph. The ST-GCN only considers local connections and position trajectory; this limits its potential capability of extracting fine-grained features. We argue that global connections and motion information, such as velocity and acceleration, plays an important role in fine-grained feature extraction. Our proposed ADGCN, which considers motion information and global connections, is able to improve the accuracy by 5.6% compared to ST-GCN.

5.3. Ablation Study

5.3.1. Loss Function

We first investigate the performance using different loss functions with the proposed ADGCN model, as shown in Table 1. Focal loss can set different weights for the loss brought by different categories, so that the model can focus on learning PD samples that are more difficult to classify. It can be seen from the results that, compared with the traditional cross-entropy loss, focal loss can further improve the accuracy.

5.3.2. Data Augmentation and Joints Selection

Gait disorders are mainly manifested in the extremities. The head joints, which are not related to gait abnormalities, are removed from the raw body skeletons to reduce interference. Table 2 shows that augmentation and head joint removal can increase performance.

5.3.3. Dual Branch

Table 3 compares the performance between different configurations of the network. We find that the asymmetric dual branch improves the performance. One possible explanation is that motion information such as velocity and acceleration is used explicitly. When both velocity and acceleration information is considered, the best result can be obtained only by combining global and local connections. Local connections correspond to the skeleton of the human body; it can capture features associated with a real human body structure. Global connections integrate all joint information indiscriminately. They both play an important role in PD gait disorder detection.

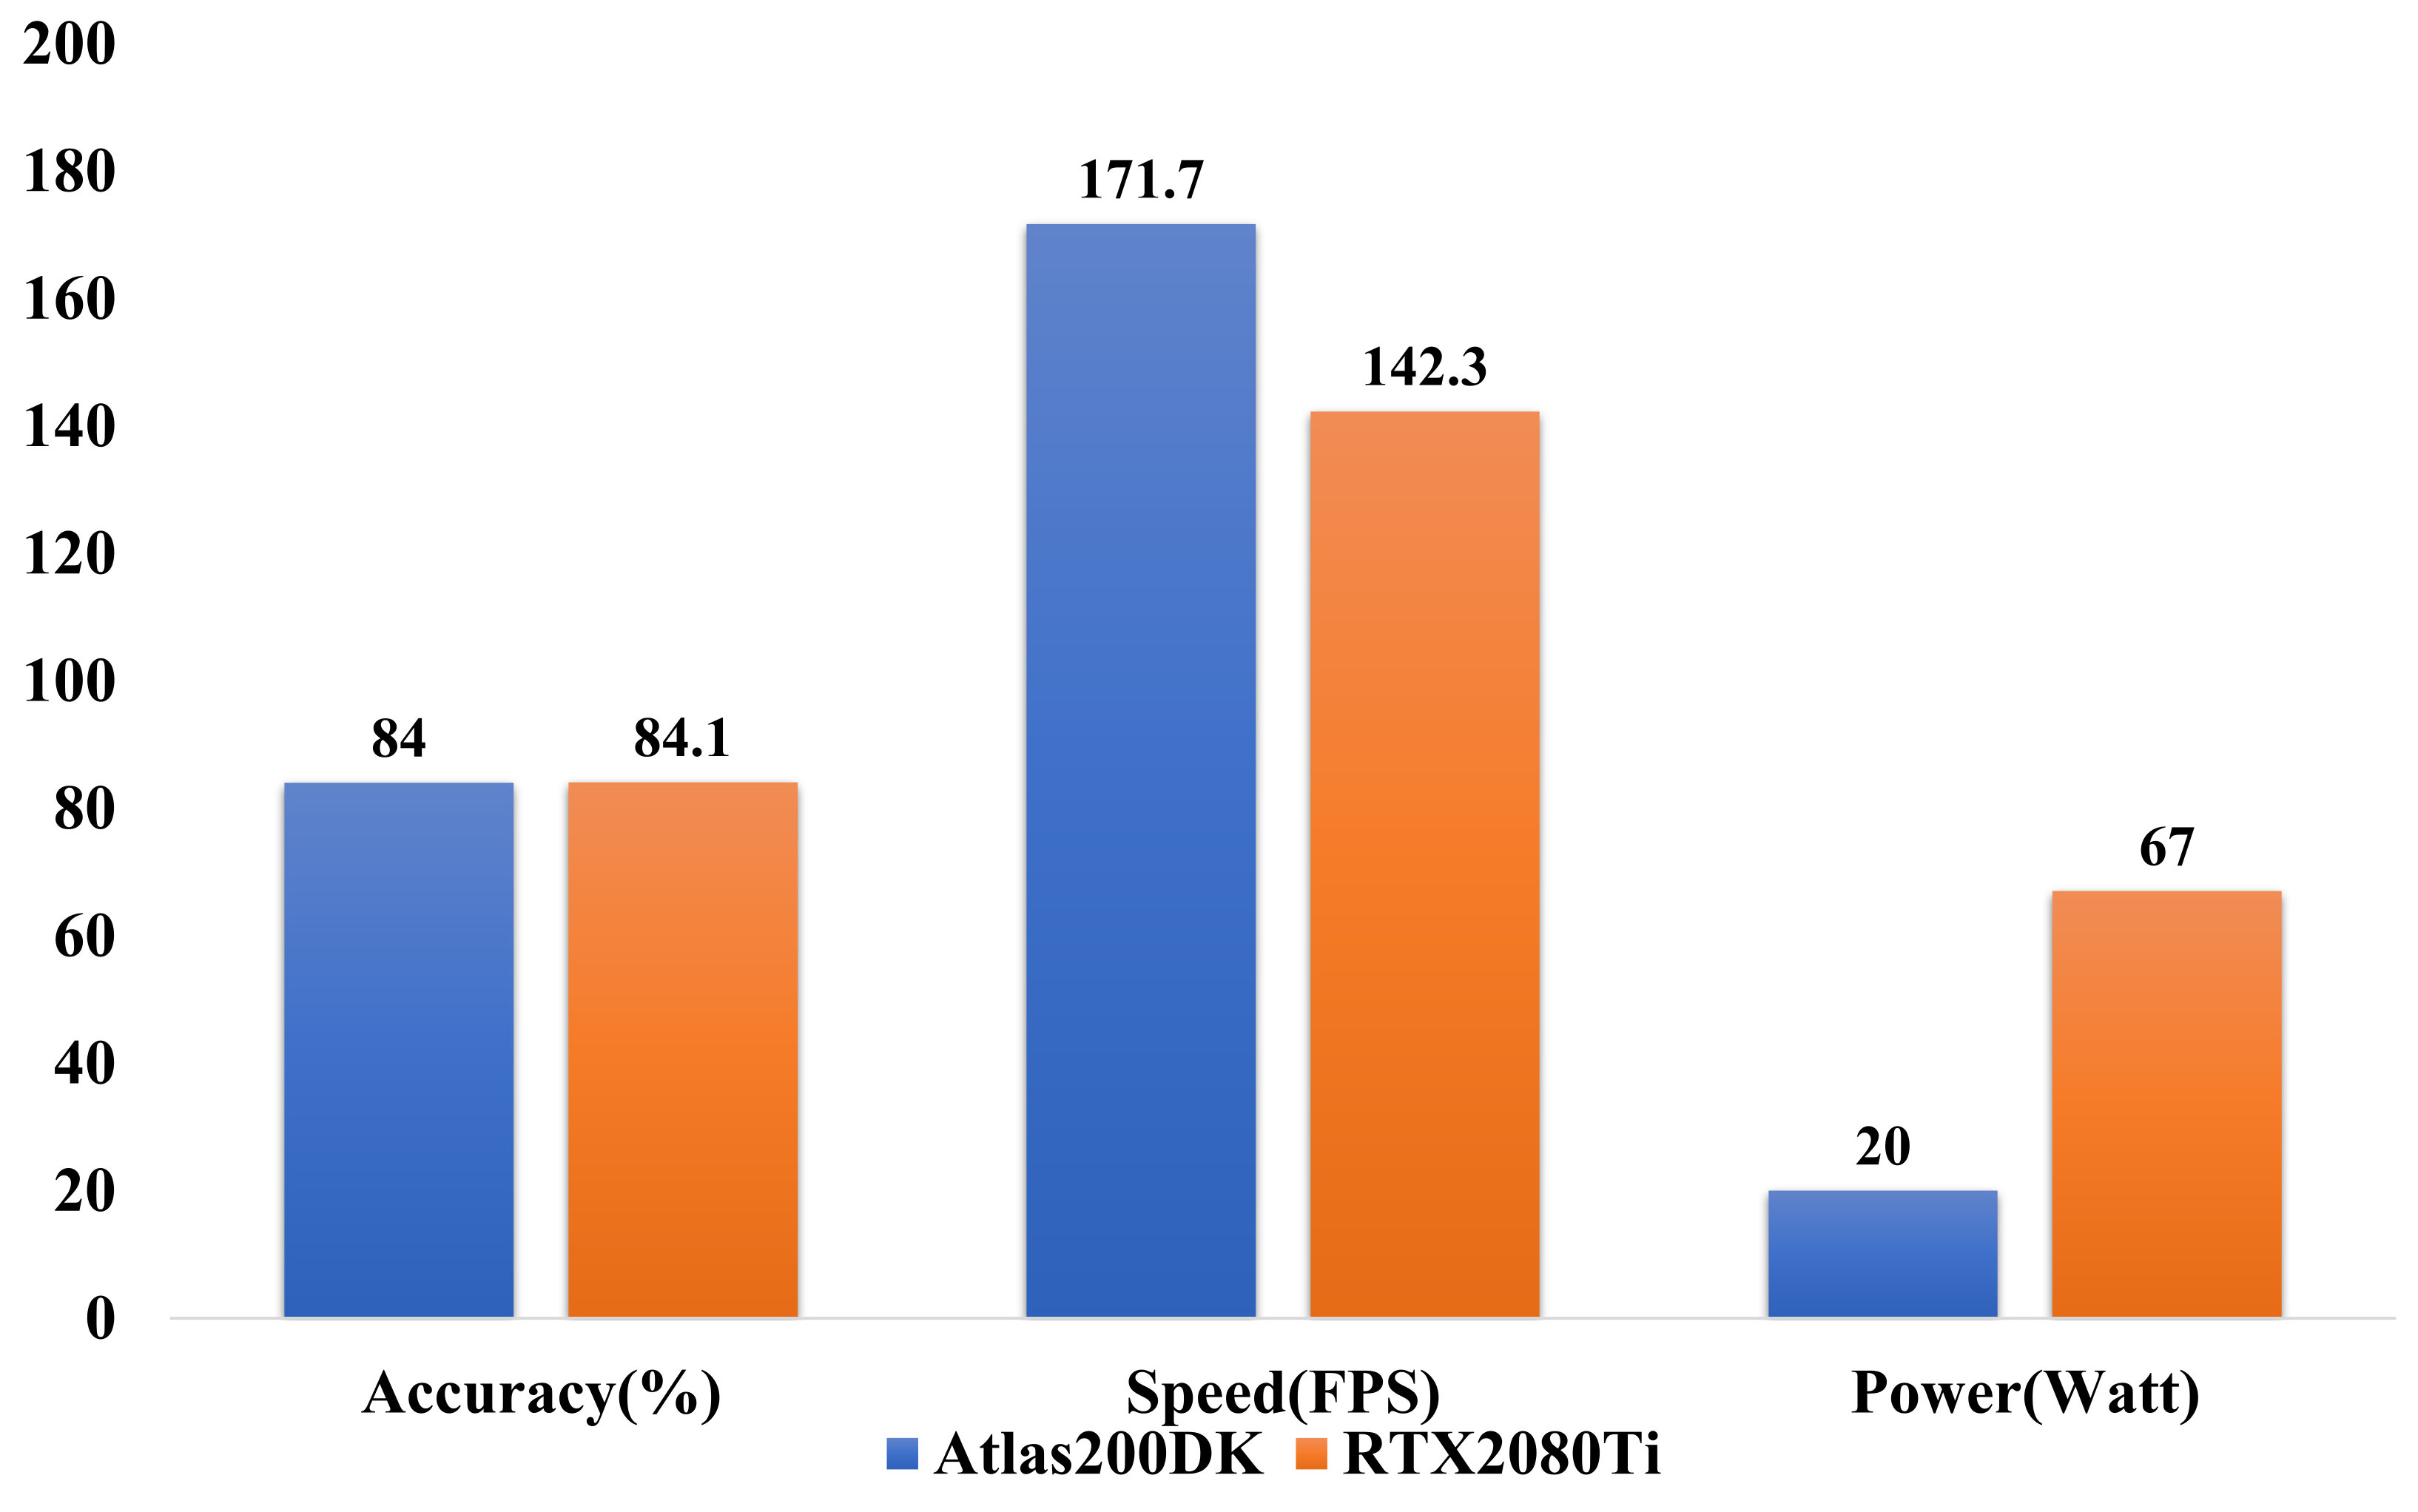
5.4. Deployment Efficiency

In this part, we evaluate our model on a low-power edge device (Atlas200DK). To demonstrate the advantages of our deployment efficiency, we compared with Nvidia RTX2080Ti GPU in both performance and power consumption.
First of all, we use the complete test dataset to test on edge devices and record the accuracy and inference speed. As shown in Figure 6, the model suffers a slight decrease in accuracy while the inference speed is way faster than that of the RTX2080Ti. Moreover, Atlas200DK’s power consumption is significantly lower than RTX2080Ti. After we use FP16 for model training, the accuracy drop of model deployment is almost negligible (0.1%).
Secondly, we test the entire equipment with real people. From video recording, skeleton detection to PD detection are all completed on the equipment. This task is extremely challenging because two deep learning models will run at the same time. After using the method mentioned in Section 4.4, we successfully achieved real-time 25FPS detection performance. Through the graphical user interface, suspicious patients can use our equipment to diagnose PD easily and see the visualized results on the interface.

6. Conclusions

In this paper, we propose a novel asymmetric dual-stream graph convolution network (ADGCN) to detect Parkinson’s disease. To train the network, PD-Walk, the world’s first Parkinson’s disease gait dataset, is presented. All the data are recorded and labeled by professional doctors. The key techniques of ADGCN are the asymmetric dual-branch architecture that can extract local and global features as well as position and motion information, thus helping our method greatly outperform baselines. Extensive experiments are conducted both in ideal and real environments to prove the availability and superiority of our method. What is more, we deploy our method on low-power equipment. The equipment has been utilized in FAHZU, helping with early detection for PD, which makes our research more practical.

Author Contributions

Conceptualization, Y.H. and T.Y.; methodology, Y.H. and T.Y.; software, Y.H. and T.Y.; validation, Y.H. and T.Y.; formal analysis, Y.H. and T.Y.; investigation, Y.H. and T.Y.; resources, C.Y.; data curation, C.Y.; writing—original draft preparation, Y.H.; writing—review and editing, Y.H., T.Y., C.Y. and H.Z.; visualization, Y.H.; supervision, H.Z.; project administration, H.Z.; funding acquisition, H.Z. All authors have read and agreed to the published version of the manuscript.

Funding

This research was funded by the National Key R & D Program of China, grant number 2019YFC0118202.

Institutional Review Board Statement

The study was approved by the Research Ethics Committee of the First Affiliated Hospital, College of Medicine, Zhejiang University (protocol code 2019-1042).

Informed Consent Statement

Informed consent was obtained from all subjects involved in the study.

Data Availability Statement

The data presented in this study are openly available in figshare (https://figshare.com/articles/dataset/PD-Walk_rar/19196138 (accessed on 19 February 2022)).

Acknowledgments

The authors would also like to thank Yuxing Wang and Luoming Zhang for their constructive opinions, as well as the help of the First Affiliated Hospital, Zhejiang University School of Medicine.

Conflicts of Interest

The authors declare no conflict of interest.

References

  1. Li, G.; Ma, J.; Cui, S.; He, Y.; Xiao, Q.; Liu, J.; Chen, S. Parkinson’s disease in China: A forty-year growing track of bedside work. Transl. Neurodegener. 2019, 1, 22. [Google Scholar] [CrossRef] [PubMed] [Green Version]
  2. Al-Radaideh, A.M.; Rababah, E.M. The role of magnetic resonance imaging in the diagnosis of Parkinson’s disease: A review. Clin. Imaging 2016, 40, 987–996. [Google Scholar] [CrossRef] [PubMed]
  3. Jankovic, J. Parkinson’s disease: Clinical features and diagnosis. J. Neurol. Neurosurg. Psychiatry 2008, 79, 368–376. [Google Scholar] [CrossRef] [PubMed] [Green Version]
  4. Steinmetzer, T.; Maasch, M.; Bönninger, I.; Travieso, C.M. Analysis and Classification of Motor Dysfunctions in Arm Swing in Parkinson’s Disease. Electronics 2019, 8, 1471. [Google Scholar] [CrossRef] [Green Version]
  5. Pistacchi, M.; Gioulis, M.; Sanson, F.; De Giovannini, E.; Filippi, G.; Rossetto, F.; Zambito Marsala, S. Gait analysis and clinical correlations in early Parkinson’s disease. Funct. Neurol. 2017, 1, 28–34. [Google Scholar] [CrossRef]
  6. Salarian, A.; Russmann, H.; Vingerhoets, F.J.G.; Burkhard, P.R.; Aminian, K. Ambulatory Monitoring of Physical Activities in Patients With Parkinson’s Disease. IEEE Trans. Biomed. Eng. 2007, 54, 2296–2299. [Google Scholar] [CrossRef]
  7. Medeiros, L.; Almeida, H.; Dias, L.; Perkusich, M.; Fischer, R. A Gait Analysis Approach to Track Parkinson’s Disease Evolution Using Principal Component Analysis. In Proceedings of the 2016 IEEE 29th International Symposium on Computer-Based Medical Systems (CBMS), Dublin, Ireland, 20–24 June 2016; pp. 48–53. [Google Scholar] [CrossRef]
  8. Veeraragavan, S.; Gopalai, A.A.; Gouwanda, D.; Ahmad, S.A. Parkinson’s Disease Diagnosis and Severity Assessment Using Ground Reaction Forces and Neural Networks. Front. Physiol. 2020, 11, 1409. [Google Scholar] [CrossRef]
  9. El Maachi, I.; Bilodeau, G.A.; Bouachir, W. Deep 1D-Convnet for accurate Parkinson disease detection and severity prediction from gait. Expert Syst. Appl. 2020, 143, 113075. [Google Scholar] [CrossRef]
  10. Cantürk, İ. A computerized method to assess Parkinson’s disease severity from gait variability based on gender. Biomed. Signal Process. Control 2021, 66, 102497. [Google Scholar] [CrossRef]
  11. Liu, X.; Li, W.; Liu, Z.; Du, F.; Zou, Q. A dual-branch model for diagnosis of Parkinson’s disease based on the independent and joint features of the left and right gait. Appl. Intell. 2021, 10, 7221–7232. [Google Scholar] [CrossRef]
  12. Hsieh, Y.L.; Abbod, M.F. Gait Analyses of Parkinson’s Disease Patients Using Multiscale Entropy. Electronics 2021, 10, 2604. [Google Scholar] [CrossRef]
  13. Pereira dos Santos, D.M.; Ferreira Neto, M.; Lemos, M.R.; da Silva, V.J.; da Silva Federal, W.A.; de Lucena Junior, V.F. Wearable System for Early Identification of Parkinson’s Disease Symptoms Through the Evaluation of the Gait Training. In Proceedings of the 2019 IEEE 9th International Conference on Consumer Electronics (ICCE-Berlin), Berlin, Germany, 8–11 September 2019; pp. 51–56. [Google Scholar] [CrossRef]
  14. Li, B.; Yao, Z.; Wang, J.; Wang, S.; Yang, X.; Sun, Y. Improved Deep Learning Technique to Detect Freezing of Gait in Parkinson’s Disease Based on Wearable Sensors. Electronics 2020, 9, 1919. [Google Scholar] [CrossRef]
  15. Locatelli, P.; Alimonti, D.; Traversi, G.; Re, V. Classification of Essential Tremor and Parkinson’s Tremor Based on a Low-Power Wearable Device. Electronics 2020, 9, 1695. [Google Scholar] [CrossRef]
  16. Cao, Z.; Simon, T.; Wei, S.E.; Sheikh, Y. Realtime Multi-Person 2D Pose Estimation Using Part Affinity Fields. In Proceedings of the IEEE Conference on Computer Vision and Pattern Recognition (CVPR), Honolulu, HI, USA, 21–26 July 2017. [Google Scholar]
  17. Fang, H.S.; Xie, S.; Tai, Y.W.; Lu, C. RMPE: Regional Multi-Person Pose Estimation. In Proceedings of the IEEE International Conference on Computer Vision (ICCV), Venice, Italy, 22–29 October 2017. [Google Scholar]
  18. Sun, K.; Xiao, B.; Liu, D.; Wang, J. Deep High-Resolution Representation Learning for Human Pose Estimation. In Proceedings of the IEEE/CVF Conference on Computer Vision and Pattern Recognition (CVPR), Long Beach, CA, USA, 15–20 June 2019. [Google Scholar]
  19. Zhou, T.; Wang, W.; Liu, S.; Yang, Y.; Van Gool, L. Differentiable Multi-Granularity Human Representation Learning for Instance-Aware Human Semantic Parsing. In Proceedings of the IEEE/CVF Conference on Computer Vision and Pattern Recognition (CVPR), Nashville, TN, USA, 20–25 June 2021; pp. 1622–1631. [Google Scholar]
  20. Randhavane, T.; Bhattacharya, U.; Kapsaskis, K.; Gray, K.; Bera, A.; Manocha, D. Learning Perceived Emotion Using Affective and Deep Features for Mental Health Applications. In Proceedings of the 2019 IEEE International Symposium on Mixed and Augmented Reality Adjunct (ISMAR-Adjunct), Beijing, China, 10–18 October 2020. [Google Scholar]
  21. Bhattacharya, U.; Mittal, T.; Chandra, R.; Randhavane, T.; Bera, A.; Manocha, D. STEP: Spatial Temporal Graph Convolutional Networks for Emotion Perception from Gaits. In Proceedings of the AAAI Conference on Artificial Intelligence, New York, NY, USA, 7–12 February 2020; Volume 34, pp. 1342–1350. [Google Scholar] [CrossRef]
  22. Bhattacharya, U.; Roncal, C.; Mittal, T.; Chandra, R.; Kapsaskis, K.; Gray, K.; Bera, A.; Manocha, D. Take an Emotion Walk: Perceiving Emotions from Gaits Using Hierarchical Attention Pooling and Affective Mapping. In Computer Vision—ECCV 2020; Springer International Publishing: Berlin/Heidelberg, Germany, 2020; pp. 145–163. [Google Scholar]
  23. Zhuang, Y.; Lin, L.; Tong, R.; Liu, J.; Iwamoto, Y.; Chen, Y.W. G-GCSN: Global Graph Convolution Shrinkage Network for Emotion Perception from Gait. In Computer Vision—ACCV 2020 Workshops; Sato, I., Han, B., Eds.; Springer International Publishing: Cham, Switzerland, 2021; pp. 46–57. [Google Scholar]
  24. Yan, S.; Xiong, Y.; Lin, D. Spatial Temporal Graph Convolutional Networks for Skeleton-Based Action Recognition. In Proceedings of the AAAI, New Orleans, LA, USA, 2–7 February 2018. [Google Scholar]
  25. Shi, L.; Zhang, Y.; Cheng, J.; Lu, H. Two-Stream Adaptive Graph Convolutional Networks for Skeleton-Based Action Recognition. In Proceedings of the 2019 IEEE/CVF Conference on Computer Vision and Pattern Recognition (CVPR), Long Beach, CA, USA, 15–20 June 2019; pp. 12018–12027. [Google Scholar] [CrossRef] [Green Version]
  26. Li, M.; Chen, S.; Chen, X.; Zhang, Y.; Wang, Y.; Tian, Q. Actional-Structural Graph Convolutional Networks for Skeleton-Based Action Recognition. In Proceedings of the 2019 IEEE/CVF Conference on Computer Vision and Pattern Recognition (CVPR), Long Beach, CA, USA, 15–20 June 2019; pp. 3590–3598. [Google Scholar] [CrossRef] [Green Version]
  27. Xiong, X.; Min, W.; Zheng, W.S.; Liao, P.; Yang, H.; Wang, S. S3D-CNN: Skeleton-based 3D consecutive-low-pooling neural network for fall detection. Appl. Intell. 2020, 50, 3521–3534. [Google Scholar] [CrossRef]
  28. Ding, C.; Liu, K.; Cheng, F.; Belyaev, E. Spatio-temporal attention on manifold space for 3D human action recognition. Appl. Intell. 2021, 51, 560–570. [Google Scholar] [CrossRef]
  29. Mehrizi, R.; Peng, X.; Zhang, S.; Liao, R.; Li, K. Automatic Health Problem Detection from Gait Videos Using Deep Neural Networks. arXiv 2020, arXiv:cs.CV/1906.01480. [Google Scholar]
  30. Wang, Y.; Wang, J.; Liu, X.; Zhu, T. Detecting Depression Through Gait Data: Examining the Contribution of Gait Features in Recognizing Depression. Front. Psychiatry 2021, 12, 633. [Google Scholar] [CrossRef]
  31. Fan, W.; Ma, Y.; Li, Q.; He, Y.; Zhao, E.; Tang, J.; Yin, D. Graph Neural Networks for Social Recommendation. In The World Wide Web Conference; Association for Computing Machinery: New York, NY, USA, 2019; pp. 417–426. [Google Scholar] [CrossRef] [Green Version]
  32. Do, K.; Tran, T.; Venkatesh, S. Graph Transformation Policy Network for Chemical Reaction Prediction. In Proceedings of the 25th ACM SIGKDD International Conference on Knowledge Discovery & Data Mining, Anchorage, AK, USA, 4–8 August 2019; Association for Computing Machinery: New York, NY, USA, 2019; pp. 750–760. [Google Scholar] [CrossRef] [Green Version]
  33. Zhou, T.; Wang, W.; Qi, S.; Ling, H.; Shen, J. Cascaded Human-Object Interaction Recognition. In Proceedings of the 2020 IEEE/CVF Conference on Computer Vision and Pattern Recognition (CVPR), Seattle, WA, USA, 13–19 June 2020; pp. 4262–4271. [Google Scholar] [CrossRef]
  34. Zhou, T.; Li, L.; Li, X.; Feng, C.M.; Li, J.; Shao, L. Group-Wise Learning for Weakly Supervised Semantic Segmentation. IEEE Trans. Image Process. 2022, 31, 799–811. [Google Scholar] [CrossRef]
  35. Yu, F.; Koltun, V. Multi-Scale Context Aggregation by Dilated Convolutions. In Proceedings of the ICLR, San Juan, PR, USA, 2–4 May 2016. [Google Scholar]
  36. Mc Ardle, R.; Del Din, S.; Galna, B.; Thomas, A.; Rochester, L. Differentiating dementia disease subtypes with gait analysis: Feasibility of wearable sensors? Gait Posture 2020, 76, 372–376. [Google Scholar] [CrossRef]
  37. Lin, T.Y.; Goyal, P.; Girshick, R.; He, K.; Dollár, P. Focal Loss for Dense Object Detection. IEEE Trans. Pattern Anal. Mach. Intell. 2020, 42, 318–327. [Google Scholar] [CrossRef] [PubMed] [Green Version]
  38. Chen, T.; Moreau, T.; Jiang, Z.; Zheng, L.; Yan, E. TVM: An Automated End-to-End Optimizing Compiler for Deep Learning. In Proceedings of the 13th USENIX Symposium on Operating Systems Design and Implementation (OSDI 18), Carlsbad, CA, USA, 8–10 October 2018. [Google Scholar]
Figure 1. The overall process of data collection and preprocessing. All the videos captured in process (a) are then cut into the same length in (b). In process of (c), HRNet was used to extract human skeletons. (d) shows the process of skeleton alignment.
Electronics 11 01154 g001
Figure 2. A visualization of samples in PD-Walk dataset.
Electronics 11 01154 g002
Figure 3. The dual branch network structure. The upper branch uses a local connection with input trajectory and velocity, while the lower branch uses a global connection with input velocity and acceleration.
Electronics 11 01154 g003
Figure 4. Joint connections (with head removed). (a) Local connections, (b) global connections.
Electronics 11 01154 g004
Figure 5. The equipment structure. An additional development board is used to expand the necessary interface. All devices are integrated in a chassis.
Electronics 11 01154 g005
Figure 6. Performance comparison between Atlas200DK and RTX2080Ti (running ADGCN only).
Electronics 11 01154 g006
Table 1. Overall performance in accuracy, recall, and F1 score.
MethodAccuracyRecallF1 Score
Hand-crafted Feature + SVM (Baseline)76.5%77.3%0.761
ST-GCN78.5%79.2%0.801
Ours 1 82.6%84.0%0.842
Ours 2 84.1%85.8%0.852
1 Results of our method with cross-entropy loss. 2 Results of our method with focal loss..
Table 2. Joints selection and data augmentation effects for ST-GCN.
Head JointsAugmentationAccuracyRecallF1 Score
74.8%72.3%0.744
76.2%73.6%0.771
78.5%79.2%0.801
Table 3. The influence of global connections and motion information.
ModelBranch1Branch2Result
ConnectionInputConnectionInputAccuracyRecallF1 Score
ST-GCNLocalTrajectory /  / 78.5%79.2%0.801
Dual branchLocalTrajectoryLocalVelocity80.0%82.1%0.817
Dual branchLocalTrajectory + velocityLocalVelocity + Acceleration80.5%82.6%0.822
Dual branchGlobalTrajectory + velocityGlobalVelocity + Acceleration80.0%83.3%0.820
Dual branchLocalTrajectory + velocityGlobalVelocity + Acceleration84.1%85.8%0.852
Publisher’s Note: MDPI stays neutral with regard to jurisdictional claims in published maps and institutional affiliations.

