1. Introduction
With the development of space technology and the popularity of satellite applications, the number and types of Earth observation satellites are increasing, playing quite an important role in the fields of economy, military and people’s livelihood [
1]. Facing the growing demand for large-scale and diversified tasks of users from all walks of life, multi-satellite scheduling for constellations has become a hot research issue at home and abroad.
The Multi-Satellite Scheduling Problem (MSSP) refers to the process by which the satellite control department allocates resources, including satellites, payloads and ground stations, etc., to meet the routine needs or urgent requests of earth observation. The process must satisfy various constraints, maximizing the benefits of satellite missions during the satellite in-orbit operation [
2,
3].
Obviously, multi-satellite scheduling involves not only satellite payload resources but also ground management resources to ensure their normal operation. It can be seen that there are many constraints in multi-satellite scheduling. Therefore, reasonable models and efficient scheduling methods are of great significance for describing and solving problems such as the MSSP.
As for the multi-satellite scheduling methods, due to the Non-deterministic Polynomial (NP) characteristics of scheduling problems, most of the current research uses heuristic methods to solve the problem [
4], mainly including Tabu Search (TS) [
5], Ant Colony Optimization (ACO) [
6], Genetic Algorithm (GA) [
7,
8], Particle Swarm Optimization (PSO) [
9,
10] and the Multi-Objective Evolutionary Algorithm (MOEA) [
11,
12], etc.
These heuristic optimization methods are easy to implement and widely used. Arezoo Sarkheyli [
5] applied the new Tabu Search (TS) algorithm to solve the problem of low-orbit satellite scheduling by considering the priority of the task and satisfying the time and resource constraints. However, the limiting factors considered only include coverage rate, data storage capacity and battery capacity in that paper.
Zixuan Zheng et al. [
8] used the improved Genetic Algorithm (GA) to solve the satellite scheduling problem and proposed a Hybrid Dynamic Mutation (HDM) strategy, which overcomes the early convergence and long calculation time to some extent. However, the simulation model did not consider the constraints adequately; only the limits of satellite data transmission were taken into account.
Chen H et al. [
1] proposed a complete search algorithm, heuristic search algorithm and swarm intelligence optimization algorithm for the observation of task-oriented satellite cluster scheduling problems on different scales.
As mentioned above, these heuristic optimization methods are easy to implement and efficient to solve satellite scheduling problems with specific constrains. However, when we encounter complex satellite scheduling problems in real time, the constraints of the model should be considered adequately; the computational complexity and efficiency of the algorithm are considered the most important aspects of multi-satellite scheduling.
Baluja [
13] first proposed an evolutionary algorithm based on Population-Based Incremental Learning (PBIL) in 1996. The basic idea of the algorithm is to regard the evolution process as a learning process. The knowledge, also called the probability of learning, is obtained by learning to guide the generation of offspring. This probability is the accumulation of information throughout the evolutionary process, and it will guide more effective directions for the offspring (compared to GA’s parental genetic recombination strategy), which results in faster convergence and better optimizations. Inspired by this PBIL, called the traditional PBIL, we propose a real-coding PBIL that has a better performance both in efficiency and quality for multi-satellite scheduling with complex constrains close to reality.
In this paper, we discuss modeling and algorithms for the Multi-satellite Scheduling Problem (MSSP). The contribution of our work is as follows:
Considering the load and platform operation of satellites in reality, we establish a mathematical model of satellite scheduling with complex constraints, and the related mathematical statement is given.
We propose the real-coding Population-Based Incremental Learning (PBIL) algorithm to solve the MSSP. Compared to the traditional PBIL algorithm with binary coding, the real-coding format can greatly shorten the coding length so that the computational efficiency is improved. Additionally, we design the value probability matrix, correction coefficient and mutation operator to guide better evolution and avoid early convergence.
We conduct some numerical simulations and analyses to verify the real-coding PBIL algorithm for the MSSP. The performance of the algorithm is analyzed by comparing it with binary-coding PBIL and Genetic Algorithm (GA). Additionally, the influence of key parameters on algorithm performance, such as probability correction coefficient, is analyzed.
We note that a shorter conference version of this paper appeared in
Wireless and Satellite Systems-11th EAI International Conference (WiSATS 2020) [
14]. Our initial conference paper neglected to provide the mathematical expressions of constraints in the multi-satellite scheduling model and did not address the influence of key parameters or coding formats on the performance of the PBIL algorithm. This manuscript addresses these issues and provides additional comparisons and analyses to verify the efficiency and quality of algorithms for multi-satellite scheduling in our study.
The organization of this paper is as follows:
Section 2 provides a mathematical model of MSSP and gives the related mathematical statement of constraints;
Section 3 proposes the real-coding PBIL algorithm for satellite schedules and explains a detailed framework of our method; the simulation details and results are elaborated on and analyzed in
Section 4; lastly, the conclusion is presented in
Section 5.
3. Real-Coding PBIL Algorithm for Multi-Satellite Scheduling
The real-coding PBIL algorithm for multi-satellite scheduling is mainly based on the evolutionary framework, including the key part of encoding, population initialization, fitness function, value probability matrix, population update, etc.
3.1. Encoding
When using the traditional PBIL algorithm for multi-satellite scheduling, the binary-coding format is often used, as shown in
Figure 1.
Each bit of the chromosome represents an observation time window corresponding to a target, and its value is 0 or 1, which indicates whether the time window is selected to arrange the observation task. The length of the chromosome is the number of visible time windows for all satellites toward all targets.
However, in the actual multi-satellite scheduling process, the number of satellites in a constellation and observation targets will be large, the planning interval will be long and the number of visible time windows will be correspondingly larger. If the binary-coding format is used to deal with the large-scale satellite scheduling problem, the chromosome will be so long that it will take a lot of time for each bit of the chromosome to do the constraints check, which will result in very low algorithm efficiency.
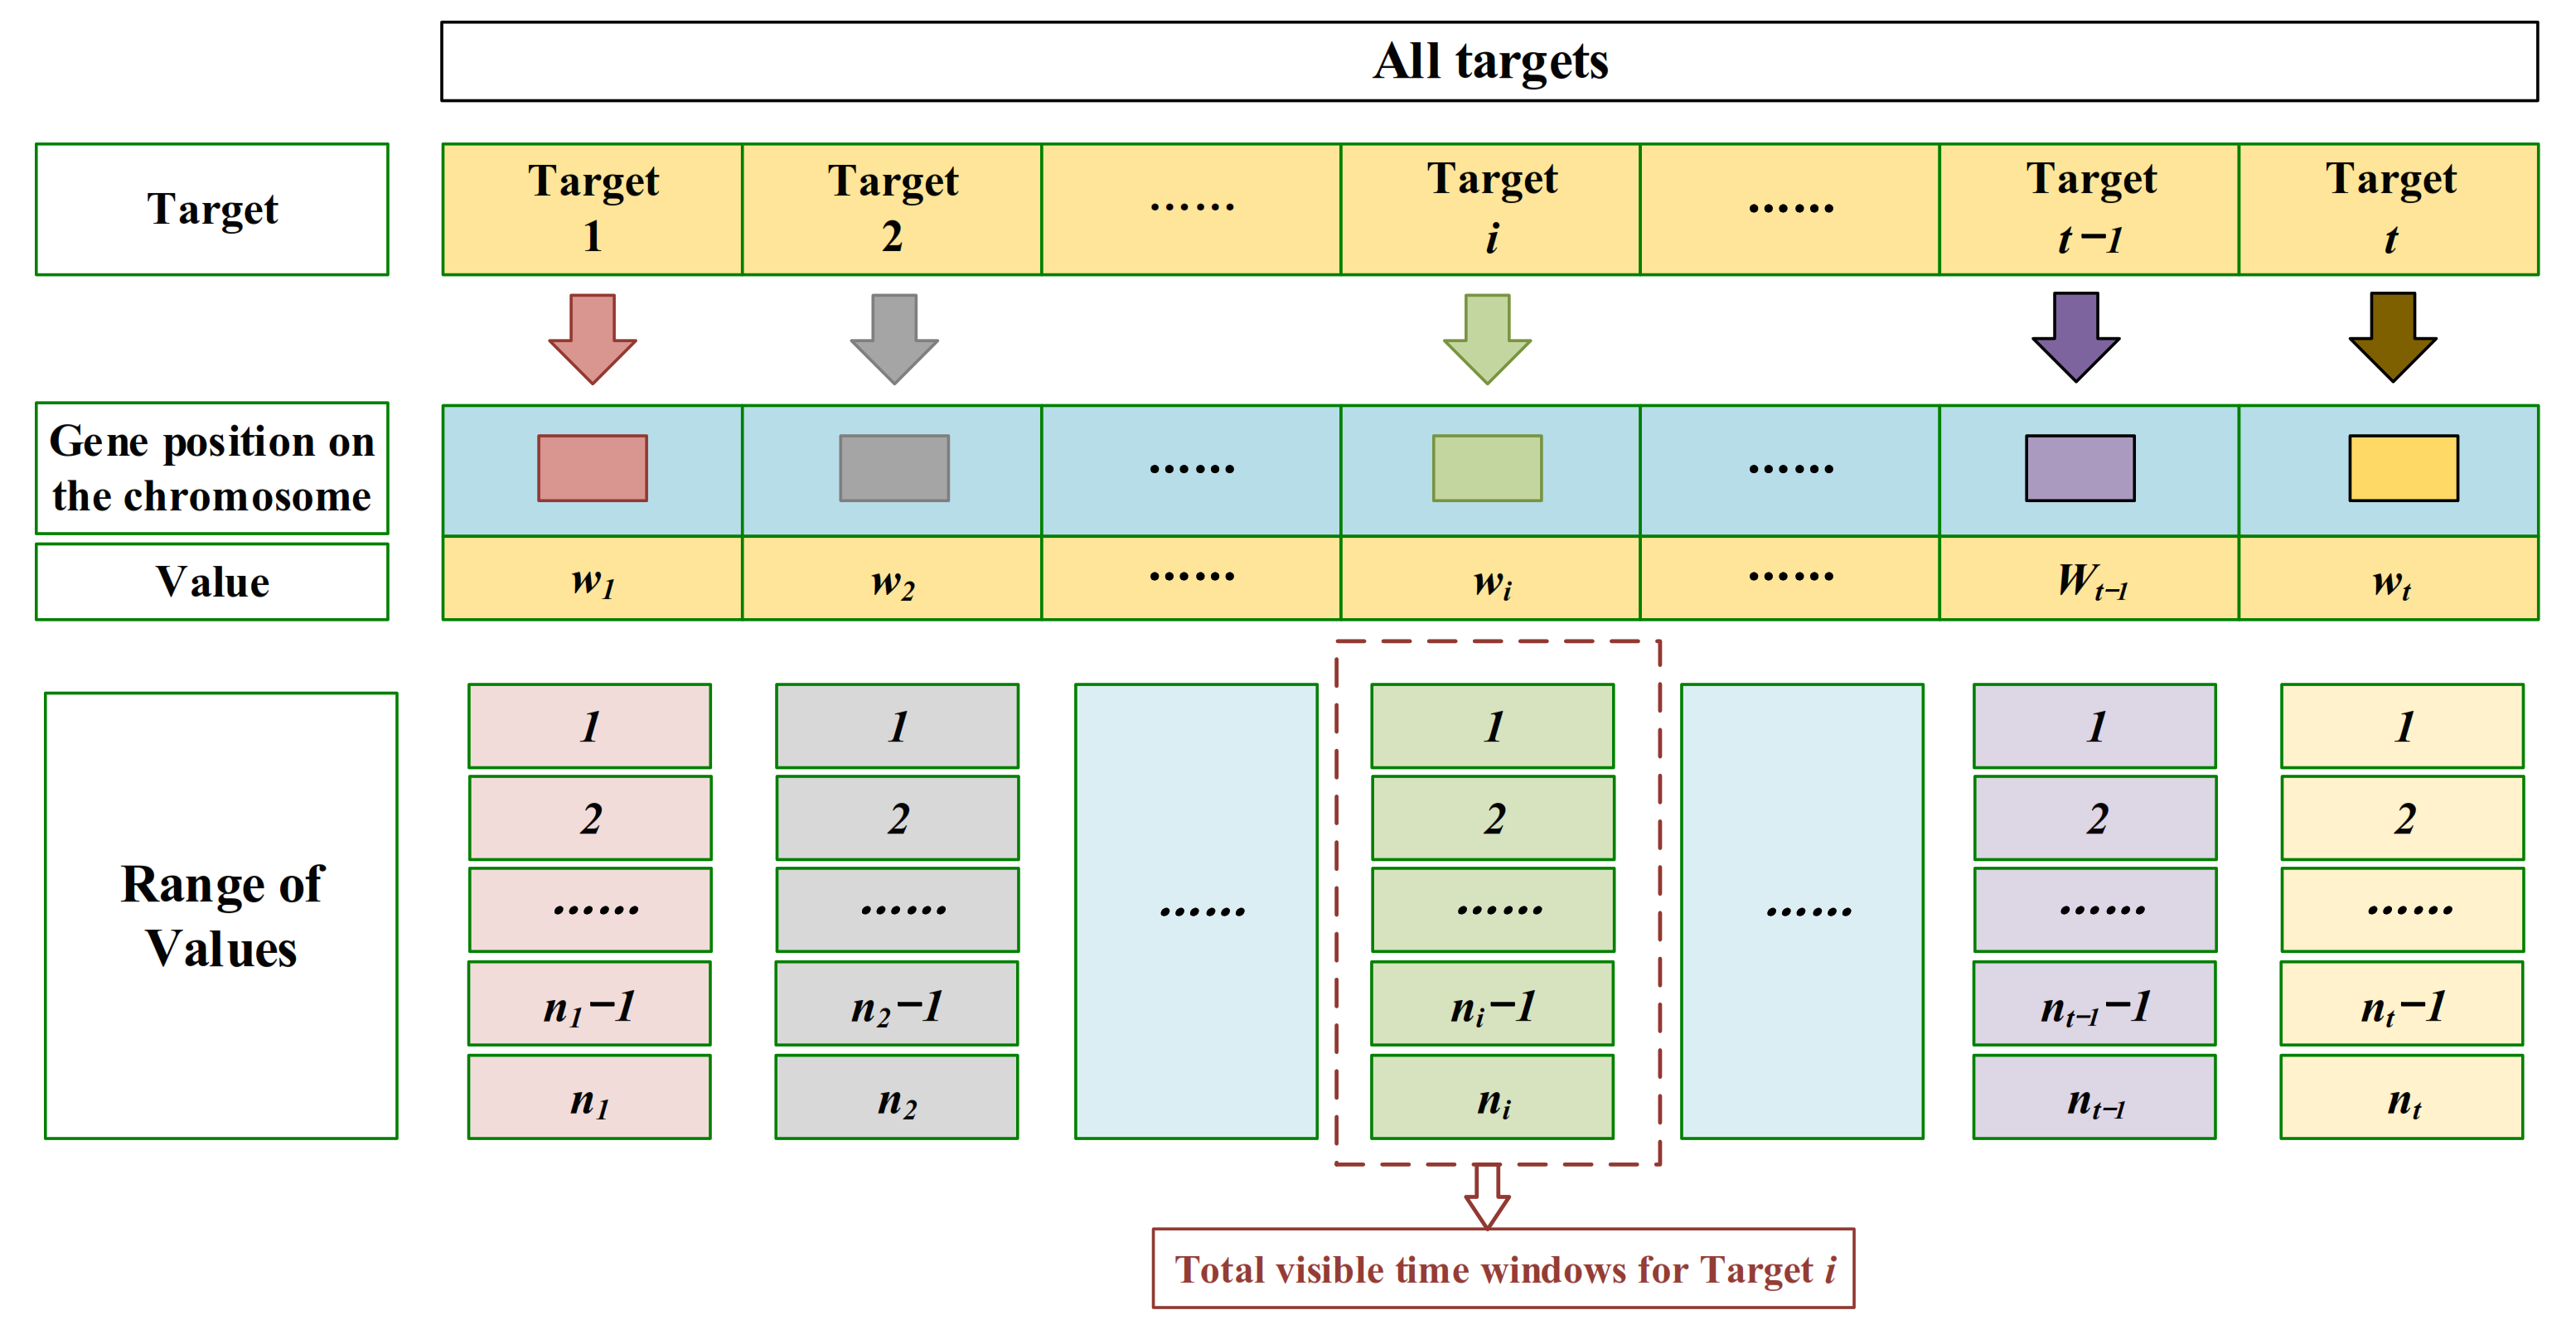
To enhance the computational efficiency of the algorithm, a real-coding format is elaborated in this paper, as shown in
Figure 2.
In the real-coding format, each bit of chromosome represents a target. For one target in the overall target set , it corresponds to the i-th bit of the chromosome.
Assuming that the total number of visible time windows for the target is , each time window is numbered, corresponding from 1 to .
If the value of the i-th gene position of the chromosome is , one of the natural numbers from 1 to , it means that the time window of target is selected to complete the observation task of this target. Thus the mapping relationship between chromosomes and problem search space points is established.
3.2. Fitness Function
In the PBIL algorithm, the fitness function represents the direction of evolution. It determines which individual will be chosen to learn and generate the probability of value to guide the generation of offspring. Generally, different fitness functions can be established according to different optimization goals.
In this paper, the objective function in the mathematical model is directly taken as the fitness function.
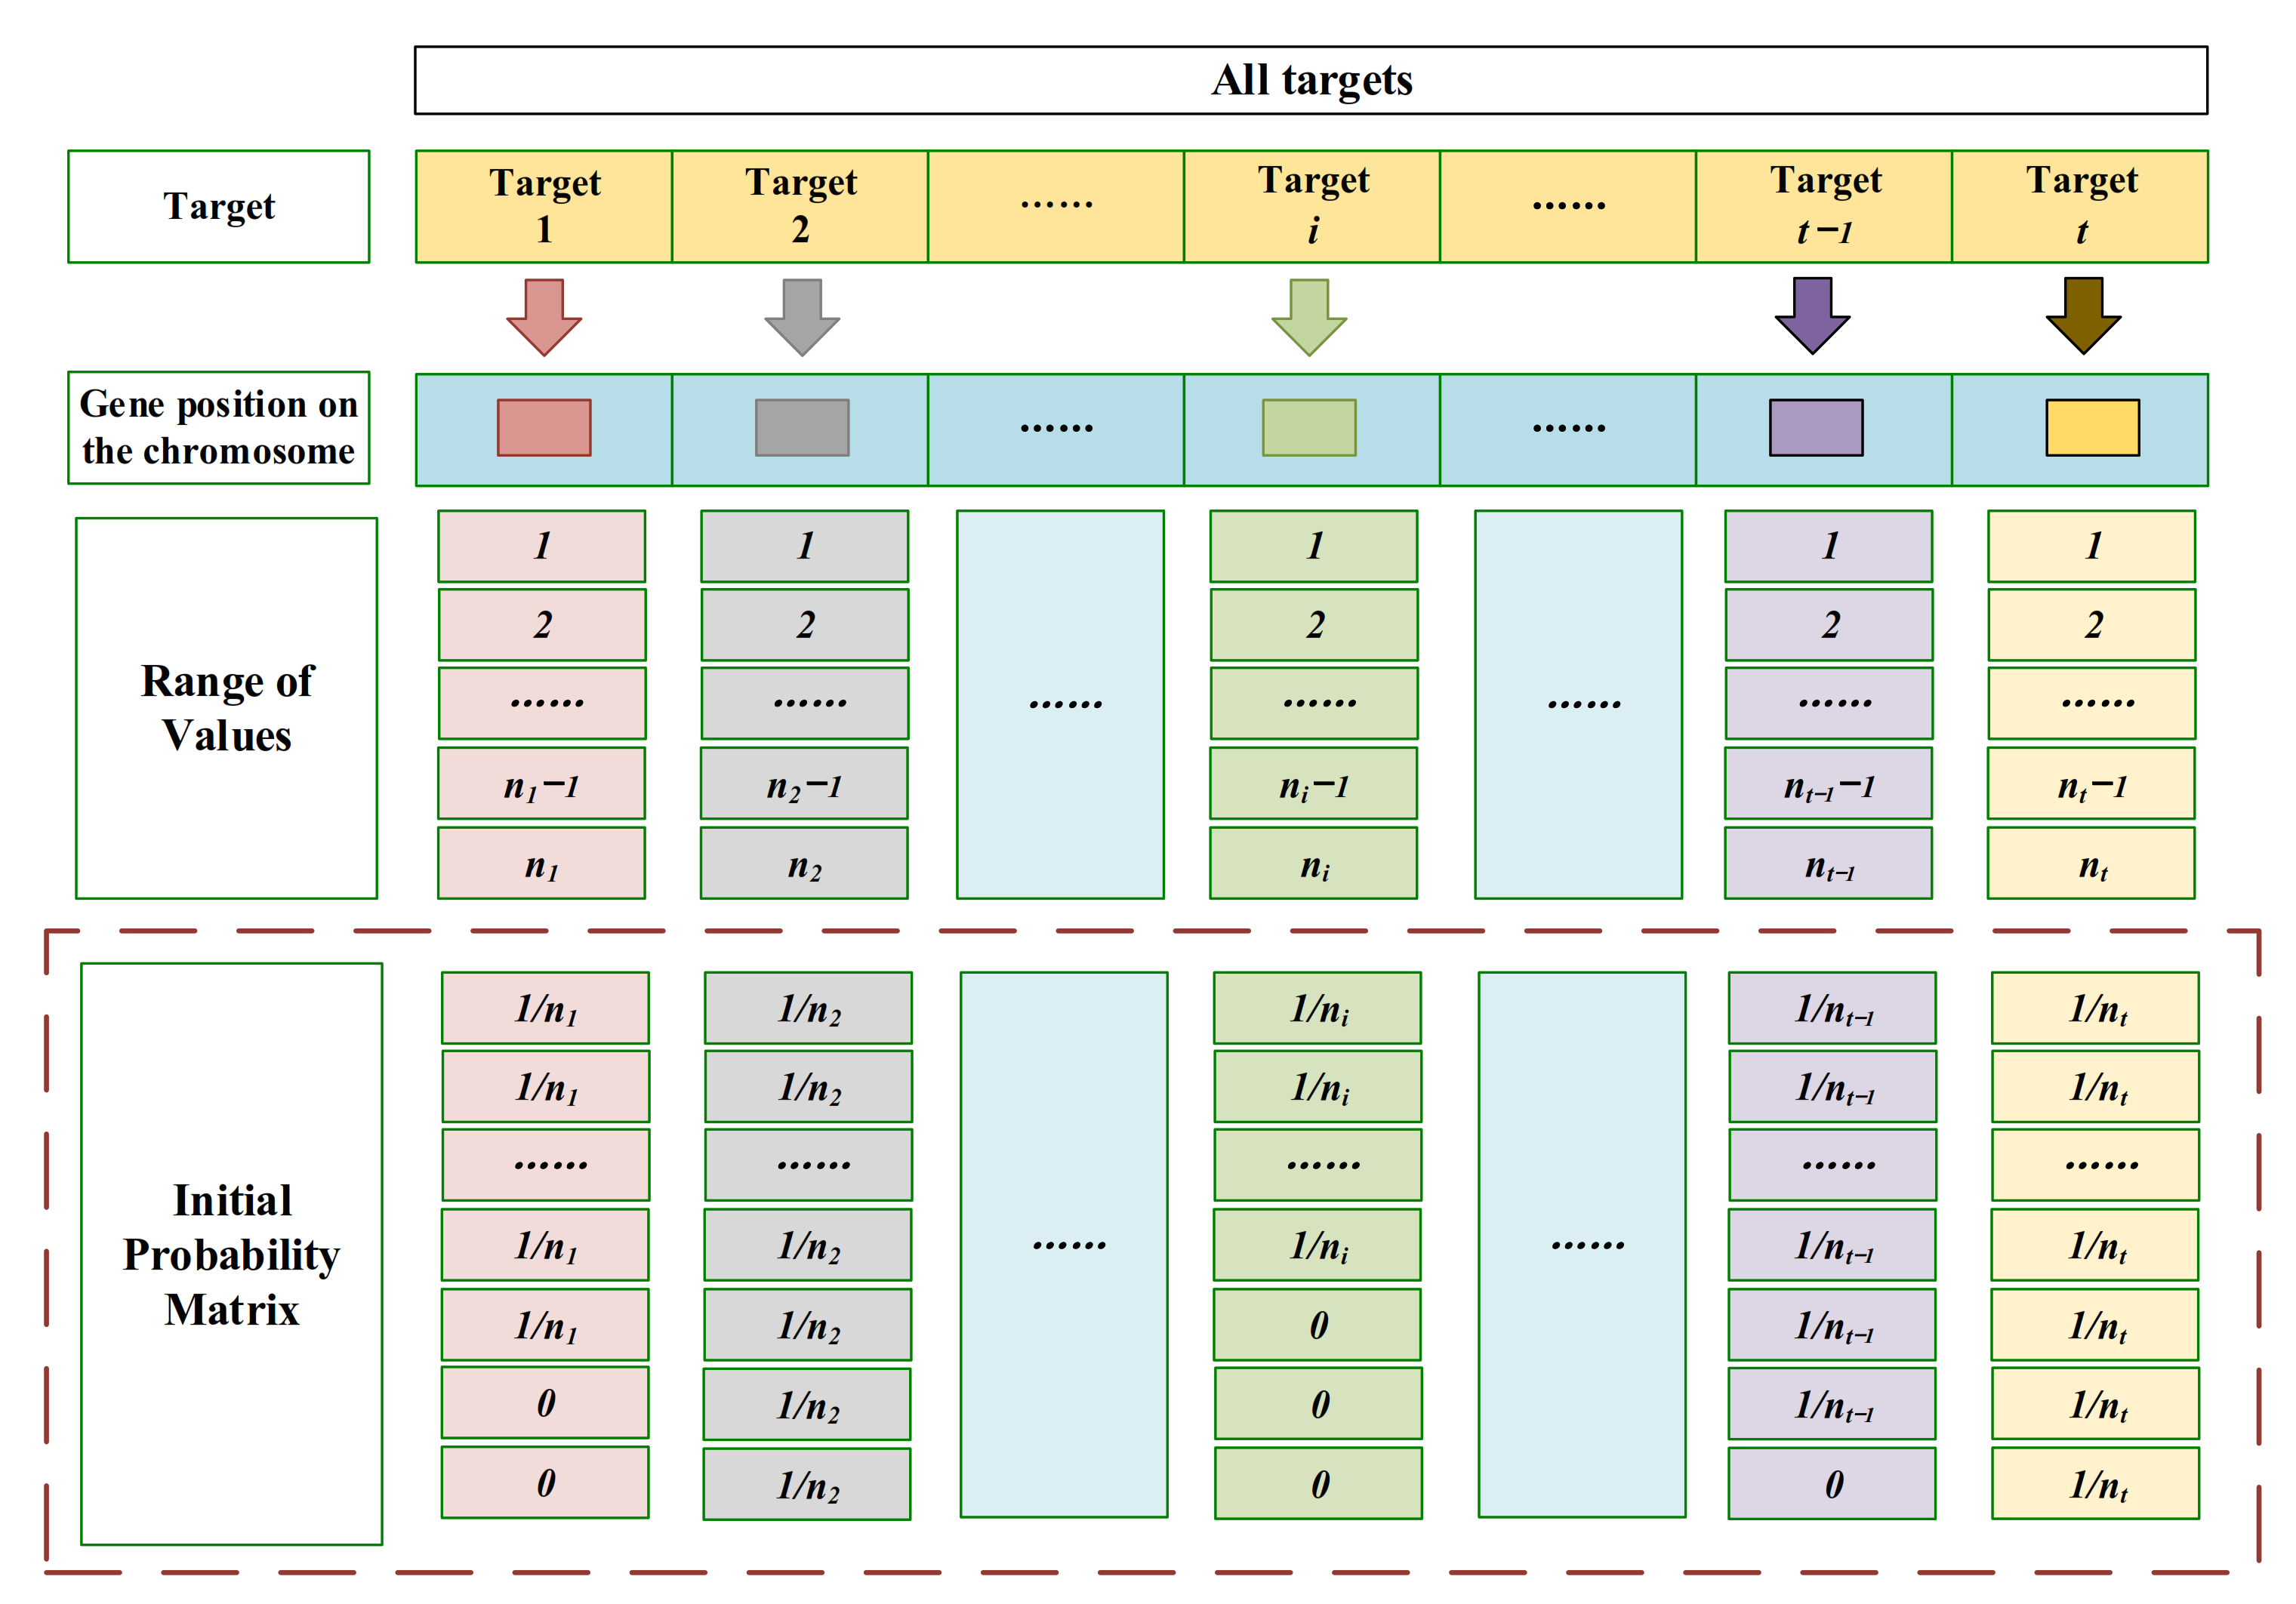
3.3. Value Probability Matrix
In the real-coding PBIL algorithm, the probability is in the form of a matrix. The initial probability matrix is shown in
Figure 3.
A column of the probability matrix corresponds to a gene position of a chromosome; in other words, it corresponds to an observation target. For the target in the overall target set , it has observable time windows in total. This means that the value of the i-th gene position of the chromosome has selections.
The matrix
is the probability of value selections in the algorithm. The
j-th row of the
i-th column of the probability matrix
represents the probability of selecting the
j-th value of the
i-th gene position. The probability matrix
is initialized as shown in Equation (6), which ensures that each value of each gene position has the same probability at the beginning of evolution. The matrix
is visually represented in
Figure 3.
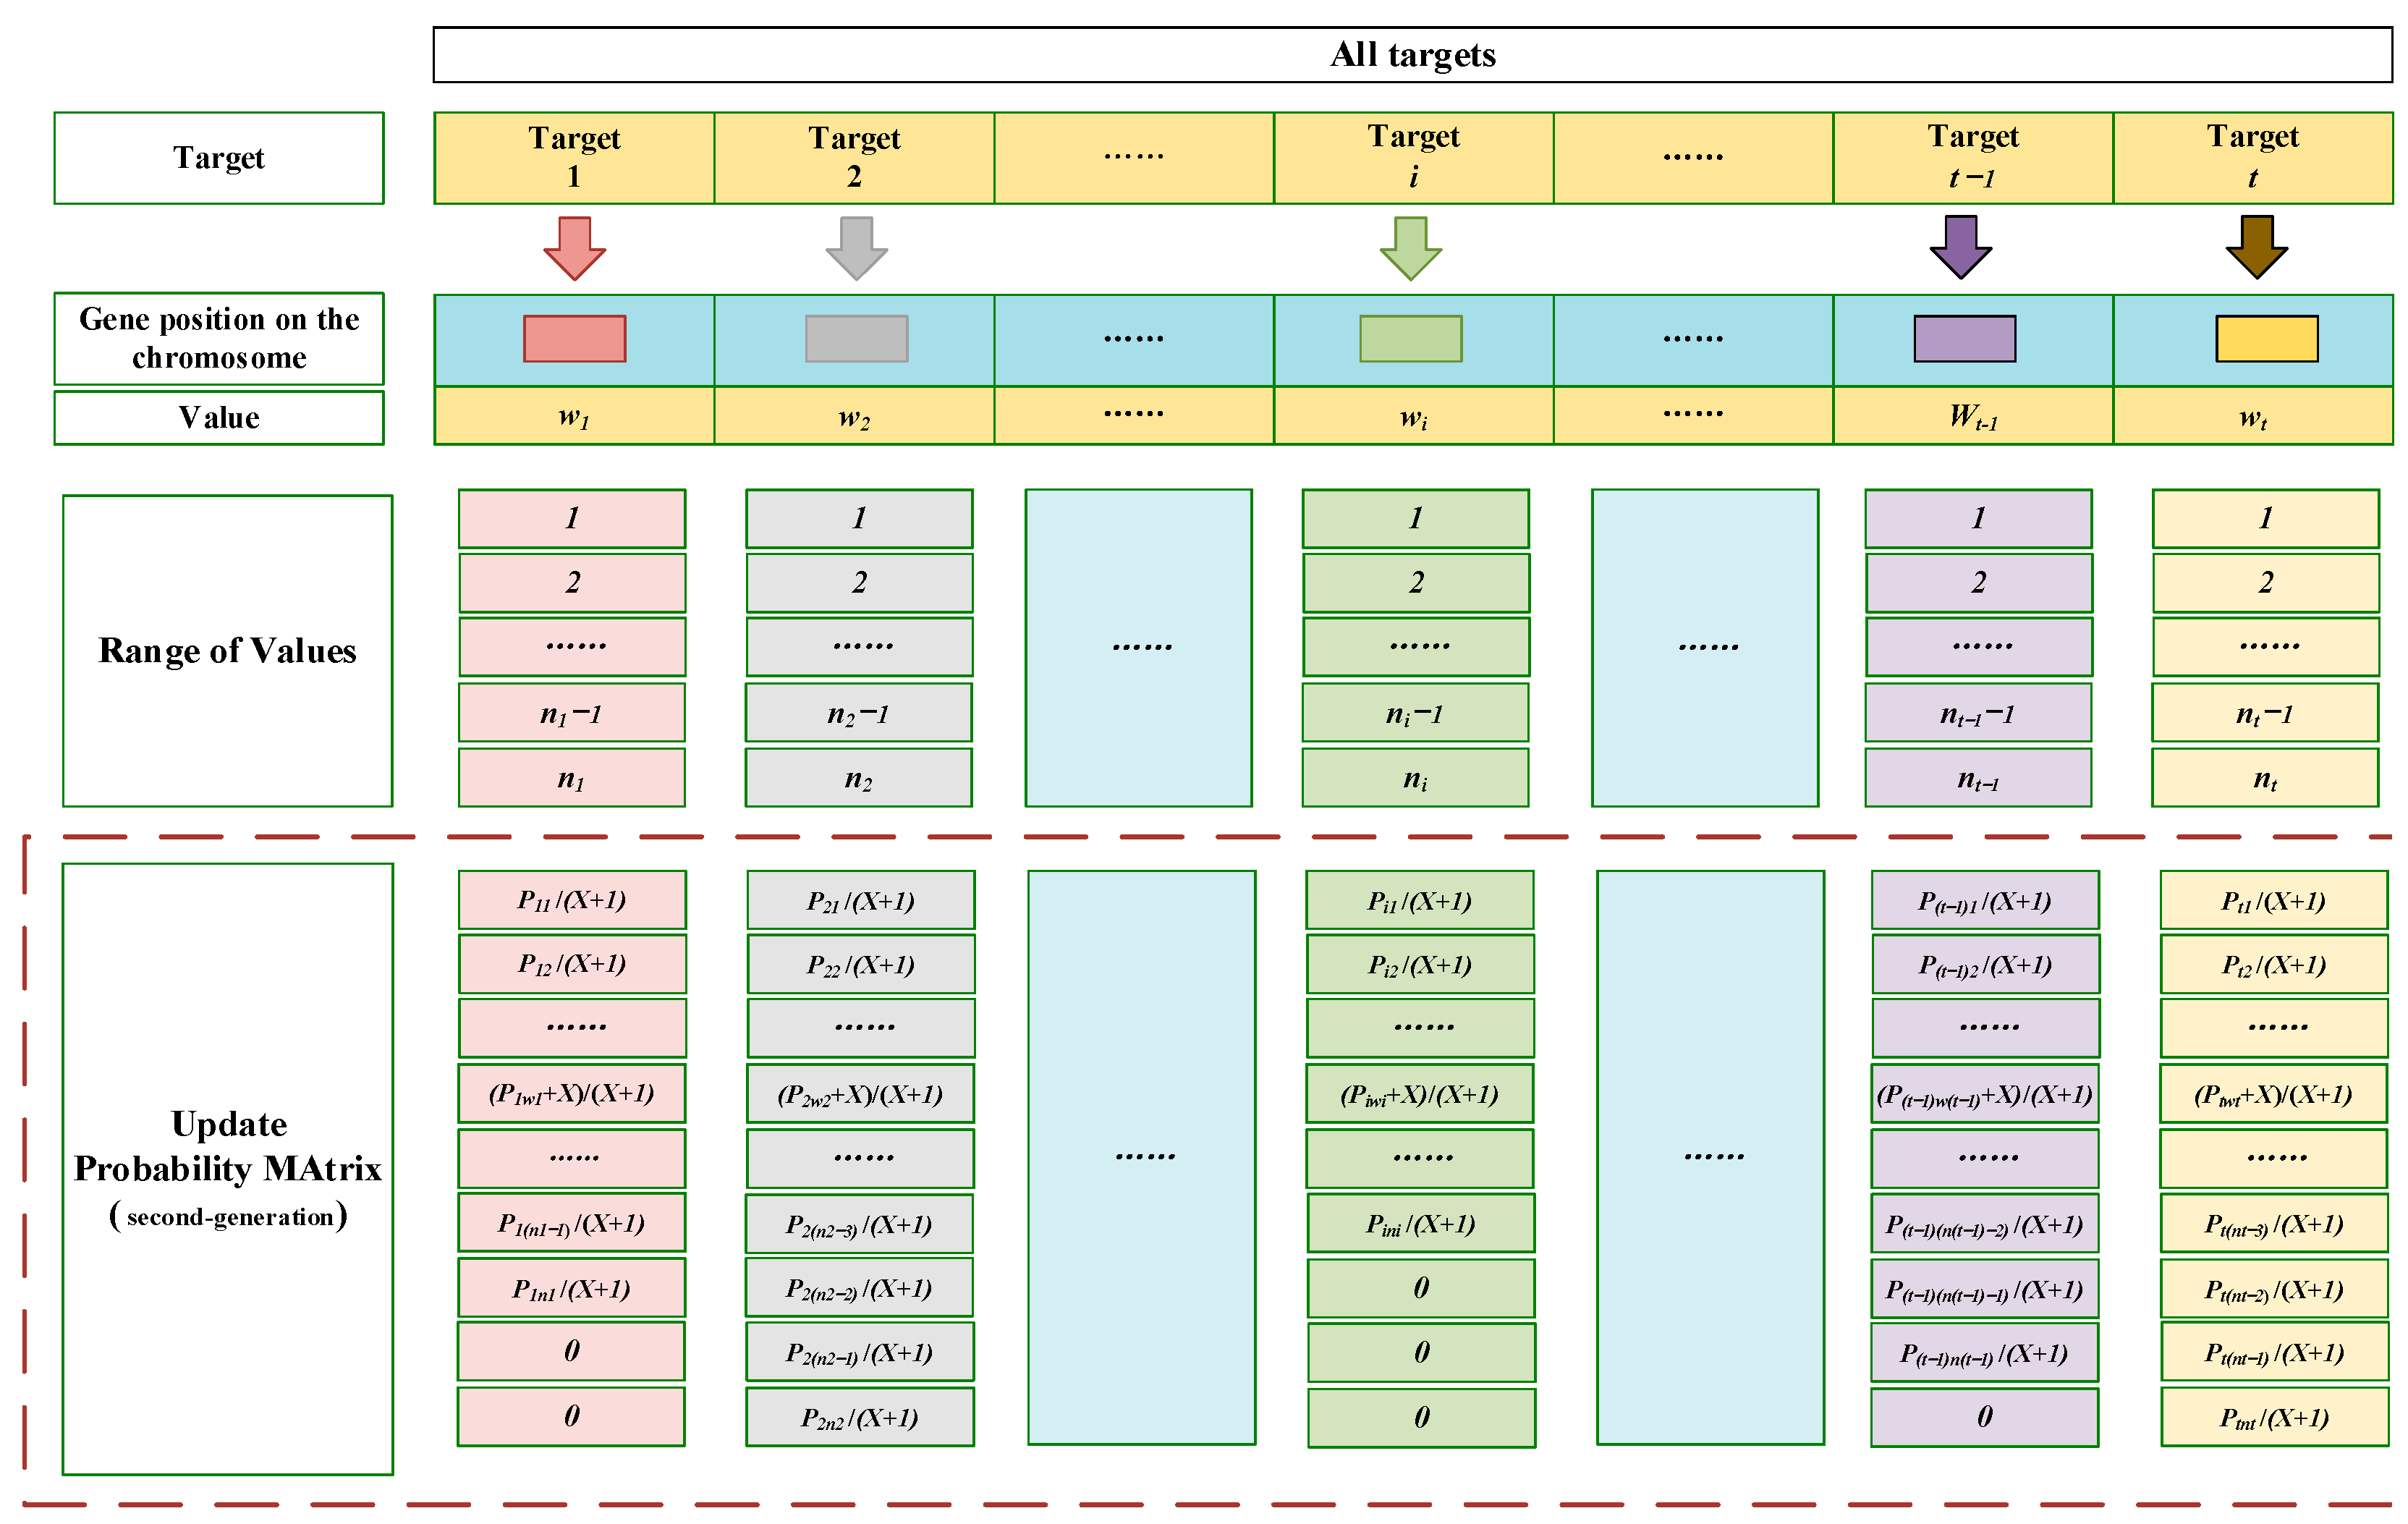
Among the new populations of each generation, the individual with the highest fitness value is selected for learning, and the probability matrix is updated, which will guide the optimization direction for the population updating.
After the optimal individual
is generated, the update formula of the probability
is as shown in Equation (7).
Obviously, the probability of the
j-th value of the
i-th gene position is increased. In order to keep the sum of the probabilities of all the values of the
i-th gene position as 1, it is necessary to normalize the probability matrix. The normalization formula is as shown in Equation (8).
Take the probability matrix update of the second generation as an example. The update of the probability matrix is shown in
Figure 4.
As the evolution process progresses, the probability of each value will deviate differently from the initial probability. Additionally, the offspring generated according to the probability update will be more likely to be highly adaptable.
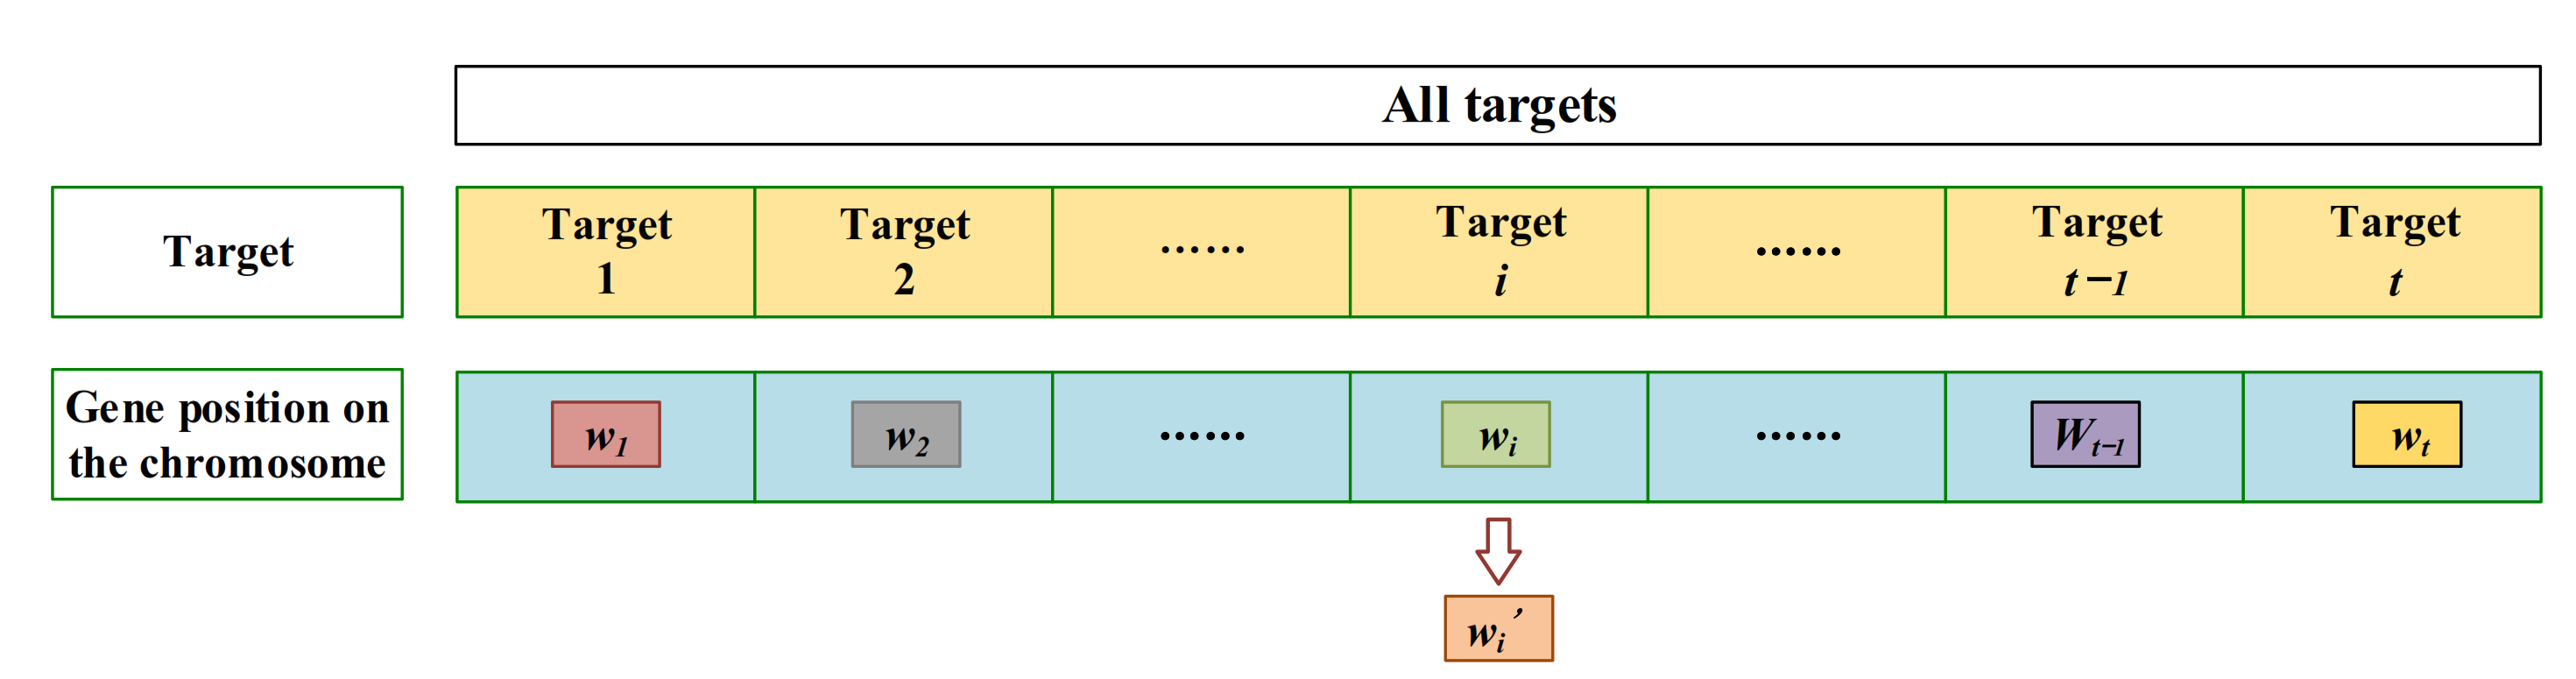
3.4. Mutation Operator
When the fitness value between individuals in the population is not much different, it means that the diversity of the population genes is low, and there may be a situation of evolutionary stagnation, resulting in insufficient global search and falling into a local optimum.
Therefore, in this paper, for each individual generated from the probability matrix, it decides whether to perform a mutation operation according to a small mutation probability. When it is selected for mutation, a certain bit in the chromosome is randomly selected, and the locus is randomly reassigned. The mutation operation is completed, as shown in
Figure 5.
3.5. Population Update
The update of the population is under the guidance of the probability matrix. With the real-coding format, the way of population updates is slightly different from that with binary coding.
Similar to the roulette selection strategy, the probability of different values of the same gene position is sequentially accumulated to obtain cumulative probabilities. Then, a random number between 0 and 1 is generated.
The value corresponding to the smallest cumulative probability greater than r is the value of the genetic position. In this way, new individuals generation and population updates can be completed.
3.6. End Condition
In this paper, the end condition is the number of evolutions determined by some numerical experiments in which the population fitness value is not significantly improved in the late stage of evolution, and the algorithm stops when the population completes these iterations. Usually, the number of iterations will be related to the size of the population. The larger the population is, the larger number of iterations is, and vice versa.
3.7. Algorithm Steps
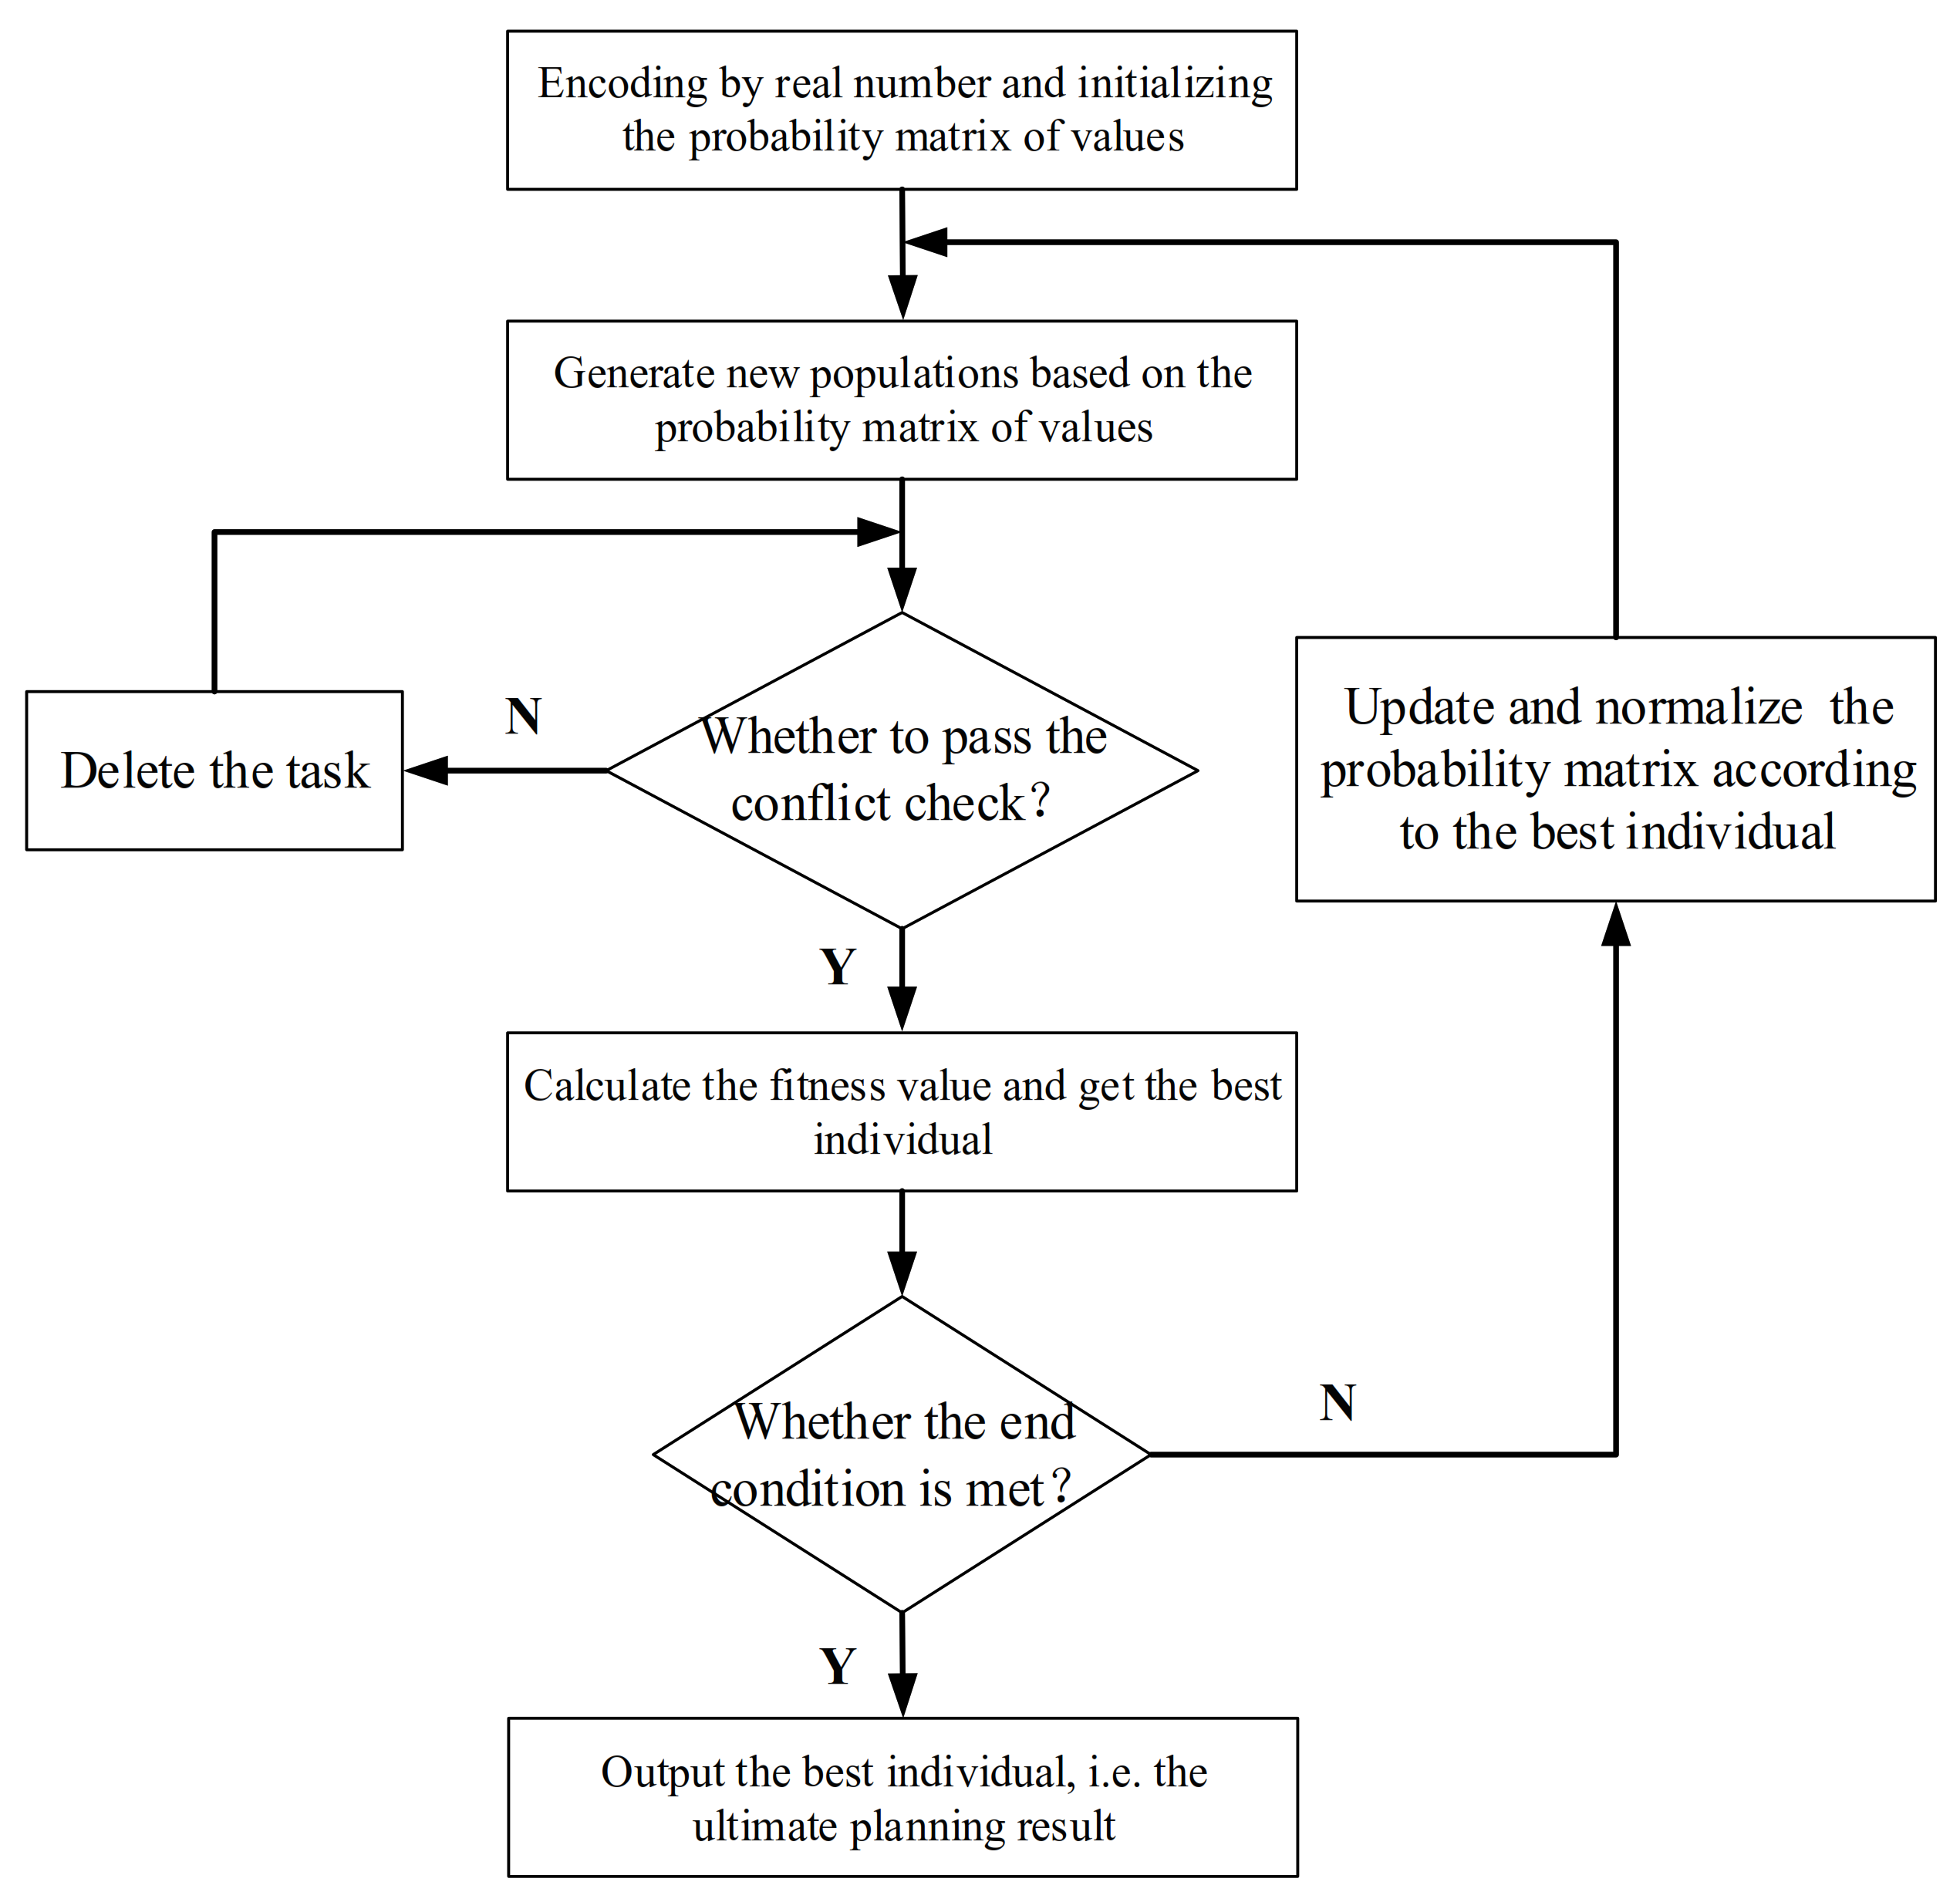
The algorithm flow chart is shown in
Figure 6.
- Step 1.
Encode each task according to the real-coding format, and initialize the probability matrix.
- Step 2.
According to the above update method, use the probability matrix to guide the generation of the new population.
- Step 3.
According to the constraints in the mathematical model, each of the genetic positions of each chromosome in the population, that is, each task is checked for conflict. A task that does not pass the conflict check will be abandoned; that is, the value of this gene position of the chromosome will be set as zero.
- Step 4.
The fitness value of each individual is calculated to obtain the best individual with the highest fitness value.
- Step 5.
If the end condition is satisfied, shift to Step 6. Otherwise, according to the best individual generated in the previous step, update and normalize the probability matrix and shift to Step 2.
- Step 6.
The algorithm ends. Obtain the best individual and output the corresponding mission planning scheme.
4. Experimental Results and Analysis
In this paper, the model and algorithm proposed for multi-satellite scheduling are verified by numerical examples as follows. By designing simulation scenarios and typical examples, the performance of the real-coding PBIL algorithm is analyzed by comparing it with binary-coding PBIL and the Genetic Algorithm (GA). Additionally, the influence of key parameters on algorithm performance, such as the probability correction coefficient, is analyzed.
4.1. Simulation Scenario
First of all, we build the simulation scenario, including satellites, targets, ground stations, etc.
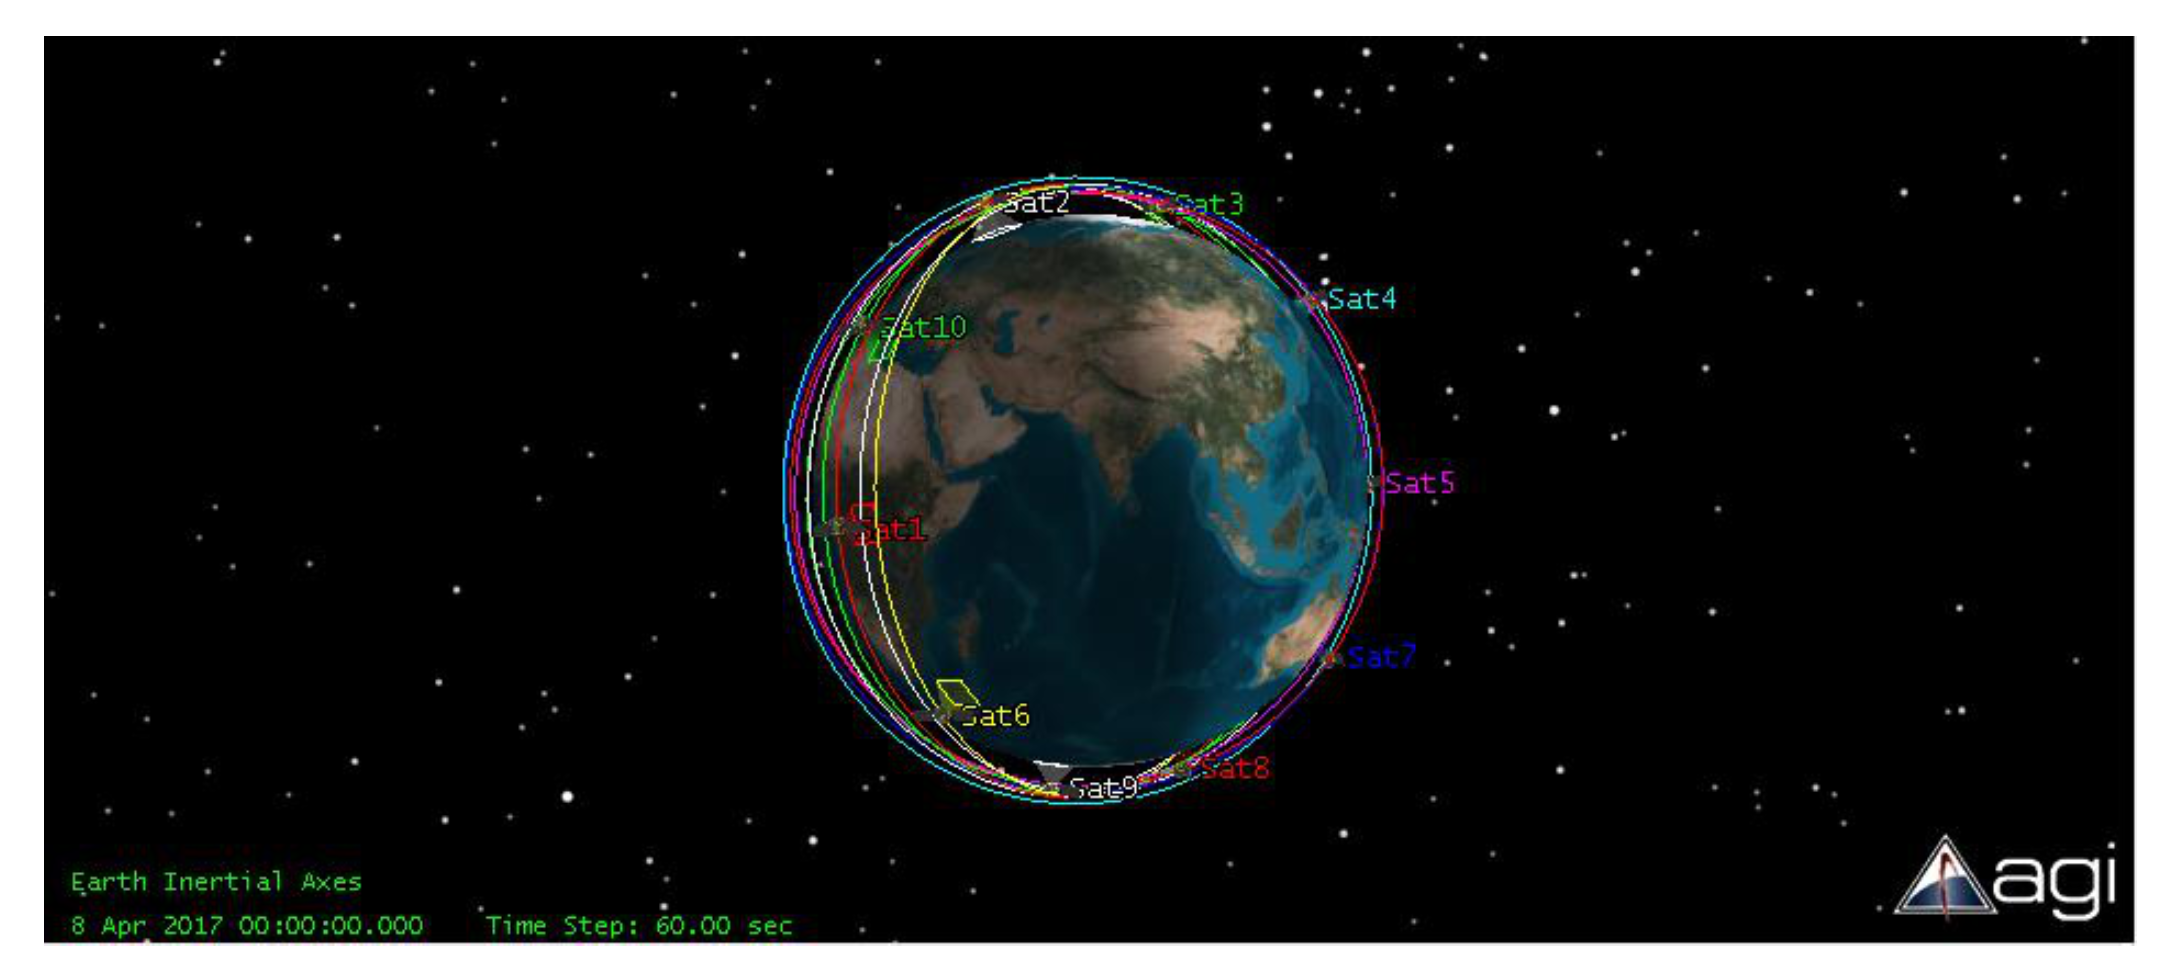
4.1.1. The Satellites
In this paper, the number of satellites is set to 10, remote satellites S1 to S10 are established in STK, and the distribution of the satellites in STK is shown in
Figure 7.
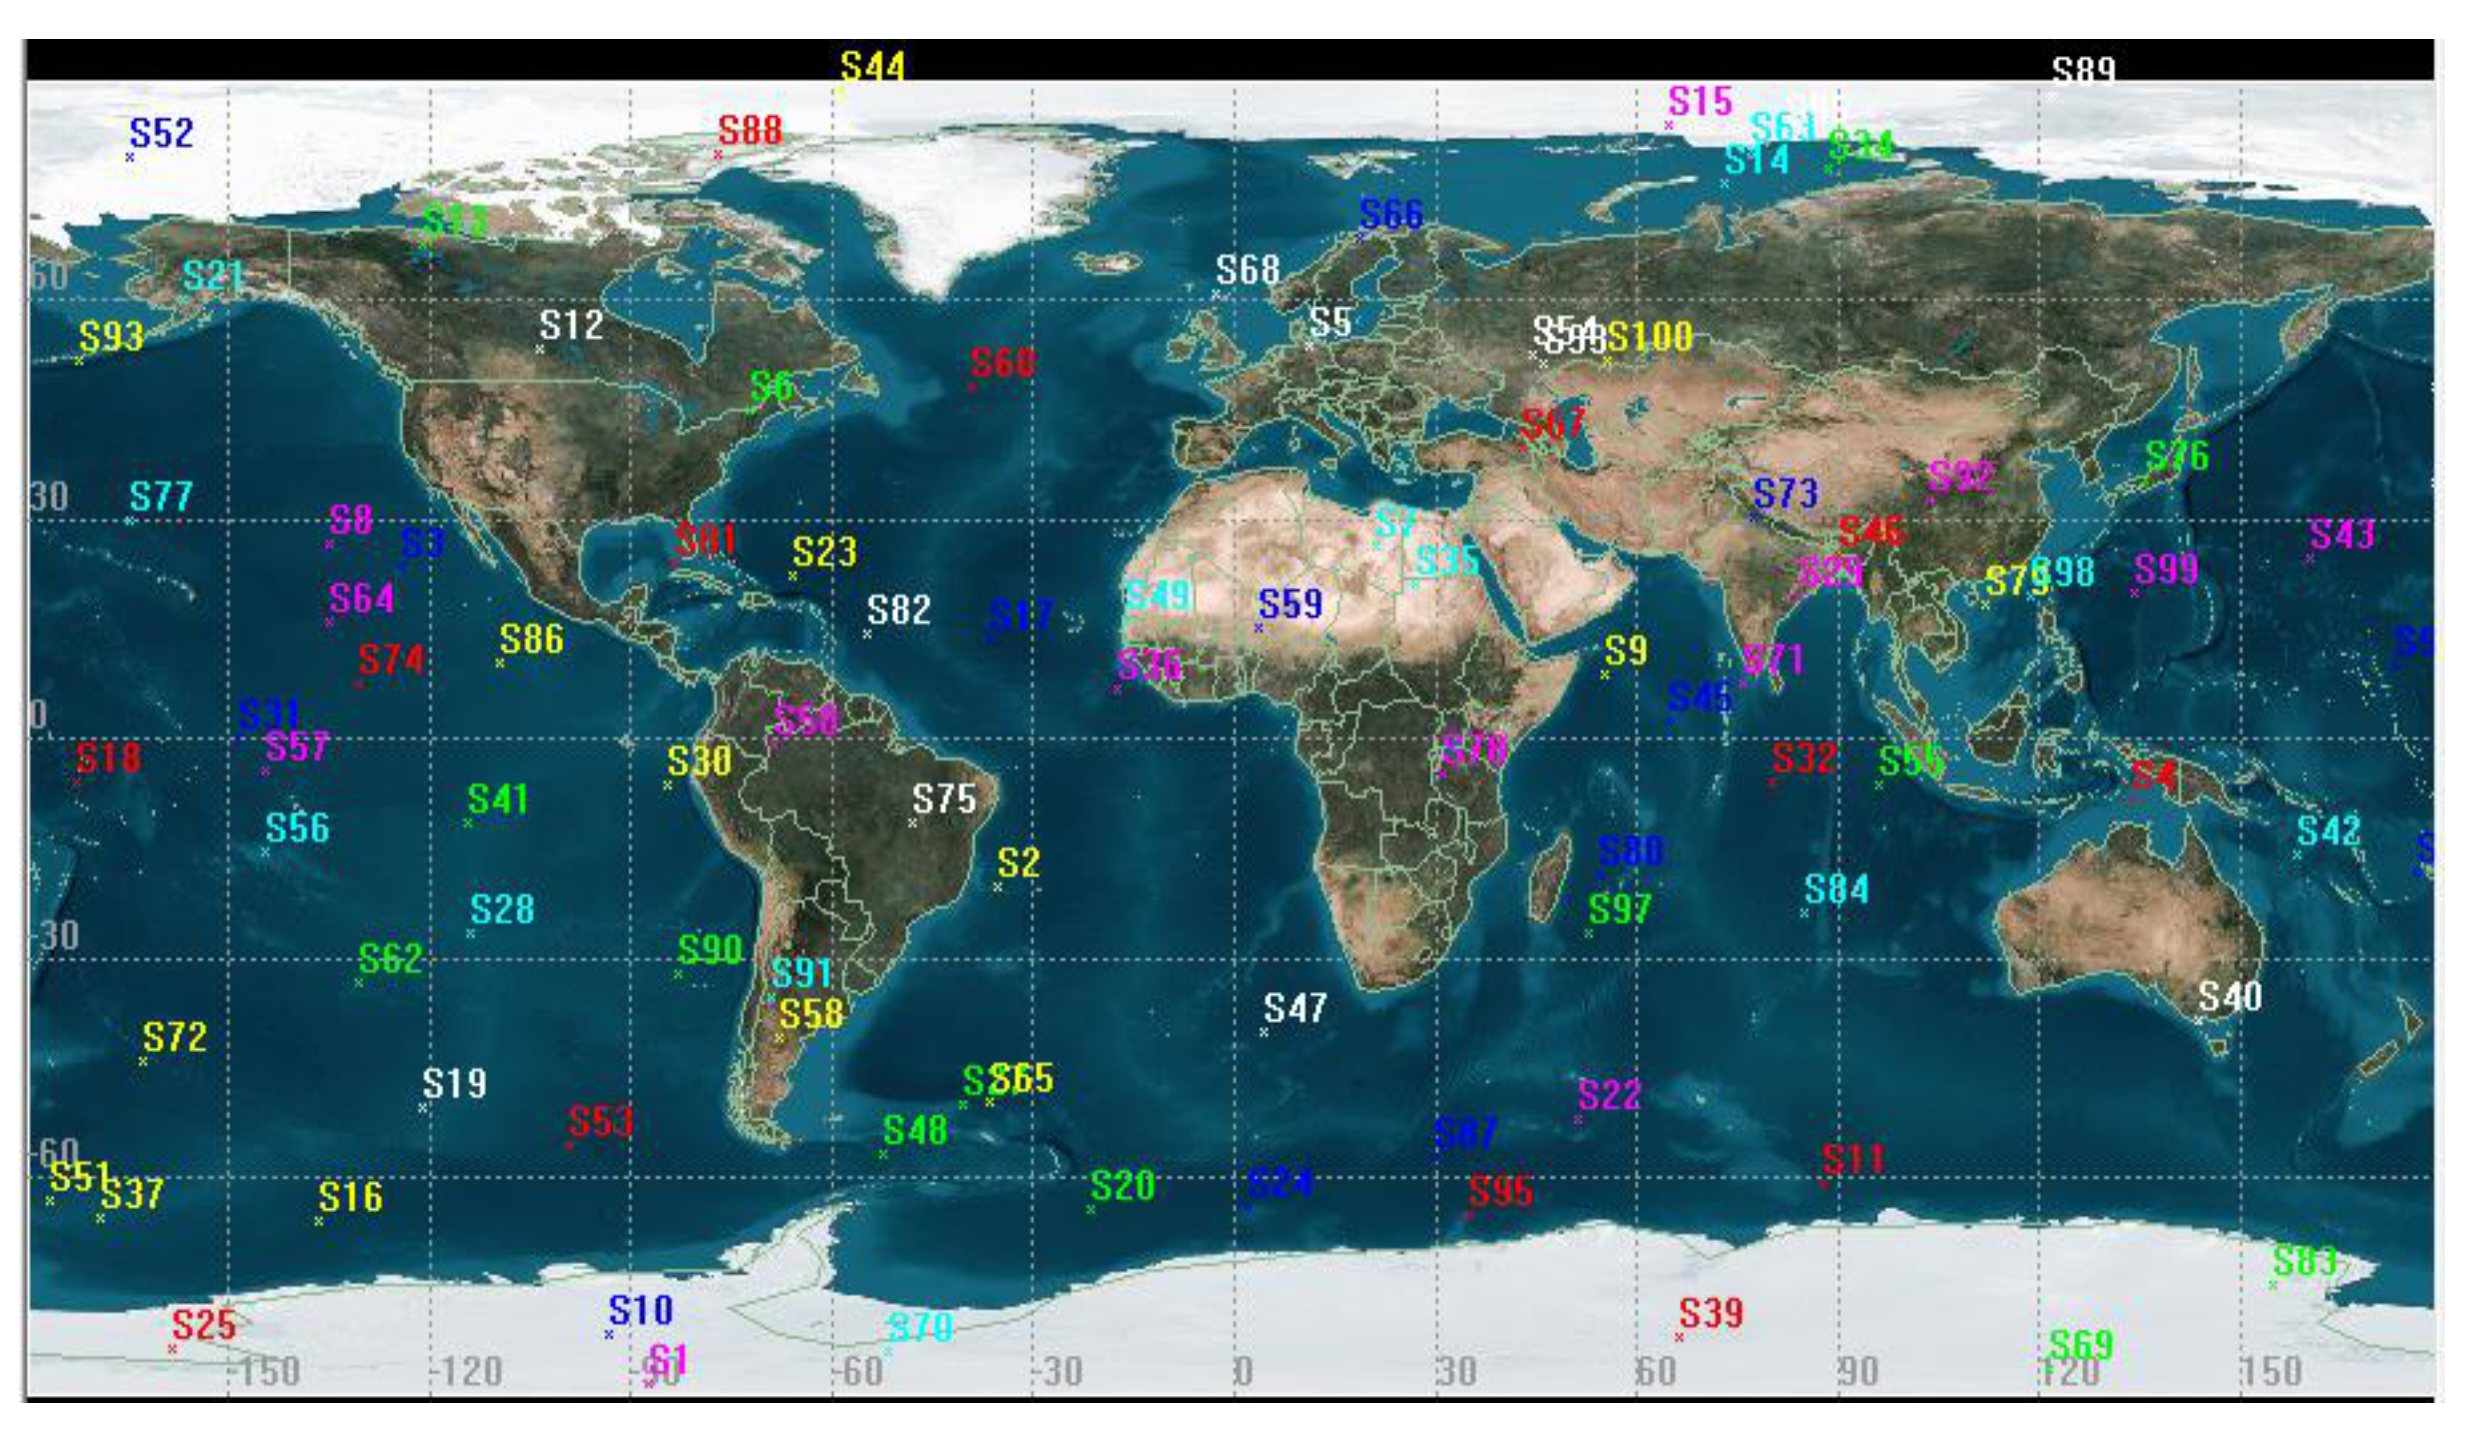
4.1.2. The Targets
A number of observation target points are randomly established globally and assigned to each target a benefit value. The distribution of the targets in STK is shown in
Figure 8.
4.1.3. The Ground Stations
After the targets are observed by the satellites and the information is obtained, the data will be temporarily stored in the onboard device. When communication conditions permit, the data will be passed back to the ground station. In this paper, 12 ground stations are set up to simulate the completion of digital missions. The distribution of the ground stations in STK is shown in
Figure 9.
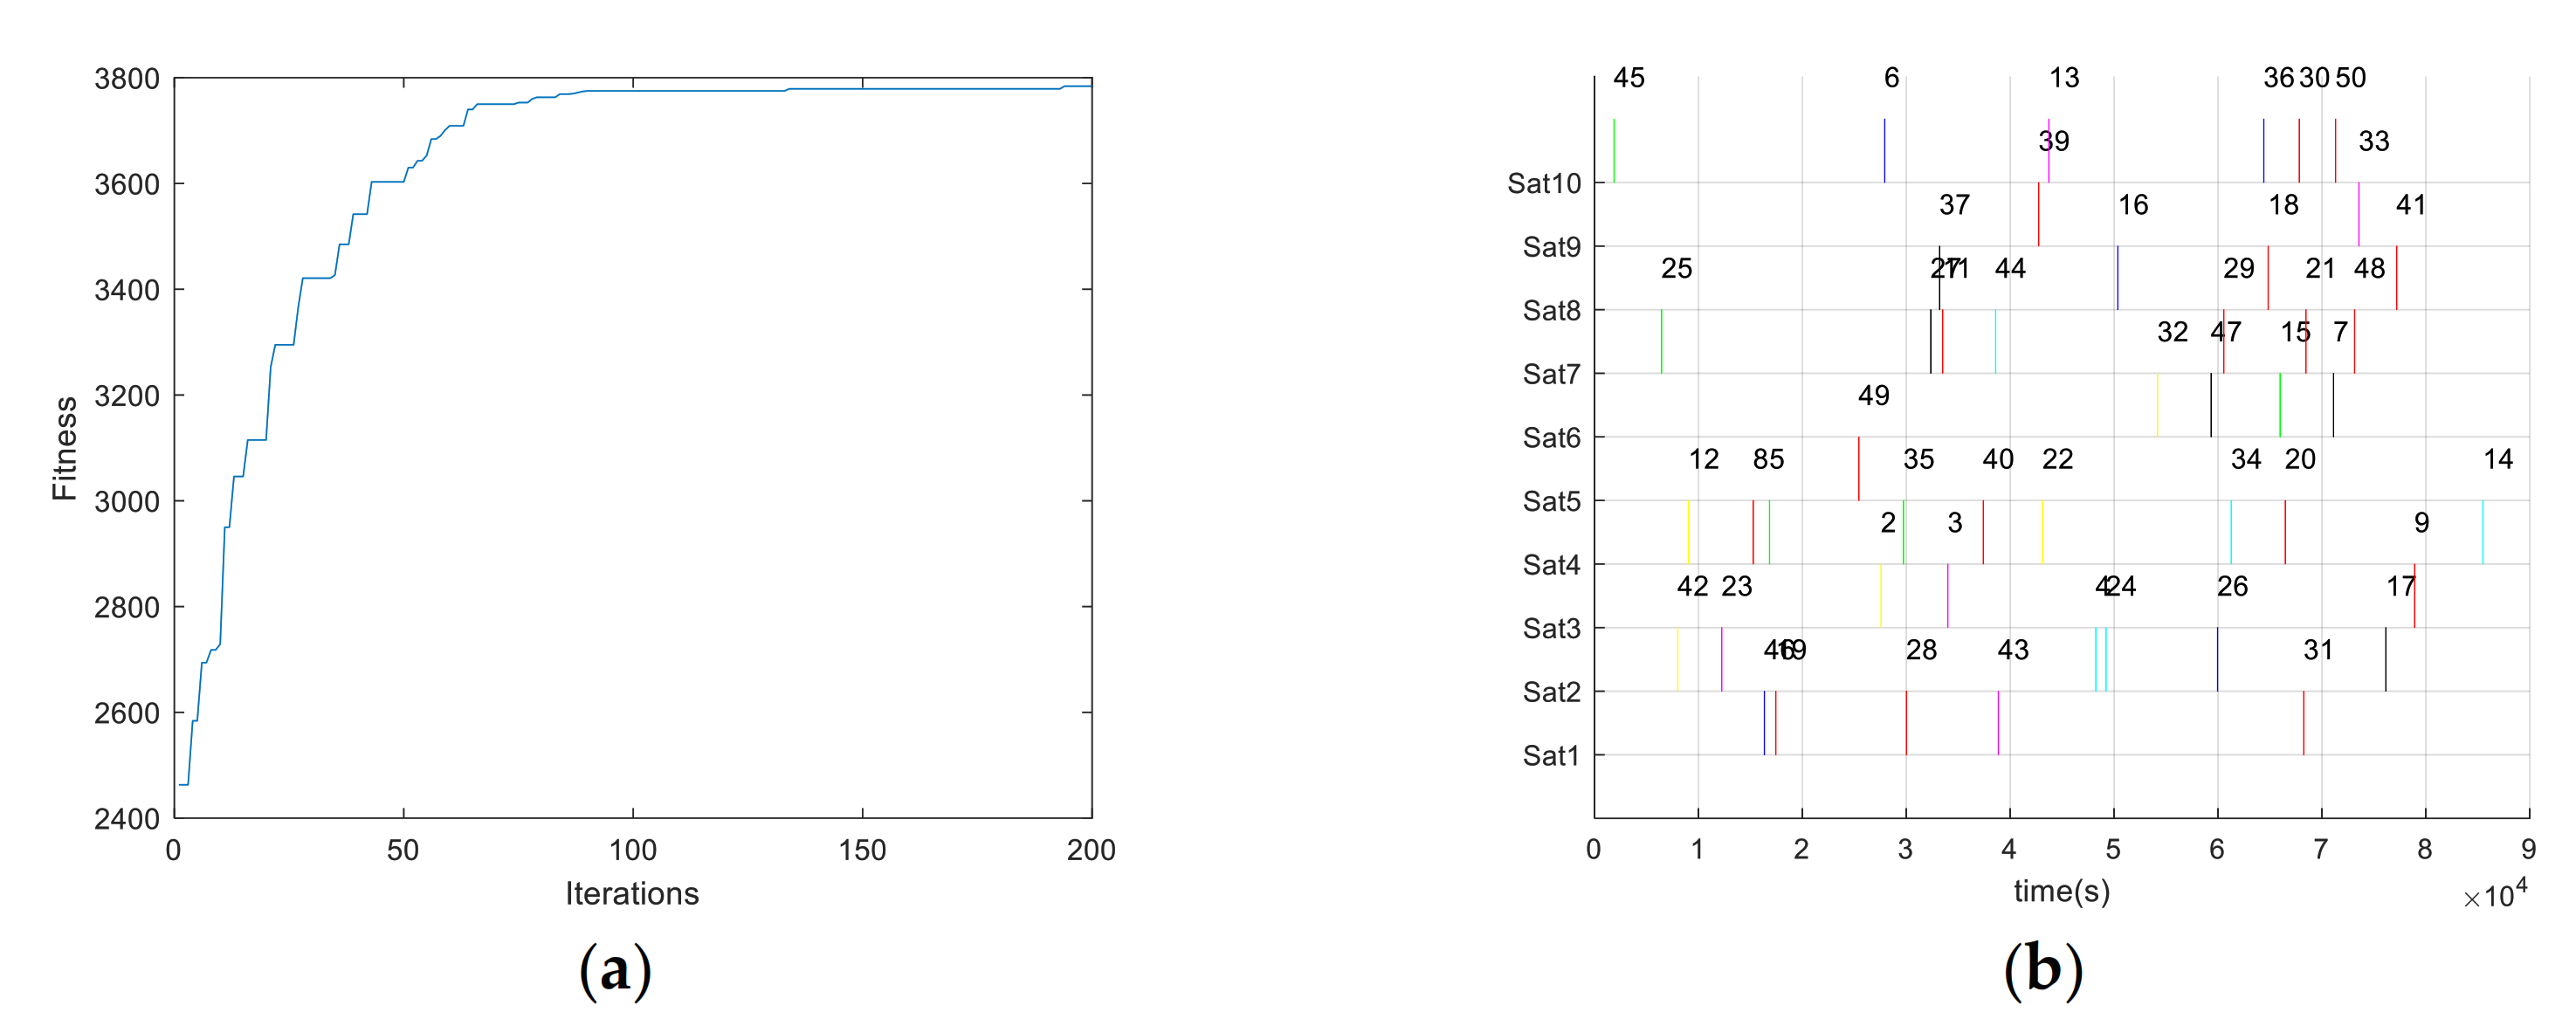
4.2. Typical Results of Multi-Satellite Scheduling Based on Real-Coding PBIL Algorithm
The average results of the 10 experiments are shown in
Table 2, and one of the typical results is shown in
Figure 10.
As shown in the table and figure above, it can be seen that the real-coding PBIL algorithm can effectively solve multi-satellite scheduling problems. As shown in the evolution curve in
Figure 9a, it converges around generation 80 and has high computational efficiency.
4.3. Analysis of Algorithm Performance
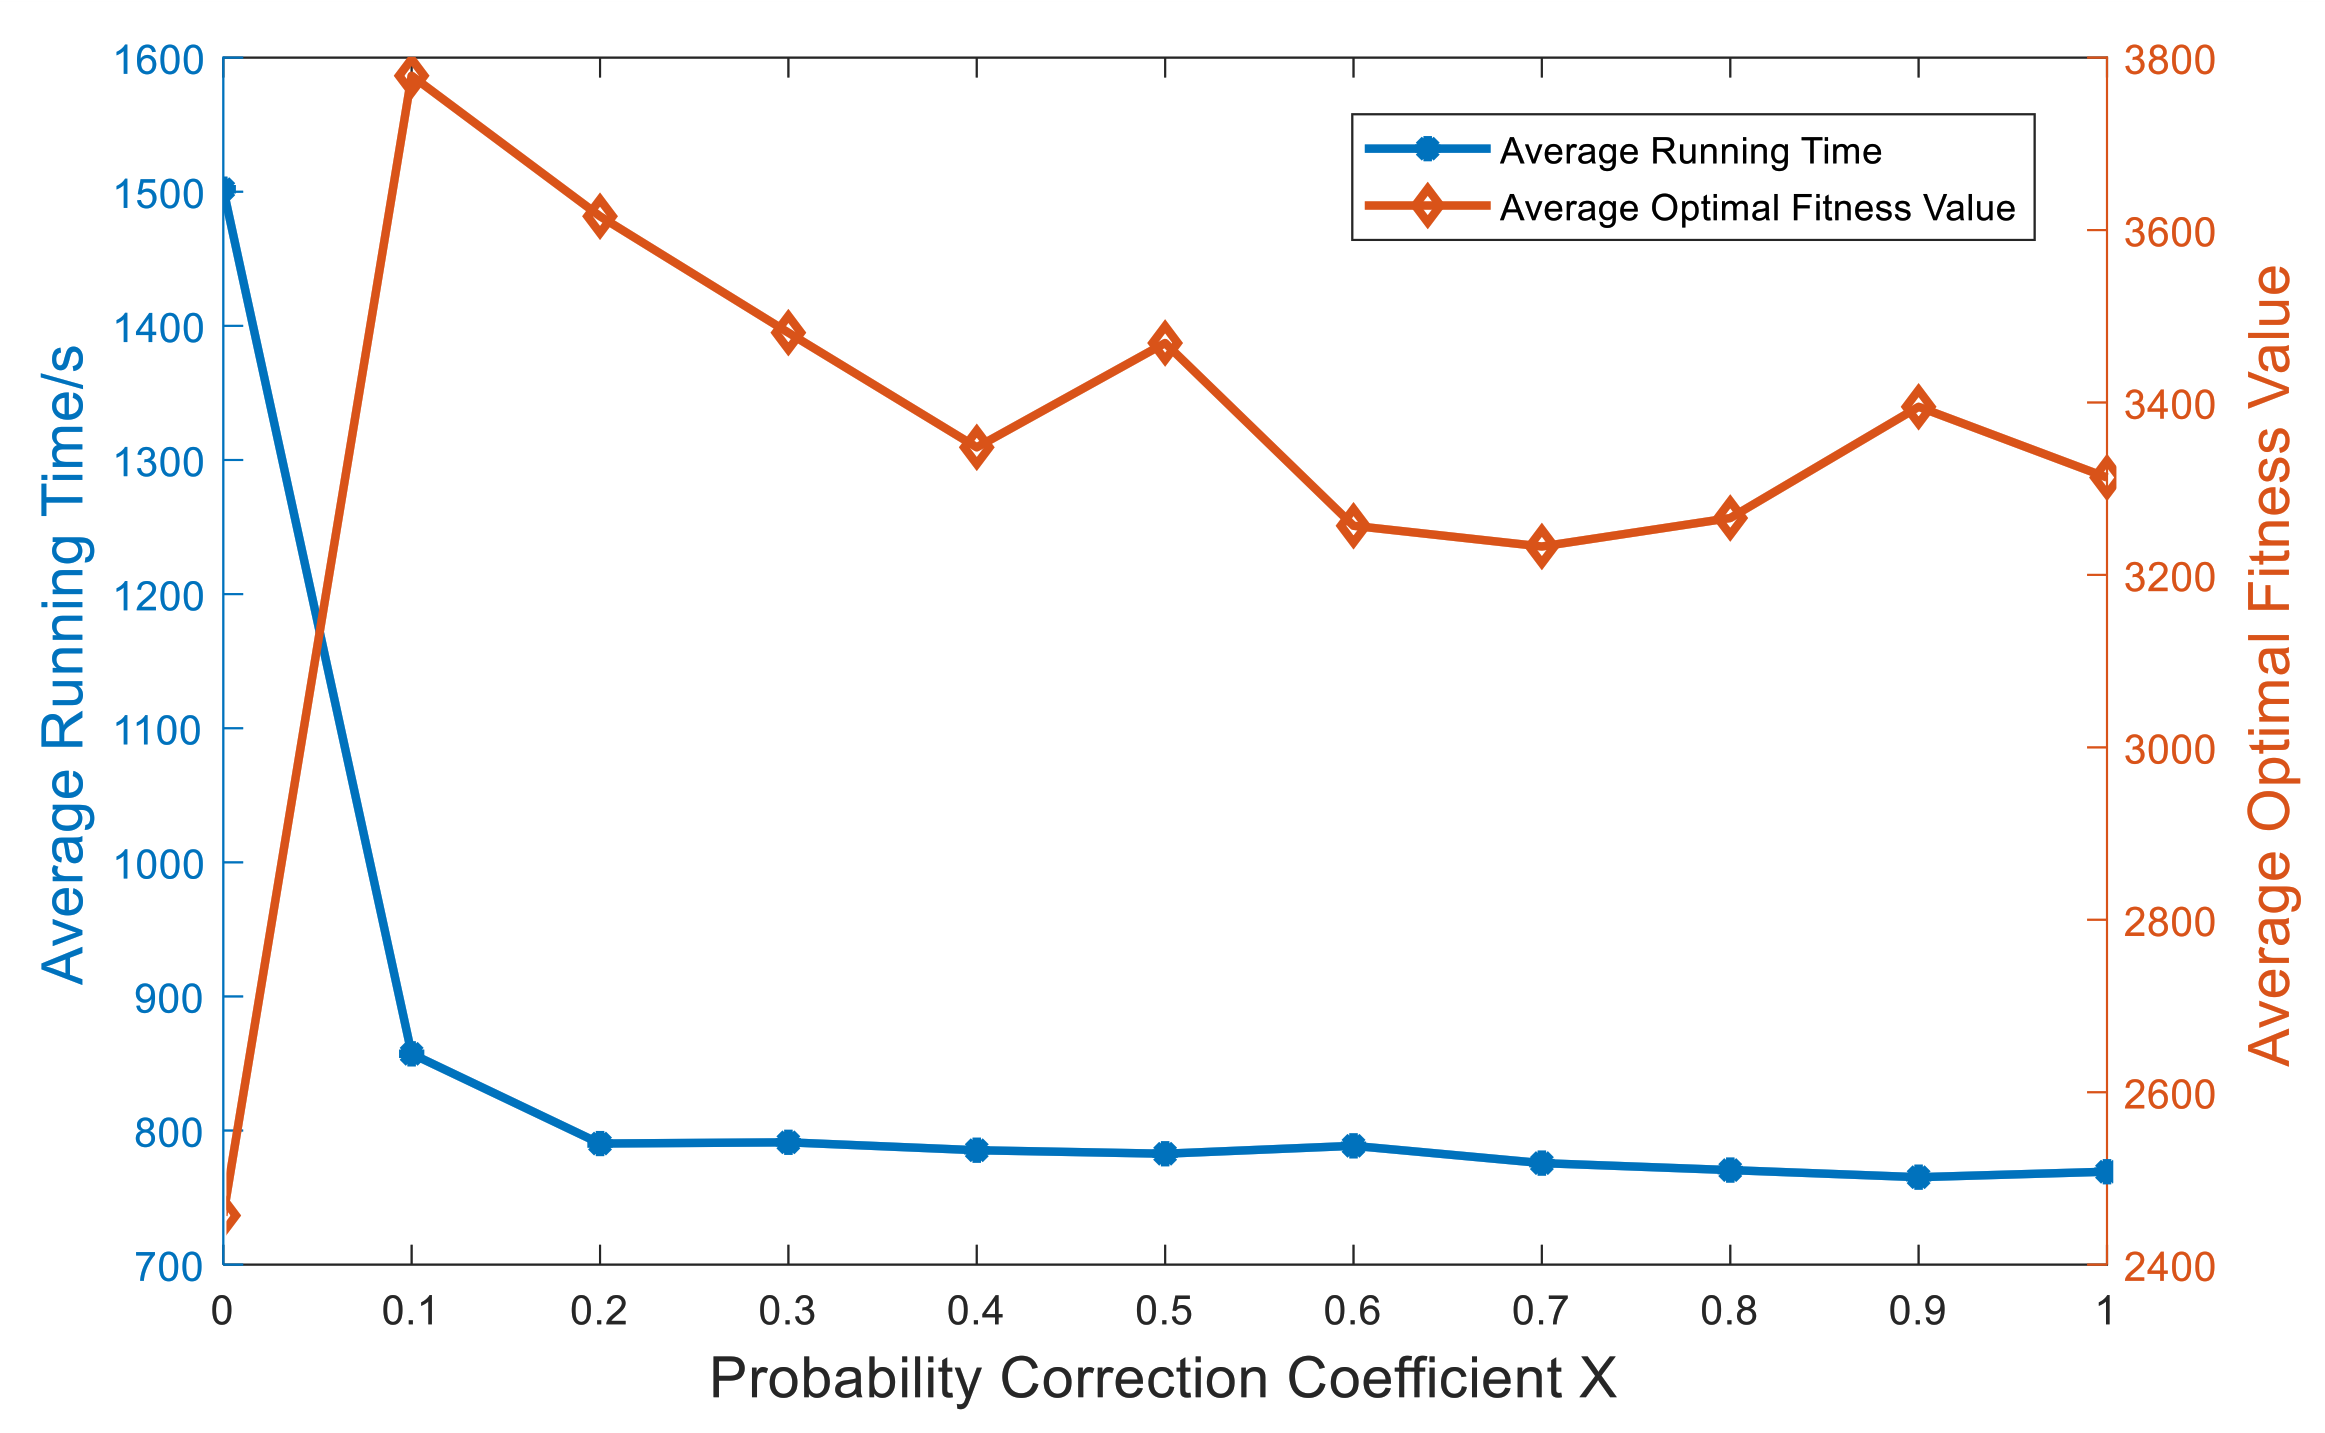
4.3.1. Influence of Probability Correction Coefficient on PBIL
In the real-coding PBIL algorithm for multi-satellite scheduling, the value probability matrix affects the direction of evolution, and the probability correction coefficient will affect the change of the value probability matrix so as to have a certain impact on the solution accuracy and calculation efficiency.
In this section, we analyze the influence of different probability correction coefficients on the performance of the real-coding PBIL algorithm. For 50 targets with different probability correction coefficients (
X ∈ [0, 1]), 10 simulation experiments are carried out. The statistical results of the real-coding PBIL algorithm are shown in
Table 3 and
Figure 11. The following data are the average results of 10 simulation experiments.
It can be seen from the above table and figure that when the probability correction coefficient X is 0, the value probability matrix has no role in guiding the evolution direction but a random optimization process, so the average running time is long, and the quality of the solution is low. After adding the probability correction coefficient for guidance, the optimization ability of the algorithm is significantly enhanced, and the average running time is greatly reduced.
With the increase of coefficient X, the average running time is basically stable, but the average optimal fitness value generally shows a downward trend, especially between 0.1 and 0.5. The possible reason is that the increase of the correction probability coefficient leads to a rapid evolution process falling into a local optimum, and at the same time, a large probability correction coefficient also makes the algorithm’s optimization and exploration ability low, thus affecting the quality of solutions.
Hence, we can know that the real-coding PBIL algorithm can achieve optimal performance when X = 0.1.
4.3.2. Influence of Coding Format on PBIL
The encoding format is the main difference between the real-coding PBIL algorithm and the traditional PBIL with binary coding. Different encoding formats usually determine the length of chromosomes and the size of the probability matrix, thus having a significant effect on the efficiency of the evolution process.
In this paper, we implement two encoding formats of binary coding and real coding for the PBIL algorithm and solve the multi-satellite scheduling problem under the same conditions, respectively. Ten simulation experiments are carried out, and the statistical results are shown in
Table 4.
As can be seen from the table above, the chromosome length of real coding is 50, which is equal to the quantities of targets. In contrast, the length of binary coding is 729, about 14 times that of real coding. Obviously, the chromosome length has a significant effect on the efficiency of constraint checking and the evolution process; therefore, shorter chromosome lengths can improve search speed. This is consistent with the results in the table that the running time of real-coding PBIL is significantly shorter than that of binary-coding PBIL. The simulation results show that the running time of binary-coding PBIL is about 1.5 times that of real-coding PBIL, which indicates that the encoding format plays an important role in the performance of the PBIL algorithm. More notably, real-coding PBIL can obtain higher optimal fitness values; that is, it can obtain higher quality solutions than binary-coding PBIL for multi-satellite scheduling.
4.3.3. Comparison of PBIL and GA
According to the optimization goal in
Section 2, we carry out the comparison experiments of the real-coding PBIL algorithm and real-coding Genetic Algorithm for solving multi-satellite scheduling under the same conditions.
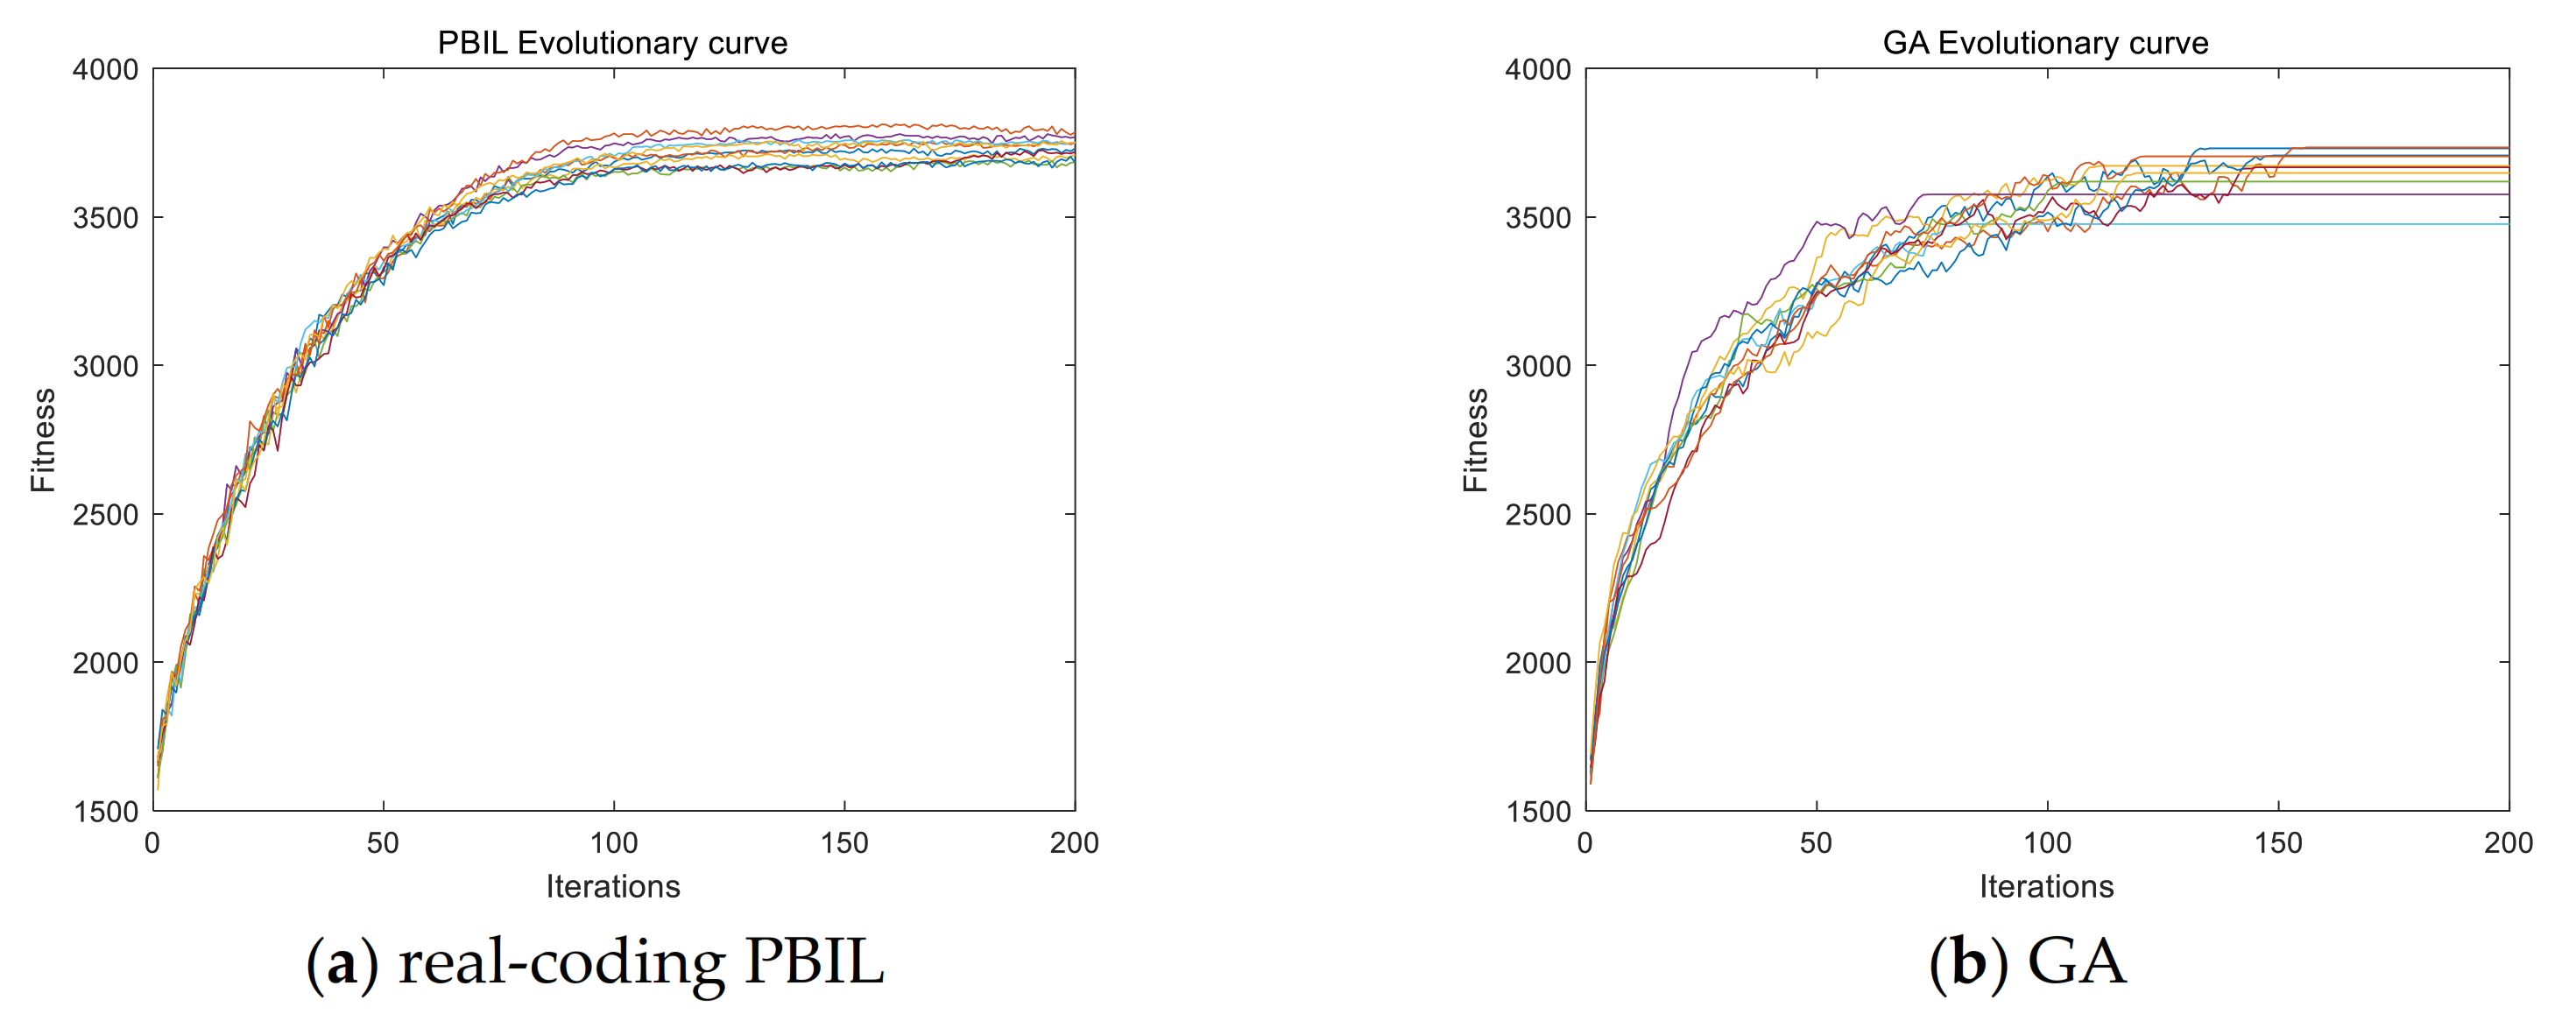
The Evolutionary curves of 10 simulation experiments for 50 targets are shown in
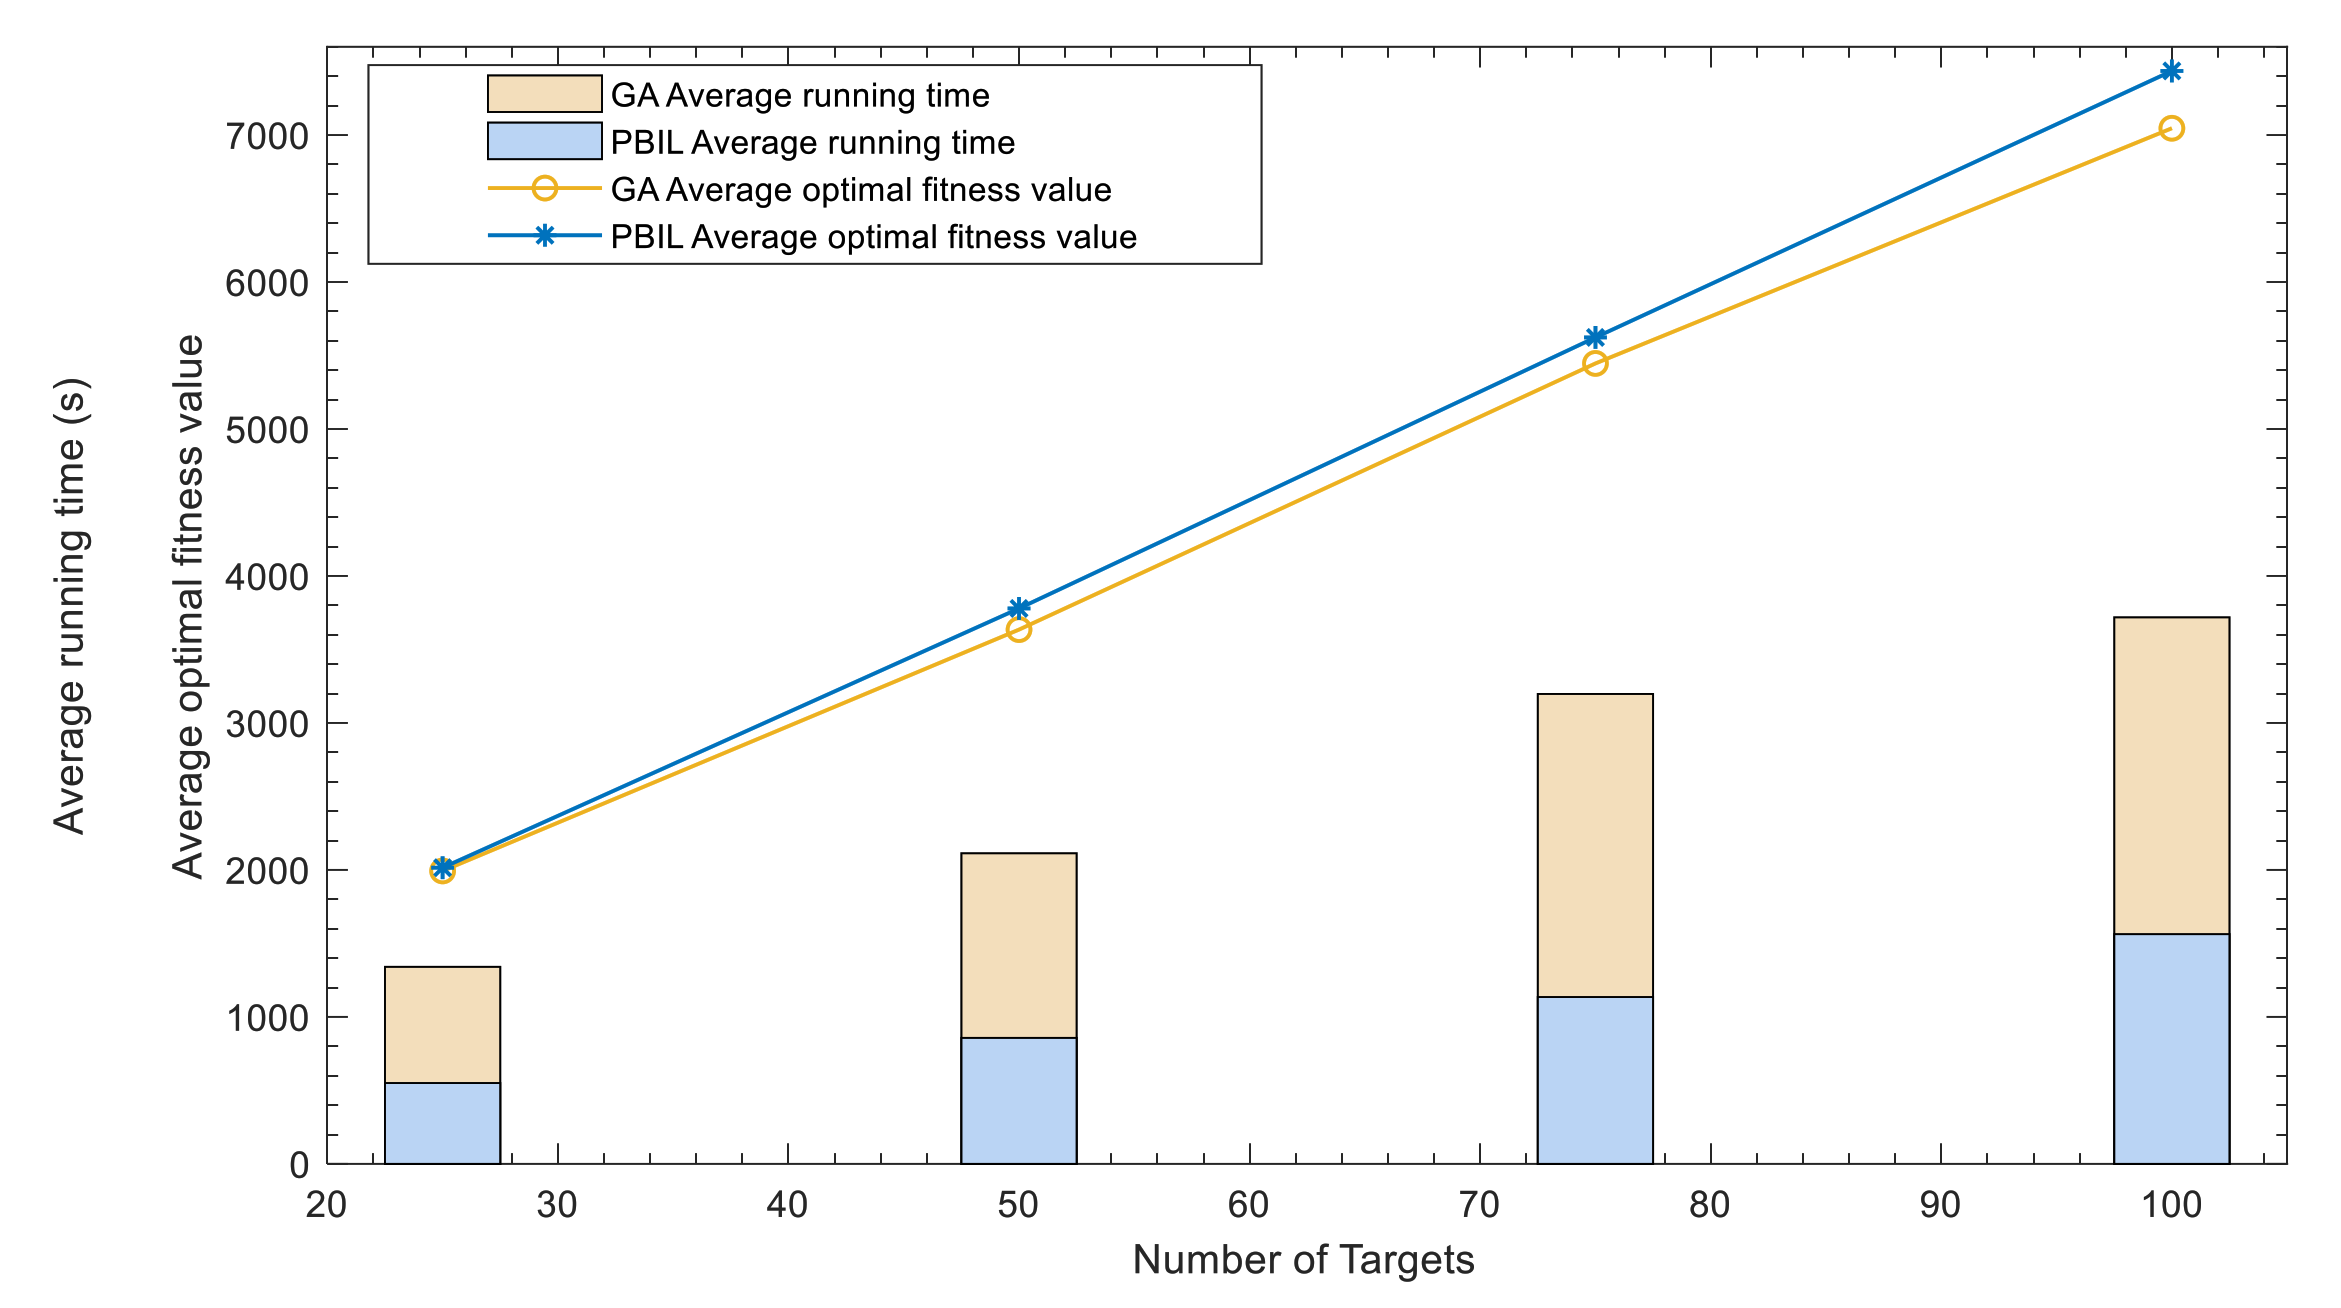
Figure 12, and the statistical results of different target quantities are shown in
Table 5 and
Figure 13. All the data as follows are the average of the results of 10 simulation experiments.
As can be seen from the figure above, to solve the multi-satellite scheduling problem under the same conditions, the PBIL algorithm converges rapidly around iteration 80, while the GA algorithm converges after iteration 100, indicating that the PBIL algorithm has faster computational performance than the GA algorithm.
In addition, the evolution curve of 10 simulation experiments shows that the evolution curves obtained by the PBIL algorithm have small fluctuation, while that obtained by the GA algorithm have significant fluctuation and difference, indicating that the PBIL algorithm is also better than the GA algorithm in terms of computational stability.
For different target quantity scales, the ability of PBIL and GA for solving multi-satellite scheduling is further compared and analyzed.
As shown in the table and the figure above, the running time of the PBIL algorithm is obviously much shorter than that of the genetic algorithm, where the computational efficiency is almost doubled, and most of the optimal fitness values are slightly higher than that of GA.
Therefore, considering algorithm stability, computational efficiency and optimization quality, etc., the PBIL algorithm is superior to the genetic algorithm in solving satellite mission planning problems to some extent.
5. Conclusions
In this paper, a number of theoretical analyses and numerical experiments were conducted to find a better method to solve centralized multi-satellite scheduling problems.
Firstly, considering the load and platform operation of satellites in reality, we established a mathematical model of satellite scheduling with complex constraints, and the related mathematical statement was given.
Secondly, the real-coding Population-Based Incremental Learning (PBIL) algorithm was proposed to solve the MSSP. Compared to the traditional PBIL algorithm with binary coding, the real-coding format can greatly shorten the coding length so that the computational efficiency is improved. Additionally, we designed the value probability matrix, correction coefficient and mutation operator to guide better evolution and avoid early convergence.
Furthermore, some numerical simulations and analyses were conducted to verify the real-coding PBIL algorithm for multi-satellite scheduling. Additionally, we analyzed the influence of key parameters such as the probability correction coefficient on algorithm performance. The performance of the algorithm was analyzed by comparing it with binary-coding PBIL and Genetic Algorithm (GA). According to the numerical results, it can be seen that when solving multi-satellite scheduling problems, in terms of the algorithm efficiency, solution quality and task completion rate, the real-coding PBIL algorithm is superior to other algorithms in our study.
5.1. Applications and Limitations
Concerning the actual satellite scheduling process, the real-coding PBIL algorithm might play a crucial part to help the Satellite Control Center make decisions precisely and quickly. Generally, users call for demands regarding earth observation and send these requirements to the Satellite Control Center. Then, the Center will aggregate all the demands to obtain the targets to be observed and make a reasonable scheduling plan within a specific period for satellites to meet the observation needs. The planning process is difficult to rely on manual completion, while the algorithm we proposed will be helpful. According to the information on targets, satellites and ground stations, it is easy to obtain the visible time window set of satellite to target. Just input the window set, and the algorithm will output the satellite scheduling result, that is, which target is to be observed by which satellite at which time.
In this paper, we carry out simulations to verify the algorithm dealing with 10 satellites and 50–100 targets. The results show that the algorithm displays good performance in both optimal speed and quality. However, the scenarios in our paper are far from the large-scale scenario with vast quantities of satellites and targets as the reality. Whether the algorithm can deal with large-scale satellite scheduling problems well still needs further discussions and verifications. Another limitation of our algorithm is that it might not be suitable for multi-satellite scheduling problems requiring the revisiting observation of targets. Due to the real-coding format, each target can be observed, at most, once in a scheduling period. Our approach might be applicable to situations with a large number of observation demands while the satellite resources are limited, rather than the scenarios with repeated observation requirements for a specific area.
5.2. Future Works
Concerning future work, two main paths could be taken. At first, the expansion of the satellite scheduling model can be more applicable to various situations in reality, such as multi-satellite scheduling with different payload types, large-scale constellations scheduling and multi-satellite scheduling for moving target search and tracking, etc.
In addition, we will continue to study algorithms for multi-satellite scheduling problems. The internal mechanism of the search algorithm will be further explored, and a more effective method for multi-satellite scheduling will be put forward, even considering the integration of artificial intelligence theory to achieve an end-to-end intelligent satellite scheduling process.


