1. Introduction
Split-ring resonators (SRR) significantly shift their resonance frequency even with the smallest change in split capacitance, and thus in permittivity, dielectric losses, and conductivity of the split capacitor’s dielectric. This effect makes split-ring resonators increasingly attractive for various applications, such as (bio)chemical sensors for the detection of biomarkers in medical applications [
1,
2,
3] and the dielectric characterization of thin films and liquids [
4,
5,
6]. Here, the dielectric characterization of liquids inside a capillary is of particular interest [
7,
8,
9]. The use of liquid chromatography (LC), e.g., high performance/pressure liquid chromatography (HPLC) and ion chromatography (IC), for the physical separation of compounds in a liquid phase is used in a wide variety of applications such as food, drug, and environmental analysis; process monitoring in the chemical industry; and even bioreactors [
10,
11,
12]. This wide variety of applications pose special challenges for the detectors used, which have to detect multiple types of substances. Depending on the different compound properties, the detection principles can be divided into light-based detectors (such as fluorescence, absorption, refraction, and scattering) and resistive detectors [
13]. For some compounds, additional sample preparation is required to be detected by optical detectors [
14]. Other detectors, such as mass spectrometers, have high initial and operating costs, but can provide a second dimension of separation [
13]. We aim for the development of a new universal detector for liquid chromatography (LC) based on a simple but sensitive SRR that is easy to integrate and is compatible with LC due to its special split-ring structure made from capillaries. This special SRR design will be part of another publication. Here, we focus on new readout electronics.
LC detectors require fast response times of 1 s or less to resolve fast peaks eluting from the LC column [
15]. Therefore, this work concentrates on the development of a fast readout method for SRR [
16,
17,
18].
The most common method for determining the frequency response of SRR and other resonant oscillating measurement systems is a vector network analyzer (VNA), which records the frequency response of SRR with a frequency sweep in the required frequency range in order to display/determine the frequency response of the SRR [
19,
20]. However, measuring the frequency response of SRR even over a small frequency range, but at a high frequency resolution, as required for accurate determination of the resonance frequency and the frequency shift, can take several seconds or even minutes—too long for resolving the peaks eluting from the LC column. Another common way of evaluating resonant oscillating measurement systems such as quartz microbalances is measuring the exponential decay [
21]. This method requires very fast and complex data acquisition that must operate at minimum double the resonant frequency of the sensor in order to capture the exponential decay. Thus, our approach uses a constant measuring frequency, instead of analyzing a certain frequency range or the exponential decay, to determine the resonance frequency shift. Therefore, SRR is excited at a constant frequency that is shifted to the resonance frequency of the SRR. Thus, a changing resonance frequency modulates the amplitude of the transmitted excitation signal. Demodulating this signal results in an output signal that correlates to the resonance frequency shift of the SRR. To the best of our knowledge, this approach of monitoring a resonant oscillating measurement system based on a single transmitted frequency has not been reported yet. This allows for the detection of even the smallest changes in split capacity in real time by just analyzing the transmission signal of the SRR at a defined frequency. Due to the very high sampling rate of the ADC and microcontroller with 5.4 kS/s, the transmission signal can be averaged to increase the signal-to-noise ratio (SNR) and to improve the limits of detection while still resolving the chromatogram.
2. Materials and Methods
Split-ring resonators are simplified LCR resonant circuits built from a ring structure with a split coupled to a microstrip transmission line, as shown in
Figure 1. At resonance frequency, most of the supplied energy is magnetically coupled into the split-ring structure and forms a standing wave. Therefore, a strong electric field is localized inside the split. The split is a simple capacitor that changes its capacitance depending on the electromagnetic properties of the surrounding materials. A change in the capacitance leads to a shift in resonance frequency [
3,
22,
23,
24]. For example, a higher permittivity reduces the resonance frequency of the split-ring structure. In most sensor applications, SRRs have relatively large capacitors, leading to significant resonance frequency shifts and the highest sensitivity. In LC, the peak volume is limited to a few µL, requiring a small detector volume for keeping the LC resolving power, and thus, a small split capacitor, but limiting the sensitivity.
Therefore, we use a new low-volume SRR concept that is easy to integrate and is compatible with LC. The new split-ring structure, as shown in
Figure 1, is made of a copper capillary with outer diameter (OD) of 1.6 mm and inner diameter (ID) of 0.3 mm, as well as a Vici Valco PEEK union ID of 1.6 mm. The capillary split-ring shown in
Figure 1 is approximately 20 mm × 40 mm with an effective length of 121 mm resulting in a total volume of 8.6 µL. The area enclosed by the split-ring is 845 mm
2. The distance between the ends of the capillaries inside the PEEK union—namely the split capacitor—is 1.2 mm and the capacitor has an area of 1.94 mm
2, resulting in a total volume of about 2.3 µL. However, it should be noted that this volume depends on the manufacturing tolerances of the PEEK union and the polished capillary ends. The electromagnetic wave is coupled via a 50 mm long transmission line made of a simple printed circuit board with dielectric material RO4003C of 0.5 mm thickness with 50 mm × 20 mm. The transmission line has a width of 1.12 mm. The split-ring is fixed on top of the transmission line with a 0.15 mm thick isolation layer made of 3M 5413 polyimide adhesive tape in between. This capillary split-ring resonator (CaSRR) is designed specifically as a detector for high performance liquid chromatography (HPLC) [
18] due to its low containment volume and easy integration with LC, without any compatibility issues between the solvents and the CaSRR materials.
The basic principle of the new readout electronics is shown in
Figure 2. A waveform generator supplies the transmission line of the CaSRR with a frequency-controlled sine wave. Due to the band rejection filter characteristics of CaSRR, all frequencies can pass the system through the transmission line, except for frequencies near the resonance frequency of CaSRR. The stop bandwidth of the band rejection filter is mainly defined by the quality factor of CaSRR. Finally, the output signal from CaSRR is demodulated via a diode and a capacitor, as shown in
Figure 2. The used envelope demodulator detects the envelope of the transmitted CaSRR signal and converts it into DC voltage. This DC voltage can be easily captured with an analog digital converter (ADC) or a digital multimeter.
At a constant frequency and constant split capacity, the voltage at the demodulation capacitor is constant. Changing the dielectric properties (permittivity, conductivity, and dielectric losses) of the split capacitor by an eluting peak from the LC column changes the frequency response leading to a different output voltage of the envelope detector. By measuring at a single frequency, a significant increase in the sampling rate of the new readout electronics is possible. This allows for significant averaging and reducing the noise level to reach a high signal-to-noise ratio (SNR).
The SNR of the system depends on the number of experimental variables such as the used excitation source, electromagnetic interference, temperature, frequency response of the CaSRR, and the ADC used. A higher bit count ADC in combination with a temperature compensated demodulator and excitation source can reduce the noise to a minimum.
The new readout electronics contains a controllable excitation source and two envelope detectors, one for the output of the excitation source and one for the transmitted output signal of CaSRR. A basic block diagram of the new readout electronics is shown in
Figure 3.
The electronics is equipped with an oven-controlled crystal oscillator (OCXO) to reduce the frequency drift. As OCXO, an IQD IQOV-162-3 with a frequency tolerance of ±500 ppb and a frequency stability of ±20 ppb is used. This constant reference frequency is fed into an Analog Devices MAX2871 wide-frequency phase locked loop (PLL) with an integrated voltage-controlled oscillator (VCO). The MAX2871 compares the reference frequency against the divided output frequency with a phase frequency detector (PFD). The PFD generates a voltage that represents the phase difference of the two signals, and the voltage is then low pass filtered and controls the VCO in the MAX2871. Due to the divider between VCO and PFD, the output frequency can be set from 23.5 MHz to 6 GHz. Afterwards, this generated frequency is filtered with a low pass filter to reduce the harmonics for a clean output signal. Due to the wide frequency range of the system, multiple filters are used and automatically selected by the software controlling a RF switch (not shown). The different filters are needed to suppress the harmonics affecting the demodulated signal. In order to vary the output power and therefore the output voltage, a controllable attenuator and amplifier combination is implemented. Thus, it is possible to change the output frequency and the output power for different CaSRR setups. The integrated RF power detector chip Analog Devices HMC713LP3E converts the input RF power into DC voltage, as shown in
Figure 4. The RF power is converted with
in a range from 50 MHz to 2.7 GHz. For measuring the output power of the electronics and the transmitted power of the CaSRR, two identical demodulators are implemented. For fast and accurate data acquisition, a 16-bit (250 kS/s) ADC Linear Technology LTC1864 is used to capture the detector DC signals from the output power and the input power demodulator. The power detector is connected to the ADC via an operational amplifier Texas Instruments OPA2140 as a buffer. All additional resistors, inductors, and capacitors shown in
Figure 4 are required to operate the power detector, ADC, and operational amplifier.
To model the behavior of CaSRR, CST Studio Suite® was used, revealing the influence of the relative permittivity change on the frequency shift. Conductivity and dielectric losses are not considered in the following, as permittivity is expected to be the most important parameter when using sugars or 2-propanol in small concentrations in ultrapure water. However, dielectric losses and conductivity need to be considered when measuring other analytes that significantly change dielectric losses and conductivity of the eluate. In general, increasing the dielectric losses and conductivity damps the resonator, and thus broadens the resonance peak and shifts the resonance frequency both changing the demodulated output signal. Thus, SRR is sensitive to permittivity, dielectric losses, and conductivity, which can be an advantage when measuring such analytes. However, the eluent needs to have minimum dielectric losses and conductivity to minimize damping of the resonator, giving the highest sensitivity.
From the simulation, not shown here, a relationship between the relative permittivity change and the frequency shift is derived using a linear regression, as shown in Equation (1). From the derivative of the frequency response of the system, the maximum slope at the inflection points could be determined, resulting in
= 2.241 dB/MHz. From Equation (1), the sensitivity of the system can be determined to be
, with
being the change in permittivity and
the frequency shift.
Thus,
= 128 averages result in a minimum measurable frequency change
of 177 Hz calculated with Equations (2) and (3) with
,
the sensitivity of the HMC713LP3E RF detector, and
the sensitivity of the simulated CaSRR. From this, a minimum measurable
change can be calculated with Equation (4).
This results in a theoretically measurable minimum permittivity change of
calculated with Equation (4) and
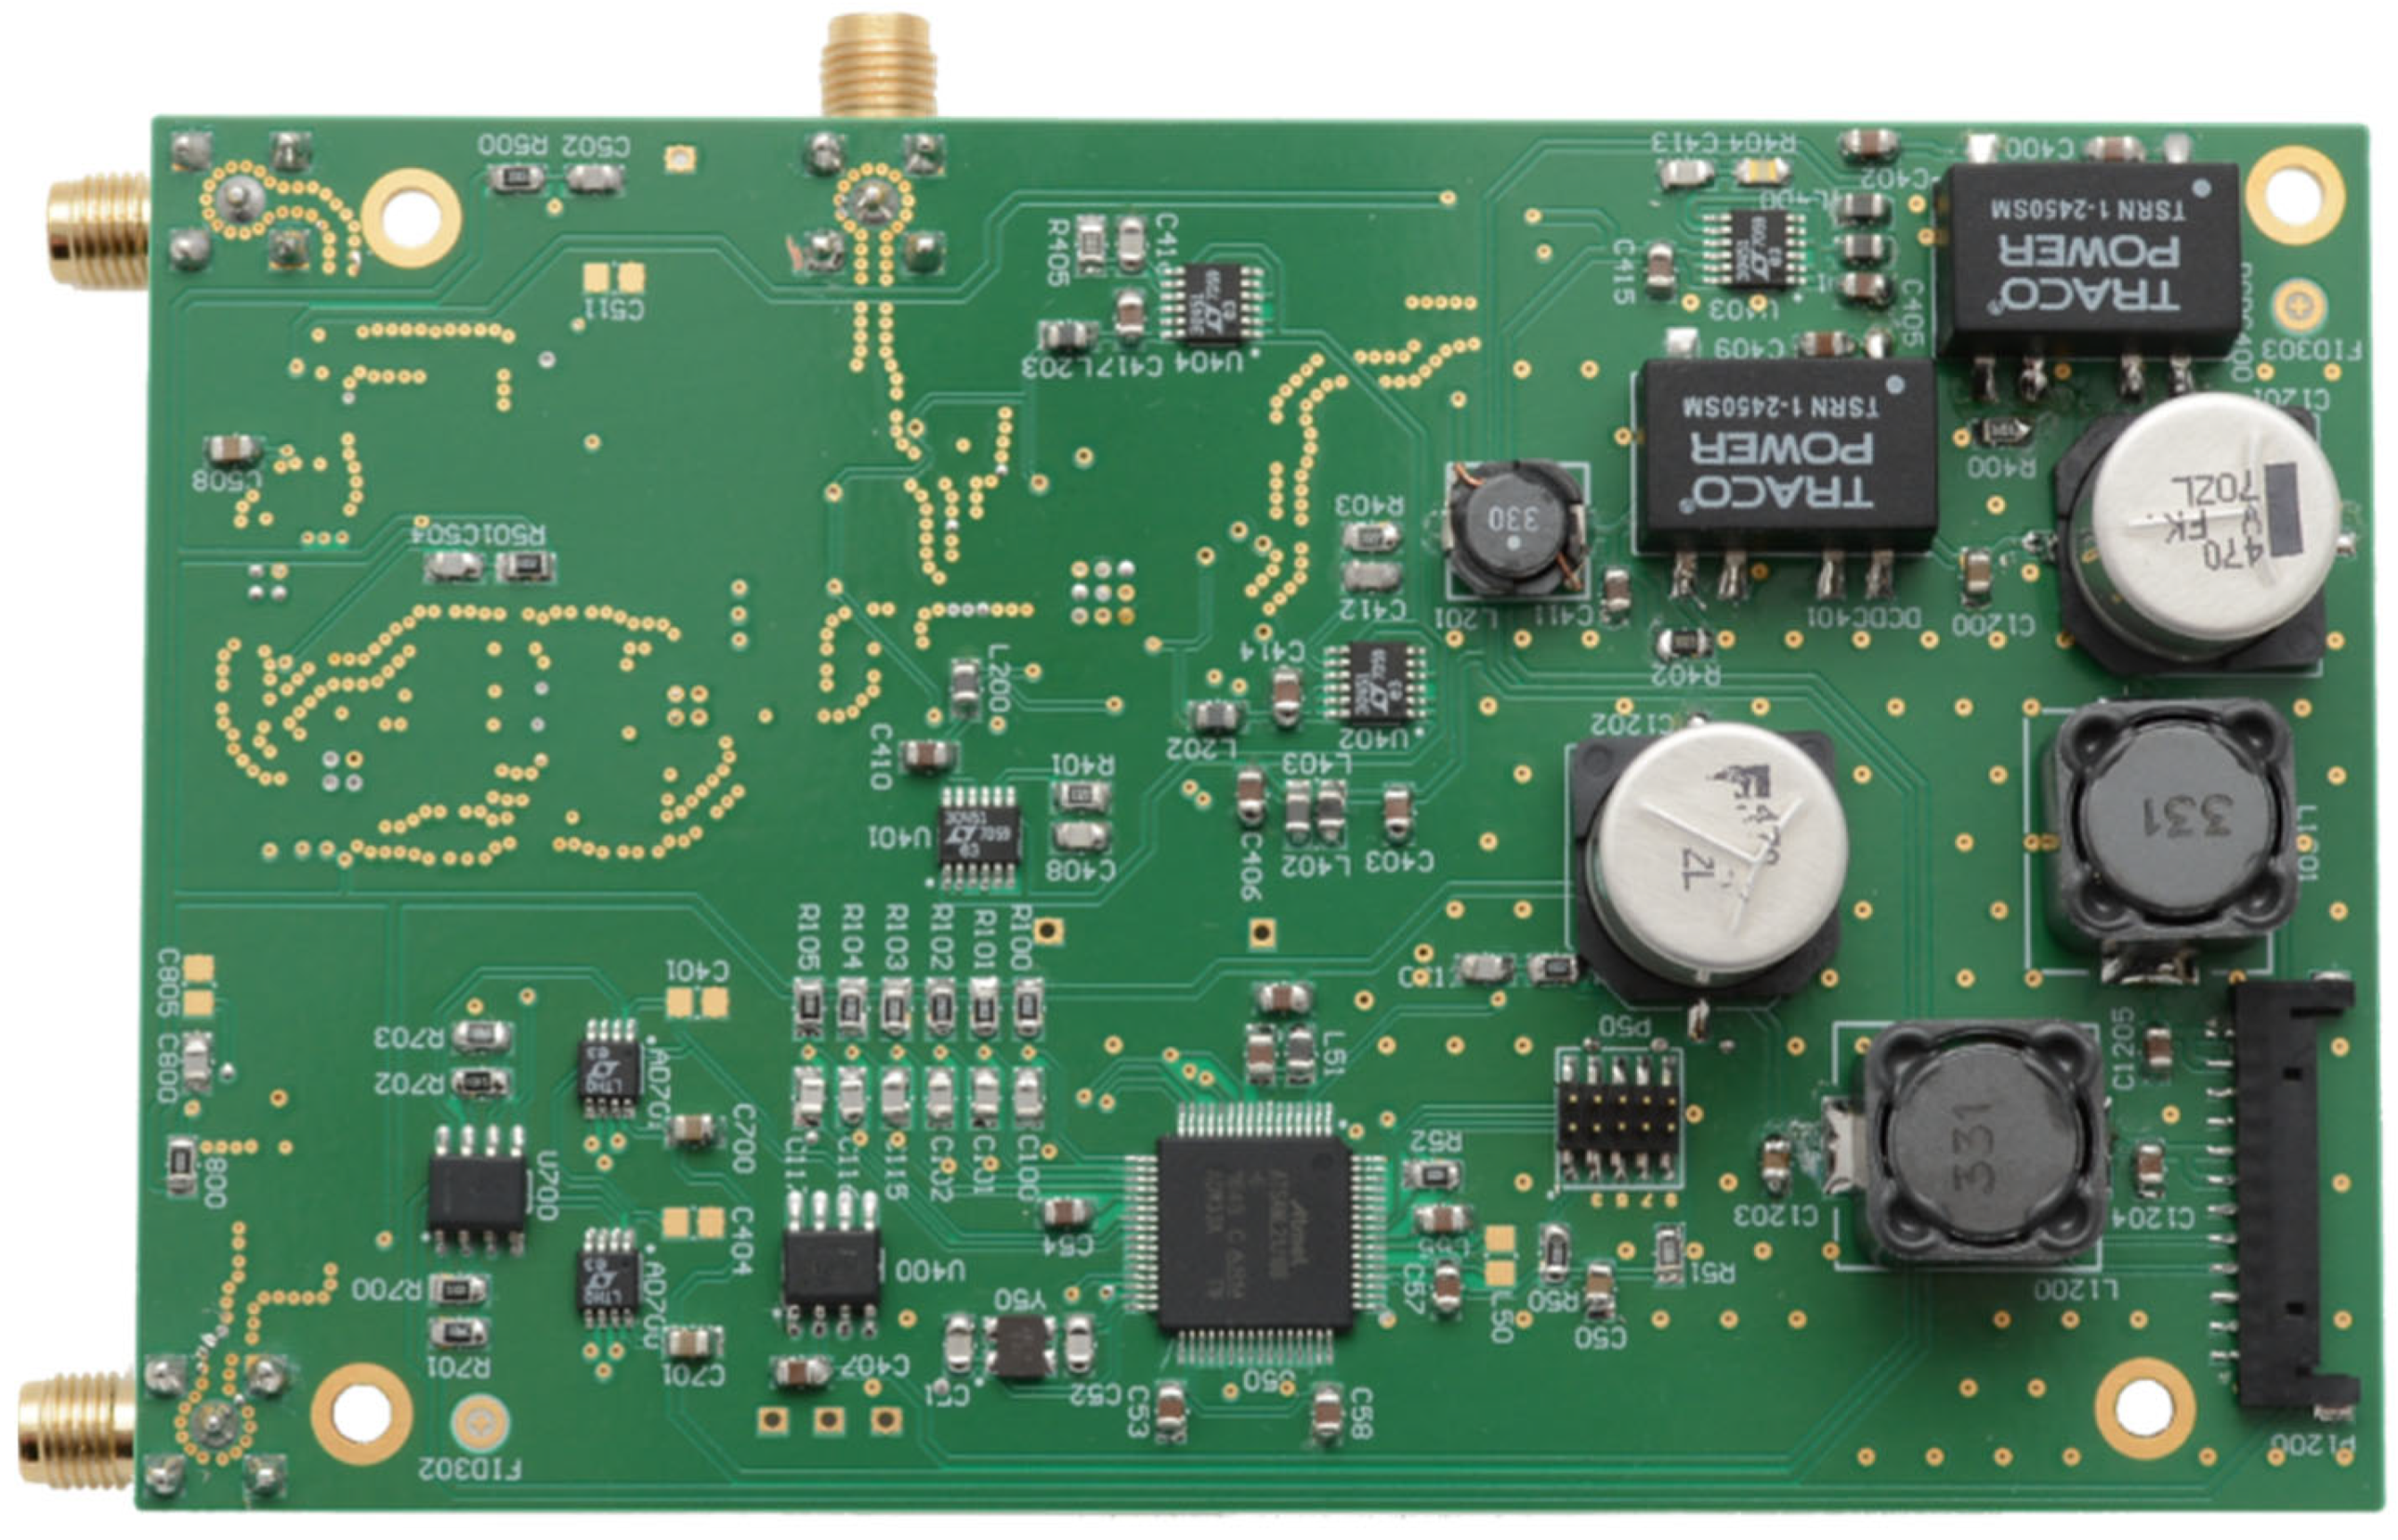
. A microcontroller operates the system and enables communication with a computer. With a self-developed National Instruments LabVIEW software, using either an operation at a constant excitation frequency or recording a frequency sweep, it is possible to determine the resonance frequency of the CaSRR. The constructed new readout electronics is shown in
Figure 5 (top view of the final electronics on a four-layer Rogers 4350B PCB with dimension of 115 mm by 72 mm).
The frequency stability and amplitude stability of the new readout electronics were measured with a Keysight Technologies N9030A PXA Signal Analyzer with the installed phase noise application Keysight Technologies N9068EMOD. The phase noise application had software version A.24.57 and allowed for fast and accurate measurement of the frequency stability and amplitude.
For measuring the frequency response of CaSRR, a vector network analyzer Rhode and Schwarz ZNL6 was used. The VNA and the matching cables Rhode and Schwarz ZV-Z192 were calibrated with a Rhode and Schwarz ZN-Z135 calibration kit.
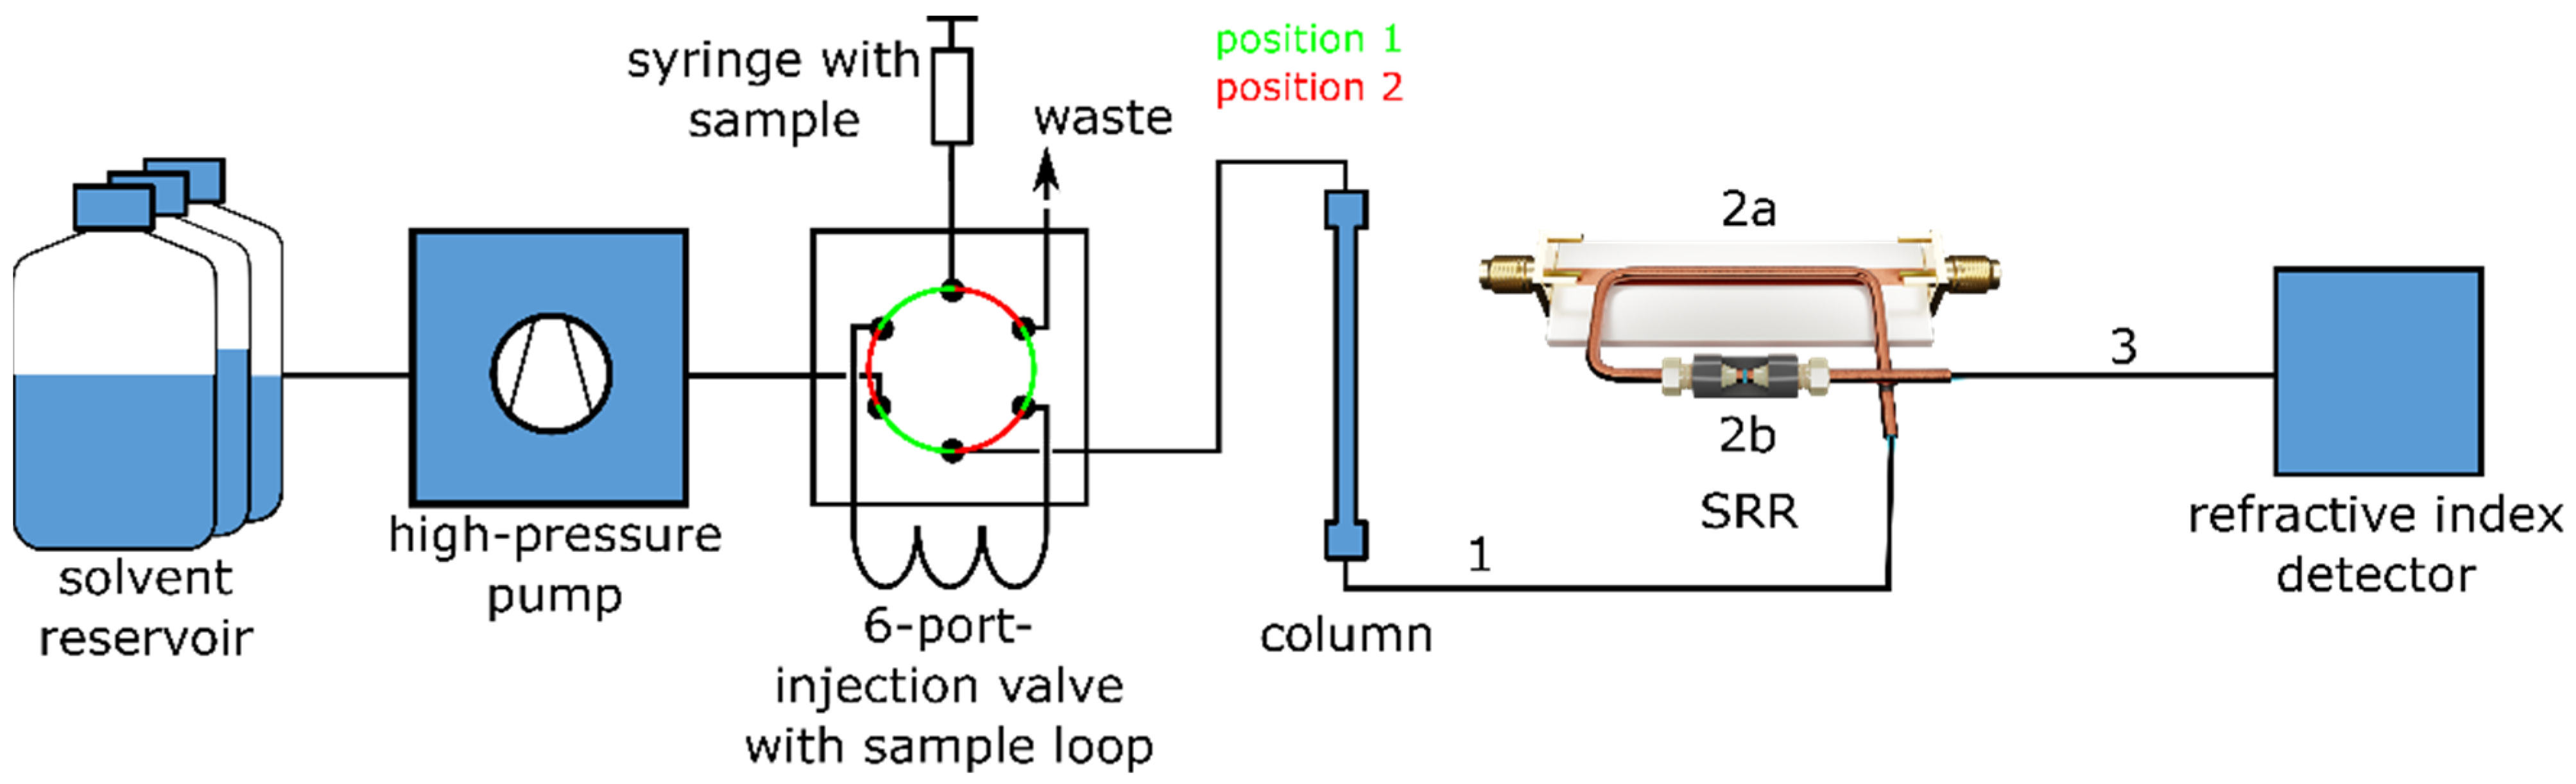
To test the functionality of CaSRR with the developed new readout electronics, a Knaur HPLC system, as shown in
Figure 6, with a built-in refractive index detector RID 2.1 L was coupled in series to CaSRR. HPLC consists of a solvent reservoir, a binary high-pressure pump P 6.1L with two 10 mL-heads, a degasser and a high-pressure mixing chamber, a 6-port-injectionvalve with 20 µL sample loop, a HPLC-column in a column thermostat CT 2.1, and a refractive index detector RID 2.1 L with a 15 µL flow cell volume. The refractive index detector has a maximum sample rate of 100 Hz with a noise of ±2.5 nRIU according to the datasheet.
First, the HPLC pump unit was used to determine the detection limit of CaSRR. The pump unit P 6.1L is capable of mixing and varying eluent mixtures with a very high degree of accuracy, and thus allows for automation of recording a calibration curve of different concentrations of 2-propanol and ultrapure water. The used mixtures were composed of 2-propanol (from 0% to 5% in 0.5% steps) in ultrapure water.
For the HPLC measurements, CaSRR was placed in series between the column and the refractive index detector. In this work, an YMC Europe YMC-Pack Polyamine II-column, a column specified for sugars and sugar alcohols after the HILIC-method, was used. The column had a length of 250 mm, a diameter of 4.6 mm, a particle size of 5 µm, and a pore size of 120 Å. The temperature of the column thermostat and the refractive index detector were set to 30 °C, the flow was 1 mL/min, and the sample volume was defined by the sample loop of 20 µL. The eluent was composed of 25% ultrapure water and 75% acetonitrile of HPLC-MS grade. The sample was a mixture of 125 mg/mL glucose and 115 mg/mL xylitol and, therefore was a mixture of sugar and sugar alcohol in ultrapure water.
The chemicals 2-propanol (Sigma product: 190764), acetonitrile (Sigma product: 1037252002), ultrapure water (Sigma product: 1037282002), D-(+)-glucose (Sigma product: G8270), and xylitol (Sigma product: 47844) that were used for all of the experiments were purchased from Sigma-Aldrich, Germany, with a purity of >99%.
For all of the measurements, the new readout electronics were housed in a thermally insulated box to minimize heat fluctuations and to ensure a constant temperature. This minimized the changes in the output signal, power detectors, and ADC.
3. Discussion
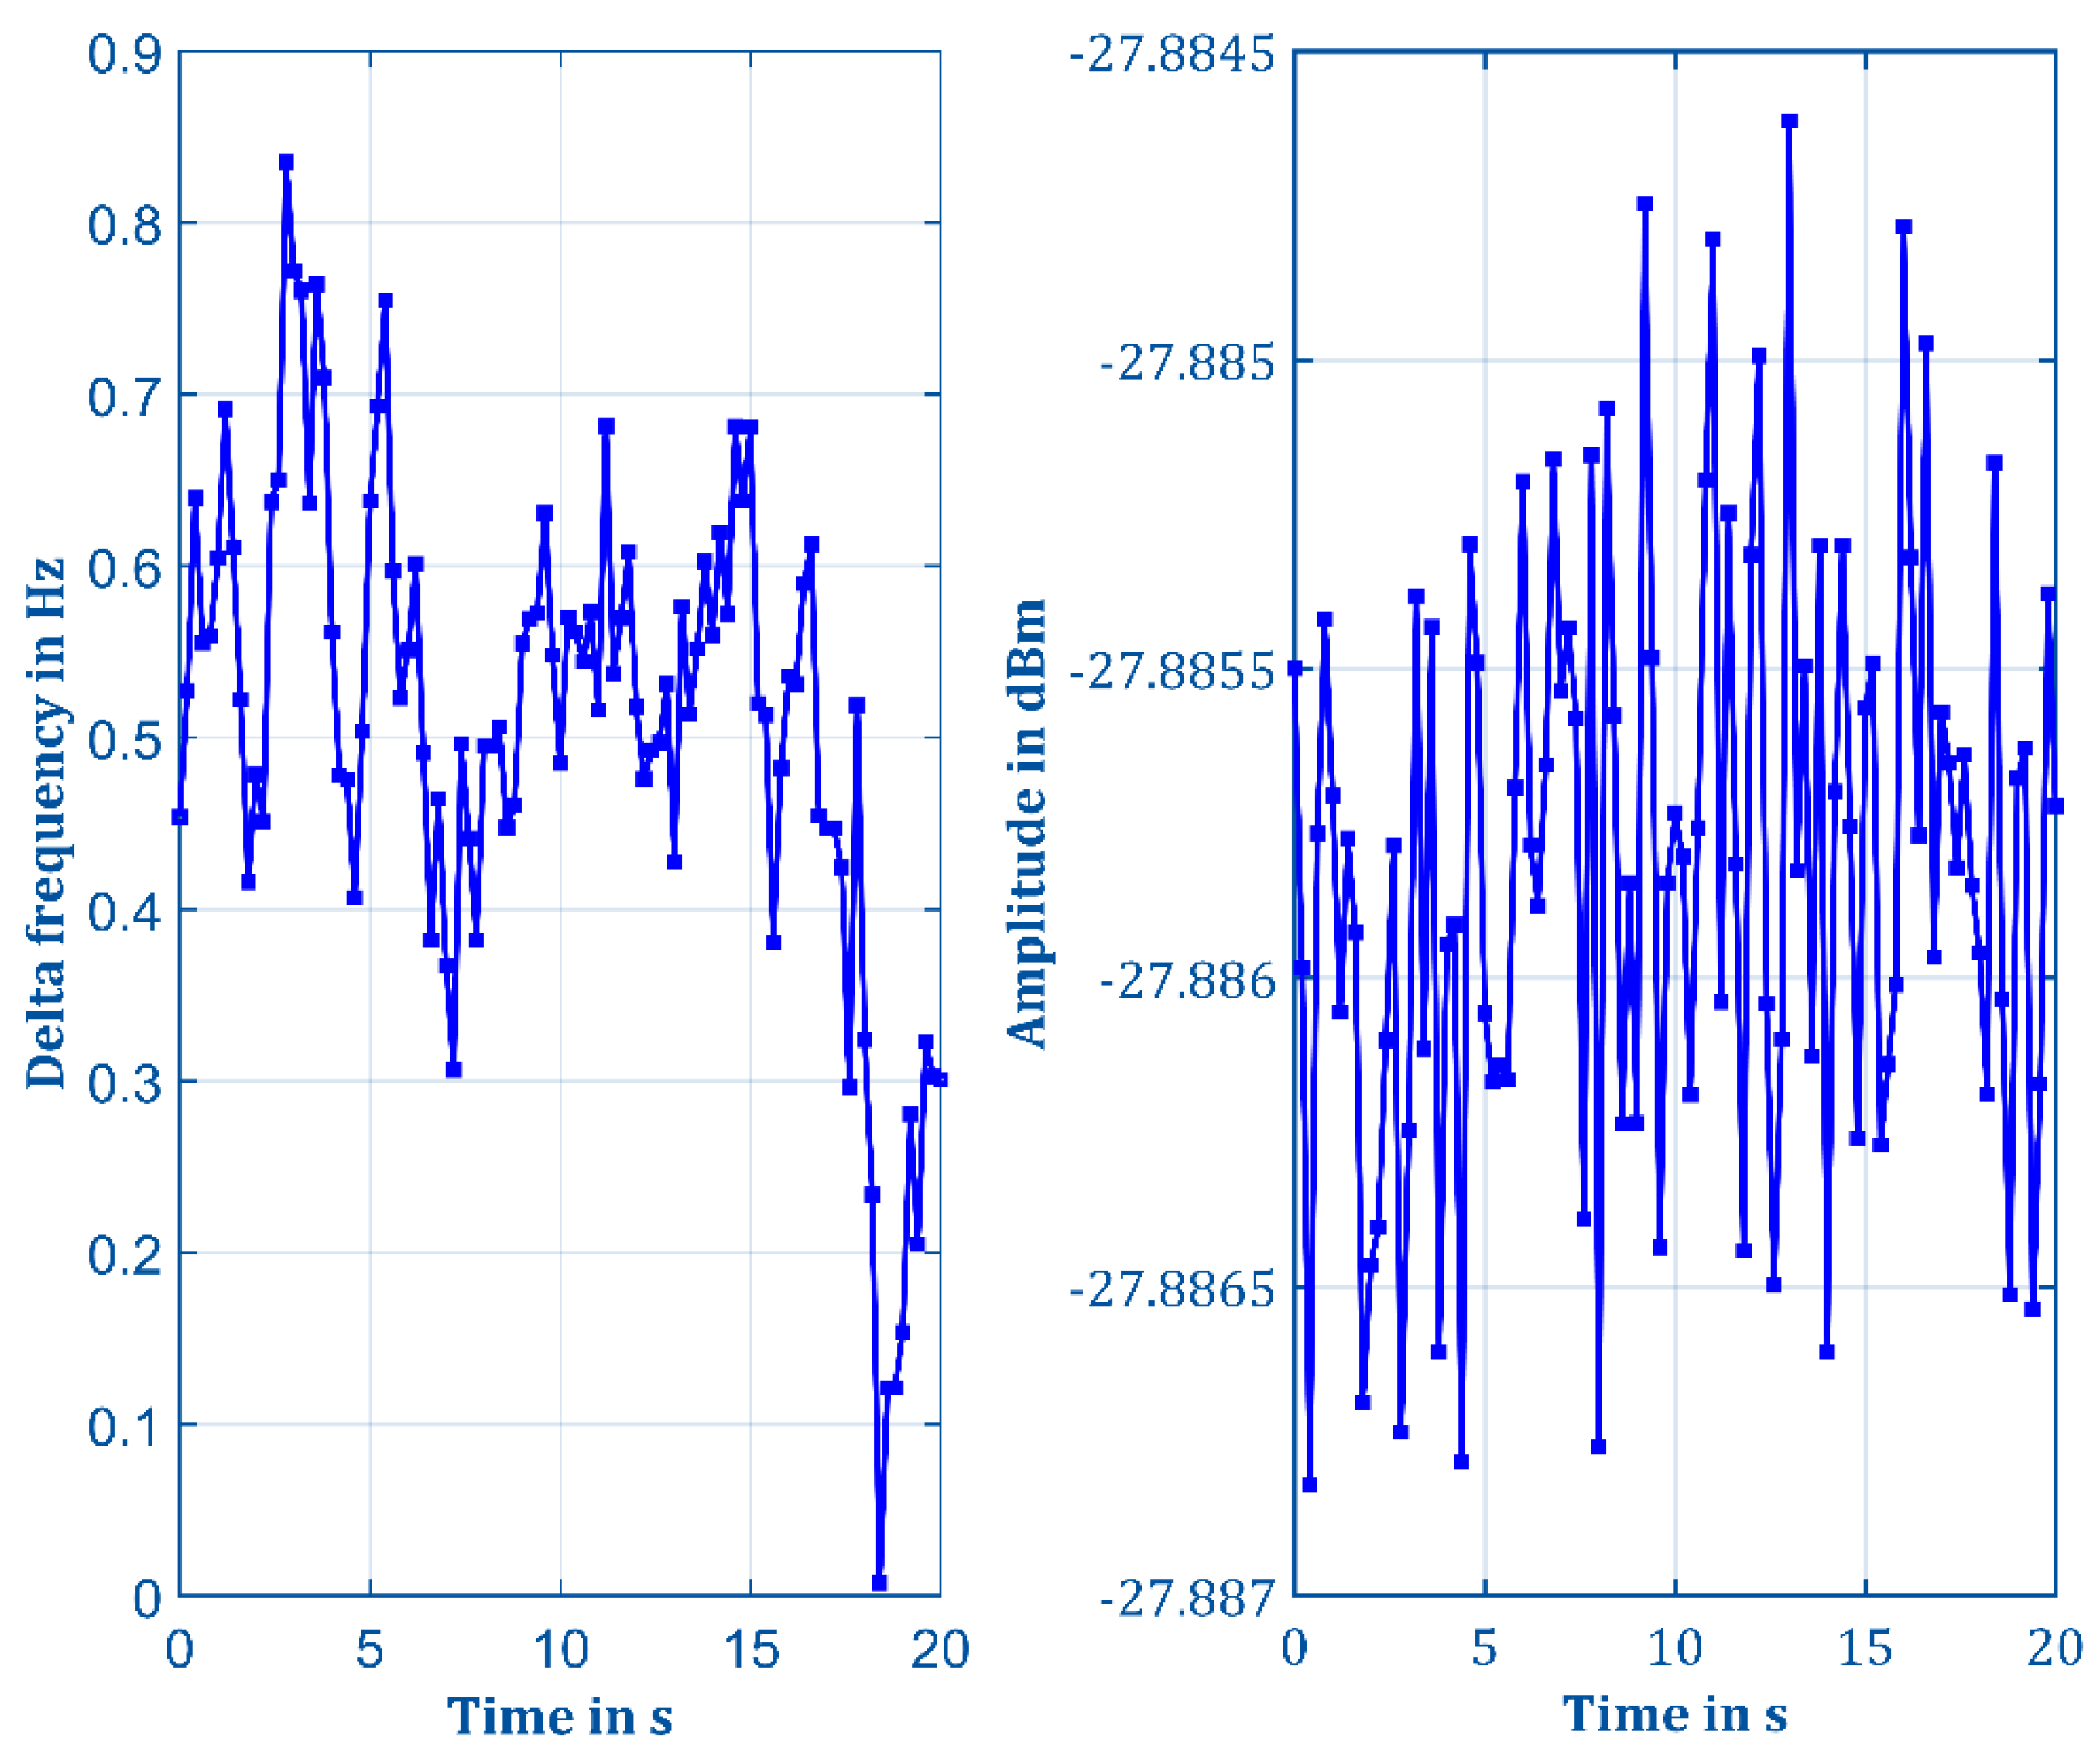
To demonstrate the capability of the new readout electronics, the frequency stability and amplitude stability were measured with the signal analyzer PXA N9030A. The results of the frequency and output power stability of the generated excitation output signal are shown in
Figure 7. The average measured phase noise was 53.95 dBc/Hz at a bandwidth of 10 kHz. The settings for the frequency and amplitude stability measurements are shown in
Table 1.
The new readout electronics had very high frequency stability with a maximum frequency jitter of just 840 mHz within 20 s, which is the maximum possible measuring time of N9030A. In addition, the amplitude was very stable and changed only from −27.8868 dBm to −27.8846 dBm. The maximum sampling rate of either the output or transmitted power in combination with the LabVIEW software was at 5.4 kS/s. The sampling rate included averaging 128 measuring points by the microcontroller and the acquisition rate of the LabVIEW software with an average of 42 Hz. The sampling rate was of the same order of magnitude as the sampling rate of the refractive index detector.
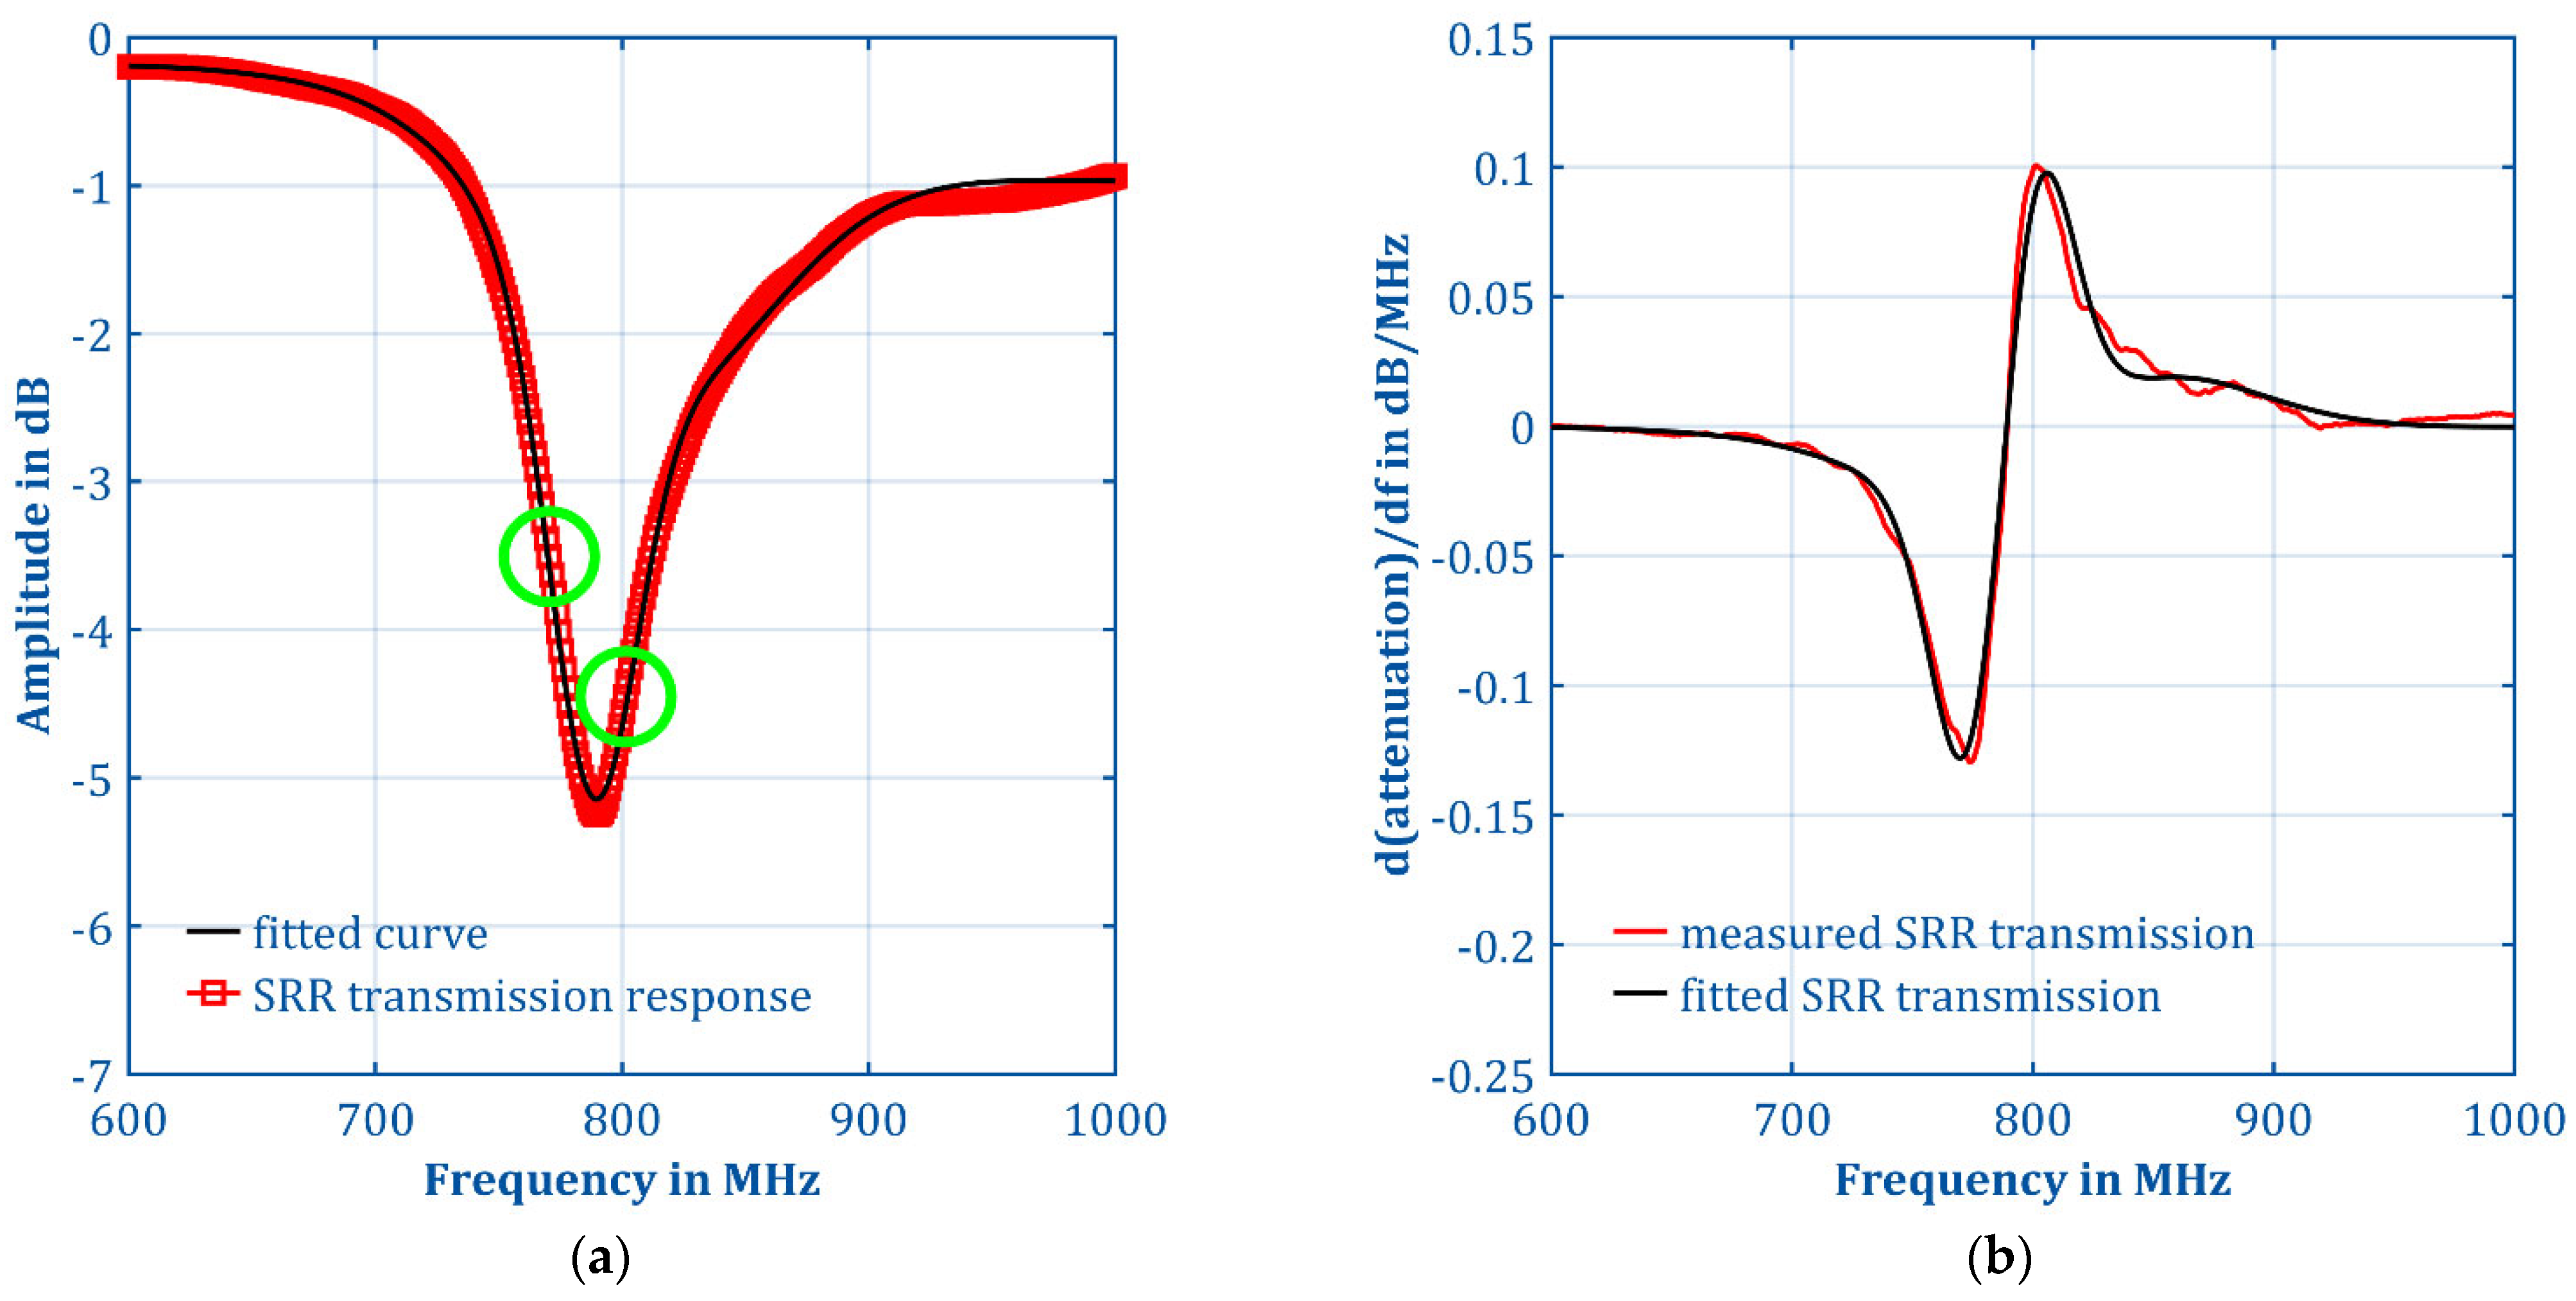
Another optimization parameter was the excitation frequency for measuring the transmission response at a fixed frequency.
Figure 8a shows the measured transmission response of the CaSRR loaded with 25% ultrapure water and 75% acetonitrile (used as eluent in the HPLC experiments) over a broad frequency range. The response of the split-ring resonator measured with the ZNL6 was low-pass filtered to achieve noise reduction for a better fit using MATLAB. The resonance frequency of the loaded CaSRR was 787.9 MHz. The black curve was fitted with a combination of five overlapping Gaussian peaks. The fit had an R
2 of 99.96%, leading to a good approximation of the measured CaSRR response.
To achieve the highest sensitivity of the system regarding the detection of resonance frequency shifts, the excitation frequency needed to be set to the frequency with the highest slope in the frequency response. We referred to this as the optimum excitation frequency. At this frequency, the amplitude change caused by a frequency shift was the highest and therefore best suited for measuring very small frequency shifts. For an ideal single Gaussian peak, the optimum excitation frequencies corresponded to the two symmetric inflection points. However, as the curve shown in
Figure 8a is a superposition of five Gaussian peaks, the inflection points were at the plotted locations and so were the optimal measurement frequencies.
Figure 8b shows the differentiation of the measured curve and the fitted curve from
Figure 8a, to determine the optimum excitation frequencies with the highest slope.
The highest possible slope at the inflection points and therefore the highest possible sensitivity was at 774.5 MHz and at 801.5 MHz for the measured curve. For the fitted curve, the inflection point frequencies differed slightly and were 769.5 MHz and 805.5 MHz, respectively.
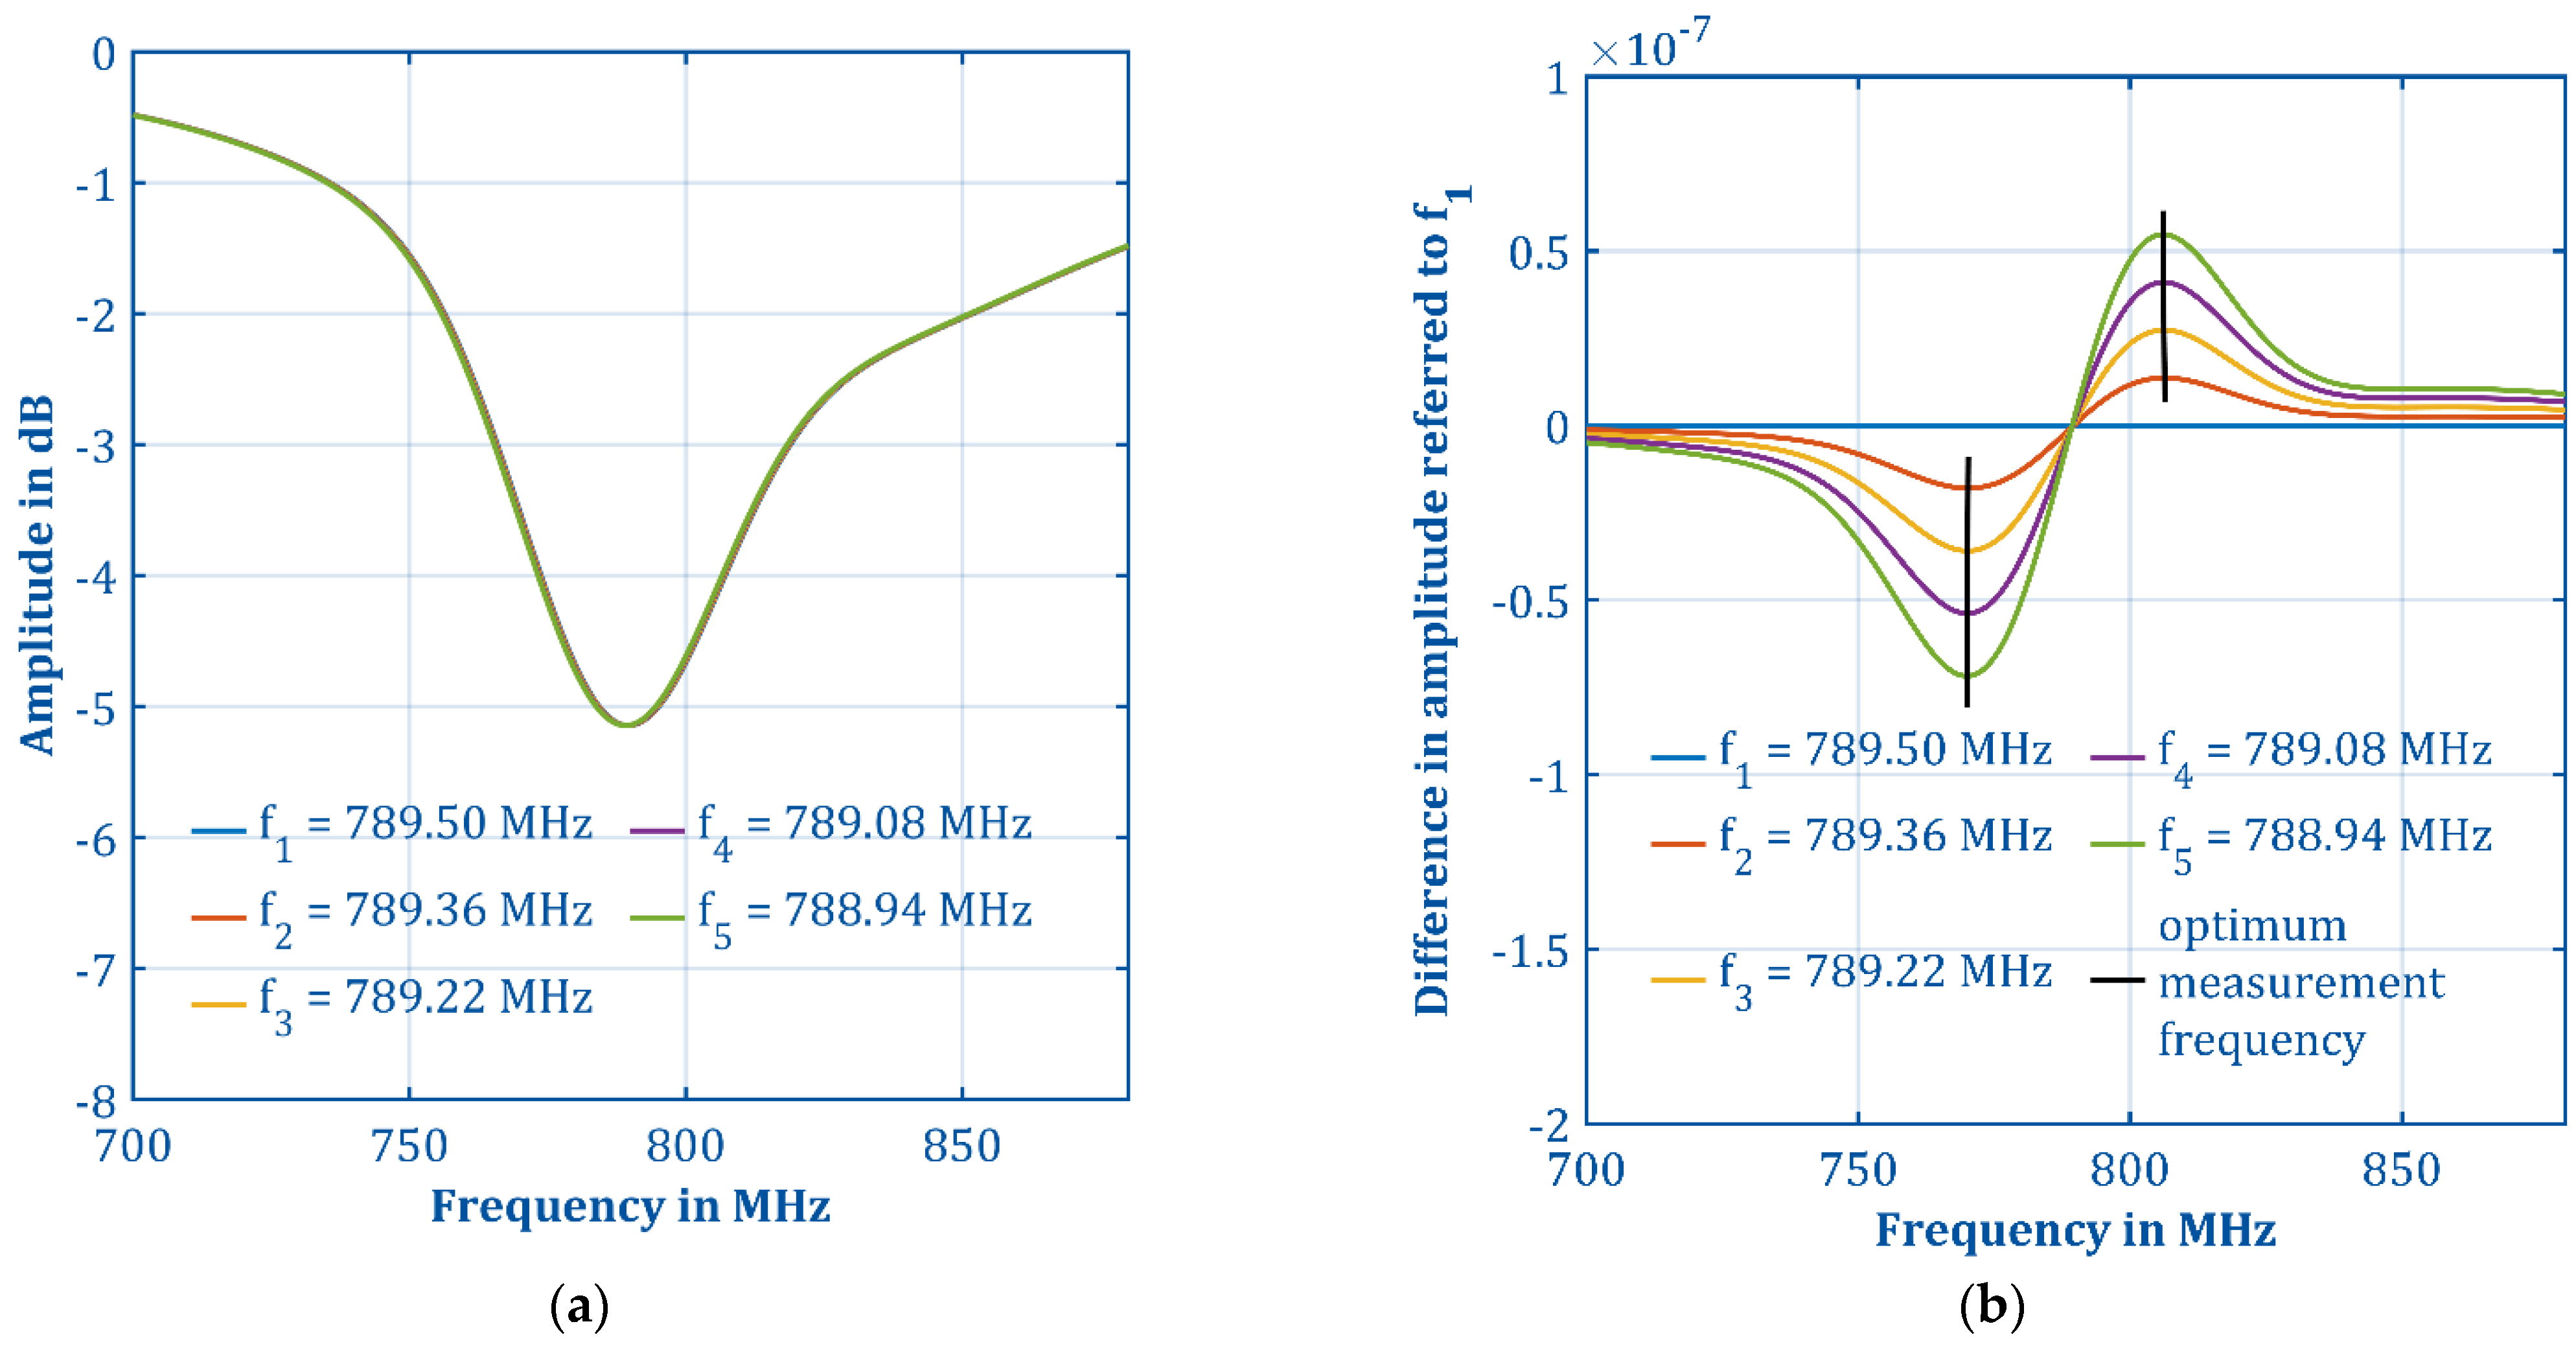
In order to investigate the optimum excitation frequency while considering the non-idealities of the electronics, the capillary split-ring resonator was simulated using MATLAB. Two additional factors had to be considered regarding the optimum excitation frequency, namely (a) the spectral impurity of the excitation frequency and (b) the expected extent of the frequency shift caused by a permittivity change. For modelling the spectral impurity of the excitation source, an ideal Gaussian peak was assumed with the previously measured phase noise of 53.95 dBc/Hz. The width of the Gaussian peak correlated to the measured phase noise of the excitation source from the new readout electronics. The measured jitter of the excitation frequency was small and was thus neglected here. For modelling CaSRR transmission, we used the fit of the frequency response from
Figure 8a. To simulate a resonance frequency shift caused by a permittivity change, this fit was simply shifted accordingly. In the following, four resonance frequency shifts (each referred to the resonance frequency f
1 of CaSRR loaded with the eluent) were investigated, see
Figure 9a. Each frequency response in
Figure 9a was now multiplied with Gaussian peaks at different center frequencies representing the spectral impurity of the excitation source giving the frequency responses of the CaSRR when measured with the new readout electronics with imperfect excitation. The resulting shifted frequency responses were now subtracted from the non-shifted frequency response of the CaSRR loaded with the eluent, giving
Figure 9b.
The highest sensitivity of CaSRR was always at the inflection points. For very large permittivity changes, it is advised to use an excitation frequency between the inflection points of the maximally shifted and non-shifted CaSRR response. However, the maximum permittivity change needs to be known in advance. Therefore, the optimum excitation frequency depends on the maximum permittivity shift expected in the application. For a shift of, e.g.,
, which are 70 kHz, the optimum excitation frequency is at 770.232 MHz for the falling edge and at 806.346 MHz for the rising edge. The optimum excitation frequency is therefore about 32 kHz away from the inflection points and thus corresponds to Equation (5).
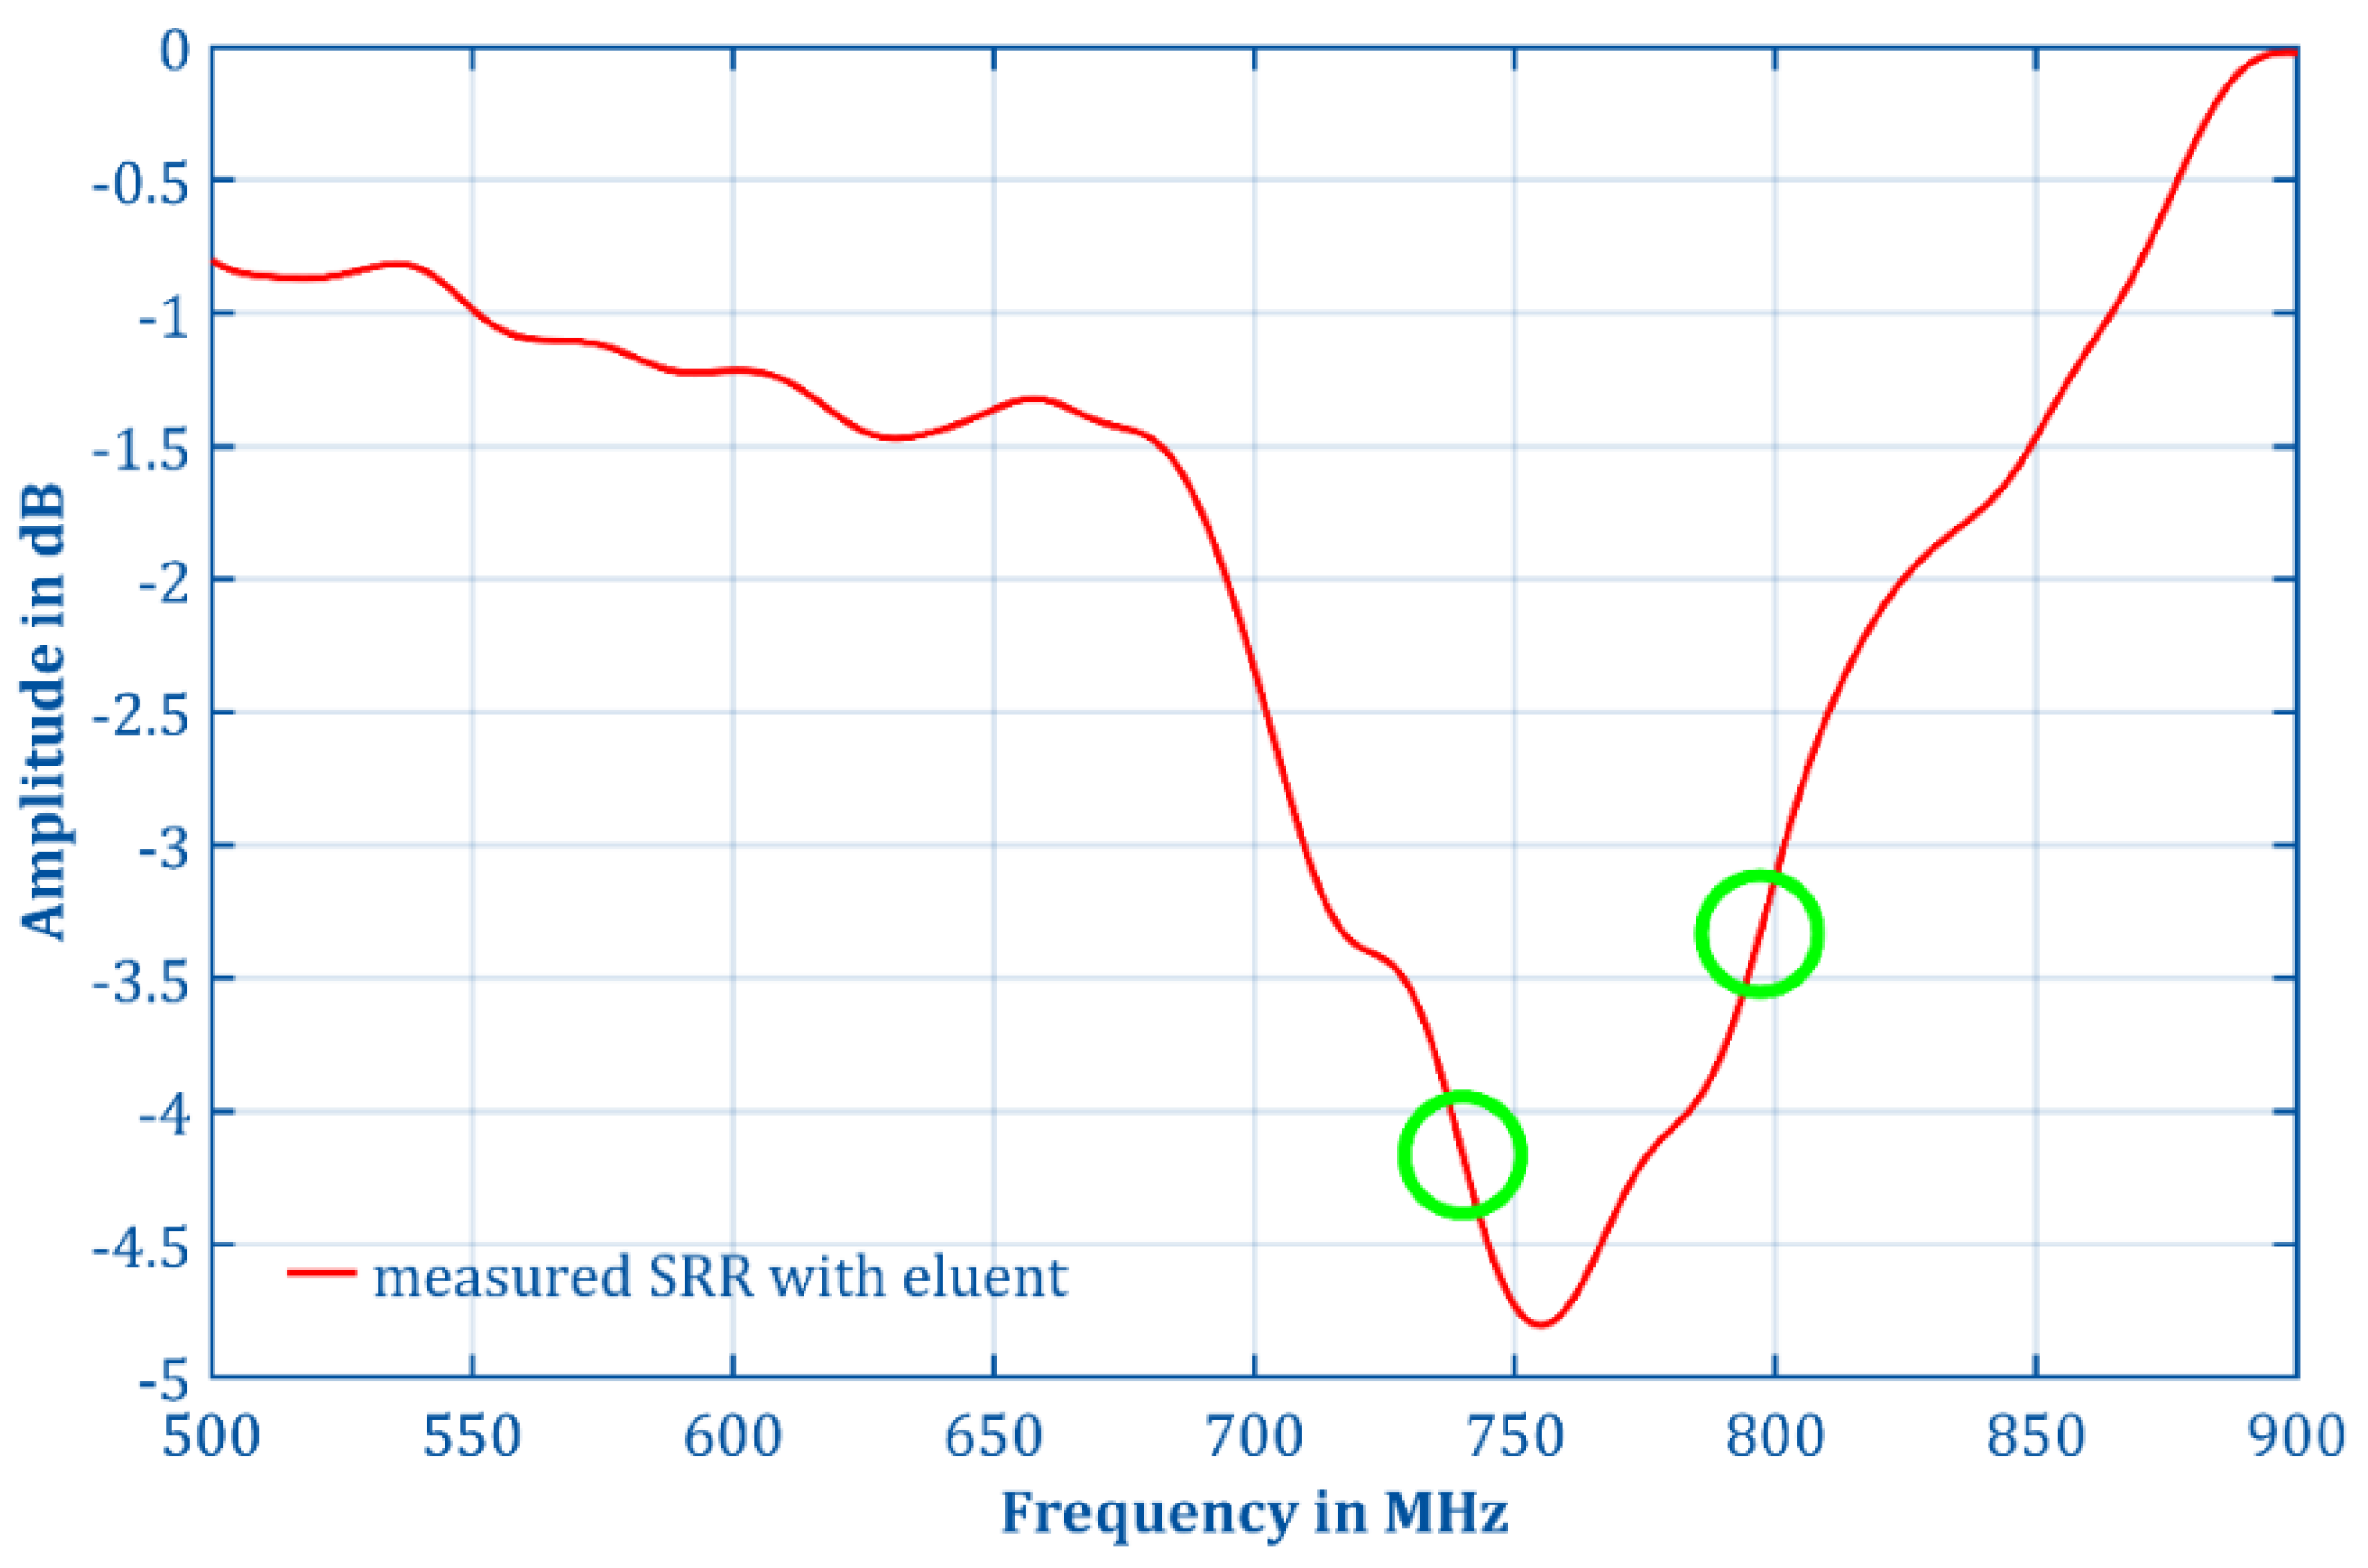
As can be seen in
Figure 10 that the CaSRR frequency response measured with our new readout electronics differed in frequency and amplitude from the measurement with the network analyzer shown in
Figure 8a. This is due to the calibration just using through but not short, matching, and high impedance. However, in HPLC, this is not necessary, because we only measured the differences of the amplitude at the optimum excitation frequency. In HPLC, the shift in resonance frequency was so small, that the infliction points of the frequency response of the CaSRR loaded with the eluent were optimum. The inflection points are marked with green circles at 740 MHz and at 797 MHz. For 740 MHz, the sensitivity of CaSRR was at
.
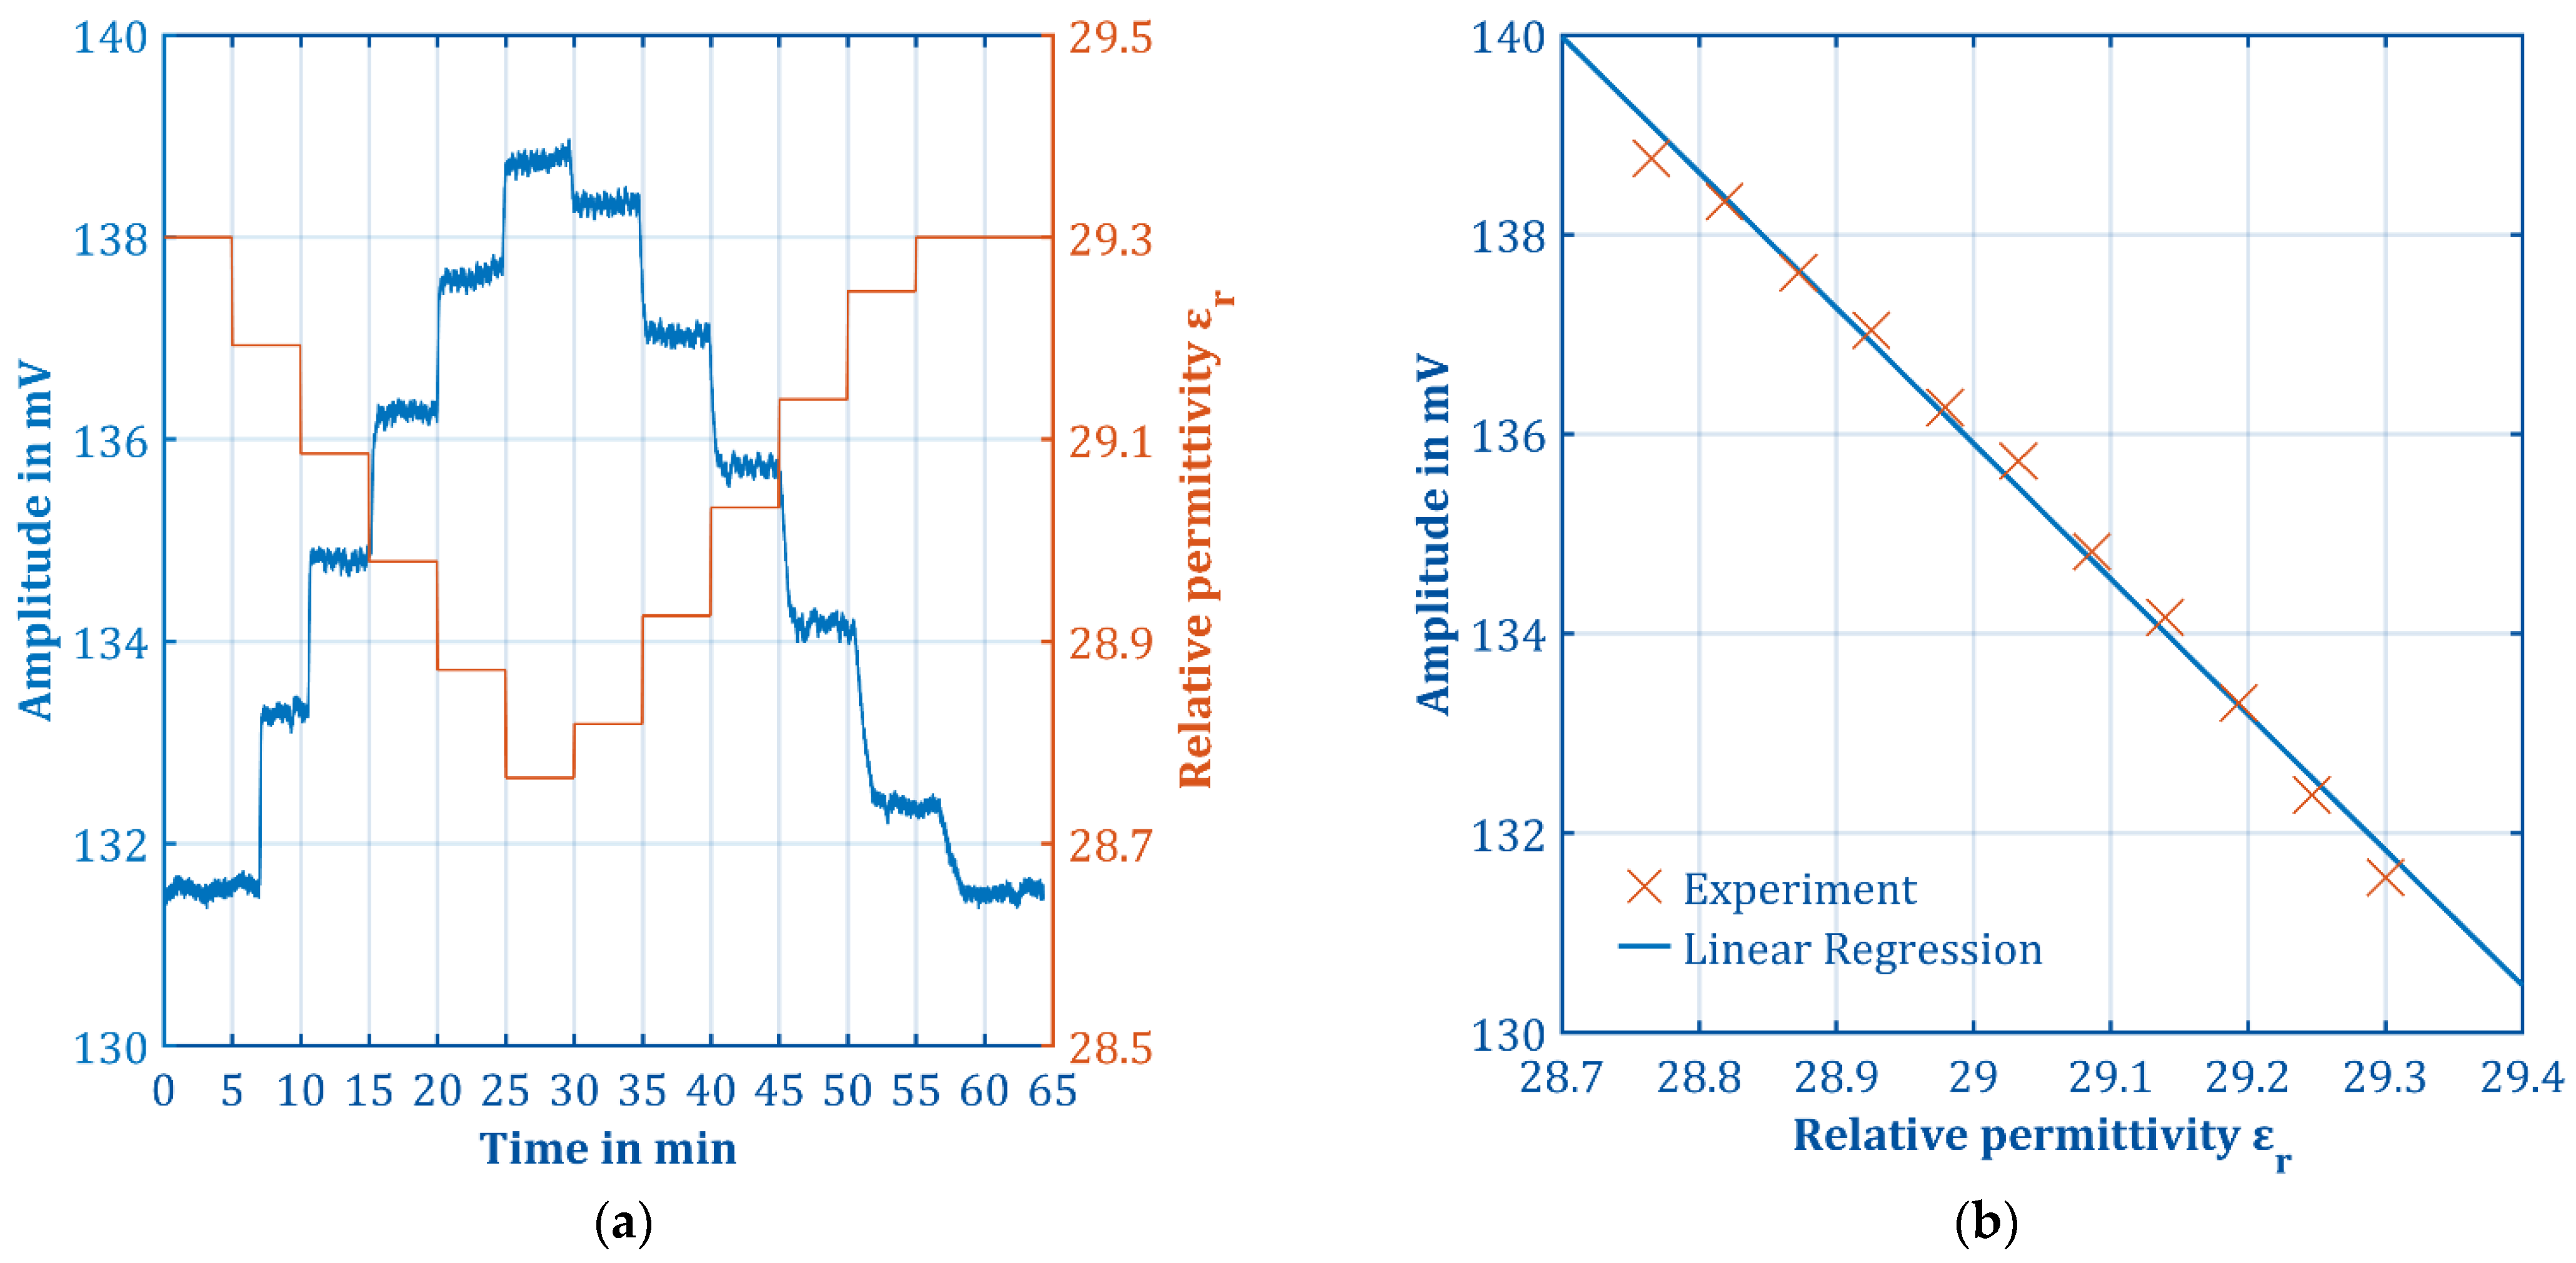
The sensitivity of CaSRR in combination with the new readout electronics was determined by measuring mixtures of ultrapure water and 2-propanol mixture. The HPLC pump unit was used to generate a step-wise increase and decrease of the 2-propanol concentration. As shown in
Figure 11a, first an increasing concentration sequence of 1%, 2%, 3%, 4%, and 5% 2-propanol was measured, followed by a decreasing concentration sequence of 4.5%, 3.5%, 2.5%, 1.5%, and 0.5% 2-propanol in ultrapure water. This results in a stepwise change of the relative permittivity with the relative permittivity of ultrapure water being
and 2-propanol being
[
25]. The relative permittivity of mixtures is calculated according to [
25], with a minimum relative permittivity of
for 5% 2-propanol.
From the calibration curve shown in
Figure 11a, the mean values of the output signal for each individual permittivity step (orange crosses) showed linear dependence of the output signal and relative permittivity, see
Figure 11b. The linear regression is given in Equation (6). As the slope of the linear regression reflects the sensitivity
of the measurement system, the measured noise of
yields a detection limit of
within an averaging time of only 24 ms. The detection limit refers to three times the standard deviation of the noise.
By increasing the sample rate of the developed electronics to 120 kS/s, which is the maximum of ADC according to the datasheet of both the ADC and the microcontroller, the noise can be further decreased by averaging 2857 data points. This should allow for recording even the smallest changes of permittivity of . Furthermore, a higher bit count ADC could be used to reduce the noise even further, and therefore increase the SNR of the measured signal.
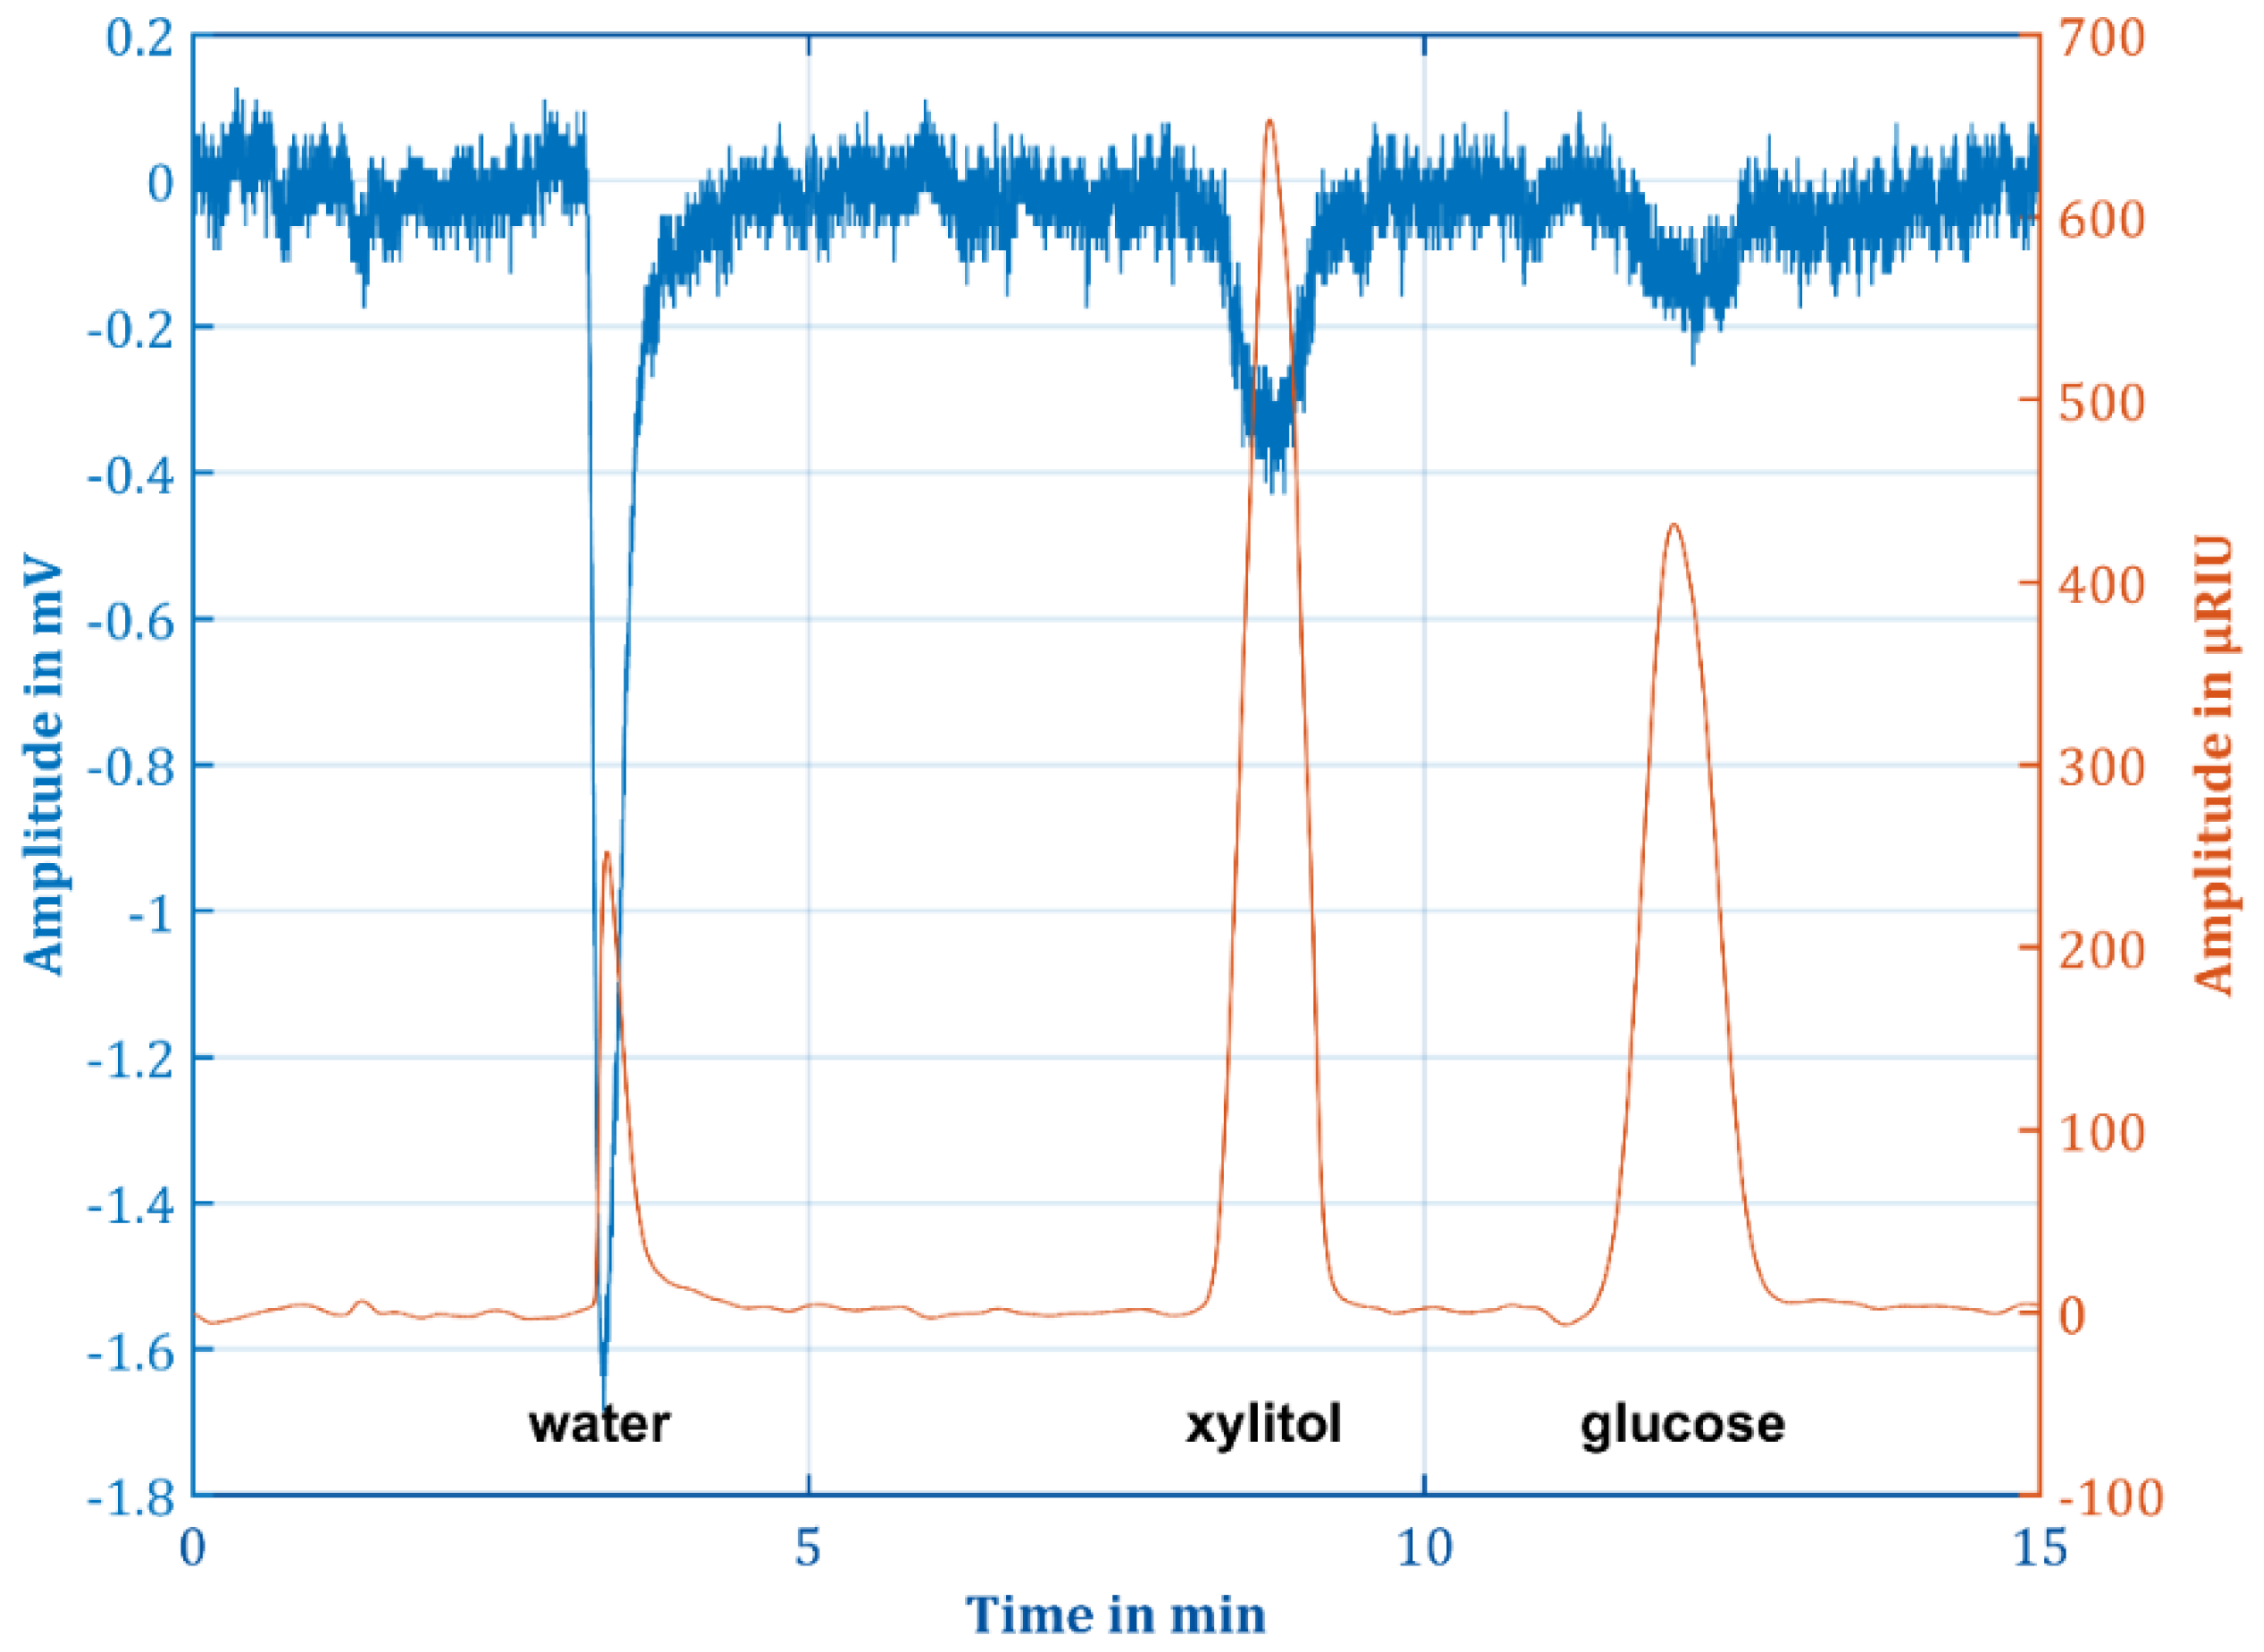
To demonstrate the potential of the CaSRR with the new readout electronics, a HPLC chromatogram was recorded, see
Figure 12. Therefore, the refractive index detector and the CaSRR were connected in series. The time delay between CaSRR and the refractive index detector is minimized using connecting capillaries with an inner diameter of only 250 µm, giving a dead volume of about 50 cm × 250 µm ≈ 24.5 µL. The time delay was determined to 1.5 s with a flow of
. The refractive index detector works in a differential-mode to eliminate changes in the eluent, so the first value was set to 0. This was also done for the first value of CaSRR. In the recorded spectrum of CaSRR, the peaks of water, glucose, and xylitol were directed to negative values due to the measuring frequency of 740 MHz at the inflection point with the highest sensitivity on the falling edge of the resonance peak. Water acted as an inert substance here, as it did not interact with the stationary phase of the column and was therefore not retarded. The dead time of the system determined from the retention time of water was 184 s. The retention time of xylitol was about 500 s, and the retention time of glucose was about 690 s.
It needs to be noted that the concentrations of 125 mg/mL glucose and 115 mg/mL xylitol were diluted by HPLC. The dilution factor DF can be calculated from the peak width at half maximum
, the flow rate
, and the volume of the sample loop
, according to Equation (7).
For a peak width at a half maximum of about
, a sample loop with
and
, the concentration at the detector was 2.5 mg/mL for glucose and 2.3 mg/mL for xylitol (dilution factor of
). In
Figure 12, CaSRR is compared to the refractive index detector, which has a significantly higher sensitivity to sugars and sugar-derivatives. As permittivity and refractive index are related according to Equation (8), this can be explained by the different measuring frequencies [
26] (pp. 232–235).
Obviously, at 740 MHz (CaSRR) the permittivity change caused by sugars and sugar-derivatives dissolved in ultrapure water is less pronounced compared to the light (450 nm to 490 nm and 630 nm to 700 nm) (refractive index detector). This high difference in frequency has different effects on the polarization properties at 740 MHz mainly orientational polarization effects occur and at light frequencies of 428 THz to 666 THz, atomic polarization effects occur [
26] (pp. 232–235). While there is room for vast improvements in the signal to noise ratio, this first chromatogram demonstrates the basic feasibility of CaSRR and the new readout electronics for application in HPLC.


