
Effectiveness Evaluation of Different IDSs Using Integrated Fuzzy MCDM Model


 , ,
, ,  and
and
Abstract
:1. Introduction
2. Related Research Studies
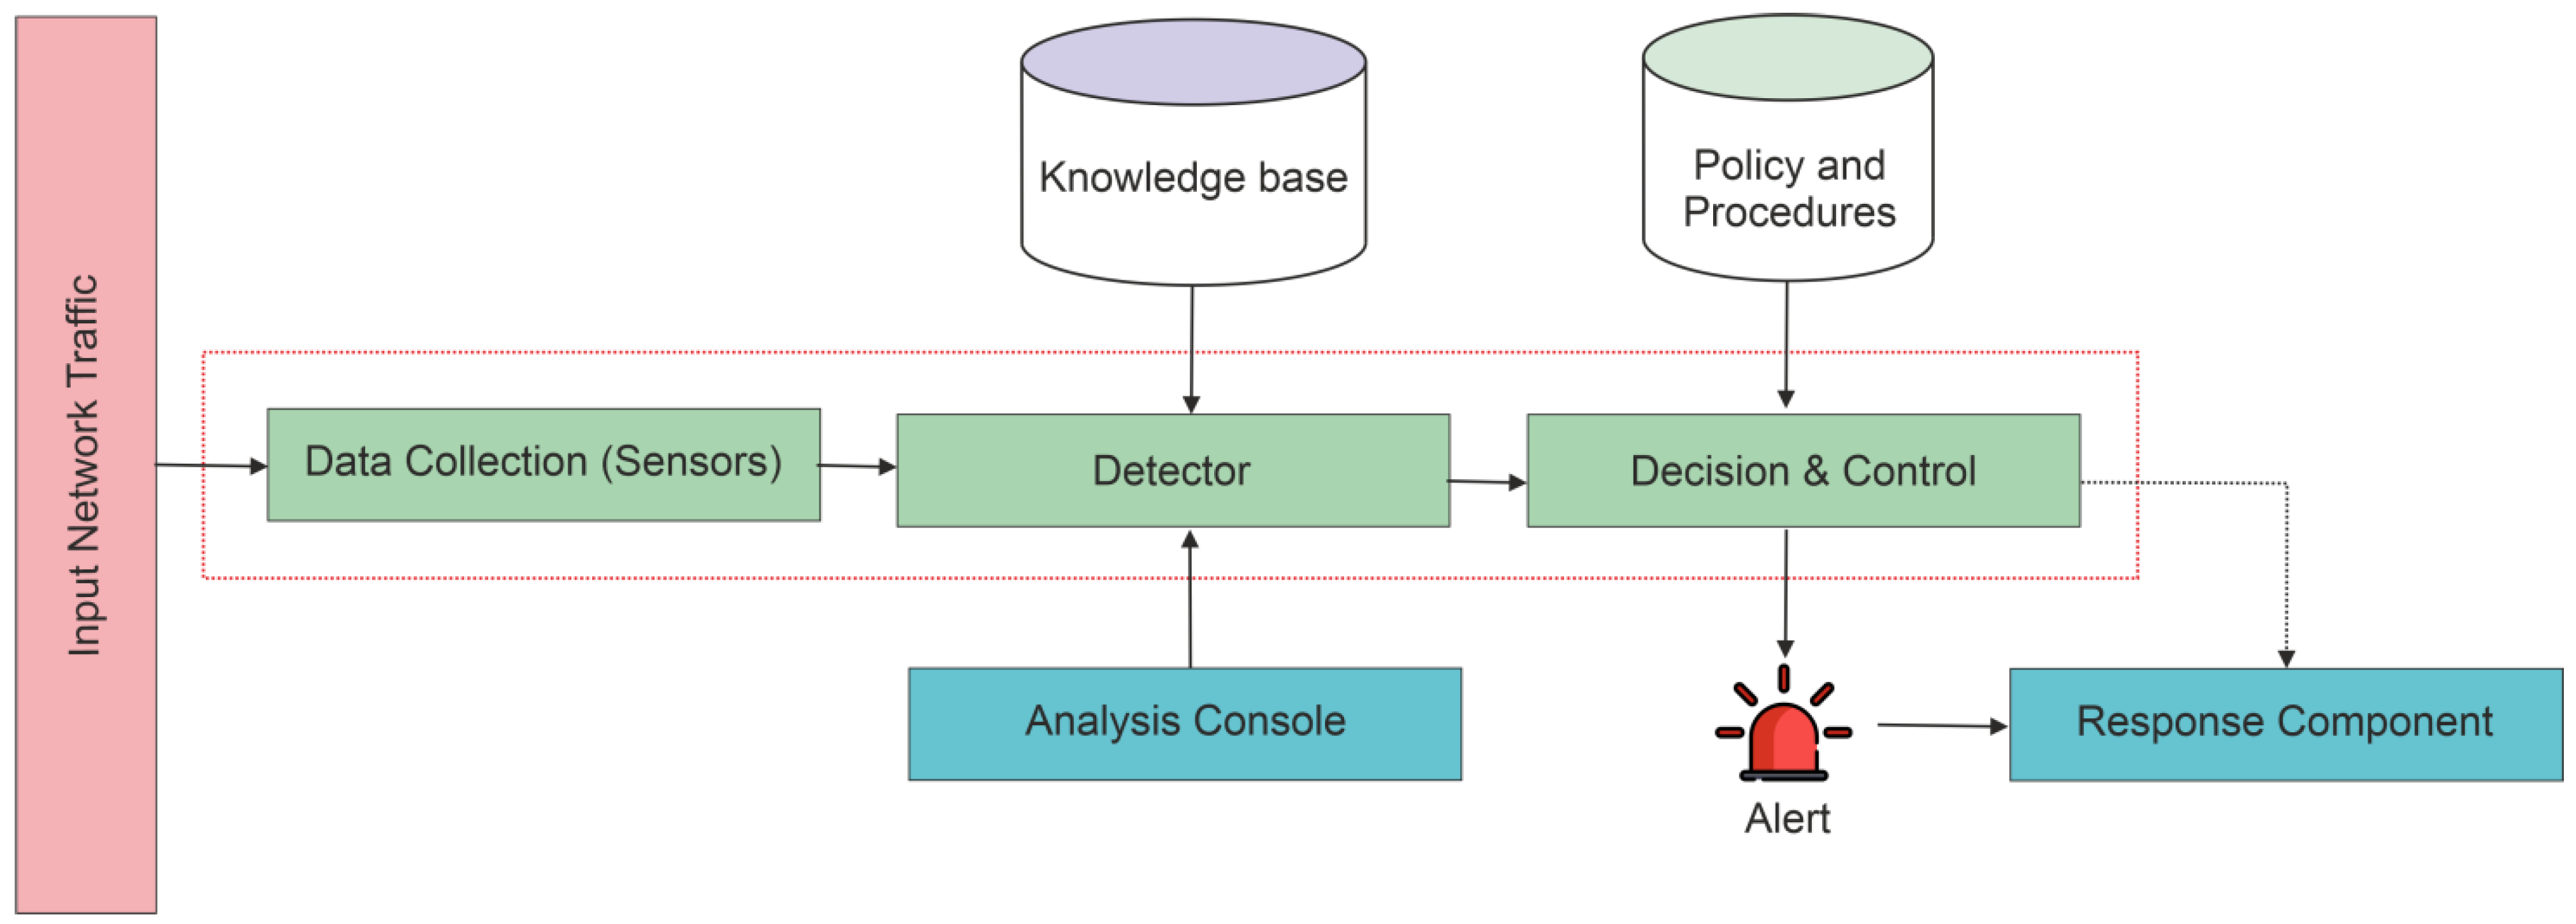
3. Different Types of Intrusion-Detection Systems
3.1. Zeek
3.2. Suricata
3.3. Security Onion
3.4. OSSEC
3.5. Snort
4. Methods
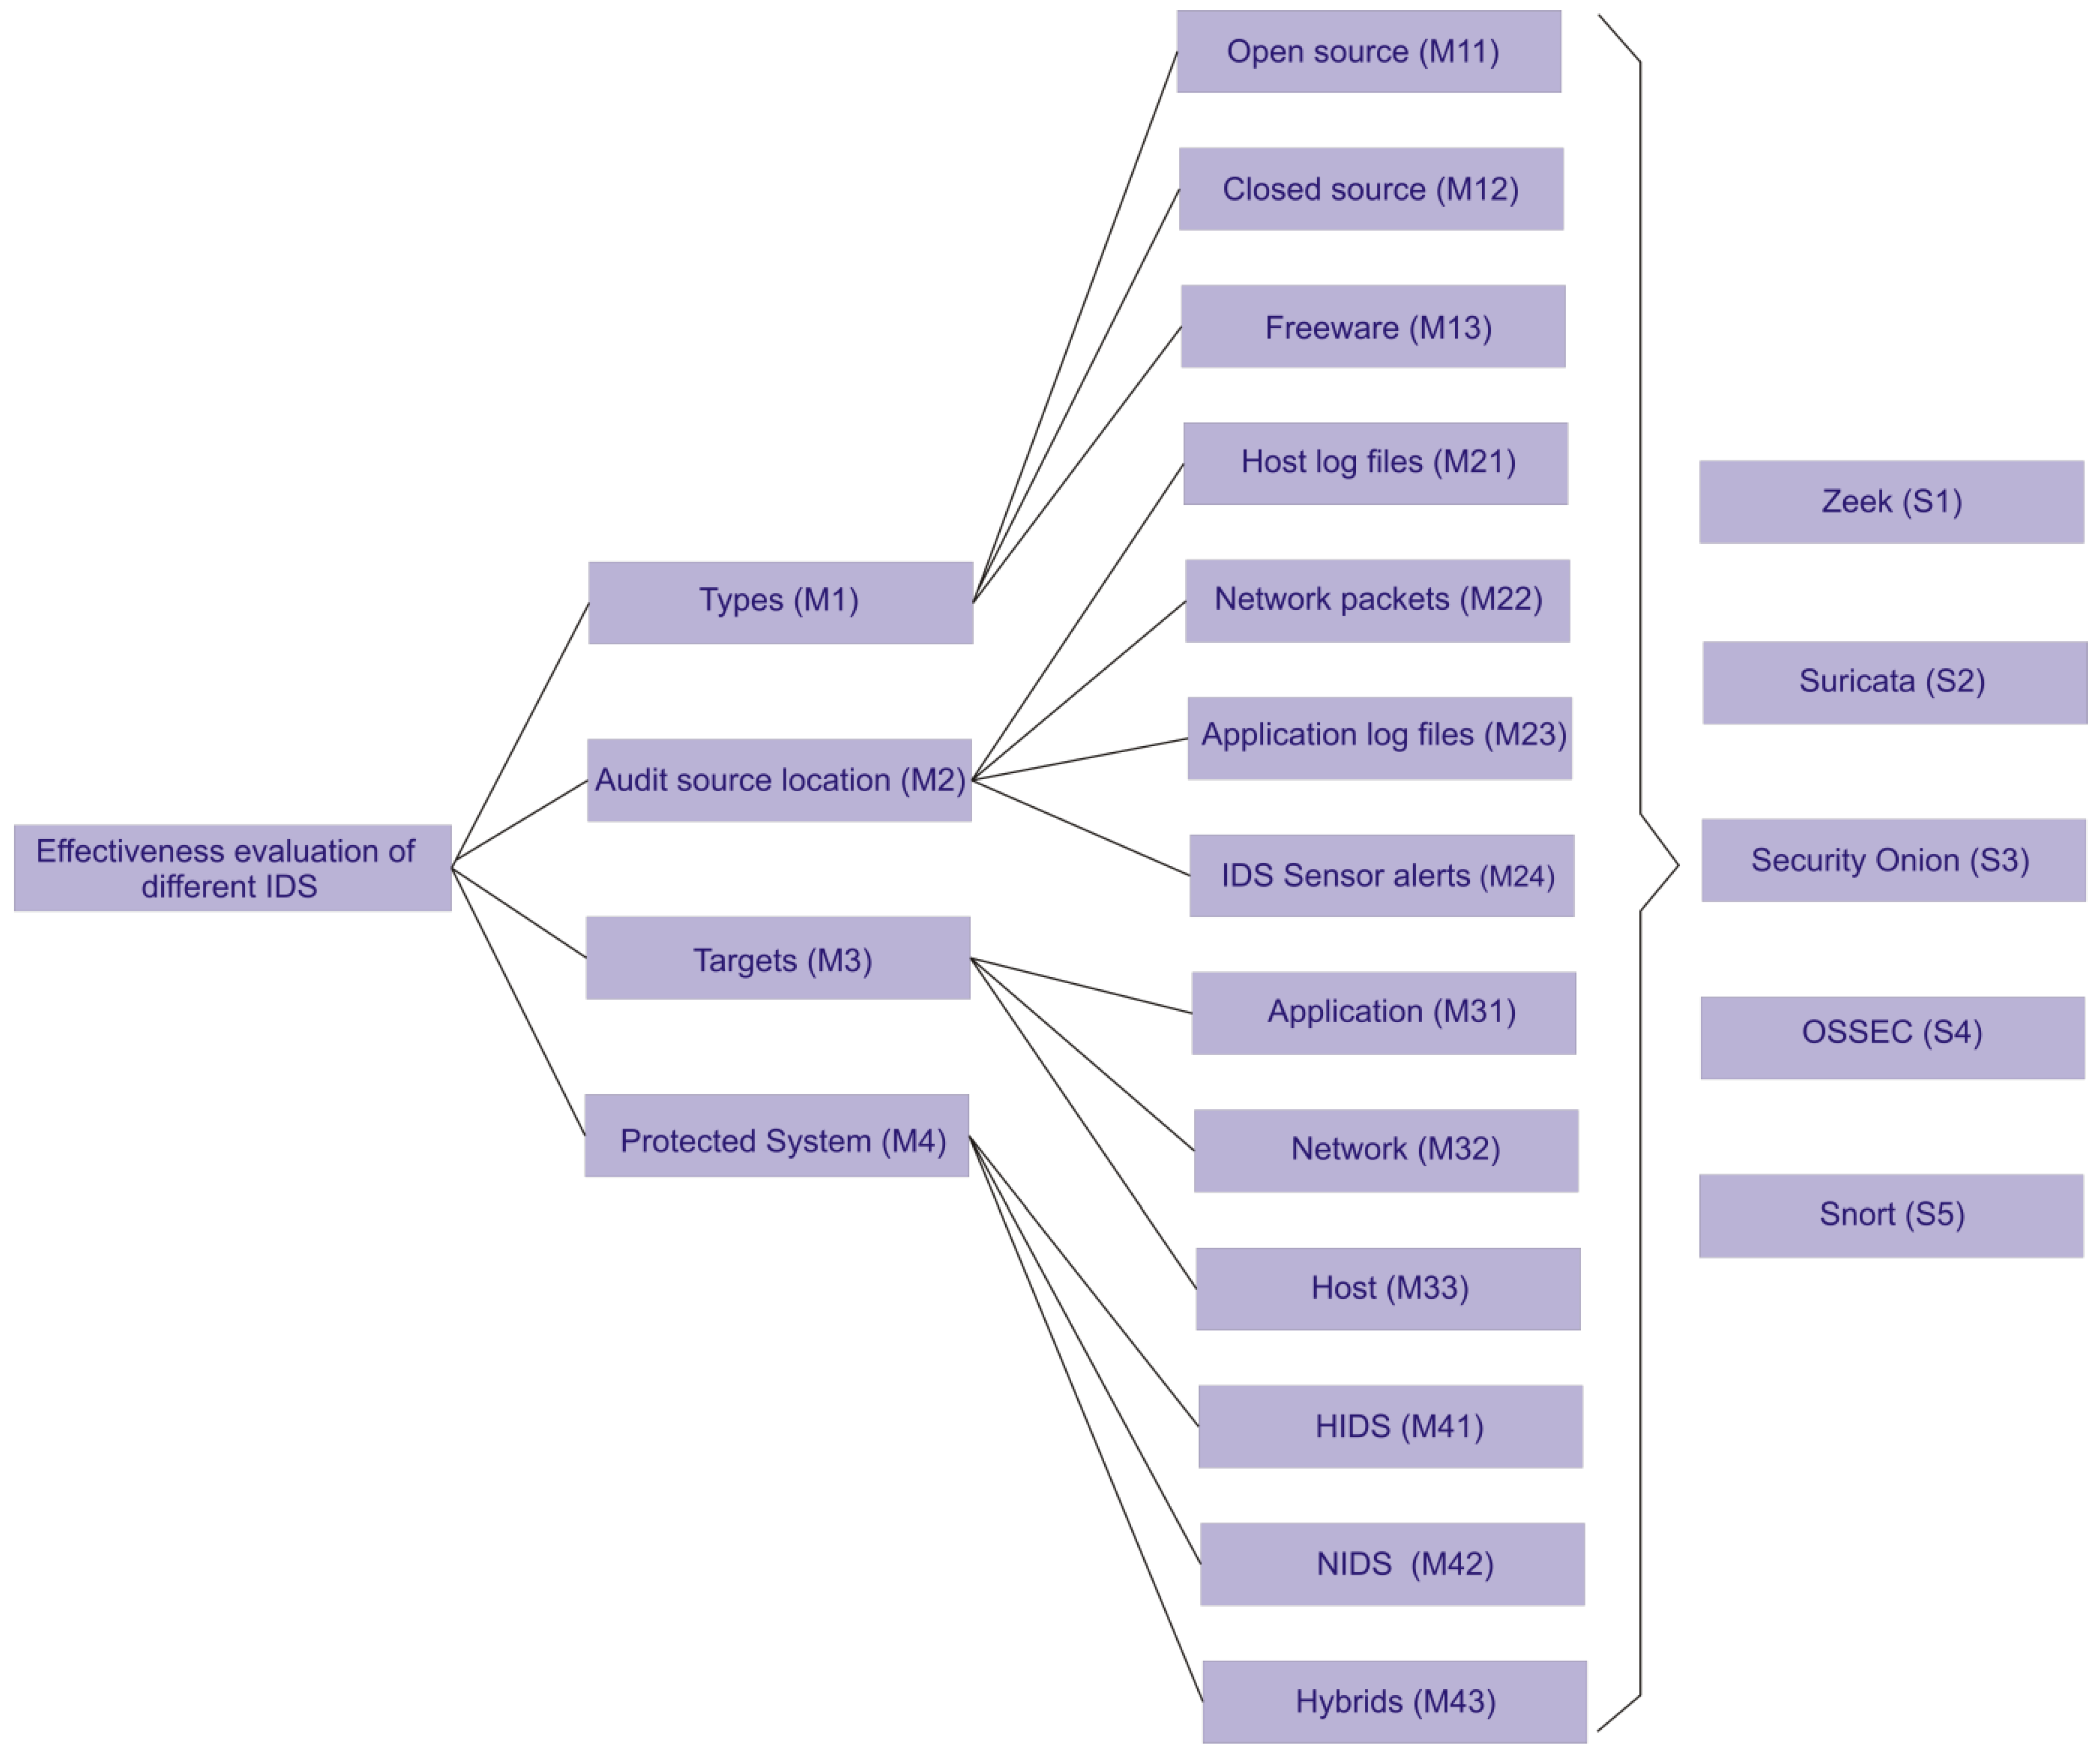
4.1. Identification of Evaluation Criteria and Alternatives
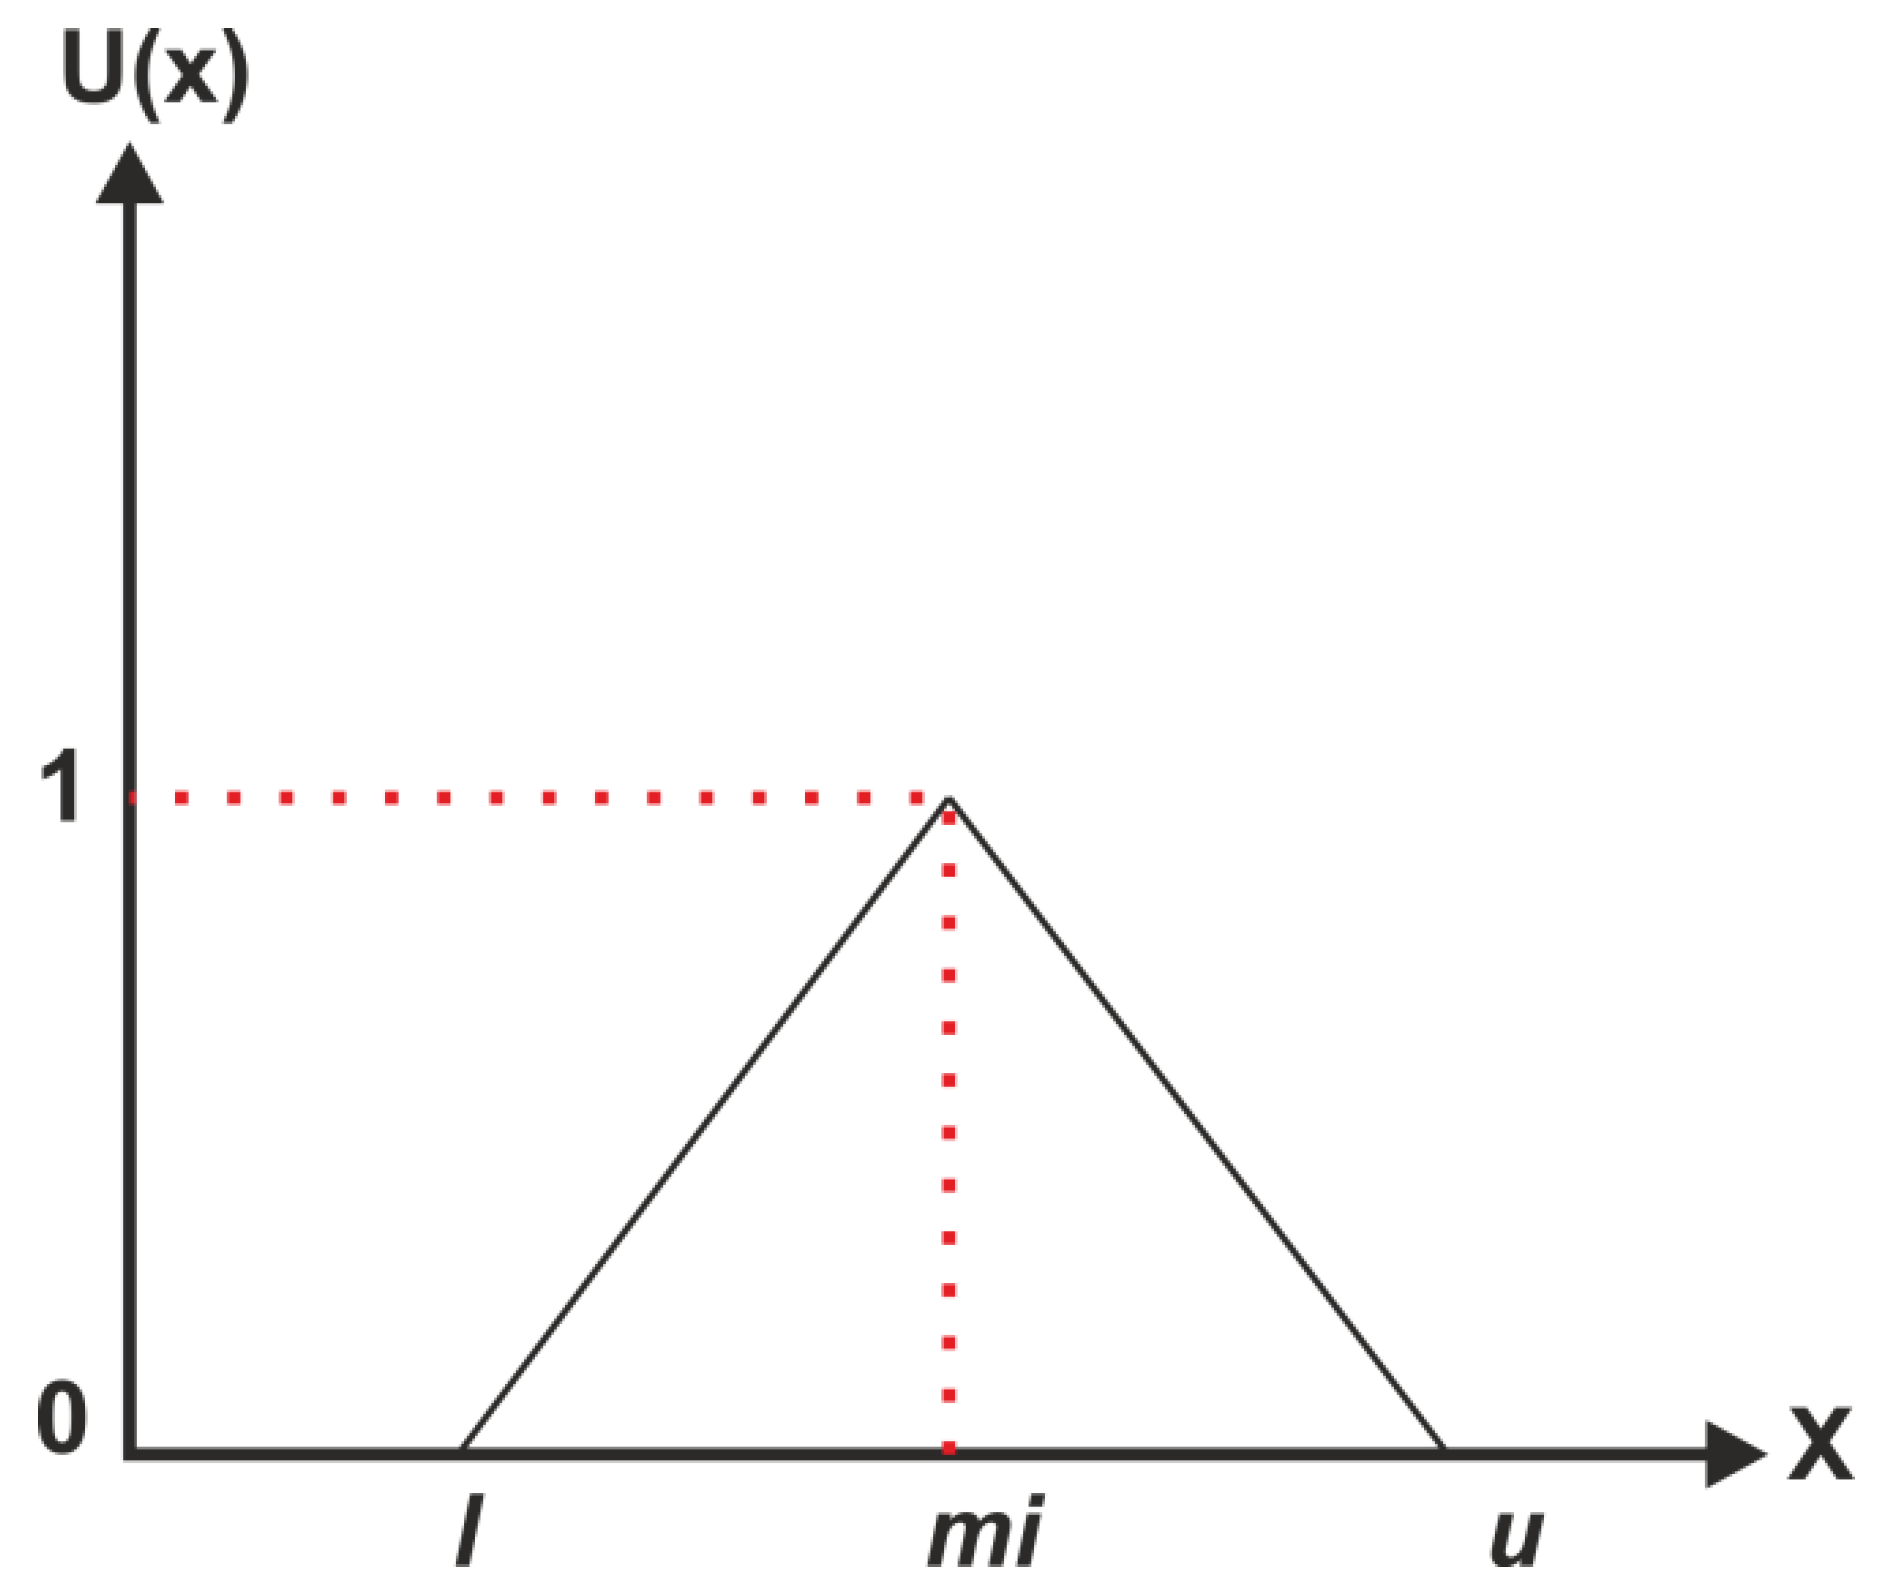
4.2. Fuzzy AHP-TOPSIS Methodology
5. Numerical Data Analysis
5.1. Statistical Findings
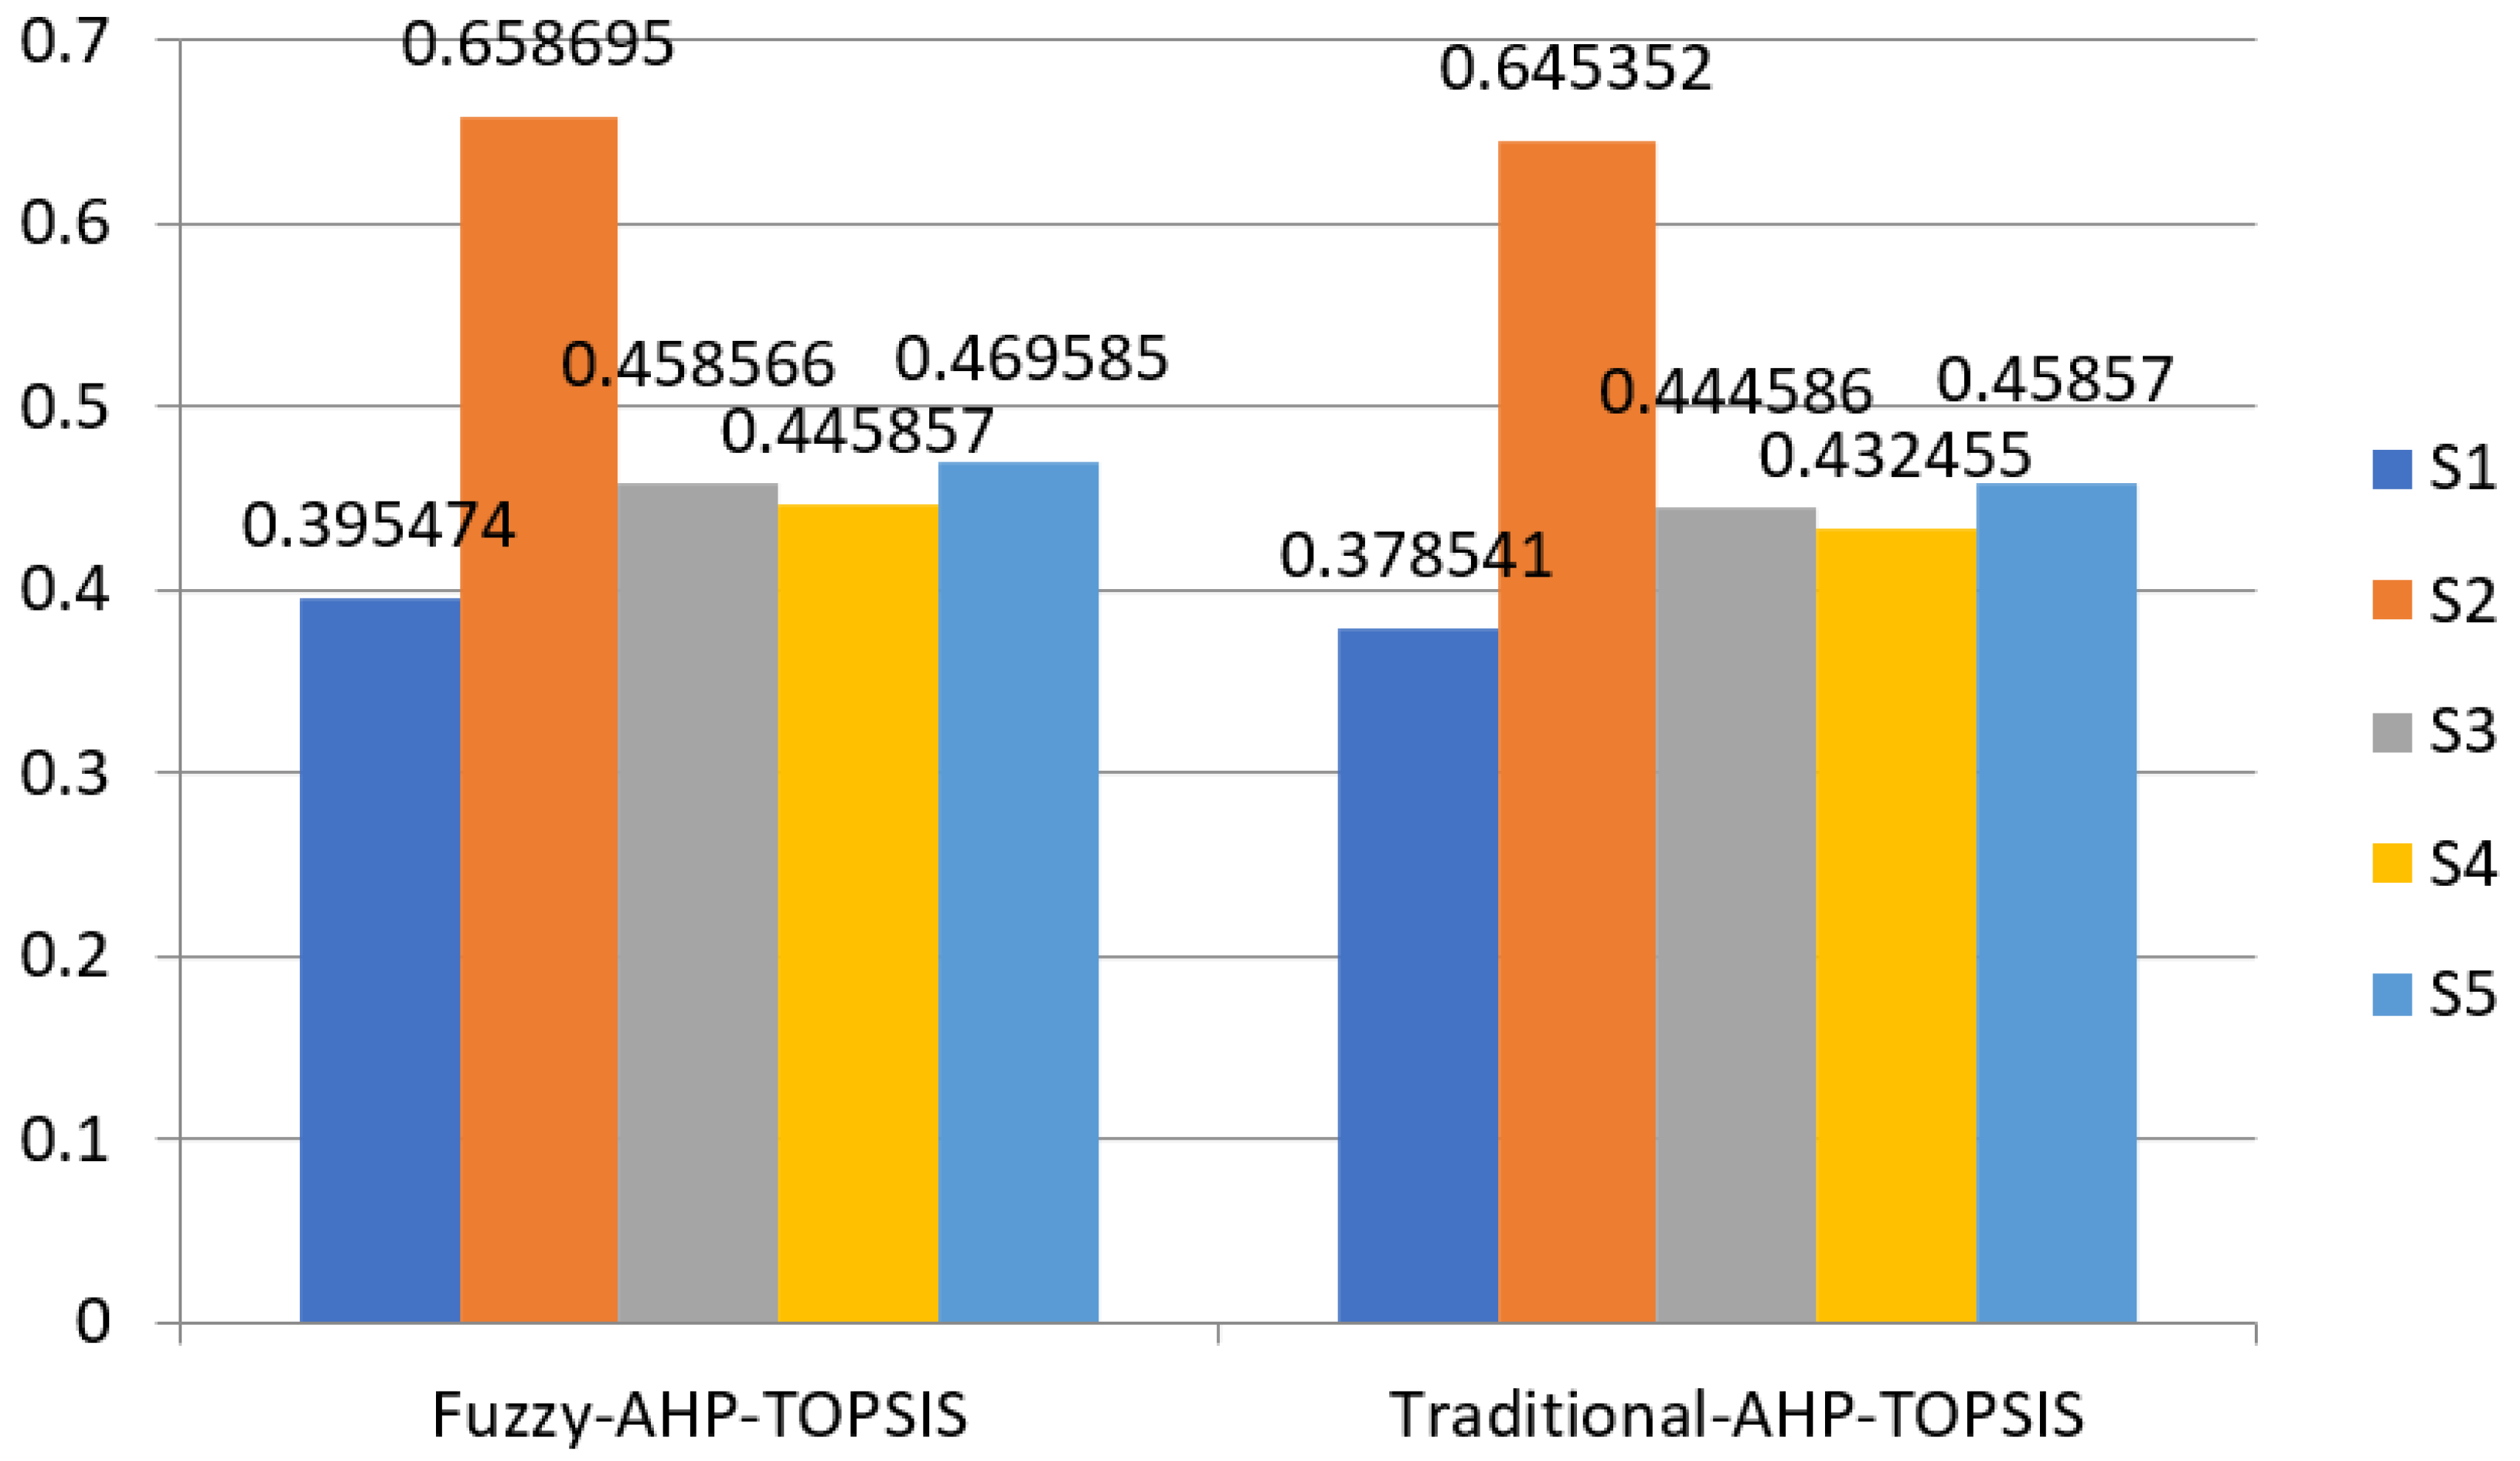
5.2. Comparative Analysis
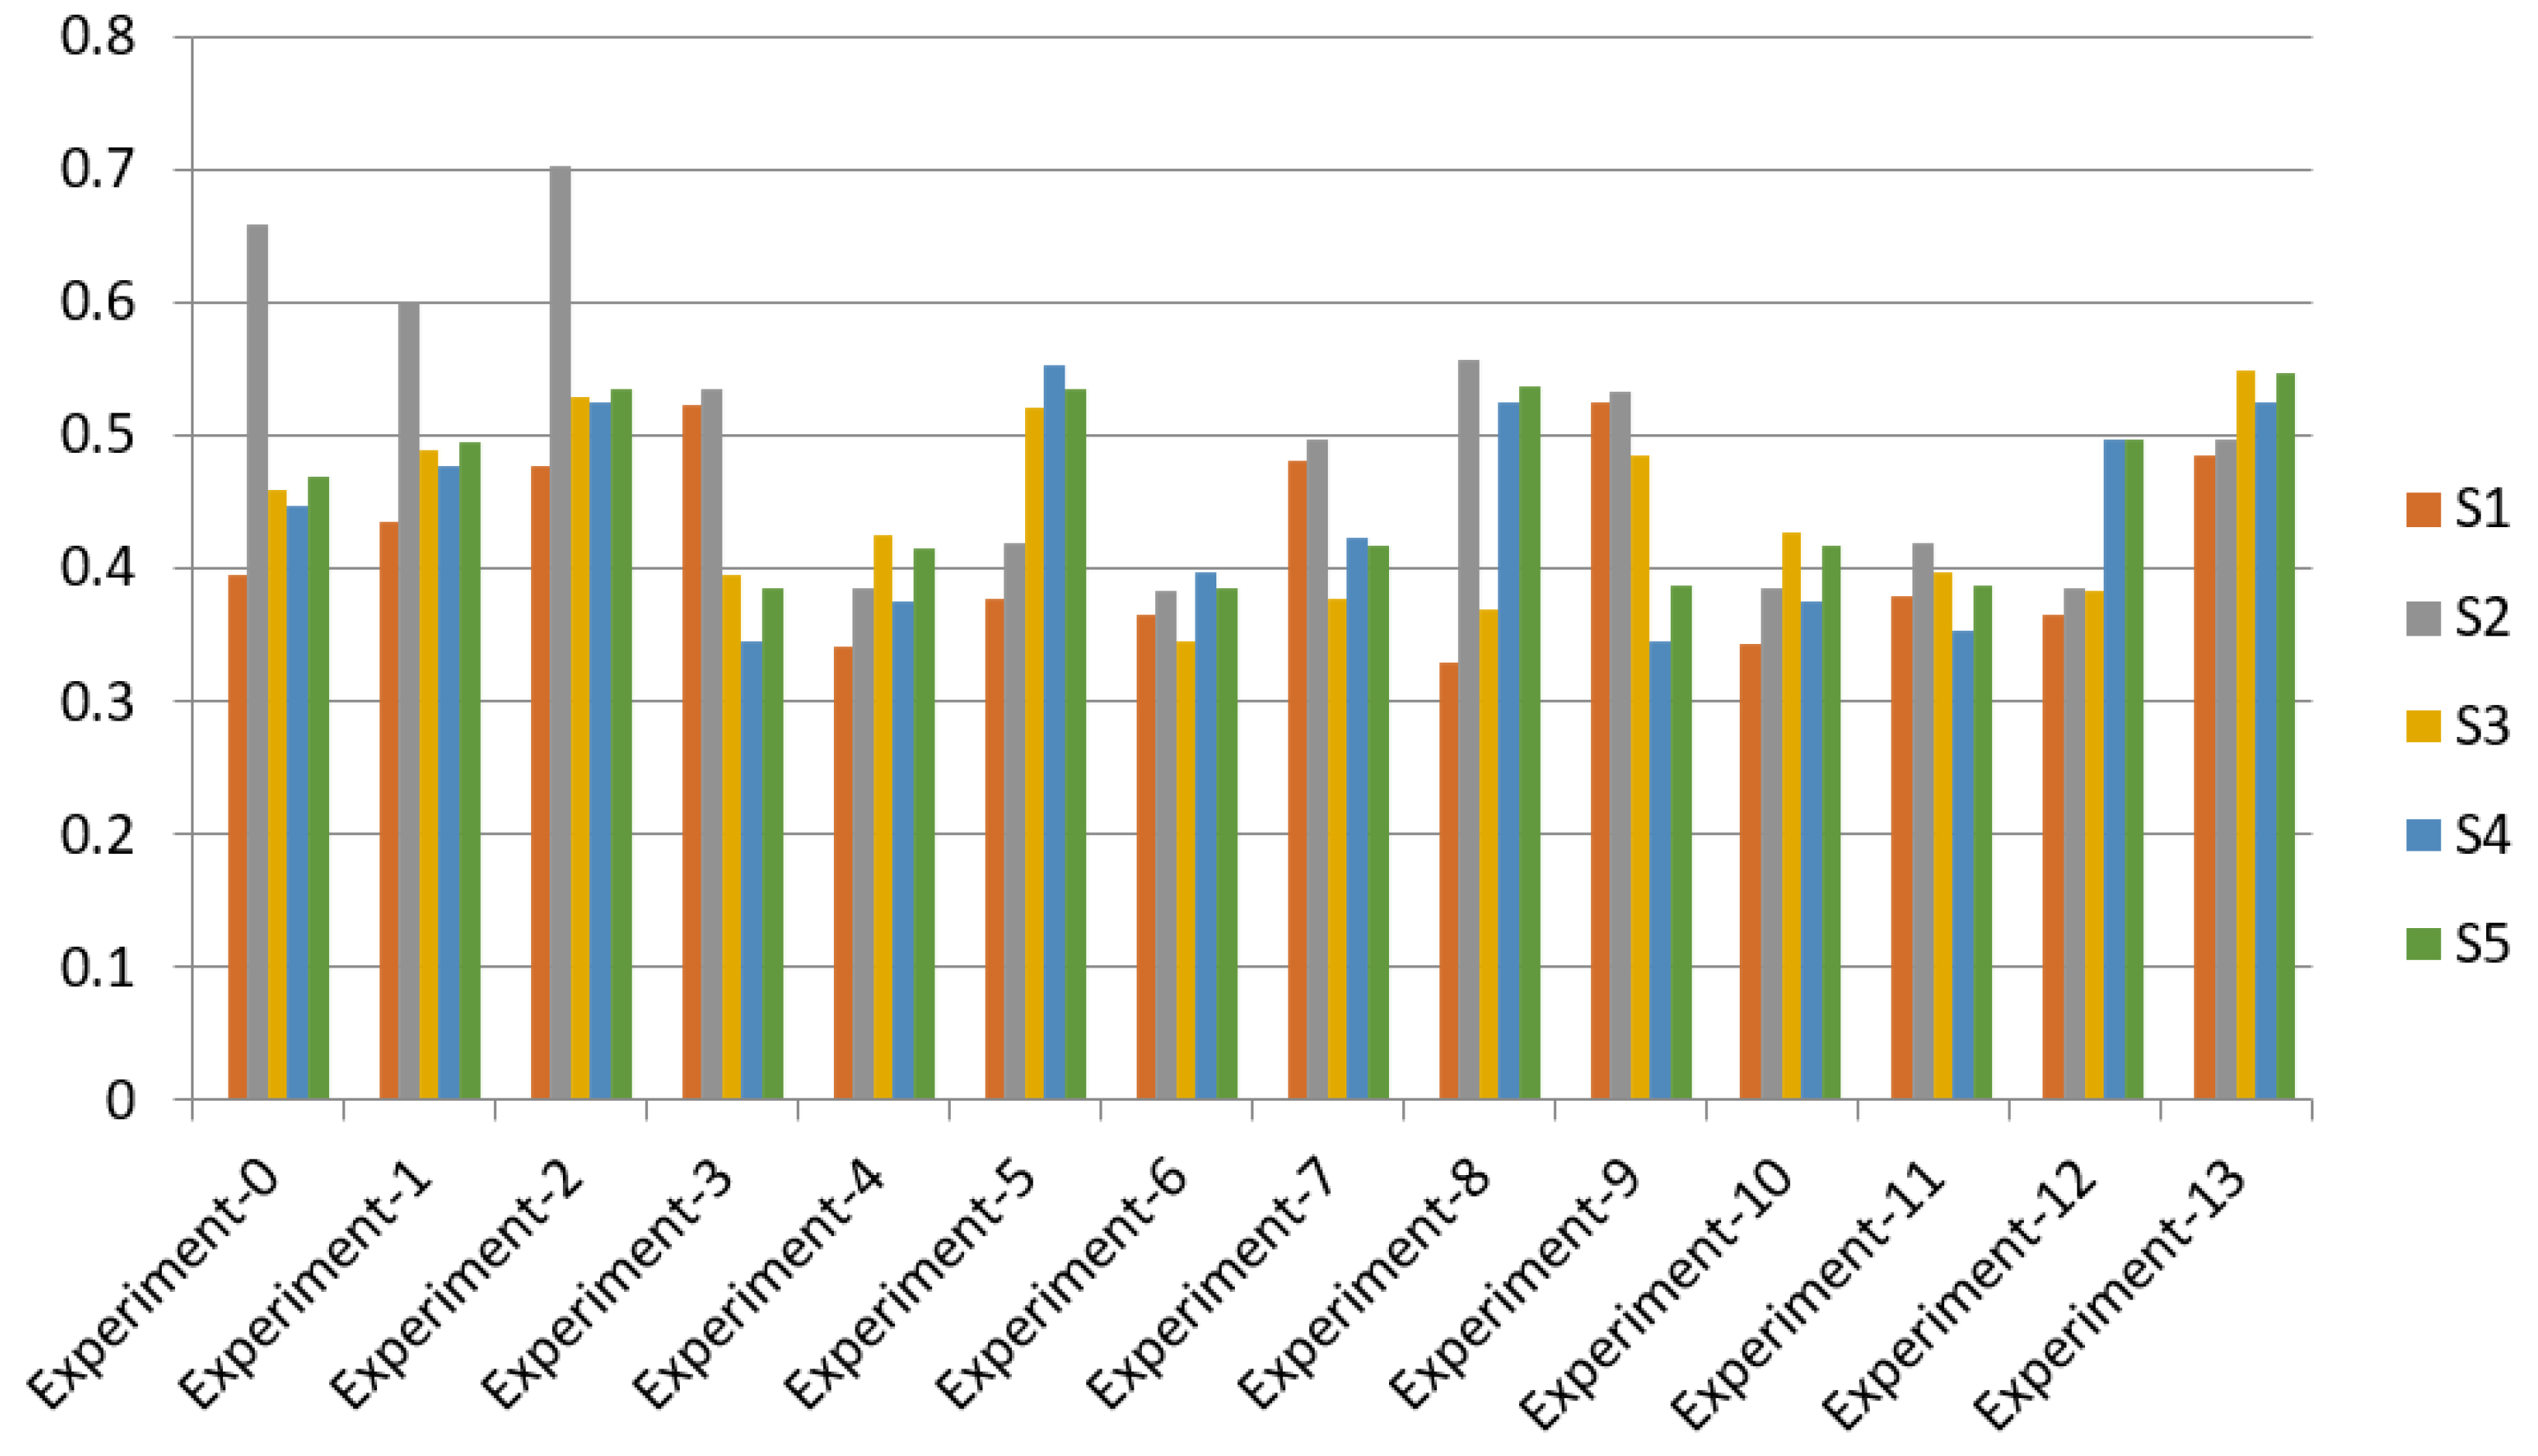
5.3. Sensitivity Analysis
6. Conclusions
Author Contributions
Funding
Acknowledgments
Conflicts of Interest
References
- Sen, S. A survey of intrusion detection systems using evolutionary computation. In Bio-Inspired Computation in Telecommunications; Morgan Kaufmann: Burlington, MA, USA, 2015; pp. 73–94. [Google Scholar]
- Ansari, M.T.J.; Pandey, D.; Alenezi, M. STORE: Security threat oriented requirements engineering methodology. J. King Saud Univ.-Comput. Inf. Sci. 2018, 34, 191–203. [Google Scholar] [CrossRef]
- Ali, M.; Shiaeles, S.; Bendiab, G.; Ghita, B. MALGRA: Machine learning and N-gram malware feature extraction and detection system. Electronics 2020, 9, 1777. [Google Scholar] [CrossRef]
- Swann, M.; Rose, J.; Bendiab, G.; Shiaeles, S.; Savage, N. A comparative study of traffic generators: Applicability for malware detection testbeds. J. Internet Technol. Secur. Trans. 2021, 8, 705–713. [Google Scholar] [CrossRef]
- Shiaeles, S.N.; Papadaki, M. FHSD: An improved IP spoof detection method for web DDoS attacks. Comput. J. 2015, 58, 892–903. [Google Scholar] [CrossRef] [Green Version]
- Ansari, T.J.; Pandey, D. An Integration of Threat Modeling with Attack Pattern and Misuse Case for Effective Security Requirement Elicitation. Int. J. Adv. Res. Comput. Sci. 2017, 8, 16–20. [Google Scholar]
- Ansari, M.T.J.; Baz, A.; Alhakami, H.; Alhakami, W.; Kumar, R.; Khan, R.A. P-STORE: Extension of STORE methodology to elicit privacy requirements. Arab. J. Sci. Eng. 2021, 46, 8287–8310. [Google Scholar] [CrossRef]
- Alosaimi, W.; Ansari, M.T.J.; Alharbi, A.; Alyami, H.; Seh, A.H.; Pandey, A.K.; Agrawal, A.; Khan, R.A. Evaluating the Impact of Different Symmetrical Models of Ambient Assisted Living Systems. Symmetry 2021, 13, 450. [Google Scholar] [CrossRef]
- Ji, H.; Wang, Y.; Qin, H.; Wang, Y.; Li, H. Comparative performance evaluation of intrusion detection methods for in-vehicle networks. IEEE Access 2018, 6, 37523–37532. [Google Scholar] [CrossRef]
- Magán-Carrión, R.; Urda, D.; Díaz-Cano, I.; Dorronsoro, B. Towards a reliable comparison and evaluation of network intrusion detection systems based on machine learning approaches. Appl. Sci. 2020, 10, 1775. [Google Scholar] [CrossRef] [Green Version]
- Hussein, S.M. Performance evaluation of intrusion detection system using anomaly and signature based algorithms to reduction false alarm rate and detect unknown attacks. In Proceedings of the 2016 International Conference on Computational Science and Computational Intelligence (CSCI), Las Vegas, NV, USA, 15–17 December 2016; pp. 1064–1069. [Google Scholar]
- Nikolopoulos, K.; Punia, S.; Schäfers, A.; Tsinopoulos, C.; Vasilakis, C. Forecasting and planning during a pandemic: COVID-19 growth rates, supply chain disruptions, and governmental decisions. Eur. J. Oper. Res. 2021, 290, 99–115. [Google Scholar] [CrossRef]
- Alhakami, W.; Binmahfoudh, A.; Baz, A.; Alhakami, H.; Ansari, M.T.J.; Khan, R.A. Atrocious Impinging of COVID-19 Pandemic on Software Development Industries. Comput. Syst. Sci. Eng. 2021, 36, 323–338. [Google Scholar] [CrossRef]
- Ansari, M.T.J.; Khan, N.A. Worldwide COVID-19 Vaccines Sentiment Analysis through Twitter Content. Electron. J. Gen. Med. 2021, 18, em329. [Google Scholar] [CrossRef]
- Attaallah, A.; Ahmad, M.; Ansari, M.T.J.; Pandey, A.K.; Kumar, R.; Khan, R.A. Device security assessment of Internet of healthcare things. Intell. Autom. Soft Comput. 2020, 27, 593–603. [Google Scholar] [CrossRef]
- Upendran, V.; Gopinath, R. Feature selection based on multi-criteria decision making for intrusion detection system. Management 2021. [Google Scholar] [CrossRef]
- Hu, Q.; Yu, S.Y.; Asghar, M.R. Analysing performance issues of open-source intrusion detection systems in high-speed networks. J. Inf. Secur. Appl. 2020, 51, 102426. [Google Scholar] [CrossRef]
- Imoize, A.L.; Oyedare, T.; Otuokere, M.E.; Shetty, S. Software intrusion detection evaluation system: A cost-based evaluation of intrusion detection capability. Commun. Netw. 2018, 10, 211–229. [Google Scholar] [CrossRef] [Green Version]
- Saber, M.; Belkasmi, M.G.; Chadli, S.; Emharraf, M.; El Farissi, I. Implementation and Performance Evaluation of Intrusion Detection Systems under high-speed networks. In Proceedings of the 2nd International Conference on Big Data, Cloud and Applications, Tetouan, Morocco, 29–30 March 2017; pp. 1–6. [Google Scholar]
- Shiaeles, S.N.; Katos, V.; Karakos, A.S.; Papadopoulos, B.K. Real time DDoS detection using fuzzy estimators. Comput. Secur. 2012, 31, 782–790. [Google Scholar] [CrossRef] [Green Version]
- Schrötter, M.; Scheffler, T.; Schnor, B. Evaluation of Intrusion Detection Systems in IPv6 Networks. In Proceedings of the 16th International Joint Conference on e-Business and Telecommunications (ICETE 2019), Prague, Czech Republic, 26–28 July 2019; pp. 408–416. [Google Scholar]
- Haas, S.; Sommer, R.; Fischer, M. Zeek-osquery: Host-network correlation for advanced monitoring and intrusion detection. In IFIP International Conference on ICT Systems Security and Privacy Protection; Springer: Cham, Switzerland, 2020; pp. 248–262. [Google Scholar]
- Paxson, V. Bro: A system for detecting network intruders in real-time. Comput. Netw. 1999, 31, 2435–2463. [Google Scholar] [CrossRef]
- Garcia-Teodoro, P.; Diaz-Verdejo, J.; Maciá-Fernández, G.; Vázquez, E. Anomaly-based network intrusion detection: Techniques, systems and challenges. Comput. Secur. 2009, 28, 18–28. [Google Scholar] [CrossRef]
- Park, W.; Ahn, S. Performance comparison and detection analysis in snort and suricata environment. Wirel. Pers. Commun. 2017, 94, 241–252. [Google Scholar] [CrossRef]
- Burks, D. Security Onion. 2012. Available online: Securityonion.blogspot.com (accessed on 17 January 2022).
- Cid, D.B. Log Analysis Using OSSEC. 2017. Available online: http://www.academia.edu/8343225/Log_Analysis_using_OSSEC (accessed on 17 January 2022).
- Anafcheh, A. Intrusion Detection with OSSEC. 2018. Available online: https://www.theseus.fi/bitstream/handle/10024/150030/ali-anafcheh-thesis.pdf?sequence=1 (accessed on 17 January 2022).
- Roesch, M. Snort: Lightweight intrusion detection for networks. In Proceedings of the LISA ’99: 13th Systems Administration Conference, Seattle, WA, USA, 7–12 November 1999; Volume 99, pp. 229–238. [Google Scholar]
- Saaty, T.L. How to make a decision: The analytic hierarchy process. Eur. J. Oper. Res. 1990, 48, 9–26. [Google Scholar] [CrossRef]
- Hwang, C.L.; Yoon, K. Methods for multiple attribute decision making. In Multiple Attribute Decision Making; Springer: Berlin/Heidelberg, Germany, 1981; pp. 58–191. [Google Scholar]
- Chen, S.J.; Hwang, C.L. Fuzzy multiple attribute decision making methods. Fuzzy Mult. Attrib. Decis. Mak. 1992, 375, 289–486. [Google Scholar]
- Ansari, M.T.J.; Al-Zahrani, F.A.; Pandey, D.; Agrawal, A. A fuzzy TOPSIS based analysis toward selection of effective security requirements engineering approach for trustworthy healthcare software development. BMC Med. Inform. Decis. Mak. 2020, 20, 236. [Google Scholar] [CrossRef] [PubMed]
- Rose, J.R.; Swann, M.; Bendiab, G.; Shiaeles, S.; Kolokotronis, N. Intrusion Detection using Network Traffic Profiling and Machine Learning for IoT. In Proceedings of the 2021 IEEE 7th International Conference on Network Softwarization (NetSoft), Tokyo, Japan, 28 June–2 July 2021; pp. 409–415. [Google Scholar] [CrossRef]
- Kumar, R.; Khan, A.I.; Abushark, Y.B.; Alam, M.M.; Agrawal, A.; Khan, R.A. An integrated approach of fuzzy logic, AHP and TOPSIS for estimating usable-security of web applications. IEEE Access 2020, 8, 50944–50957. [Google Scholar] [CrossRef]
- Kumar, R.; Khan, A.I.; Abushark, Y.B.; Alam, M.M.; Agrawal, A.; Khan, R.A. A knowledge-based integrated system of hesitant fuzzy set, ahp and topsis for evaluating security-durability of web applications. IEEE Access 2020, 8, 48870–48885. [Google Scholar] [CrossRef]
- Abushark, Y.B.; Khan, A.I.; Alsolami, F.J.; Almalawi, A.; Alam, M.M.; Agrawal, A.; Kumar, R.; Khan, R.A. Usability Evaluation through Fuzzy AHP-TOPSIS Approach: Security Requirement Perspective. CMC-Comput. Mater. Contin. 2021, 68, 1203–1218. [Google Scholar] [CrossRef]


| IDS Techniques | Provider | Type | Operating System | License | Network Traffic |
|---|---|---|---|---|---|
| Zeek | Vern Paxson | NIDS | Unix/Linux/Mac | BSD License | IPv4 |
| Suricata | OISF | NIDS | Win/Unix/Mac | GNU General Public License (version 2) | IPv4/IPv6 |
| Security Onion | Security Onion Solutions, LLC | NIDS, HIDS | Linux | GNU General Public License (version 2) | IPv4/IPv6 |
| OSSEC | Daniel B. Cid et al. | HIDS | Win/Unix/Linux/Mac | GNU General Public License (version 2) | IPv6 |
| Snort | Cisco System | NIDS | Win/Unix/Linux | GNU General Public License (version 2) | IPv4/IPv6 |
| Saaty Scale Definition | Fuzzy Triangle Scale | |
|---|---|---|
| 1 | Equally important | (1, 1, 1) |
| 3 | Weakly important | (2, 3, 4) |
| 5 | Fairly important | (4, 5, 6) |
| 7 | Strongly important | (6, 7, 8) |
| 9 | Absolutely important | (9, 9, 9) |
| 2 | Intermittent values between two adjacent scales | (1, 2, 3) |
| 4 | (3, 4, 5) | |
| 6 | (5, 6, 7) | |
| 8 | (7, 8, 9) | |
| Linguistic Variable | Corresponding Triangular Fuzzy Number |
|---|---|
| Very poor (VP) | (0, 1, 3) |
| Poor (P) | (1, 3, 5) |
| Fair (F) | (3, 5, 7) |
| Good (G) | (5, 7, 9) |
| Very good (VG) | (7, 9,10) |
| M1 | M2 | M3 | M4 | |
|---|---|---|---|---|
| M1 | 1.000000, 1.000000, 1.000000 | 1.000000, 1.515700, 1.933100 | 0.489600, 0.637200, 1.000000 | 0.415200, 0.574300, 1.000000 |
| M2 | - | 1.000000, 1.000000, 1.000000 | 0.574300, 0.665700, 0.802200 | 0.303900, 0.393600, 0.566100 |
| M3 | - | - | 1.000000, 1.000000, 1.000000 | 1.000000, 1.319500, 1.551800 |
| M4 | - | - | - | 1.000000, 1.000000, 1.000000 |
| M11 | M12 | M13 | |
|---|---|---|---|
| M11 | 1.000000, 1.000000, 1.000000 | 0.237552, 0.287963, 0.367526 | 0.342154, 0.447785, 0.824763 |
| M12 | - | 1.000000, 1.000000, 1.000000 | 0.661454, 1.172563, 1.693686 |
| M13 | - | - | 1.000000, 1.000000, 1.000000 |
| M21 | M22 | M23 | M24 | |
|---|---|---|---|---|
| M21 | 1.000000, 1.000000, 1.000000 | 0.694154, 0.895356, 1.112485 | 0.234596, 0.287864, 0.364168 | 0.711256, 0.954163, 1.351257 |
| M22 | - | 1.000000, 1.000000, 1.000000 | 0.493154, 0.642362, 1.241435 | 0.271354, 0.351565, 0.521635 |
| M23 | - | - | 1.000000, 1.000000, 1.000000 | 1.085484, 1.329762, 1.558235 |
| M24 | - | - | - | 1.000000, 1.000000, 1.000000 |
| M31 | M32 | M33 | |
|---|---|---|---|
| M31 | 1.000000, 1.000000, 1.000000 | 0.665365, 1.172384, 1.697465 | 1.157663, 1.447254, 1.704365 |
| M32 | - | 1.000000, 1.000000, 1.000000 | 1.007762, 1.524765, 1.934368 |
| M33 | - | - | 1.000000, 1.000000, 1.000000 |
| M41 | M42 | M43 | |
|---|---|---|---|
| M41 | 1.000000, 1.000000, 1.000000 | 1.197856, 1.588385, 2.156465 | 0.491541, 0.642285, 1.009958 |
| M42 | - | 1.000000, 1.000000, 1.000000 | 0.224165, 0.295684, 0.427969 |
| M43 | - | - | 1.000000, 1.000000, 1.000000 |
| M1 | M2 | M3 | M4 | Weights | |
|---|---|---|---|---|---|
| M1 | 1.000000 | 1.491200 | 0.691000 | 0.641000 | 0.214422 |
| M2 | 0.670600 | 1.000000 | 0.677000 | 0.414300 | 0.159049 |
| M3 | 1.447200 | 1.477100 | 1.000000 | 1.297700 | 0.312280 |
| M4 | 1.560100 | 2.413700 | 0.770600 | 1.000000 | 0.314249 |
| C.R.= 0.015241 | |||||
| M11 | M12 | M13 | Weights | |
|---|---|---|---|---|
| M11 | 1.000000 | 1.173540 | 0.494564 | 0.275854 |
| M12 | 0.852550 | 1.000000 | 1.172547 | 0.328627 |
| M13 | 2.024340 | 0.853545 | 1.000000 | 0.395519 |
| C.R. = 0.0488003 | ||||
| M21 | M22 | M23 | M24 | Weights | |
|---|---|---|---|---|---|
| M21 | 1.000000 | 0.892654 | 1.173554 | 0.994547 | 0.246313 |
| M22 | 1.121242 | 1.000000 | 0.691526 | 0.372546 | 0.182575 |
| M23 | 0.852562 | 1.447256 | 1.000000 | 1.298541 | 0.272112 |
| M24 | 1.006624 | 2.688354 | 0.770435 | 1.000000 | 0.299000 |
| C.R. = 0.034904 | |||||
| M31 | M32 | M33 | Weights | |
|---|---|---|---|---|
| M31 | 1.000000 | 1.172541 | 1.363652 | 0.388975 |
| M32 | 0.853345 | 1.000000 | 1.491224 | 0.355978 |
| M33 | 0.733754 | 0.670725 | 1.000000 | 0.255047 |
| C.R. = 0.002506 | ||||
| M41 | M42 | M43 | Weights | |
|---|---|---|---|---|
| M41 | 1.000000 | 1.633244 | 0.691844 | 0.322565 |
| M42 | 0.612477 | 1.000000 | 0.303457 | 0.356224 |
| M43 | 1.447247 | 3.300347 | 1.000000 | 0.321211 |
| C.R. = 0.0052045 | ||||
| Level 1 Methods | Local Weights of Level 1 | Level 2 Methods | Local Weights of Level 2 | Overall Weights | Overall Ranks |
|---|---|---|---|---|---|
| M1 | 0.214422 | M11 | 0.275854 | 0.059149 | 9 |
| M12 | 0.328627 | 0.070465 | 8 | ||
| M13 | 0.395519 | 0.084808 | 6 | ||
| M2 | 0.159049 | M21 | 0.246313 | 0.039176 | 12 |
| M22 | 0.182575 | 0.029038 | 13 | ||
| M23 | 0.272112 | 0.043279 | 11 | ||
| M24 | 0.299000 | 0.047556 | 10 | ||
| M3 | 0.312280 | M31 | 0.388975 | 0.121469 | 1 |
| M32 | 0.355978 | 0.111165 | 3 | ||
| M33 | 0.255047 | 0.079646 | 7 | ||
| M4 | 0.314249 | M41 | 0.322565 | 0.101366 | 4 |
| M42 | 0.356224 | 0.111943 | 2 | ||
| M43 | 0.321211 | 0.100940 | 5 |
| S1 | S2 | S3 | S4 | S5 | |
|---|---|---|---|---|---|
| M11 | 5.3600, 7.3006, 8.7300 | 5.5500, 7.5500, 8.9100 | 0.6400, 2.2700, 4.2700 | 5.3600, 7.3600, 8.7300 | 4.1800, 6.0900, 7.6400 |
| M12 | 3.7300, 5.5500, 7.2700 | 4.4500, 6.4500, 8.1800 | 1.6400, 3.5500, 5.5500 | 3.5500, 5.5500, 7.3600 | 5.0000, 7.0000, 8.4500 |
| M13 | 2.3600, 4.2700, 6.2700 | 5.3600, 7.3006, 8.7300 | 5.5500, 7.5500, 8.9100 | 0.6400, 2.2700, 4.2700 | 5.3600, 7.3600, 8.7300 |
| M21 | 4.8200, 6.8200, 8.5500 | 3.7300, 5.5500, 7.2700 | 4.4500, 6.4500, 8.1800 | 1.6400, 3.5500, 5.5500 | 3.5500, 5.5500, 7.3600 |
| M22 | 5.5500, 7.5005, 9.2700 | 2.3600, 4.2700, 6.2700 | 2.4500, 4.2700, 6.2700 | 1.3600, 3.3600, 5.3600 | 4.4500, 6.4500, 8.1800 |
| M23 | 4.2700, 6.2700, 8.1800 | 4.8200, 6.8200, 8.5500 | 4.6400, 6.6400, 8.5500 | 0.8200, 2.6400, 4.6400 | 4.4500, 6.4500, 8.2700 |
| M24 | 5.3600, 7.3006, 8.7300 | 5.5500, 7.5500, 8.9100 | 0.6400, 2.2700, 4.2700 | 5.3600, 7.3600, 8.7300 | 5.7300, 7.7300, 9.2700 |
| M31 | 3.7300, 5.5500, 7.2700 | 5.3600, 7.3006, 8.7300 | 5.5500, 7.5500, 8.9100 | 0.6400, 2.2700, 4.2700 | 5.3600, 7.3600, 8.7300 |
| M32 | 2.3600, 4.2700, 6.2700 | 3.7300, 5.5500, 7.2700 | 4.4500, 6.4500, 8.1800 | 1.6400, 3.5500, 5.5500 | 3.5500, 5.5500, 7.3600 |
| M33 | 5.3600, 7.3006, 8.7300 | 5.5500, 7.5500, 8.9100 | 0.6400, 2.2700, 4.2700 | 5.3600, 7.3600, 8.7300 | 4.4500, 6.4500, 8.1800 |
| M41 | 3.7300, 5.5500, 7.2700 | 4.4500, 6.4500, 8.1800 | 1.6400, 3.5500, 5.5500 | 3.5500, 5.5500, 7.3600 | 4.4500, 6.4500, 8.2700 |
| M42 | 2.3600, 4.2700, 6.2700 | 2.4500, 4.2700, 6.2700 | 1.3600, 3.3600, 5.3600 | 4.4500, 6.4500, 8.1800 | 5.7300, 7.7300, 9.2700 |
| M43 | 4.8200, 6.8200, 8.5500 | 4.6400, 6.6400, 8.5500 | 0.8200, 2.6400, 4.6400 | 4.4500, 6.4500, 8.2700 | 5.1800, 7.1800, 8.8200 |
| S1 | S2 | S3 | S4 | S5 | |
|---|---|---|---|---|---|
| M11 | 0.3800, 0.6000, 0.8000 | 0.5400, 0.7500, 0.9200 | 0.5200, 0.7400, 0.9300 | 0.4200, 0.6900, 0.9900 | 0.5200, 0.7400, 0.9400 |
| M12 | 0.5200, 0.7400, 0.9400 | 0.3800, 0.6000, 0.8000 | 0.5400, 0.7500, 0.9200 | 0.5200, 0.7400, 0.9300 | 0.4200, 0.6900, 0.9900 |
| M13 | 0.3800, 0.6000, 0.8000 | 0.5200, 0.7400, 0.9400 | 0.5400, 0.7500, 0.9200 | 0.5200, 0.7400, 0.9200 | 0.2000, 0.4700, 0.7700 |
| M21 | 0.3800, 0.6000, 0.8000 | 0.5400, 0.7500, 0.9200 | 0.5200, 0.7400, 0.9300 | 0.4200, 0.6900, 0.9900 | 0.5400, 0.7500, 0.9400 |
| M22 | 0.5200, 0.7400, 0.9400 | 0.3800, 0.6000, 0.8000 | 0.5400, 0.7500, 0.9200 | 0.5200, 0.7400, 0.9300 | 0.4200, 0.6900, 0.9900 |
| M23 | 0.3800, 0.6000, 0.8000 | 0.5200, 0.7400, 0.9400 | 0.5400, 0.7500, 0.9200 | 0.5200, 0.7400, 0.9200 | 0.2000, 0.4700, 0.7700 |
| M24 | 0.3800, 0.6000, 0.8000 | 0.5400, 0.7500, 0.9200 | 0.5200, 0.7400, 0.9300 | 0.4200, 0.6900, 0.9900 | 0.5400, 0.7500, 0.9400 |
| M31 | 0.5200, 0.7400, 0.9400 | 0.3800, 0.6000, 0.8000 | 0.5400, 0.7500, 0.9200 | 0.5200, 0.7400, 0.9300 | 0.4200, 0.6900, 0.9900 |
| M32 | 0.3800, 0.6000, 0.8000 | 0.5200, 0.7400, 0.9400 | 0.5400, 0.7500, 0.9200 | 0.5200, 0.7400, 0.9200 | 0.2000, 0.4700, 0.7700 |
| M33 | 0.3800, 0.6000, 0.8000 | 0.5400, 0.7500, 0.9200 | 0.5200, 0.7400, 0.9300 | 0.4200, 0.6900, 0.9900 | 0.5400, 0.7500, 0.9400 |
| M41 | 0.5200, 0.7400, 0.9400 | 0.5400, 0.7500, 0.9200 | 0.3800, 0.6000, 0.8000 | 0.5400, 0.7500, 0.9200 | 0.5200, 0.7400, 0.9300 |
| M42 | 0.3800, 0.6000, 0.8000 | 0.3500, 0.5800, 0.8100 | 0.5200, 0.7400, 0.9400 | 0.5400, 0.7500, 0.9200 | 0.5200, 0.7400, 0.9200 |
| M43 | 0.5200, 0.7400, 0.9200 | 0.4600, 0.6700, 0.8600 | 0.3800, 0.6000, 0.8000 | 0.3500, 0.5800, 0.8100 | 0.4200, 0.6900, 0.9900 |
| S1 | S2 | S3 | S4 | S5 | |
|---|---|---|---|---|---|
| M11 | 0.00000, 0.00200, 0.00900 | 0.00200, 0.00700, 0.02200 | 0.00200, 0.00700, 0.02400 | 0.00100, 0.00500, 0.01800 | 0.00300, 0.01100, 0.03600 |
| M12 | 0.00300, 0.01200, 0.04100 | 0.00000, 0.00200, 0.00900 | 0.00200, 0.00700, 0.02200 | 0.00200, 0.00700, 0.02400 | 0.00100, 0.00500, 0.01800 |
| M13 | 0.00300, 0.01200, 0.04200 | 0.00300, 0.01200, 0.04100 | 0.00300, 0.01200, 0.04100 | 0.00500, 0.01600, 0.04800 | 0.00500, 0.01600, 0.04900 |
| M21 | 0.00000, 0.00200, 0.00900 | 0.00200, 0.00700, 0.02200 | 0.00200, 0.00700, 0.02400 | 0.00100, 0.00500, 0.01800 | 0.00200, 0.00900, 0.03800 |
| M22 | 0.00300, 0.01200, 0.04100 | 0.00000, 0.00200, 0.00900 | 0.00200, 0.00700, 0.02200 | 0.00200, 0.00700, 0.02400 | 0.00100, 0.00500, 0.01800 |
| M23 | 0.00300, 0.01200, 0.04200 | 0.00300, 0.01200, 0.04100 | 0.00300, 0.01200, 0.04100 | 0.00500, 0.01600, 0.04800 | 0.00500, 0.01600, 0.04900 |
| M24 | 0.00000, 0.00200, 0.00900 | 0.00000, 0.00200, 0.00900 | 0.00200, 0.00700, 0.02200 | 0.00200, 0.00700, 0.02400 | 0.00100, 0.00500, 0.01800 |
| M31 | 0.00300, 0.01200, 0.04100 | 0.00300, 0.01200, 0.04100 | 0.00300, 0.01200, 0.04100 | 0.00500, 0.01600, 0.04800 | 0.00500, 0.01600, 0.04900 |
| M32 | 0.00000, 0.00200, 0.00900 | 0.00000, 0.00200, 0.00900 | 0.00200, 0.00700, 0.02200 | 0.00200, 0.00700, 0.02400 | 0.00100, 0.00500, 0.01800 |
| M33 | 0.00300, 0.01200, 0.04100 | 0.00300, 0.01200, 0.04100 | 0.00300, 0.01200, 0.04100 | 0.00500, 0.01600, 0.04800 | 0.00500, 0.01600, 0.04900 |
| M41 | 0.00000, 0.00200, 0.00900 | 0.00200, 0.00700, 0.02200 | 0.00200, 0.00700, 0.02400 | 0.00100, 0.00500, 0.01800 | 0.00200, 0.00900, 0.03800 |
| M42 | 0.00300, 0.01200, 0.04100 | 0.00300, 0.01200, 0.04100 | 0.00500, 0.01600, 0.04800 | 0.00500, 0.01600, 0.04900 | 0.00100, 0.00500, 0.01800 |
| M43 | 0.00300, 0.01200, 0.04200 | 0.00300, 0.01200, 0.04200 | 0.00200, 0.01000, 0.03700 | 0.00200, 0.00900, 0.03800 | 0.00100, 0.00500, 0.01800 |
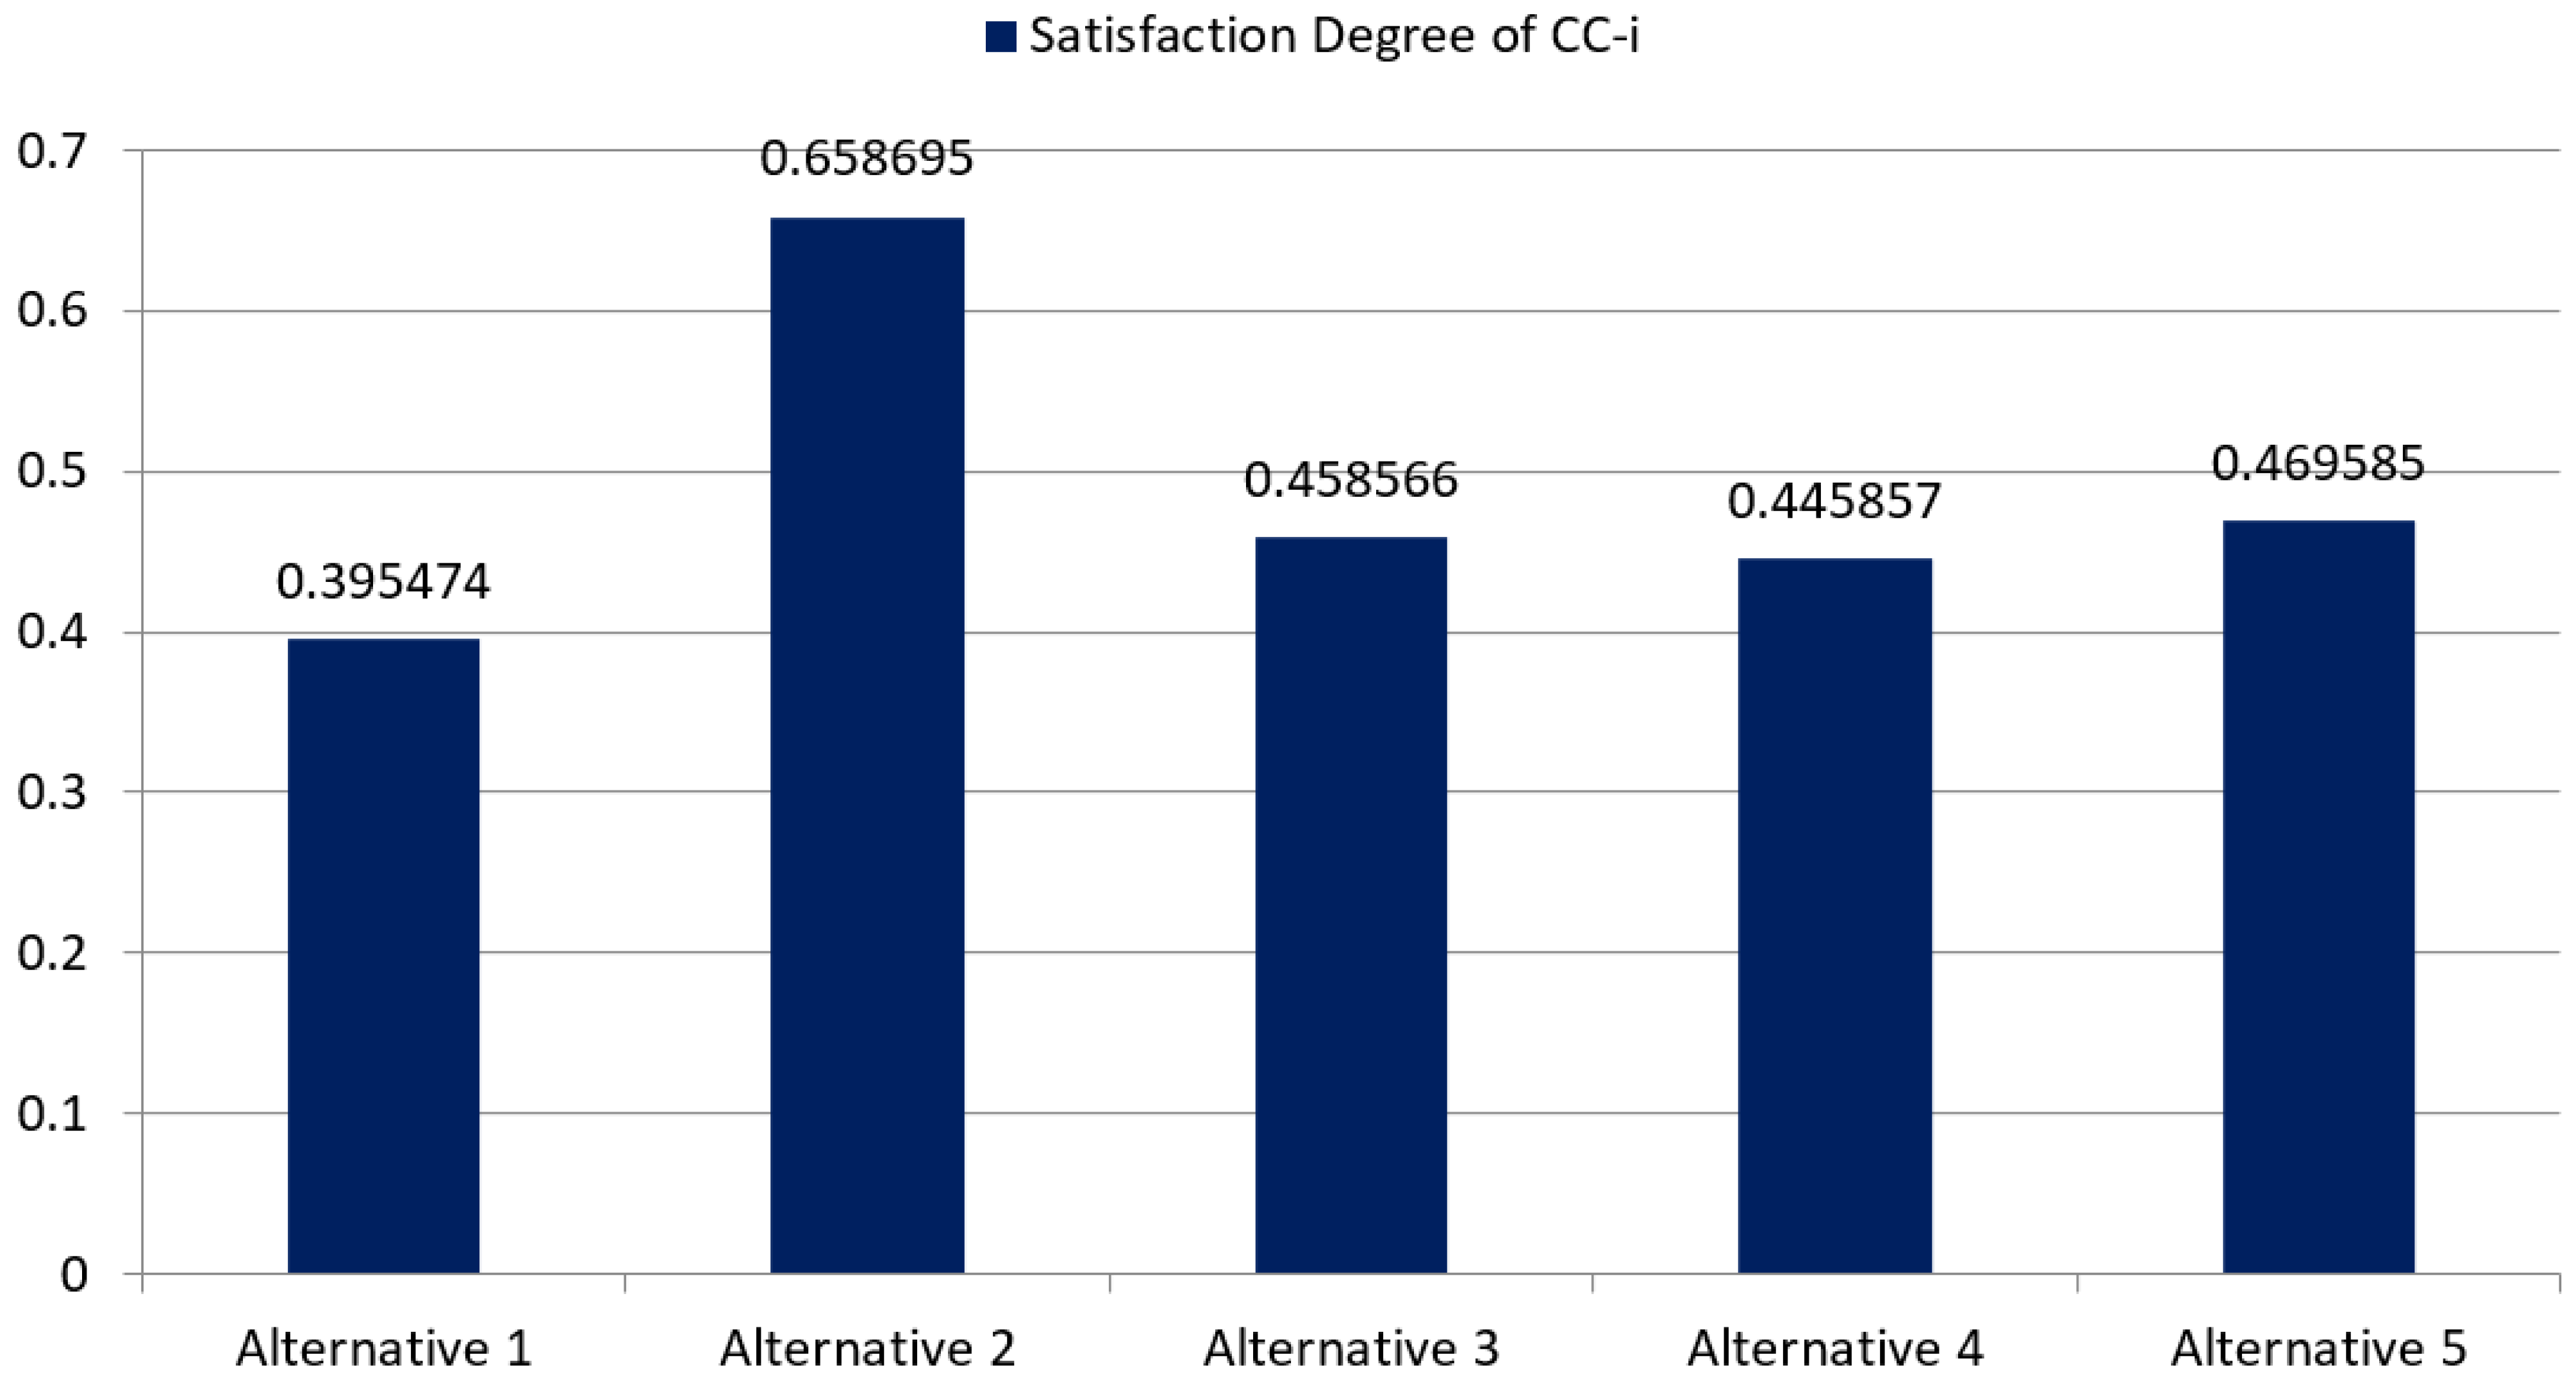
| Alternatives | d + i | d − i | Gap Degree of CC+i | Satisfaction Degree of CC-i | |
|---|---|---|---|---|---|
| Alternative 1 | S1 | 0.0452564 | 0.0556547 | 0.6235652 | 0.3954740 |
| Alternative 2 | S2 | 0.0564554 | 0.0353625 | 0.3655474 | 0.6586950 |
| Alternative 3 | S3 | 0.0475458 | 0.0555474 | 0.5695857 | 0.4585660 |
| Alternative 4 | S4 | 0.0453567 | 0.0463562 | 0.4685745 | 0.4458570 |
| Alternative 5 | S5 | 0.0452265 | 0.0425555 | 0.4536652 | 0.4695850 |
| Methods/Alternatives | S1 | S2 | S3 | S4 | S5 |
|---|---|---|---|---|---|
| Fuzzy-AHP-TOPSIS | 0.3954740 | 0.6586950 | 0.4585660 | 0.4458570 | 0.4695850 |
| Traditional-AHP-TOPSIS | 0.3785410 | 0.6453520 | 0.4445860 | 0.4324550 | 0.4585700 |
| Experiments | Weights/Alternatives | S1 | S2 | S3 | S4 | S5 | |
|---|---|---|---|---|---|---|---|
| Experiment-0 | Original Weights | Satisfaction Degree (CC-i) | 0.3954740 | 0.6586950 | 0.4585660 | 0.4458570 | 0.4695850 |
| Experiment-1 | M11 | 0.4354254 | 0.6012524 | 0.4895685 | 0.4775474 | 0.4956526 | |
| Experiment-2 | M12 | 0.4765285 | 0.7025652 | 0.5285657 | 0.5245412 | 0.5346525 | |
| Experiment-3 | M13 | 0.5225365 | 0.5345474 | 0.3952653 | 0.3457425 | 0.3858547 | |
| Experiment-4 | M21 | 0.3412524 | 0.3855268 | 0.4245623 | 0.3756352 | 0.4152334 | |
| Experiment-5 | M22 | 0.3778569 | 0.4184759 | 0.5212542 | 0.5526354 | 0.5348549 | |
| Experiment-6 | M23 | 0.3645256 | 0.3832654 | 0.3452635 | 0.3965875 | 0.3856368 | |
| Experiment-7 | M24 | 0.4800215 | 0.4976965 | 0.3776538 | 0.4236587 | 0.4165365 | |
| Experiment-8 | M31 | 0.3285452 | 0.5563598 | 0.3685659 | 0.5252635 | 0.5363524 | |
| Experiment-9 | M32 | 0.5256356 | 0.5332654 | 0.4856965 | 0.3452635 | 0.3863897 | |
| Experiment-10 | M33 | 0.3436352 | 0.3853652 | 0.4276566 | 0.3753416 | 0.4163526 | |
| Experiment-11 | M41 | 0.3785695 | 0.4183265 | 0.3965235 | 0.3535277 | 0.3863524 | |
| Experiment-12 | M42 | 0.3645758 | 0.3852653 | 0.3838574 | 0.4965352 | 0.4963564 | |
| Experiment-13 | M43 | 0.4856365 | 0.4963526 | 0.5485684 | 0.5254291 | 0.5458473 |
Publisher’s Note: MDPI stays neutral with regard to jurisdictional claims in published maps and institutional affiliations. |
© 2022 by the authors. Licensee MDPI, Basel, Switzerland. This article is an open access article distributed under the terms and conditions of the Creative Commons Attribution (CC BY) license (https://creativecommons.org/licenses/by/4.0/).
Share and Cite
Alyami, H.; Ansari, M.T.J.; Alharbi, A.; Alosaimi, W.; Alshammari, M.; Pandey, D.; Agrawal, A.; Kumar, R.; Khan, R.A. Effectiveness Evaluation of Different IDSs Using Integrated Fuzzy MCDM Model. Electronics 2022, 11, 859. https://doi.org/10.3390/electronics11060859
Alyami H, Ansari MTJ, Alharbi A, Alosaimi W, Alshammari M, Pandey D, Agrawal A, Kumar R, Khan RA. Effectiveness Evaluation of Different IDSs Using Integrated Fuzzy MCDM Model. Electronics. 2022; 11(6):859. https://doi.org/10.3390/electronics11060859
Chicago/Turabian StyleAlyami, Hashem, Md Tarique Jamal Ansari, Abdullah Alharbi, Wael Alosaimi, Majid Alshammari, Dhirendra Pandey, Alka Agrawal, Rajeev Kumar, and Raees Ahmad Khan. 2022. "Effectiveness Evaluation of Different IDSs Using Integrated Fuzzy MCDM Model" Electronics 11, no. 6: 859. https://doi.org/10.3390/electronics11060859