Review

On the Treatment and Diagnosis of Attention Deficit Hyperactivity Disorder with EEG Assistance

Institute of Computer Technology, TU Vienna, Gußhausstraße 27–29, 1040 Vienna, Austria
*
Author to whom correspondence should be addressed.
Electronics 2022, 11(4), 606; https://doi.org/10.3390/electronics11040606
Submission received: 15 December 2021 / Revised: 4 February 2022 / Accepted: 7 February 2022 / Published: 16 February 2022
(This article belongs to the Special Issue New Technologies for Biomedical Circuits and Systems)

Abstract

:
Attention deficit hyperactivity disorder (ADHD) is a mental disorder most notable in children. The disease may affect the ability to focus and cause a physical and mental restlessness and risky behavior. Recommended treatment consists of stimulant administration and behavioral therapy. However, medicating children is problematic since there are indications that brain development is affected by ADHD medication agents. Therefore, behavioral therapy is the preferred approach in ADHD treatment for children. In order to monitor and optimize the success of such behavioral therapies, neuro-feedback methods can be used. The most notable technology used in such methods is Electroencephalography (EEG). In this article, an overview of the pathology of ADHD, EEG and its usage as a diagnostic and therapeutic tool in the context of ADHD is given. Based on that knowledge, novel EEG measurement modes, new development principles, and system on chip implementations are presented and discussed.

1. Introduction

According to the International Statistical Classification of Diseases Related Health Problems (ICD10) catalog in its tenth revision [1], ADHD is classified as a “behavioral and emotional disorder with onset usually occurring in childhood and adolescence”. The Diagnostic and Statistical Manual of Mental Disorders V (DSM-5) catalog [2] provides a similar definition. Still, when applying DSM5 criteria, ADHD is three times more likely to be diagnosed compared to ICD10 [3,4]. This circumstance suggests that ADHD is an unspecific disease, which is not yet fully understood and still requires research. In particular, the concrete pathology of the disease is only vaguely discovered. This leads to the diagnosis being more of a qualitative nature rather than relying on physiological metrics, such as features extracted from EEG. Efficient therapy, however, requires a concise method of diagnosis in order to be able to choose the right medication, track disease progress, visualize therapy progress, and learn more about the disease in general.
Recent advances in the electronics domain, and particularly wearable devices, have led to unprecedented access to physiological data. Wearable devices are used in many applications, such as well-being and sport activities [5,6,7], physical health [8,9,10,11,12,13,14], and mental health [5,7,15,16]. These advanced devices provide access to a vast amount of data, which can be processed to improve the efficiency of therapy. In the case of ADHD, the data collected by EEG are the most relevant and have the potential to improve the therapy and diagnosis of this disease. This paper provides an overview of major topics that have to be understood to be able to comprehend how electronics, particularly systems on chips, can improve the therapy and diagnosis of ADHD. We focus on ease of application, cost, and accuracy.
Section 2 presents the current understanding of the ADHD disease. After that, in Section 3, a short excursus is taken to the principles of EEG. Combining the knowledge delivered in Section 2 and Section 3, Section 4 shows how ADHD can be diagnosed with EEG. Recent developments in the systems-on-chip domain and their application in ADHD diagnosis and therapy are then presented in Section 5. Finally, the paper is concluded in Section 6.

2. Pathology of ADHD

Since it is a subject of public discussion, ADHD faces a multitude of professional and amateurish views. Some opinions suggest that ADHD should not be seen as a disease but as a deviation of socially accepted behavior [17,18]. However, several scientific publications [19,20,21] define ADHD as a neurodevelopment disease, which manifests itself mostly in childhood. According to these publications, the disorder is characterized by (for the specific age of the person) inappropriate levels of overactivity, inattention, and impulsiveness. The meta-study conducted by [22] states a prevalence of 3.4% in all children, while [23] suggests a percentage of 1.4%.
Diagnosis of ADHD is difficult, partially because its presence is often accompanied by other mental disorders [24,25,26]. Additionally, the occurrence of the disorder is not connectable to single bio-markers, such as a sole defective gene [27]. The most significant circumstance for the lack of a concise ADHD diagnosis is the limited knowledge about the brain mechanisms that lead to the disease. Animal models suggest that impairments in some brain signal transmission processes lead to the symptoms of ADHD [28,29]. However, it is not yet completely clear to what extent those animal models can be translated to humans [19]. In order to achieve at least a minimum level of consensus and comparability between cases, standardized criteria are used to determine if a patient is affected by ADHD. Popular instances of such criteria are classifications systems, such as DSM5 or ICD10. For example, a positive diagnosis via DSM5 requires the patient to show at least six of the behaviors described in Listing 1 from either the “Inattentive symptoms” or “Hyperactivity or impulsivity symptoms” sections. The patient must not be older than the age of 16, and the symptoms have to have appeared before the age of 12. Additionally, the symptoms must not be better described by other diseases. The experienced symptoms have to lead to impairments in at least two social settings (e.g., school, domestic life, or workplace). Note that other criteria are applied to patients older than the age of 16. However, these shall not be further elaborated here, as this paper focuses mainly on the diagnosis of ADHD in children.
The emergence of the disease is believed to be genetically inheritable. A study [30] suggests that the risk of developing ADHD is five times higher if first-grade relatives possess the disorder. However, inheritance seems to not be the only risk factor. Low birth weight, malnutrition, substance abuse during pregnancy, and psychological trauma during childhood also show a correlation with an ADHD diagnosis [31,32,33,34].
Therapy guidelines are published by several institutions, such as the National Institute for Health and Care Excellence (NICE) [35], the European ADHD Guidelines Group (EAGG) [36], and the American Academy of Pediatrics (AAP) [37]. The different guidelines are similar in most aspects, with some significant differences. For instance, the US guidelines are much less restrictive regarding pharmaceutical treatments of mild cases and pre-school children [19]. The guidelines suggest that first-line treatment should consist of drug administration. In this regard, stimulants, such as Methylphenidate (also known as “Ritalin”), are an effective medication [38,39]. These drugs amplify the stimulus transmission between brain cells, causing increased focus for several hours. Stimulants have been used relatively abundantly since the 1950s and were deemed harmless [20]. The recent perception suggests a more cautious approach since suppositions emerged that stimulants may cause side effects. These effects include but are not limited to sleep disturbances [40] and growth suppression [41]. However, non-pharmaceutical treatments, such as neuro-feedback therapy, do not reach the therapeutic success of stimulants [42]. While stimulants remain a first-line treatment in ADHD cases, the same study [42] suggests that patients that participate in accompanying behavioral therapy require lower prescribed doses of stimulants than those patients that are exclusively medicated. This circumstance serves as the key motivation for EEG-based therapy and diagnostics.

3. Electroencephalography (EEG)

EEG is a technology dating back to the 1920s. EEG enables the visualization of brain activity through the interpretation of electric signals. These signals are gathered from electrodes placed on the scalp (mounted on the surface). It is mostly applied in neuroscience and to an increasing extent in clinical diagnostic. The latter one is mainly related to the relatively low cost and high availability of EEG compared to other functional brain imaging methods. Comparable contenders are functional magnetic resonance imaging (fMRI) and functional near-infrared spectroscopy (fNIRS). The availability of portable solutions and the immediacy of measurement results further speak for the use of EEG (see Table 1 for a more detailed comparison). Due to these points, this paper focuses on EEG-based ADHD diagnosis methods.

Functional Description

The basic outputs of an EEG are curves of the electric potential picked up by a reproducible electrode configuration. In medical applications, the 10–20 electrode placement system is commonly used. Its use is recommended by the International Federation of Clinical Neurophysiology (IFCN) [43,44]. A guide for the system can be found under [45]. The 10–20 system requires the application of 21 electrodes on the scalp. This process can be tedious and may be uncomfortable for the patient. For some tasks, simpler consumer-grade EEG devices may suffice. These systems consist of considerably fewer electrodes and are optimized for patient comfort. However, due to the restricted electrode count, they are more susceptible to signal artifacts induced by, e.g., eye movement [46].
The unprocessed signal can be manually assessed in order to discover relative changes to a pre-determined resting-state EEG. Large-scale defects, such as an acute epileptic seizure, can be analyzed in this fashion. More sophisticated modes (that are already considered state of the art for several years) let the acquired curves undergo signal processing. The most prominent one is Fast Fourier transformation (FFT). The gathered power spectrum is divided into multiple named frequency bands. There is no single convention on where to exactly set the margins of these bands and different studies use slightly different ranges [47,48,49]. Table 2 shows three examples for different bands used in three different studies.
This division is based on the underlying brain mechanisms. Attenuation or exaltation of one or multiple bands can be connected to specific diseases or patient moods or states. For instance, the Delta band shows high activity in sleeping patients, while elevated Beta power indicates active concentration on a task.

4. Diagnosis and Treatment of ADHD with EEG

A link between deviations in standard EEG and the occurrence of ADHD has been known for 80 years [50], but it was only recently that the field gained reasonable traction. One major breakthrough would be the approval of Neuropsychiatric EEG-based assessment aid for ADHD (NEBA) systems by the American Food and Drug Administration (FDA) in 2013 [51]. It has been shown that using a NEBA system can prevent erroneous diagnosis, help in the resolution of uncertain cases, and increase the accuracy of clinicians’ diagnoses from 61% to 88% [52].
The first NEBA devices solely exploited the power ratio between Theta and Beta waves (Theta-to-Beta Ratio (TBR)) as a metric for the diagnosis of ADHD. This ratio is sampled while the patient is subjected to different stimuli (e.g., resting state, focus on a sound or image, etc.). Comparison of this dataset to a norm yields the diagnosis.
Several publications provided evidence that a classification via TBR allows a diagnostic accuracy of around 90% [53]. However, shortly after the FDA published the approval for NEBA devices criticism over the relevance of TBR arose since multiple independent studies failed to reproduce the proclaimed accuracy of TBR classification. The achieved accuracy was in the range of 49.2–54.8% [54] and 53 % [55]. A possible reason for this controversy could be the heterogeneous nature of ADHD. In an approach postulated in [56], it is stated that ADHD is not caused by a single distinct brain fault. ADHD can rather be caused by several independent defects, which all manifest themselves differently in EEG readings. Therefore, a single EEG feature, such as TBR, is not enough to safely diagnose ADHD. Multi-variate methods try to tackle this deficit by considering multiple features gathered from independent measurement runs. For instance, multiple Event-Related Potential (ERP) measurement epochs can be taken. In this measurement mode, the patient is consecutively presented with different tasks stimulating different brains regions separately. The response of the EEG signals to those tasks serves as a metric. In this case, an accuracy of around 80% could be achieved [57]. By employing machine learning methodologies, the accuracy increases to values above 90% [57].
Despite promising results in regards to accuracy, multi-variate measurement approaches are quite demanding on patients and medical staff. Several 100 task repetitions have to be undertaken to obtain meaningful ERP charts. Such sessions can span over hours. In addition, the fatigue of patients and staff or random misalignment of measurement equipment, etc., can lead to distorted results. This circumstance demonstrates that accuracy is not the single characteristic that should be looked into when developing a NEBA. Methodologies should additionally be considered by the three qualities: robustness, interpretability, and feasibility. Using the example given in [57], an X-ray to find tuberculosis is robust because it is impervious to noise (e.g., patient movement). Interpretability is given because abnormalities can easily be detected on the X-ray image. Eventually, the method is feasible since an X-ray session can be administered in less than 10 min, and X-ray devices are quite abundant.
The above-mentioned multi-variate approaches provide the means to achieve higher accuracy but have the fundamental disadvantage of requiring long and potentially tiring sessions. Feasibility and robustness therefore suffer. Due to these limitations, EEG-based methodologies, in their current form, are only recommended as an accompanying aid to visualize ADHD treatment response (e.g., neuro-feedback therapy) [57]. In order to be usable as a diagnostic tool, it either lacks reproducible evidence (in case of TBR) or in interpretability/feasibility (multivariate features). However, new developments in the field of system on chips address the deficits in those fields and show promising results. The next section therefore shall present three approaches, which try to push the boundaries in the fields of feasibility, accuracy, and robustness.

5. Potential Approaches for Improvement

As elaborated in Section 4, the diagnosis of ADHD with current EEG devices and methodologies is not common practice. Insufficient accuracy, difficulty, and complexity of usage in clinical situations are two main reasons for that. In the following sections, new measurement modes, a hardware development tool, and system on chip design considerations are presented. These advancements shall increase the usability of the next generation of Neuropsychiatric EEG-based assessment aids for ADHD NEBAs.

5.1. New Measurement Modes

The utilized measurement mode has a significant impact on the accuracy, robustness, interpretability, and feasibility of the diagnostic method. It would therefore seem profitable to introduce new methodologies in this field. One approach lies in the definition of new signal features. Features extracted from signals are not only relevant in the context of EEG and ADHD. Naturally, signal processing is also heavily utilized in other domains, such as telecommunications, machine vision, and human–computer interfaces. It can therefore be drawn from a vast theoretic background.
A quite simple feature is TBR. However, due to its uni-variate nature, it may not be suitable to depict the heterogeneity of ADHD. More generic features, therefore, have to be used. Non-linear features are a potential contender for this role, as they perform better in reproducing non-idealities of the signal.
The second dominant approach is to not rely on high-level features but to directly identify brain regions that are affected by ADHD. Sophisticated algorithms enable the detection of increased or reduced activity in those regions. Based on this information, ADHD treatment success can be monitored in more detail, and accurate diagnostics with a rich rationale can be given.

5.1.1. Nonlinear Features

As the name suggests, nonlinear features are metrics that are defined for signals generated by nonlinear systems. As the reactions of the human brain to stimuli are mostly unpredictable and may be chaotic, it can be treated as a nonlinear system. This assumption enables the calculation of specific features, which may bear correlation with brain defects. Ideally, these defects can then be mapped to ADHD.
One suggested cause for ADHD is a defect in the neuron synchronization mechanism. This circumstance would cause “jagged” EEG readings. Jaggedness can be described by a metric called fractal dimension. There are multiple definitions for this metric, each with its own focus. In [58], a comparison of four different definitions is made. Two other prominent metrics are largest lyapunov exponent [59] and approximate entropy [60]. These two target the desynchronization and chaoticness of a signal. These features are not completely orthogonal to each other and may contain redundancy when computed on the same signal sequence. Feature selection algorithms such as Double Input Symmetrical Relevance (DISR) [61] and Minimum redundancy maximum relevance (mRMR) [62] can be used to select the most descriptive features of a signal sequence.
If the features described in this section are fed to a neural network, an accuracy of up to 93.65% can be achieved [63]. With respect to feasibility, this method seems to be promising, as the task presented to the patient was simple and finished within a matter of minutes. Despite the use of a machine learning algorithm, interpretability is also given, as the nonlinear features calculated prior to the neural network already show a correlation with the presence of an ADHD diagnosis. A point of criticism has to be noted: the extent of the study is quite limited, as only 60 children participated. It remains to be seen if these results can be reproduced in a larger setting.

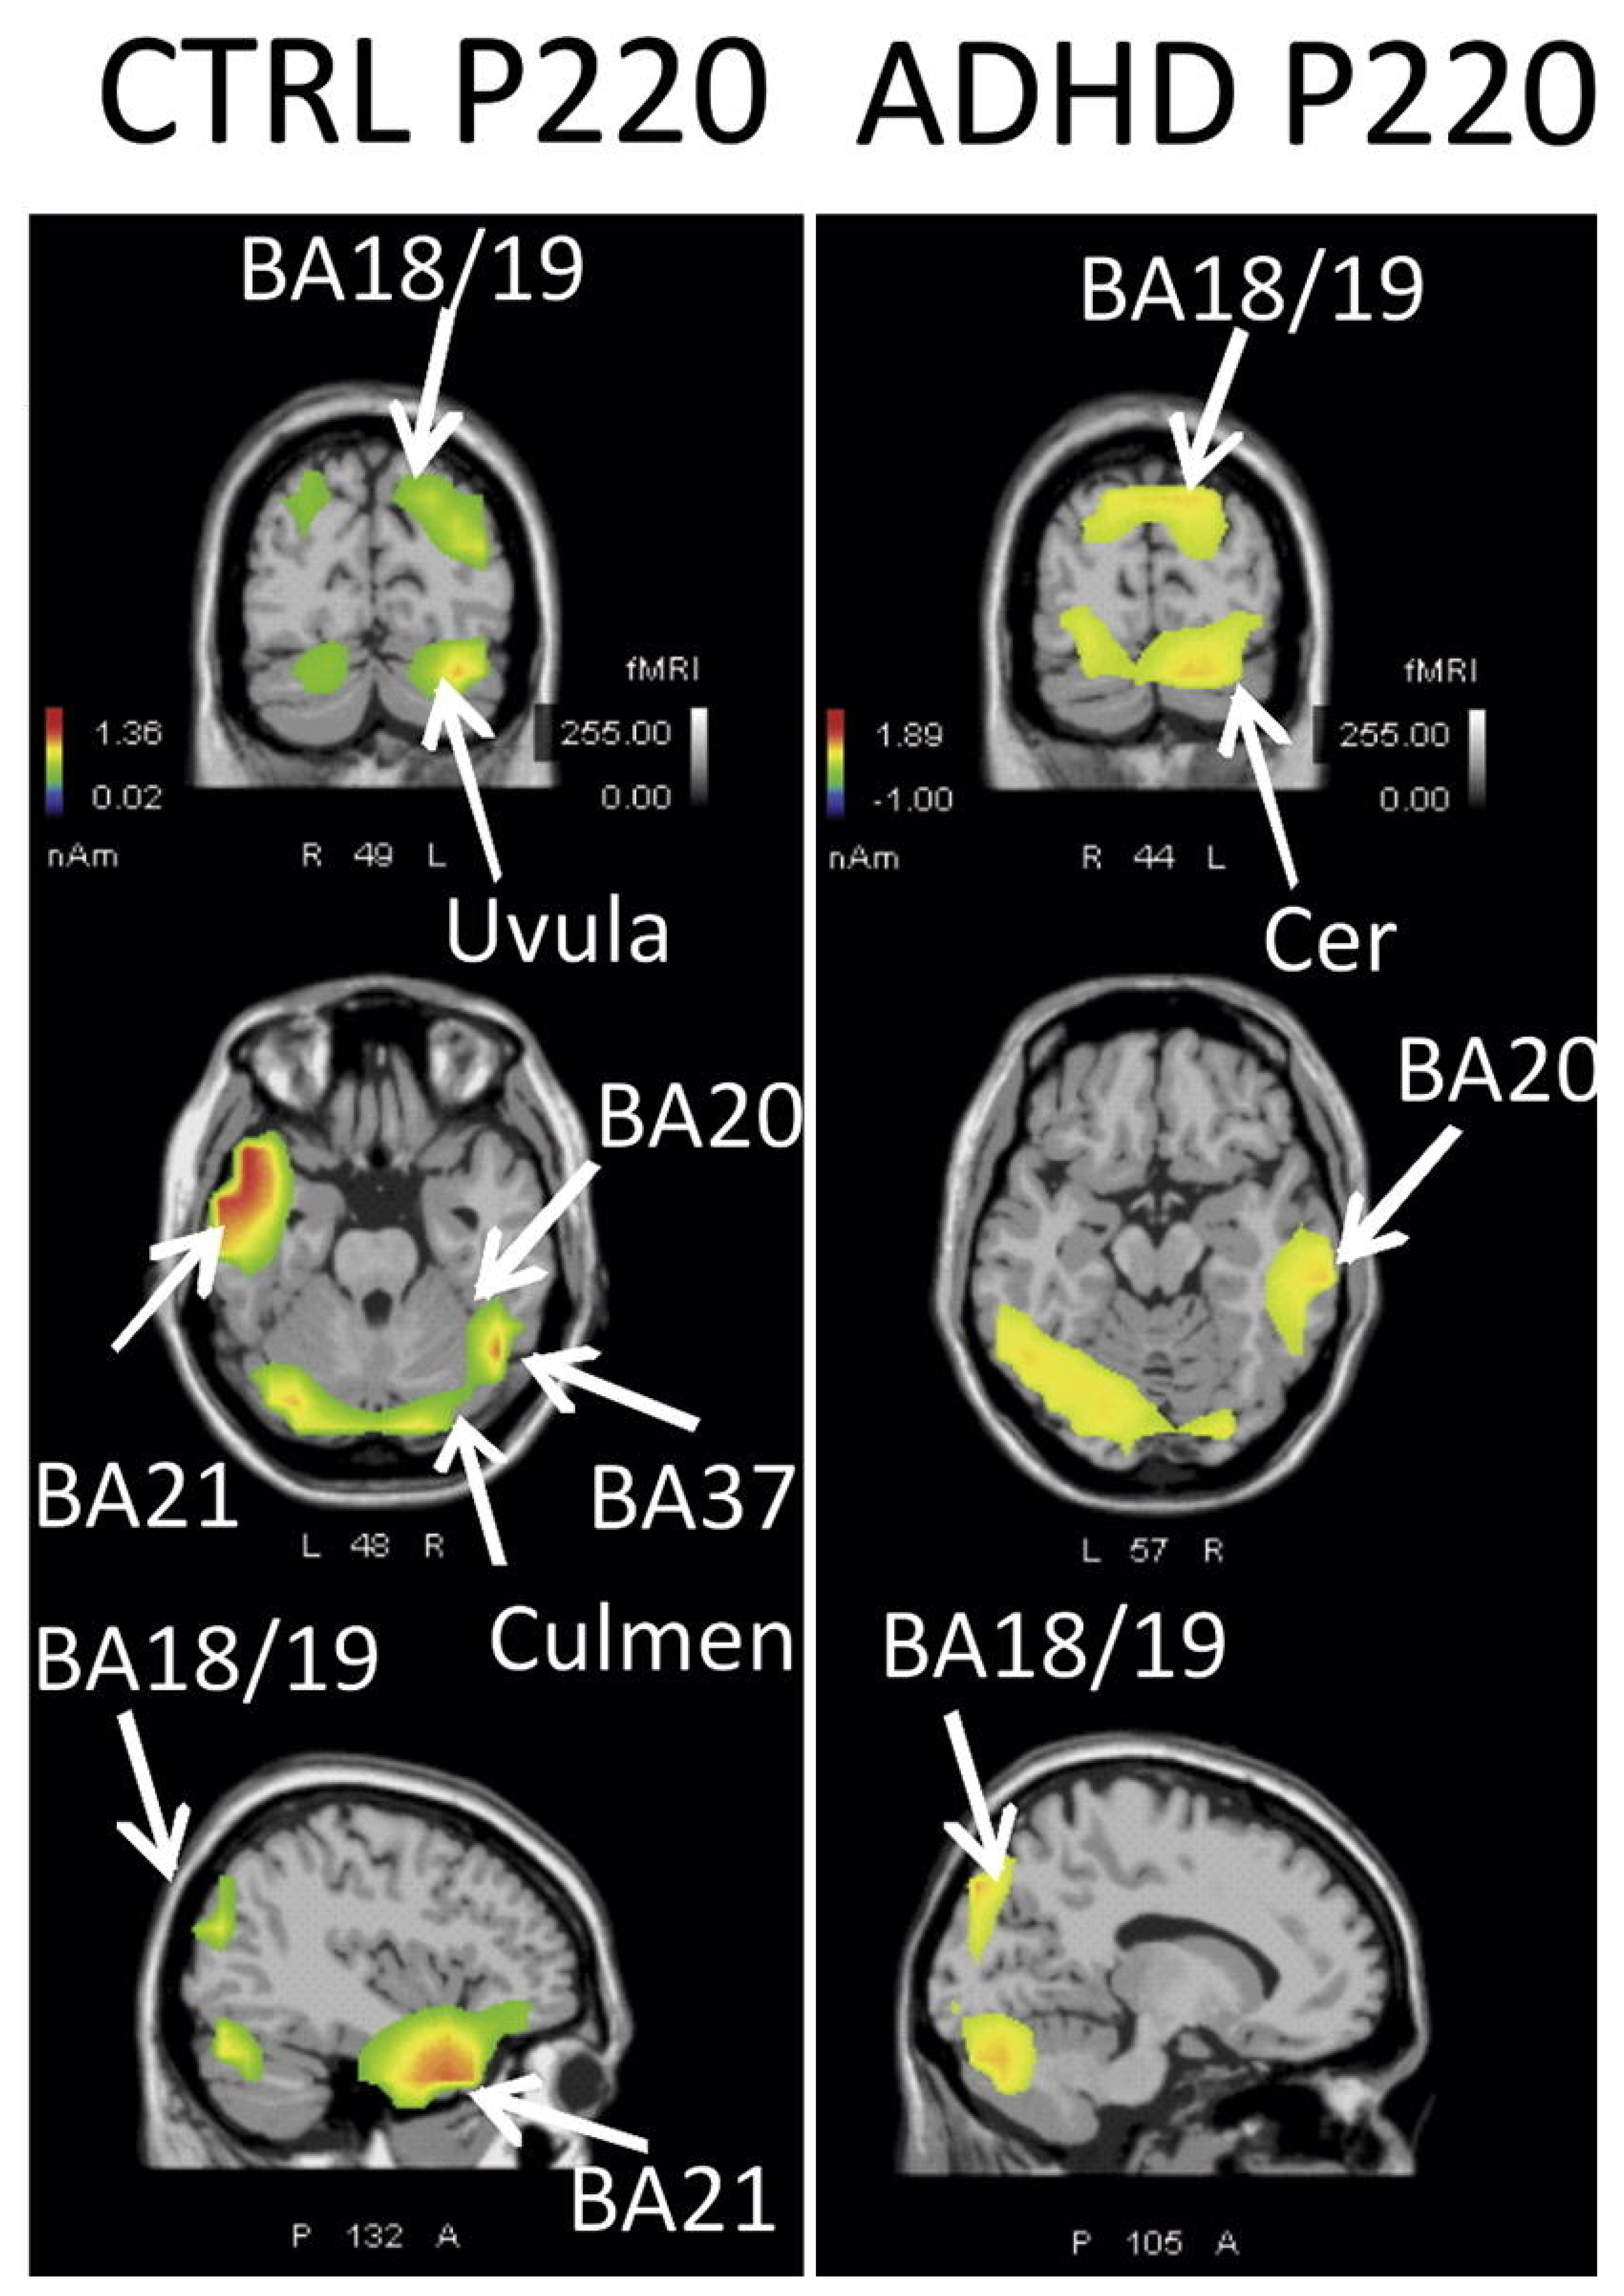
5.1.2. Identification of Neural Mechanisms

Another quite new approach to increase the applicability of EEG readings is to identify the effects the neural mechanism of ADHD have on the EEG signals. This approach promises to be more concise than the abstract, high-level signal features presented in Section 5.1.1. Reasoning based on this methodology would refer to physiological facts and not on possibly arbitrary correlations. However, as suggested previously, the heterogeneity of ADHD complicates this methodology. Many different neural circuits contribute to ADHD, and not all may be known as of today. Fortunately, neural circuitry has been extensively researched via fMRI. These insights can serve as a reference for this method.
A survey conducted by [64] suggests that the brain regions responsible for visual pre-processing are compromised in adults affected by ADHD. This deviation can traditionally be measured through the means of ERP. More interestingly, the publication shows that this deficit can also be made visible by applying standardized weighted low-resolution electromagnetic tomography (swLORETA). This technique allows the localization of current densities by analyzing EEG signals. Therefore, the spatial resolution of brain activity is enabled. The study tasked subjects to focus on a picture. If the picture changed in a certain way, a button had to be pressed. After 220 milliseconds, the brain state is captured via swLORETA. Figure 1 depicts the magnitude of the difference between the control and ADHD groups. A similar survey [65] comes to the same result, reinforcing the feasibility of this method.
The outstanding advantage of this method lies in its diagnostic value. It immediately provides images with clearly visible features. Effort for the subject and the conductor is low. The survey in [65] demonstrated that results can be generated with the patient in resting state and with hardware that costs no more than USD 1000. The heterogeneity of ADHD is captured, as multiple brain regions are depicted simultaneously. However, it has to be considered that this approach is rather new. This circumstance implies that the scale of the conducted surveys was rather small. Further evidence has to be collected to enable large-scale clinical applicability.

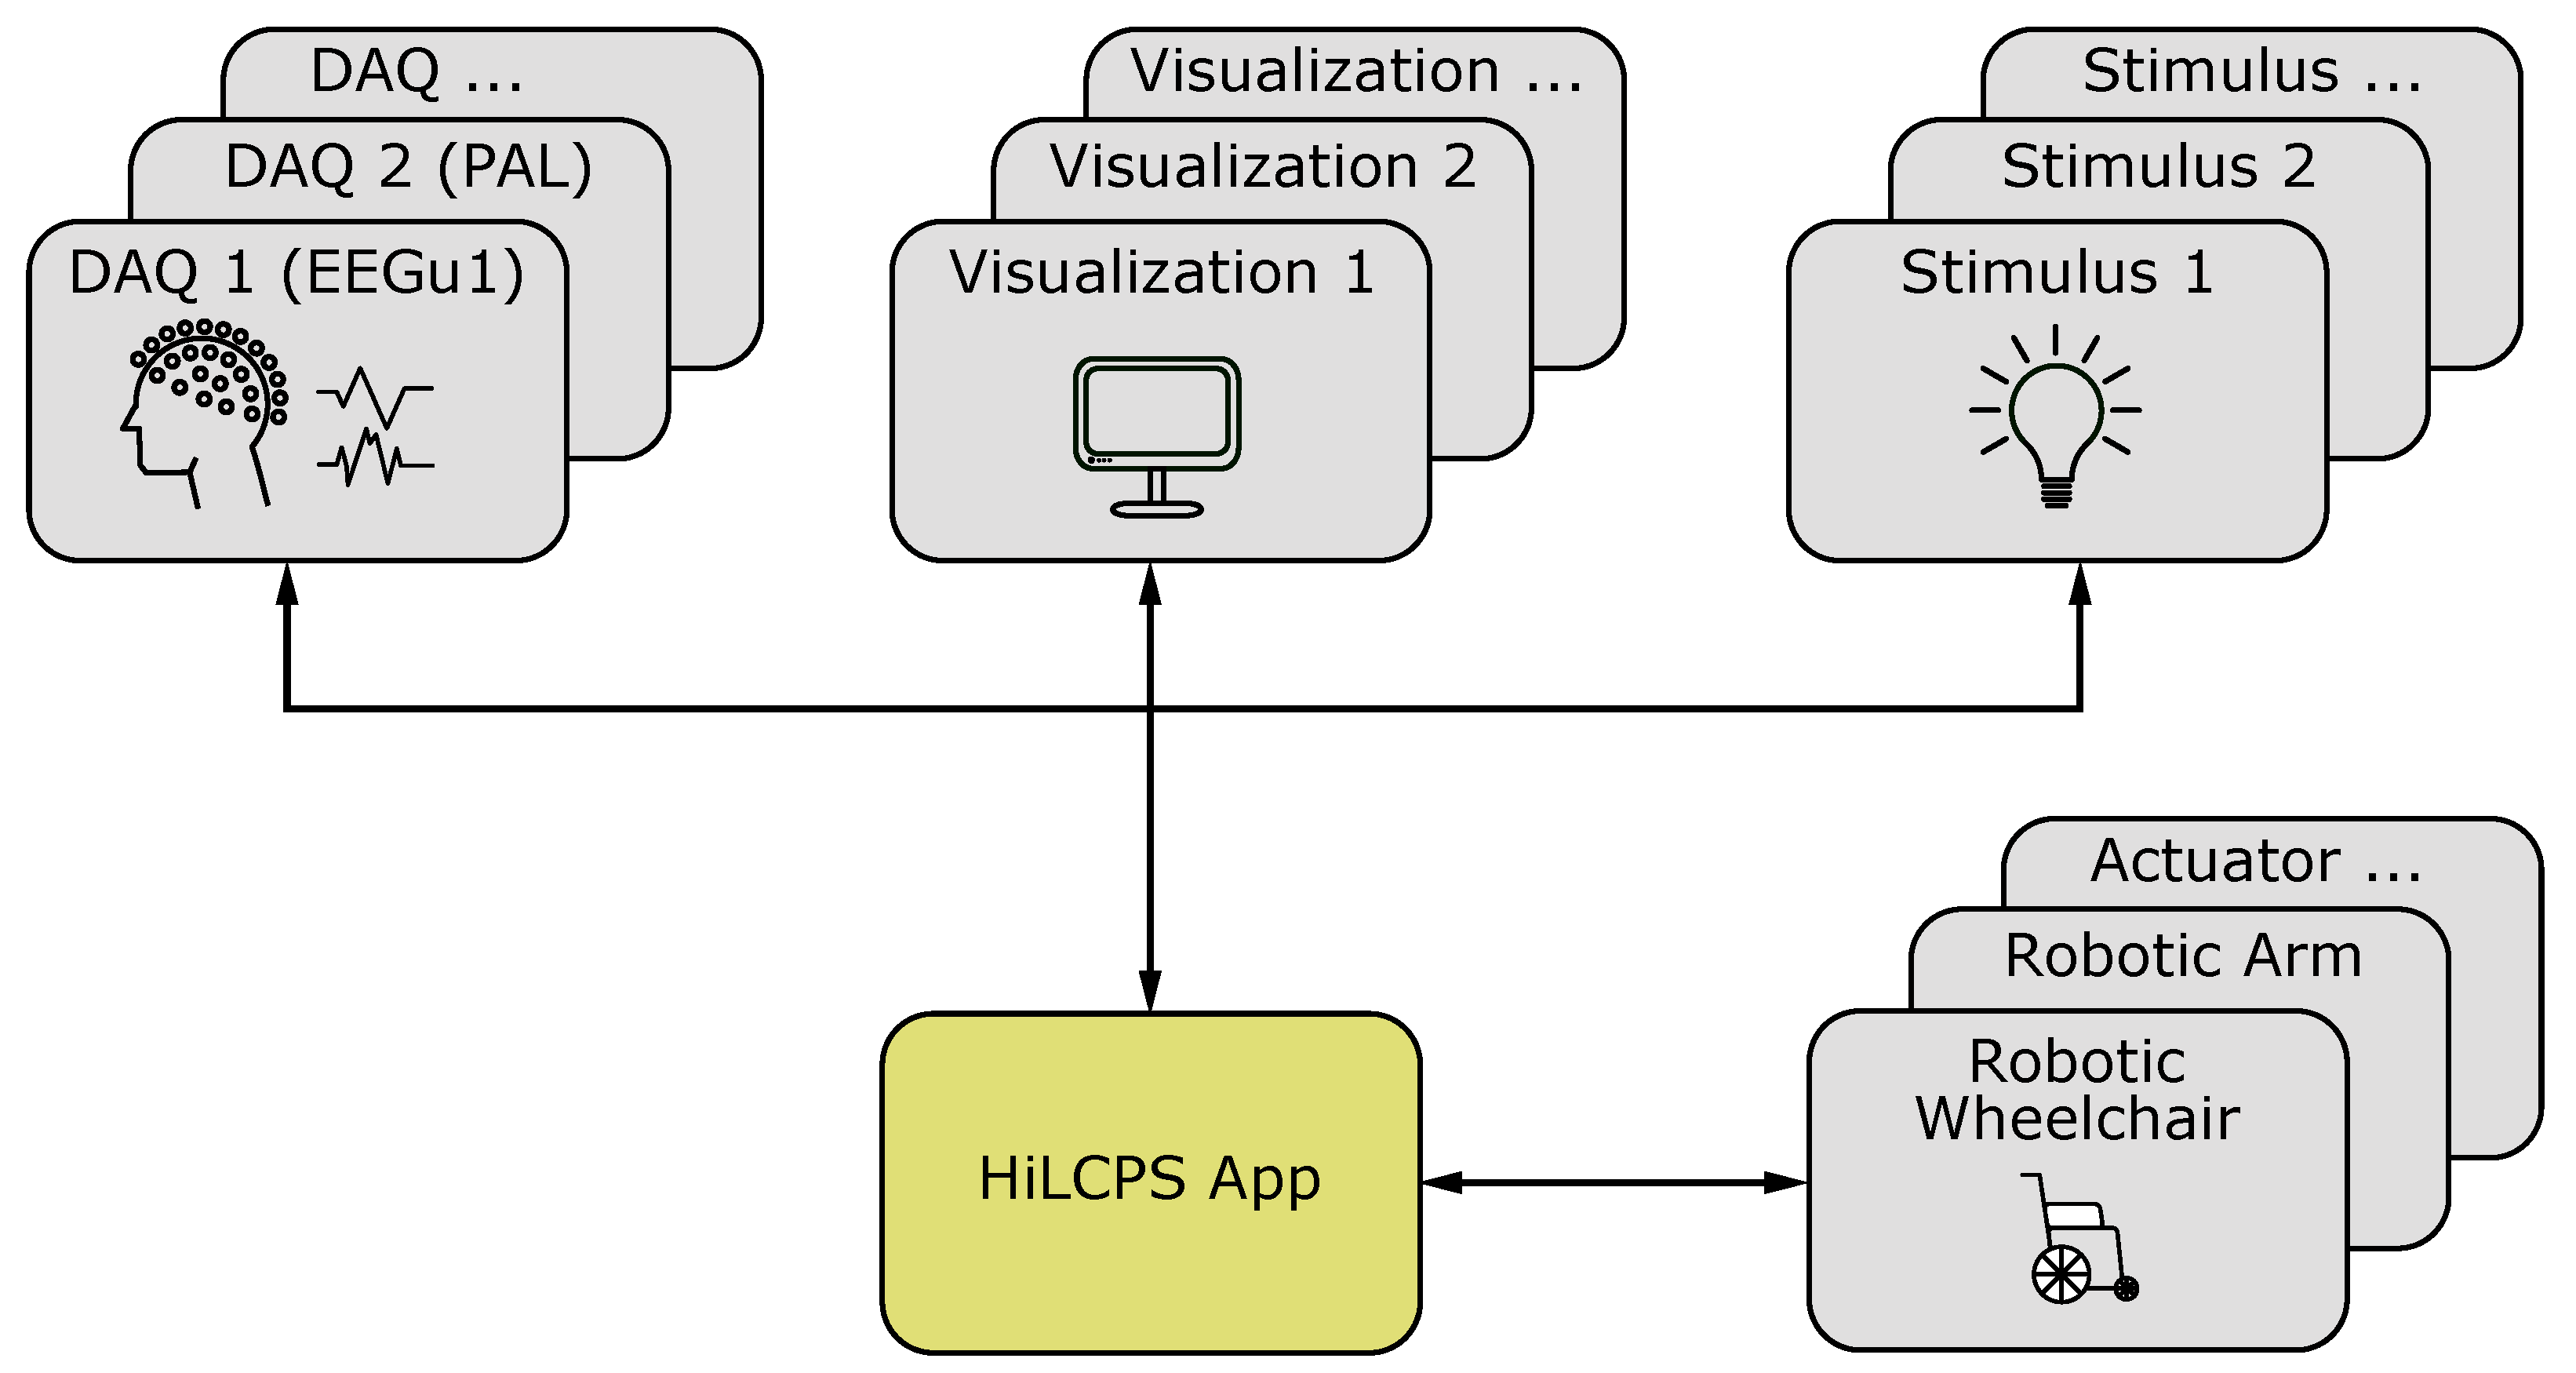
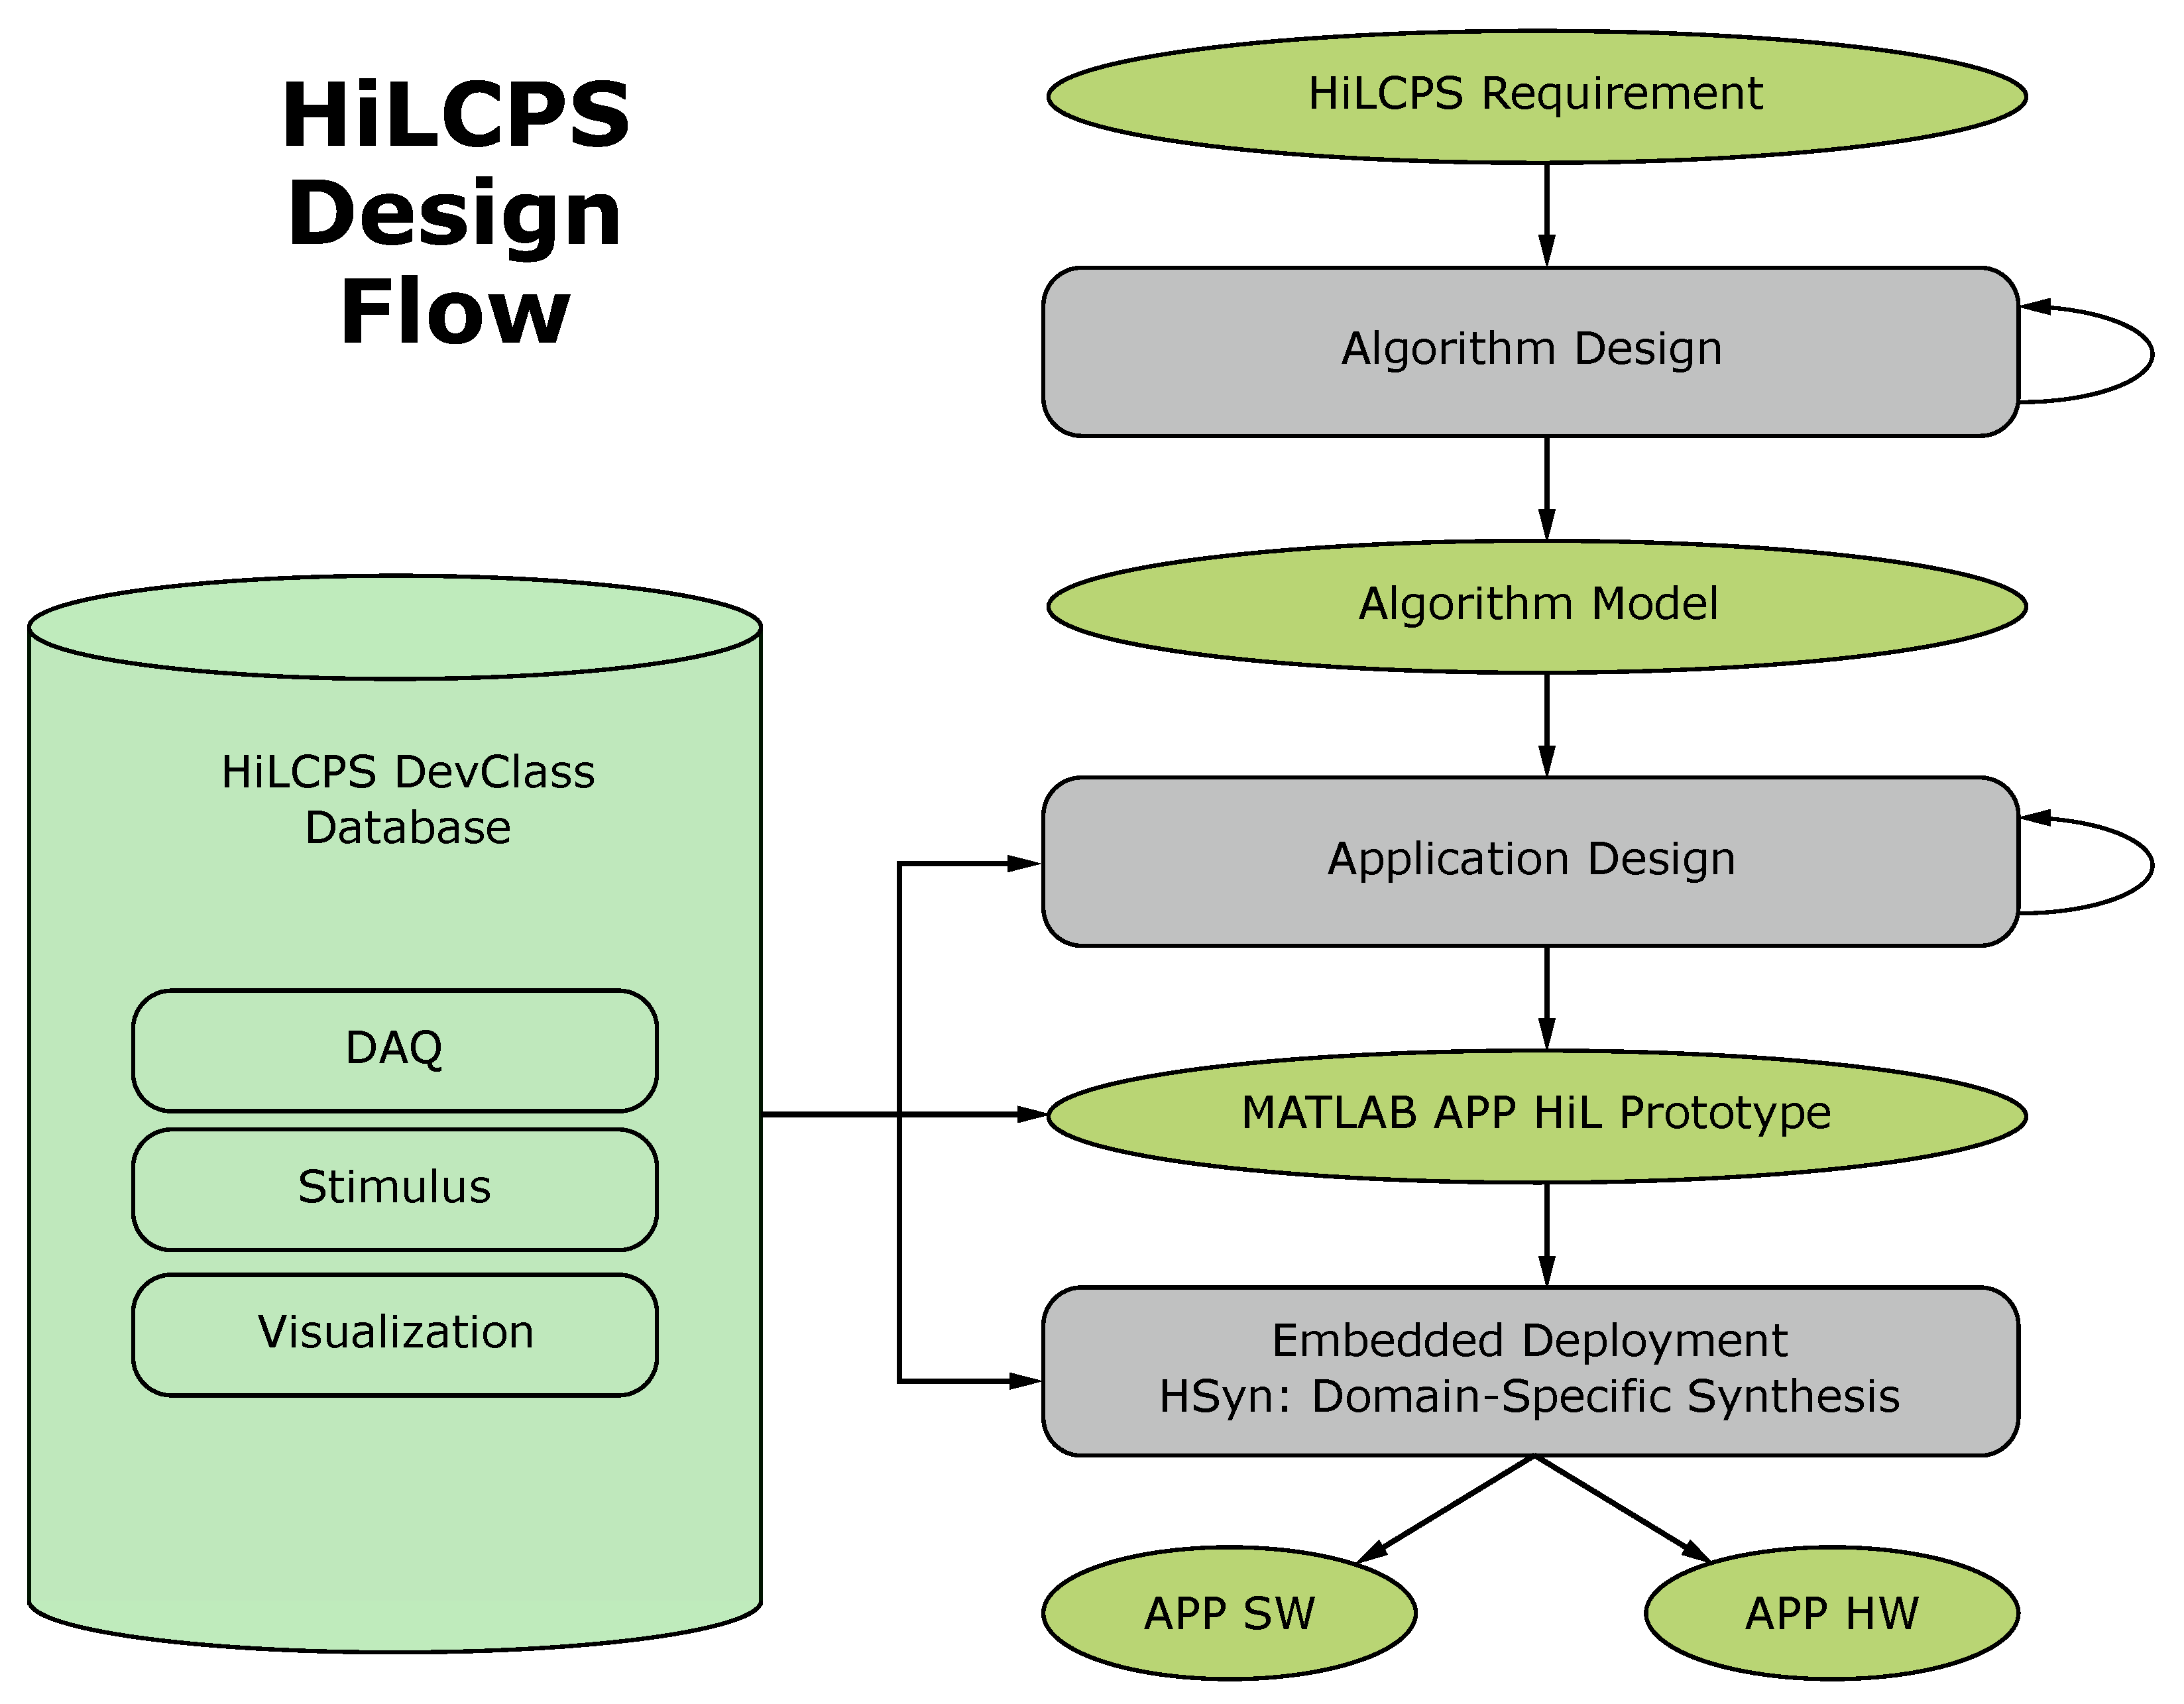
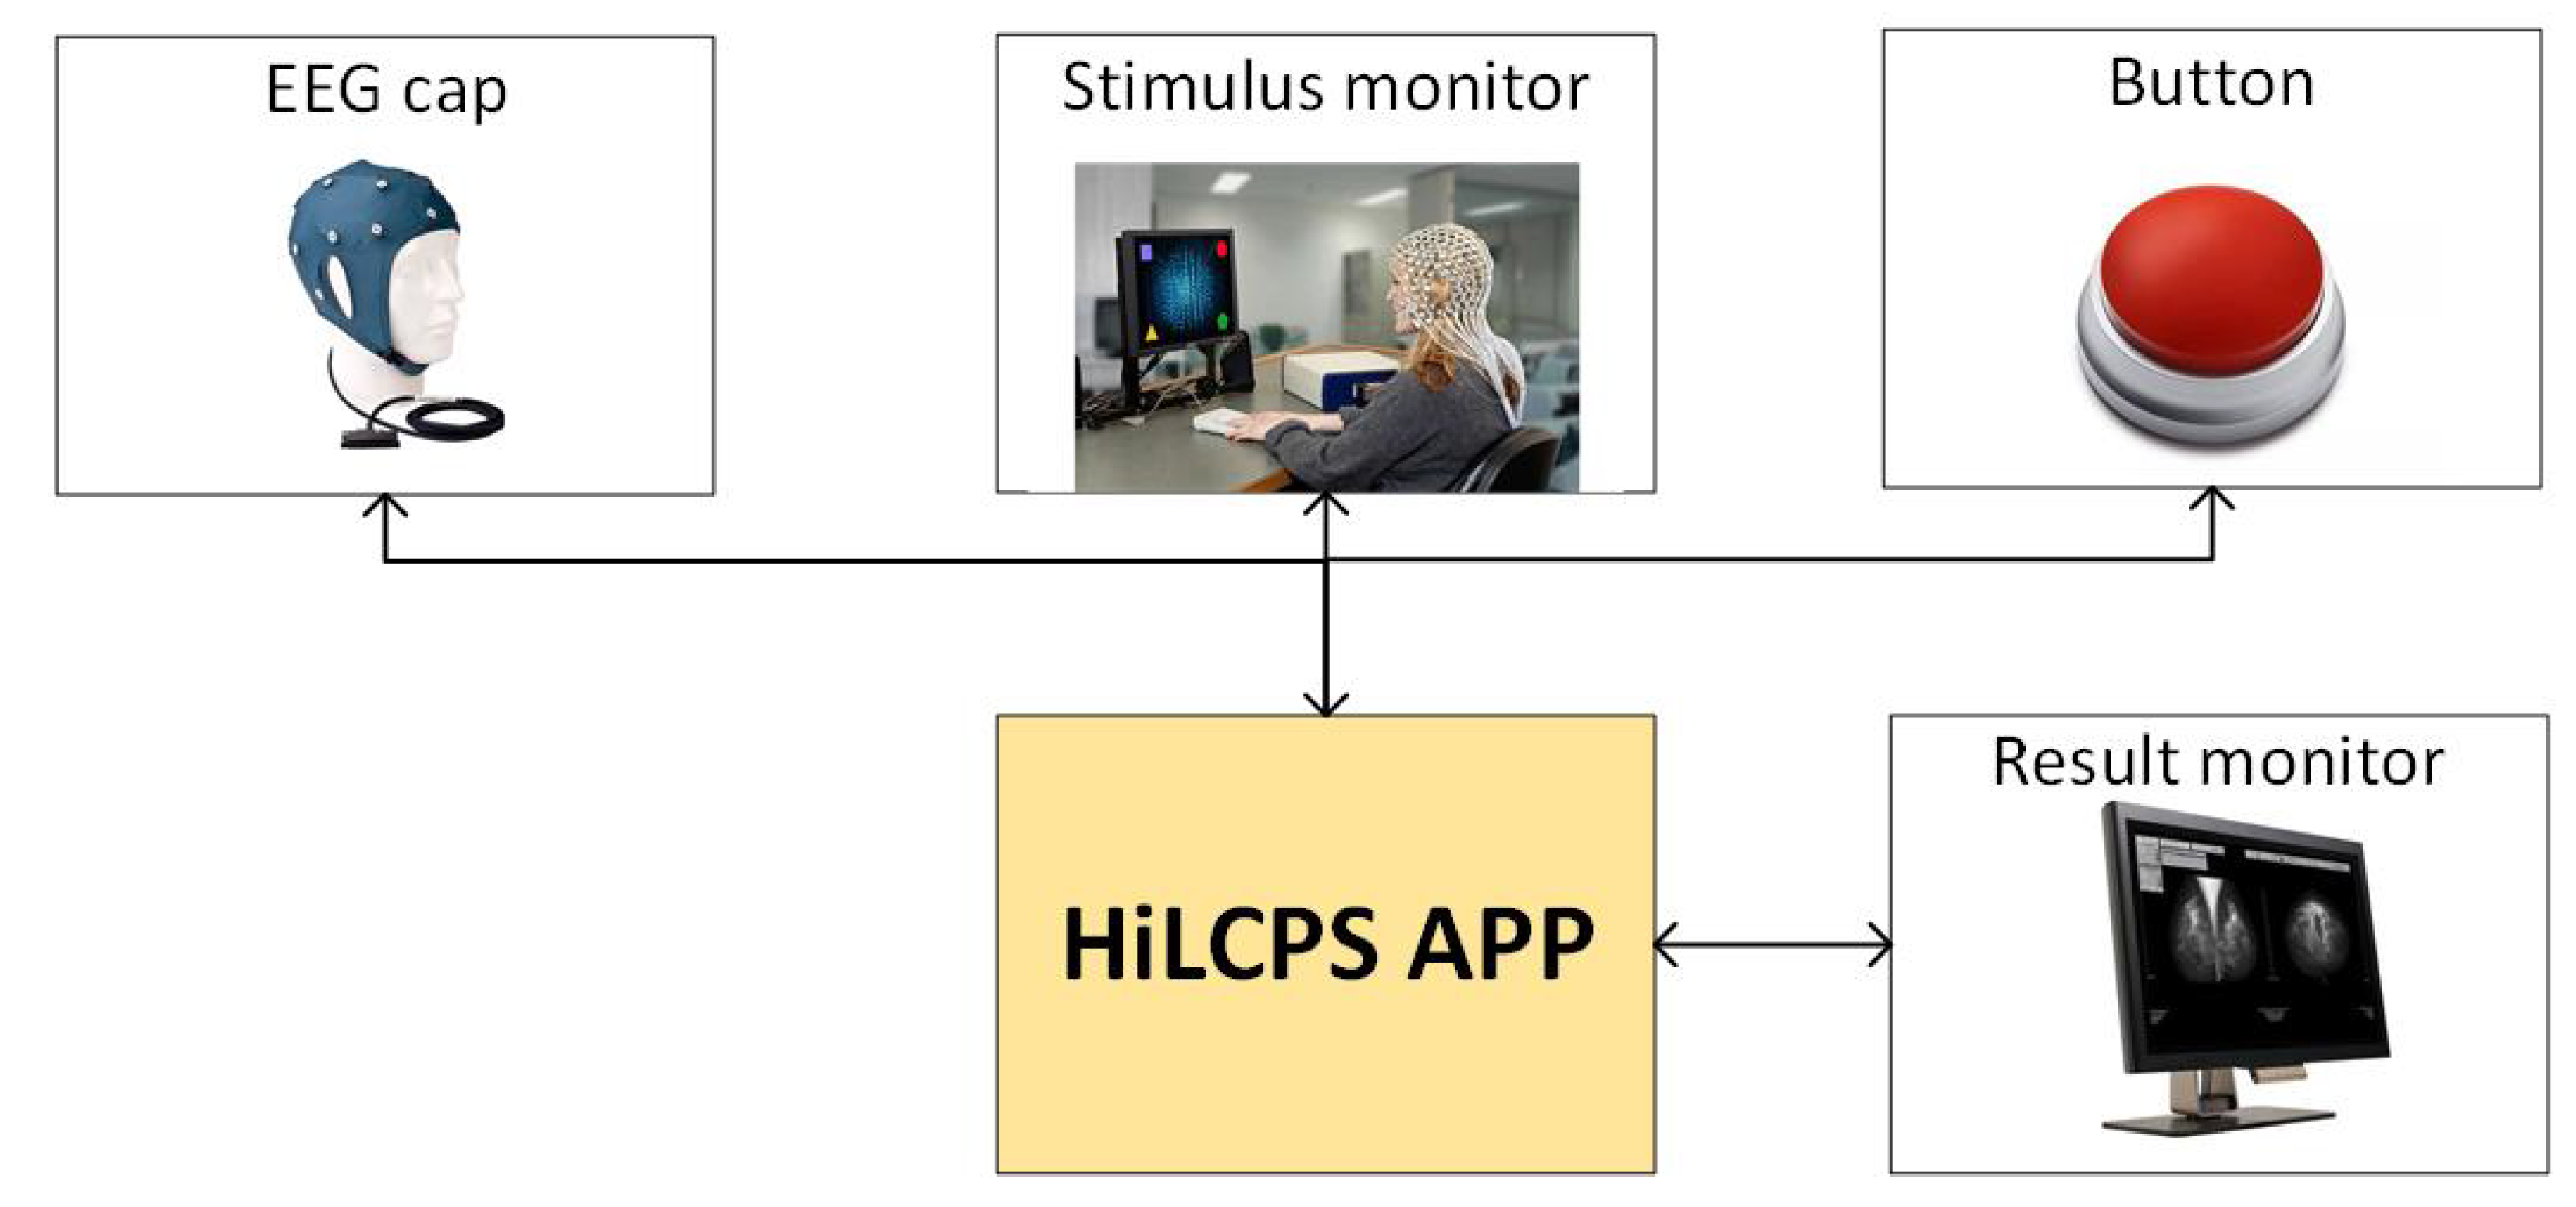
5.2. Human-in-the-Loop Cyber-Physical Systems Framework

Building the EEG-based diagnostic or therapeutic systems requires the coordination of hardware and software engineering. This circumstance drastically complicates the development process. Failure to address this challenge may lead to long, expensive development cycles and poorly scaleable products. Functional rigidity of such systems is especially of concern since it is quite possible that new findings regarding ADHD diagnosis/therapy emerge. The integration of such novel findings may be expensive if the system is inflexible. This is a case that should be avoided.
A common way to tackle complexity in projects that incorporate software and hardware is using domain-specific frameworks. Such frameworks provide abstraction layers, which simplify development processes. Some research has already gone into this topic and produced frameworks such as Angelah [66] or bHCI [67]. Both of them mainly focus on the abstraction of hardware and data acquisition. In the Human-in-the-Loop Cyber-Physical Systems (HiLCPS) [68] another important aspect is addressed: Via its submodule, HSyn, it is possible to implement MATLAB algorithms directly in the embedded hardware. Due to this feature and its support for hardware abstraction, HiLCPS emerges as a suitable framework in the context of EEG applications. It shall, therefore, be elaborated further on in the next paragraphs.
HiLCPS addresses three aspects important in hardware/software system development:
  • Hardware Transparent Access: Similar devices are grouped into device classes called DevClass. Members of the same device class are accessible via the same well-defined interface.
  • Location Transparent Access: Allows simple development of distributed systems. Remote hardware components can be accessed as if locally connected.
  • Domain-Specfic Synthesis: The framework provides the HSyn submodule, which allows automatic appropriation of MATLAB algorithms, so they can be implemented on embedded hardware.
A typical HiLCPS application structure is depicted in Figure 2. It can be seen that most hardware devices can be categorized into four groups: DAQ, stimulus, visualization, and actuator. Therefore, a DevClass for each of those groups exists in an HiLCPS device database.
Figure 3 illustrates the recommended workflow when using the HiLCPS framework. It consists of three main stages. During Algorithm Design, the designer can utilize the full extent of the MATLAB environment to compile the desired algorithm. In the Application Design stage, the algorithm is embedded in a software application that ties inputs from multiple sensors and outputs to actors/visualization elements together. HiLCPS DevClasses are instantiated here and can be prototyped through the MATLAB HiL mechanism. Eventually, the application is deployed to the target systems in the Embedded Deployment step. HSyn allows the automatization of this step, so developers do not have to manually map the algorithms to the specific hardware. By doing so, the authors claim that a productivity gain (i.e., development time decrease) of six orders of magnitude can be achieved.
An EEG system, focused on diagnostic/therapeutic tasks with the ADHD context, which is built with the HiLCPS framework, could be structured as depicted in Figure 4. Here, an ERP test is implied. The subject is presented a sequence of images. If a specific image is displayed, the subject has to press a button. The EEG signals are captured by an EEG cap and the corresponding controllers. Through the stimulus monitor, the image sequence is displayed. The subject can signal the odd picture via the button. The conductors of the test can monitor the result with the result monitor.

5.3. System on Chip Implementations

The first form of EEG devices, which are comparable to today’s versions, were mechanical chart recorders similar to [69]. Since then, EEG technology went through multiple evolutionary steps. The most notable being the digitalization of the EEG signals that was enabled by the advent of computer technology in the 1970s. The most recent advancement are wireless, wearable EEG devices (see Figure 5). They are made possible due to the increasing function density, power efficiency, and decreasing area consumption of system on chips (SoCs). The mobile nature of such wearable devices lowers the mental entry barrier for their usage and decreases fatigue during therapy or diagnostic sessions. Because of the importance of SoCs in the evolution of EEG diagnostic and therapeutic systems, it shall be discussed how SoCs may contribute to the emergence of better Neuropsychiatric EEG-based assessment aid for ADHD NEBAs.
SoCs come in many varieties and are ubiquitously used in signal processing heavy domains, such as mobile or wearable devices, automotive applications as well as in the medical sector. They excel with their small size and power efficiency, enabling them to be powered by batteries and to be realized with mobility in mind. By the release of this publication, there are no SoCs with the specific function of ADHD diagnosis or therapy. This circumstance serves as motivation to discuss system on chip (SoC) design considerations and architecture requirements for other EEG-related SoCs (i.e., seizure detection and sleep staging) and compare them to the needs of NEBAs.
When working on a concept for a certain SoC, a vast design space has to be explored. Decisions include, among others: the selection of intellectual property (IP) cores, the energy management policy, the on-chip communication scheme, the interfaces on the SoC boundary, etc. With regards to NEBAs, these decisions have to be based on the four principles stated in Section 4: accuracy, feasibility, interpretability, and robustness. The following paragraphs shall elaborate on the trade-offs that emerge when trying to fulfill these four aspects.
1
Accuracy: “The SoC shall produce accurate results.”
The obtainable accuracy is highly dependent on the algorithm that is implemented on the SoC. Thus, the choice of algorithm defines, to a great extent, the trade-offs that have to be dealt with. It has been mentioned previously that neural networks pose a possibility to increase the accuracy of NEBAs. However, this improvement has to be bought with increased energy consumption. Hardware-implemented neural networks, in their essence, are expansive matrices of transistors and often multiplies in size compared to the processor cores that feed data to them. This circumstance implies a high static energy consumption. A comparative study, focused on EEG-related SoCs [71], confirms this assumption. According to the study, an SoC with a hardware-implemented neural network ([72]) consumes up to 1.589 mW, while a conventional, processor-based one ([73]) draws up to 37 nW. This comparison clarifies that the choice of the algorithm may subsequently decide whether a battery-powered operation of the system is feasible.
On the other hand, conventional processor-based algorithms may have higher computation latency than hardware-implemented neural networks. Again, the epilepsy detection systems of [72,73] can be considered as examples. The first publication states that it can produce results within 2 s. The later one specifies a latency of 0.16 s. However, in the later case, the bottleneck is the processor that calculates the features that are then presented to the neural network. The network itself requires 250 clock cycles in order to generate results. When driven with a 8 MHz clock (as it is the case in [73]), this corresponds to a latency of 31.25 μ s. With respect to diagnostic and therapeutic NEBAs, the latency is one of the key design drivers. This is especially true for neuro-feedback therapy applications. In this constellation, the patient and the NEBA form a back coupled system. Delays introduced by the NEBA may lead to the instability of the measured data since the patient may be presented with outdated stimuli. This behavior has been surveyed in [74], where it has come to the conclusion that delays of more than 1 s lead to neuro-feedback sessions with no noticeable therapeutic success. Fast computation, therefore, has to be a high priority in NEBA design.
2
Feasibility: “The cost of the SoC shall be low, and its application shall be simple.”
An inexpensive NEBA device ensures a low entry barrier for its usage. By achieving this requirement, widespread clinical usage may be enabled. The demand for a low-cost electronic device can often be translated to short development cycles with low staff effort. This circumstance constrains the types of SoC that can be used in such a development project to Platform SoCs (PFSoCs). This variety of SoC focuses on a general-purpose approach to achieve lower monetary costs. Re-usability through programmability enables mass production, hence lowering the price tag for the device. Some PFSoCs are part of an ecosystem of tools (e.g., operating systems, standardized interfaces, compilers, etc.), which further accelerates the development with this kind of SoC. Their counterpart are domain-specific SoCs (DSSoCs). These are highly specialized designs with superior measurements in performance and area consumption. PFSoCs are often designed from scratch and thus require substantially more monetary and design effort.
Examples for EEG-related DSSoCs would be the patient mood detection system proposed by [75] and a sleep staging SoC stated by [76]. PFSoCs are implemented by [77,78].
Another consideration has to be taken with respect to the mobility of the device. The ideal device is a battery-powered, transportable, and wireless NEBA headset, which can be read out via a laptop or smartphone. This allows test personnel and clinicians to be independent of the clinical infrastructure and enables them to bring the therapy equipment to the patient. By developing such a mobile device, its application is exceedingly simplified when compared to other professional EEG-related devices. A study conducted in [79] suggests that mobile devices can achieve similar accuracy levels when compared to traditional EEG devices.
The transportability implies a small form factor. As in this regard, virtually any SoC is negligible in size, and the dimensions of the device are mainly determined by the number and scale of the attached peripherals (i.e., scalp electrodes). Therefore, no SoC-specific trade-offs have to be considered with regards to transportability. The implications, which are introduced by the requirement of being battery-powered, have already been discussed under the point “Accuracy”. The requirement for being wireless will be elaborated upon under the point Interpretability.
3
Robustness: “The result shall be impervious to noise.”
EEG signals are typically in the regime of several μ V and therefore susceptible to internal and external noise. External noise refers to disturbances that are induced from outside the human body, e.g., 50/60 Hz mains hum, wireless communication, or poor electrode-scalp contact. Internal noise originates, for instance, from the eye movement of the patient. The SoC has to be able to detect the signal artifacts induced by such events and has to filter them out or has to at least signal that the result is compromised. By using more elaborate analog front ends, the external noise can be suppressed. However, this often has to be bought with increased energy consumption. The power efficiency factor (PEF) provides a figure of merit for how efficiently noise is filtered with regards to energy consumption. The formula is depicted in Equation (1), where V n o i s e r m s is the root mean square (RMS) value of the input-referred noise, P t o t denotes the total drawn power, V t is the thermal voltage, k is the Boltzmann’s constant, T is the temperature in Kelvin, and B W is the bandwidth of the circuit. An efficient way of EEG signal conditioning is the implementation of chopper amplifiers. In [80], an analog frontend with a chopper amplifier is presented, where P E F = 3.8 is achieved. By stacking amplifier circuits, the chopper principle can be taken even further, and a P E F of 0.85 can be achieved [81].
P E F = V n o i s e r m s 2 2 P t o t π V t · 4 k T · B W
Internal noise is produced within the EEG signal bandwidth. This means that it has to be suppressed algorithmically. Independent component analysis (ICA) is one of those algorithms and is implemented in order to reject eye blink artifacts. Typically, ICA is a statistical method applied to static data. However, in [82], an EEG system is proposed that implements an ICA variant. This ICA version specifically allows the real-time processing of EEG signals. This results in a more robust signal acquisition but also introduces latency between the neurological event and its detection by the EEG system. (In [82], a latency of 0.25 s has been introduced.) Furthermore, additional analog channels may have to be considered (a total of eight channels are used in [82]), resulting in an increase in scalp electrodes. This inevitably leads to a bulkier device, which contradicts the issues discussed under the point “Feasibility”. The algorithm proposed in [83] offers a remedy for this circumstance by implementing a curve fitting method that identifies eye blink artifacts by certain inflection points. After such an artifact has been detected, it is subtracted from the raw EEG signal. It has been shown that this method is feasible even for single-electrode setups.
4
Interpretability: “The result of the SoC shall be accessible and comprehensible.”
Ultimately, the computational result of the SoC has to be displayed to the medical personnel in order to enable patient evaluation. This circumstance poses two main challenges. Firstly, the transmission of the result data and, secondly, the comprehensibility of the data.
Regarding the challenge of data transmission, a mobile device shall be assumed. Given this requirement, the favorable transmission method would be wireless technology. However, using wireless media brings up the question of whether data processing shall be carried out on the SoC or remotely (e.g., on the displaying device). This consideration does not only include concerns regarding the energy consumption of the SoC but also privacy issues. In case processing is conducted locally on the NEBA device, the transmitted data hold highly concentrated, patient-specific data. These data may be relevant with respect to patient–doctor confidentiality and therefore have to be encrypted. Hence, the SoC also has to implement encryption functionality, which further increases the complexity. If only raw data are sent, encryption is optional since the expressiveness of such data is limited. In [76], it was decided to implement the processing on the SoC. The main driver for this decision was the gain in flexibility on the receiver end. Processing results are sent via the Bluetooth Low Energy protocol. This means that any device that supports that protocol (i.e., virtually any modern smartphone, tablet, or laptop) can receive the results of the SoC. However, data privacy was no concern of this publication.
Any serious diagnostic and therapeutic method has to be comprehensible. With regards to NEBAs, this means that the data on which the final decision is based on have to be expressive and have to be accessible to the medical personnel. A prime example for expressiveness has already been given with the X-ray image in Section 4. Although otherwise promising, traditional neural networks are the opposite of expressive. The output of such a network is often limited to a boolean value, which leaves no space for additional interpretation. The evaluation of the neural network’s neurons is no remedy either since their causal relationship is hard to analyze. Without further efforts, neural networks are, therefore, not fit for therapeutic or diagnostic applications. One of such efforts is presented in [84], where an additional explanatory layer is introduced. This layer provides a heat map that allows the interpretation of the neural network’s decision. By giving that possibility, the method qualifies itself for clinical usage.

6. Conclusions

This paper gave an overview of the pathology of ADHD, EEG as a diagnostic tool, and conventional EEG-supported diagnosis of ADHD. Potential new measurement modes, which aim for more accurate ADHD diagnoses, have been presented. A system-level design framework has been shown, which shall enable fast and cost-effective development of NEBAs. Finally, design considerations regarding EEG-related SoCs have been taken into account and have been discussed.
The shown methods indicate that there is still considerable room for improvement in NEBAs, especially with regards to accuracy, feasibility, interpretability, and robustness. The application of SoCs enables the implementation of new and more complex algorithms while simultaneously allowing mobile and wireless operation. This is especially evident when comparing the novel designs to the traditional TBR-based systems. Preliminary studies achieve an accuracy of 93.65 % , whereas the accuracy of TBR-based methods has not gone beyond 54 % . By implementing new development principles, such as system-level frameworks, NEBA devices can be made cheap and accessible, thus enabling widespread clinical usage.

Author Contributions

D.F. conducted the literature search and wrote the paper under supervision and guidance of N.T. In addition to providing input and comments, N.T. reviewed and edited the paper. All authors have read and agreed to the published version of the manuscript.

Funding

Open Access Funding by TU Wien.

Institutional Review Board Statement

Not applicable.

Informed Consent Statement

Not applicable.

Conflicts of Interest

The author declares no conflict of interest.

References

  1. International Statistical Classification of Diseases and Related Health Problems Online Catalog. Available online: https://icd.who.int/browse10/2016/en (accessed on 30 January 2022).
  2. Diagnostic and Statistical Manual of Mental Disorders. Available online: https://www.psychiatry.org/psychiatrists/practice/dsm/history-of-the-dsm (accessed on 30 January 2022).
  3. Willcutt, E.G. The Prevalence of DSM-IV Attention-Deficit/Hyperactivity Disorder: A Meta-Analytic Review. Neurotherapeutics 2012, 9, 490–499. [Google Scholar] [CrossRef] [Green Version]
  4. Cowen, P.; Harrison, P.; Burns, T. Shorter Oxford Textbook of Psychiatry; OUP Oxford: Oxford, UK, 2012. [Google Scholar]
  5. Perego, P.; Rahmani, A.M.; Taherinejad, N. Wireless Mobile Communication and Healthcare; Lecture Notes of the Institute for Computer Sciences, Social Informatics and Telecommunications Engineering; Springer International Publishing: Berlin/Heidelberg, Germany, 2018. [Google Scholar]
  6. Yin, H.; Ozge Akmandor, A.; Mosenia, A.; K. Jha, N. Smart healthcare. In Foundations and Trends® in Electronic Design Automation; Foundations and Trends in Electronic Design Automation: Boston, MA, USA, 2018; Volume 2, pp. 401–466. [Google Scholar]
  7. Perego, P.; Taherinejad, N.; Caon, M. Wearables in Healthcare; Lecture Notes of the Institute for Computer Sciences, Social Informatics and Telecommunications Engineering Book Series (LNICST, Volume 376); Springer International Publishing: Berlin/Heidelberg, Germany, 2021. [Google Scholar]
  8. Götzinger, M.; Taherinejad, N.; Rahmani, A.M.; Liljeberg, P.; Jantsch, A.; Tenhunen, H. Enhancing the early warning score system using data confidence. In Proceedings of the 6th International Conference, MobiHealth 2016, Milan, Italy, 14–16 November 2016; Springer: Berlin/Heidelberg, Germany, 2016; pp. 91–99. [Google Scholar]
  9. Götzinger, M.; Azanpour, A.; Azimi, I.; Taherinejad, N.; Rahmani, A.M. Enhancing the Self-Aware Early Warning Score System through Fuzzified Data Reliability Assessment. In Proceedings of the 6th International Conference, MobiHealth 2016, Milan, Italy, 14–16 November 2016; Springer: Berlin/Heidelberg, Germany, 2017. [Google Scholar]
  10. Anzanpour, A.; Azimi, I.; Götzinger, M.; Rahmani, A.M.; TaheriNejad, N.; Liljeberg, P.; Jantsch, A.; Dutt, N. Self-Awareness in Remote Health Monitoring Systems using Wearable Electronics. In Proceedings of the Design and Test Europe Conference (DATE), Lausanne, Switzerland, 27–31 March 2017. [Google Scholar]
  11. Götzinger, M.; Anzanpour, A.; Azimi, I.; TaheriNejad, N.; Jantsch, A.; Rahmani, A.; Liljeberg, P. Confidence-Enhanced Early Warning Score Based on Fuzzy Logic. Mob. Netw. Appl. 2019, 1–18. [Google Scholar] [CrossRef] [Green Version]
  12. TaheriNejad, N.; Rahmati, Y. Blood Pressure Estimation using a Single PPG Signal. In Proceedings of the 2nd EAI International Conference on Wearables in Healthcare (Healthwear 2020), Virtual Event, 9–11 June 2020; pp. 1–9. [Google Scholar]
  13. Hadizadeh, E.; Elmi, M.; TaheriNejad, N.; Fotowat, A.; Mirabbasi, S. A Low-Power Signal-Dependent Sampling Technique: Analysis, Implementation, and Application. IEEE Trans. Circuits Syst. I Regul. Pap. 2020, 67, 4334–4347. [Google Scholar]
  14. Hafshejani, E.H.; TaheriNejad, N.; Rabbani, R.; Azizi, Z.; Mohin, S.; Fotowat-Ahmady, A.; Mirabbasi, S. Self-aware Data Processing for Power Saving in Resource-Constrained IoT Cyber-Physical Systems. IEEE Sens. J. 2021, 1–12. [Google Scholar] [CrossRef]
  15. TaheriNejad, N.; Pollreisz, D. Assessment of Physiological Signals during Happiness, Sadness, Pain or Anger. In Proceedings of the 6th International Conference, MobiHealth 2016, Milan, Italy, 14–16 November 2016. [Google Scholar]
  16. Pollreisz, D.; TaheriNejad, N. A simple algorithm for emotion recognition, using physiological signals of a smart watch. In Proceedings of the 2017 39th Annual International Conference of the IEEE Engineering in Medicine and Biology Society (EMBC), Jeju Island, Korea, 11–15 July 2017; pp. 2353–2356. [Google Scholar] [CrossRef]
  17. Miller, T.; Leger, M.C. A Very Childish Moral Panic: Ritalin. J. Med. Humanit. 2003, 24, 9–33. [Google Scholar] [CrossRef]
  18. Mieszkowski, K. Scientology’s War on Psychiatry. Available online: https://www.salon.com/2005/07/01/sci_psy/ (accessed on 30 January 2022).
  19. Thapar, A.; Cooper, M. Attention deficit hyperactivity disorder. Lancet 2016, 387, 1240–1250. [Google Scholar] [CrossRef]
  20. Singh, I. Beyond polemics: Science and ethics of ADHD. Nat. Rev. Neurosci. 2009, 9, 957–964. [Google Scholar] [CrossRef]
  21. Konrad, K.; Eickhoff, S.B. Is the ADHD brain wired differently? A review on structural and functional connectivity in attention deficit hyperactivity disorder. Hum. Brain Mapp. 2010, 31, 904–916. [Google Scholar] [CrossRef]
  22. Polanczyk, G.V.; Salum, G.A.; Sugaya, L.S.; Caye, A.; Rohde, L.A. Annual Research Review: A meta-analysis of the worldwide prevalence of mental disorders in children and adolescents. J. Child Psychol. Psychiatry 2015, 56, 345–365. [Google Scholar] [CrossRef]
  23. Meltzer, H.; Gatward, R.; Goodman, R.; Ford, T. Mental health of children and adolescents in Great Britain. Int. Rev. Psychiatry 2003, 15, 185–187. [Google Scholar] [CrossRef]
  24. Lichtenstein, P.; Carlström, E.; Råstam, M.; Gillberg, C.; Anckarsäter, H. The Genetics of Autism Spectrum Disorders and Related Neuropsychiatric Disorders in Childhood. Am. J. Psychiatry 2010, 167, 1357–1363. [Google Scholar] [CrossRef] [PubMed] [Green Version]
  25. Jensen, C.M.; Steinhausen, H.C. Comorbid mental disorders in children and adolescents with attention-deficit/hyperactivity disorder in a large nationwide study. ADHD Atten. Deficit Hyperact. Disord. 2014, 7, 27–38. [Google Scholar] [CrossRef] [PubMed]
  26. Ahuja, A.; Martin, J.; Langley, K.; Thapar, A. Intellectual Disability in Children with Attention Deficit Hyperactivity Disorder. J. Pediatr. 2013, 163, 890–895.e1. [Google Scholar] [CrossRef] [PubMed] [Green Version]
  27. Swanson, J.M.; Kinsbourne, M.; Nigg, J.; Lanphear, B.; Stefanatos, G.A.; Volkow, N.; Taylor, E.; Casey, B.J.; Castellanos, F.X.; Wadhwa, P.D. Etiologic Subtypes of Attention-Deficit/Hyperactivity Disorder: Brain Imaging, Molecular Genetic and Environmental Factors and the Dopamine Hypothesis. Neuropsychol. Rev. 2007, 17, 39–59. [Google Scholar] [CrossRef] [PubMed]
  28. Russell, V.A. Overview of Animal Models of Attention Deficit Hyperactivity Disorder (ADHD). Curr. Protoc. Neurosci. 2011, 54, 9.35.1–9.35.25. [Google Scholar] [CrossRef]
  29. Sontag, T.A.; Tucha, O.; Walitza, S.; Lange, K.W. Animal models of attention deficit/hyperactivity disorder (ADHD): A critical review. ADHD Atten. Deficit Hyperact. Disord. 2010, 2, 1–20. [Google Scholar] [CrossRef]
  30. Faraone, S.V.; Biederman, J.; Monuteaux, M.C. Toward guidelines for pedigree selection in genetic studies of attention deficit hyperactivity disorder. Genet. Epidemiol. 2000, 18, 1–16. [Google Scholar] [CrossRef]
  31. Thapar, A.; Cooper, M.; Eyre, O.; Langley, K. Practitioner Review: What have we learnt about the causes of ADHD? J. Child Psychol. Psychiatry 2012, 54, 3–16. [Google Scholar] [CrossRef] [Green Version]
  32. Bhutta, A.T.; Cleves, M.A.; Casey, P.H.; Cradock, M.M.; Anand, K.J.S. Cognitive and Behavioral Outcomes of School-Aged Children Who Were Born Preterm. JAMA 2002, 288, 728. [Google Scholar] [CrossRef]
  33. Liew, Z.; Ritz, B.; Rebordosa, C.; Lee, P.C.; Olsen, J. Acetaminophen Use During Pregnancy, Behavioral Problems, and Hyperkinetic Disorders. JAMA Pediatr. 2014, 168, 313. [Google Scholar] [CrossRef] [Green Version]
  34. Thompson, J.M.D.; Waldie, K.E.; Wall, C.R.; Murphy, R.; Mitchell, E.A. Associations between Acetaminophen Use during Pregnancy and ADHD Symptoms Measured at Ages 7 and 11 Years. PLoS ONE 2014, 9, e108210. [Google Scholar] [CrossRef] [PubMed] [Green Version]
  35. National Institute for Health and Care Excellence Clinical Guideline 72: Attention Deficit Hyperactivity Disorder: Diagnosis and Management of ADHD in Children, Young People and Adults. Available online: https://www.nice.org.uk/guidance/cg72 (accessed on 30 January 2022).
  36. Taylor, E.; Döpfner, M.; Sergeant, J.; Asherson, P.; Banaschewski, T.; Buitelaar, J.; Coghill, D.; Danckaerts, M.; Rothenberger, A.; Sonuga-Barke, E.; et al. European clinical guidelines for hyperkinetic disorder—First upgrade. Eur. Child Adolesc. Psychiatry 2004, 13, 17–30. [Google Scholar] [CrossRef] [PubMed]
  37. Brown, R.T.; DuPaul, G.; Earls, M.; Feldman, H.M.; Ganiats, T.G.; Kaplanek, B.; Meyer, B.; Perrin, J.; Pierce, K.; Reiff, M.; et al. ADHD: Clinical Practice Guideline for the Diagnosis, Evaluation, and Treatment of Attention-Deficit/Hyperactivity Disorder in Children and Adolescents. Pediatrics 2011, 128, 1007–1022. [Google Scholar] [CrossRef] [Green Version]
  38. Kempton, S.; Vance, A.; Maruff, P.; Luk, E.; Costin, J.; Pantelis, C. Executive function and attention deficit hyperactivity disorder: Stimulant medication and better executive function performance in children. Psychol. Med. 1999, 29, 527–538. [Google Scholar] [CrossRef] [PubMed]
  39. Storebø, O.J.; Ramstad, E.; Krogh, H.B.; Nilausen, T.D.; Skoog, M.; Holmskov, M.; Rosendal, S.; Groth, C.; Magnusson, F.L.; Moreira-Maia, C.R.; et al. Methylphenidate for children and adolescents with attention deficit hyperactivity disorder (ADHD). Cochrane Database Syst. Rev. 2015, 2015, CD009885. [Google Scholar] [CrossRef] [Green Version]
  40. Schachter, H.M.; Pham, B.; King, J.; Langford, S.; Moher, D. How efficacious and safe is short-acting methylphenidate for the treatment of attention-deficit disorder in children and adolescents? A meta-analysis. CMAJ 2001, 165, 1475–1488. [Google Scholar]
  41. Faraone, S.V.; Biederman, J.; Morley, C.P.; Spencer, T.J. Effect of Stimulants on Height and Weight: A Review of the Literature. J. Am. Acad. Child Adolesc. Psychiatry 2008, 47, 994–1009. [Google Scholar] [CrossRef]
  42. A 14-Month Randomized Clinical Trial of Treatment Strategies for Attention-Deficit/Hyperactivity Disorder. Arch. Gen. Psychiatry 1999, 56, 1073. [CrossRef]
  43. The Ten Twenty Electrode System: International Federation of Societies for Electroencephalography and Clinical Neurophysiology. Am. J. EEG Technol. 1961, 1, 13–19. [CrossRef]
  44. Klem, G.H.; LuÈders, H.O.; Jasper, H.; Elger, C. The Ten-Twenty Electrode System of the International Federation. Available online: http://media.journals.elsevier.com/content/files/clinph-chapter11-14082757.pdf (accessed on 11 February 2022).
  45. 10–20 Electrode Placement Guide. Available online: https://www.trans-cranial.com/docs/10_20_pos_man_v1_0_pdf.pdf (accessed on 11 February 2022).
  46. Ratti, E.; Waninger, S.; Berka, C.; Ruffini, G.; Verma, A. Comparison of Medical and Consumer Wireless EEG Systems for Use in Clinical Trials. Front. Hum. Neurosci. 2017, 11, 398. [Google Scholar] [CrossRef] [Green Version]
  47. IFCN. Recommendations for the Practice of Clinical Neurophysiology: Guidelines of the IFCN. Clin. Neurophysiol. 1999. Available online: https://www.journals.elsevier.com/clinical-neurophysiology/view-for-free/guidelines-of-the-ifcn-2nd-ed-published-1999 (accessed on 11 February 2022).
  48. Peng, G.; Nourani, M.; Harvey, J.; Dave, H. Feature Selection Using F-Statistic Values for EEG Signal Analysis; IEEE: New York, NY, USA, 2020; pp. 5963–5966. [Google Scholar] [CrossRef]
  49. Saby, J.N.; Marshall, P.J. The Utility of EEG Band Power Analysis in the Study of Infancy and Early Childhood. Dev. Neuropsychol. 2012, 37, 253–273. [Google Scholar] [CrossRef] [PubMed]
  50. Jasper, H.H.; Solomon, P.; Bradley, C. Electroencephalographic analyses of behavior problem children. Am. J. Psychiatry 1938, 95, 641–658. [Google Scholar] [CrossRef]
  51. FDA. FDA Permits Marketing of First Brain Wave Test to Help Assess Children and Teens for ADHD. Available online: https://web.archive.org/web/20130925093434/http://www.fda.gov/NewsEvents/Newsroom/PressAnnouncements/ucm360811.htm (accessed on 30 January 2022).
  52. Snyder, S.M.; Rugino, T.A.; Hornig, M.; Stein, M.A. Integration of an EEG biomarker with a clinician’s ADHD evaluation. Brain Behav. 2015, 5, e00330. [Google Scholar] [CrossRef] [PubMed]
  53. Quintana, H.; Snyder, S.M.; Purnell, W.; Aponte, C.; Sita, J. Comparison of a standard psychiatric evaluation to rating scales and EEG in the differential diagnosis of attention-deficit/hyperactivity disorder. Psychiatry Res. 2007, 152, 211–222. [Google Scholar] [CrossRef]
  54. Buyck, I.; Wiersema, J.R. Resting electroencephalogram in attention deficit hyperactivity disorder: Developmental course and diagnostic value. Psychiatry Res. 2014, 216, 391–397. [Google Scholar] [CrossRef]
  55. Liechti, M.D.; Valko, L.; Müller, U.C.; Döhnert, M.; Drechsler, R.; Steinhausen, H.C.; Brandeis, D. Diagnostic Value of Resting Electroencephalogram in Attention-Deficit/Hyperactivity Disorder Across the Lifespan. Brain Topogr. 2012, 26, 135–151. [Google Scholar] [CrossRef] [Green Version]
  56. Loo, S.K.; McGough, J.J.; McCracken, J.T.; Smalley, S.L. Parsing heterogeneity in attention-deficit hyperactivity disorder using EEG -based subgroups. J. Child Psychol. Psychiatry 2017, 59, 223–231. [Google Scholar] [CrossRef]
  57. Lenartowicz, A.; Loo, S.K. Use of EEG to Diagnose ADHD. Curr. Psychiatry Rep. 2014, 16, 498. [Google Scholar] [CrossRef] [Green Version]
  58. Esteller, R.; Vachtsevanos, G.; Echauz, J.; Litt, B. A comparison of waveform fractal dimension algorithms. IEEE Trans. Circuits Syst. I Fundam. Theory Appl. 2001, 48, 177–183. [Google Scholar] [CrossRef] [Green Version]
  59. Stoica, P.; Moses, R. Introduction to Spectral Analysis; Prentice Hall: Upper Saddle River, NJ, USA, 1997; Volume 1. [Google Scholar]
  60. Principe, J.C.; Lo, P.C. Towards the determination of the largest Lyapunov exponent of EEG segments. Meas. Chaos Hum. Brain 1991, 86, 156–166. [Google Scholar]
  61. Meyer, P.E.; Schretter, C.; Bontempi, G. Information-Theoretic Feature Selection in Microarray Data Using Variable Complementarity. IEEE J. Sel. Top. Signal Process. 2008, 2, 261–274. [Google Scholar] [CrossRef]
  62. Peng, H.; Long, F.; Ding, C. Feature selection based on mutual information criteria of max-dependency, max-relevance, and min-redundancy. IEEE Trans. Pattern Anal. Mach. Intell. 2005, 27, 1226–1238. [Google Scholar] [CrossRef]
  63. Mohammadi, M.R.; Khaleghi, A.; Nasrabadi, A.M.; Rafieivand, S.; Begol, M.; Zarafshan, H. EEG classification of ADHD and normal children using non-linear features and neural network. Biomed. Eng. Lett. 2016, 6, 66–73. [Google Scholar] [CrossRef]
  64. Leroy, A.; Petit, G.; Zarka, D.; Cebolla, A.; Palmero-Soler, E.; Strul, J.; Dan, B.; Verbanck, P.; Cheron, G. EEG Dynamics and Neural Generators in Implicit Navigational Image Processing in Adults with ADHD. Neuroscience 2018, 373, 92–105. [Google Scholar] [CrossRef] [PubMed]
  65. Jouzizadeh, M.; Khanbabaie, R.; Ghaderi, A.H. A spatial profile difference in electrical distribution of resting-state EEG in ADHD children using sLORETA. Int. J. Neurosci. 2020, 130, 917–925. [Google Scholar] [CrossRef]
  66. Taleb, T.; Bottazzi, D.; Guizani, M.; Nait-Charif, H. Angelah: A framework for assisting elders at home. IEEE J. Sel. Areas Commun. 2009, 27, 480–494. [Google Scholar] [CrossRef] [Green Version]
  67. Müller-Putz, G.R. Tools for brain-computer interaction: A general concept for a hybrid BCI. Front. Neuroinform. 2011, 5, 30. [Google Scholar] [CrossRef] [Green Version]
  68. Feng, S.; Quivira, F.; Schirner, G. Framework for Rapid Development of Embedded Human-in-the-Loop Cyber-Physical Systems. In Proceedings of the 2016 IEEE 16th International Conference on Bioinformatics and Bioengineering (BIBE), Taichung, Taiwan, 31 October–2 November 2016. [Google Scholar] [CrossRef]
  69. Undulator (EEG Machine). Available online: https://braintour.harvard.edu/archives/portfolio-items/undulator-eeg-machine (accessed on 30 January 2022).
  70. Available online: https://ear-eeg.org/ (accessed on 28 November 2021).
  71. Wei, Y.; Zhou, J.; Wang, Y.; Liu, Y.; Liu, Q.; Luo, J.; Wang, C.; Ren, F.; Huang, L. A Review of Algorithm & Hardware Design for AI-Based Biomedical Applications. IEEE Trans. Biomed. Circuits Syst. 2020, 14, 145–163. [Google Scholar] [CrossRef]
  72. Page, A.; Sagedy, C.; Smith, E.; Attaran, N.; Oates, T.; Mohsenin, T. A Flexible Multichannel EEG Feature Extractor and Classifier for Seizure Detection. IEEE Trans. Circuits Syst. II Express Briefs 2015, 62, 109–113. [Google Scholar] [CrossRef]
  73. Tsou, C.; Liao, C.C.; Lee, S.Y. Epilepsy Identification System with Neural Network Hardware Implementation. In Proceedings of the 2019 IEEE International Conference on Artificial Intelligence Circuits and Systems (AICAS), Hsinchu, Taiwan, 18–20 March 2019. [Google Scholar] [CrossRef]
  74. Smetanin, N.; Lebedev, M.A.; Ossadtchi, A. Towards Zero-Latency Neurofeedback; Cold Spring Harbor Laboratory: Woodbury, NY, USA, 2018. [Google Scholar] [CrossRef] [Green Version]
  75. Huang, Y.D.; Wang, K.Y.; Ho, Y.L.; He, C.Y.; Fang, W.C. An Edge AI System-on-Chip Design with Customized Convolutional-Neural-Network Architecture for Real-time EEG-Based Affective Computing System. In Proceedings of the 2019 IEEE Biomedical Circuits and Systems Conference (BioCAS), Nara, Japan, 17–19 October 2019. [Google Scholar] [CrossRef]
  76. Imtiaz, S.A.; Jiang, Z.; Rodriguez-Villegas, E. An Ultralow Power System on Chip for Automatic Sleep Staging. IEEE J. Solid-State Circuits 2017, 52, 822–833. [Google Scholar] [CrossRef]
  77. Conti, F.; Schilling, R.; Schiavone, P.D.; Pullini, A.; Rossi, D.; Gurkaynak, F.K.; Muehlberghuber, M.; Gautschi, M.; Loi, I.; Haugou, G.; et al. An IoT Endpoint System-on-Chip for Secure and Energy-Efficient Near-Sensor Analytics. IEEE Trans. Circuits Syst. I Regul. Pap. 2017, 64, 2481–2494. [Google Scholar] [CrossRef] [Green Version]
  78. Sridhara, S.R.; DiRenzo, M.; Lingam, S.; Lee, S.J.; Blazquez, R.; Maxey, J.; Ghanem, S.; Lee, Y.H.; Abdallah, R.; Singh, P.; et al. Microwatt Embedded Processor Platform for Medical System-on-Chip Applications. IEEE J. Solid-State Circuits 2011, 46, 721–730. [Google Scholar] [CrossRef]
  79. Kam, J.W.; Griffin, S.; Shen, A.; Patel, S.; Hinrichs, H.; Heinze, H.J.; Deouell, L.Y.; Knight, R.T. Systematic comparison between a wireless EEG system with dry electrodes and a wired EEG system with wet electrodes. NeuroImage 2019, 184, 119–129. [Google Scholar] [CrossRef] [PubMed]
  80. Lee, C.J.; Song, J.I. A Chopper Stabilized Current-Feedback Instrumentation Amplifier for EEG Acquisition Applications. IEEE Access 2019, 7, 11565–11569. [Google Scholar] [CrossRef]
  81. Mondal, S.; Hall, D.A. An ECG chopper amplifier achieving 0.92 NEF and 0.85 PEF with AC-coupled inverter-stacking for noise efficiency enhancement. In Proceedings of the 2017 IEEE International Symposium on Circuits and Systems (ISCAS), Baltimore, MD, USA, 28–31 May 2017. [Google Scholar] [CrossRef]
  82. Liao, J.C.; Shih, W.Y.; Huang, K.J.; Fang, W.C. An online recursive ICA based real-time multichannel EEG system on chip design with automatic eye blink artifact rejection. In Proceedings of the 2013 International Symposium onVLSI Design, Automation, and Test (VLSI-DAT), Hsinchu, Taiwan, 22–24 April 2013. [Google Scholar] [CrossRef]
  83. Zhang, S.; McIntosh, J.; Shadli, S.M.; Neo, P.S.H.; Huang, Z.; McNaughton, N. Removing eye blink artefacts from EEG—A single-channel physiology-based method. J. Neurosci. Methods 2017, 291, 213–220. [Google Scholar] [CrossRef]
  84. Sturm, I.; Lapuschkin, S.; Samek, W.; Müller, K.R. Interpretable deep neural networks for single-trial EEG classification. J. Neurosci. Methods 2016, 274, 141–145. [Google Scholar] [CrossRef] [PubMed] [Green Version]
Figure 1. An extract of the results adapted with permission from Ref. [64], © 2018 IBRO. The two image columns show current density distributions within the brain, which have been captured by swLORETA during an ERP run.
Electronics 11 00606 g001
Figure 2. Typical structure of an application built with the HiLCPS framework [68]. The four different device types, digital acquisition (DAQ), visualization, stimulus, and actuators, can be seen.
Electronics 11 00606 g002
Figure 3. The design workflow when using the HiLCPS framework [68].
Electronics 11 00606 g003
Figure 4. A hypothetical application structure of an EEG system built upon the HiLCPS framework.
Electronics 11 00606 g004
Figure 5. An example of a wearable EEG device [70].
Electronics 11 00606 g005
Listing 1. List of symptoms that are used in the diagnosis of ADHD via DSM5. The items in this list originate from the DSM5 catalog [2] and have been paraphrased by the author for conciseness. Note that the occurrence of one or more symptoms from this list does not necessarily indicate a positive ADHD diagnosis.
Electronics 11 00606 list001
Table 1. A comparison between relevant brain imaging technologies that allow functional analysis of brain mechanisms.
EEGfMRIfNIRS
Temporal resolutionHighLowHigh
Spatial resolutionLowHighLow
Measurement of
brain activity
DirectlyIndirectlyDirectly
Training neededSomeExtensivelySome
PortabilitySome systems
are protable
Not portableSome systems
are protable
Cost (USD)∼100+50 k+10 k+
Table 2. Examples for EEG frequency band systems.
Name[47][48][49]
Delta<4 Hz0.1–4 Hz1–3 Hz
Theta4–7 Hz4–8 Hz4–7 Hz
Alpha8–13 Hz8–12 Hz8–12 Hz
Beta14–40 Hz12–30 Hz13–30 Hz
Gamma>40 Hz30–57 Hz and 63–90 Hz30–100 Hz
Publisher’s Note: MDPI stays neutral with regard to jurisdictional claims in published maps and institutional affiliations.

