Article

Improved Noise Cancelling Algorithm for Electrocardiogram Based on Moving Average Adaptive Filter

by
Américo K. Tanji, Jr.
1,
Moacyr A. G. de Brito
1,
Marcos G. Alves
2,*,
Raymundo C. Garcia
1,
Gen-Lang Chen
2 and
Naji R. N. Ama
3
1
Electrical Engineering Department, Faculty of Engineering, Architecture and Urbanism and Geography, Federal University of Mato Grosso do Sul, Costa e Silva Avenue, Campo Grande 79070-900, MS, Brazil
2
School of Computing and Data Engineering, NingboTech University, Ningbo 315100, China
3
Electrical Engineering Department, Dom Bosco Catholic University, Campo Grande 79117-900, MS, Brazil
*
Author to whom correspondence should be addressed.
Electronics 2021, 10(19), 2366; https://doi.org/10.3390/electronics10192366
Submission received: 10 August 2021 / Revised: 16 September 2021 / Accepted: 23 September 2021 / Published: 28 September 2021
(This article belongs to the Special Issue New Technologies for Biomedical Circuits and Systems)

Abstract

:
The electrocardiogram (ECG) is basic equipment used in the diagnosis of cardiac illness. However, in non-developed countries, most of the population does not have access to medical tests, and many hospitals do not even have these ECGs. On the other hand, the electrical signals generated by the heart and acquired by the ECG have low power and are affected by electromagnetic interference (EMI), mainly produced by the electrical system. Filtering EMI when frequency varies is a challenging task. Within this context, this work aims to produce an easy-to-use low-cost ECG with good electromagnetic disturbances rejection. The proposed noise rejection system is composed of two moving average filters and a phase-locked-loop, namely 2MAV-PLL. The system operates with a low sampling frequency and attenuates the EMI noise present in the ECG signal regardless of the amplitude, obtaining a filtered signal with a 44-dB signal–noise ratio (SNR) between the frequencies of± 10 Hz of the fundamental frequency. Simulation and experimental results prove that the ECG system can attenuate the EMI using relatively low sampling frequency, giving adequate information for health professionals to properly evaluate an electrocardiogram.

1. Introduction

Worldwide, the most lethal diseases are associated to heart-related issues—accounting for 31% of deaths. Moreover, 75% of these deaths occur in third-world countries, where the population has limited access to a good health system. According to data from the World Health Organization, approximately 17.9 million deaths occur every year [1].
In Brazil, according to data from Healthy Ministry, 358 thousand people died in 2017 with cardiovascular diseases (CVDs) as the main cause. This number corresponds to 27% of all deaths that occurred in Brazil in the same period, a number statistically equal to that of the last five years [2].
Among the existing apparatuses to diagnose CVDs, the electrocardiogram (ECG) stands out, which, among other advantages, is economically viable [3]. The exam consists of making a graphic or numerical record of the heart’s electrical signals using a device called an electrocardiograph. Through the interpretation of the acquired data, it is possible to early diagnose CVDs.
The electrocardiograph was developed during an important era of the union between engineering and medicine (biomedical engineering)—the 20th century. The ECG is an exam that can be executed in different types of health units, not just in hospitals, and more recently, devices for self-monitoring, such as watches, bracelets, cell phones, among others that can measure heart rate, number of step walks, oximetry, and blood pressure [4]. Medicine, taking advantage of the new technologies that are being developed, invests in telemedicine and telemonitoring fields, mainly to monitor patients with comorbidities or who are immunosuppressed, thus preventing them from going to health units or helping to choose the best moment to look for help [5]. In [4], a new type of dry electrode (capacitive type) is proposed to acquire the ECG signal to be incorporated into shirts, improving the comfort of patients who need constant monitoring compared to current silver wet electrodes. In [5], the authors present a remote monitoring, diagnosis, and treatment system to increase the effectiveness and efficiency of health professionals, which also suggests treatment and exam interpretations of patients who are distant or in loco.
Many of the developed innovations are continuously being improved, and concerning electrocardiograms, the research is focused on enhancing the signal-to-noise ratio (SNR) and the automated identification of anomalies present in the graphic records [6].
A common problem observed during the design and development of this equipment is the filtering of noise and disturbances that interfere with bioelectrical signals. Several factors can favor signal distortion, but the most common condition is the electromagnetic interference (EMI) through the electrical power grid, mainly in the cables that connect the patient to the electrocardiogram [7].
EMI noise can appear in the ECG signals also coming from the patient’s own body, usually generated by medical equipment used for treatment such as the Left Ventricular Assist Device (LVAD). Studies such as [8] indicate that the electromechanical pumps used in LVADs to assist in pumping blood to the patient’s body cause EMI in ECG signals. The EMI has the fundamental frequency of the pump speed, which may depend on the manufacturer, but they are normally above 40 Hz.
Many algorithms have been proposed over the years for EMI noise suppression in bioelectric signals. Classical techniques were deeply developed during the years 1980 and 1990, as shown in [7,9,10]. These techniques are based on band-pass filters (digital or analog), which can be tuned with different bandwidths. Narrowband filters present issues when subjected to grid frequency variations, but present good noise suppression responses. Broadband filters have a poor response and filtering quality, but do not suffer from variations in the fundamental grid frequency.
Improvements in the classical techniques can be seen in the works presented in [11,12,13,14]. The filtering techniques are tested digitally with ECG signals added to sinusoidal noises at the frequency of the network and with amplitude up to four times greater.
In [11], a finite impulse response filter (FIR) of the equiripple type is applied. It is improved by hardware simplification with coefficient adjustment to zero (HSSCZ) and hardware simplification by coefficient convergence (HSCC). The combination of these techniques resulted in an SNR attenuation of 13.1 dB with a bandwidth for the cut-off frequency of ±1 Hz in relation to the nominal frequency of the electrical grid. However, this solution is far less than the recommended by the international standard OIML/R-90 of at least 30 dB of SNR in the output signal and 2% variation of the nominal power grid frequency [15].
In [12], an algorithm based on the sliding discrete Fourier transform adjusted by a phase-locked-loop (PLL) is proposed, namely the SDFT-PLL algorithm. Noise attenuation was obtained at an SNR of 40 dB at a sampling frequency of 25.6 kHz, which complicates its implementation in technologies with low computational power.
In [13], a comparison is made among Kalman filter, Least Mean Squares (LMS), Wavelet (UWT), and low-pass type FIR filter. The Kalman filter exhibited the best performance, with an SNR attenuation of 15 dB. However, it presented a reduction in performance against noise frequencies lower than the nominal one.
In [14], a low-cost equipment was developed, with a simple channel and with a three-way cable for the acquisition of the ECG signal. To eliminate noise, a third-order Butterworth bandpass filter with a 0.5 Hz to 35.0 Hz bandwidth is used. The authors do not present an SNR value for the output signal, but readers can verify in the results the residual noise and attenuation of the R waves.
Moving average filters are found in [16,17,18]. They are tested in ECG signals with fixed frequency noises. The absence of adaptability to noise signals with unstable frequency makes these filters unsuitable for environments with such conditions.
Additionally, conventional notch filters are commonly applied to reject the power line interference (50/60 Hz and harmonics) [8]. However, conventional notch filters have fixed parameters considering that the frequencies to be rejected have fixes values. Therefore, a variation in the AC fundamental frequency reduces the capability of the notch filter to reject the power line interference. Thus, an adaptive filtering process defined by the measurement of the interference frequency would be suitable for the rejection of interferences that may affect an ECG.
In this context, the purpose of this work is to develop a new algorithm capable of eliminating the electromagnetic interference of ECG signals—the main cause of noise in exams [11]—through a variable order adaptive moving average filter tuned through the frequency of the noise provided with a moving average PLL for changing the number of samples [19]. It is imperative that the ECG signal maintains adequate signal/noise attenuation independent of variations in the amplitude or frequency of the noise. Even in extreme situations, when only two electrodes are used to read the ECG signal (differential mode), dispensing the use of the right leg electrode (reference). The algorithm must present an adequate response and the complete system must be low cost.
The proposed system has numerous advantages. The filter performance is not affected by the noise amplitude as it only depends on the frequency of the EMI noise and shows a good rejection response for the EMI harmonic content. Additionally, it is easy to modify the filter’s fundamental frequency by tuning the values of the sampling frequency. It is also worth mentioning that the number of samples (N) is updated at each iteration considering the EMI noise frequency to properly adapt the moving average filter. Conversely, as disadvantages, we may verify a cutting of 10% in the R-wave amplitude and a signal delay of 9.98 ms. However, these are minor drawbacks as they are within the standards.

2. Electrocardiogram Background

Anatomically, the cardiac muscle resembles a set of hydraulic pumps that are driven by electrical impulses and operate in a pulsatile manner, with four stages and two times. The chambers of blood are called atria (brush pumps), one being right (AD) and one left (AE), and the exit chambers (pumps) are called ventricles, one being right (RV) and one left (VE) [20].
Some heart structures are self-excitable, that is, they have an automatic electrical discharge process that regulates the rhythm of the heart’s beats per minute (BPM). These form the specialized conductive system. The sinus or sinoatrial node (SA) has a self-excitation frequency of 70 BPM and is the heart’s natural pacemaker. The energy generated at the SA node is conducted through the internodal pathways to the atrioventricular (AV) node, a secondary pacemaker, with a self-excitation frequency of 60 BPM (at this moment the signal is delayed until the atria complete their contraction). The AV node forwards the electrical impulse to the bundle of His or AV bundle that distributes the impulse between the right and left branches until it reaches the bundle of Purkinje fibers [21].
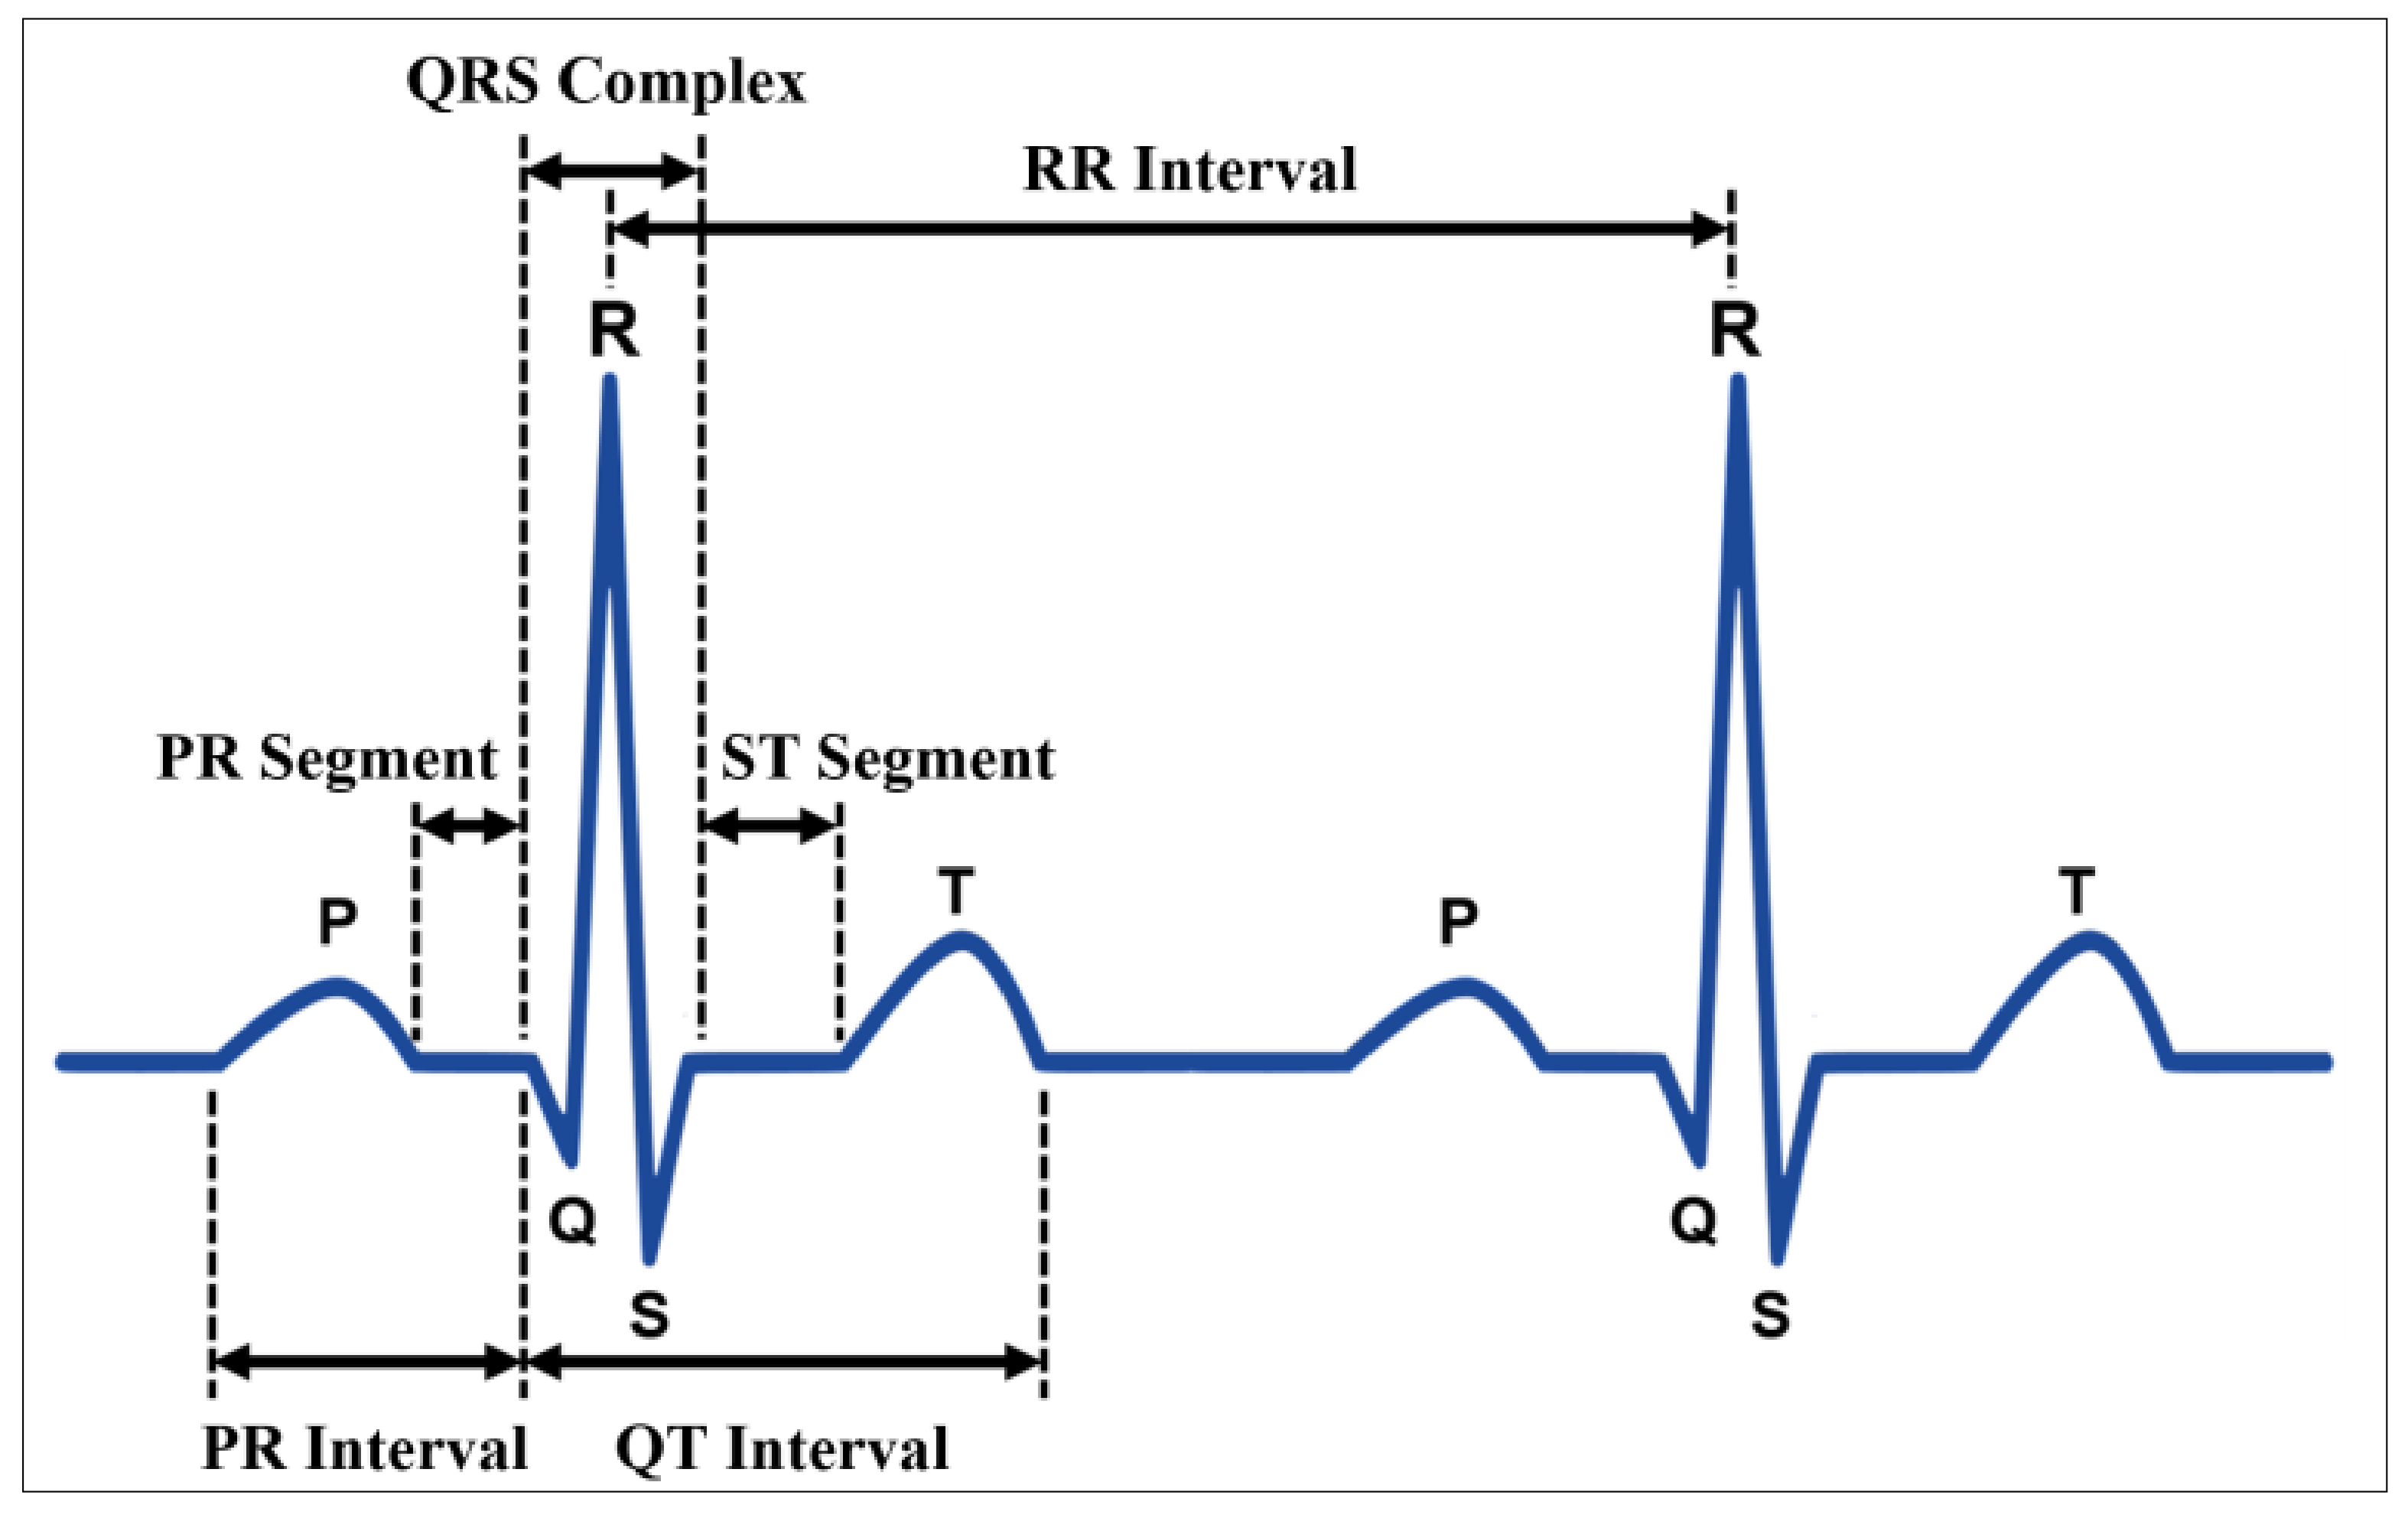
The electrocardiogram or electrocardiography is the record of the heart’s electrical activity and one of the equipment used to perform this record is the electrocardiograph. The recording of the electrical activities signals of the heart corresponds to the QRS complex, shown in Figure 1.
The P wave corresponds to the depolarization of the atria (muscle contraction moment), the depolarization of the ventricles is represented by the waves Q, R, and S while the T wave corresponds to repolarization (muscle relaxation). Atrial repolarization occurs simultaneously with ventricular depolarization, which hides the signal, as the atrial electrical potential is less than the ventricular one [20].
For the registration of the QRS complex, two planes of the human body are defined, the frontal or vertical plane, where are the bipolar (DI, DII, and DIII) and unipolar (aVR, aVL, and aVF) leads and the transversal or horizontal plane, where the precordial unipolar leads are (V1, V2, V3, V4, V5, and V6) [16]. The mathematical relationship between the electrical signals of each lead can be seen in Table 1 [20].
The normal ECG signal can be characterized as a quasi-periodic deterministic stationary signal; that is, a sum of several periodic signals with defined frequencies, considering a finite period of time.
The typical amplitude of the ECG signal varies according to the derivation under analysis and the position where the signal is captured. Usually, in the thorax, the maximum amplitude of the signal from the R wave peak to the valley of the S wave, in the DII derivation, is 5.0 mV, while in the limbs, the signal is 1.5 mV [20].
The most common reading frequency of the ECG signal is between direct current (0 Hz) and 150 Hz, depending on the analyzed wave. The P and T waves have a frequency spectrum between 0.05 Hz and 0.5 Hz, and the Q, R, and S waves are in the frequency spectrum of approximately 10 Hz. This for a heart rate of approximately 60 BPM. Knowing that the heart rate can vary from 40 BPM to more than four times this value, the frequency spectrum of the QRS complex will also increase [11,22,23]. Thus, the algorithm proposed in this work will operate with a bandwidth of DC up to 360 Hz to cover a wide possible range of ECGs.
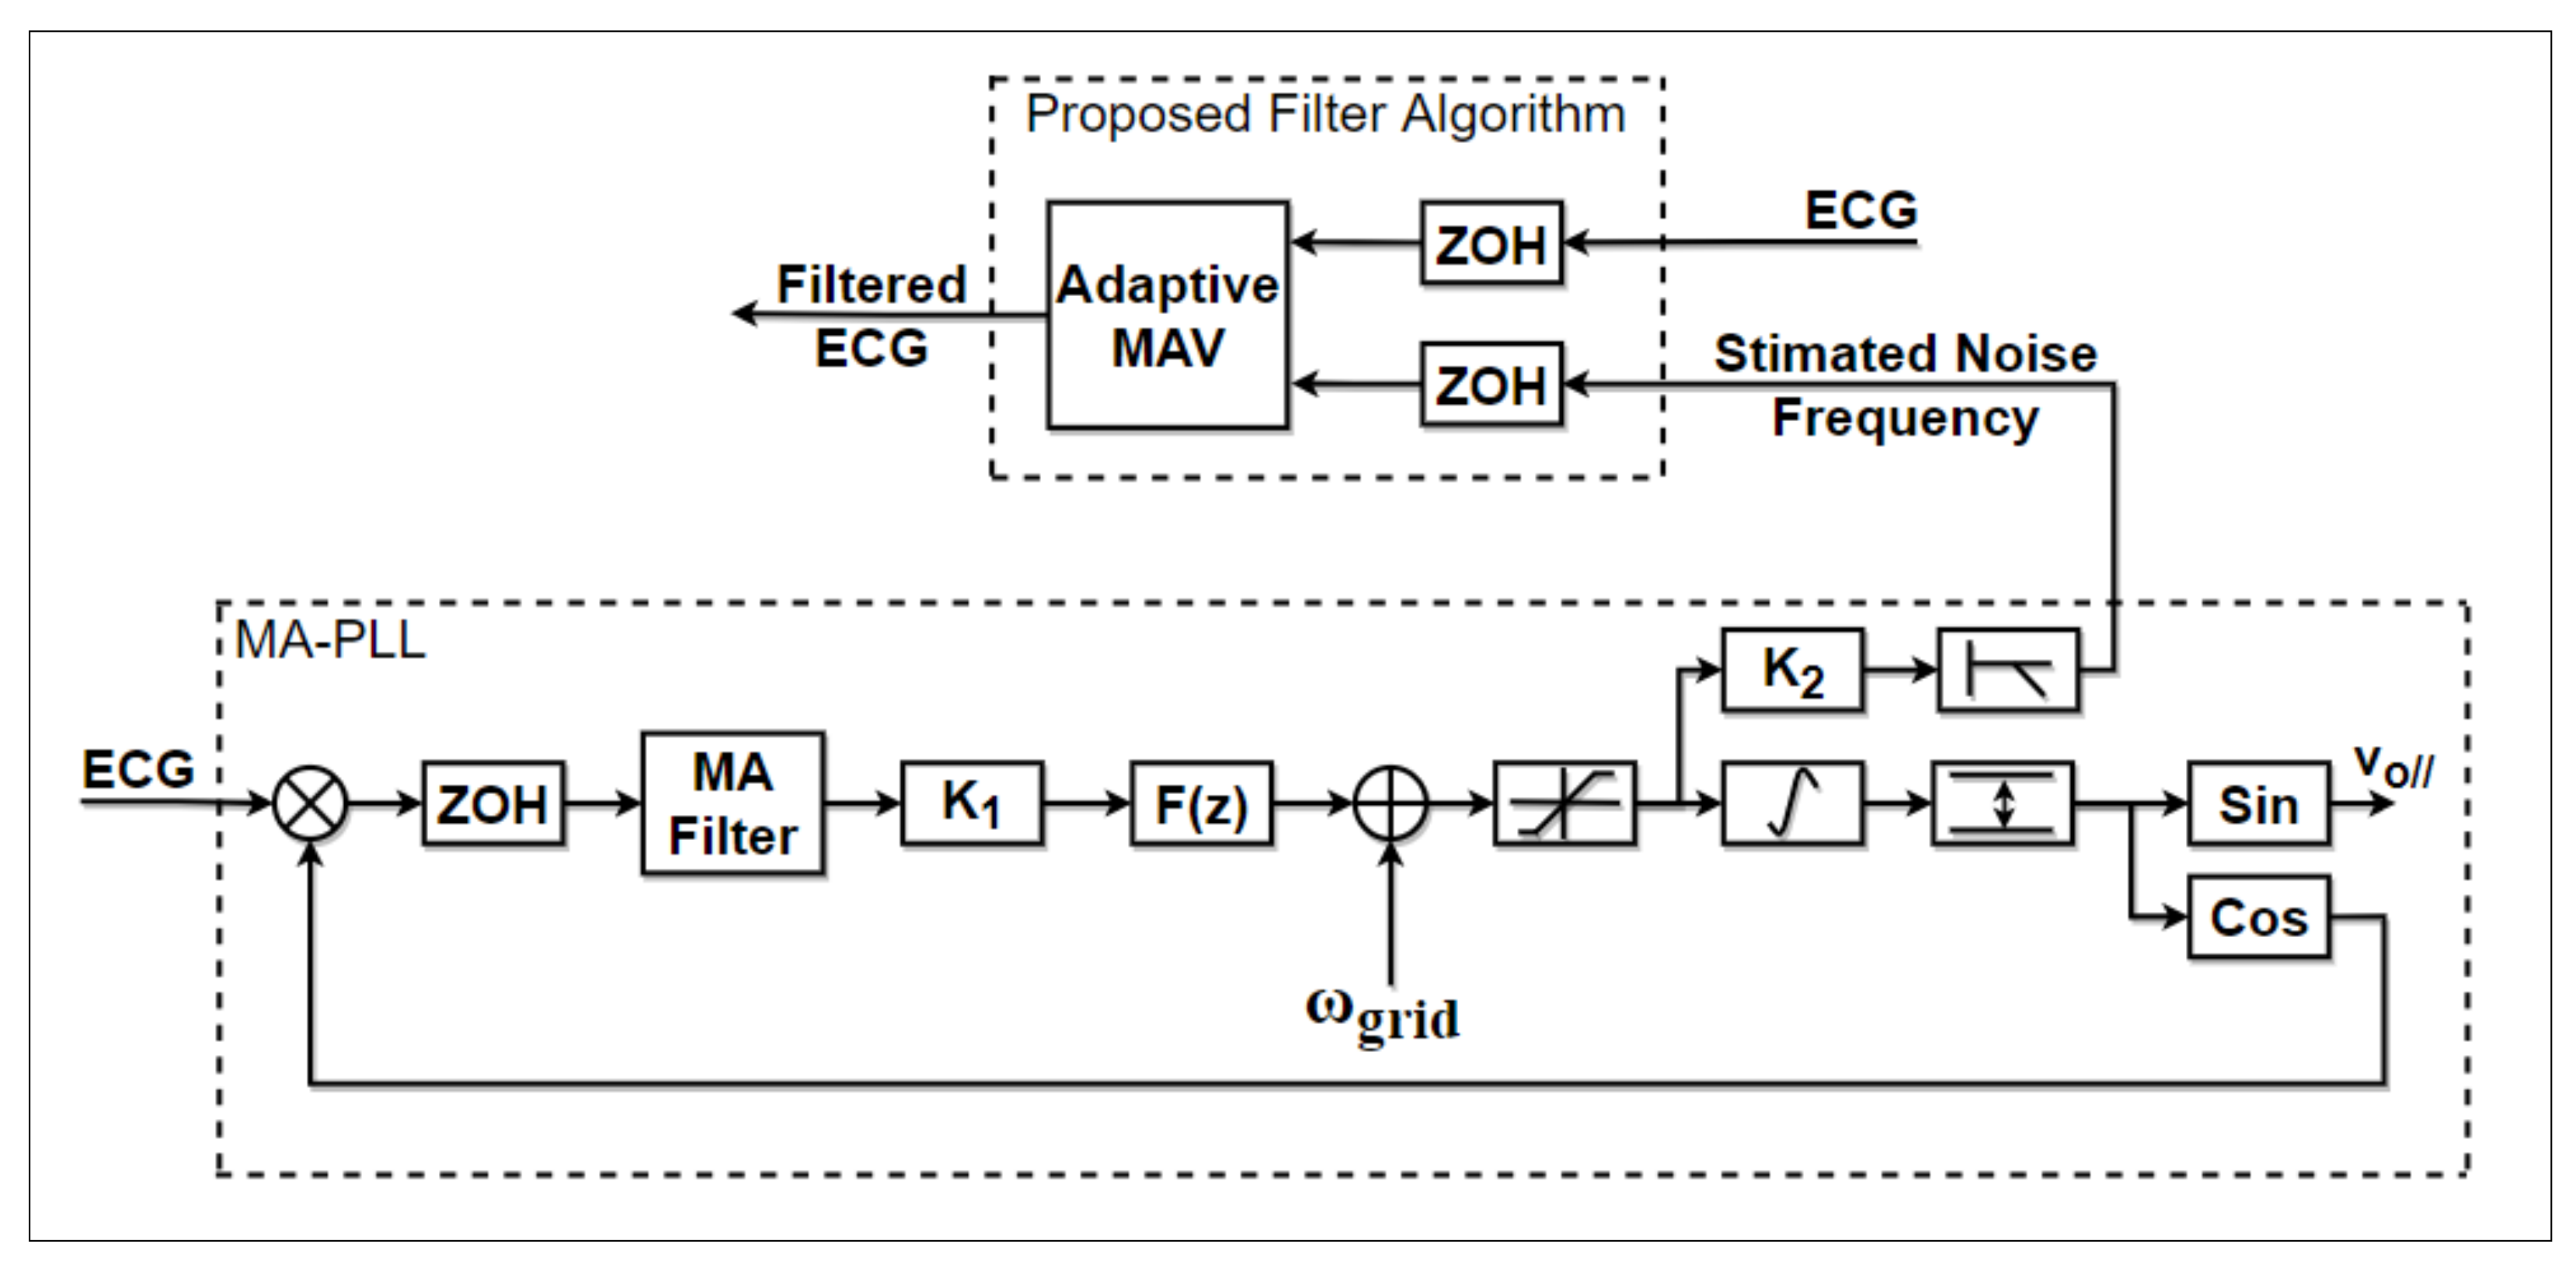
3. Methodology

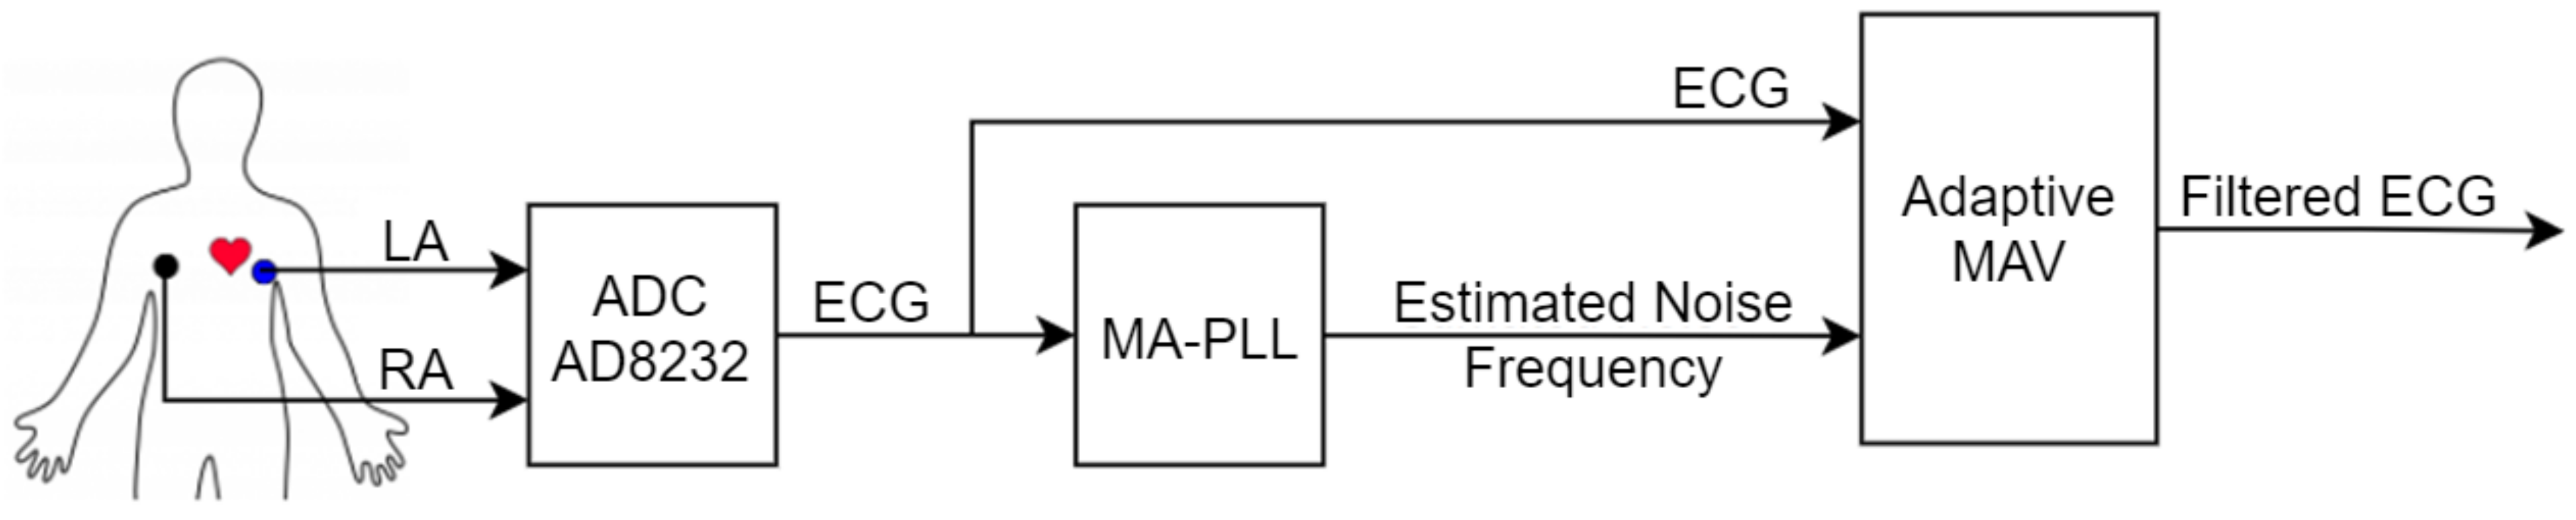
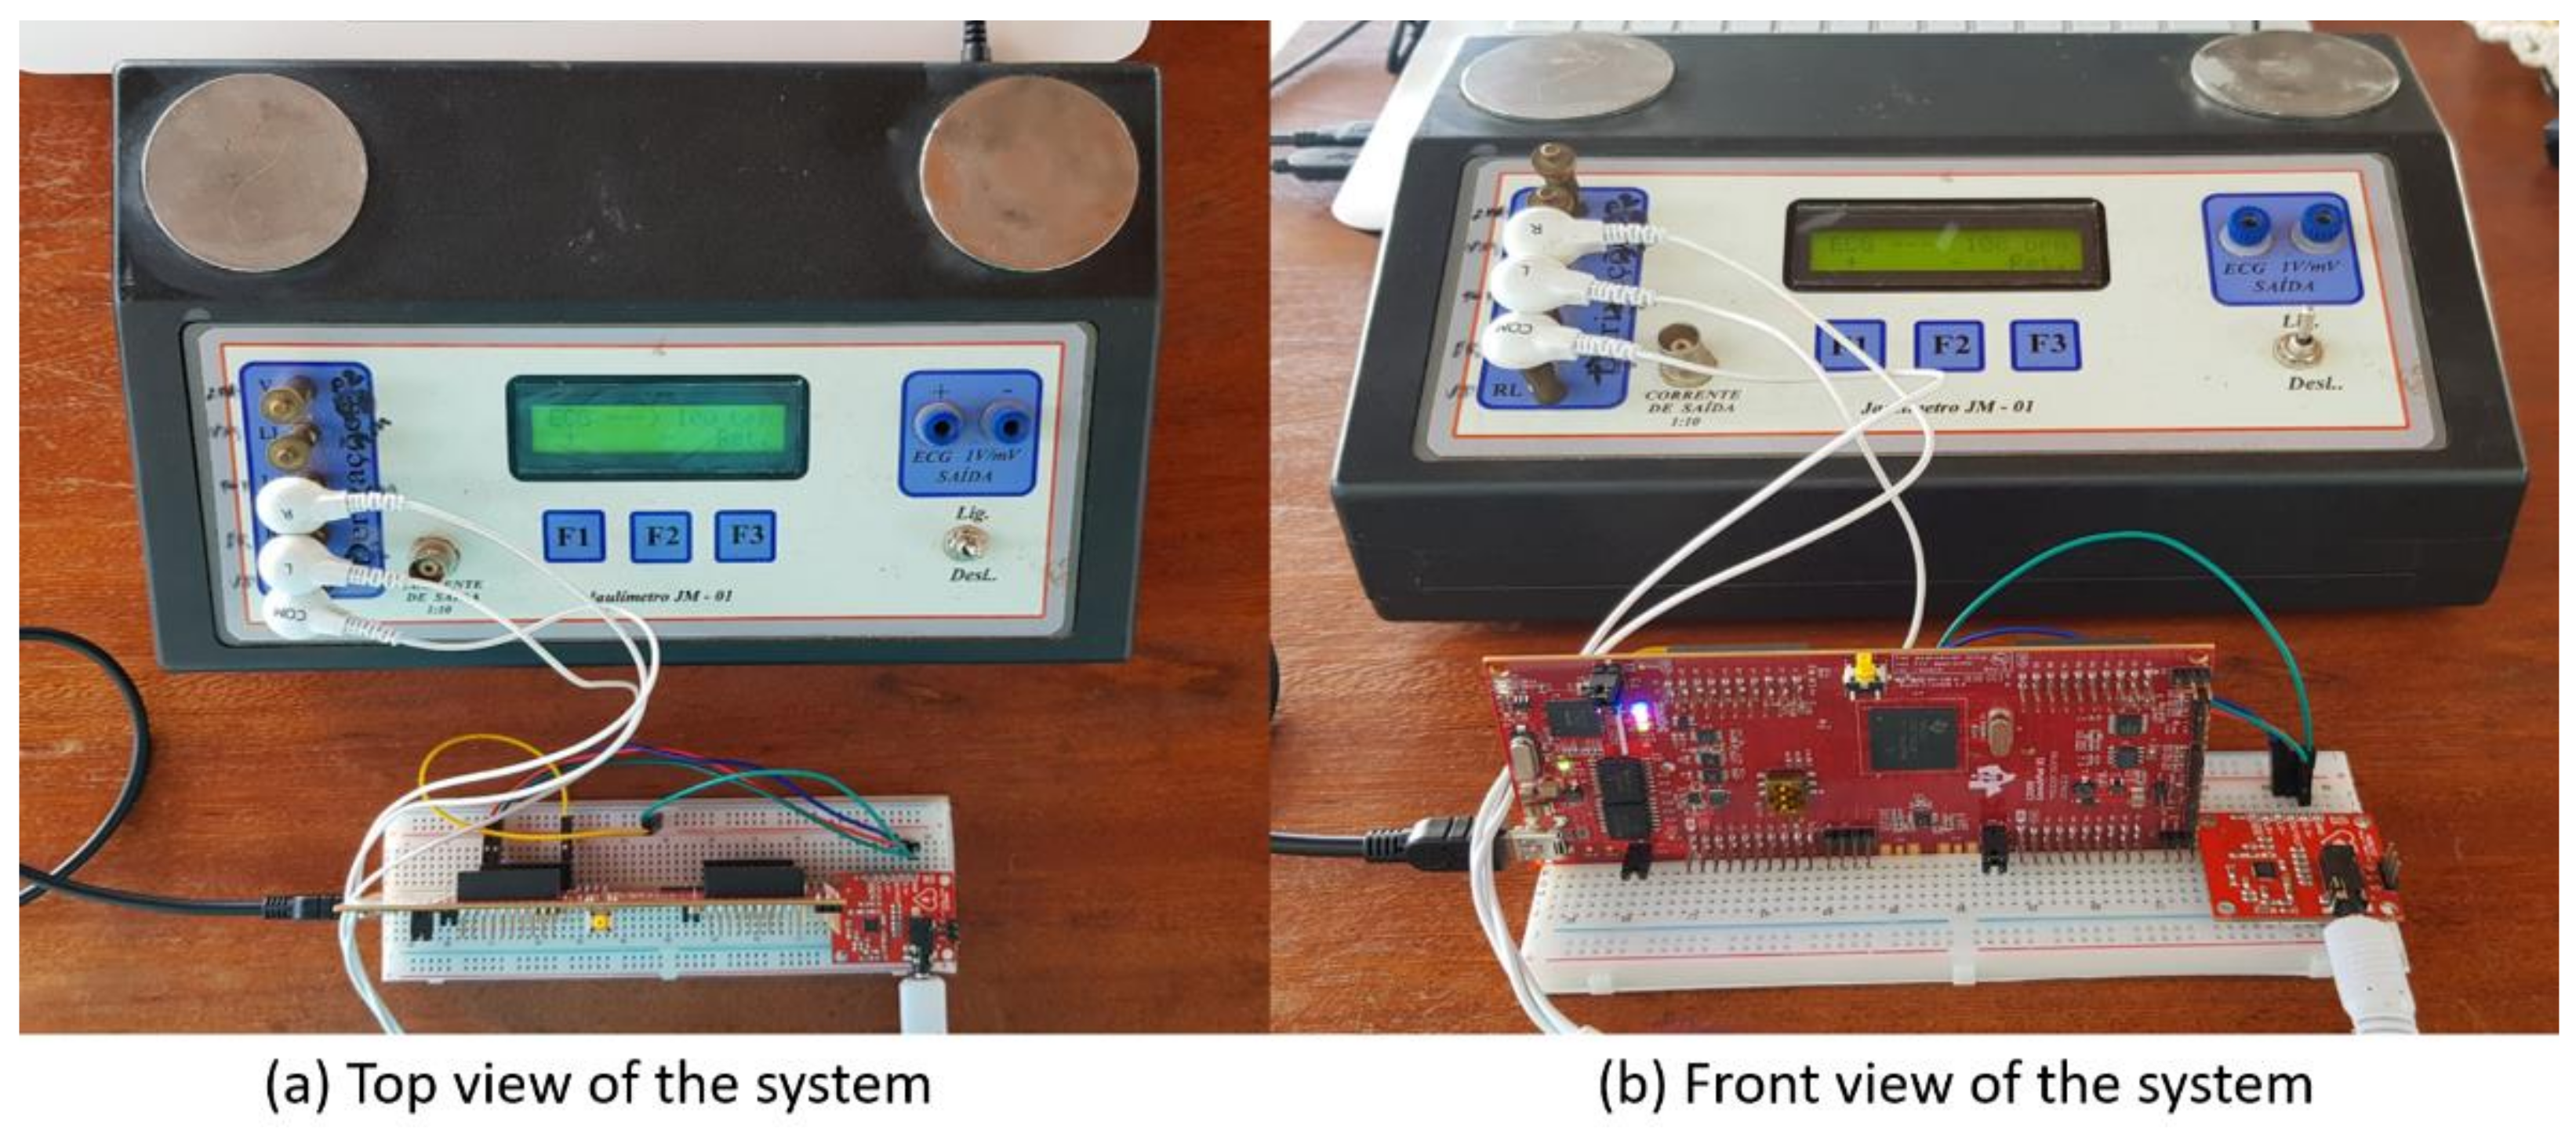
Figure 2 presents the simplified block diagram of the proposed method for the acquisition and filtering of bioelectric signals obtained using only two electrodes. As proposed in [24], the usage of only two electrodes provides many economic advantages, and this method can be applied to ECG equipment for constant monitoring within hospitals, as well as in wearable devices.
In [24], a non-differential analog circuit for the acquisition of the ECG signal with a CMRR of 80 dB is proposed, but for this study, the IC AD8232 was used, which has the same CMRR of 80 dB (at frequencies up to 60 Hz) and can be configured for use with or without the right leg electrode. It is not covered in [24]’s filtering or post-processing methods.
The MA-PLL block of Figure 2 receives the ECG signal as input and, as there is no need to reconstruct the signal for the proposed filter, this block just outputs the estimated noise frequency.
The proposed algorithm is found in the adaptive MAV block, which has as inputs the ECG signals and the estimated noise frequency. The inputs determine the adaptive MAV filter order and produce the filtered ECG signal as output.

3.1. Phase-Locked-Loop (PLL)

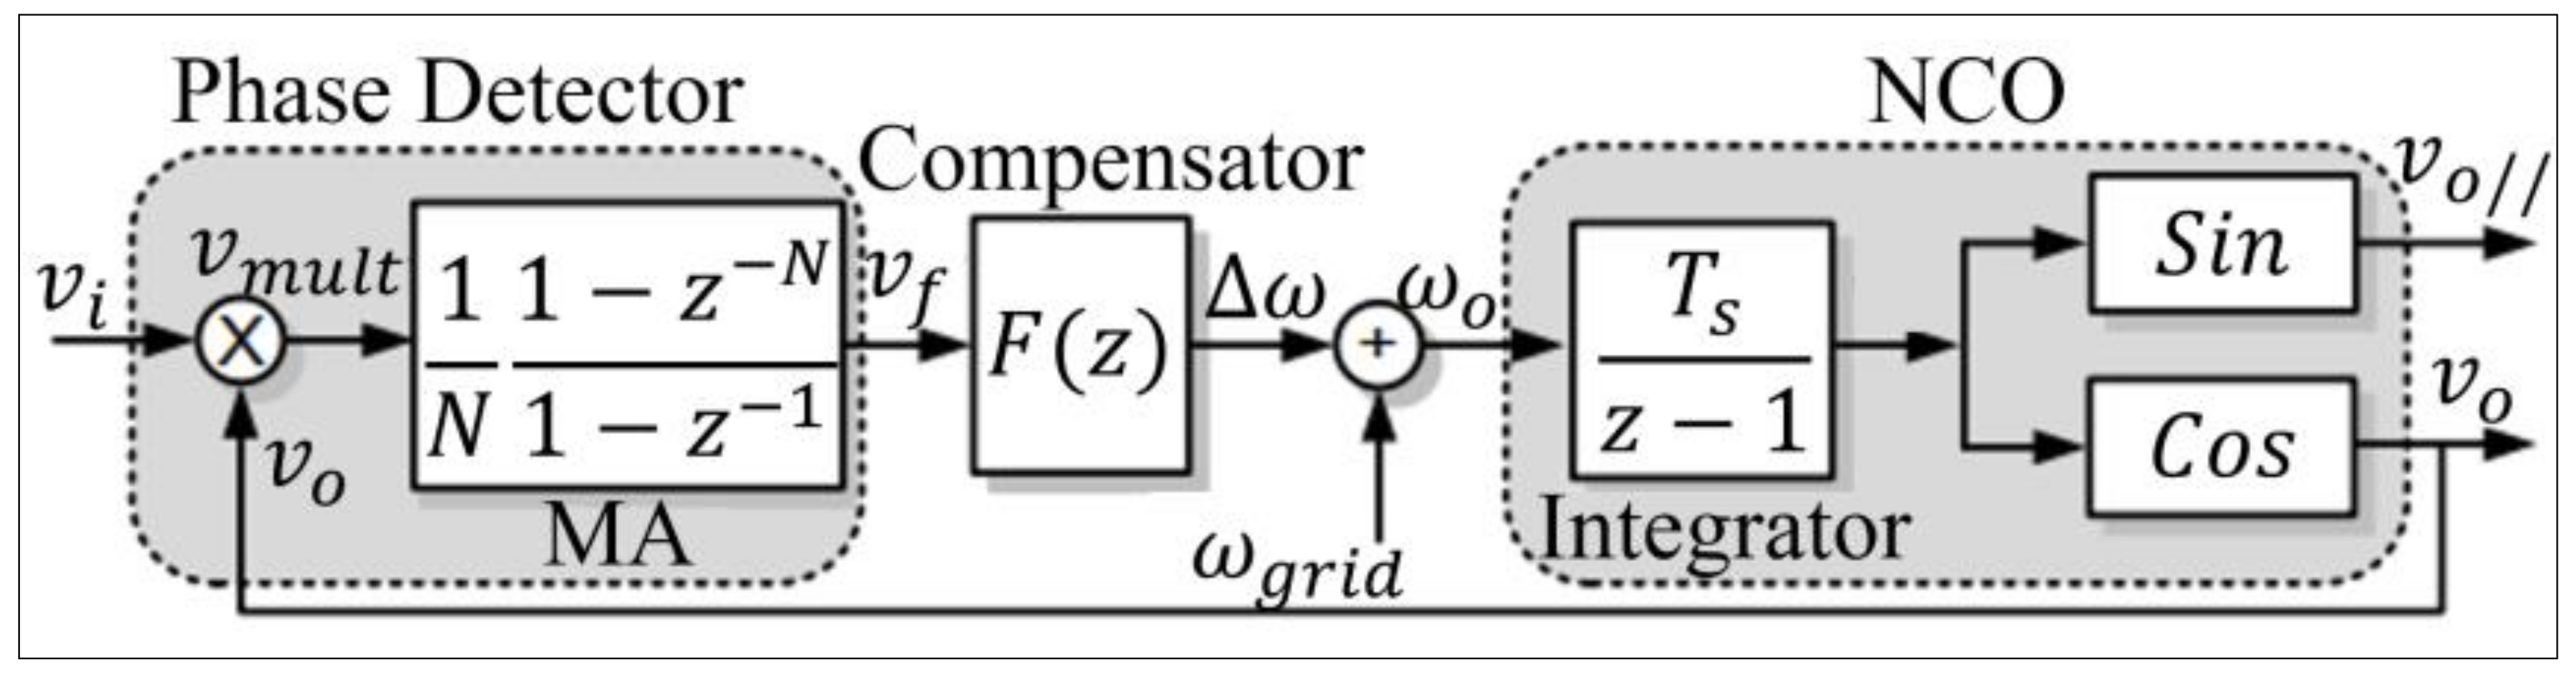
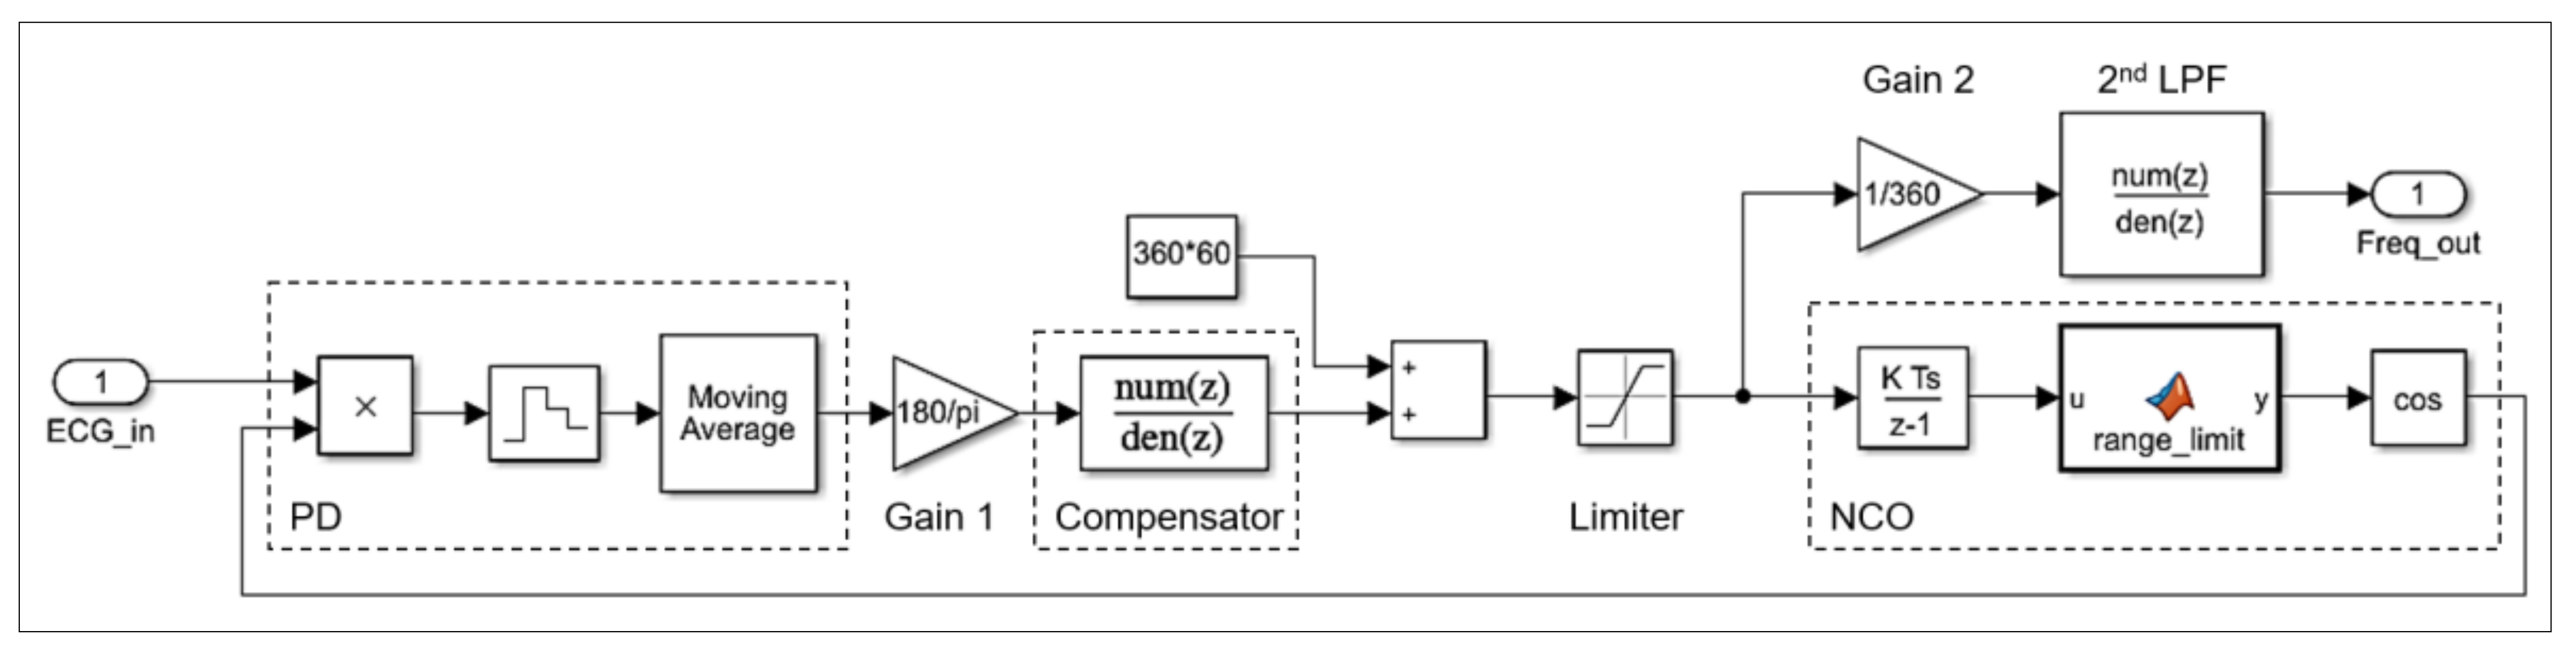
The PLL is a subblock of the proposed system, and it is derived based on [25]. It is designed with a non-adaptive moving average filter (MA-PLL), as shown in Figure 3. The MA-PLL was chosen as it has a low computational cost and good frequency response, even in presence of oscillation in the EMI amplitude. In addition, the signal amplitude is not required, as it is desired to eliminate the entire EMI noise.
To find the PLL parameters, it was linearized following the same procedure presented in [25], obtaining the structure in the discrete domain depicted in Figure 4.

3.1.1. Phase Detector (PD)

The PD receives two inputs, the ECG signal (vi) and the error signal (vo cosine feedback). The corresponding output resulting from the comparison between these two inputs is Φd, which is a linearization of the sinusoidal signal to small angles, according to Equations (1) and (2):
Φ d = Θ i Θ o
sin Φ d Φ d
The output signal vmult is composed of the signal Φd multiplied by a gain added to a high frequency component (n), which represents a disturbance applied to the system:
v m u l t = 0.5 . A 1 . Φ d + n
A low-pass filter of the moving average (MA) type is used to eliminate the high-frequency noise from the PD phase, thus eliminating the n component of the vmult signal. The transfer function in the z domain is defined in Equation (4), where N is the filter order, defined according to the desired cut-off frequency (fc) and the sampling frequency (fa), presented in Equation (5):
M A z = 1 N . 1 z N 1 z 1
N = f a f c
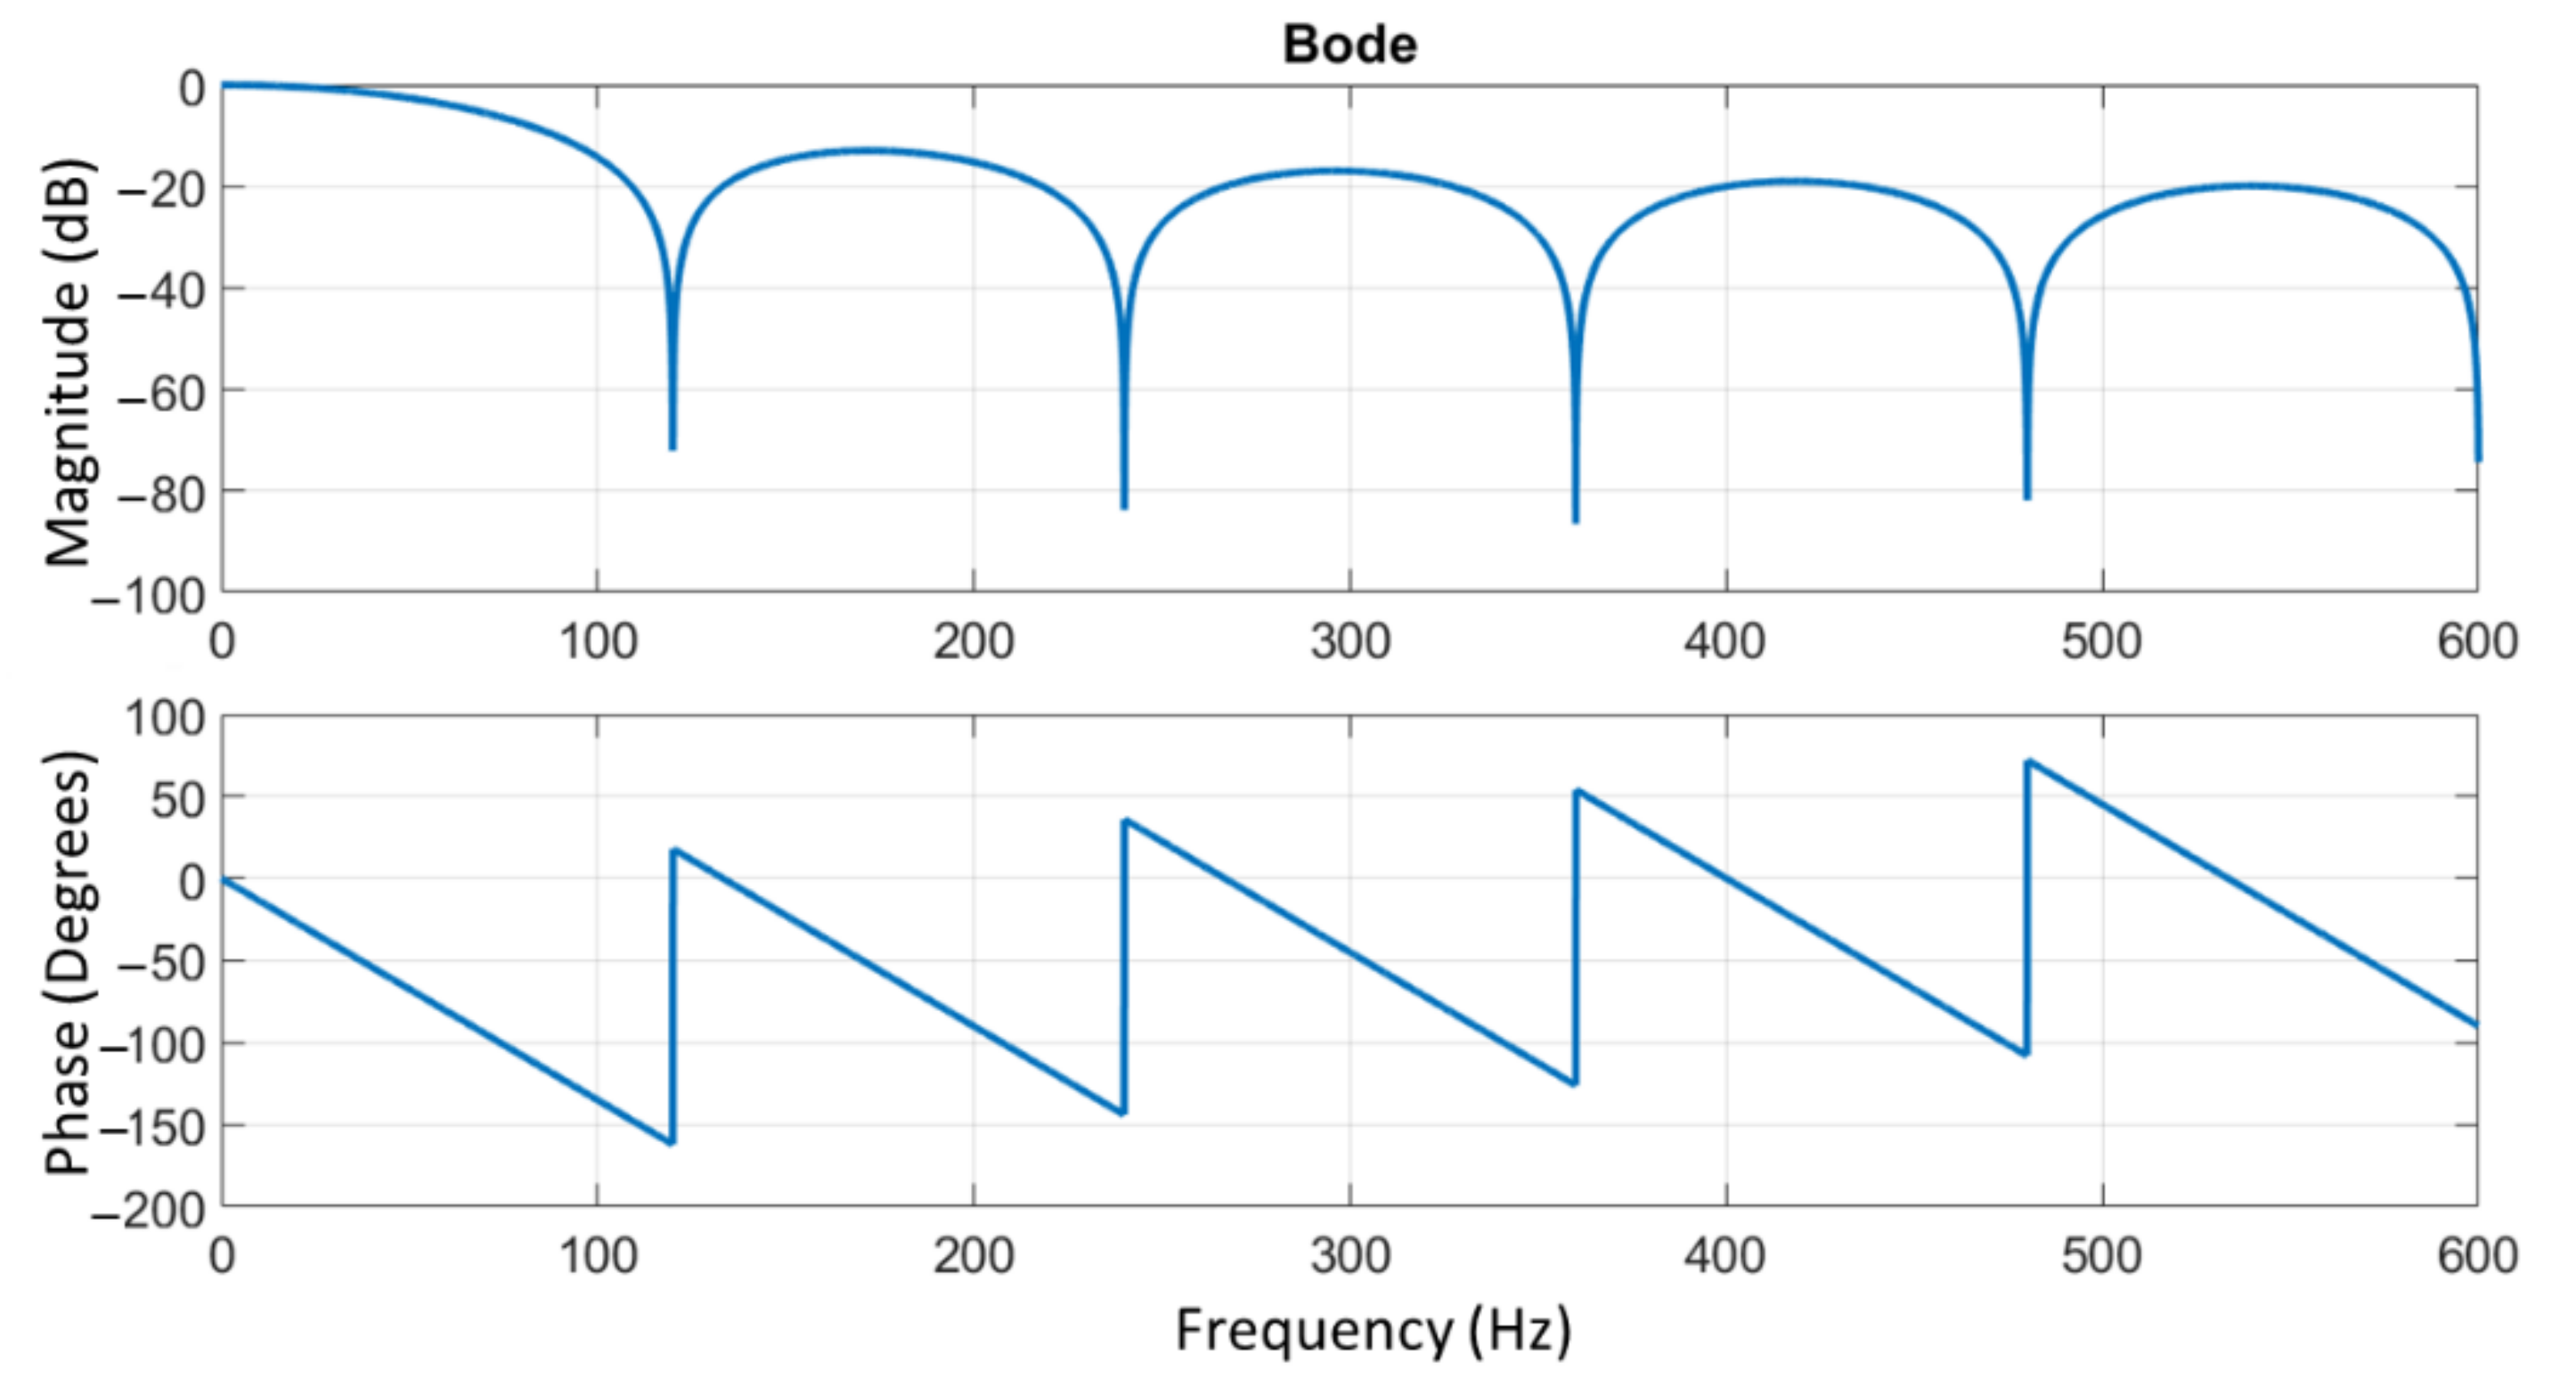
The sampling frequency is 1200 Hz, and the cut-off frequency is 120 Hz, eliminating all noise from the second harmonic of the fundamental frequency (60 Hz). The window size N is then fixed at 10 samples. Figure 5 shows the MA filter’s magnitude and phase response.
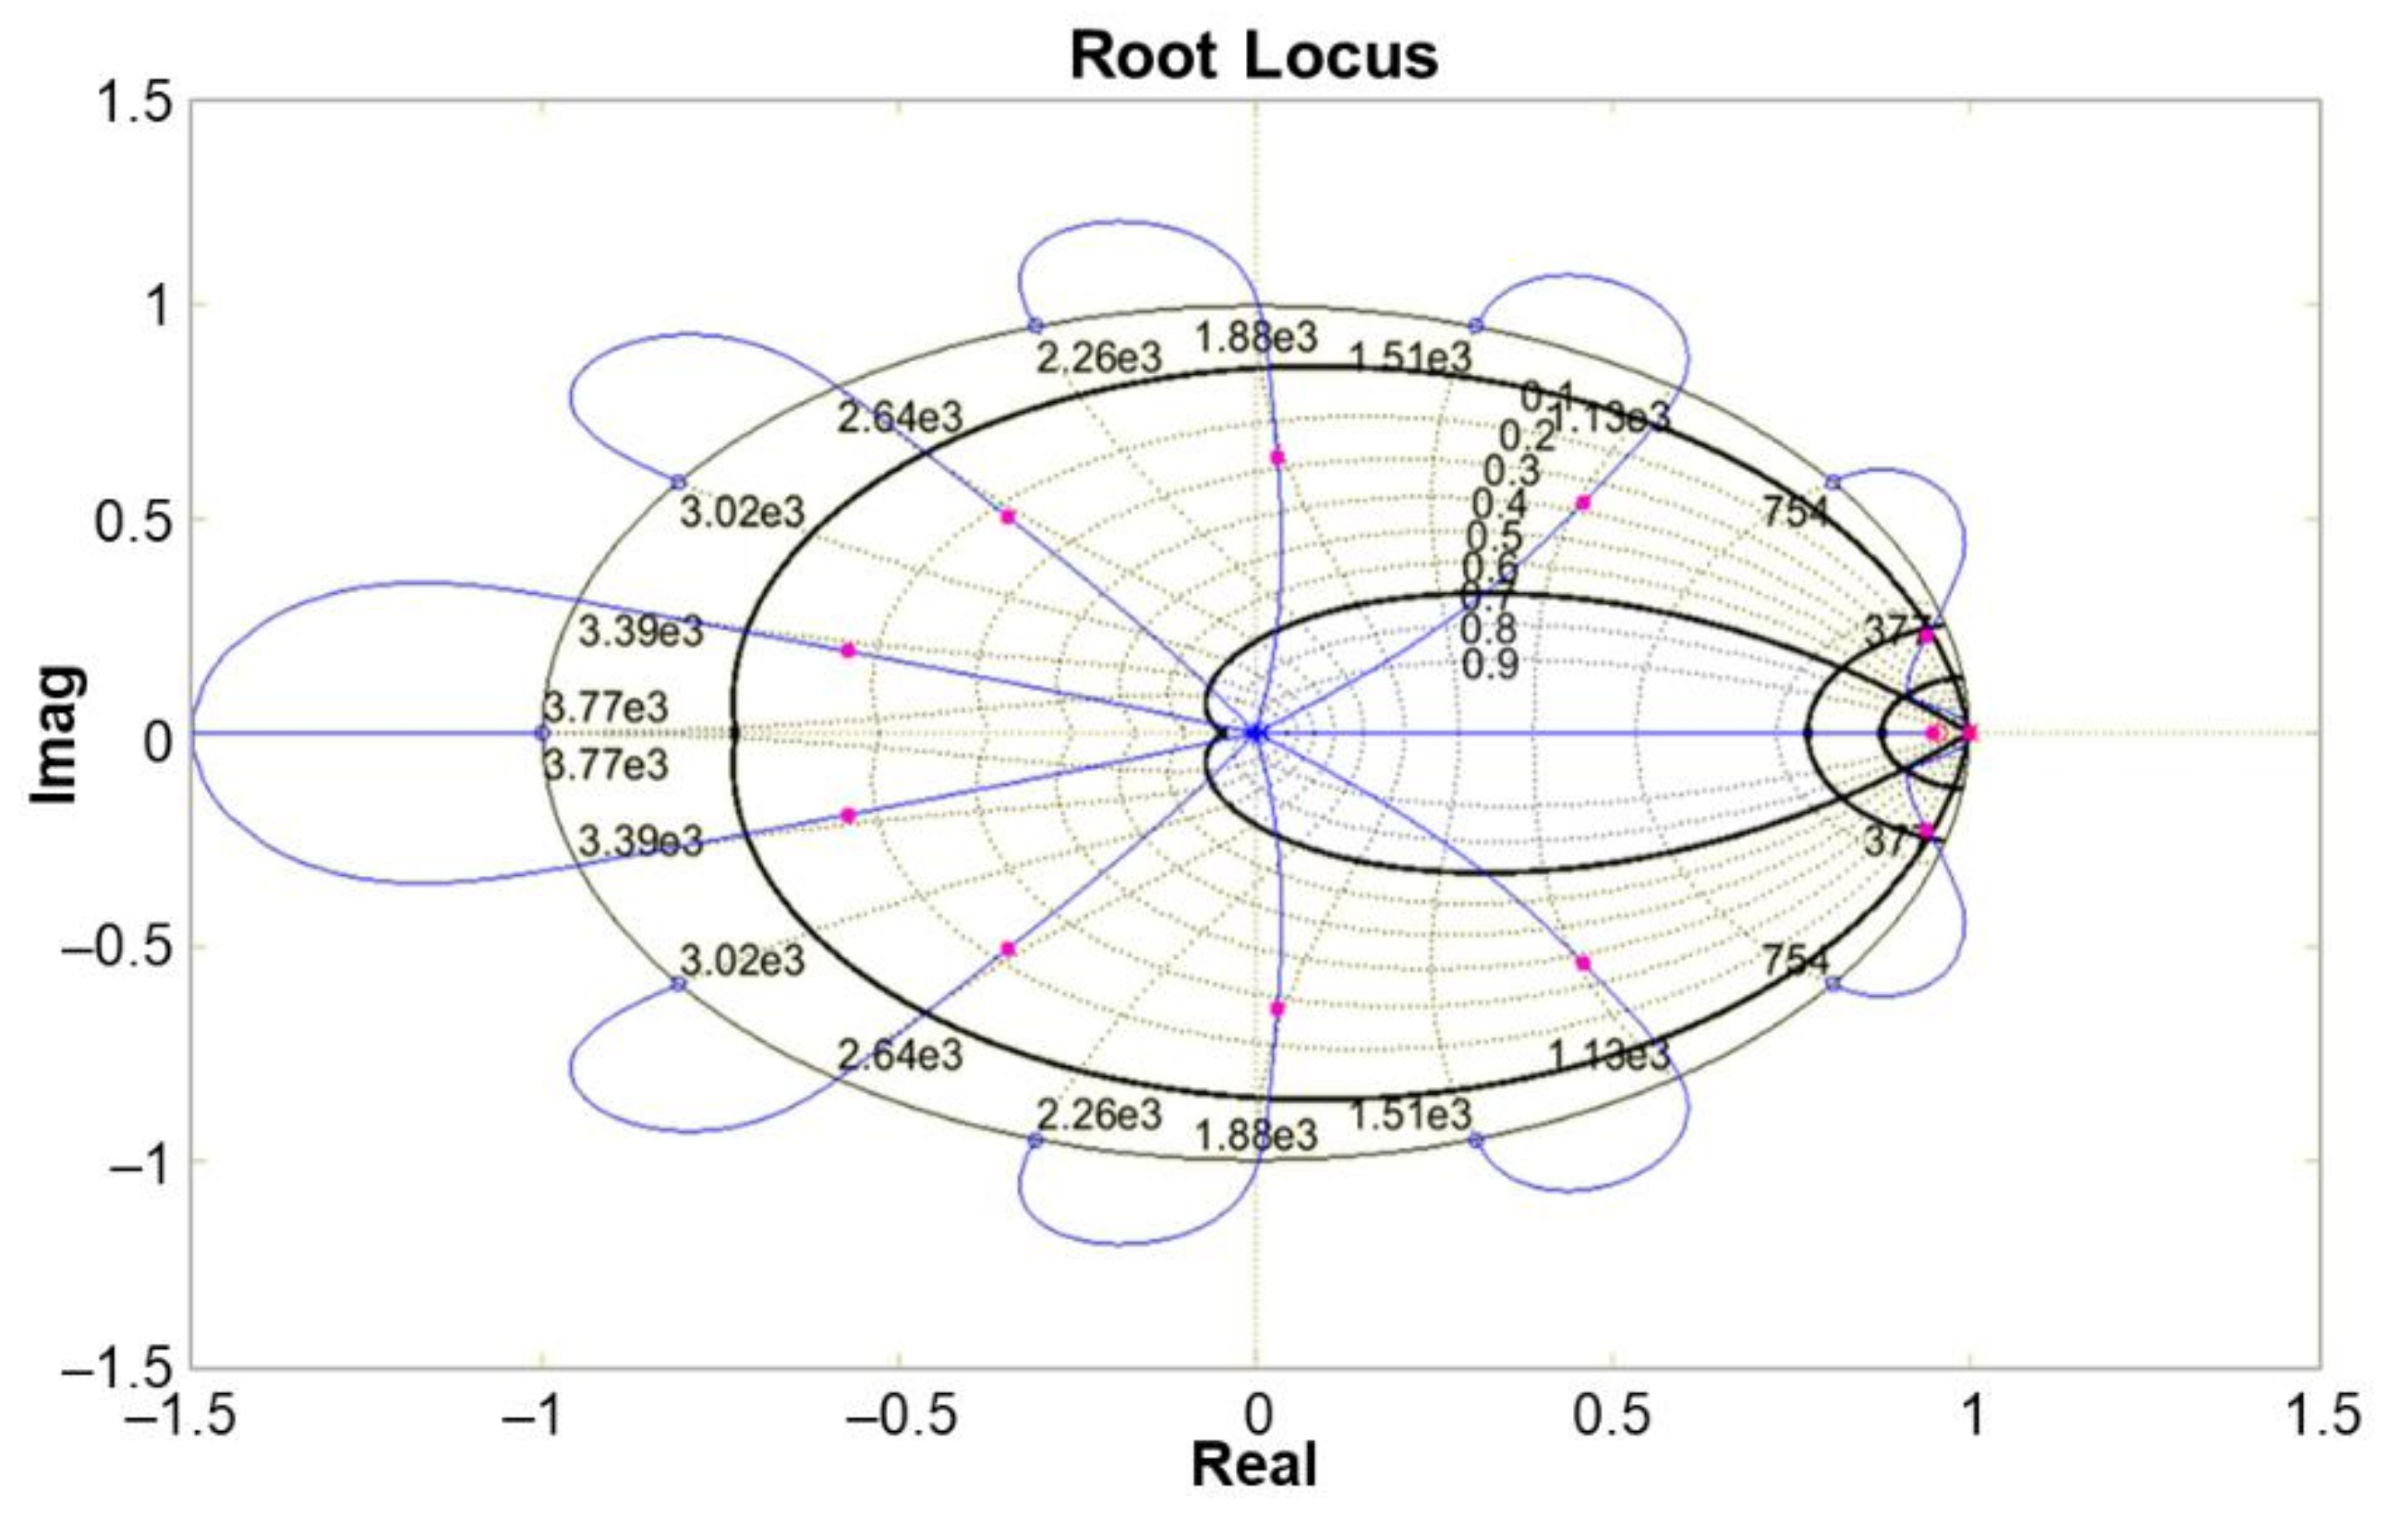
3.1.2. Compensator

The compensator is a proportional plus integral controller (PI). It is tuned with the root locus technique. Through approximations of second-order system specifications, based on the desired settling time (ts), the limits of the damping coefficient (ζ) and the undamped natural frequency (ωn) are defined according to Equations (6) and (7), respectively. Equation (8) demonstrates a standard discrete PI controller, where Kp is the proportional gain and Ki is the integral gain. Equations (6)–(8) are calculated as follows:
t s = 4 ζ . ω n
ζ m i n < ζ < ζ m a x ω n m i n < ω n < ω n m a x
P I z = K p + K i 1 z 1
Equation (8) was rewritten as Equation (9) to facilitate the use of the root locus method. Equations (10) and (11) represent the gain (K) and the zero (α) of the transfer function:
F z = K . z α z 1
K = K p + K i
α = K p K p + K i
Figure 6 depicts the PLL roots location, where the damping coefficient lines (0.1 and 0.7) and the natural frequencies (25 Hz and 45 Hz) are highlighted. The region where the roots of the controller must be located is delimited in yellow and the two magenta dots within this area are the roots of the controller. Thus, the adopted values for α and K were 955.74 × 10⁻³ (0.9557437866536668) and 3.19 × 10² (319.1934263090495), respectively. Those values are the results given by the software used to analyze and tune the controller, without eliminating decimal fractional digits. However, those numbers are difficult to implement in a 32-bit microcontroller. Simulations and experimental tests were performed to reduce the number of these digits without affecting the controller performance. Thus, the aforementioned tests allow for defining the minimal numerical resolution for those parameters:
-
The parameter K requires, at least, two decimal fractional digits (K = 319.19).
-
The parameter α requires, at least, six decimal fractional digits (α = 0.955744).
These new values of α and K can be easily implemented in the 32-bit digital processor used in this work.
On the other hand, ω and ζ with poor dimensioned values can lead to a slow response system, unable to track the grid frequency and/or the saturation of the controller outputs. Both cases can cause PLL instability.

3.1.3. Numerically Controlled Oscillator

The numerically controlled oscillator (NCO) is composed of a digital integrator, a sine, and a cosine, as seen in Figure 3. After the MA-PLL linearization, only the integrator is present, as the values of sine and cosine are approximated as previously addressed. Equation (12) presents the Forward Euler type digital integrator, where Ts is the sampling period:
I z = T s z 1

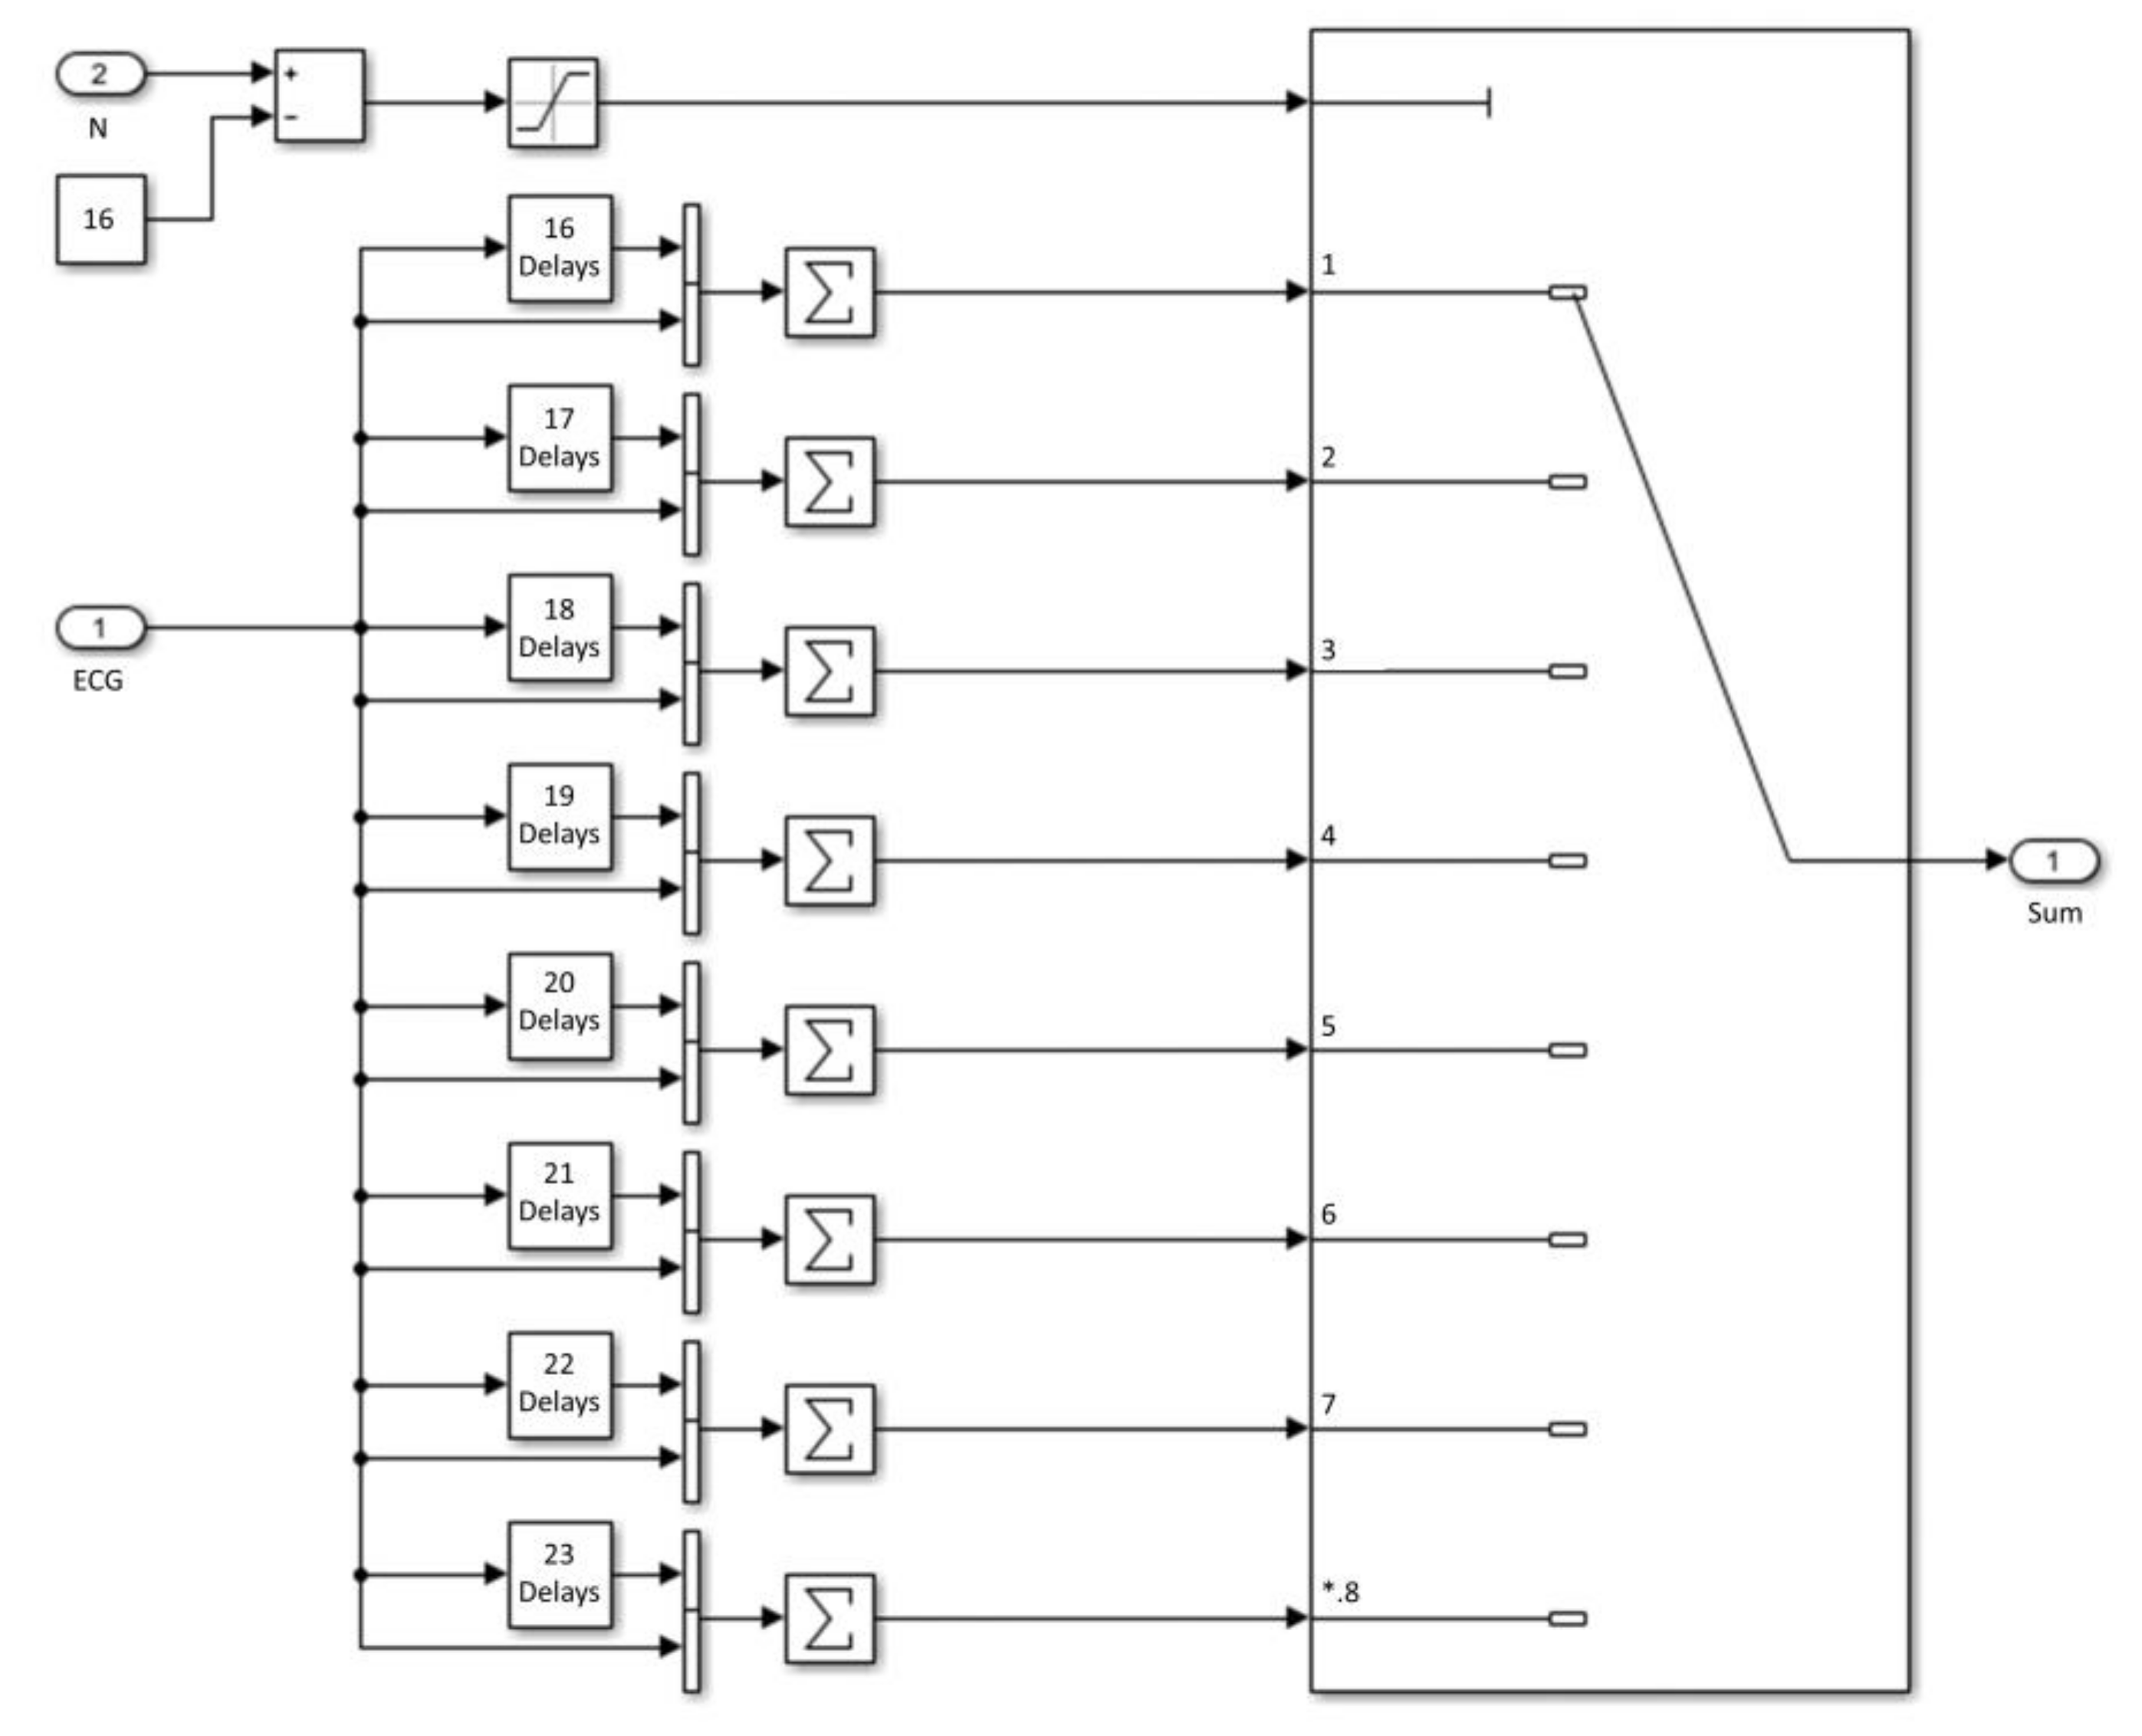
3.2. Adaptive Moving Average Filter (MAV)

The adaptive moving average filter is a digital filter that presents a behavior similar to bandpass FIR type digital filters. In the MAV, the algorithm uses the frequency tracked by the PLL to perform the filter tuning and generate the precise EMI noise cancellation.
MAV filters present some advantages for this application proposal, such as low computational cost with simple mathematical operations; ease of implementation; eliminates the main frequency (EMI) and its harmonics, preserving the intermediate frequencies; and it presents linear phase delay and narrow rejection range.
Conversely, as disadvantage, the attenuation of signal peaks can be a problem in the R waves of ECG signals.
The MAV has a window of variable size, which guarantees the adaptability of the algorithm to the frequency of the EMI noise. The MAV is configured to act with ±10 Hz at the EMI noise’s fundamental frequency. Due to its characteristics, it eliminates both the noise at the fundamental frequency and its harmonics. The window size N is defined according to Equation (5), but different from the MA filter, the cut-off value varies according to the reference frequency sent by the PLL algorithm, thus improving the SNR ratio.
Equation (13) describes the behavior of the adaptive filter, where YMAV is the filtered ECG signal, xi is the ECG signal read from the patient with EMI noise, and the filter order N is a function of sampling frequency (fa) and fundamental frequency of the estimated EMI noise through the PLL (fn), as shown in Equation (14). The variation of the filter order as a function of the EMI frequency guarantees an adequate filtering even when there is a variation in the EMI frequency. Equations (13) and (14) are calculated as follows:
Y M A V = i = 0 N x i N
N = f a f n

4. EMI Cancellation Algorithm

The general block diagram of Figure 2 can be divided into two systems to better understand the proposed approach. The MA-PLL is at the bottom of Figure 7 and the adaptive MAV is at the top. In summary, the adaptive filter is based on Equation (13) with the order varying according to the grid frequency. The N order is obtained using the output of the MA-PLL. Equation (14) can be used to obtain the N value.
Limiters are used to prevent the ECG signal from exceeding the limits of the signal processor. Two limiters are used: one is positioned after the compensator and a range-type is placed after the NCO integrator.

Waveforms Used in the System Validation

In Figure 8, the pure ECG signal obtained in the database [26] is shown in the upper image as (a), at an approximated frequency of 80 BPM with 3.5 mVpp of signal amplitude. In the intermediate image, (b), there is the sinusoidal signal referring to the electrical power grid, with a frequency of 60 Hz and 6 mVpp of amplitude. The lower image, (c), shows the corrupted ECG signal, where only the outline of the QRS complex can be observed. All signals were acquired for 4 s.

5. Project Guidelines

For data acquisition and interface with patients, the integrated circuit (IC) AD8232 was used. This IC is a single-channel ECG monitor that combines a block of pre-filtering stages for reducing extra noise from muscle movement, in addition to electrode lack detectors, which can be configured for use with or without the right leg electrode. Due to the ease of assembling, the Sparkfun module was used, which has the necessary components for the IC configuration and a type P3 connector for connecting the electrodes and patient cable.
The system has an embedded 32-bit microcontroller, model TMS320F29379D, from Texas Instruments as main CPU.

5.1. Embedded Firmware

For embedding the firmware into the TMS320F28379D microcontroller, it was decided to use Simulink together with the blocks and library packages specific to the F2837xD family. The system was divided into two main blocks, the PLL and the MAV adaptive filter, as seen in Figure 9, together with an ADC input connected to the AD8232 board and the DAC to reconstruct the filtered digital signal.
The first main block, see Figure 10, is the MA-PLL, with PD, its compensator, and NCO. The frequency (Freq_out) is obtained after the low-pass filter and will be used as a reference for the MAV adaptive filter. The limiter that is powered by the controller output is configured to provide the limits of 50 Hz and 70 Hz. The limiter (range_limit block) positioned after the discrete integrator is a cyclic controller, where, when the value reaches the upper limit, the value restarts at the lower limit and vice-versa (range_limit), with limits set between 0 and 360. The ECG signal (ECG_in) is used as the input for this block and the EMI noise frequency (Freq_out) as the output.
The Adaptive MAV block has the ECG signal, the EMI noise reference frequency as inputs, and the filtered signal (ECG_out) as an output, as shown in Figure 11. The ECG output can be presented on a monitor or printed. The “Sum Delay” subsystem consists of the sum of eight delay sets (corresponding to each of the eight windows between the frequency of 50 Hz (N = 24) and 70 Hz (N = 17)). Inside this block, a commutation block selects the appropriate N size according to the measured frequency. A limiter from one to eight serves as protection so that the system does not select values outside that range, avoiding operating errors (Figure 12).
As the values of N must be integers, the division is approximated through the round block. The Sum Delay block is responsible for storing the input signal data (ECG) and performs the sum according to the order of the adaptive MAV filter.

5.2. Experimental Setup

The experimental setup is performed using a contact matrix, the AD8232, the LAUNCHXL-F28379D development kit, connection cables, ECG simulator JM-01, and the 3-way patient cable. Figure 13 shows in (a) the top view of the system and in (b) the front view of the system.
With this system, the ECG signal was acquired for 52 s, with a sampling period of 833.333 μs (1200 Hz). Figure 14 presents an excerpt of the ECG signal performed by the proposed system. The measure was corrupted in two different manners; first by inserting an additive analog noise directly into the two-way cable through an inductor (generating EMI at the power grid frequency) and second through a sinusoid with an amplitude of 2 V and a frequency of 60 Hz, digitally inserted additively in the signal before processing. The unfiltered signals can be seen in Figure 15.

6. Results and Discussion

6.1. Simulation Results

Table 2 summarizes the values used for the proposed system implementation.
An SNR is defined as the ratio between the average power of the input signal (Psignal) and the average power of the noise (Pnoise) according to Equation (15). However, for signals under the same impedances, Equation (15) can be used to measure the SNR as long as it has the same sampling window. Equation (16) presents the SNR of the input signal in terms of the average amplitudes. Thus, SNRin is the SNR of the input signal, Asignal is the average amplitudes of the input signal, and noise is the average noise amplitudes of the input signal [27]. Equations (15) and (16) are calculated as follows:
S N R = P s i g n a l P n o i s e
S N R i n = A s i g n a l A n o i s e 2
Using the results obtained in simulation together with Equation (16), the input SNR value of 0.2619 was obtained. Through Equation (17) it is possible to calculate the SNR in dB. The input SNR of this circuit is −11.6376 dB:
d B i n = 20 . log 10 A s i g n a l A n o i s e
The SNR of the filtered signal in dB is calculated using Equation (18). The proposed cancellation algorithm is applied to the two signals: the original signal (Asol) and the corrupted signal with filtered EMI (Ascf). The difference between these two is the residue after filtering. So dBout, in Equation (18), is the SNR of the ECG after the filtering process. The SNR is 584.3627 or 63.7052 dB:
d B o u t = 20 . log 10 A s i g n a l A s o l A s c f
Figure 16 shows in (a) the ECG signal corrupted by the noise of the power grid and in (b) the ECG signal after it was processed by the proposed algorithm, compared to the original ECG signal. Through the measurements, the maximum signal delay was 9.98 ms. This delay is within the maximum parameters determined by the standards, where the maximum transmission delay must be 35 ms [28].
Additionally, the system was started at t = 0 s. The system needs two cycles (33.34 ms) to lock the mains frequency (estimate it properly), and less than 1 s for the moving average filter to pass its transient response. Therefore, the result of the ECG signal is ready after less than 1 s.
For the calculation of the filtered signal SNR, it is necessary that the original ECG signal is delayed until the point of the filtered signal and the accommodation time is discarded. This procedure was carried out in two different manners, the first submitting the ECG original signal to the proposed algorithm and, the second performing the mathematical delay after measuring it. Both methods showed similar results.
Figure 17 shows the signal-to-noise ratio for the frequency range of the system proposed in this work (50 Hz to 70 Hz). For the reference frequency (60 Hz), the SNR was in the range of 43.98 dB, while 30.6 dB and 47.0 dB were minimum and maximum SNR presented by the system, as verified by Table 3. The signal delay remained constant throughout the frequency range.
Figure 18 shows the noise residues after filtering at the frequencies of 60 Hz, 66.7 Hz (best noise attenuation, maximum SNR), and 50.9 Hz (worst case of noise attenuation, minimum SNR). It is important to note that due to the response characteristics of the MAV filter, the biggest difference between the original signal and the filtered signal is in the wave peaks, where the difference can reach 0.5 mV in the worst case and 0.3 mV on average.

6.2. Experimental Evaluations

In two different cases, a noise signal was added to the ECG signal generated by the JM-01. In the first case, an EMI generated by approximating one inductor to the patient cables was added to the pure ECG signal presenting an SNR of 25.69 dB. In the second case, a 60 Hz sinusoidal digitally generated interference was added resulting in an SNR of −23.55 dB. By Figure 19a, it is possible to verify that the noise generated by the EMI has an amplitude close to 0.2 mV and is about 4.5 times smaller than the amplitude of the bioelectric signal. Figure 19b shows the resultant signal generated by the 60 Hz sinusoidal noise has an amplitude of 2.0 mV and is 3.9 times greater than the pure ECG signal. However, in both cases, the signals showed satisfactory quality after filtering.
The maximum delay observed during the experiments was 10 ms, close to the simulated results and the SNR of the filtered signal was 45.37 dB, with excellent quality and without noise. In Figure 20, it is possible to compare the original signal delayed by 10 ms with the one filtered by the proposed system, where the greatest divergence between the signals is found in the peaks of the R waves, as expected by the characteristics of the moving average filters.
Table 4 presents the summary of the comparison among the proposed method and the adaptive techniques developed in recent years. With an SNR of 44 dB and capable to deal with frequency variations of ±10 Hz in relation to the fundamental frequency of the power grid, and considering the reduced sampling rate, it is possible to note the superior performance of the proposed algorithm.

7. Conclusions

The proposed 2MAV-PLL algorithm presented an excellent signal-to-noise ratio compared to other methods proposed in the literature. It can eliminate the noise signals of a determined frequency plus a bandwidth of ±10 Hz. The amplitude of the input signal, both noise and original, does not interfere in the cancellation of the interferences, maintaining good results even when the amplitude of the noise varies.
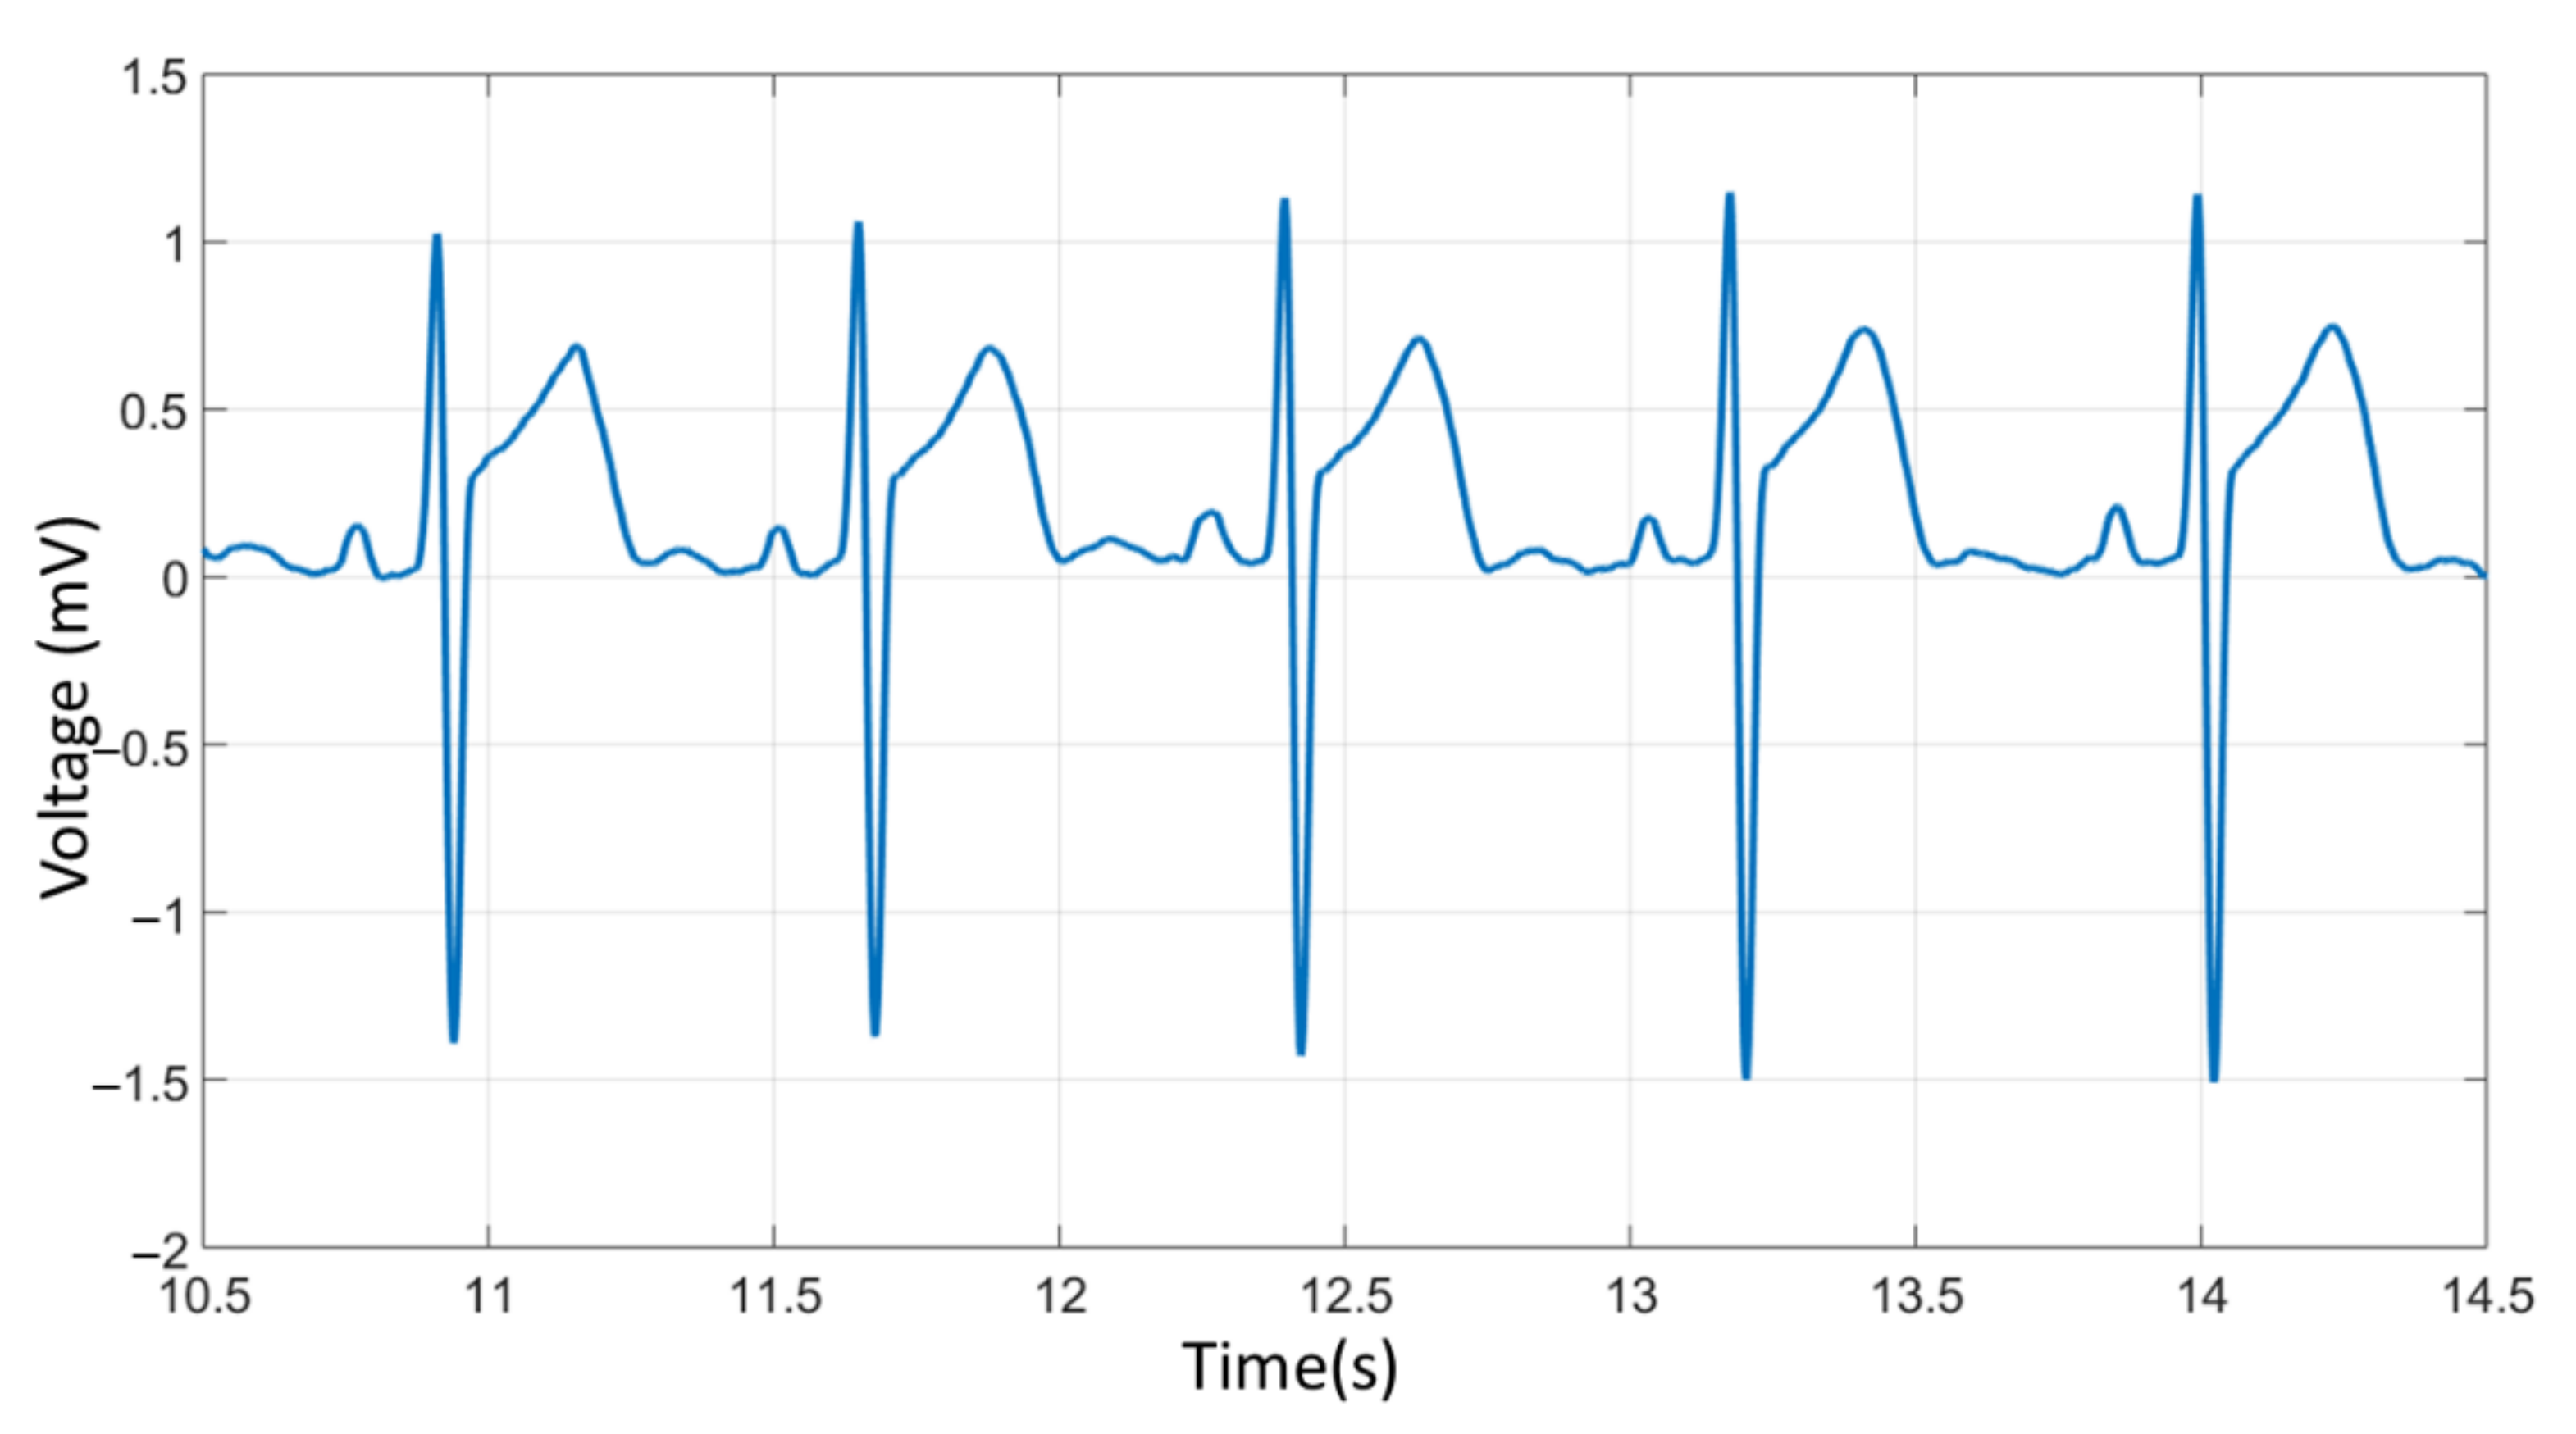
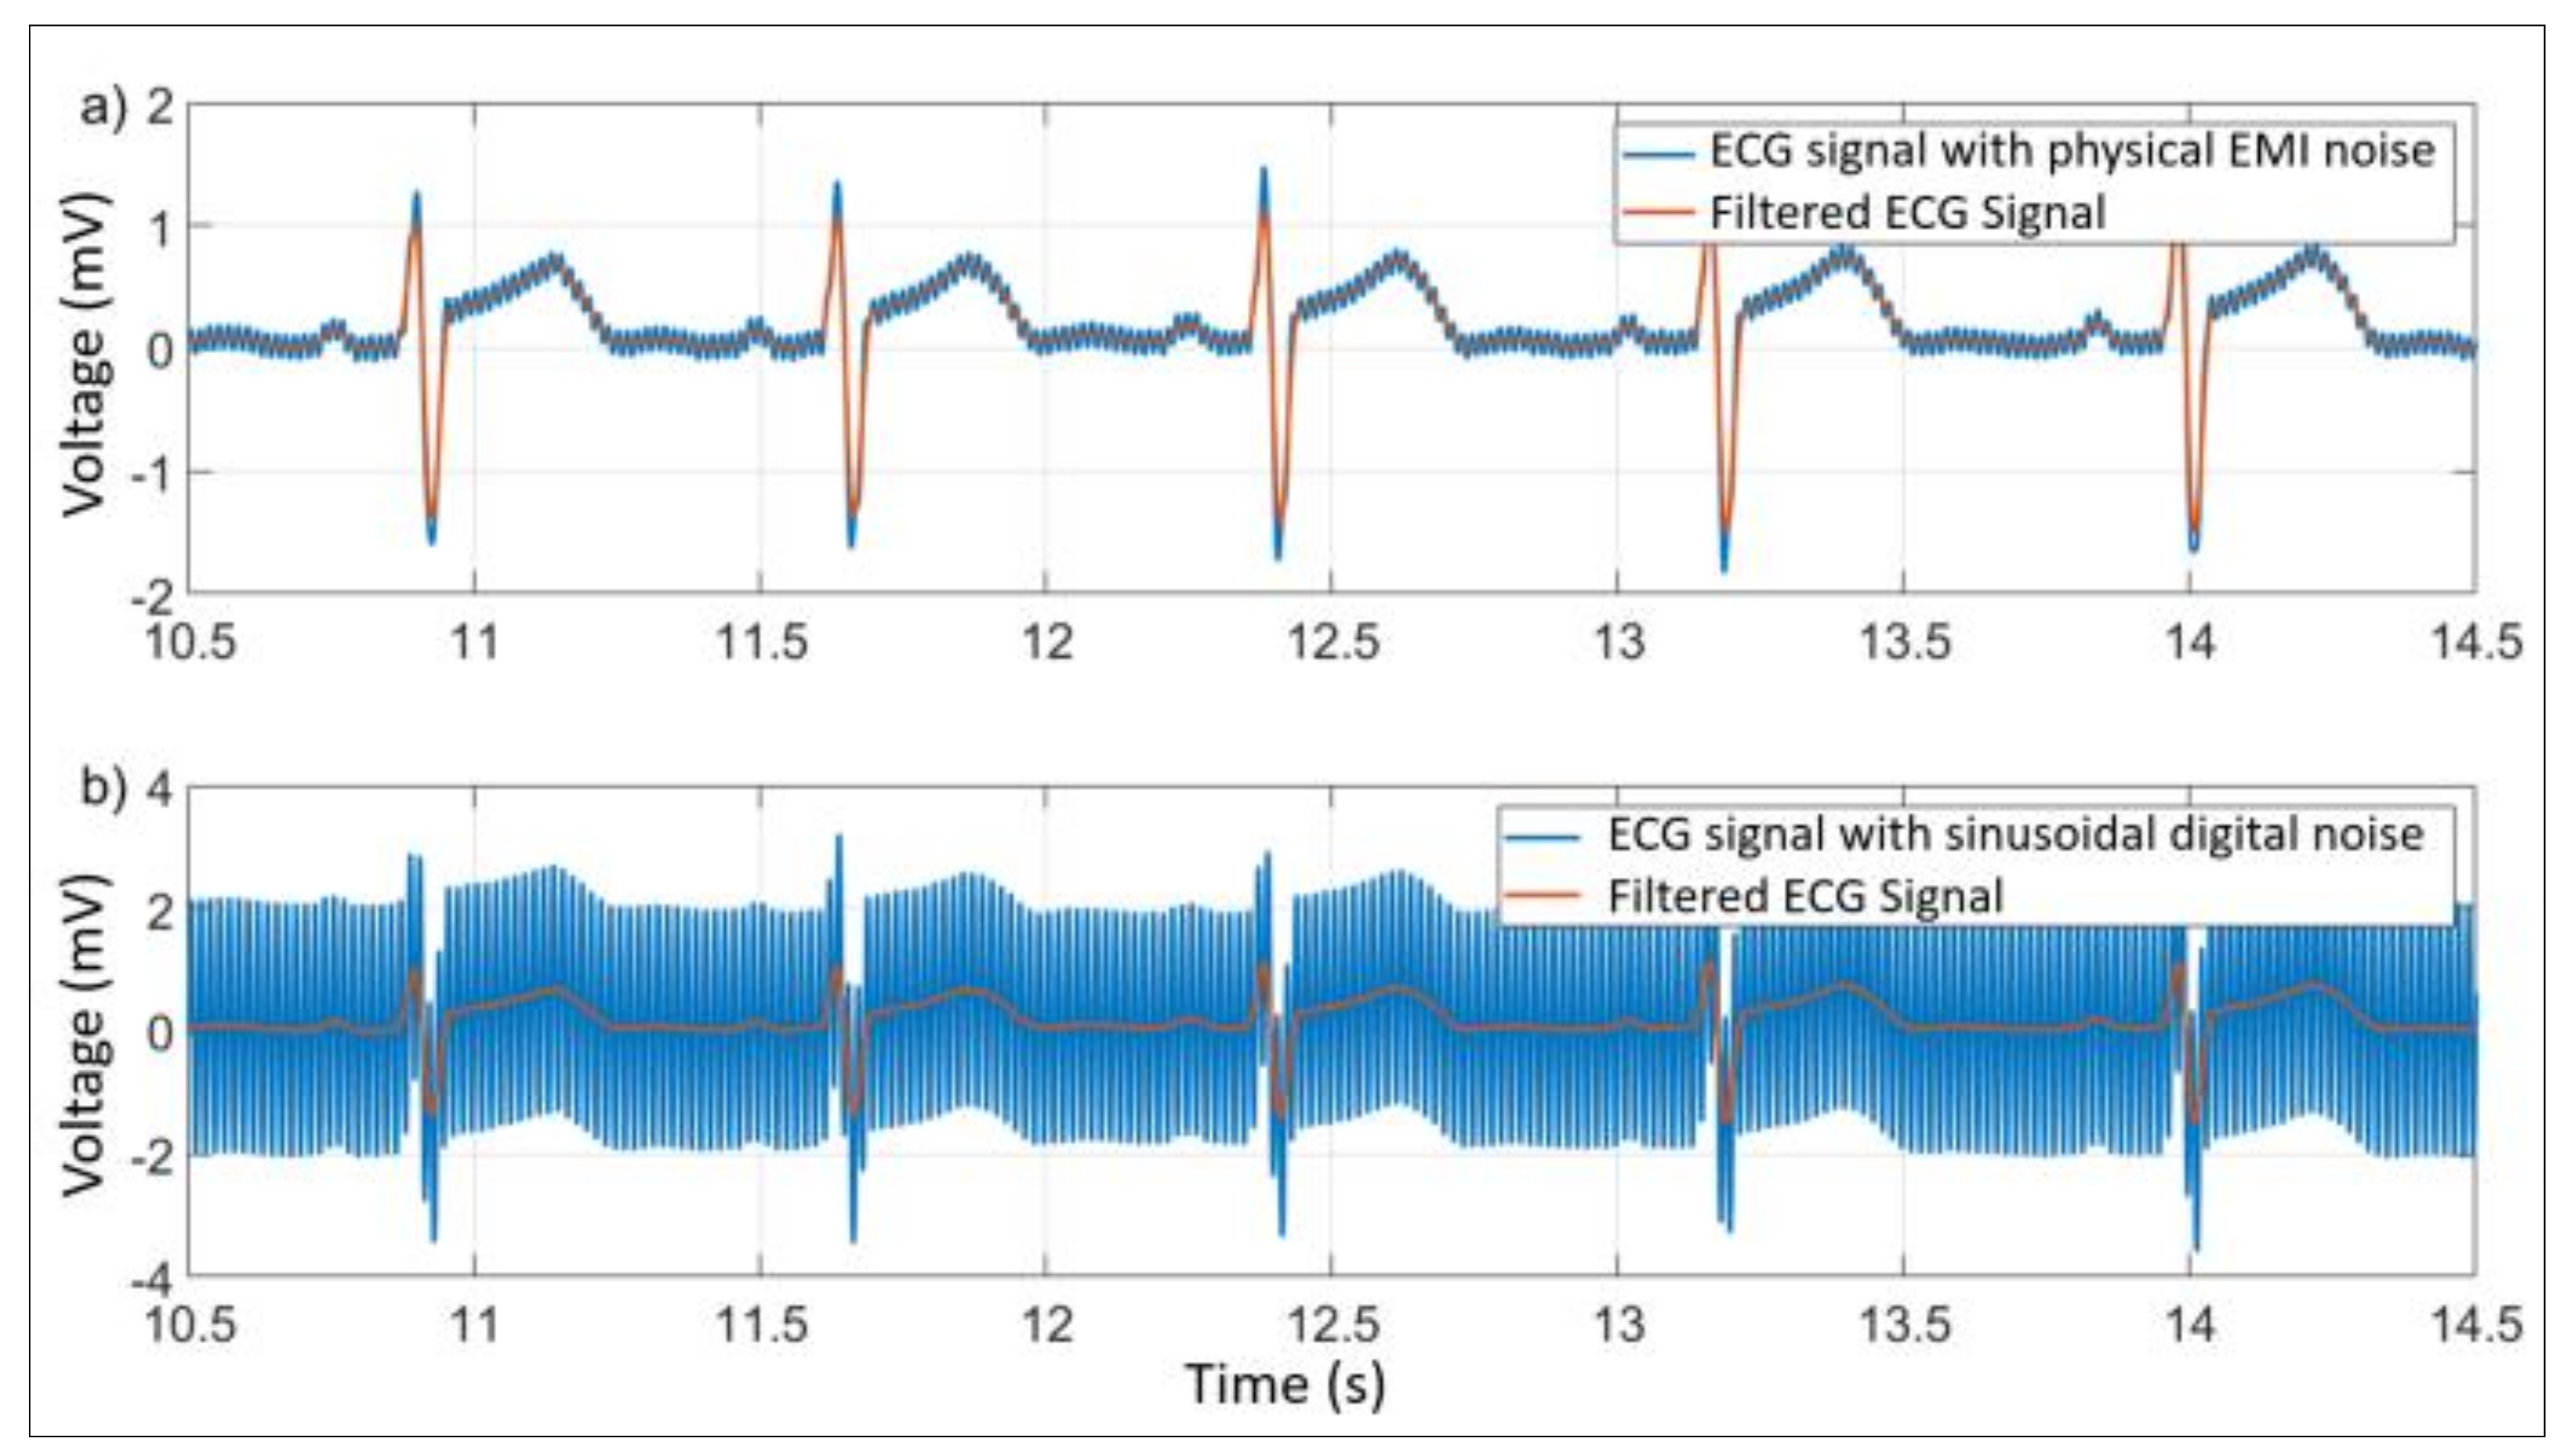
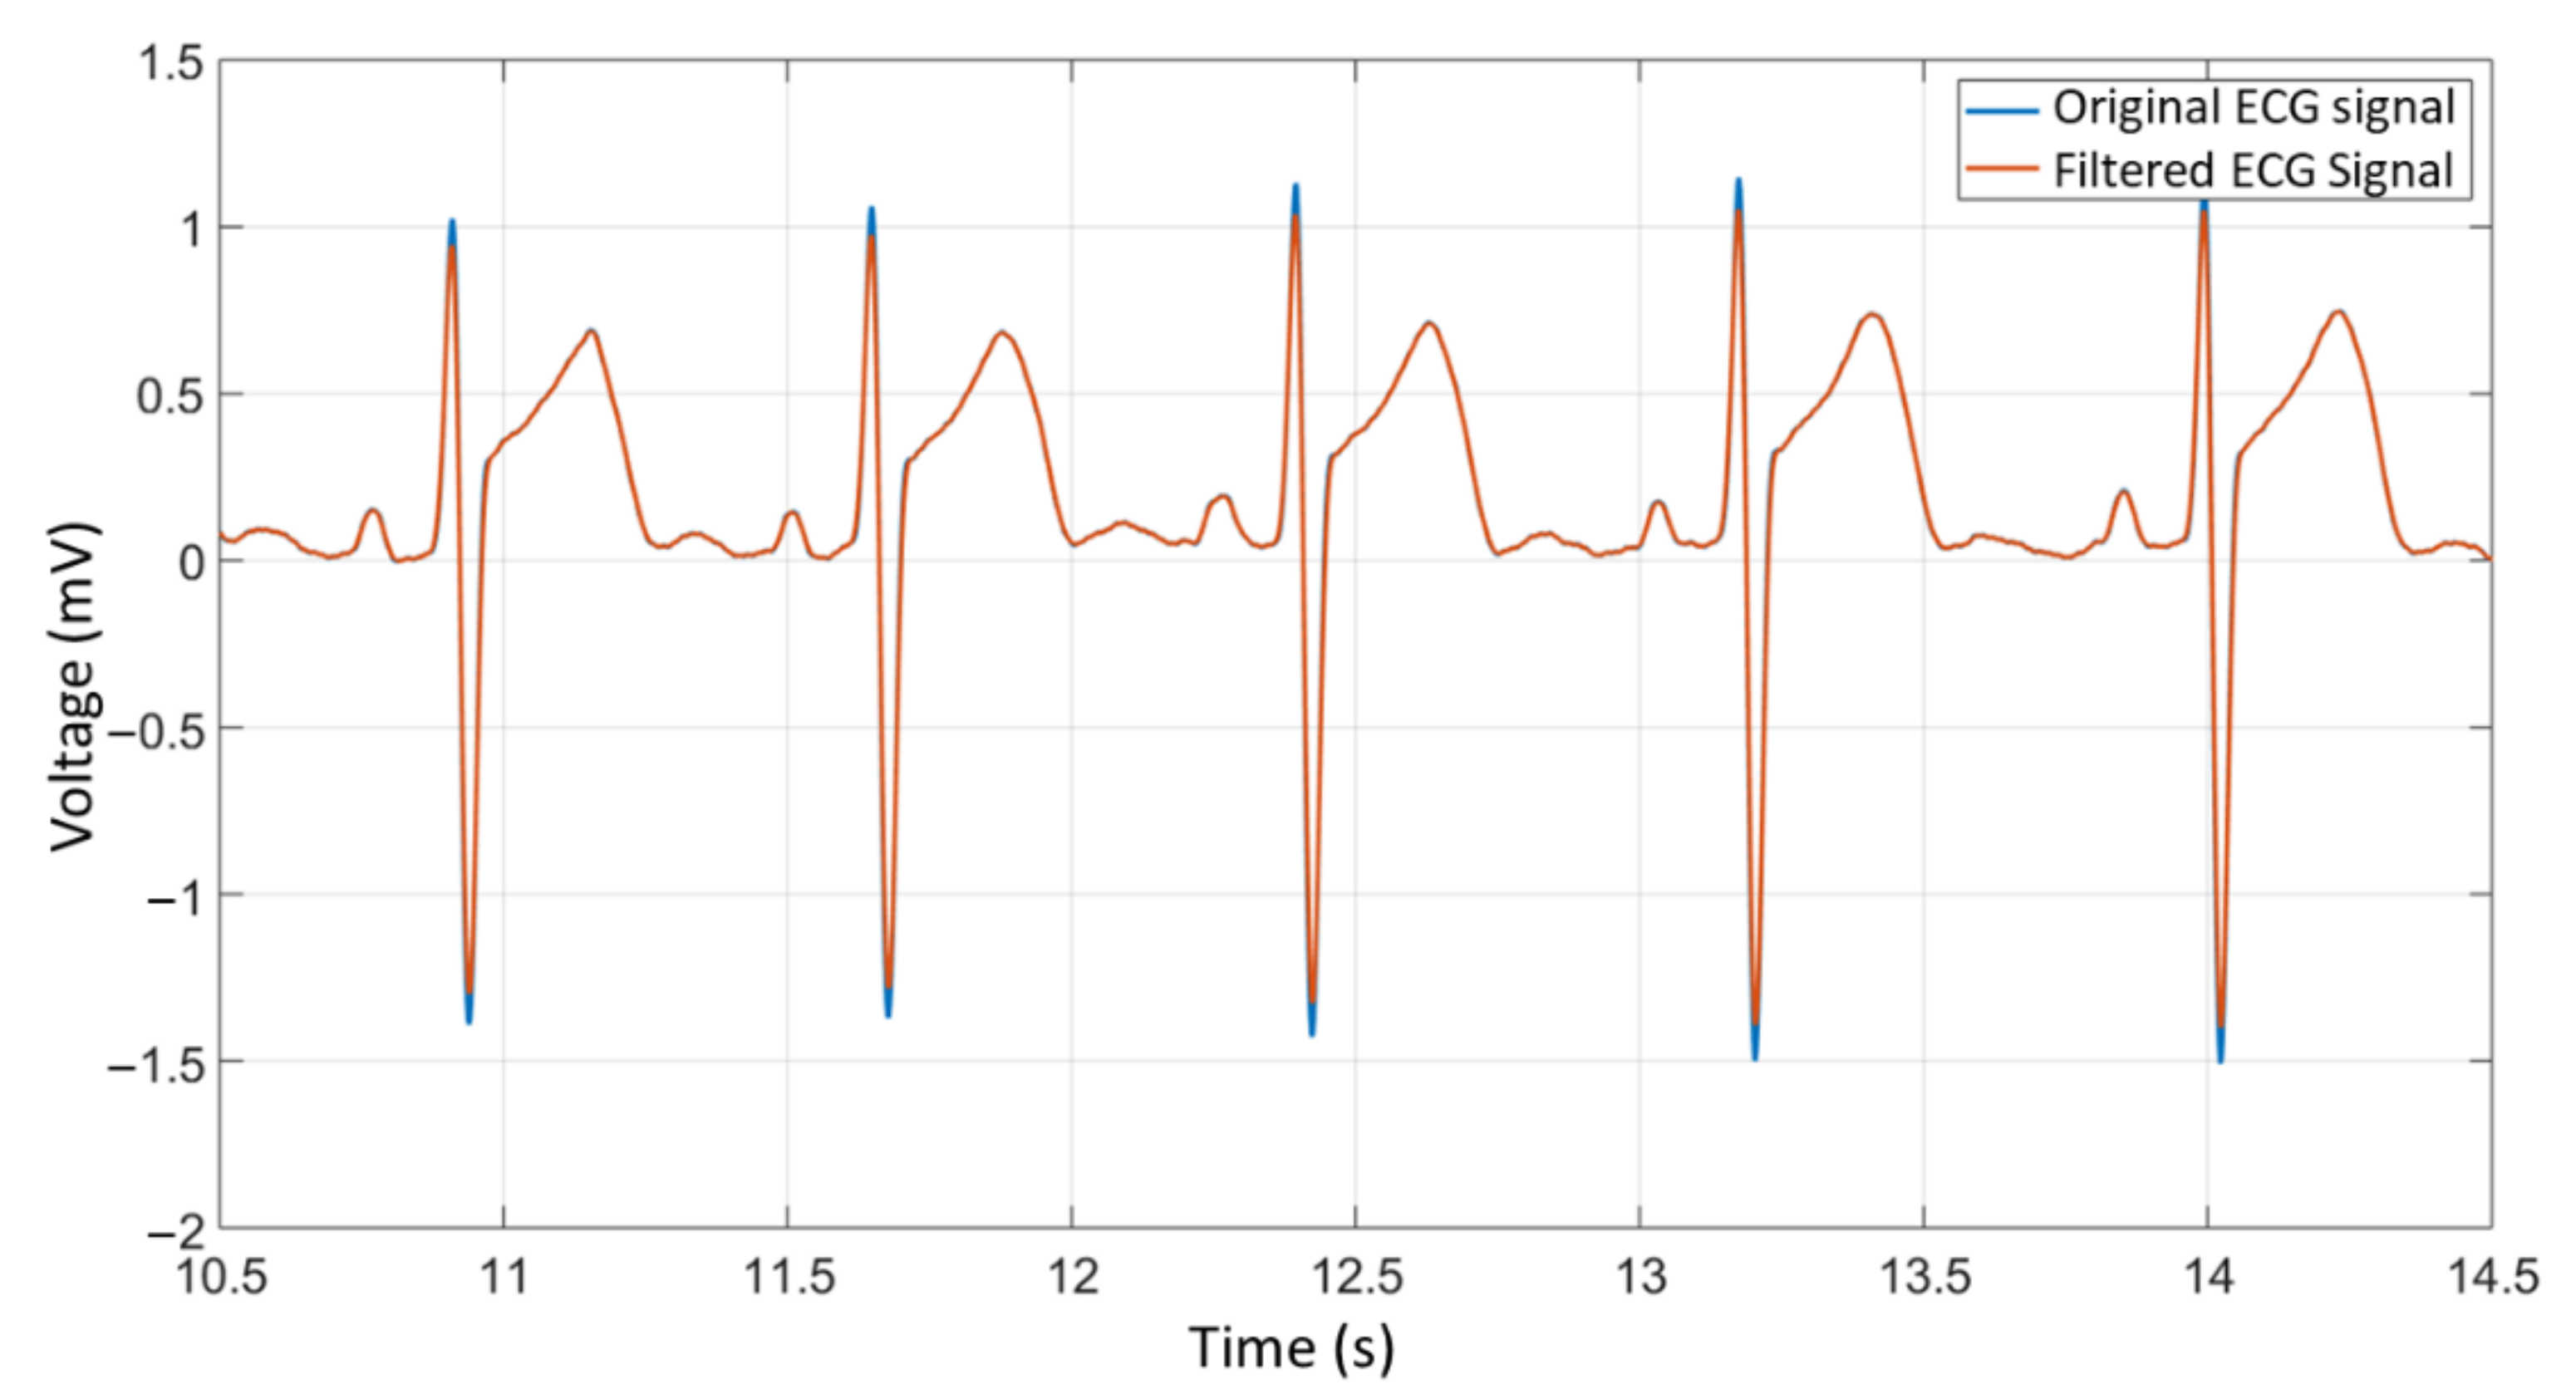
Observing the experimental evaluations, the SNR of the output signal remained close to the simulated results, where the signal was visually clean and detailed, (both with the EMI noise and with the sinusoidal digital noise), presenting an average SNR of 45 dB in the frequency of 60 Hz. In the simulated and experimental results, the peaks of the R and S waves were attenuated by nearly 10% of their amplitude, without compromising the width of the waves.
The delay generated by the filtering algorithm, during the simulated and experimental tests, was far below the standard limit (9.9 ms against 35 ms) and did not compromise the width of the waves nor their original characteristics. The attenuation was kept within reasonable values at the maximum amplitudes, and the waves with intermediate and low amplitudes did not suffer attenuation.
By the results of this work, it is possible to verify the real applicability of the proposed algorithm for its insertion in low-cost two electrodes ECG system. The low sampling rate and computational effort make the proposed algorithm suitable for low-cost embedded systems.
As future works, this ECG system can be improved and embed artificial intelligence algorithms to predict the initial phase of heart attack, sending an alarm message to any health system. It is important to verify that easy-to-use, low-cost EGCs are of vital importance as a point of care for monitoring at home fragile people, especially in the era of pandemics.

Author Contributions

Conceptualization, N.R.N.A.; methodology, N.R.N.A. and A.K.T.J.; software, A.K.T.J.; validation, M.G.A., R.C.G. and M.A.G.d.B.; funding, G.-L.C.; formal analysis, A.K.T.J. and M.A.G.d.B.; investigation, A.K.T.J. and N.R.N.A.; writing—original draft preparation, M.G.A., G.-L.C. and M.A.G.d.B.; review and editing M.A.G.d.B. and G.-L.C. All authors have read and agreed to the published version of the manuscript.

Funding

This work was partially supported by the Natural Science Foundation of Zhejiang (Nº LY20F020001) and the Natural Science Foundation of Ningbo City (Nº 2018A610166, 2019A610339).

Acknowledgments

The authors would like to thank the Federal University of Mato Grosso do Sul—UFMS and NingboTech University.

Conflicts of Interest

The authors declare no conflict of interest.

References

  1. Ministry of Health. Epidemiological and Morbidity. 2019. Available online: https://datasus.saude.gov.br/epidemiologicas-e-morbidade (accessed on 14 June 2021).
  2. World Health Organization. Cardiovascular Diseases (CVDs). 2017. Available online: https://www.who.int/en/news-room/fact-sheets/detail/cardiovascular-diseases-(cvds) (accessed on 14 June 2021).
  3. Moffa, P.J.; Uchida, A.H.; Barbosa, P.B. Standardization of equipment and techniques for conducting electrocardiography and high-resolution electrocardiography exams. Braz. Arch. Cardiol. 2003, 80, 572–578. [Google Scholar]
  4. Colantonio, S.; Conforti, D.; Martinelli, M.; Moroni, D.; Perticone, F.; Salvetti, O.; Sciacqua, A. An intelligent and integrated platform for supporting the management of chronic heart failure patients. In Proceedings of the 2008 Computers in Cardiology, Bologna, Italy, 14–17 September 2008; pp. 897–900. [Google Scholar]
  5. Zompanti, A.; Sabatini, A.; Grasso, S.; Pennazza, G.; Ferri, G.; Barile, G.; Chello, M.; Lusini, M.; Santonico, M. Development and Test of a Portable ECG Device with Dry Capacitive Electrodes and Driven Right Leg Circuit. Sensors 2021, 21, 2777. [Google Scholar] [CrossRef] [PubMed]
  6. Fye, W.B. A History of the Origin, Evolution, and Impact of Electrocardiography. Am. J. Cardiol. 1994, 73, 937–949. [Google Scholar] [CrossRef]
  7. van Rijn, A.C.M.; Peper, A.; Grimbergen, C.A. High-quality recording of bioelectric events part 1, interference reduction, theory and practice. Med. Biol. Eng. Comput. 1990, 28, 389–397. [Google Scholar] [CrossRef] [PubMed]
  8. Loring, Z.; Sen, S.; Black-Maier, E.; Atwater, B.D.; Russell, S.D.; DeVore, A.D.; Piccini, J.P. Reducing ECG Artifact from Left Ventricular Assist Device Electromagnetic Interference. J. Am. Heart Assoc. 2020, 9, e017563. [Google Scholar] [CrossRef] [PubMed]
  9. Winter, B.B.; Webster, J.G. Driven-Right-Leg Circuit Design. IEEE Trans. Biomed. Eng. 1983, 30, 62–66. [Google Scholar] [CrossRef] [PubMed]
  10. van Rijn, A.C.M.; Peper, A.; Grimbergen, C.A. High-quality recording of bioelectric events part 2, low-noise, low-power multichannel amplifier design. Med. Biol. Eng. Comput. 1991, 29, 433–440. [Google Scholar] [CrossRef] [PubMed]
  11. Meidani, M.; Mashoufi, B. Introducing new algorithms for realising an FIR filter with less hardware in order to eliminate power line interference from the ECG signal. IET Signal Process. 2016, 10, 709–716. [Google Scholar] [CrossRef]
  12. Mishra, S.; Das, D.; Kumar, R.; Sumathi, P. A Power-Line Interference Canceler Based on Sliding DFT Phase Locking Scheme for ECG Signals. IEEE Trans. Instrum. Meas. 2015, 64, 132–142. [Google Scholar] [CrossRef]
  13. Aiboud, Y.; el Mhamdi, J.; Jilbab, A.; Sbaa, H. Review of ECG Signal de-noising techniques. In Proceedings of the 2015 Third World Conference on Complex Systems (WCCS), Marrakech, Morocco, 23–25 November 2015. [Google Scholar]
  14. Martinez, A.C.; Pfrimer, F.W.D.; Costa, M.S.; Nakano, A.Y. How to Develop a Single Channel Electrocardiograph with a Low Budget. IEEE Lat. Am. Trans. 2018, 16, 1057–1063. [Google Scholar] [CrossRef]
  15. Electrocardiographs-Metrological Characteristics, OIML R90. 1990. Available online: https://www.oiml.org/en/files/pdf_r/r090-e90.pdf (accessed on 16 June 2021).
  16. Bai, Y.W.; Chu, W.Y.; Chen, C.Y.; Lee, Y.T.; Tsai, Y.C.; Tsai, C.H. The Combination of Kaiser Window and Moving Average for the Low-Pass Filtering of the Remote ECG Signals. In Proceedings of the 17th IEEE Symposium on Computer-Based Medical Systems (CBMS’04), Bethesda, MD, USA, 25 June 2004. [Google Scholar]
  17. Pandey, V.; Giri, V. High Frequency Noise Removal from ECG using Moving Average Filters,” International Conference on Emerging Trends in Electrical. In Proceedings of the Electronics and Sustainable Energy Systems (ICETEESES–16), Sultanpur, India, 11–12 March 2016; pp. 191–195. [Google Scholar]
  18. Chaturvedi, R.; Yadav, Y. Application of moving average filter in ECG denoising. World Acad. J. Eng. Sci. 2014. [Google Scholar] [CrossRef]
  19. Ama, N.R.N.; Komatsu, W.; Junior, L.M. Single and three phase moving average filter PLLs: Digital controller design recipe. Electr. Power Syst. Res. 2014, 116, 276–283. [Google Scholar] [CrossRef]
  20. Guyton, A.C.; Hall, J.E. The Heart. Medical Physiology; Elsevier: Rio de Janeiro, Brazil, 2006; pp. 103–160. [Google Scholar]
  21. Berne & Levy Physiology; Koeppen, B.M.; Stanton, B.A. (Eds.) Elsevier: Rio de Janeiro, Brazil, 2009; pp. 289–416. [Google Scholar]
  22. Webster, J.G. (Ed.) Medical Instrumentation: Application and Design; John Wiley & Sons: Hoboken, NJ, USA, 2010. [Google Scholar]
  23. Hwang, I.D.; Webster, J.G. Direct Interference Canceling for Two-Electrode Biopotential Amplifier. IEEE Trans. Biomed. Eng. 2008, 55, 2620–2627. [Google Scholar] [CrossRef] [PubMed]
  24. Dobrev, D. Two-electrode non-differential biopotential amplifier. Med. Biol. Eng. Comput. 2002, 40, 546–549. [Google Scholar] [CrossRef] [PubMed]
  25. Ama, N.R.N.; Komatsu, W.; Junior, L.M. Digital Control for PLLs Based on Moving Average Filter: Analysis and Design in Discrete Domain. Rev. Eletrônica De Potência 2015, 20, 293–299. [Google Scholar]
  26. PhysioNet. MIT-BIH Arrhythmia Database. 2005. Available online: https://physionet.org/content/mitdb/1.0.0/ (accessed on 16 June 2021).
  27. Medeiros, J.C.D.O. Principles of Telecommunications: Theory and Practice; Érica: São Paulo, Brazil, 2007. [Google Scholar]
  28. Electromedical Equipment—Part 2–27: Particular Requirements for Basic Safety and Essential Performance of Electrocardiographic Monitoring Equipment, IEC 60601-2-27; IEC: Geneva, Switzerland, 2013.
Figure 1. QRS Complex.
Electronics 10 02366 g001
Figure 2. Generalized block diagram of the proposed system.
Electronics 10 02366 g002
Figure 3. Generalized block diagram of the MA-PLL.
Electronics 10 02366 g003
Figure 4. Discrete linearized block diagram of the MA-PLL.
Electronics 10 02366 g004
Figure 5. Bode plot—Module and phase of the MA filter for N = 10, fa = 1200 Hz, and fc = 120 Hz.
Electronics 10 02366 g005
Figure 6. Root Locus of the MA-PLL (N = 10, fc = 120 Hz, and fa = 1200 Hz).
Electronics 10 02366 g006
Figure 7. Block diagram of the 2MAV-PLL.
Electronics 10 02366 g007
Figure 8. Original ECG signal (a), EMI (60 Hz) (b), and ECG signal plus noise (c).
Electronics 10 02366 g008
Figure 9. Block diagram of the embedded ECG algorithm.
Electronics 10 02366 g009
Figure 10. Block diagram of MA-PLL (Simulink).
Electronics 10 02366 g010
Figure 11. Adaptive MAV block diagram (Simulink).
Electronics 10 02366 g011
Figure 12. Sum Delay block diagram (Simulink).
Electronics 10 02366 g012
Figure 13. Prototype under analysis. (a) Top view of the prototype; (b) front view of the prototype.
Electronics 10 02366 g013
Figure 14. Original ECG signal.
Electronics 10 02366 g014
Figure 15. ECG signal with physical EMI noise (a) and with digital sinusoidal noise (b).
Electronics 10 02366 g015
Figure 16. ECG signal with EMI noise, original ECG (a), and filtered ECG (b).
Electronics 10 02366 g016
Figure 17. Curve of SNR values in the frequency range of 50 Hz to 70 Hz.
Electronics 10 02366 g017
Figure 18. Noise residue after filtering (60 Hz, maximum SNR, and minimum SNR).
Electronics 10 02366 g018
Figure 19. ECG signals with EMI noise (a) and sinusoidal noise (b).
Electronics 10 02366 g019
Figure 20. Original and filtered ECG signals.
Electronics 10 02366 g020
Table 1. Electrodes and their derivations—mathematical relationships.
DerivationsElectrodesDefinition
BipolarBE, BD, and PEDI = BE − BD
DII = PE − BD
DIII = PE − BE
Unipolar Augmented (Goldberg)BE, BD, and PEaVR = BD − ½(BE + PE)
aVL = BE − ½ (PE + BD)
aVF = PE − ½ (BE + BD)
Unipolar (Wilson)BE, BD, PE, V1, V2, V3, V4, V5, and V6V1 = v1 − (BD + BE + PE)/3
V2 = v2 − (BD + BE + PE)/3
V3 = v3 − (BD + BE + PE)/3
V4 = v4 − (BD + BE + PE)/3
V5 = v5 − (BD + BE + PE)/3
V6 = v6 − (BD + BE + PE)/3
Table 2. Algorithm configuration data.
FigureBlockEquationParameterValue
10Moving average(4)N10
10Gain 1-K1180/π
10Compensator(9)K319.1934263090495
10Compensator(9)A0.957437866536668
10Limiter-min360 × 50
10Limiter-max360 × 70
10Integrator(12)K1
10Integrator(12)Ts1/1200
10Range_limit-min0
10Range_limit-max360
10Gain 2-K21/360
102nd LPF-num(z)1
102nd LPF-den(z)s2 + 2.s + 1
11Adaptive(13)/(14)fa1200
12Limiter-min1
12Limiter-max8
Table 3. Statistical Data of the SNR—2MAV-PLL.
DataSNR (dB)
Minimum30.60
Maximum46.99
Average38.90
Variation16.39
Table 4. Comparison among filtering algorithms.
FilterProposed
2MAV-PLL
HSSCZ+
HSSC [11]
SDFT-PLL [12]Kalman [13]
SNR(dB)44.013.140.014.9
Acquisition frequency (kHz)1.2-25.6-
Nominal frequency (Hz)±10±1±25-
Publisher’s Note: MDPI stays neutral with regard to jurisdictional claims in published maps and institutional affiliations.

