Article

A Novel Turbo Detector Design for a High-Speed SSVEP-Based Brain Speller

College of Communications Engineering, Army Engineering University of PLA, Nanjing 210007, China
*
Author to whom correspondence should be addressed.
Electronics 2022, 11(24), 4231; https://doi.org/10.3390/electronics11244231
Submission received: 4 October 2022 / Revised: 5 November 2022 / Accepted: 9 November 2022 / Published: 19 December 2022

Abstract

:
The past decade has witnessed the rapid development of brain-computer interfaces (BCIs). The contradiction between communication rates and tedious training processes has become one of the major barriers restricting the application of steady-state visual-evoked potential (SSVEP)-based BCIs. A turbo detector was proposed in this study to resolve this issue. The turbo detector uses the filter bank canonical correlation analysis (FBCCA) as the first-stage detector and then utilizes the soft information generated by the first-stage detector and the pool of identified data generated during use to complete the second-stage detection. This strategy allows for rapid performance improvements as the data pool size increases. A standard benchmark dataset was used to evaluate the performance of the proposed method. The results show that the turbo detector can achieve an average ITR of 130 bits/min, which is about 8% higher than FBCCA. As the size of the data pool increases, the ITR of the turbo detector could be further improved.

1. Introduction

The brain-computer interface (BCI) is a new human-machine system that allows control commands to be sent directly to applications without a peripheral nervous system. Over the past decade, the steady-state visual-evoked potential (SSVEP)-based brain-computer interface (BCI) has garnered much attention due to its high information transfer rate (ITR) robustness and non-invasiveness [1,2,3,4]. SSVEP is an innate brain response to visual stimuli; when the eyes stare at a flashing stimulus, the brain’s occipital region will generate a signal corresponding to the stimulus’s frequency.
With this feature, the BCIs can send commands by identifying the target on which the subject is gazing. If SSVEP-based BCIs are considered a specific communication system, the brain and visual pathways can be regarded as a nonlinear channel [5,6,7,8]. Thus, SSVEP-based BCIs offer a potential alternative communication solution for patients suffering from limited motor capabilities, such as locked-in syndrome amyotrophic lateral sclerosis (ALS) patients, severe patients and those with physical disabilities [9,10]. Efficiency and convenience are crucial for SSVEP-based BCIs, especially for disabled-people-oriented applications. In order to provide better services and alleviate the patient’s suffering, there has been extensive research on SSVEP-based BCIs. Most recent works can be divided into two categories, i.e., stimulus paradigm design and signal processing algorithms. The former focuses mainly on designing an efficient stimulus paradigm according to different requirements, whereas the latter focuses on developing a high-performance signal detection algorithm.
The performance of the signal detection algorithm plays a vital role in SSVEP-based BCIs if the stimulus paradigm is designed. There are two major types of algorithms for SSVEP signal detection: unsupervised methods and supervised methods. Unsupervised methods can realize plug-and-play without requiring training data; on the contrary, supervised methods require users to collect training data in advance [11].
Given the convenience and efficiency as such, the unsupervised method has drawn wider scholarly attention. The power spectral density analysis (PSDA) is widely applied in early research, but it has low accuracy and cannot fully utilize multi-channel signals. As a result, PSDA has quickly been replaced by other spatial filter-based algorithms, such as canonical correlation analysis (CCA) [12,13,14], minimum energy combination (MEC) [15,16], and multivariate synchronization index (MSI) [17]. The CCA algorithm is a statistical method that calculates the maximum correlation coefficient between two multivariate sets of variables. In the SSVEP-based BCIs system, this method can find a spatial filter that maximizes the correlation coefficient between the multi-channel EEG signals and the reference signals. Similarly, MEC also calculates a spatial filter that minimizes the noise power. Besides these methods, MSI is another algorithm that obtains results most similar to those in references by optimizing a spatial filter.
Researchers have also worked on studying supervised algorithms. Individual template-based canonical correlation analysis (IT-CCA) was first proposed by Nakanishi et al. This method applies averaging multiple training trials to replace the reference signal in a standard CCA algorithm [6,18,19]. Based on IT-CCA, multi-way canonical correlation analysis and L1-regularized multi-way canonical correlation analysis (L1-MCCA) are proposed by subsequent researchers to improve the performance [20,21]. Extended canonical correlation analysis (eCCA) was proposed in [22], which combines the standard CCA and IT-CCA to reduce the interference from the spontaneous background noise. Task-related component analysis (TRCA) can maximize the reproducibility of SSVEP signals across multiple trials to reduce the interference of spontaneous electroencephalographic (EEG). Furthermore, the ensemble version of the TRCA algorithm, i.e., ensemble TRCA (eTRCA), was also proposed. Due to its high accuracy and information transfer rate (ITR), the eTRCA algorithm has become the most popular supervised algorithm in the detection of SSVEP. In a recent study, Wong et al. proposed a multi-stimulus technique, further improving the performance of eCCA and eTRCA. To the best of our knowledge, the multi-stimulus eCCA+eTRCA has the highest ITR in existing reports [23].
In general, supervised methods perform better than unsupervised ones. Without the dynamic window strategy, the filter bank canonical correlation analysis (FBCCA) proposed in 2015 still achieves the highest ITR [14,16,24]. In contrast, supervised methods have made rapid progress from IT-CCA to eTRCA and multi-stimulus eCCA + eTRCA algorithms. However, supervised methods have a major drawback, namely the tedious training process. To overcome this drawback, a novel turbo detector is proposed in this study.
How to improve the “efficiency” of unsupervised algorithms while maintaining their high “performance”, or how to improve the “performance” of supervised algorithms while maintaining their “efficiency” is the problem to be solved in this paper. In other research fields, there are also contradictions between two important indicators. For example, in engine design, there are contradictions between engine displacement and power. In order to reconcile this contradiction, engineers invented the turbo engine, which is used to enhance engine power through the reuse of exhaust gas. In addition to being applied to engines, the “Turbo” idea is also widely used in the communication field. For example, the Turbo equalizer overcomes the fading channel and improves the performance through information interaction between the first-level equalizer and the second-level decoder. Turbo coding technology, which is also widely used in 4G network technology, is also improved in performance through information exchange between two levels of decoders. Inspired by the “Turbo” idea, we proposed a turbo detector for SSVEP-based BCIs to enhance the performance. The proposed method contains two stage detectors; the first stage calculates soft information, and the second stage searches the training data from the data pool based on the soft information and completes the identification. The turbo detector can achieve plug-and-play, and its performance is approximate to the supervised method without the tedious training process. The experimental results show that the ITR of the proposed method is higher than FBCCA, which is the most extensive unsupervised algorithm.

2. Methods and Materials

2.1. Filter Bank Canonical Correlation Analysis and Extend Canonical Correlation Analysis
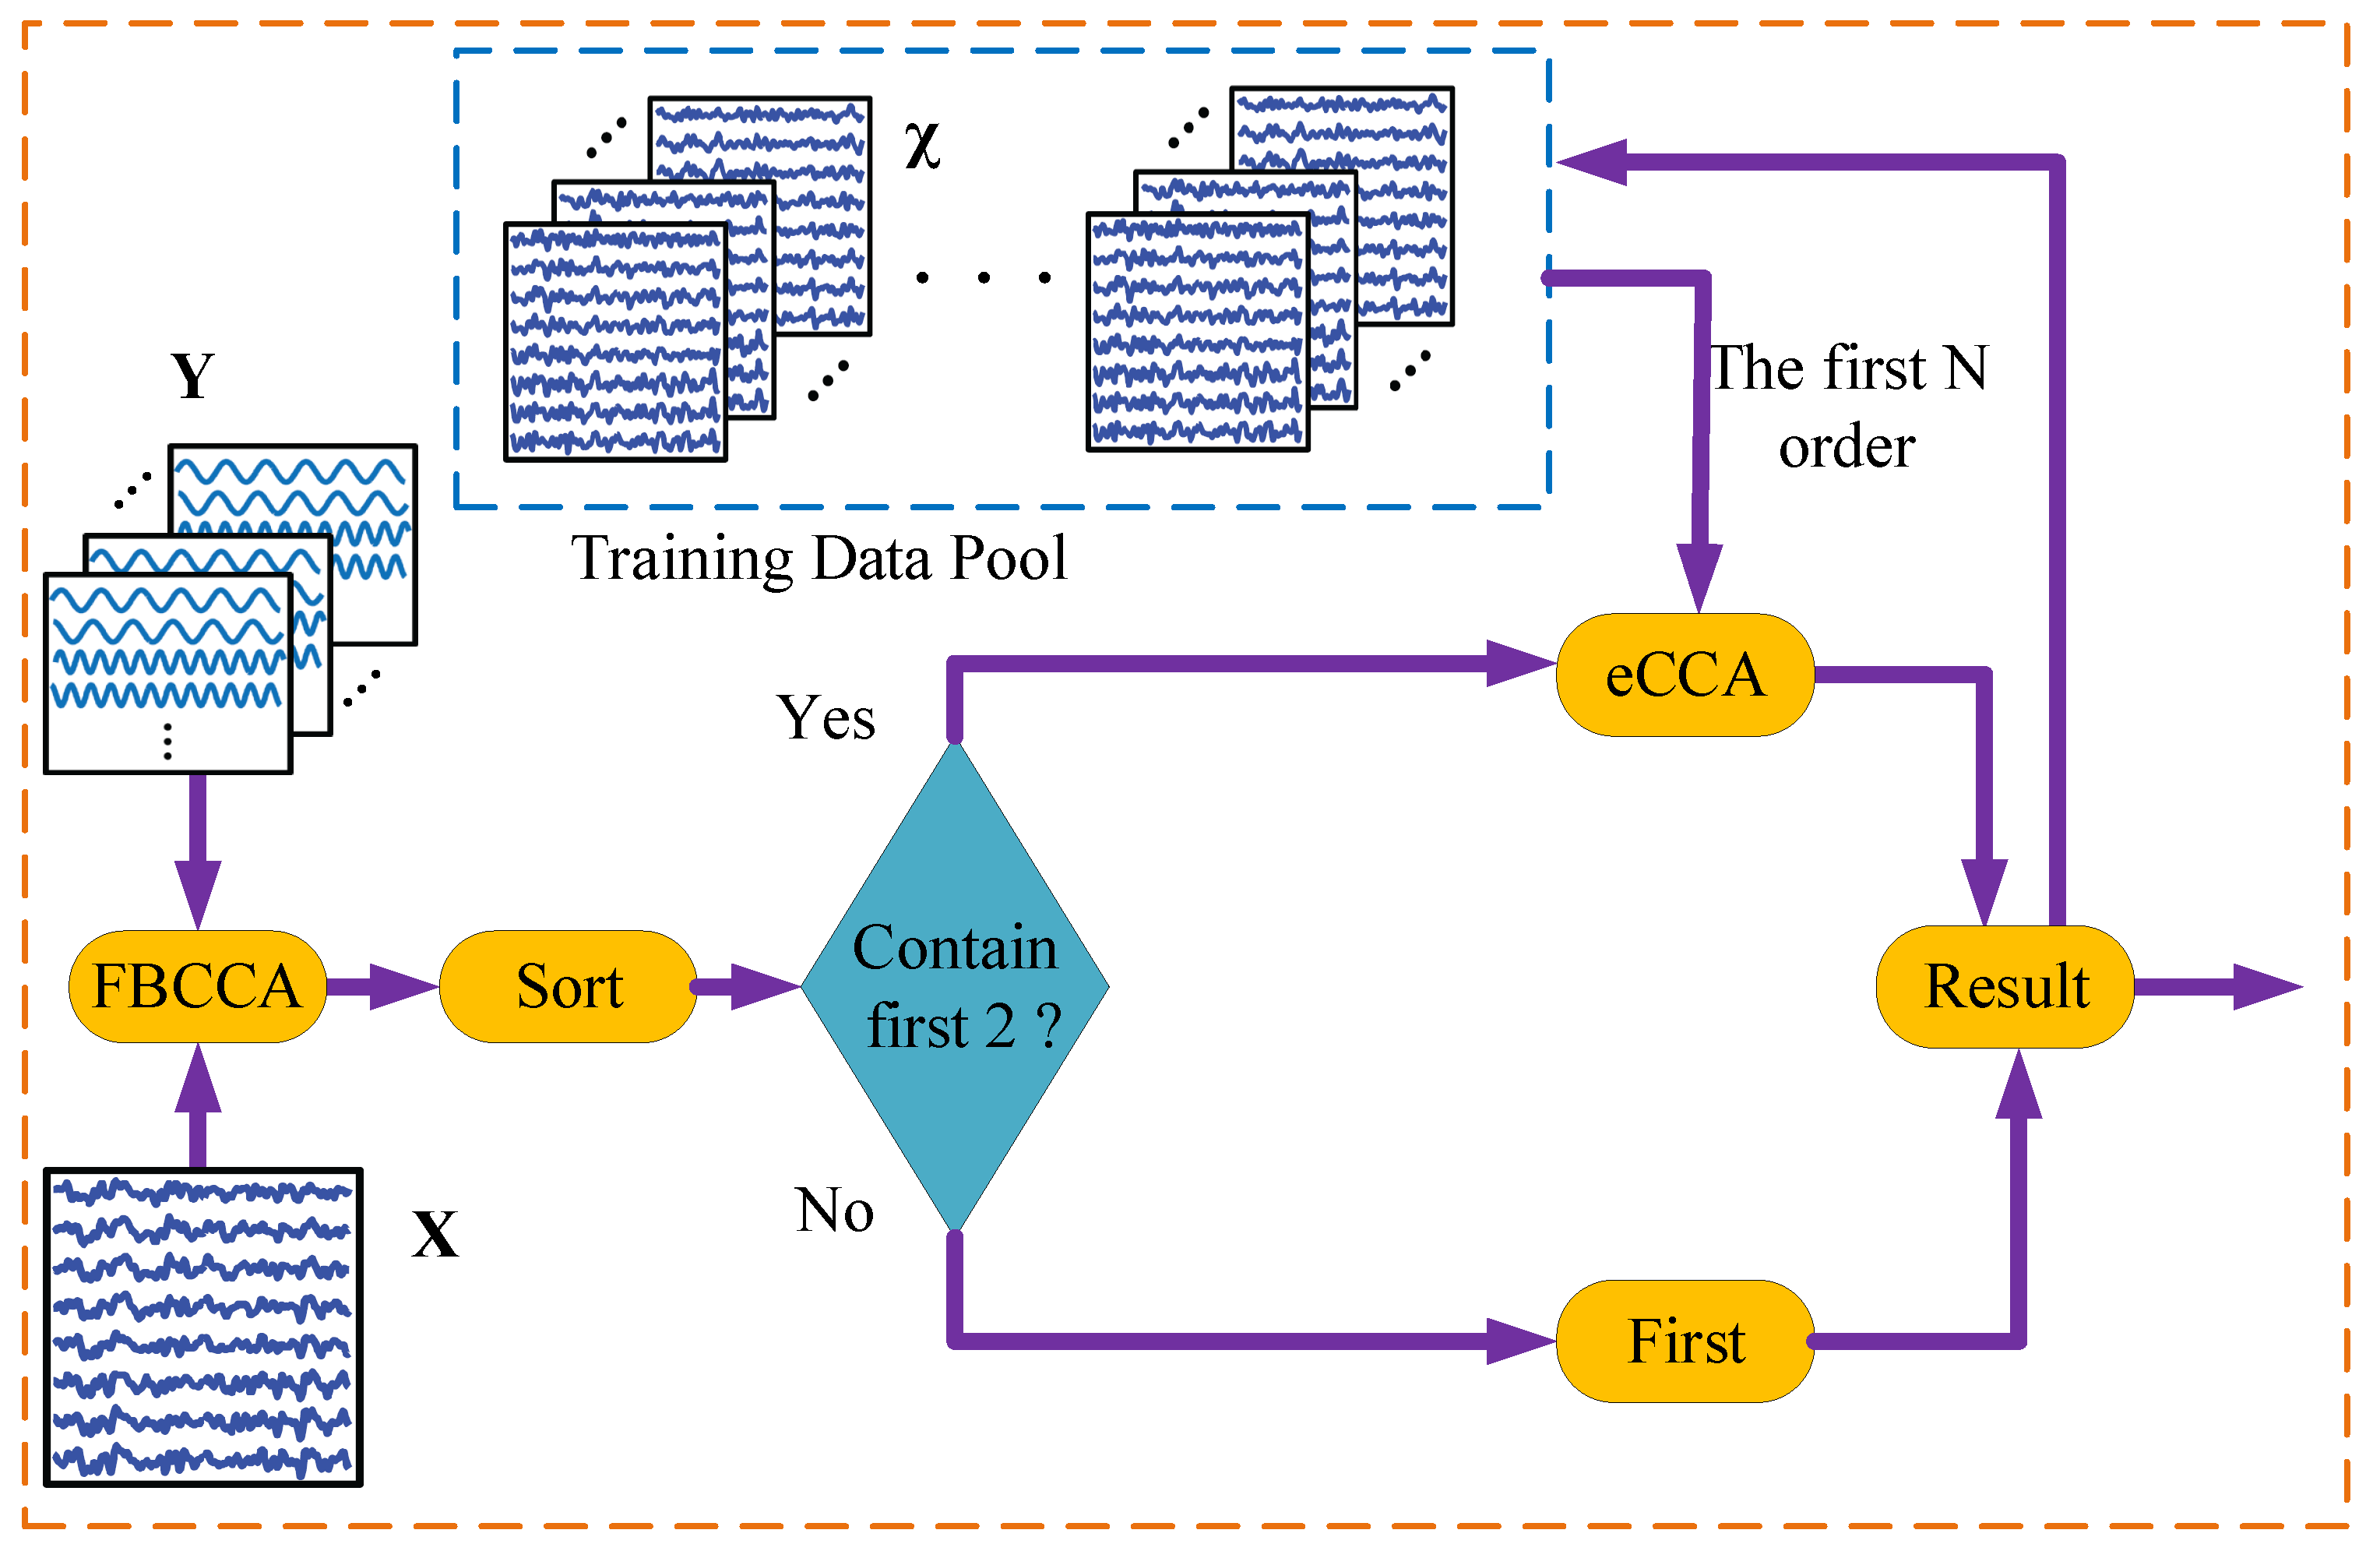
Standard CCA makes the projection results of two multivariate variables A R n × m 1 , B R n × m 2 have the largest correlation coefficient by selecting the best projection direction [12]. CCA maximizes the correlation of A u and B v by calculating the optimal projection direction u R m 1 × 1 and v R m 2 × 1 . The optimization problem can be written as follows.
CCA ( A , B ) = arg max u , v E [ u T A T B v ] E [ u T A T A u ] E [ v T B T B v ]
Let x = A u and y = B v and the result of Equation (1) make the Pearson’s correlation ρ ( x , y ) maximization. Let X and Y k be the multi-channel EEG signals and SSVEP reference signal; the maximum correlation between EEG signals and reference signals can be calculated via Equation (1). The reference signal Y k matching with stimulation frequency f k can be expressed as:
Y k = sin ( 2 π f k t ) cos ( 2 π f k t ) sin ( 2 π N h f k t ) cos ( 2 π N h f k t ) , t = 1 F s , 2 F s , , N s F s ,
where f k denotes the stimulus frequency, F s is the sampling rate and N h is the number of harmonics of the SSVEP component.
Let X ¯ k denote the average of multiple trials in the training set, the feature of the test data can be defined as the correlation coefficients among the test data, the training data and reference signals under several spatial filters calculated by the CCA algorithm. Toward this end, the feature can be expressed as follows:
r k = r k ( 1 ) r k ( 2 ) r k ( 3 ) r k ( 4 ) = ρ ( X T u X Y , Y k T v X Y ) ρ ( X T u X X ¯ , X ¯ k T v X X ¯ ) ρ ( X T u X Y , X ¯ k T u X Y ) ρ ( X T u X ¯ Y , X ¯ k T u X ¯ Y ) ,
where u X Y and v X Y represent the spatial filter of X and Y, respectively, which can be calculated by the CCA algorithm, and ρ ( X , Y ) denote the correlation coefficient of X and Y. In practice, the following weighted correlation coefficient ρ k is usually used as the final feature of the detection.
ρ k = q = 1 4 sign r k ( q ) · r k ( q ) 2
where sign() is used for discriminative information from negative correlation coefficients between test data X f and training data X ¯ f . The detector recognizes the visual stimulus frequency corresponding to the received data by selecting the largest ρ k .
To overcome the effects of non-Gaussian background noise and the SSVEP harmonies, FBCCA decomposes the EEG into several sub-bands and employs standard CCA to process the sub-band data. In this paper, the lower and upper cut-off frequencies of the m-th sub-band are set to m × 8 Hz and 90 Hz, respectively. Both the number of sub-bands and the harmonic number of the reference signals ( N h ) are set as 5. Then, using the weighted correlation coefficient in (3) and (4), a weighted sum of squares of the correlation coefficients of all sub-bands can be expressed as:
r e s u l t = arg max k m = 1 N f b ( m 1.25 + 0.25 ) · ρ k ( m )
where ρ k ( m ) is the canonical correlation coefficient between X n in the m-th sub-band and Y k calculated by CCA in the m-th sub-band. In this paper, both the FBCCA algorithm and the eCCA algorithm use the filter bank design method described above, where both the number of filter banks and harmonic number are set to 5.

2.2. Turbo Detector

In the existing SSVEP signal detection methods, for both the supervised and the unsupervised methods, the received data will be abandoned instead of extending the training dataset. If the detector can fully exploit those received data to extract the subject-specific information, the performance will be improved. However, if the received data are set as training data, we note that the detector needs a large amount of data to achieve the complete training dataset (each stimulus frequency has at least 1 trial data for training) since the received data are random. Furthermore, the size of the training dataset is determined by the stimulus frequency with a minimum number of trials. It takes a long time to obtain a small complete training dataset, and most of the received data are discarded. In this work, a novel turbo detector is proposed, which recycles the received data to train the detector through the second-stage detector. The turbo detector is a two-stage detector composed of a first-stage FBCCA detector and a second-stage supervised detector (e.g., eCCA and eTRCA).
We assume that the correlation coefficients determined by FBCCA can be expressed as:
ρ = ρ 1 , ρ 2 , ρ 3 , , ρ N t .
For the traditional algorithm, the detector identifies the target by the maximum value of ρ . However, there is a lot of information about the data contained in ρ for the traditional algorithm, which is expected to reach the maximum value, and it gives up a lot of information about the data, which is called the hard decision in the field of communication. In most cases, the hard decision is not the best decision for the detector [25].
By sorting vector ρ from largest to smallest as
ρ s q u = s o r t ( ρ ) = ρ f i r , ρ s e c , ρ t h i r , , ρ l a s t ,
We can note that the order of the sorts can reflect the probability of the target. Figure 1 illustrates the statistical probability of the correct target’s order under different data lengths in the SSVEP benchmark dataset. From the figure, it can be easily found that the order of the correct target is concentrated in the first few places, especially the first and second. Meanwhile, aggregation degrees increase with data length. If the received data are used as the training data, the detector only needs the first N data rather than the complete training dataset to achieve supervision detection. Inspired by the turbo engine boosting power by exhaust gas, the turbo detector for SSVEP-based BCIs is proposed in this paper. The flowchart is shown in Figure 2. The main step of the strategy is specified formally in Algorithm 1. The turbo detector first recognizes the received signal by FBCCA and then finds the first candidates. Then, if the data pool contains the candidates’ training data, it reidentifies them by eCCA. Otherwise, the result of FBCCA is considered the final result. Finally, the received signal is saved into the data pool as training data.
Algorithm 1 Turbo strategy for SSVEP-based BCIs.
1:
initialize χ = n u l l ;
2:
for  n = 1 , 2 , 3 , all trials  do
3:
     ρ = FBCCA ( X n ) ;
4:
     ρ s q u = SORT ( ρ ) ; % from largest to smallest
5:
    if  χ contains 2 targets in the training data; then
       eCCA ( X n ) ; % reidentifies the top N order
       OUTPUT : Results
       χ = [ χ , X n ]
6:
    else
       FBCCA ( X n )
       OUTPUT : Results
       χ = [ χ , X n ]
7:
    end if
8:
end for
To analyze the performance, two assumptions are proposed.
Assumption 1: The accuracy of the supervision algorithm is higher than that of the unsupervised algorithm under the same condition [11].
In the turbo detector, it means that the performance of the second-stage detector is superior to the first-stage detector via assumption 1.
Assumption 2: The order is positively sorted to the probability of the correct target.
Let p c c a and p e c c a denote the accuracy of FBCCA and eCCA, respectively, and H c denotes the correct identification. Supposing the probability of the target order in the sort determined by the FBCCA, it can be expressed as: p ( H c | ρ f i r ) , p ( H c | ρ s e c ) , ⋯, p ( H c | ρ N t t h ) . The essential aspects of assumption 2 can be described as follows
i = 1 N t p ( ρ i t h ) p ( H c | ρ i t h ) = 1 p ( H c | ρ f i r ) > p ( H c | ρ sec ) > , > , p ( H c | ρ N t )
The recognition ability of FBCCA can be expressed as p c c a N , and the recognition ability of eCCA can be expressed as p e c c a N , where N denotes the order of the sort that input the second-stage detector. Based on assumption 1, we have p e c c a N > p c c a N .
Furthermore, according to Bayes’ theorem, the accuracy of the turbo strategy can be calculated as follows:
p e c c a t u r = p e c c a N i = 1 N p ( H c | ρ i t h ) > p c c a N i = 1 N p ( H c | ρ i t h ) = p c c a
Let p t denote the probability that the training data pool contains the required data. Along with the user’s continuous input of characters, the training data pool is continuously expanding [26]. Therefore, the value of p t increases with use time until it reaches one; the data pool contains at least one experiment of each candidate’s goal and forms a complete dataset. Before the data pool collects at least one complete training set, the value of N is another factor affecting p t . When N = N t , p t = 0 without complete training datasets. When N = 2 (the minimum value), p t is at its maximum value under the same data pool. In addition to p t , the value also has a certain influence on the performance of the second-stage detector. It is not easy to only qualitatively analyze the effect of the value of N on the performance of the detector. Namely, the value of N is approximately positively correlated with the second-stage detector’s performance.
Let T denote the number of trials that complete the training data pool, N t denote the number of the candidates of the target and each target has equal probabilities and t i denote the number of trials that completes the ( i 1 ) -th target to i-th target. The expectation value of T is
T = i = 1 N t t i
where t i , i = 1 , 2 , , N t are statistically independent of each other and obey the geometric distribution t i G e ( p i ) , p i = N t i + 1 N t
E T = i = 1 N t E t i = i = 1 N t 1 p i = N t N t + N t N t 1 + + N t 1 = N t H N t
where H N t is a harmonic series [27]. If the received data are used as training data, the detector needs to receive an average of N t H N t trials to complete the training dataset. It is inefficient for the detector, especially when the N t is large. Similar to the most popular 40 target SSVEP-speller, the detector needs to receive 171 trials to complete the training dataset. However, there are only 40 trials that can be used to train the detector, and 131 trials are wasted, which means each target has only one trial to train the detector. According to the flowchart of the turbo strategy and the results from Figure 2, there only needs to be two largest probability candidates’ training data for the second-stage detector. Here, we set t i a i = 1 , 2 , , N t as the number of trials that can realize the second detection during the ( i 1 ) -th target to i-th target, let p i a denote the average probability that the received data can be detected by the supervised algorithm through the training data pool. Similarly, we have p i a = i 2 N t 1 and t i a = t i 1 p i a and
E T a = 2 N t E t i a = 2 N t 1 p i 1 p i a
Furthermore, the number of trials can be calculated as follows: p i b = N t i + 2 N t 1 , t i b = t i 1 p i b ,
E T b = 2 N t E t i b = 2 N t 1 p i 1 p i b
According to Equations (12) and (13), it can be easily calculated for the 40 target speller that an average of 111 trials can employ the supervised method, and only 20 trials are wasted before the data pool collects a complete training dataset.

2.3. Training Data Selection

Different from traditional training datasets, the proposed training data pool is dynamic; its label may be wrong, the number of each stimulus is not equal and the training data of some stimuli may be missing. The selected training data directly affects the performance of the second-stage detector. Let the received data be X f r j R N C × N S , where f r denotes the identified result (it may be wrong) and j denotes the j-th trial identified as f r stimulus. Let χ f r = [ X f r 1 , X f r 2 , , X f r N f r ] denote the training data pool of f r stimulus, where N f r denotes the number of trials of the f r stimulus. The data pool can be denoted as χ = [ χ 1 , χ 2 , , χ N t ] . Let χ t denote the training data selected from χ . In this work, we propose two strategies for selecting the training data for the second-stage detector. Let χ s o r t = [ χ 1 t h , χ 2 t h , , χ N t t h ] denote the data pool sorted corresponding to Equation (6). The first strategy (S1) selects the top N candidate targets in the sort, and the latest trial for each stimulus is treated as training data. The training data selected from χ s o r t is χ S 1 = [ X 1 t h , X 2 t h , X N t h ] , where the latest received data are X k t h , k denotes the order in χ s o r t . The second strategy (S2) selects the top N candidate targets in the sort, and the average of all the trials corresponding to each stimulus are treated as training data. The training data selected from the data pool are χ S 2 = [ χ 1 t h , χ 2 t h , χ N t h ] , where χ k t h is a third-order tensor that contains all the received data from the k-th stimulus.
The detector selects the training data from the data pool in Algorithm 2.
Algorithm 2 Training data selection method.
1:
initialize
         χ S 1 = = [ χ 1 t h 1 , χ 2 t h 1 , χ k t h 1 , χ N t t h 1 ]
         χ S 2 = [ χ 1 t h 2 , χ 2 t h 2 , χ k t h 2 , χ N t t h 2 ]
         χ k t h 1 = n u l l and χ k t h 2 = n u l l ;
2:
for  n = 1 , 2 , 3 ,  do
        Identify ( X n ) = k
         χ k t h 1 = X n
         χ k t h 2 = [ χ k t h 2 , X n ]
3:
end for

3. Performance and Evaluations

The previous section confirmed factors affecting the performance of the turbo detector, i.e., the SNR of the SSVEP, data length, the order of the input sequence, the number of trials for each stimulus in the test dataset and the value of N. This section evaluates their impact and the according ways to optimize the detector.

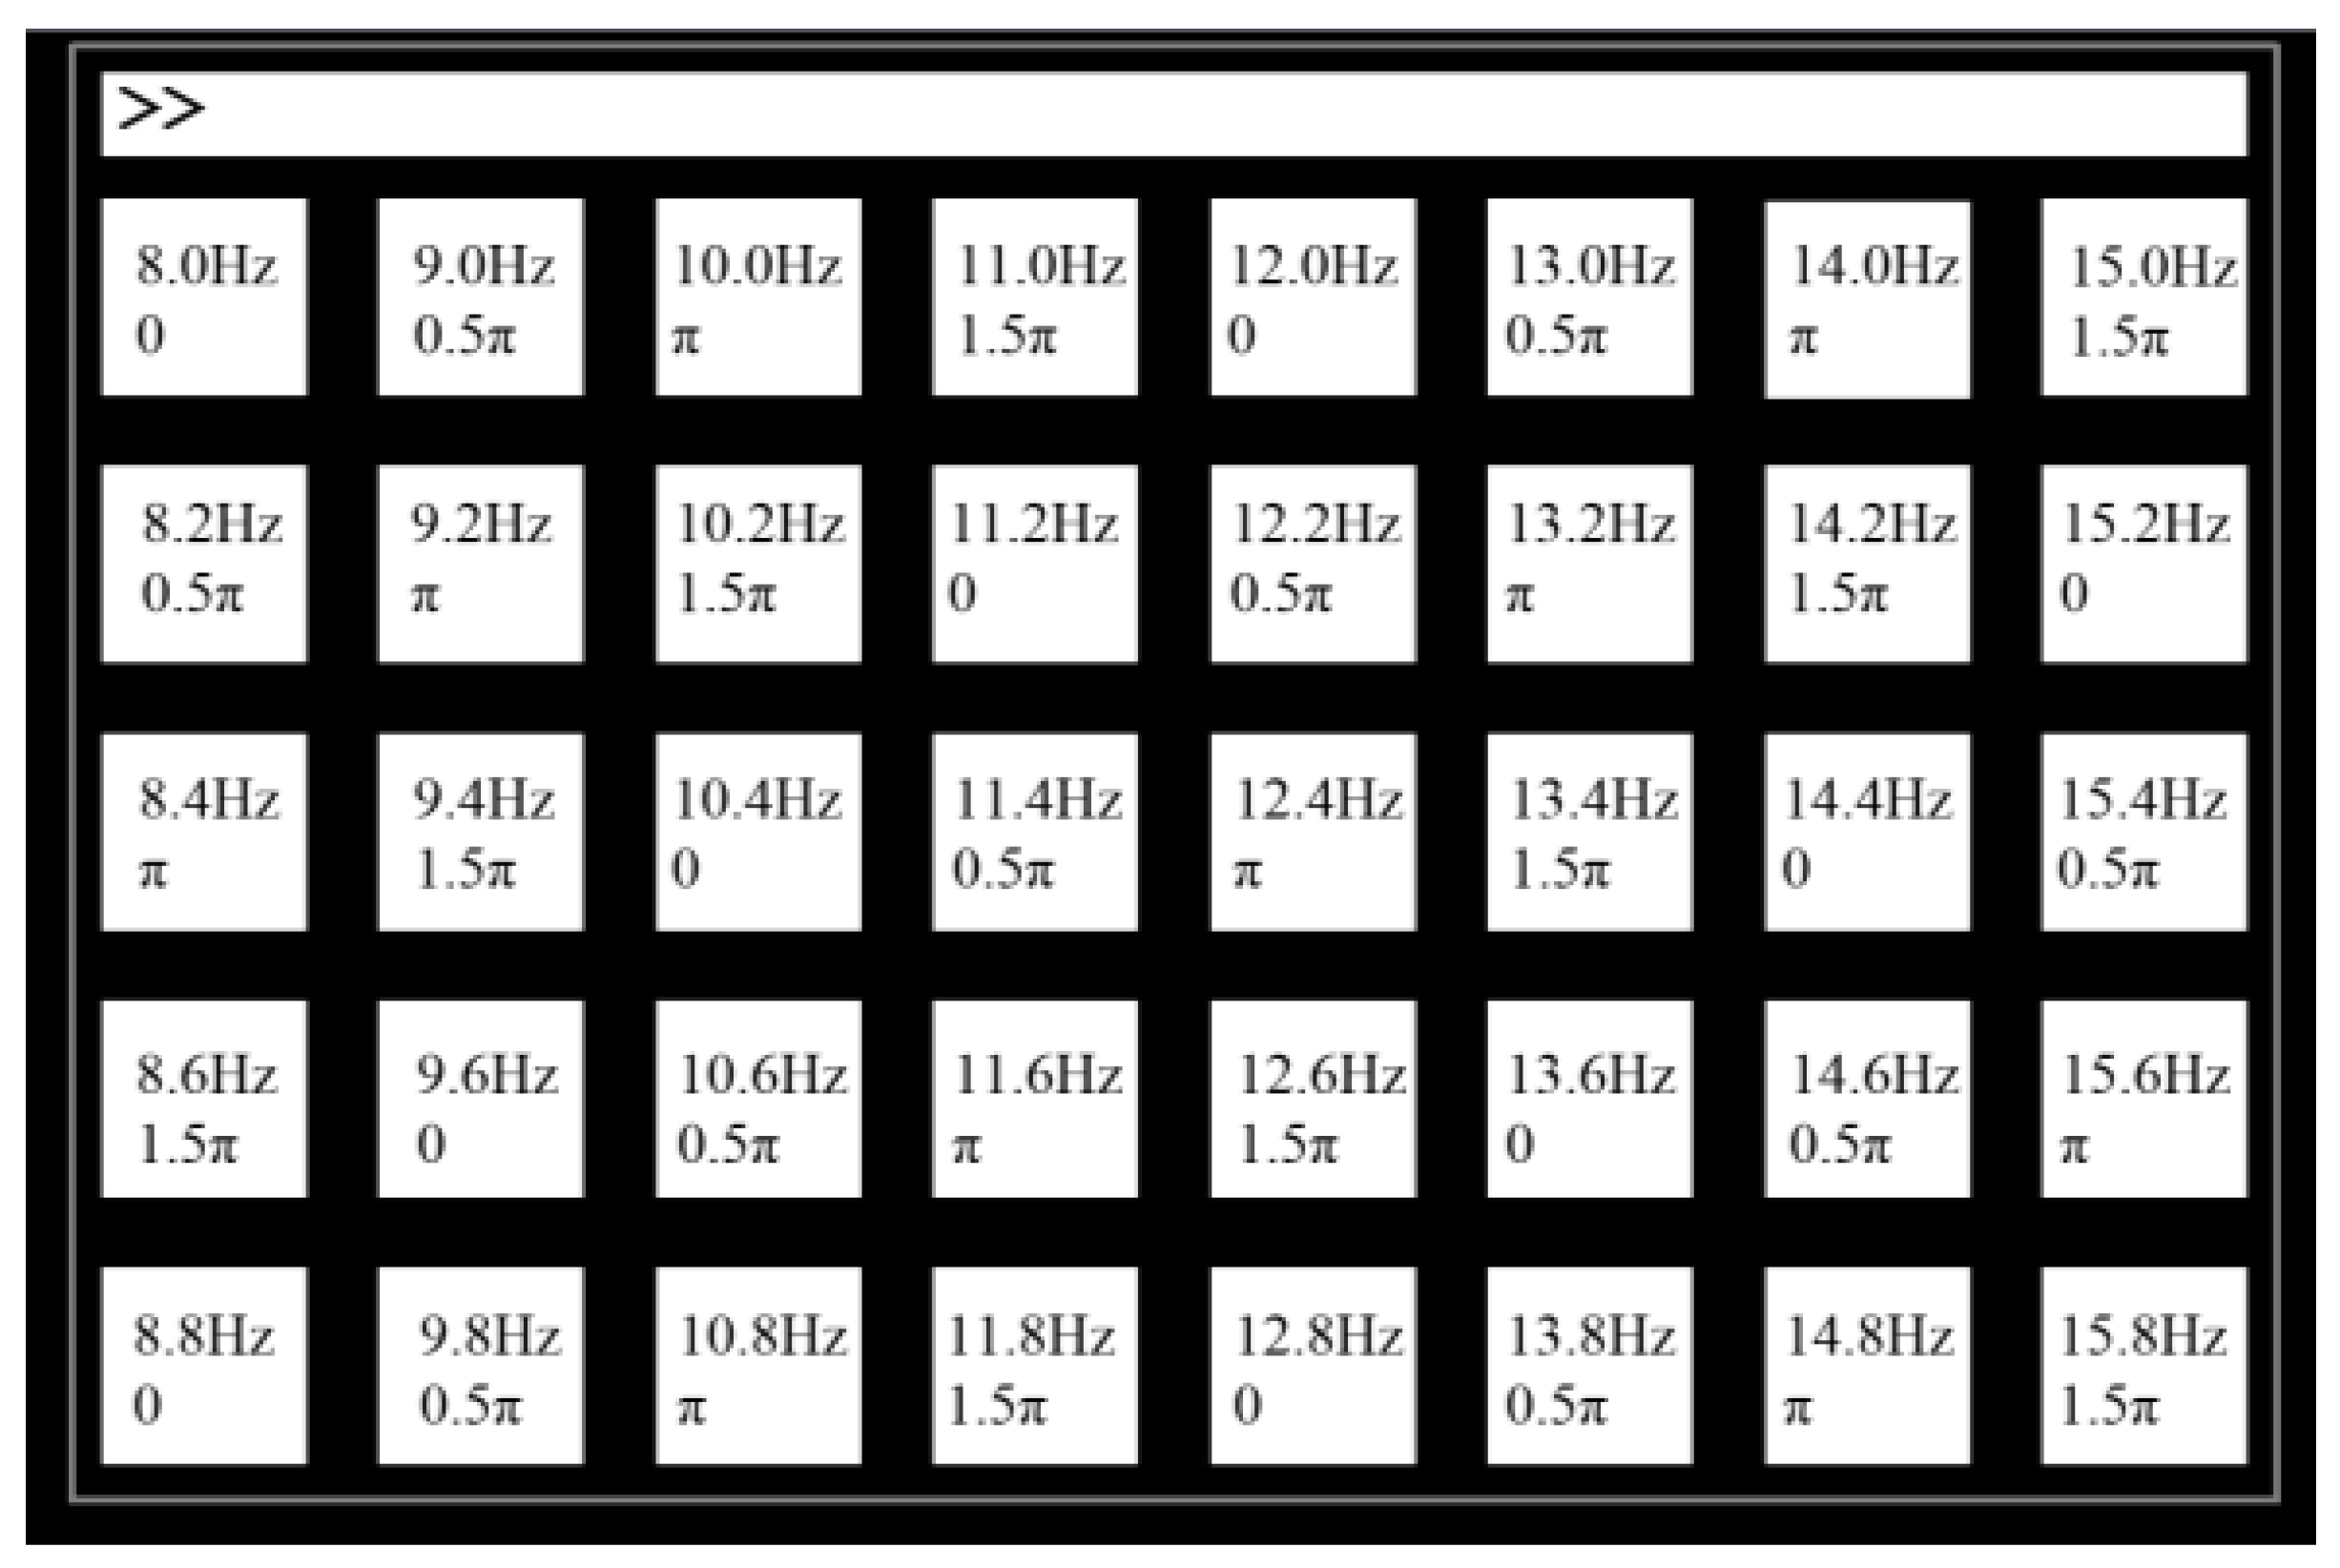
3.1. Test Method and datasets

To fully evaluate the turbo strategy, the benchmark dataset was employed to simulate different scenarios. This dataset, published by Tsinghua University, has been extensively used in the research of SSVEP-based BCIs.
The benchmark dataset is recorded in the SSVEP speller experiment with 35 subjects. Each experiment contains 6 blocks. During the block, the subject is shown a matrix ( 5 × 8 ) of 40 target characters on the screen flickering at various frequencies (range from 8 to 15.8 Hz with an interval of 0.2 Hz) with at least 0.5 π phase difference between adjacent frequencies. The stimulation is shown in Figure 3. The details of the datasets can be found in [2]. According to [24], nine electrodes (Oz, O1, O2, Pz, POz, PO3, PO4, PO5, PO6) worth of data are selected to identify the targets. Considering a latency delay in the visual pathway, the data epochs are extracted in [ 0.14 s , 0.14 + T w ], where T w stands for the data length, and time 0 is the stimulus onset.
The trails are randomly entered into the detector. Since the order of the trials can affect the result, the experiments are repeated 10 times and each time, the order was random to avoid overfitting.

3.2. Performance Evaluation
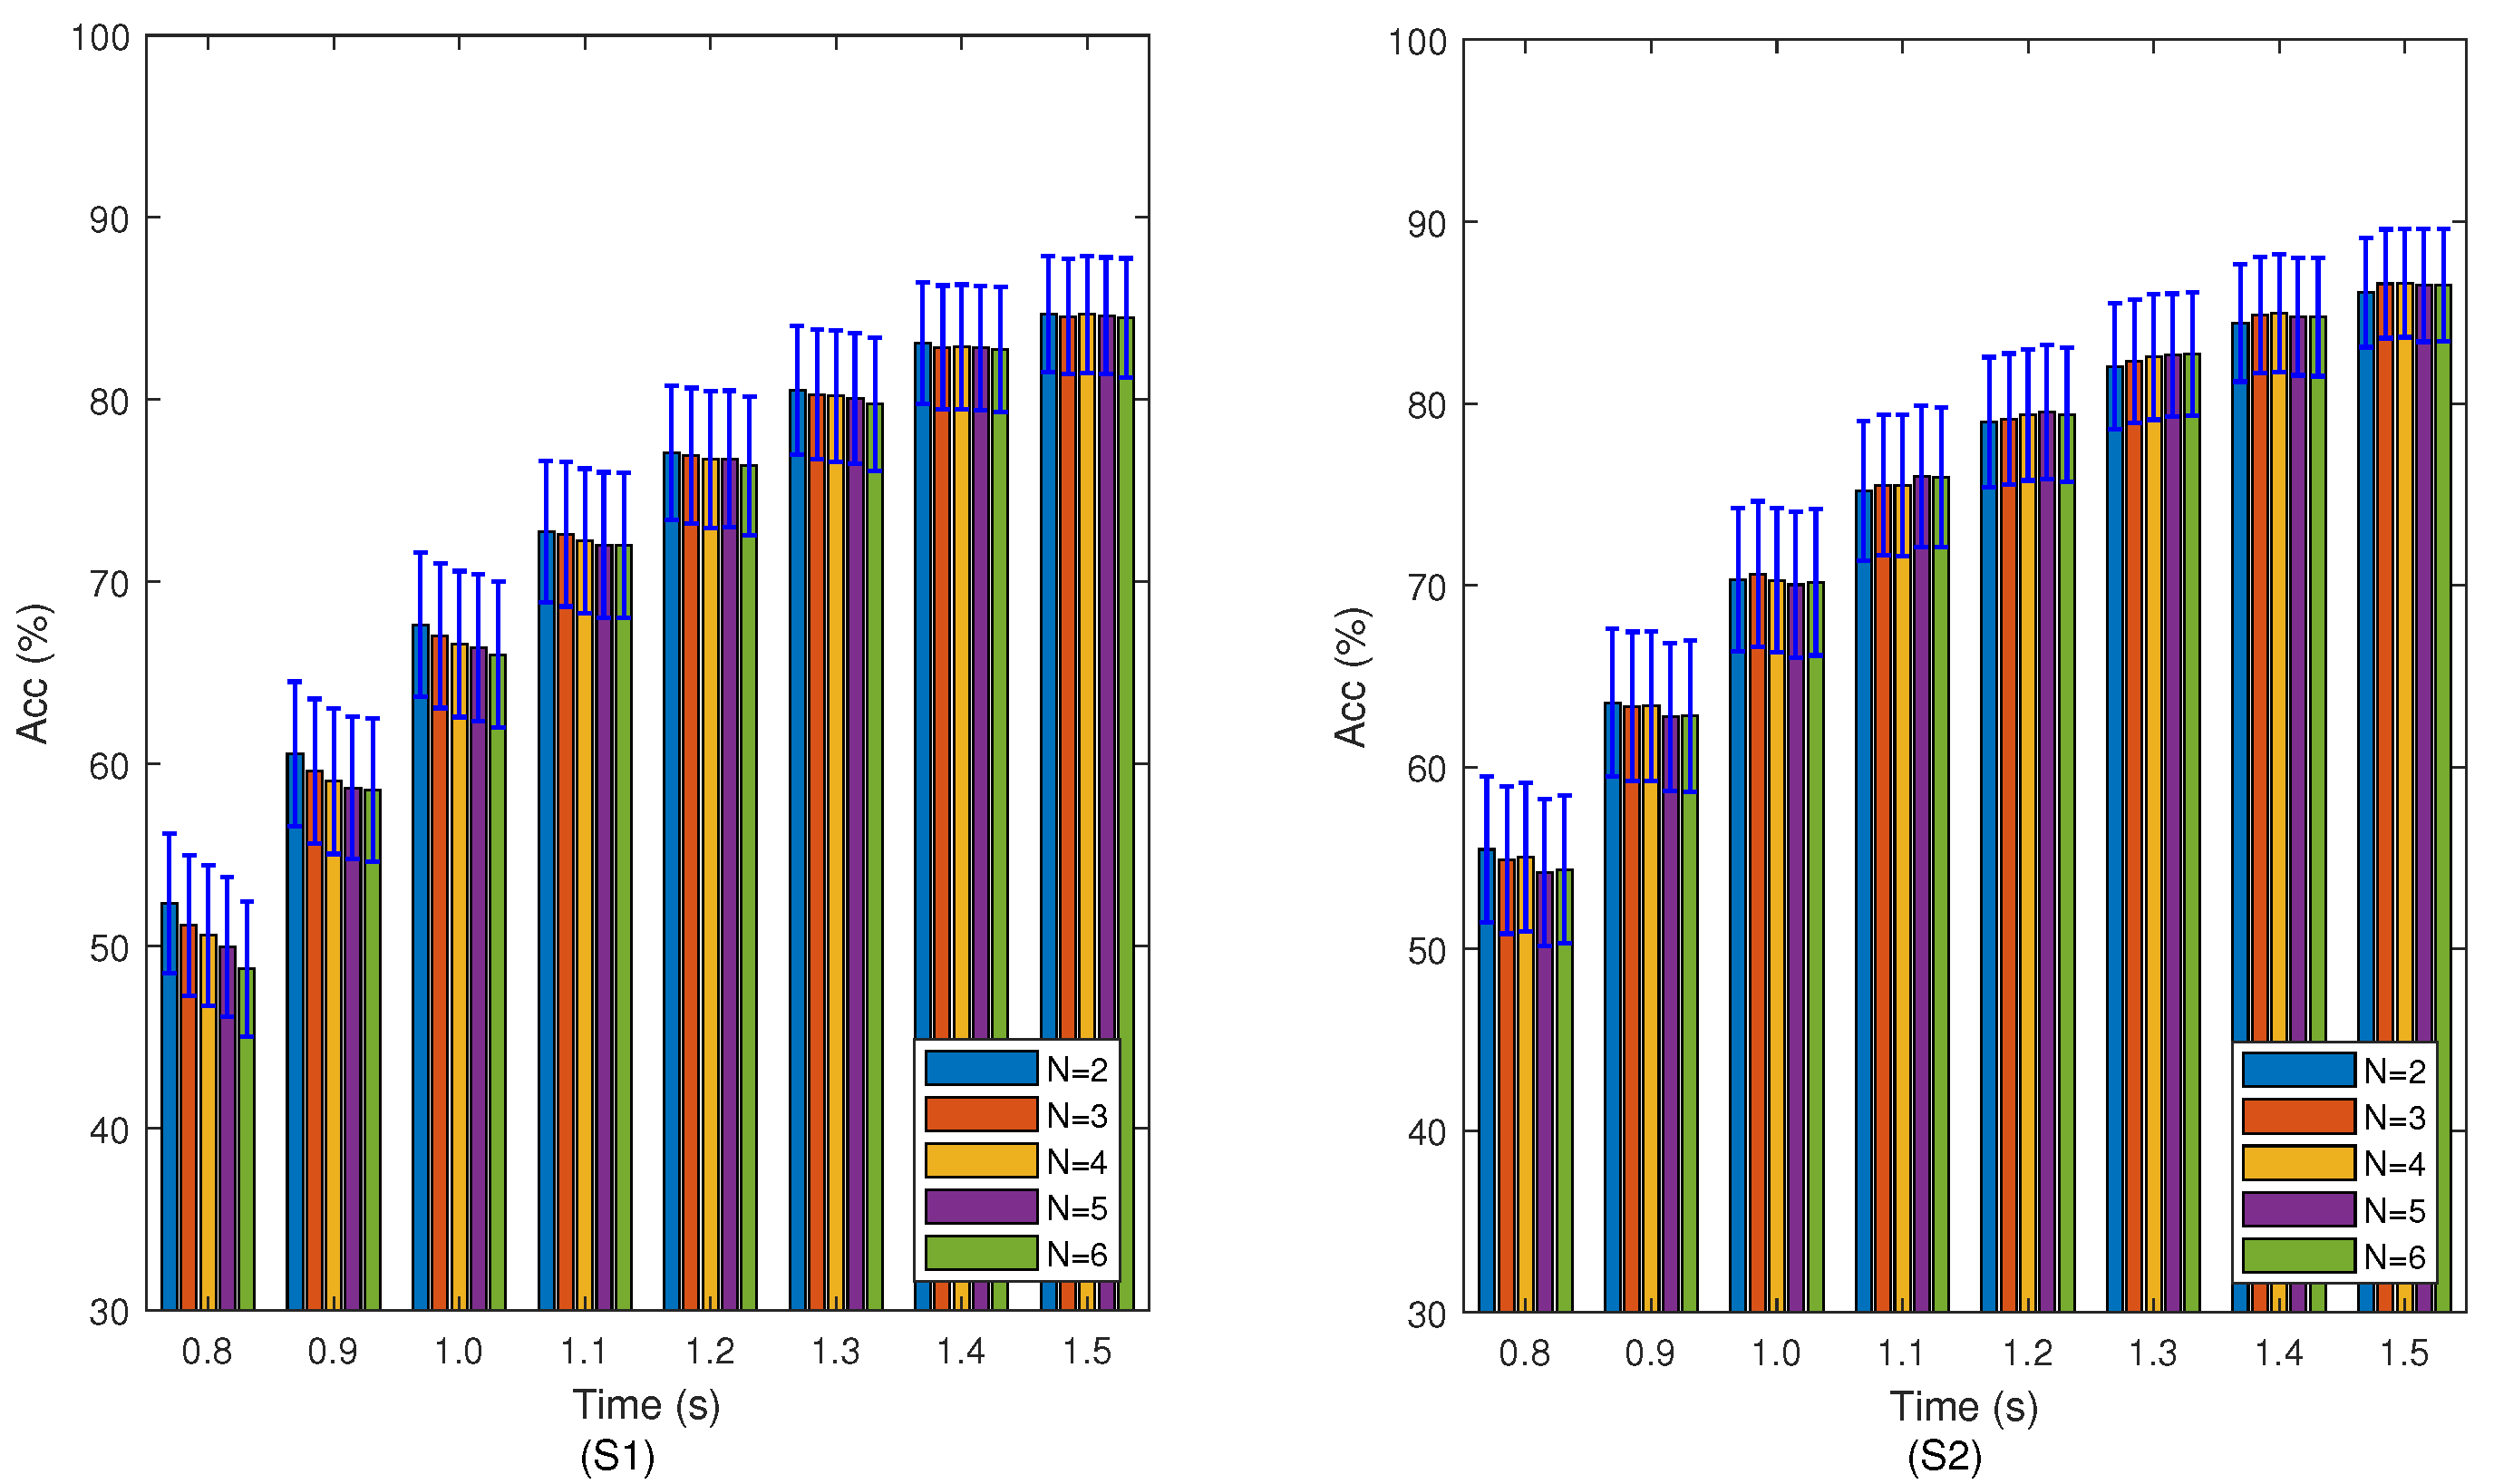
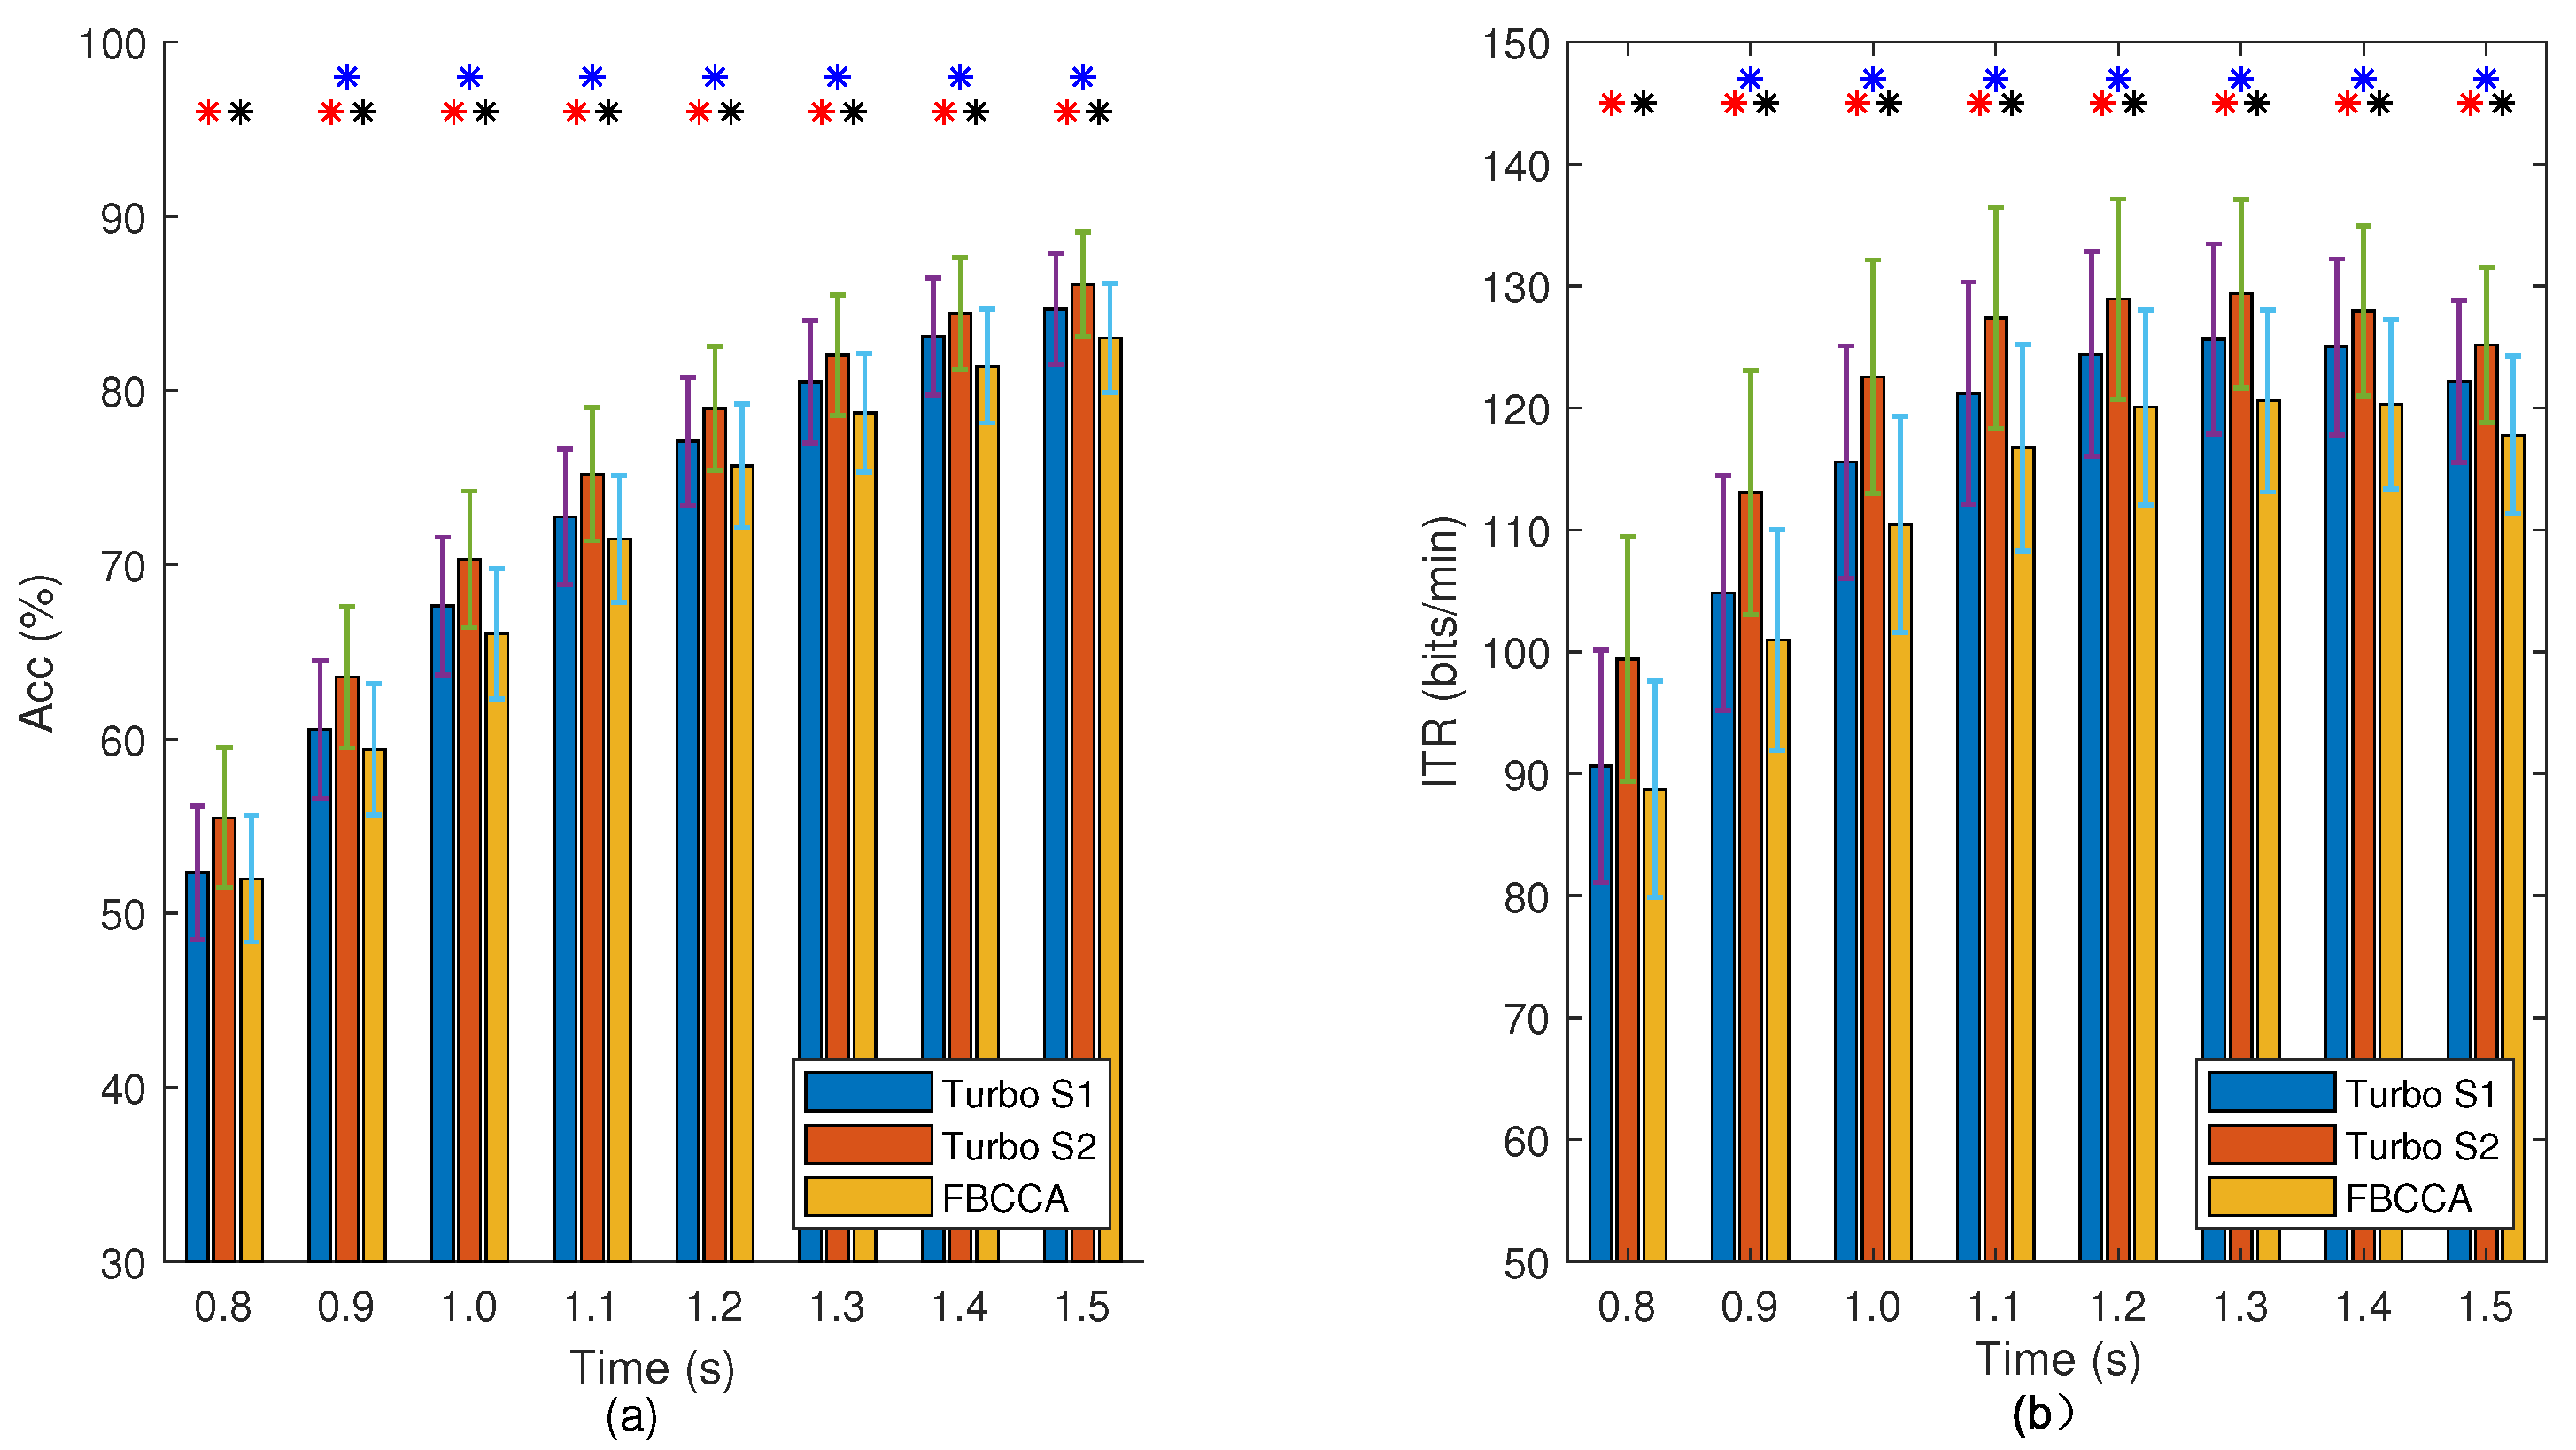
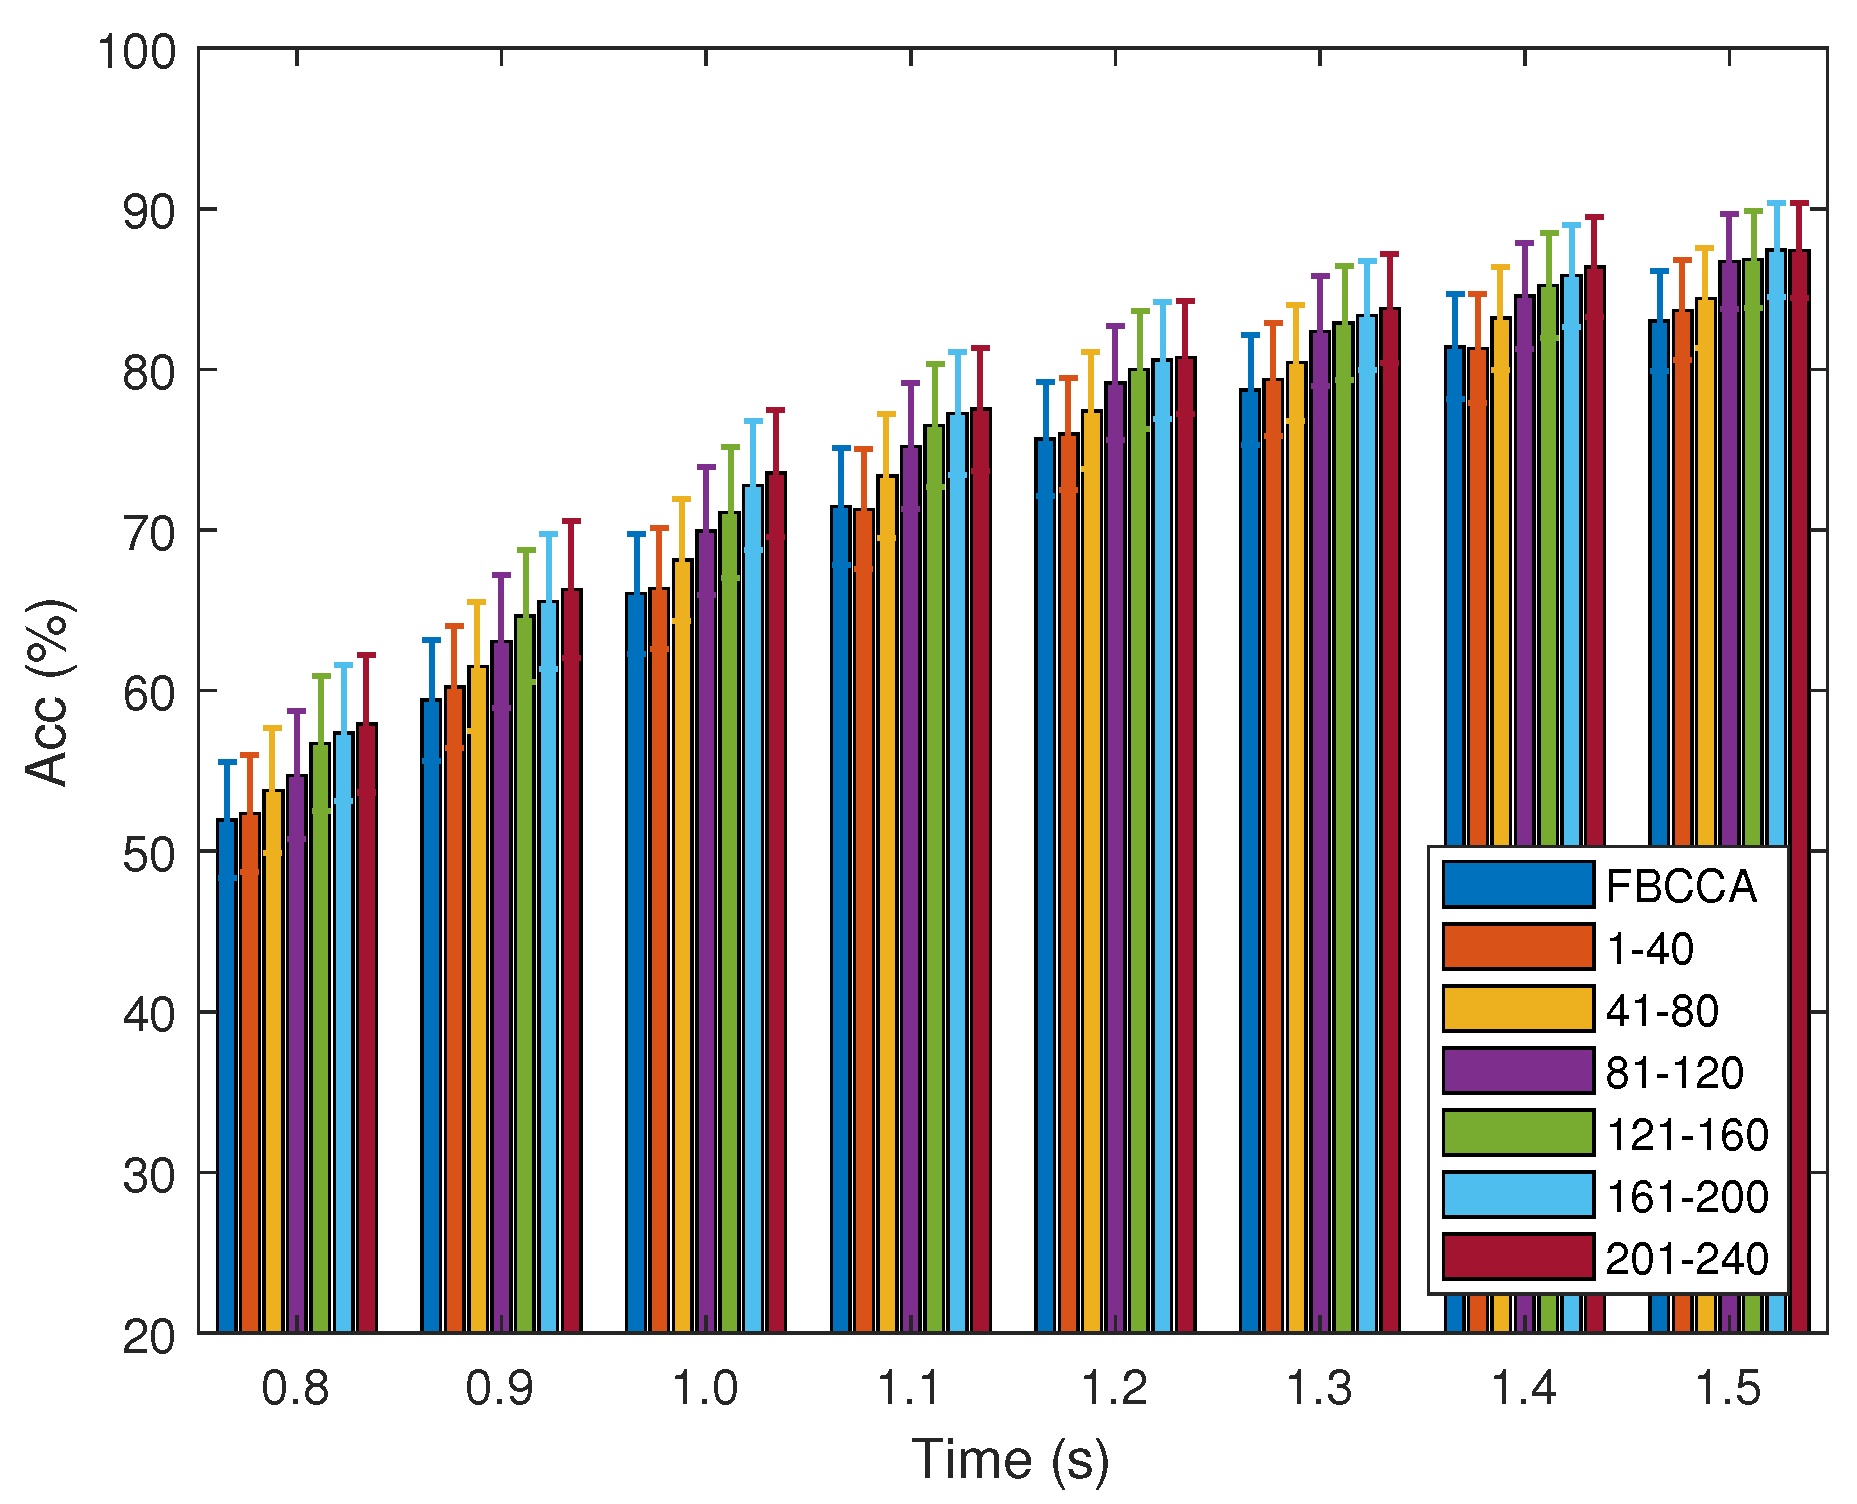
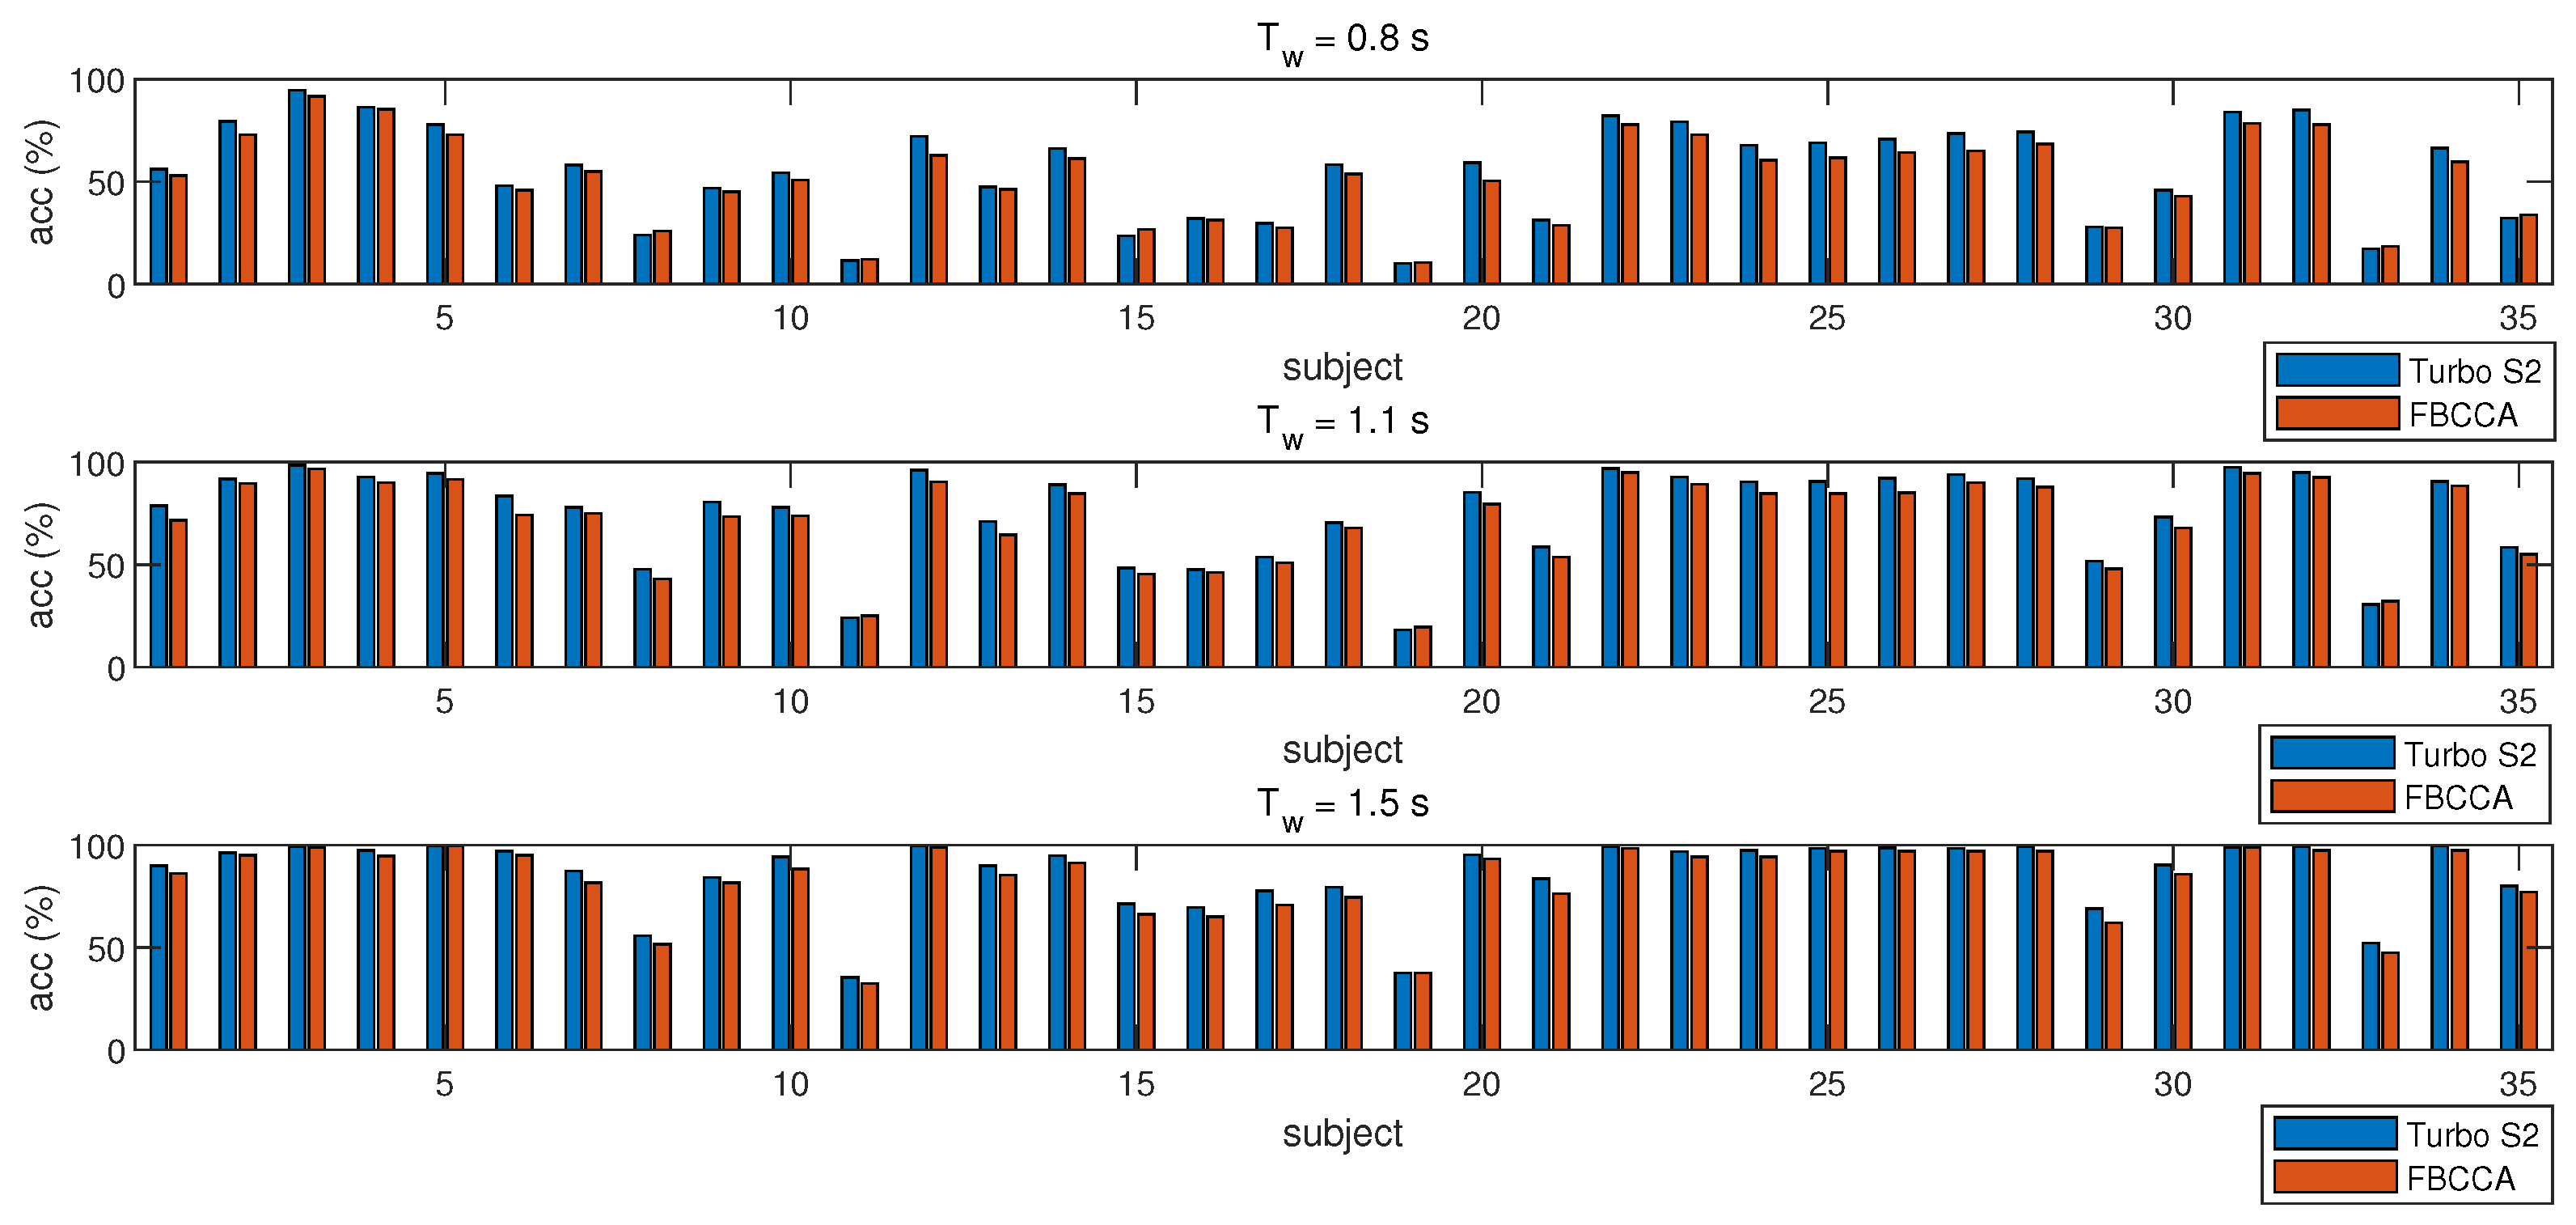
The accuracy and information transfer rate (ITR) are the most commonly used indicators of BCI performance. Specifically, accuracy refers to the proportion of correctly identified test data, which directly reflects the performance of BCIs under certain conditions. Nevertheless, it is invalid under different conditions, such as under different N t and T w . ITR is another indicator that can better reflect the performance of the BCIs’ accuracy, which is defined as the following:
I T R = ( log 2 N t + P log 2 P + ( 1 P ) log 2 ( 1 P N t 1 ) ) × 60 T
where P stands for the average classification accuracy and T is the average data length, which contains the gaze shifting time ( T = T w + T s ), while T s is the gaze shifting time. Moreover, T s is set as 0.5 s.
Based on the turbo strategy, the FBCCA detector and eCCA detector or TRCA detector can be combined into a better detector. Given that the eCCA algorithm requires only one trial for each target to complete the training of the detector, this paper employed the eCCA algorithm for the second-stage detector for the turbo detector. Furthermore, the turbo detector can be written as FBCCA + eCCA or FBCCA + eTRCA if the first stage detector is FBCCA and the second stage detector is eCCA or eTRCA.

3.3. Results

Figure 4 shows the average classification accuracy of all subjects in the benchmark dataset corresponding to different data lengths (from 0.8 to 1.5 s with an interval of 0.1 s) and different values of N (from 2 to 6). Figure 4(S1) demonstrates the certain roles of values of N on the performance when the data length is short. In addition, when the data length reaches 1 s, the value of N has a minor effect on the performance of the turbo detector; its performance gradually dips with the increase in the value of N when the data length is less than 1 s. This is because, with the increase in N, the mislabeled data in the training data also rises correspondingly, while the performance of the detector increases less, according to Equation (8). The paired t-test also reveals the significant difference between the average accuracy of the turbo detector with a different N value when the data length is less than 1.1 s. As shown in Table 1, when T w = 0.8 s, there is a significant difference ( p < 0.01 ) between the accuracy of the turbo detector with different values of N. Instead, when T w = 1.1 s, there is a significant difference ( p < 0.05 ) between the accuracy of the turbo detector with adjacent values of N; that is, only between N = 2 and N = 3 . Figure 4(S2) illustrates the performance of the detector when it has adopted the S2 data selection strategy. The results show the negligible role of the value of N on the detector performance. As shown in Table 1, the paired t-test also indicates that conclusion.
Figure 5 shows the average classification accuracy and simulated ITR for the turbo detector when it has adopted the S1 and S2 data selection strategies and FBCCA detector. The N value of the detectors (both detectors adopted the S1 strategy and detectors adopted the S2 strategy) is set to 2. Actually, the performance of FBCCA is equivalent to that of the first-stage detector of the turbo detector. The improved gain of the turbo detector comes from the second-stage detector. A comparison of the three methods indicates that the turbo detector outperforms the FBCCA detector, and the S2 strategy is more suitable for the turbo detector than the S1 strategy. The paired t-test reveals the significant differences between the three methods. The accuracy (and ITR) of the turbo detector equipped with the S2 strategy is significantly higher than that of FBCCA and the turbo detector with the S1 strategy. While the accuracy (and ITR) of the turbo detector with the S1 strategy is significantly higher than that of FBCCA (except T w = 0.8 s). The highest ITR of the turbo detector having adopted S1 the turbo detector having adopted S2 and FBCCA are 125.5, 130.0 and 120.6 bits/mins, respectively. The size of the training data pool increases over use. In order to analyze the impact of the training data size on the performance of the turbo detector, the accuracy of 1st–40th trial, 41st–80th trial, 81st–12th trial, 121st–160th trial, 161st–200th trial and 201st–240th trial for each experiment is calculated, respectively. Figure 6 displays the direct proportion between accuracy and data pool size. The paired t-tests also indicate that the larger size of the data pool leads to better performance. Table 2 demonstrates the improvement of accuracy compared with FBCCA.

4. Discussion

The results demonstrate the much better performance of the proposed turbo detector. Inspired by the turbo engine, this paper integrates FBCCA and eCCA to create a new type of SSVEP signal detector with better performance and without the tedious training process, which does not necessarily cover the flaws as follows.

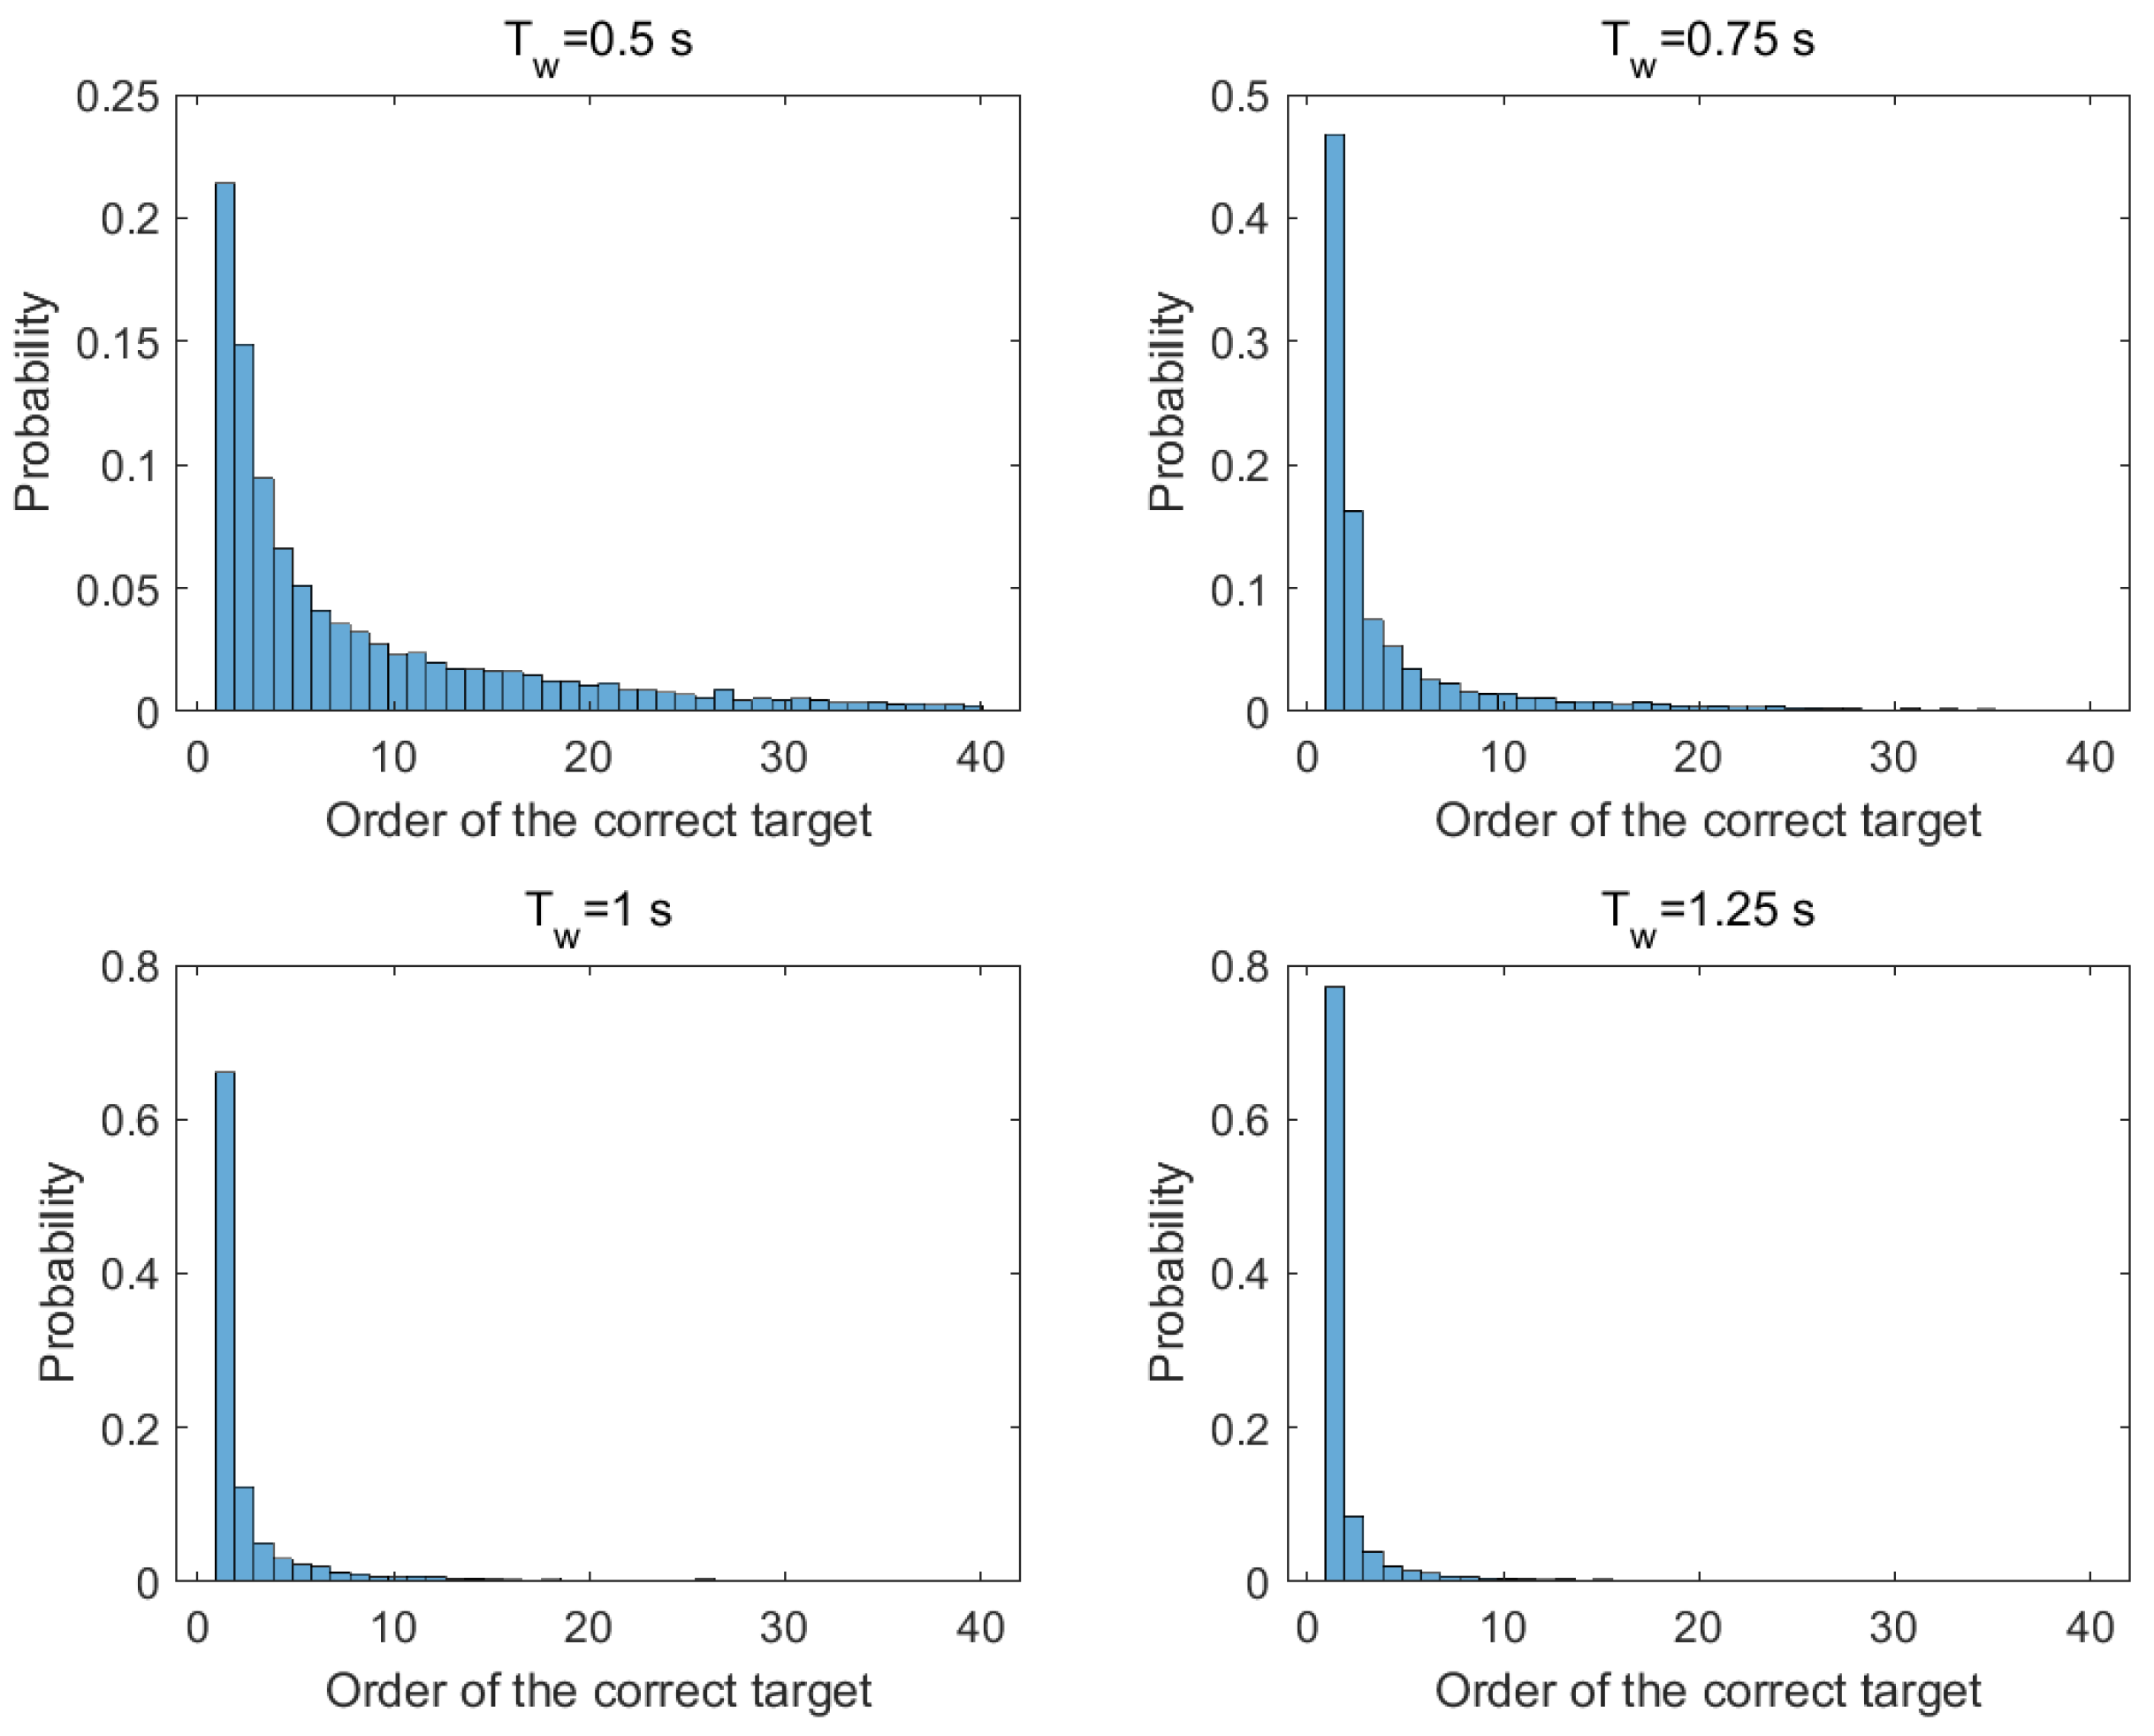
4.1. The Probability of the Second-Stage Detector

The turbo detector contains two SSVEP detectors, the first-stage unsupervised detector and the second-stage supervision detector. If the training data pool contains no top two-order targets needed to train the second-stage detector, the final output identification is completed by the first-stage detector. Equations (8)–(11) are derived based on the assumption that all the candidates have equal probability, which means all targets have the same prior probability. Moreover, the experimental results in Section 4 are somewhat different from the theoretical value because of the limited scale of datasets, which, fortunately, exerts no effect on the calculation. In reality, the prior probability of each target is not equal, and some targets seldom appear, which makes it difficult for the data pool to complete the training datasets, thus undermining the performance of the turbo detector.
In view of the scramble coding or source coding technology in the communication field, the BCIs can achieve the equal prior probability of each target by scrambling the mapping between the stimulus frequencies and the symbols.

4.2. Error Propagation

Given that the training data in the second-stage detector are labeled by previous identification, the error-labeled training data in the data pool will definitely influence the subsequent target identification. Figure 7 shows the classification accuracy of all subjects with a data length of 0.8, 1.1 and 1.5 s, which demonstrates the higher average accuracy of subjects whose performance was improved compared with those that deteriorated. Table 3 also proves the much higher average accuracy of improved subjects than that of the deteriorated subjects. Such a phenomenon can be explained by the influence of data wrongly labeled by the detector among the training data pool on the performance of the turbo detector. Despite the above, the turbo detector still outperforms the FBCCA detector. Figure 7 and Table 2 reveal the extremely low accuracy of the deteriorated subjects detected by FBCCA. Instead, the identification accuracy of the turbo detector for the deteriorated subjects only dips a bit (e.g., T w = 0.8 s, the accuracy loss is 1.4%). Furthermore, as the data length increases, the accuracy of the training data labels decreases the impact of wrong labels (e.g., T w = 1.5 s, no subject’s accuracy decreases).
In practice, the participation of subjects helps to delete the error labeled easily. If the next input symbol stands for deletion, the previous input training data will be deleted from the training data pool. To sum up, despite the influence of error propagation on the performance, the turbo detector is superior to the FBCCA detector.

4.3. Computational Complexity

The flow chart of the turbo detection algorithm divides the computational load into two parts. The computational load generated by the first-level FBCCA algorithm and the computational load generated by the second-level eCCA algorithm. According to Equation (3), the computational complexity of the eCCA algorithm is about three times that of the FBCCA algorithm. In the secondary detector, the detector only identifies the received symbols from N candidate targets, unlike the conventional eCCA detector, which recognizes the received signal symbols from N / N f selected targets. In this paper, 40 target SSVEP characters are used to input the data collected by the system ( N f = 40 ), and the N of the turbo algorithm is set to be 2. Therefore, the calculation amount of the algorithm is about 1 + 3 × N ÷ N f 1.2 times that of the FBCCA algorithm. For the single-trial processing by turbo detector (S2 data selection strategy, N = 2 ), the computation time is less than 50 ms using MATLAB R2018b on Microsoft Windows 10 (with an AMD Ryzen 7 4700 U 2.0 G processor). Target recognition in such a short time satisfies the real-time requirements for SSVEP-based BCI.

5. Conclusions

A novel turbo detector was proposed to improve the performance of SSVEP-based BCIs in this study. The detector reuses the received data to train the second-stage detector, thereby avoiding tedious training processing and enhancing performance. Experimental results demonstrated that the proposed method outperformed FBCCA in terms of ITR and classification accuracy under the benchmark dataset. Besides that, the performance of the turbo detector increases with the data pool, meaning that the performance increases with the time of use. Since the turbo detector reuses the received data rather than spending extra time to collect validation data, it enables SSVEP-based BCIs for plug-and-play. This method is, therefore, an appropriate and efficient candidate for detection algorithms for SSVEP-based BCIs systems. As the BCI design based on SSVEP can be used for a variety of applications, this study will promote more real BCI applications in communication and control. In the future, the dynamic window strategy can be adopted to further improve ITR and provide more efficient and convenient communication means for ALS patients.

Author Contributions

Conceptualization, C.T.; Methodology, J.C.; Formal analysis, C.T. and J.C.; Funding acquisition, H.W.; Investigation, H.W.; Project administration, H.W.; Resources, C.T. and J.C.; Software, C.T. and J.C.; Visualization, C.T.; Writing original draft, C.T.; Writing review and editing, C.T. and J.C. All authors have read and agreed to the published version of the manuscript.

Funding

This work has been supported by the National Natural Science Foundation of China (No.61802425, 62171466 and 62001515).

Acknowledgments

The authors would like to thank Professor Xiaorong Gao for the experimental data. This work was supported by the National Natural Science Foundation of China (No.61802425, 62171466 and 62001515).

Conflicts of Interest

The authors declare no conflict of interest.

References

  1. Wang, Y.; Gao, X.; Hong, B.; Jia, C.; Gao, S. Brain-Computer Interfaces Based on Visual Evoked Potentials. IEEE Eng. Med. Biol. Mag. 2008, 27, 64–71. [Google Scholar] [CrossRef] [PubMed]
  2. Wang, Y.; Chen, X.; Gao, X.; Gao, S. A Benchmark Dataset for SSVEP-Based Brain-Computer Interfaces. IEEE Trans. Neural Syst. Rehabil. Eng. 2017, 25, 1746–1752. [Google Scholar] [CrossRef] [PubMed]
  3. Liu, B.; Huang, X.; Wang, Y.; Chen, X.; Gao, X. BETA: A Large Benchmark Database Toward SSVEP-BCI Application. Front. Neurosci. 2019, 14, 627. [Google Scholar] [CrossRef] [PubMed]
  4. Chen, X.; Wang, Y.; Nakanishi, M.; Gao, X.; Jung, T.P.; Gao, S. High-speed spelling with a noninvasive brain-computer interface. Proc. Natl. Acad. Sci. USA 2015, 112, E6058. [Google Scholar] [CrossRef] [PubMed] [Green Version]
  5. Wei, Q.; Liu, Y.; Gao, X.; Wang, Y.; Yang, C.; Lu, Z.; Gong, H. A Novel c-VEP BCI Paradigm for Increasing the Number of Stimulus Targets Based on Grouping Modulation With Different Codes. IEEE Trans. Neural Syst. Rehabil. Eng. 2018, 26, 1178–1187. [Google Scholar] [CrossRef] [PubMed]
  6. Chen, X.; Wang, Y.; Nakanishi, M.; Jung, T.; Gao, X. Hybrid frequency and phase coding for a high-speed SSVEP-based BCI speller. In Proceedings of the 2014 36th Annual International Conference of the IEEE Engineering in Medicine and Biology Society, Chicago, IL, USA, 26–30 August 2014; pp. 3993–3996. [Google Scholar] [CrossRef]
  7. Kimura, Y.; Tanaka, T.; Higashi, H.; Morikawa, N. SSVEP-Based Brain–Computer Interfaces Using FSK-Modulated Visual Stimuli. IEEE Trans. Biomed. Eng. 2013, 60, 2831–2838. [Google Scholar] [CrossRef]
  8. Wang, Y.; Wang, Y.; Jung, T. Visual stimulus design for high-rate SSVEP BCI. Electron. Lett. 2010, 46, 1057–1058. [Google Scholar] [CrossRef]
  9. Hwang, H.; Han, C.; Lim, J.; Kim, Y.; Choi, S.; An, K.; Lee, J.; Cha, H.; Kim, S.H.; Im, C. Clinical feasibility of brain-computer interface based on steady-state visual evoked potential in patients with locked-in syndrome: Case studies: Clinical feasibility of SSVEP-based BCI. Psychophysiology 2016, 54, 444. [Google Scholar] [CrossRef]
  10. Lim, J.H.; Kim, Y.W.; Lee, J.H.; An, K.O.; Hwang, H.J.; Cha, H.S.; Han, C.H.; Chang-Hwan, I. An emergency call system for patients in locked-in state using an SSVEP-based brain switch. Psychophysiology 2017, 54, 1632. [Google Scholar] [CrossRef]
  11. Zerafa, R.; Camilleri, T.; Falzon, O.; Camilleri, K.P. To train or not to train? A survey on training of feature extraction methods for SSVEP-based BCIs. J. Neural Eng. 2018, 15, 051001. [Google Scholar] [CrossRef]
  12. Lin, Z.; Zhang, C.; Wu, W.; Gao, X. Frequency Recognition Based on Canonical Correlation Analysis for SSVEP-Based BCIs. IEEE Trans. Biomed. Eng. 2006, 53, 2610–2614. [Google Scholar] [CrossRef] [PubMed]
  13. Bin, G.; Gao, X.; Yan, Z.; Hong, B.; Gao, S. An online multi-channel SSVEP-based brain-computer interface using a canonical correlation analysis method. J. Neural Eng. 2009, 6, 046002. [Google Scholar] [CrossRef] [PubMed]
  14. Chen, Y.; Yang, C.; Chen, X.; Wang, Y.; Gao, X. A novel training-free recognition method for SSVEP-based BCIs using dynamic window strategy. J. Neural Eng. 2021, 18, 036007. [Google Scholar] [CrossRef] [PubMed]
  15. Friman, O.; Volosyak, I.; Graser, A. Multiple Channel Detection of Steady-State Visual Evoked Potentials for Brain-Computer Interfaces. IEEE Trans. Biomed. Eng. 2007, 54, 742–750. [Google Scholar] [CrossRef]
  16. Yang, C.; Han, X.; Wang, Y.; Saab, R.; Gao, X. A Dynamic Window Recognition Algorithm for SSVEP-Based Brain-Computer Interfaces Using a Spatio-Temporal Equalizer. Int. J. Neural Syst. 2018, 28, 1850. [Google Scholar] [CrossRef] [PubMed]
  17. Zhang, Y.; Xu, P.; Cheng, K.; Yao, D. Multivariate Synchronization Index for Frequency Recognition of SSVEP-based Brain-computer Interface. J. Neurosci. Methods 2013, 221, 32–40. [Google Scholar] [CrossRef] [PubMed]
  18. Bin, G.; Gao, X.; Wang, Y.; Li, Y.; Hong, B.; Gao, S. A high-speed BCI based on code modulation VEP. J. Neural Eng. 2011, 8, 025015. [Google Scholar] [CrossRef] [Green Version]
  19. Nakanishi, M.; Wang, Y.; Wang, Y.T.; Mitsukura, Y.; Jung, T.P. A high-speed brain speller using steady-state visual evoked potentials. Int. J. Neural Syst. 2014, 24, 1450019. [Google Scholar] [CrossRef]
  20. Zhang, Y.; Zhou, G.; Zhao, Q.; Onishi, A.; Jin, J.; Wang, X.; Cichocki, A. Multiway Canonical Correlation Analysis for Frequency Components Recognition in SSVEP-Based BCIs. Lect Notes Comput. Sci. 2011, 7062, 287–295. [Google Scholar] [CrossRef]
  21. Zhang, Y.; Zhou, G.; Jin, J.; Wang, M.; Wang, X.; Cichocki, A. L1-Regularized Multiway Canonical Correlation Analysis for SSVEP-Based BCI. IEEE Trans. Neural Syst. Rehabil. Eng. 2013, 21, 887–896. [Google Scholar] [CrossRef] [PubMed]
  22. Nakanishi, M.; Wang, Y.; Nakanishi, M.; Wang, Y.T.; Jung, T.P. Enhancing detection of steady-state visual evoked potentials using individual training data. In Proceedings of the 36th Annual International Conference of the IEEE Engineering in Medicine and Biology Society, Chicago, IL, USA, 26–30 August 2014; pp. 3037–3040. [Google Scholar]
  23. Chi, M.W.; Wan, F.; Wang, B.; Wang, Z.; Nan, W.; Lao, K.F.; Peng, U.M.; Vai, M.I.; Rosa, A. Learning across multi-stimulus enhances target recognition methods in SSVEP-based BCIs. J. Neural Eng. 2020, 17, 016026. [Google Scholar]
  24. Chen, X.; Wang, Y.; Gao, S.; Jung, T.P.; Gao, X. Filter bank canonical correlation analysis for implementing a high-speed SSVEP-based brain-computer interface. J. Neural Eng. 2015, 12, 046008. [Google Scholar] [CrossRef] [PubMed]
  25. Proakis, J.G.; Salehi, M. Digital Communications, 5th ed.; McGraw-Hill: New York, NY, USA, 2008. [Google Scholar]
  26. Li, H. Statistical Learning Method; Tsinghua University Press: Beijing, China, 2012; pp. 137–153. [Google Scholar]
  27. Kobza, J.E.; Jacobson, S.H.; Vaughan, D.E. A Survey of the Coupon Collector’s Problem with Random Sample Sizes. Methodol. Comput. Appl. Probab. 2007, 9, 573–584. [Google Scholar] [CrossRef]
Figure 1. The statistical probability of the correct label position in the sort under different data lengths.
Electronics 11 04231 g001
Figure 2. The flowchart of the turbo strategy for SSVEP-based BCIs.
Electronics 11 04231 g002
Figure 3. The computer screen for the stimulus presentation in the experiments of the benchmark datasets.
Electronics 11 04231 g003
Figure 4. The accuracy of the turbo detector when it has adopted the S1 and S2 training data selection strategies with 0.8–1.5 s data length. The error bars represent the standard error.
Electronics 11 04231 g004
Figure 5. The average results of 35 subjects in the benchmark datasets. (a) Average classification accuracy of FBCCA and turbo detector with different data lengths. (b) Average ITR of FBCCA and turbo detector with different data lengths. The error bars represent the standard error. * indicates significant difference between two methods by paired t-test (* p < 0.05 ).
Electronics 11 04231 g005
Figure 6. The accuracy of the turbo detector having adopted the S2 data selection strategy with 0.8 and 1.5 s data length. The error bars represent the standard error.
Electronics 11 04231 g006
Figure 7. The accuracy of the turbo detector and FBCCA across all the subjects with 0.8 and 1.5 s data lengths.
Electronics 11 04231 g007
Table 1. Paired t-test of turbo detector with different values of N.
S1 S2
T w ( s )
( N 1 N 2 )
0.81.11.50.81.11.5
2–3><
3–4>
4–5
5–6
1 ≫ (or ≪): N1 is significantly higher (or lower) than N2 (p < 0.01). 2 > (or >): N1 is significantly higher (or lower) than N2 (p < 0.05). 3 ≈: N1 and N2 have no significant difference (p > 0.05).
Table 2. Accuracy improvement for FBCCA by percentage and paired t-test.
1–40121–160201–240
T w ( s ) Improvementp-ValueImprovementp-ValueImprovementp-Value
0.80.44.86.0
1.1−0.25.06.1
1.50.7>3.84.4
1 ≫: Acc of turbo is significantly higher than that of FBCCA (p < 0.01). 2 >: Acc of turbo is significantly higher than that of FBCCA (p < 0.05). 3 ≈: Acc of turbo and FBCCA have no significant difference (p > 0.05).
Table 3. Average accuracy of improved subjects and decreased subjects.
T w ( s ) Improved (sub)AVG ACC (%)Decreased (sub)AVG ACC
0.82962.9619.8
1.13280.0324.3
1.53586.1
Publisher’s Note: MDPI stays neutral with regard to jurisdictional claims in published maps and institutional affiliations.

