
A Novel Geo-Social-Aware Video Edge Delivery Strategy Based on Modeling of Social-Geographical Dynamic in an Urban Area

Abstract
:1. Introduction
2. Related Work
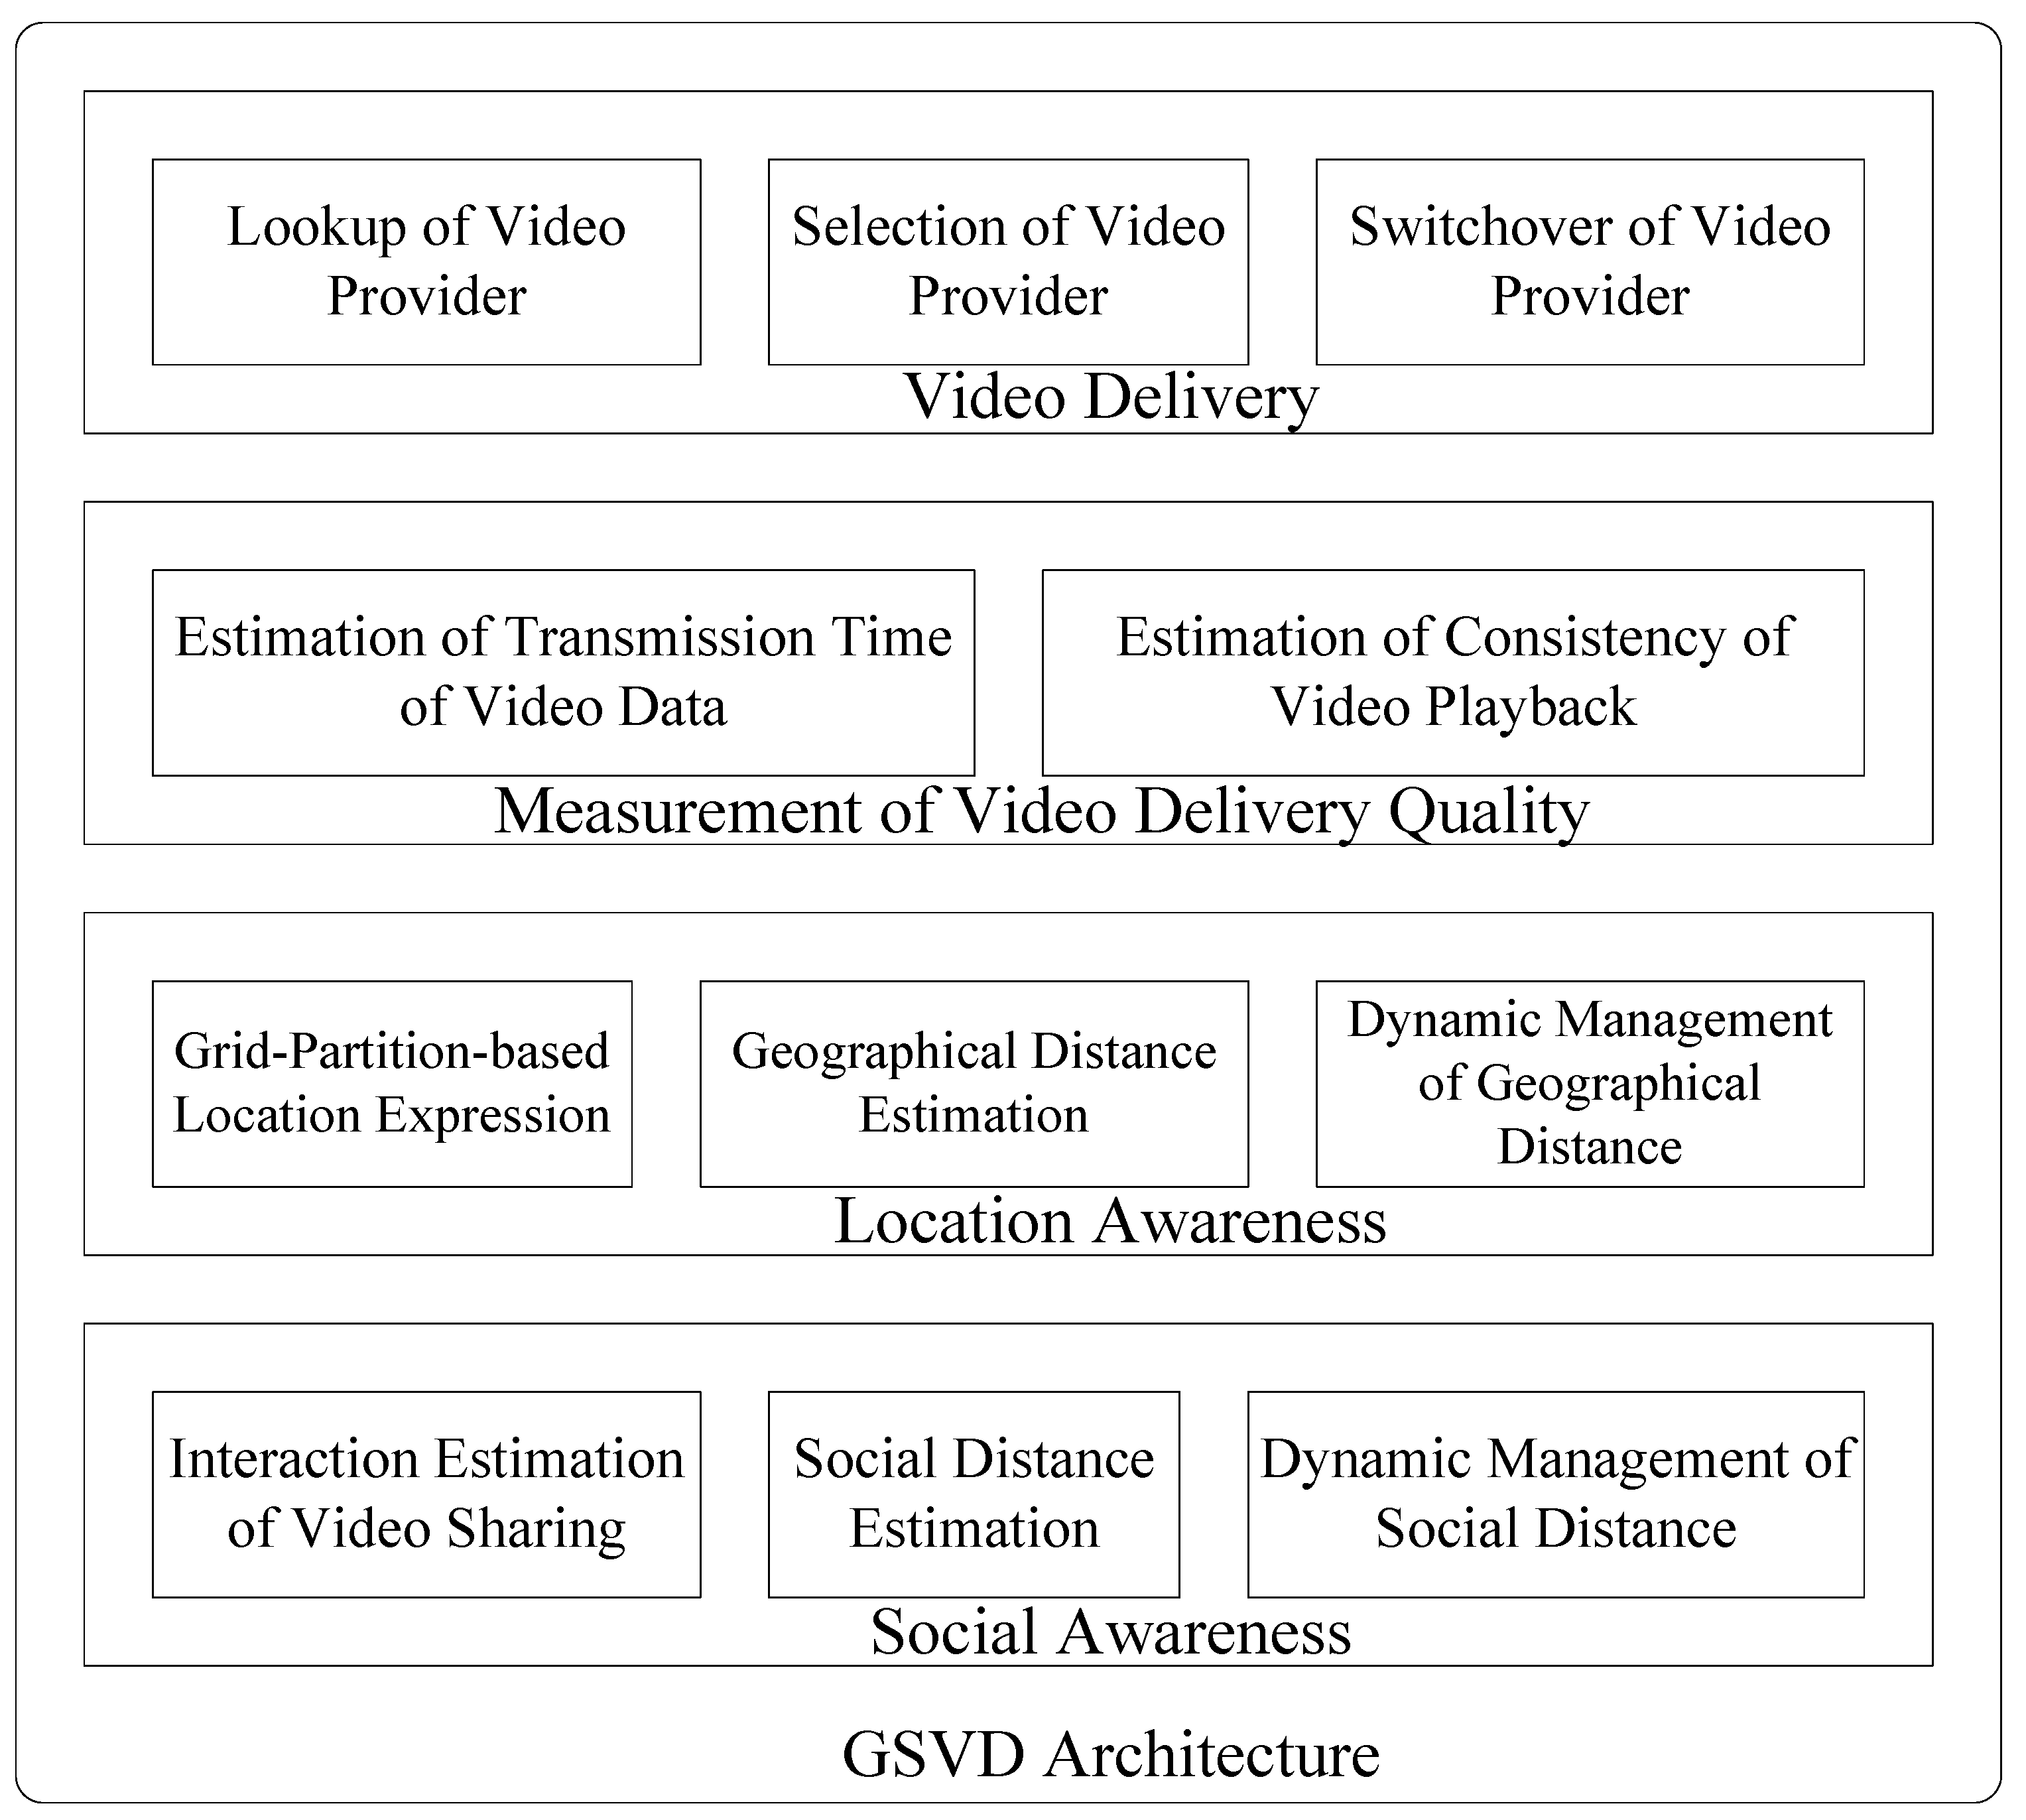
3. GSVD Overview
4. GSVD Detailed Design
4.1. Measurement of the Social Relationship
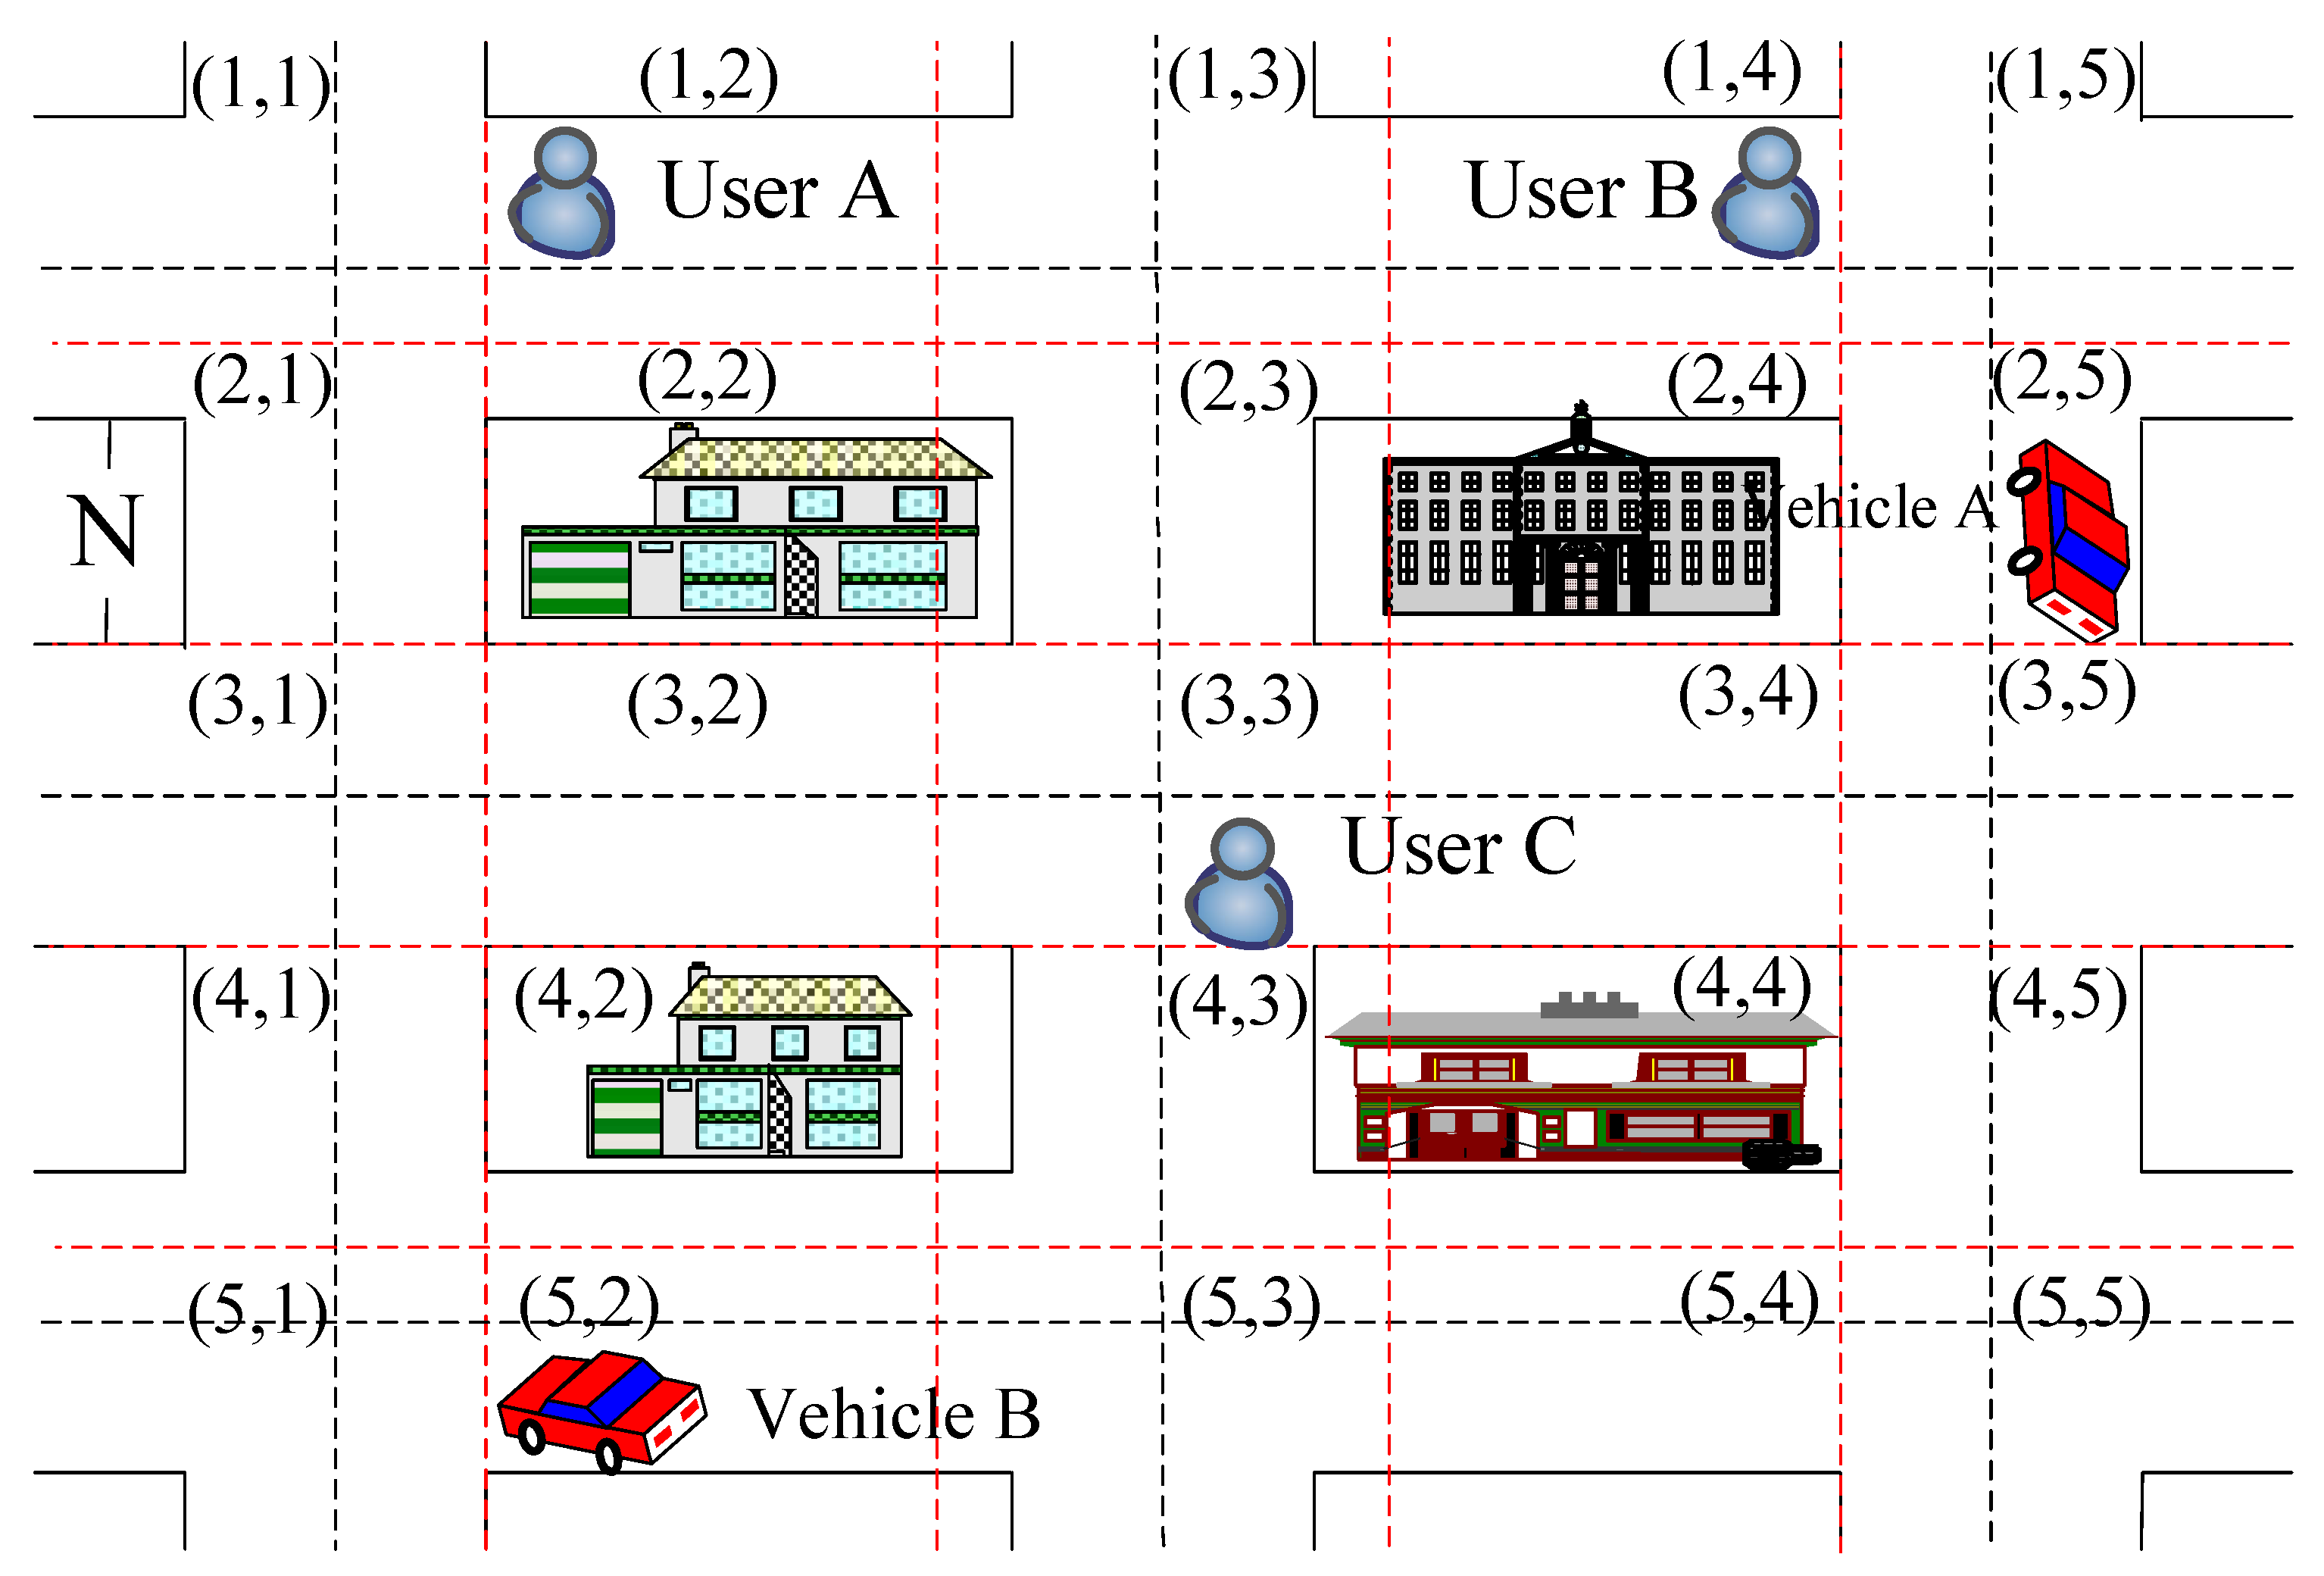
4.2. Measurement of the Geographical Location
4.3. Measurement of Video Delivery Quality
4.4. Video Delivery Strategy
| Algorithm 1 Video Provider Selection |
| 1: is maximum value of startup delay of ; |
| 2: is set of candidate providers; |
| 3: t is timer and ; |
| 4: for (j = 0; j < ; j++) |
| 5: for (h = 0; h < ; h++) |
| 6: if is |
| 7: is added into ; |
| 8: end if |
| 9: end for |
| 10: end for |
| 11: sends request messages to items in ; |
| 12: receives return messages from items in ; |
| 13: if items in do not have |
| 14: requires flooding by broadcasting messages to ; |
| 15: while |
| 16: if receives return message with |
| 17: candidate providers are added into ; |
| 18: end if |
| 19: ; |
| 20: end while |
| 21: end if |
| 22: calculates of items in and ; |
| 23: connects with provider with maximum value of ; |
| 24: receives video data from selected provider; |
5. Testing and Results Analysis
5.1. Testing Topology and Scenarios
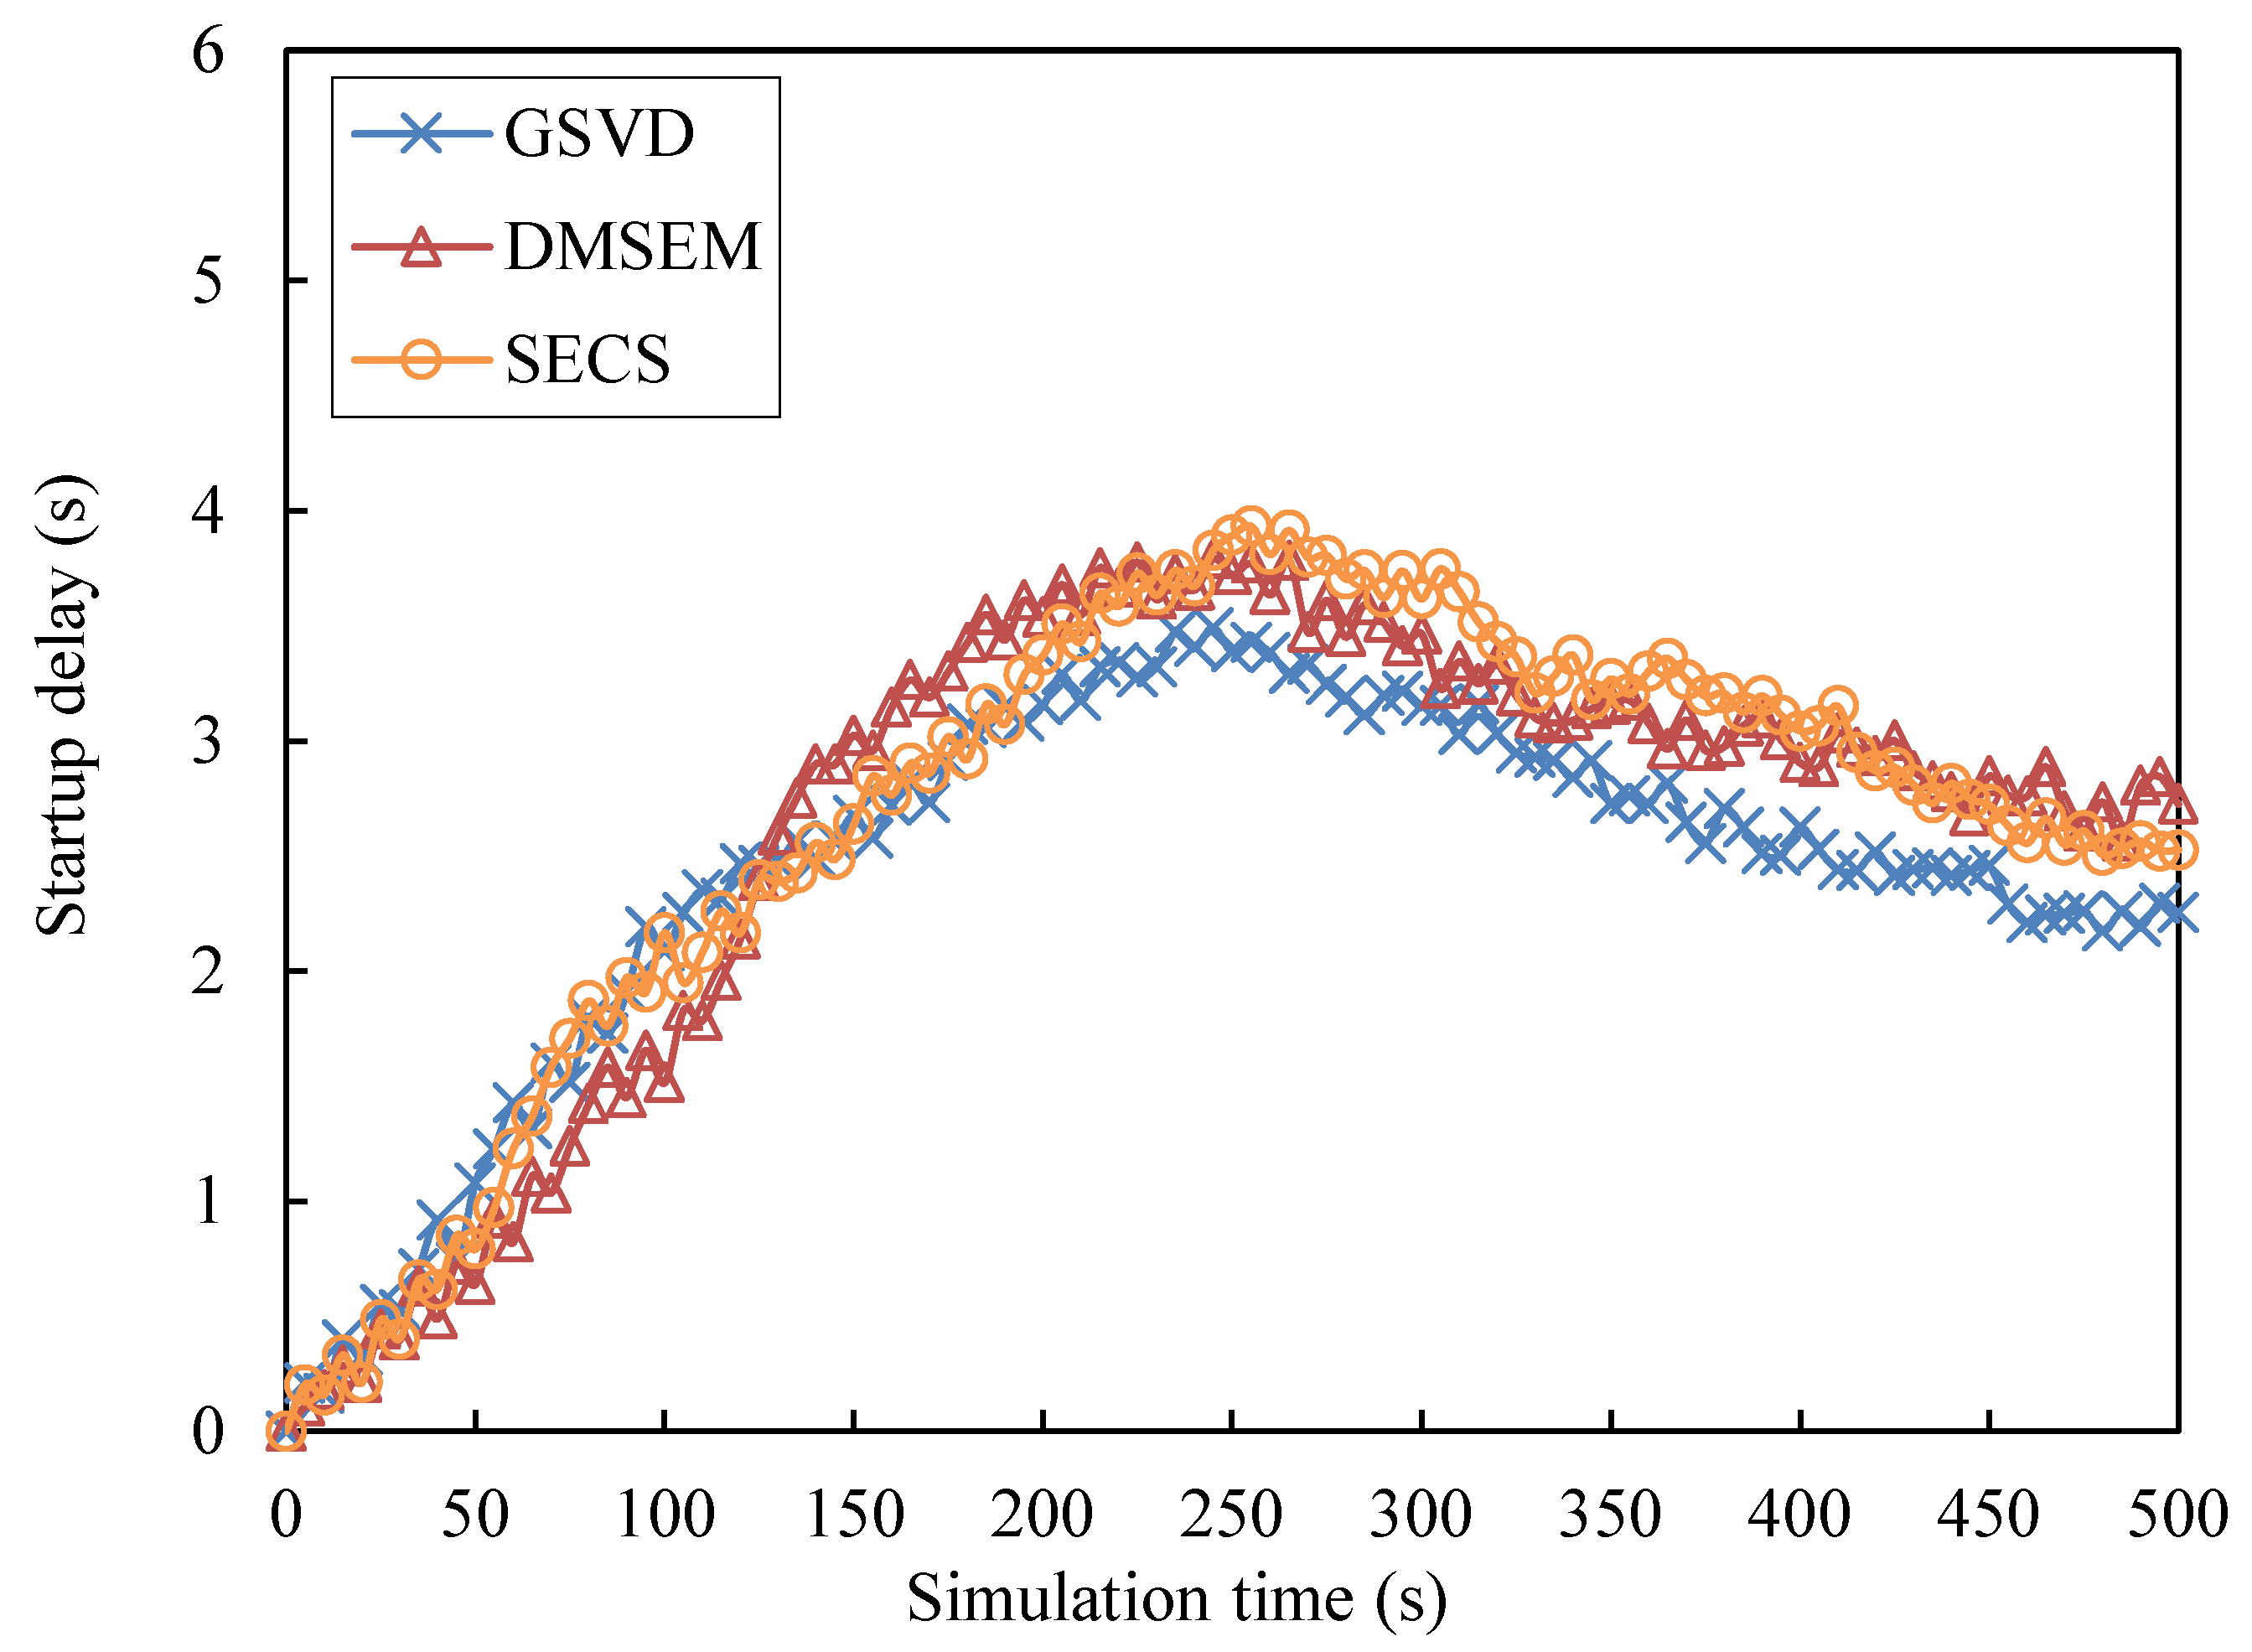
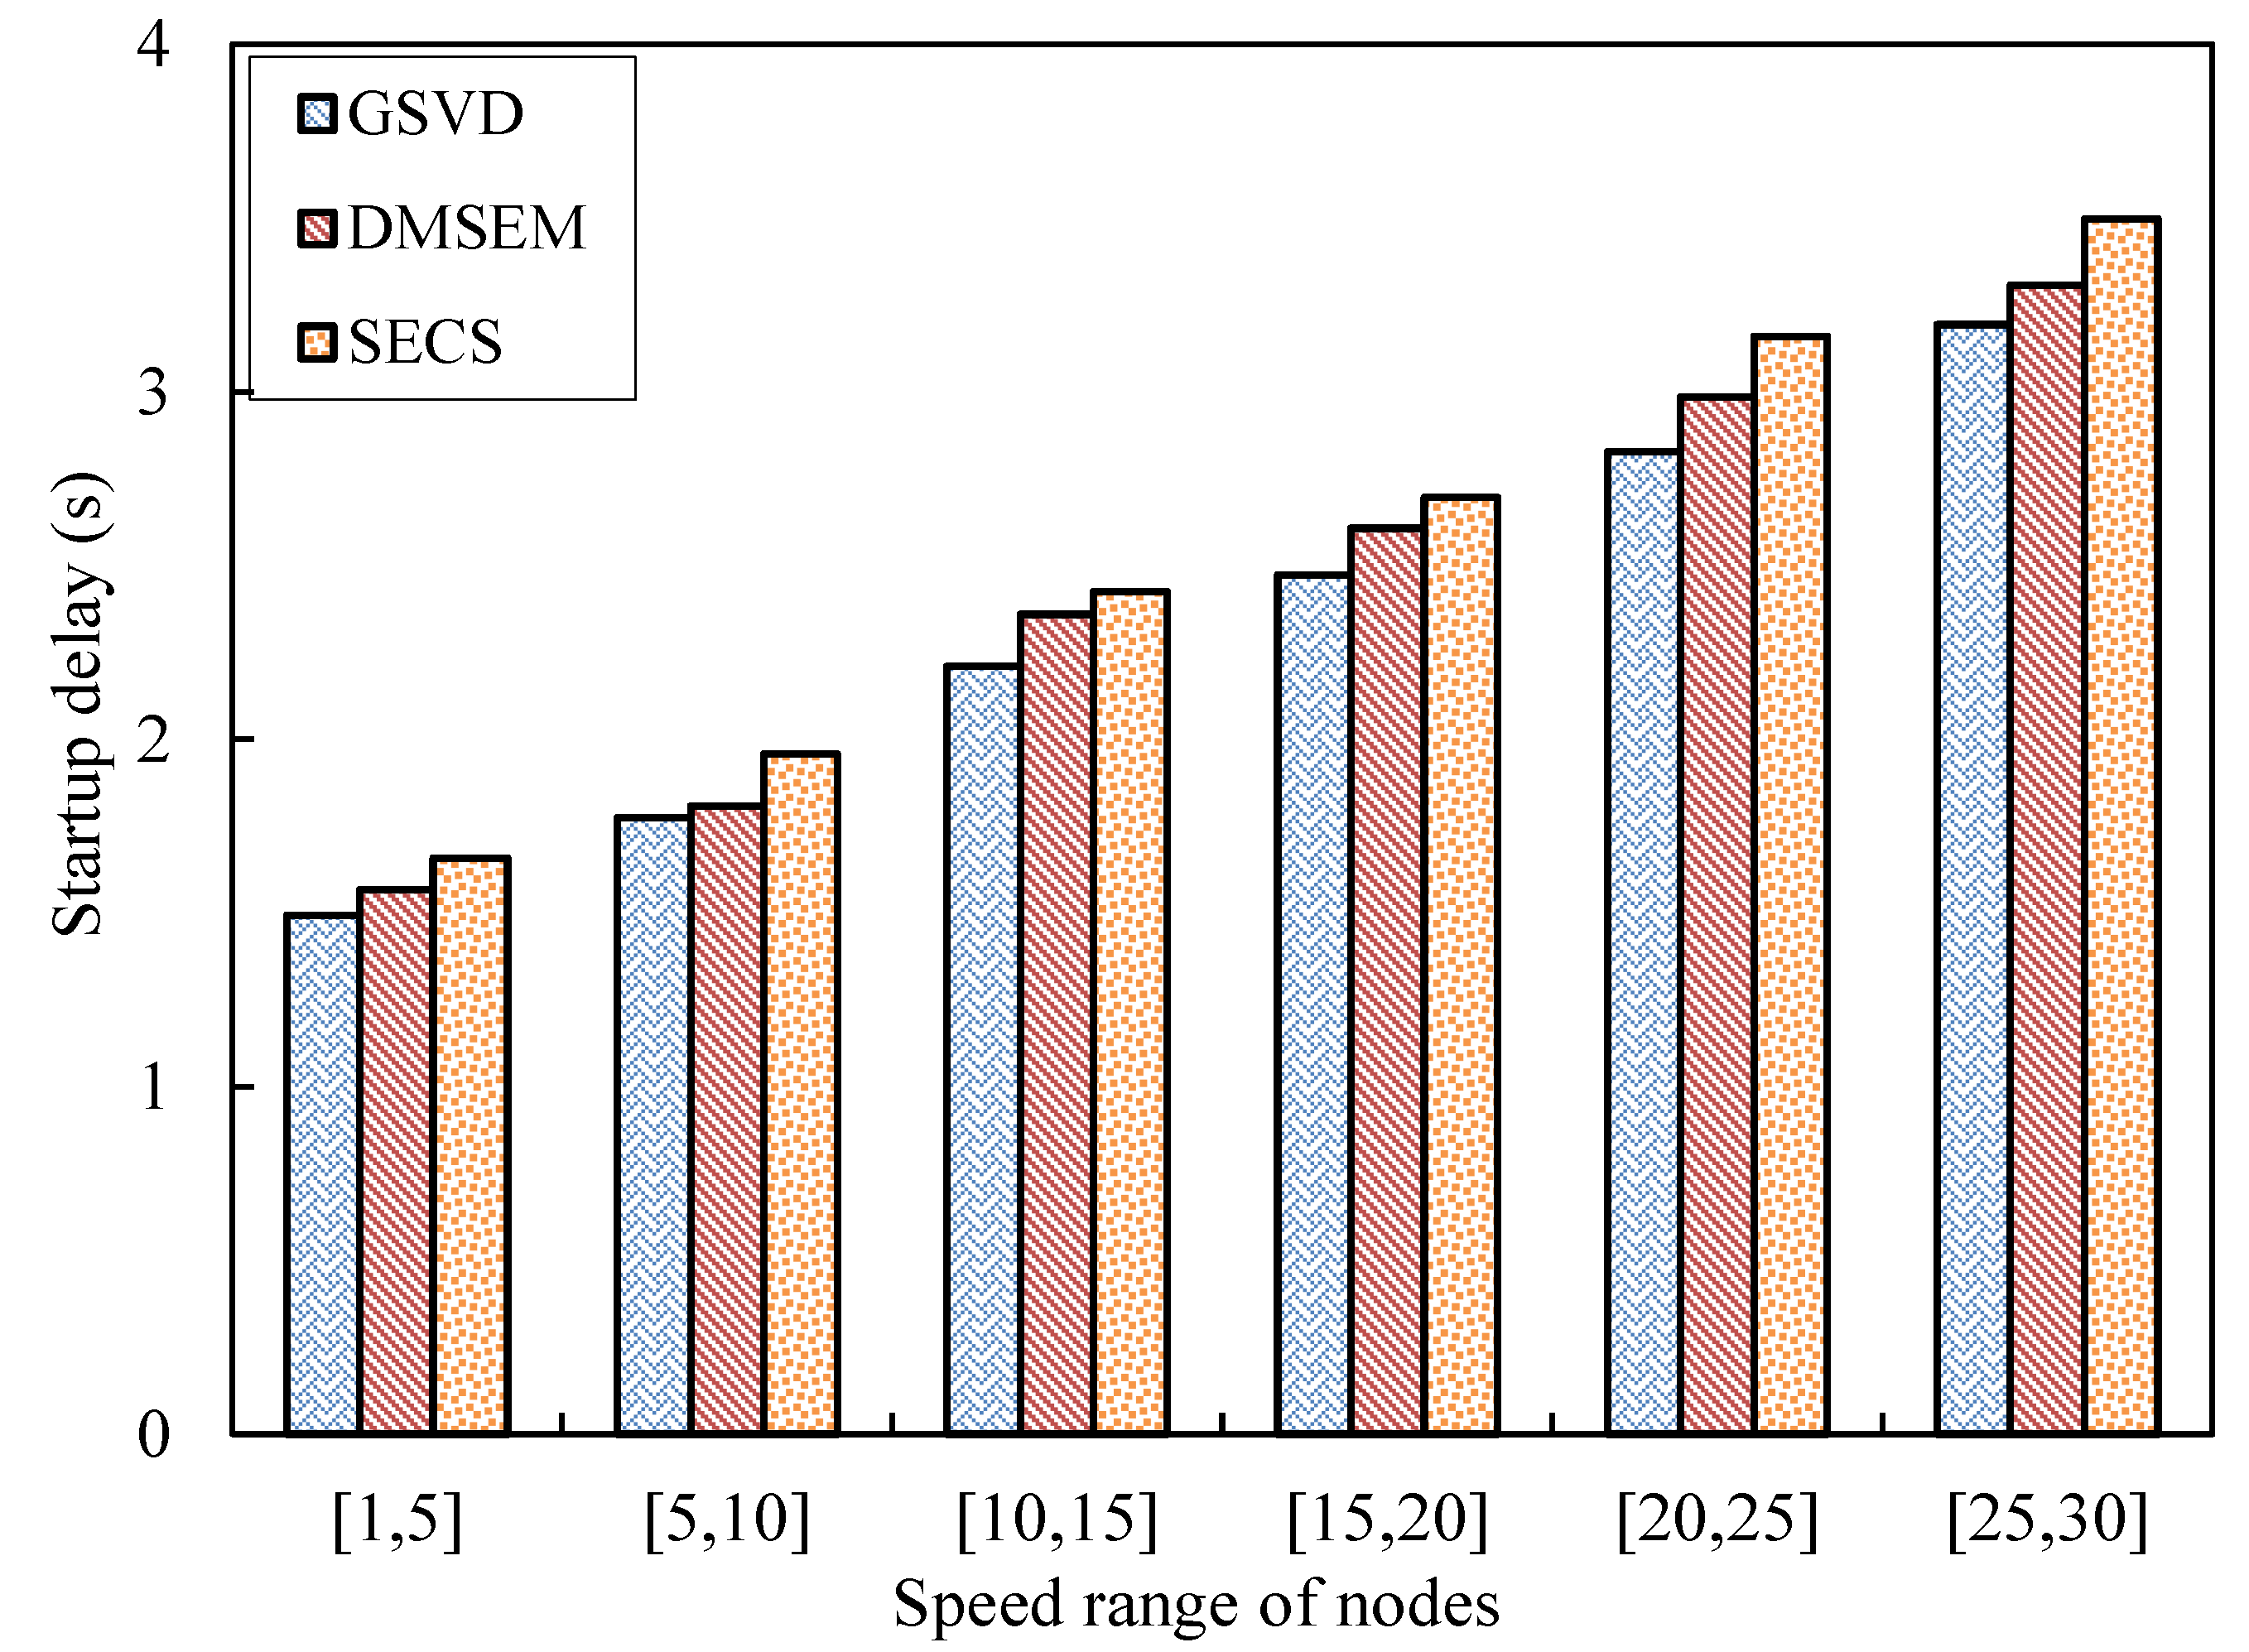
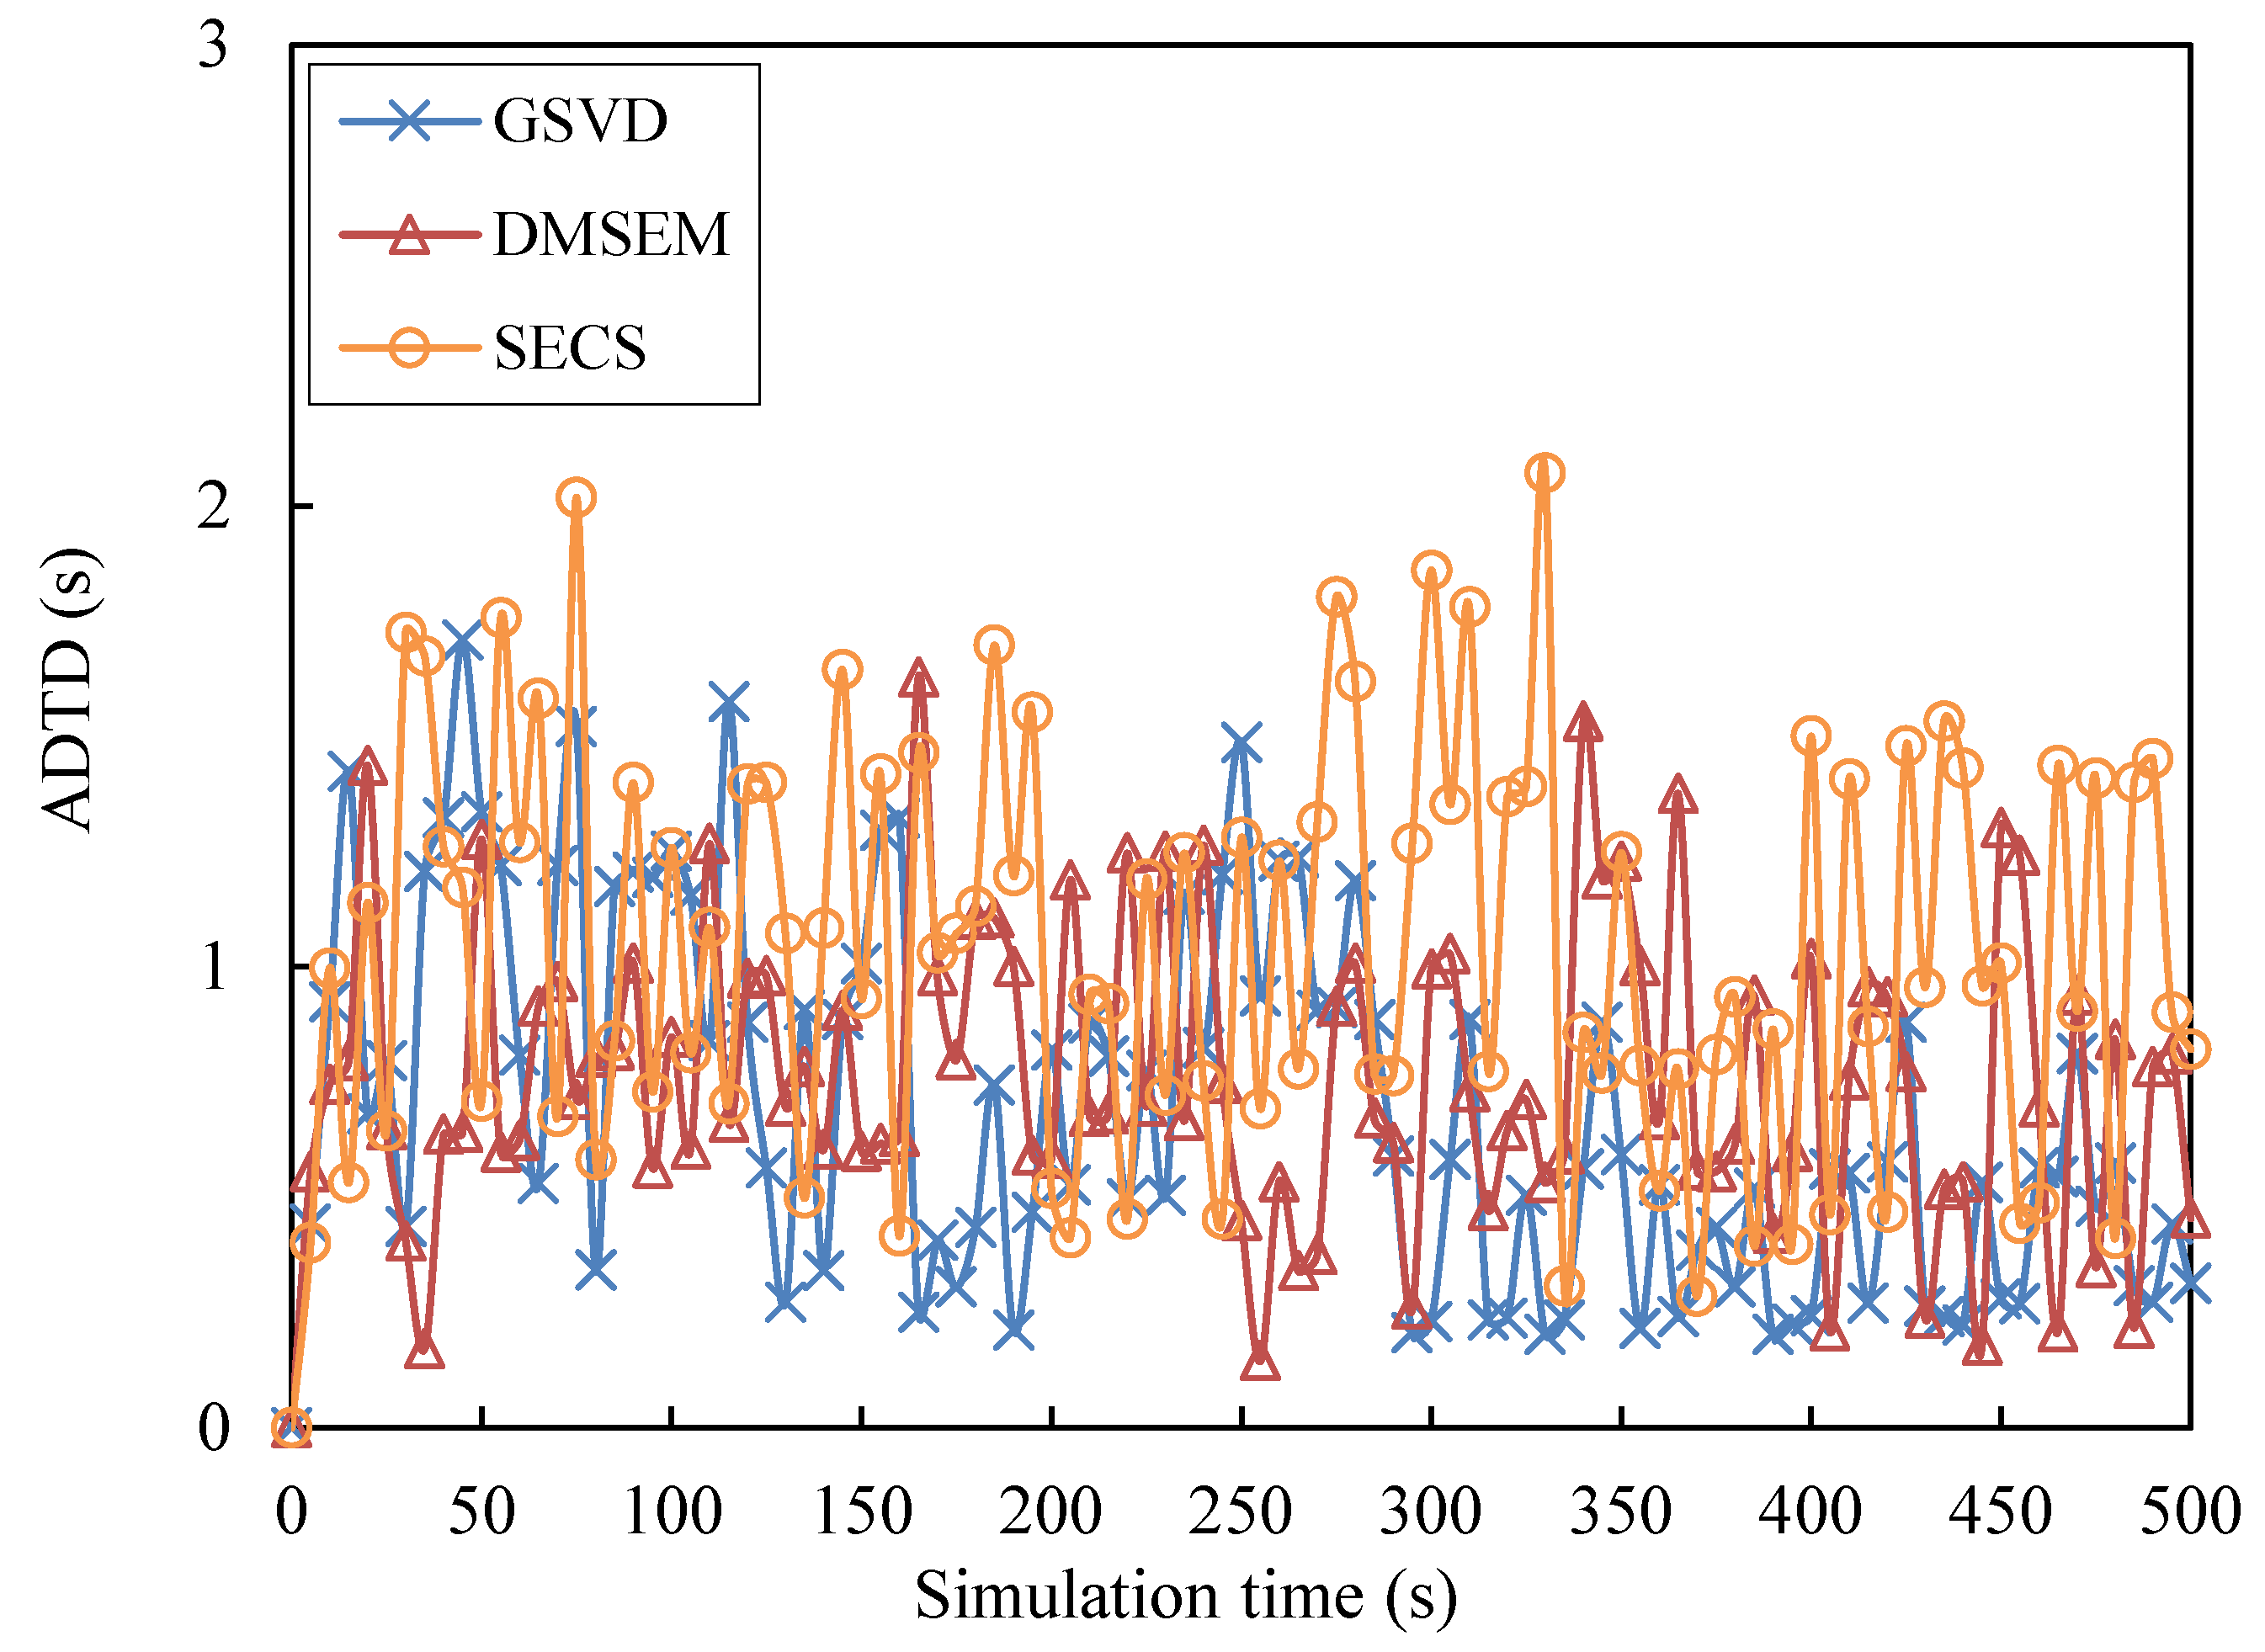
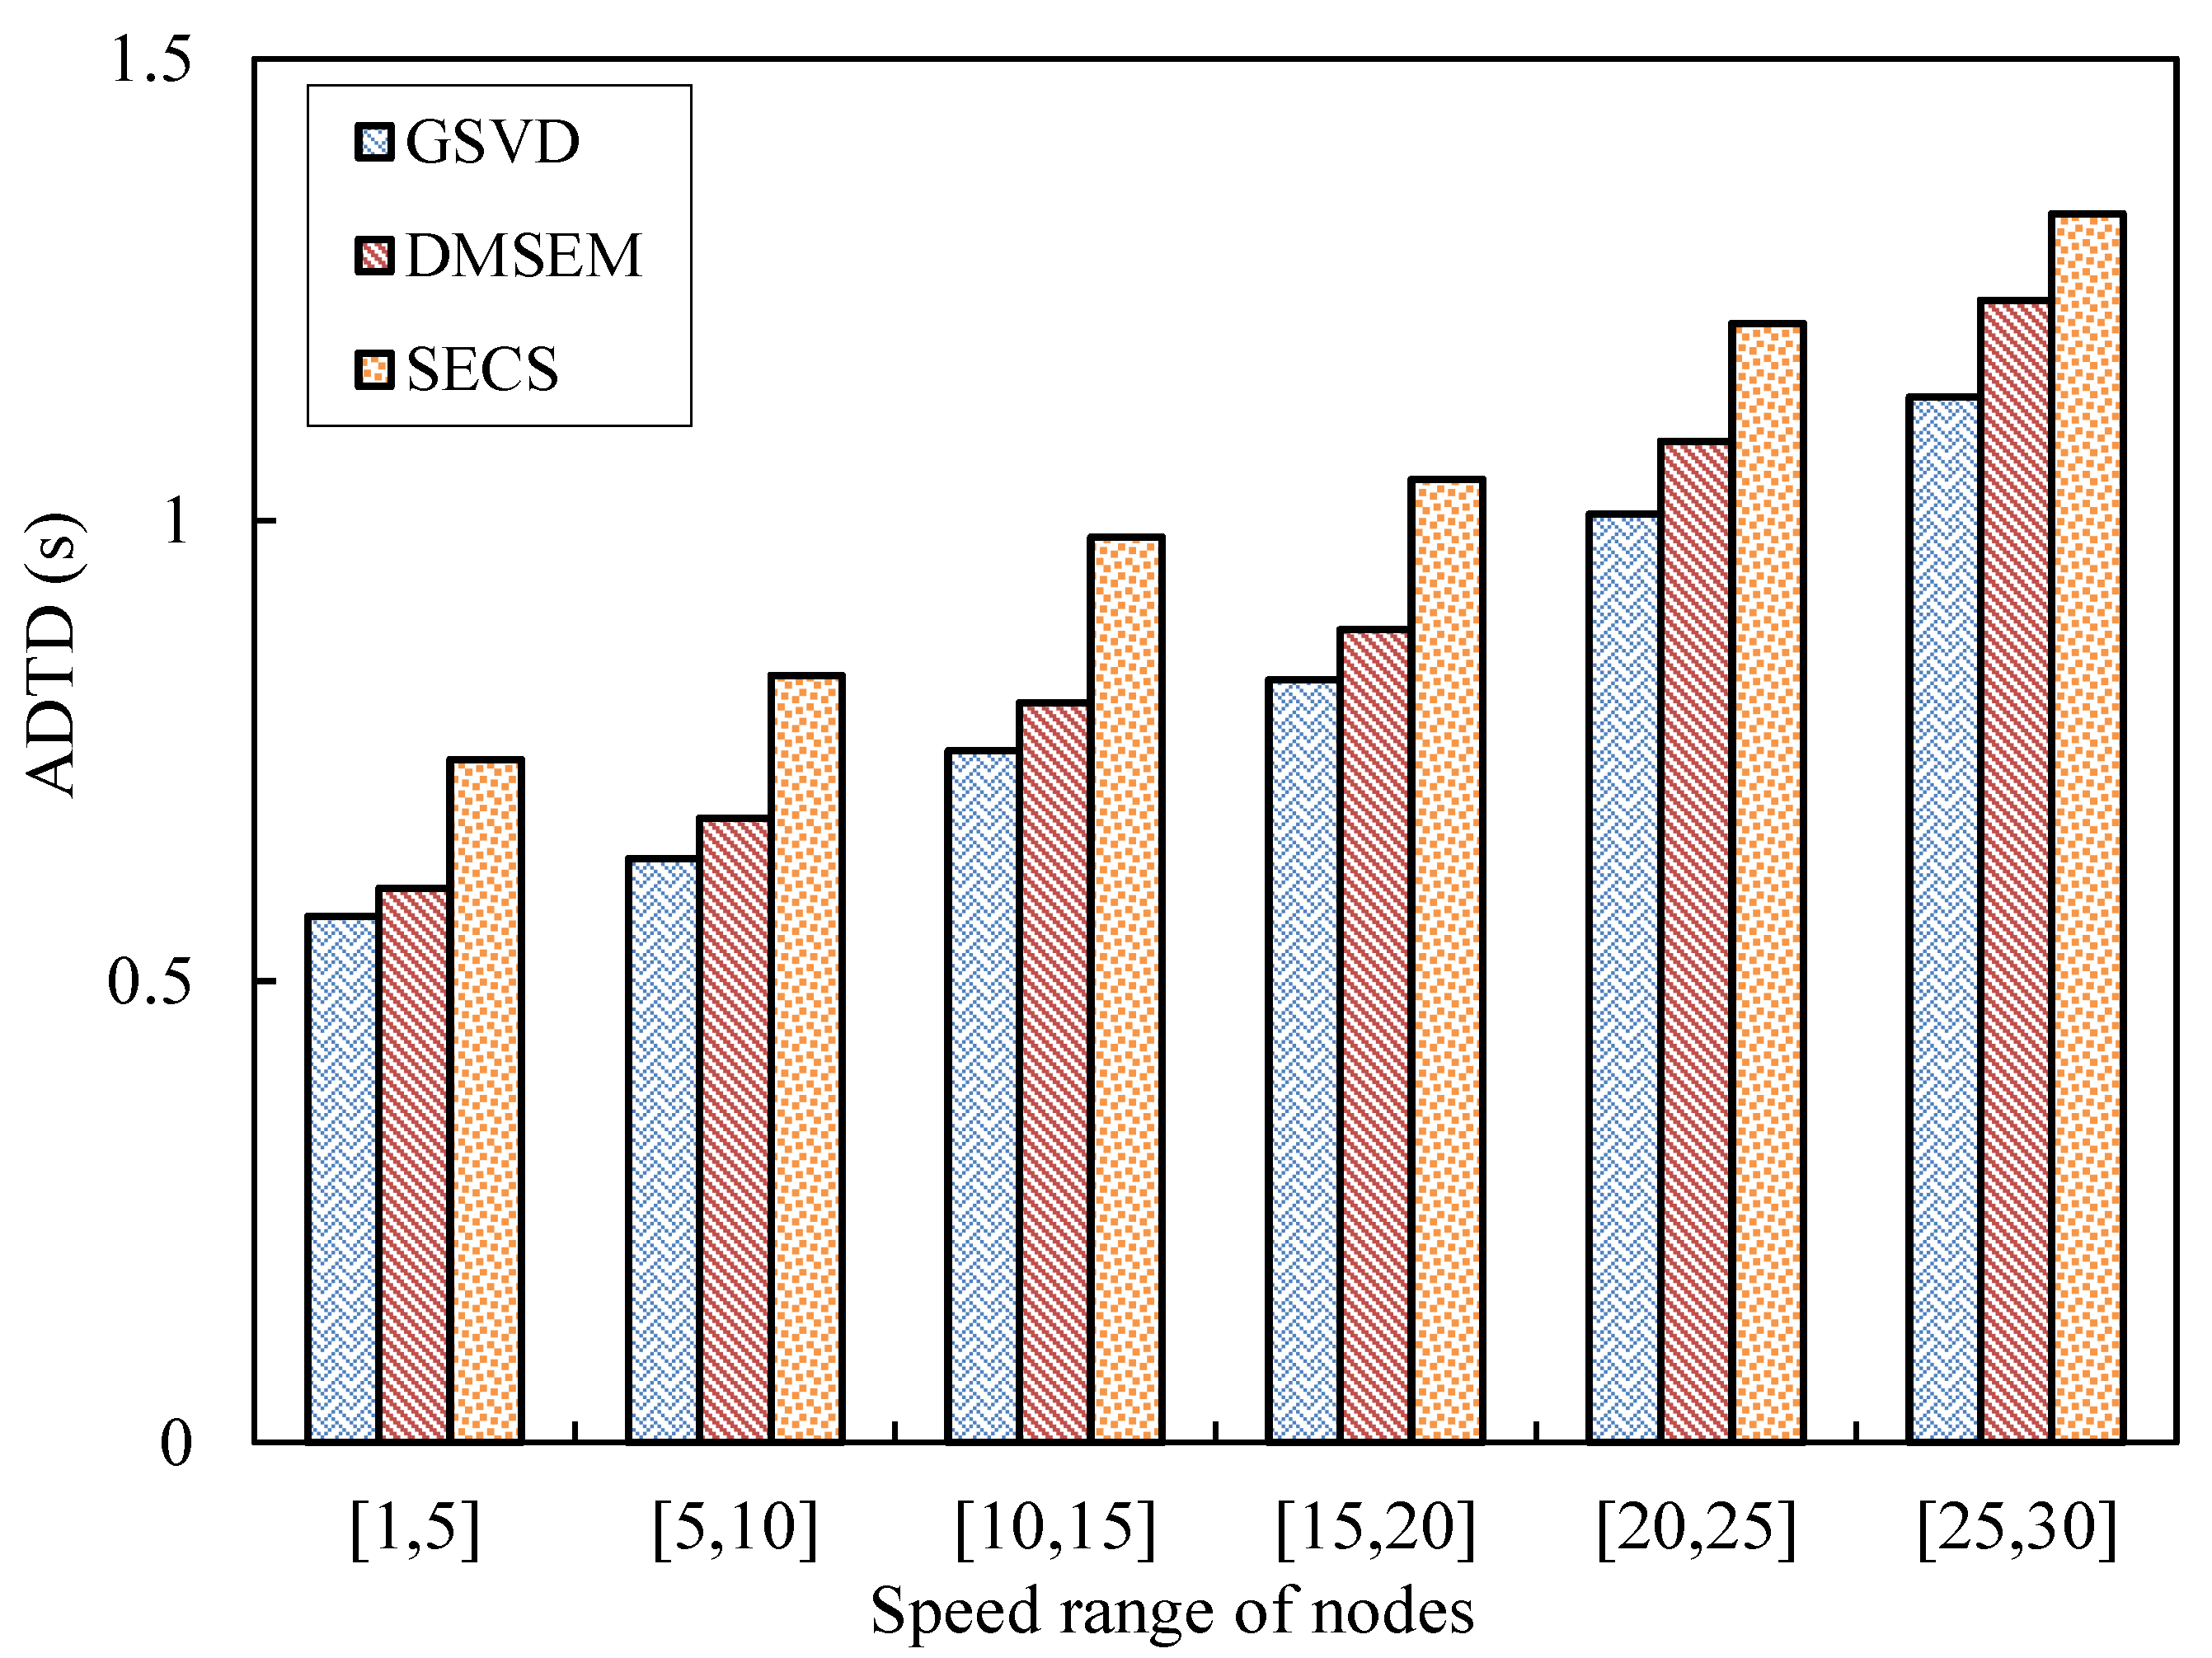
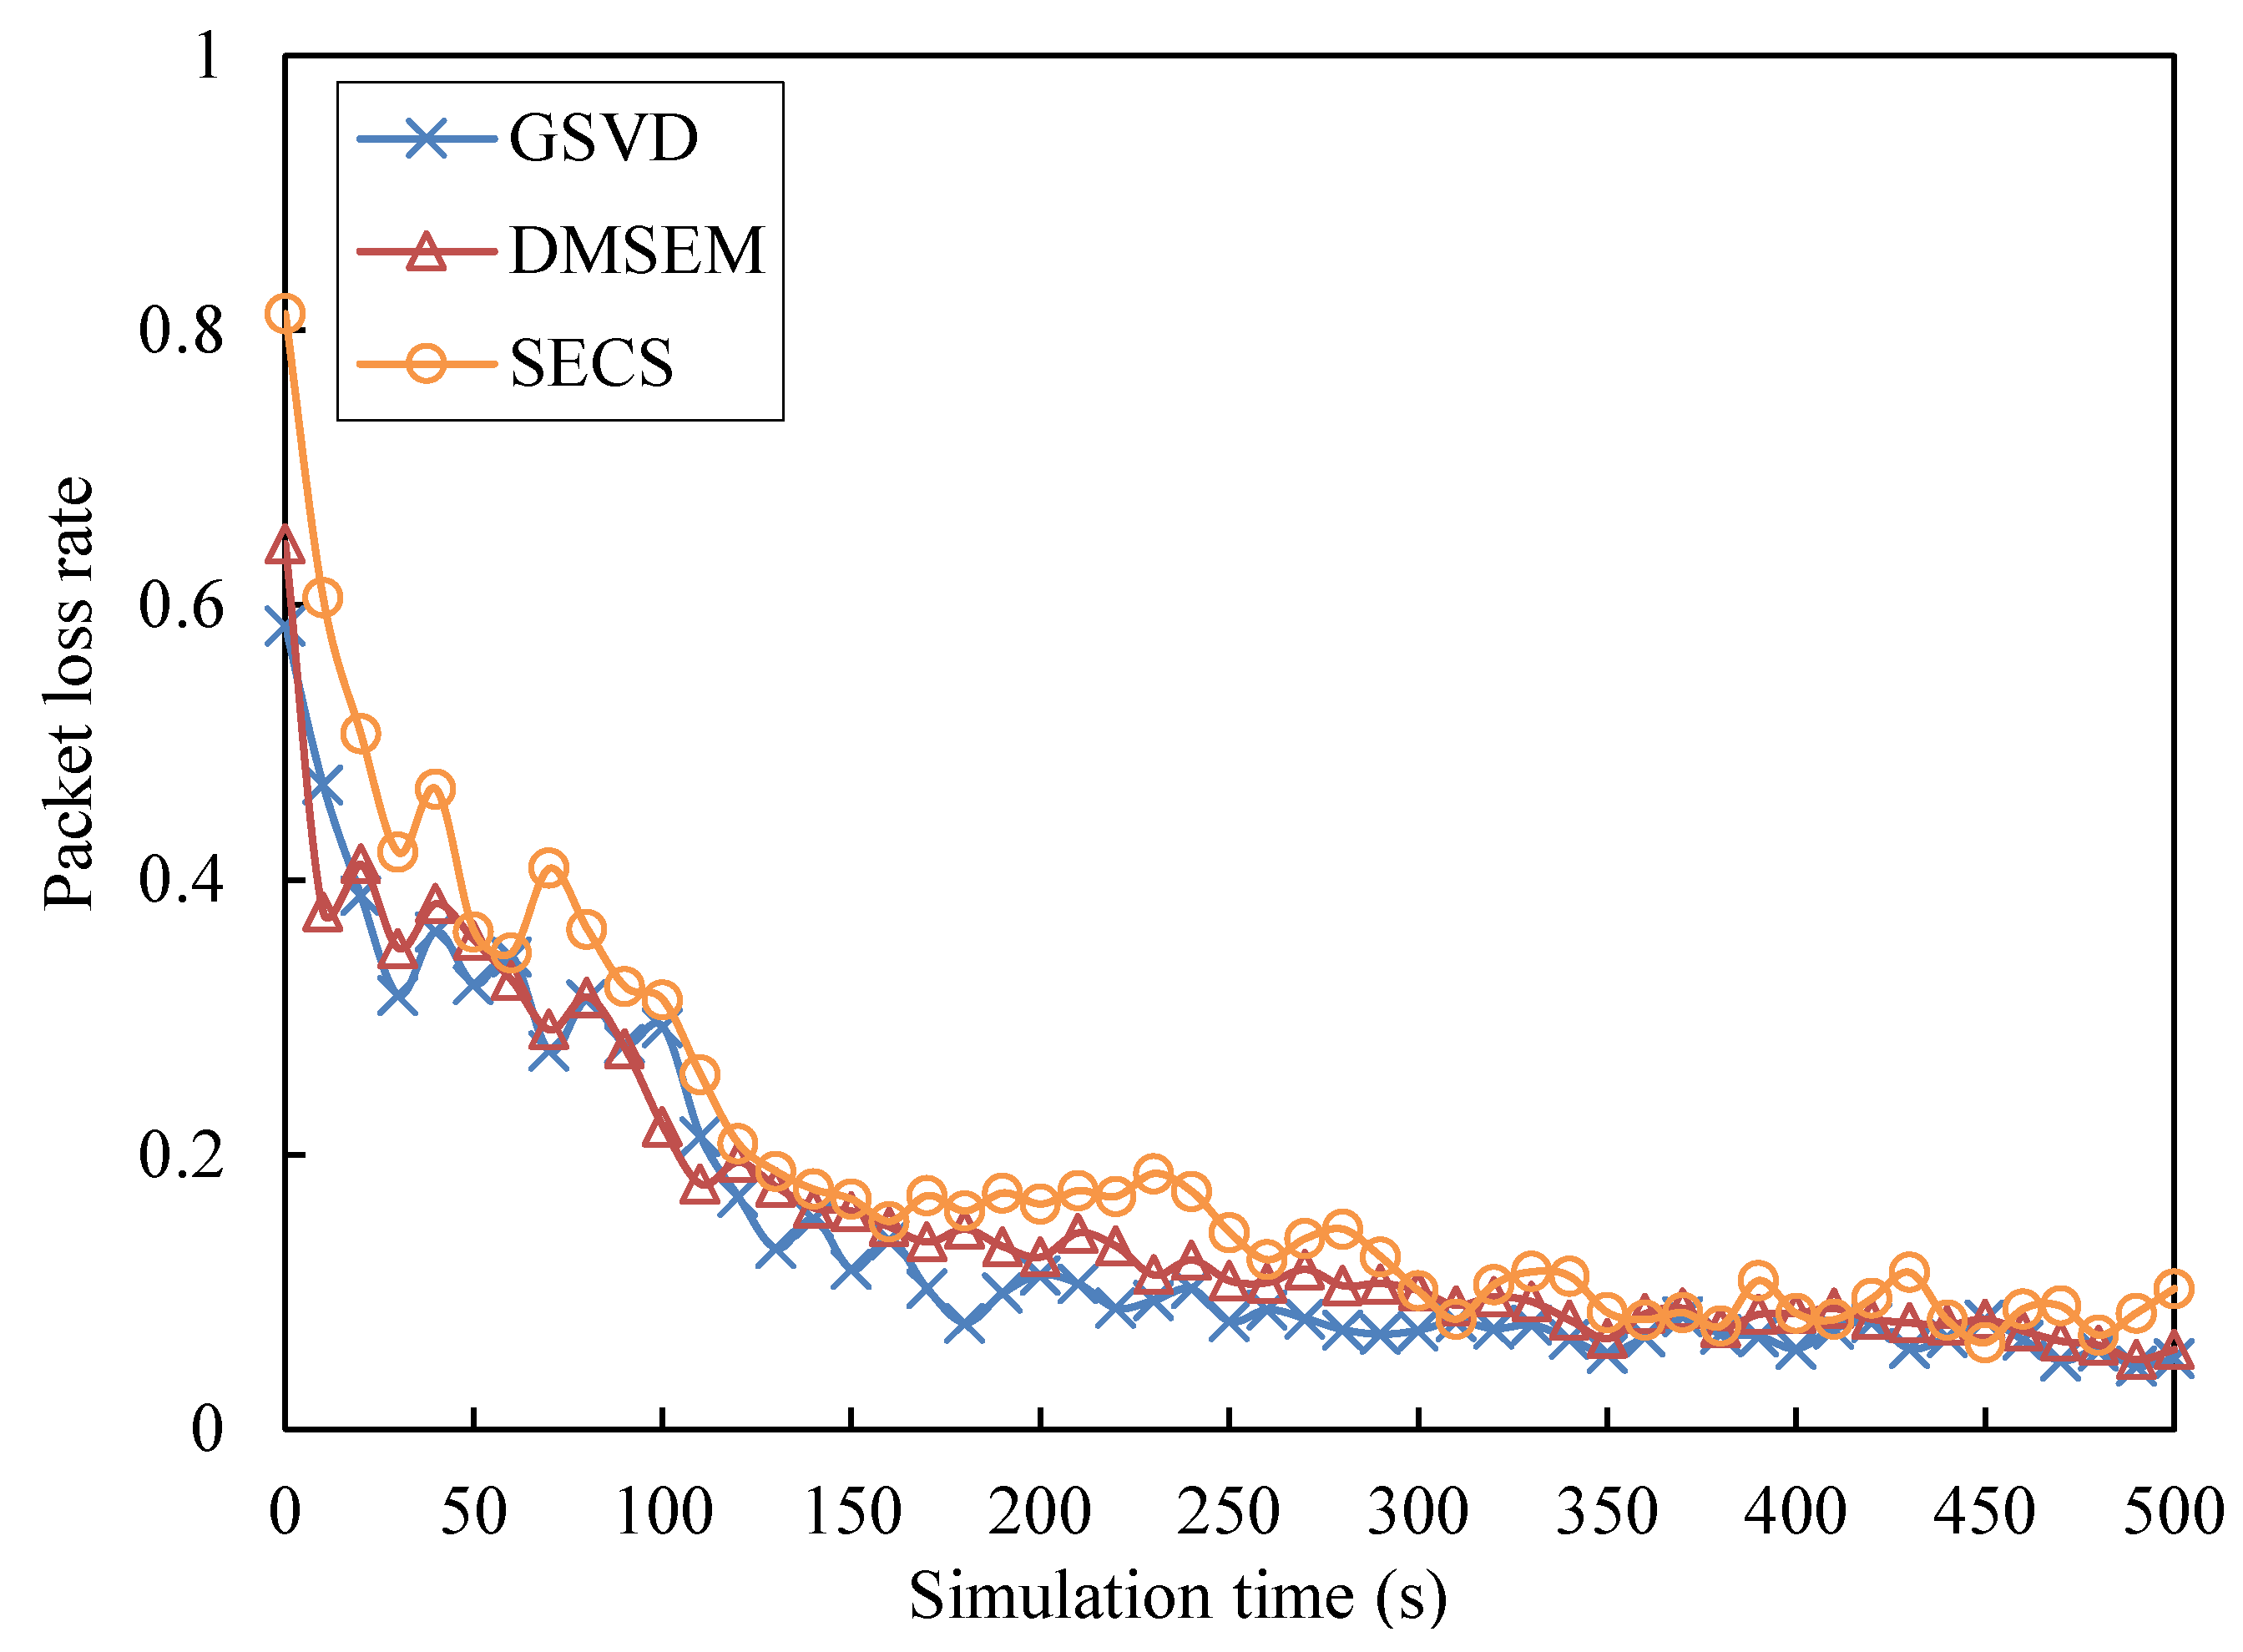
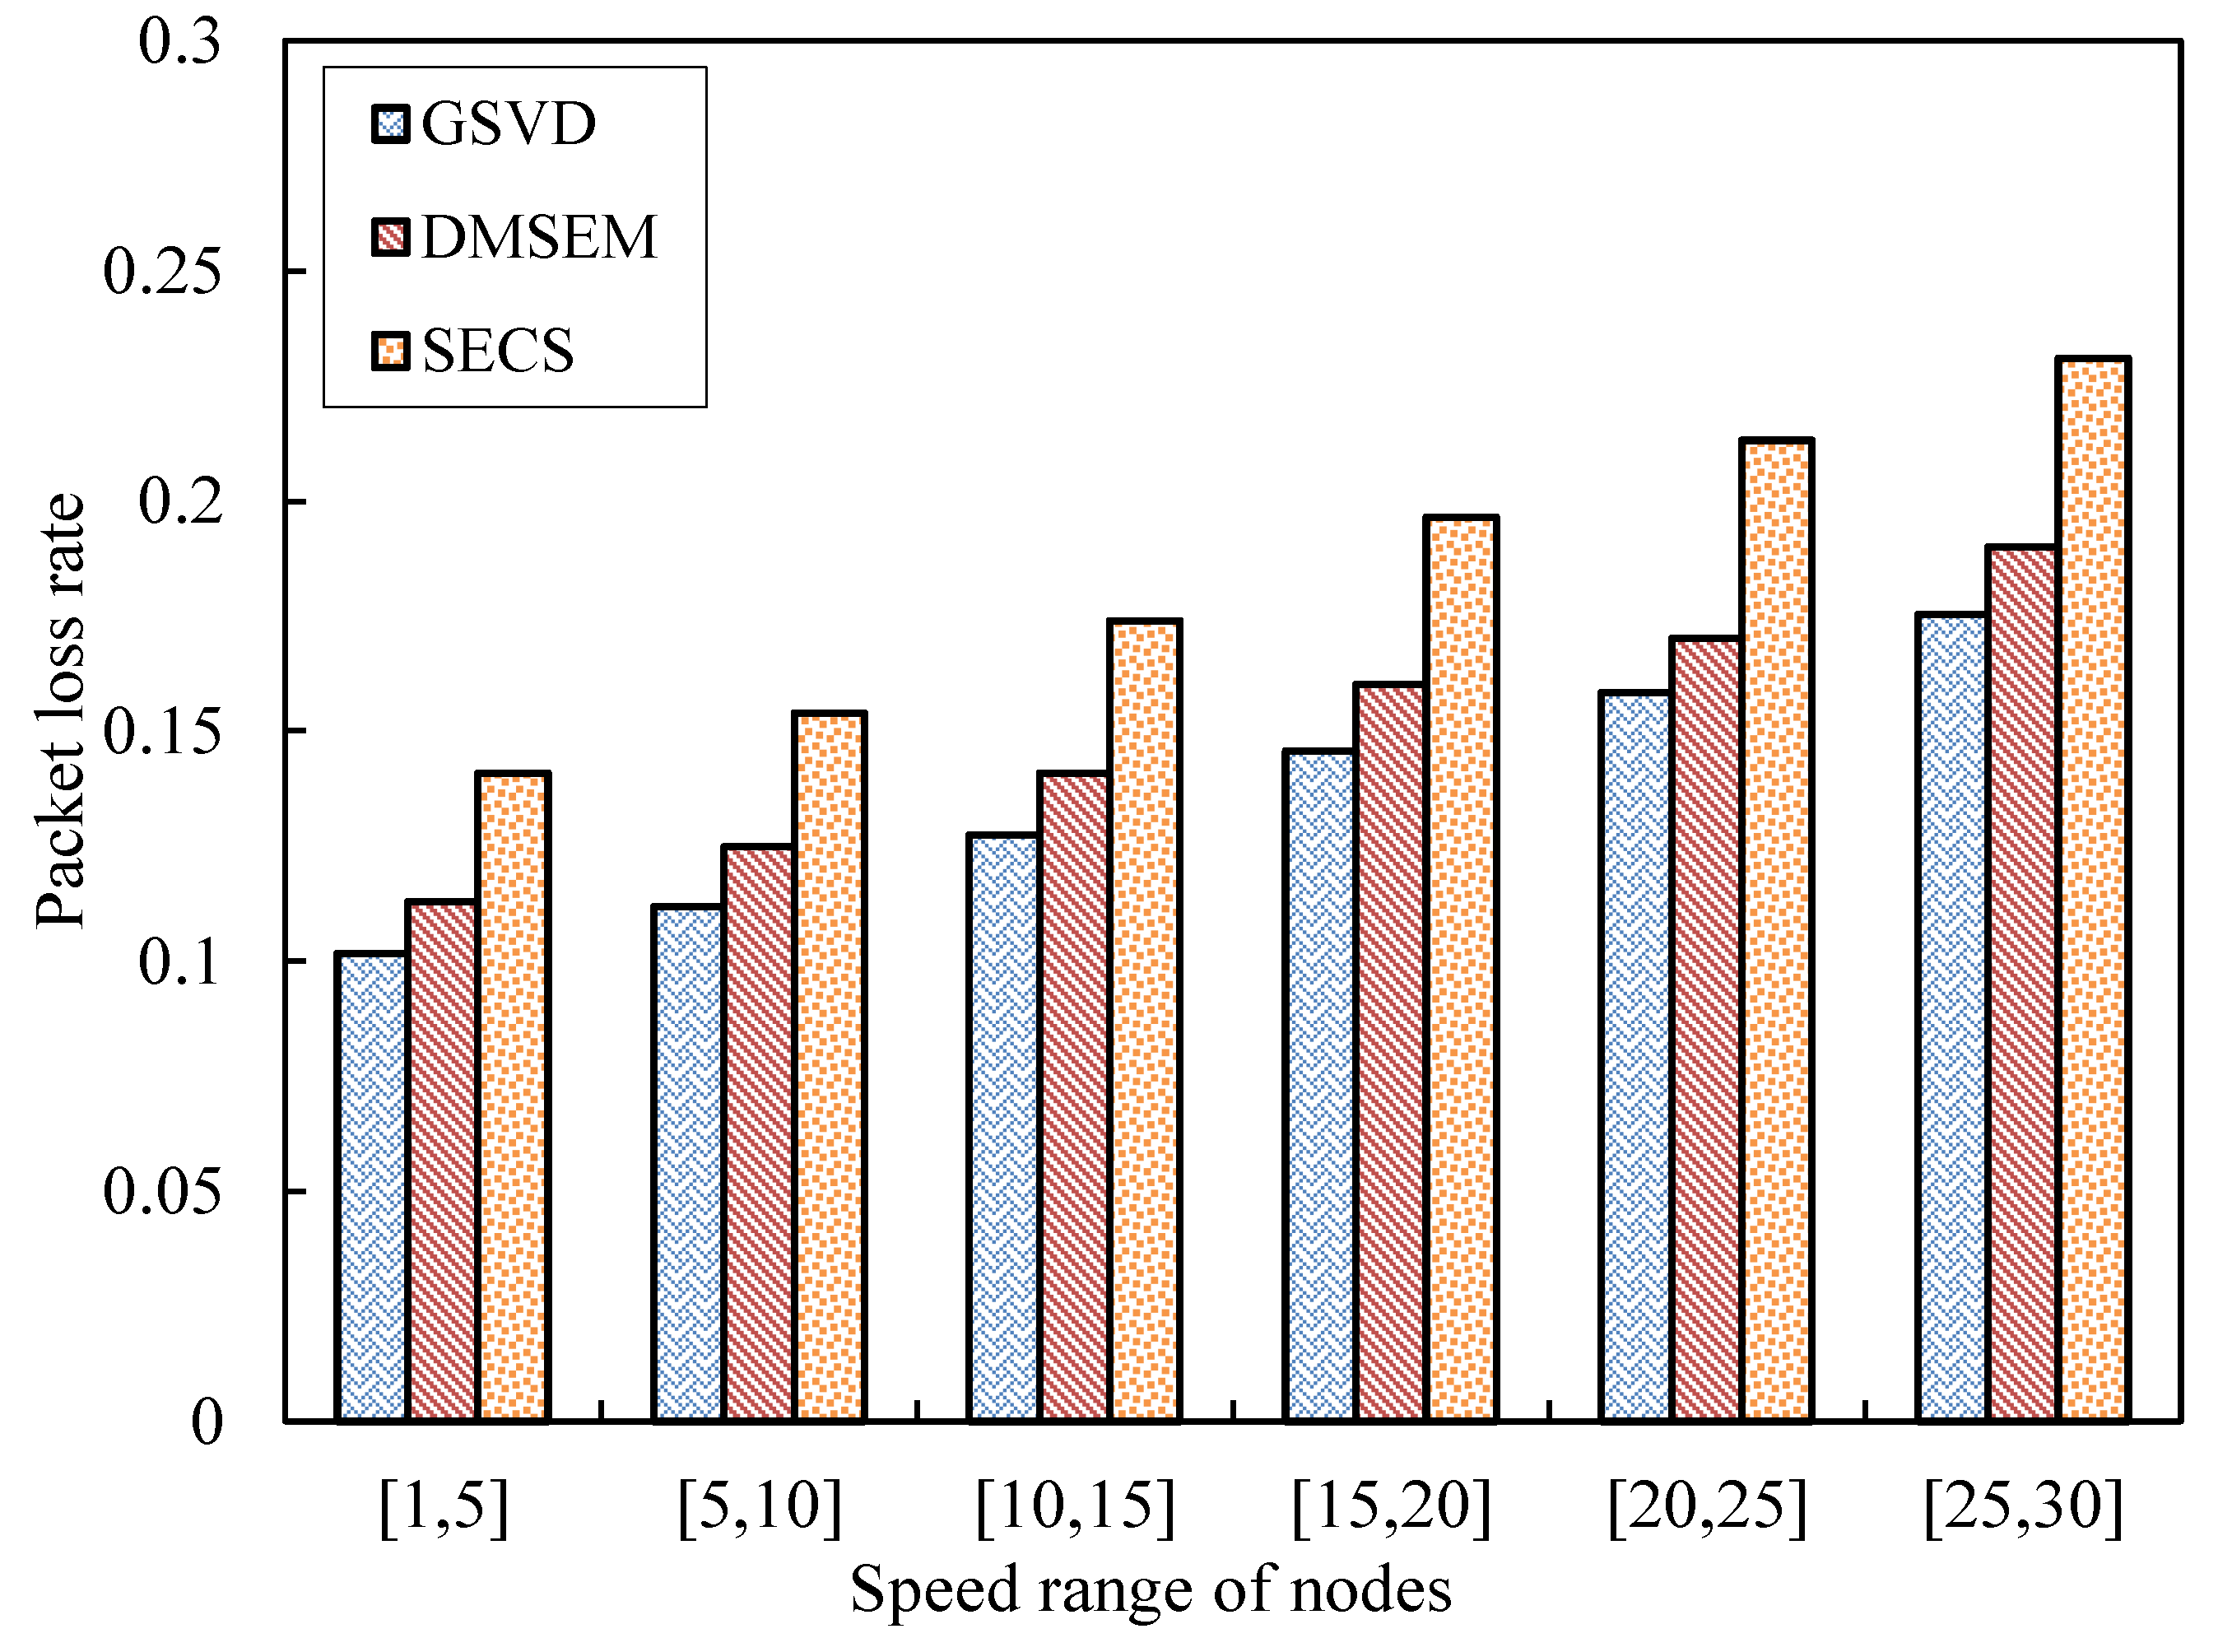
5.2. Performance Evaluation
6. Conclusions
Author Contributions
Funding
Institutional Review Board Statement
Informed Consent Statement
Data Availability Statement
Conflicts of Interest
References
- Nightingale, J.; Salva-Garcia, P.; Calero, J.M.A.; Wang, Q. 5G-QoE: QoE Modelling for Ultra-HD Video Streaming in 5G Networks. IEEE Trans. Broadcast. 2018, 64, 621–634. [Google Scholar] [CrossRef] [Green Version]
- Kouhalvandi, L.; Shayea, I.; Ozoguz, S.; Mohamad, H. Overview of evolutionary algorithms and neural networks for modern mobile communication. Trans. Emerg. Telecommun. Technol. 2022, 33, e4579. [Google Scholar] [CrossRef]
- Park, S.-H.; Jang, G.-H.; Seo, Y.-H.; Keum, H.-S.; Bang, S.-I. High-Speed Antenna Measurement System Using Multi-Probe Array Technique for 5G Applications. Electronics 2022, 11, 3435. [Google Scholar] [CrossRef]
- Abd, A.K.; Rasool, J.M.; Rahman, Z.-A.S.A.; Al-Yasir, Y.I.A. Design and Analysis of Novel Reconfigurable Monopole Antenna Using Dip Switch and Covering 5G-Sub-6-GHz and C-Band Applications. Electronics 2022, 11, 3368. [Google Scholar] [CrossRef]
- Ramirez, I.Q.; Sequeira, L.; Mas, J.R. An Edge-Cloud Approach for Video Surveillance in Public Transport Vehicles. IEEE Lat. Am. Trans. 2021, 19, 1763–1771. [Google Scholar] [CrossRef]
- Xu, C.; Qin, J.; Zhang, P.; Gao, K.; Grieco, L.A. Reinforcement Learning-based Mobile AR/VR Multipath Transmission with Streaming Power Spectrum Density Analysis. IEEE Trans. Mob. Comput. 2021. [Google Scholar] [CrossRef]
- Zhong, L.; Chen, X.; Xu, C.; Ma, Y.; Wang, M.; Zhao, Y.; Muntean, G. A Multi-User Cost-Efficient Crowd-Assisted VR Content Delivery Solution in 5G-and-Beyond Heterogeneous Networks. IEEE Trans. Mob. Comput. 2022. [Google Scholar] [CrossRef]
- Daz, C.; Fernndez, A.; Sacristn, F.; Garca, N. Energy- and Quality-Aware Video Request Policy for Wireless Adaptive Streaming Clients. IEEE Trans. Consum. Electron. 2020, 66, 366–375. [Google Scholar] [CrossRef]
- Esmaeilyfard, R.; Esmaili, R. A privacy-preserving mechanism for social mobile crowdsensing using game theory. Trans. Emerg. Telecommun. Technol. 2022, 33, e4517. [Google Scholar] [CrossRef]
- Agrawal, J.; Kapoor, M.; Tomar, R. A ferry mobility based direction and time-aware greedy delay-tolerant routing (FM-DT-GDR) protocol for sparse flying ad-hoc network. Trans. Emerg. Telecommun. Technol. 2022, 33, e4533. [Google Scholar] [CrossRef]
- Xu, F.; Zhang, Z.; Feng, J.; Qin, Z.; Xie, Y. Efficient deployment of multi-UAV assisted mobile edge computing: A cost and energy perspective. Trans. Emerg. Telecommun. Technol. 2022, 33, e4453. [Google Scholar] [CrossRef]
- Shahina, K.; Pradeep Kumar, T.S. Similarity-based clustering and data aggregation with independent component analysis in wireless sensor networks. Trans. Emerg. Telecommun. Technol. 2022, 33, e4462. [Google Scholar] [CrossRef]
- Shen, H.; Li, Z.; Lin, Y.; Li, J. SocialTube: P2P-assisted Video Sharing in Online Social Networks. IEEE Trans. Parallel Distrib. Syst. 2014, 25, 2428–2440. [Google Scholar] [CrossRef]
- Yan, H.; Liu, J.; Li, Y.; Jin, D.; Chen, S. Spatial Popularity and Similarity of Watching Videos in Large-Scale Urban Environment. IEEE Trans. Netw. Serv. Manag. 2018, 15, 797–810. [Google Scholar] [CrossRef]
- Li, Y.; Wang, J.; Sun, X.; Li, Z.; Liu, M.; Gui, G. Smoothing-Aided Support Vector Machine Based Nonstationary Video Traffic Prediction Towards B5G Networks. IEEE Trans. Veh. Technol. 2020, 69, 7493–7502. [Google Scholar] [CrossRef]
- Park, G.S.; Song, H. Cooperative Base Station Caching and X2 Link Traffic Offloading System for Video Streaming Over SDN-Enabled 5G Networks. IEEE Trans. Mob. Comput. 2019, 18, 2005–2019. [Google Scholar] [CrossRef]
- Akhtar, M.J.; Mahum, R.; Butt, F.S.; Amin, R.; Sherbeeny, A.M.E.; Lee, S.M.; Shaikh, S. A Robust Framework for Object Detection in a Traffic Surveillance System. Electronics 2022, 11, 3425. [Google Scholar] [CrossRef]
- Xiao, H.; Xu, C.; Ma, Y.; Yang, S.; Zhong, L.; Muntean, G. Edge Intelligence: A Computational Task Offloading Scheme for Dependent IoT Application. IEEE Trans. Wirel. Commun. 2022. [Google Scholar] [CrossRef]
- Cao, Y.; Jiang, T.; Chen, X.; Zhang, J. Social-Aware Video Multicast Based on Device-to-Device Communications. IEEE Trans. Mob. Comput. 2016, 15, 1528–1539. [Google Scholar] [CrossRef]
- Hu, H.; Wen, Y.; Chua, T.-S.; Huang, J.; Zhu, W.; Li, X. Joint Content Replication and Request Routing for Social Video Distribution Over Cloud CDN: A Community Clustering Method. IEEE Trans. Circuits Syst. Video Technol. 2018, 26, 1320–1333. [Google Scholar] [CrossRef]
- Wang, X.; Chen, M.; Kwon, T.T.; Yang, L.T.; Leung, V.C.M. AMES-Cloud: A Framework of Adaptive Mobile Video Streaming and Efficient Social Video Sharing in the Clouds. IEEE Trans. Multimed. 2013, 15, 811–820. [Google Scholar] [CrossRef]
- Alam, K.M.; Saini, M.; Ahmed, D.T.; Saddik, A.E. VeDi: A vehicular crowd-sourced video social network for VANETs. In Proceedings of the 39th Annual IEEE Conference on Local Computer Networks Workshops, Edmonton, AB, Canada, 8–11 September 2014. [Google Scholar]
- Lin, W.S.; Zhao, H.V.; Liu, K.J.R. Cooperation Stimulation Strategies for Peer-to-Peer Wireless Live Video-Sharing Social Networks. IEEE Trans. Image Process. 2010, 19, 1768–1784. [Google Scholar] [CrossRef] [PubMed] [Green Version]
- Jiao, J.; Guo, S.; Wang, Y.; Yang, Y. Energy-Efficient Cooperative Scalable Video Distribution and Sharing in Mobile Social Networks. In Proceedings of the 2019 15th International Conference on Mobile Ad-Hoc and Sensor Networks (MSN), Shenzhen, China, 11–13 December 2019. [Google Scholar]
- Hung, Y.-H.; Wang, C.-Y.; Hwang, R.-H. Optimizing Social Welfare of Live Video Streaming Services in Mobile Edge Computing. IEEE Trans. Mob. Comput. 2020, 19, 922–934. [Google Scholar] [CrossRef]
- Wang, M.; Xu, C.; Chen, X.; Hao, H.; Zhong, L.; Yu, S. Differential Privacy Oriented Distributed Online Learning for Mobile Social Video Prefetching. IEEE Trans. Multimed. 2019, 21, 636–651. [Google Scholar] [CrossRef]
- Li, Z.; Wu, Q.; Salamatian, K.; Xie, G. Video Delivery Performance of a Large-Scale VoD System and the Implications on Content Delivery. IEEE Trans. Multimed. 2015, 17, 880–892. [Google Scholar] [CrossRef]
- Choi, M.; No, A.; Ji, M.; Kim, J. Markov Decision Policies for Dynamic Video Delivery in Wireless Caching Networks. IEEE Trans. Wirel. Commun. 2019, 18, 5705–5718. [Google Scholar] [CrossRef] [Green Version]
- Jia, S.; Xu, C.; Guan, J.; Zhang, H.; Muntean, G.-M. A Novel Cooperative Content Fetching-Based Strategy to Increase the Quality of Video Delivery to Mobile Users in Wireless Networks. IEEE Trans. Broadcast. 2014, 60, 370–384. [Google Scholar] [CrossRef]
- Xiang, L.; Ng, D.W.K.; Islam, T.; Schober, R.; Wong, V.W.S.; Wang, J. Cross-Layer Optimization of Fast Video Delivery in Cache- and Buffer-Enabled Relaying Networks. IEEE Trans. Veh. Technol. 2017, 66, 11366–11382. [Google Scholar] [CrossRef]
- Roy, S.D.; Mei, T.; Zeng, W.; Li, S. Towards Cross-Domain Learning for Social Video Popularity Prediction. IEEE Trans. Multimed. 2018, 15, 1255–1267. [Google Scholar] [CrossRef]
- Xu, J.; Schaar, M.v.d.; Liu, J.; Li, H. Forecasting Popularity of Videos Using Social Media. IEEE J. Sel. Top. Signal Process. 2015, 9, 330–343. [Google Scholar] [CrossRef]
- Yang, W.; Ma, J.; Li, Y.; Yan, R.; Yuan, J.; Wu, W.; Li, D. Marginal Gains to Maximize Content Spread in Social Networks. IEEE Trans. Comput. Soc. Syst. 2019, 6, 479–490. [Google Scholar] [CrossRef]
- Niu, G.; Fan, X.; Li, V.O.K.; Long, Y.; Xu, K. Multi-Source-Driven Asynchronous Diffusion Model for Video-Sharing in Online Social Networks. IEEE Trans. Multimed. 2014, 16, 2025–2037. [Google Scholar] [CrossRef] [Green Version]
- Fan, Y.; Yang, B.; Hu, D.; Yuan, X.; Xu, X. Social- and Content-Aware Prediction for Video Content Delivery. IEEE Access 2020, 8, 29219–29227. [Google Scholar] [CrossRef]
- Zhang, R.; Jia, S.; Ma, Y.; Xu, C. Social-Aware D2D Video Delivery Method Based on Mobility Similarity Measurement in 5G Ultra-Dense Network. IEEE Access 2020, 8, 52413–52427. [Google Scholar] [CrossRef]
- Wang, Z.; Liu, J.; Zhu, W. Social-aware video delivery: Challenges, approaches, and directions. IEEE Netw. 2016, 30, 35–39. [Google Scholar] [CrossRef]
- Jia, S.; Zhou, Z.; Li, W.; Ma, Y.; Zhang, R.; Wang, T. Social-Aware Edge Caching Strategy of Video Resources in 5G Ultra-Dense Network. Mob. Inf. Syst. 2021, 2021, 6625629. [Google Scholar] [CrossRef]
- Li, W. Random texts exhibit Zipf’s-law-like word frequency distribution. IEEE Trans. Inf. Theory 1992, 38, 1842–1845. [Google Scholar] [CrossRef] [Green Version]
- Li, Q.; Zhang, Y.; Pandharipande, A.; Ge, X.; Zhang, J. D2D-Assisted Caching on Truncated Zipf Distribution. IEEE Access 2019, 7, 13411–13421. [Google Scholar] [CrossRef]
- Aldalbahi, A.; Rahaim, M.; Khreishah, A.; Ayyash, M.; Little, T.D.C. Visible Light Communication Module: An Open Source Extension to the ns3 Network Simulator With Real System Validation. IEEE Access 2017, 5, 22144–22158. [Google Scholar] [CrossRef]
- Zhang, H.; Liao, Y.; Song, L. D2D-U: Device-to-Device Communications in Unlicensed Bands for 5G System. IEEE Trans. Onwireless Commun. 2017, 16, 3507–3519. [Google Scholar] [CrossRef]
- Lee, S.-B.; Muntean, G.-M.; Smeaton, A.F. Performance-aware replication of distributed pre-recorded IPTV content. IEEE Trans. Broadcast. 2009, 55, 516–526. [Google Scholar]


Publisher’s Note: MDPI stays neutral with regard to jurisdictional claims in published maps and institutional affiliations. |
© 2022 by the authors. Licensee MDPI, Basel, Switzerland. This article is an open access article distributed under the terms and conditions of the Creative Commons Attribution (CC BY) license (https://creativecommons.org/licenses/by/4.0/).
Share and Cite
Jia, S.; Cui, Y.; Zhang, R. A Novel Geo-Social-Aware Video Edge Delivery Strategy Based on Modeling of Social-Geographical Dynamic in an Urban Area. Electronics 2022, 11, 4230. https://doi.org/10.3390/electronics11244230
Jia S, Cui Y, Zhang R. A Novel Geo-Social-Aware Video Edge Delivery Strategy Based on Modeling of Social-Geographical Dynamic in an Urban Area. Electronics. 2022; 11(24):4230. https://doi.org/10.3390/electronics11244230
Chicago/Turabian StyleJia, Shijie, Yan Cui, and Ruiling Zhang. 2022. "A Novel Geo-Social-Aware Video Edge Delivery Strategy Based on Modeling of Social-Geographical Dynamic in an Urban Area" Electronics 11, no. 24: 4230. https://doi.org/10.3390/electronics11244230