Article

Human Emotions Recognition, Analysis and Transformation by the Bioenergy Field in Smart Grid Using Image Processing

1
Department of Computer Science and Engineering, Graphic Era Hill University, Dehradun 248002, India
2
Department of Vocational and Technical Education, Faculty of Education, Alex Ekwueme Federal University (Ndufu-Alike), Abakaliki 482131, Nigeria
3
Department of Mathematics and Computer Science, Coal City University, Enugu 400104, Nigeria
4
School of Computer Science, University of Petroleum and Energy Studies, Dehradun 248007, India
5
CSE Department, Malla Reddy University, Hyderabad 500043, India
6
Department of Computer Applications, R.V.R. & J.C. College of Engineering, Chowdavaram, Guntur 522019, India
7
School of Creative Technologies, University of Bolton, Bolton BL3 5AB, UK
*
Authors to whom correspondence should be addressed.
Electronics 2022, 11(23), 4059; https://doi.org/10.3390/electronics11234059
Submission received: 29 October 2022 / Revised: 29 November 2022 / Accepted: 5 December 2022 / Published: 6 December 2022
(This article belongs to the Special Issue Internet of Things for Smart Grid)

Abstract

:
The passage of electric signals throughout the human body produces an electromagnetic field, known as the human biofield, which carries information about a person’s psychological health. The human biofield can be rehabilitated by using healing techniques such as sound therapy and many others in a smart grid. However, psychiatrists and psychologists often face difficulties in clarifying the mental state of a patient in a quantifiable form. Therefore, the objective of this research work was to transform human emotions using sound healing therapy and produce visible results, confirming the transformation. The present research was based on the amalgamation of image processing and machine learning techniques, including a real-time aura-visualization interpretation and an emotion-detection classifier. The experimental results highlight the effectiveness of healing emotions through the aforementioned techniques. The accuracy of the proposed method, specifically, the module combining both emotion and aura, was determined to be ~88%. Additionally, the participants’ feedbacks were recorded and analyzed based on the prediction capability of the proposed module and their overall satisfaction. The participants were strongly satisfied with the prediction capability (~81%) of the proposed module and future recommendations (~84%). The results indicate the positive impact of sound therapy on emotions and the biofield. In the future, experimentation using different therapies and integrating more advanced techniques are anticipated to open new gateways in healthcare.

1. Introduction

The human body functions based on the transmission of various signals both inside and outside the body. Electrical signals such as those recorded in Electroencephalogram (EEG), Electrocardiogram (ECG), and others that are easy to measure indicate the health condition of a human [1,2,3]. The human biofield is an electromagnetic energy field produced by these signals inside the human body, which is highly complex in nature and, thus, difficult to decode. Numerous studies have reported that interpreting the information carried by this biofield could bring a remarkable revolution in the field of healthcare. The biofield contains significant information related to both the physical health and the mental condition of an individual. Previous works have shown that by analyzing the human biofield, one can predict various health issues, such as the flu, thyroid and respiratory issues, heart-related problems, and possibly even cancer.
The human brain is responsible for the production of emotions and conditions, including sadness, anger, joy, and anxiety, to which an individual reacts accordingly. It has been reported that different portions of the human brain induce different emotions in real time, based on the electric signals in the human biofield. Information extracted from the biofield can be analyzed to identify the positive and negative psychology of a patient. Research has revealed the large influence of different psychology states on the daily life of humans. Particularly, a detailed study on the human biofield revealed that these emotional states are directly linked with the pattern of the energy field around humans, whereby the field’s patterns change as the psychology of an individual is altered. Various color codes have been identified for different emotional moods, which correspond to chakras and their relationship with psychological functions, as shown in Table 1 [4,5,6,7]. The variation in colors of the chakras can cause a deficiency or excess of psychological functions. Further, the colors of various chakra levels are representative of different emotional states and can help provide a clear and detailed understanding of an individual’s psychology.
Every individual has the desire to retain consistent happiness and a positive mindset, yet the environment and many other factors largely affect this balanced state in negative ways. Such effects cause negative mood and emotions, such as anger and sadness, that can further lead to poor concentration, depression, stress, anxiety, and other issues that complicate the daily life. Considering the direct relationship between human emotions and physical and mental health, maintaining a positive state of psychology is highly important. Research has shown that the human biofield of an individual changes with emotion, whereby negative emotions are indicated by different patterns in the human energy field. Healing is a process that helps to convert or improve an individual’s energy pattern and transform an unhealthy biofield into a healthy state. Numerous studies have proposed various healing methods of the human biofield, including Reiki, water therapy, acupressure, acupuncture, sound therapy, non-touchable therapy, among many others. This research specifically investigated sound therapy, with the help of emotion detection techniques, as a novel healing method [8,9,10].
While it is known that music can induce either positive feelings of joy or negative emotions like anger, the choice of music also largely depends on an individual’s current mood and situation. Research has disclosed that rhythm or musical beats not only affect emotions but also strongly impact the nervous system. The effect of music or rhythm can stimulate either passion or help calm an individual and achieve a peaceful state. The visible effects of sounds and related influences can be observed in the form of radiance that reveals energy absorbed by the physical body in some form, i.e., sound. The after-effects can be seen by visualizing the aura of an individual (compared to that before sound therapy), which can be used as an indicator to show if the physical body has been restored or if the bioenergy field has improved with a new electromagnetic field.
After a detailed study on the biofield and sound healing mechanisms, the present research was performed by integrating an emotion detection classifier. In this proposed mechanism, images of each participant were taken with a digital camera in real time and input into the system. Then, a designed algorithm based on artificial intelligence techniques was employed to identify the current psychology, mood, and emotion of the individuals. Following the proposed algorithm, if a negative mood such as anger or sadness was detected, a song from the selected playlist was played. Further, an image-processing technique was used to evaluate the biofield and determine the next steps. When a song was stopped, the system captured the image of the participants and evaluated their current emotion. If a person’s mood transformed from negative to positive, no new song was played, and the biofield image was calculated and analyzed by the automated systems. However, if no change in mood was detected, i.e., the participant still exhibited a negative emotion, the process was repeated until a positive emotion was identified. In the following section, a literature survey of previous research in this domain is presented, then the proposed methodology with mathematical justification is discussed. Subsequently, an analysis of the experimental results is provided, followed by the results, the discussion section, and a final conclusion.

2. Literature Review

This section elaborates on the previous studies in the field of emotion detection, biofield analysis, and sound therapy. Over the past decades, much research has been conducted to acquire a better understanding of human emotions and develop improved applications in different domains. Nowadays, dedicated emotion detection is a major area of research that aims to describe the interaction between humans and robots or machines. Filippini et al. reviewed thermal infrared imaging-based effective computing to achieve better human–robot interactions by understanding human emotions. The term ‘effective computing’ is now largely popular for computing emotions and other effective phenomena [1]. The results of the mentioned work can help to bridge the gap between understanding human emotions and communication with robots, thus supporting a natural interaction between robots and humans, especially those who find difficulty in expressing their true emotions.
Garcia-Garcia et al. provided a technological review and comparative study of popular emotion detection applications. The authors stated that effective computing is strongly linked to the correct detection of emotions, which can be detected through various means such as facial expressions, speech analysis, text analysis, body gestures and movements, physiological behavior, and so on [4]. This study highlighted various methods and applications for emotion detection along with their strength shortcomings and future recommendations. The authors also elaborated on the advantages of using multimodal methods along with the challenges associated with it. Overall, the researchers concluded that better outcomes can be achieved by using multimodal techniques; therefore, furher research is needed in this domain [4].
Seyeditabariet et al. proposed that the analysis of emotions via a text for emotion detection is a multi-class classification problem that needs advanced artificial intelligence methods. Supervised machine learning approaches have been used for sentiment analysis, since an abundance of data are now generated on social media platforms. The authors also concluded that there is much inefficiency in the current emotion classifiers due to the lack of quality data and the complex nature of emotional expression, and therefore, the development of improved hybrid approaches is critical [2]. Moreover, Gosai et al. proposed a new approach for emotion detection via textual data based on a natural language processing technique. The authors suggest a context-based approach can yield better results than context-free approaches and that semantic and syntactic data help to improve the prediction accuracy [8].
Wagh and Vasanth reviewed works on EEG signals for brain–computer interaction, which can be used to interact with the world and develop applications in the biomedical domain [3]. In addition, this work introduced a methodology to detect emotions via EEG signals that involves complex computing, including signal pre-processing, feature extraction, and signal classifications. However, this proposed technique requires wearable sensors and involves many uncertainties. In this same domain, i.e., emotion recognition, Dzedzickis et al. analyzed various technical articles and scientific papers on contact-based and contactless methods used for human emotion detection. The analysis was based on each emotion according to its detected intensity and usefulness for emotion classification [5]. The authors also elaborated about the emotion sensors along with their area of application, expected outcomes, and limitations associated with them. The authors concluded the article by providing a two-step procedure for detected emotion classification. Step one includes the selection of parameters and methods, whereas step two regards the selection of sensors. However, such techniques (EEG, ECG, Heart Rate, Respiration Rate, etc.) still suffer from many limitations, and the measurement of uncertainties, the lack of clear specifications for recognizing a particular emotion, etc., must be considered thoroughly for future applications using IoT and big data techniques. The use of multimodal techniques integrated with machine learning seems to be powerful for future applications [5].
A review article by Ko evaluated conventional approaches for facial emotion recognition and the respective algorithms for emotion recognition via visual information. Specifically, the deep learning and hybrid deep learning techniques were highlighted, and a detailed comparative study was performed using both video-sequence and still-image databases [9]. This article emphasized the limitations related to deep learning approaches that require huge datasets, large storage, and a high computing power [9]. In addition, the work indicated that micro-expressions are still very challenging to recognize due to their spontaneous occurrence. Tian et al. and Ming et al. conducted a facial expression analysis and found that the human face displays numerous expressions voluntarily and involuntarily, which can enhance the complexity of the accurate recognition of facial artifacts [11,12]. Specifically, [11] was the first to utilize FACS for recognizing facial expression, inspiring subsequent studies [13,14,15,16]. Some researchers focused on recognizing the action unit occurrence and intensity, while others aimed to identify the facial action unit points that further help to determine the emotions [17,18,19]. The two primary tasks for facial emotion recognition include facial feature extraction and emotion classification [20,21,22]. The existing facial emotion recognition techniques utilize numerous recognition patterns to categorize facial emotion per the extracted facial features, such as texture, appearance, geometry (location and shape of a feature), and a hybrid of these. The pioneer studies on facial feature extraction motivated subsequent works on facial emotion recognition, leading to the now widely used methods of regression, classification, and deep learning [12,23,24].
In Refs. [6,7,25] a detailed study on the human biofield, or Human Energy Field (HEF), is presented, which is a concept that dates back to ancient times. In 1939, Semyon Kirlian discovered Kirlian photography using a high-voltage supply to obtain the first auric image. After numerous studies and experiments, the existence of the human biofield and its correlation with human health was unfolded by Prof. Korotkov, who designed a technique called Gas Discharge Visualization (GDV). By making use of the GDV device, appreciable discoveries have been made in the field of healthcare, and numerous applications have been introduced using this technique. The human body is viewed as a mysterious box that contains a wealth of hidden information. Initially, energy signals obtained from EEGs, ECGs, and other similar methods were discovered and examined to understand the health conditions of an individual. Techniques based on such signal analysis are gaining popularity, as the readings offer pertinent information that can help save the life of an individual. More advanced discoveries, such as the human biofield, have revealed other mysterious information stored in the human body that is related to both the mental and the physical health of an individual.
In Ref. [26], the author stated that the human biofield is very complex, dynamic, and invisible in nature; therefore, its existence is still largely questioned. Yet, biotech researchers have provided various methodologies for the analysis as well as proofs of the existence of the biofield, from which alternative medicine research has emerged. The study of the biofield is an interdisciplinary approach based on of laws of meta-physics, biochemistry, biophysics, and many sub-fields. Changes in the biofield are attributed to changes in the environment, the presence of other individuals, and surrounding energies. Researchers claim that the most interesting finding thus far is the change in the biofield due to internal molecular changes in the human body, which validates the connection between human health and the biofield. Much research has been conducted in the past to predict human health based on changes in the biofield of an individual.
For instance, [27] revealed that the structure of the biofield drastically changes due to changes in human brain signals, specifically related to positive or negative thought processes. Hence, the biofield is also affected by changes in an individual’s thoughts and, thus, emotions. In response to varying situations in life, human emotions can rapidly change at a particular instant, which causes different regions of the brain to be activated and brain signals to be stimulated. This subsequently affects an individual’s electromagnetic field and, hence, alters the overall structure of the biofield.
Complementary and Alternative Medicine (CAM) researchers have discovered various healing therapies to rebalance an unstable human biofield. Such instability occurs due to the presence of negative thoughts or an imbalance in the energy state caused by environmental factors. Several methods to balance the energy field have been reported, including water, sound, acupressure, acupuncture, and other therapies. It is pertinent to detect an unstable energy field and appropriately heal the biofield, since human health and thought processes can be ill-affected by such instability. In addition to CAM, other techniques are available to analyze the biofield status, such as Bio Reflexography, RFI, Quantum Magnetic Resonance, to name a few (designed based on the GDV technique) [25,7].

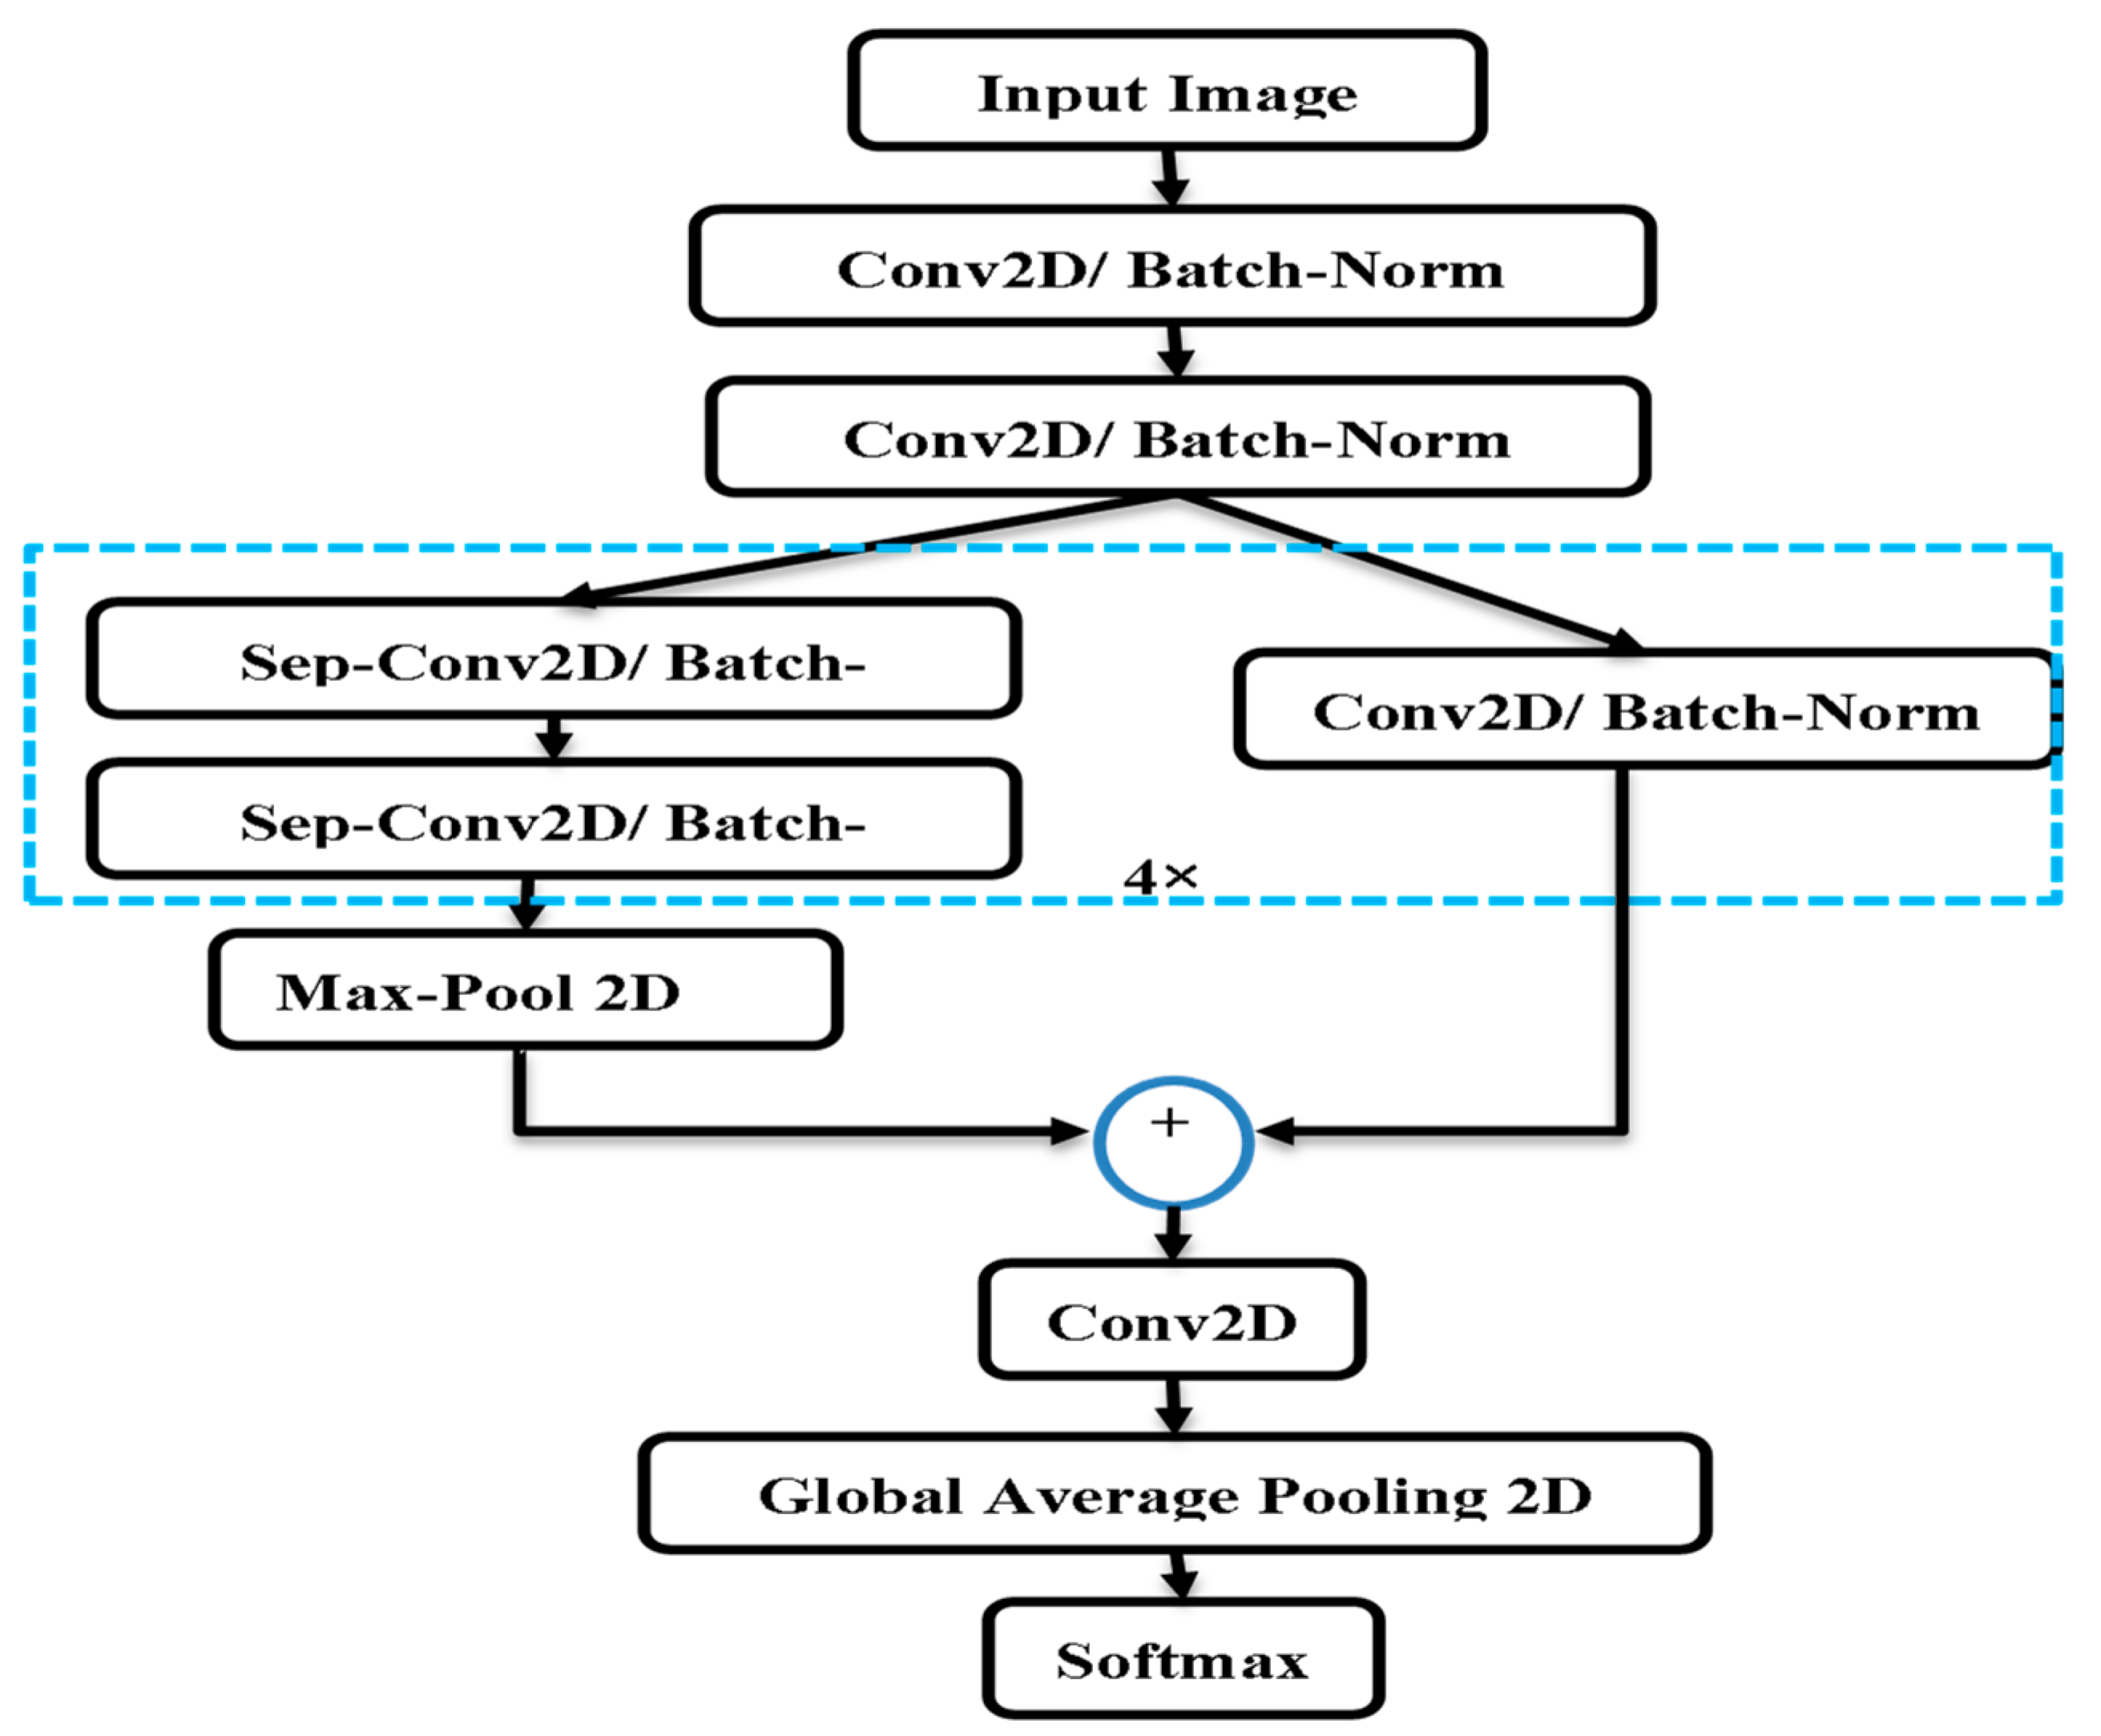
3. The Proposed Ensemble Model

This section describes the workflow of the proposed methodology. The biofield science is the foundation for understanding the complex, dynamic homeostasis regulation of a living system. Thus, a living system is the amalgamation of its biofield, biochemistry, quantum physics, and electromagnetic fields. As aforementioned, the human body comprises complex electromagnetic fields, ranging from low to high frequencies, that emanate from various organs. These frequencies contain information regarding the health of the organs, stress level, emotions, overall well-being, and other parameters.
For instance, the electromagnetic frequency emitted from the heart is responsible for the generation of facial expressions and artifacts. In terms of psychological state, positive emotions motivate an individual to consume knowledge from an external entity, supplying feelings of confidence and the capability to boost strength to perform any activity. On the other hand, negative emotions demotivate an individual, inducing feelings of insecurity and incompetence. Therefore, the objective of this work was to capture human facial artifacts and perform healing through sound healing therapy. The workflow of the proposed methodology is shown in Figure 1.
As displayed, the proposed algorithm first captured an image of an individual through a webcam. The captured image was utilized as input for the aura visualization algorithm and emotion recognition model. For emotion recognition, as shown in Figure 2, a modified CNN neural network was implemented, which was motivated by [24]. To obtain the desired results, this architecture included a fully connected CNN with nine convolution layers, ReLU, batch normalization, and global average pooling. To achieve the objective, the task was divided into two categories: (1) classification using the Haar cascade classifier to identify ROI in an image and (2) application of the Xception CNN model to predict emotions based on the evaluated probabilities. Subsequently, training and validation of the CNN model were performed via data augmentation, kernel regularizer, batch normalization, global average pooling, and depth-wise separable convolution.
For the aura analysis, the visualization color model was designed and implemented. Happy and Normal are considered positive emotions, while Surprise, Sad, Anger, Fear, and Disgust are considered negative emotions. Playlists associated with positive and negative emotions were appropriately created. When the interpreted biofield or recognized emotion was negative, then a song from the associated emotion playlist was played using a media player. After playing the song for 5 min, another image frame was captured and evaluated to detect any change in emotion. This process was repeated until a positive emotion was computed by the emotion and aura visualization algorithm (Figure 1). The nomenclature used in the proposed algorithm is detailed below and elaborated in Algorithm 1.
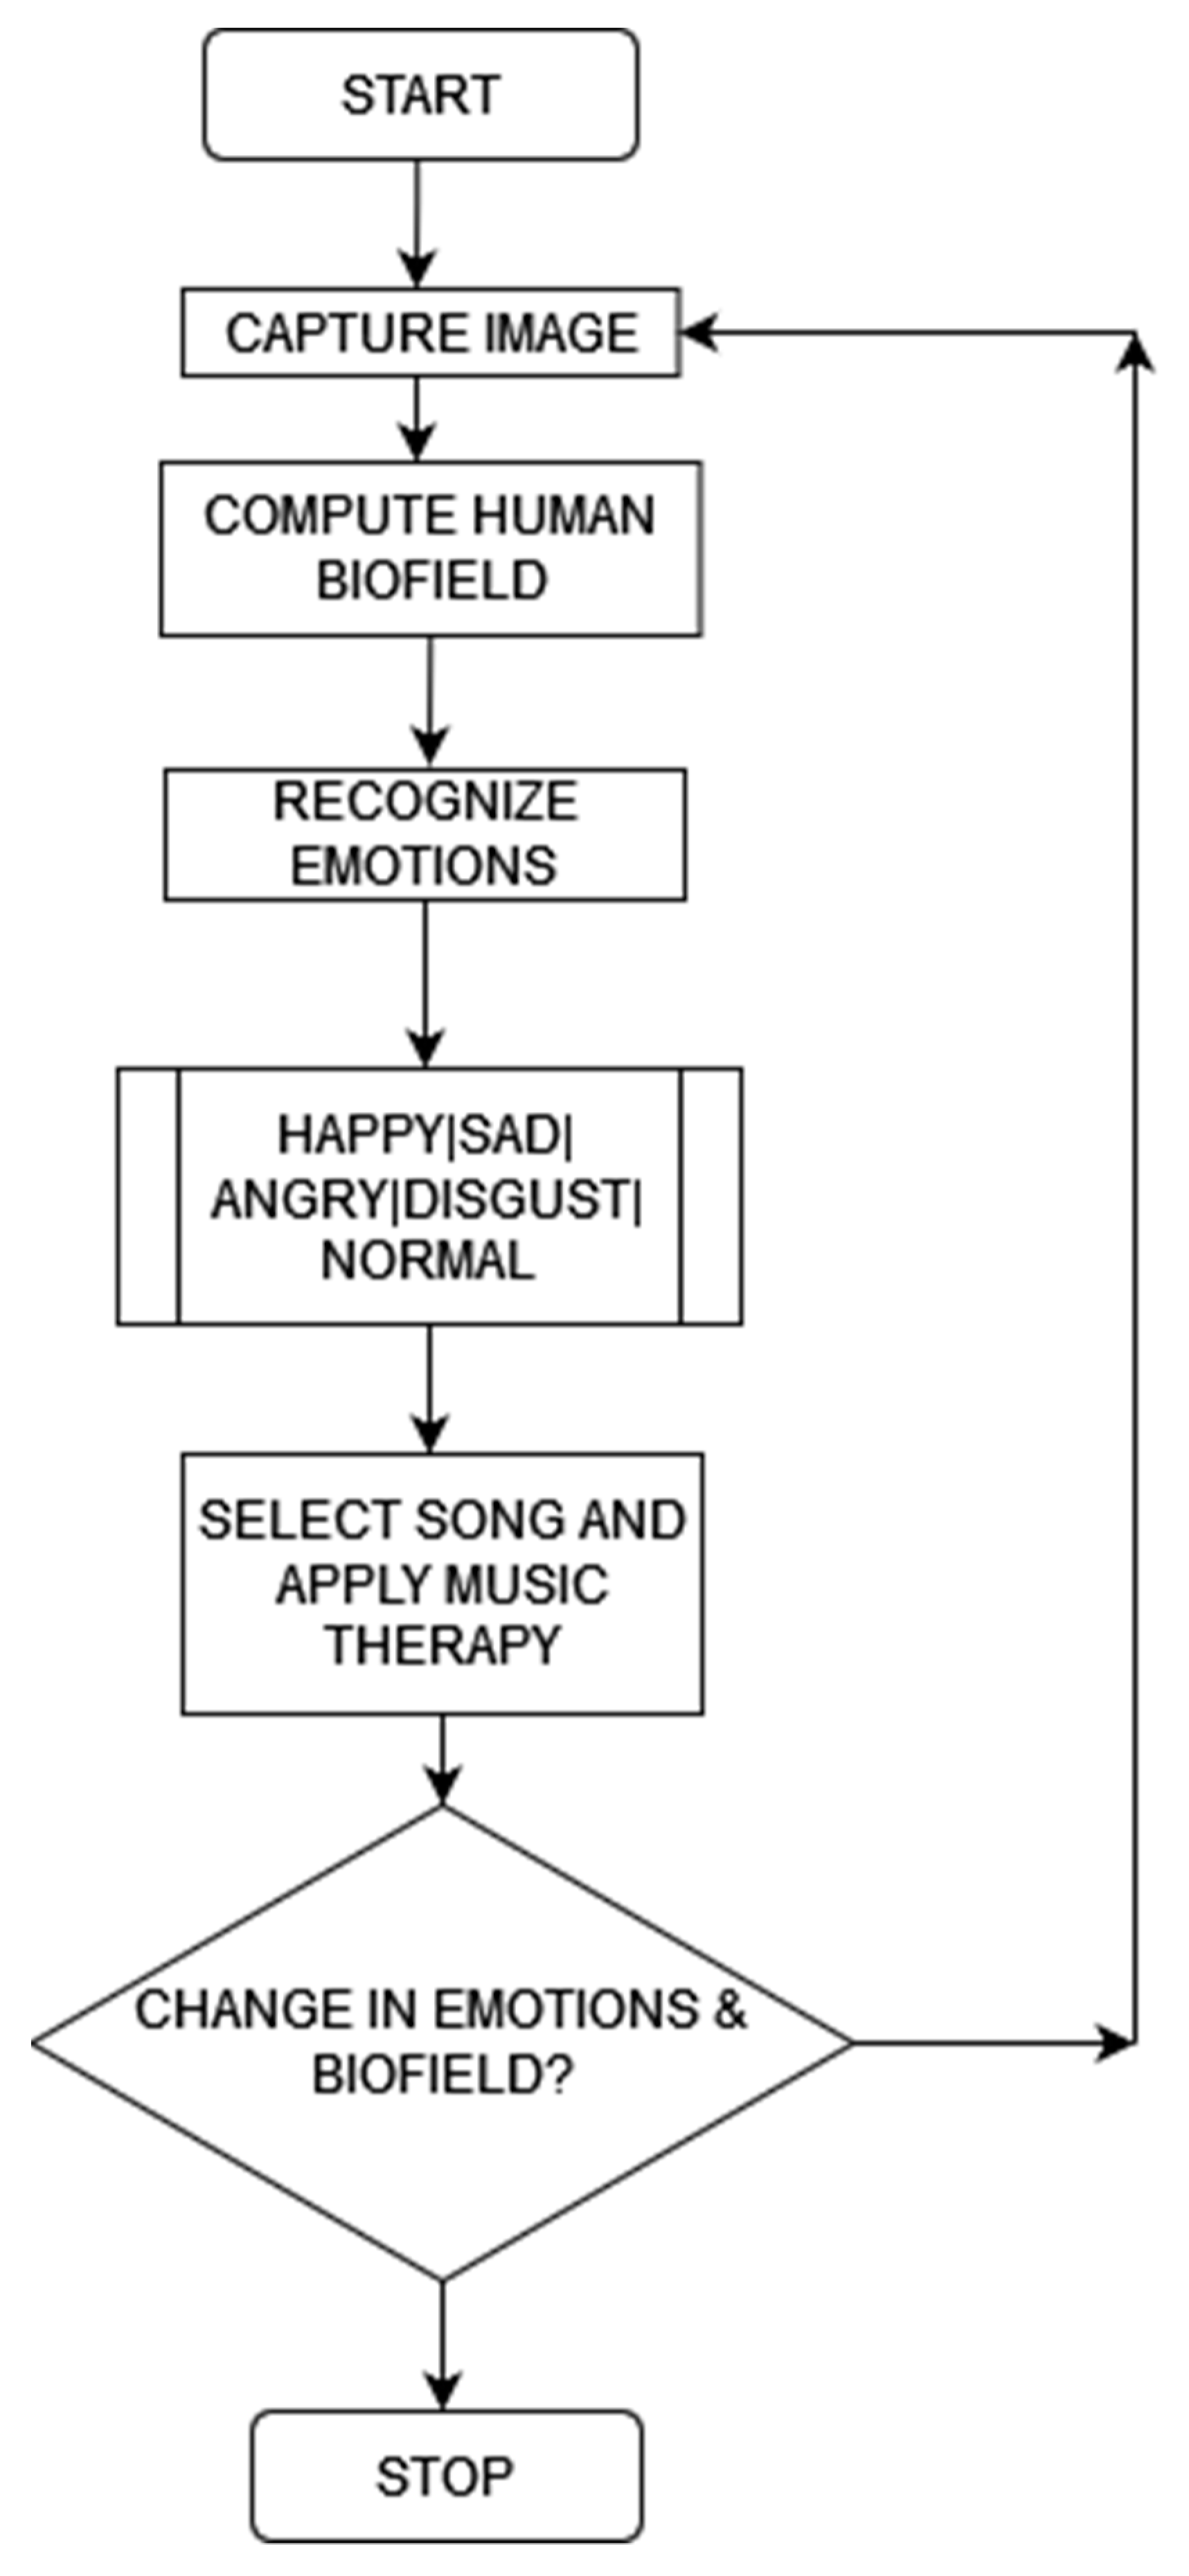
Algorithm 1: Algorithm of the proposed method.
Algorithm 1
Input: RGB image on an individual
Output: Healed individual biofield using sound therapy
Begin
 Capture the RGB image of an individual.
V i d c a p = c v 2 . V i d e o C a p t u r e ( 0 ) B g r _ i m g = V i d c a p . r e a d ( ) [ 1 ] G r a y _ i m a g e = c v 2 . c v t C o l o r ( B g r _ i m g ,   c v 2 . C O L O R _ B G R 2 G R A Y ) R g b _ i m g = c v 2 . c v t C o l o r ( B g r _ i m g ,   c v 2 . C O L O R _ B G R 2 R G B ) Identify   e m o t i o n _ t e x t , i . e . ,   emotion   and h u m a n _ a u r a , i.e. , human   biofield   of   an   individual . # emotion prediction e m o t i o n _ p r e d i c t i o n = e m o t i o n _ c l a s s i f i e r . p r e d i c t ( g r a y _ f a c e ) e m o t i o n _ p r o b a b i l i t y = n p . m a x ( e m o t i o n _ p r e d i c t i o n ) e m o t i o n _ l a b e l _ a r g = n p . a r g m a x ( e m o t i o n _ p r e d i c t i o n ) e m o t i o n _ t e x t = e m o t i o n _ l a b e l s [ e m o t i o n _ l a b e l _ a r g ]
    # for Human Biofield visualization
    mcolor((i − 1)× 6 + j, :) = [0, 0, 35];
    mcolor(i× 6 + j, :) = [i× 10, 0, 0];
    mcolor((i + 1)× 6 + j, :) = [1, 0, 35];
    mcolor((i + 2)× 6 + j, :) = [i× 20, 0, i× 20];
    mcolor((i + 3)× 6 + j, :) = [i× 10, i× 5, i× 5];
    mcolor((i + 4)× 6 + j, :) = [i× 10, 0, i× 4];
    mcolor((i − 1)× 6 + j, :) = [0, i× 10, 30];
    mcolor(i× 6 + j, :) = [0, i× 10, 30];
    mcolor((i + 1)× 6 + j, :) = [0, i× 10, 30];
    mcolor((i + 2)× 6 + j, :) = [ i× 10, 0, 0];
    mcolor((i + 3)× 6 + j, :) = [i× 10, 0, 0];
    mcolor((i + 4)× 6 + j, :) = [i× 10, 0, 0];
    mcolor((i − 1)× 6 + j, :) = [0, 0, i× 6];
    mcolor(i× 6 + j, :) = [0, i× 6, i× 6];
    mcolor((i + 1)× 6 + j, :) = [0, i× 6, 0];
    mcolor((i + 2)× 6 + j, :) = [i× 6, i× 6, 0];
    mcolor((i + 3)× 6 + j, :) = [i× 6 , 0, i× 6];
    mcolor((i + 4)× 6 + j, :) = [i× 6, 0, 0];
    for n = 1: wid
    for n1 = 1: hei
    InputIMG(n, n1, 1) = int16((InputIMG(n, n1, 1) + mcolor(grayIMG(n, n1) + 1, 1))/1.2);
    InputIMG(n, n1, 2) = int16((InputIMG(n, n1, 2) + mcolor(grayIMG(n, n1) + 1, 2))/1.2);
    InputIMG(n, n1, 3) = int16((InputIMG(n, n1, 3) + mcolor(grayIMG(n, n1) + 1, 3))/1.2);
    endend
Separate list of songs that are created as per the emotions, i.e., playlist_normal, playlist_happy, playlist_sad, playlist_angry, playlist_fear, playlist_surprise.
i = 0;
I f ( e m o t i o n _ t e x t = = s a d ) : S o n g = p l a y l i s t _ s a d [ i ] P l a y e r = x y z . M e d i a P l a y e r ( S o n g ) P l a y e r . p l a y ( )                 i = i + 1
//these if a statement is created for every emotion with their respective playlist.
Step 1 to step 4 are repeated until a change in an individual’s emotion, i.e., normal and happy, in the biofield is noticed.
//if a person is normal and happy, then songs from their respective playlist are played. If the next emotion is the same, then the aforementioned loop will break.
End

4. Mathematical Justification

This section describes the mathematical model of the proposed methodology. Let us consider Vidcap that captures an image frame from a live video streaming through a webcam.
V i d c a p = c v 2 .   V i d e o C a p t u r e ( 0 )
B g r _ i m g = V i d c a p . r e a d ( ) [ 1 ]
Gray_image= cv2.cvtColor(Bgr_img,cv2.COLOR_BGR2GRAY)
R g b _ i m g = c v 2 . c v t C o l o r ( B g r _ i m g ,   c v 2 . C O L O R _ B G R 2 R G B )
Equations (2) and (4) indicate that the captured image frame is converted to Bgr_img to Rgb_img for accurate analysis and reduce computational complexities. For emotion recognition, a CNN-based facial emotion recognition module was implemented, whereas for the aura visualization, an aura visualization algorithm was applied as mentioned in [25,7]. Let us consider that F a c i a l e m o t i o n is the CNN-based facial emotion recognition module that can predict the seven facial artifacts
F a c i a l e m o t i o n = { Happy ,   S a d ,   A n g r y ,   S u r p r i s e ,   F e a r ,   D i s g u s t ,   N o r m a l }
Consider that A u r a I n t e r is the aura visualizer module that can visualize and interpret the human biofield around the seven chakras. Past research revealed that the chakras are responsible for various types of positive and negative emotions [25,7]. The colors, each of which has its own significant meaning, indicate the state of emotion. Consider S o n g e m o t i o n as the playlist of songs per emotions
A u r a I n t e r = { C r o w n ,   T h i r d   e y e ,   T h r o a t ,   H e a r t ,   S o l a r ,   S a c r a l ,   R o o t }
Heart_Inter={Violet,Indigo,Blue,Green,Yellow,Orange,White,Pink,…n}
S o n g h a p p y = { h 1 , h 2 , h 3 , h n }
S o n g s a d = { s 1 , s 2 , s 3 , s n }
S o n g a n g r y = { a 1 , a 2 , a 3 , a n }
S o n g s u r p r i s e = { s p 1 , s p 2 , s p 3 , s p n }
S o n g f e a r = { f 1 , f 2 , f 3 , f n }
S o n g d i s g u s t = { d 1 , d 2 , d 3 , d n }
S o n g n o r m a l = { n 1 , n 2 , n 3 , n n }
Assume that Sad is the recognized facial emotion, and the overall interpreted aura is depressed, stressed, or impulsiveness.
E m o t i o n t e x t = { S a d }
A u r a V i s u = { d e p r e s s e d   o r   s t r e s s e d }
Using Equation (9), a song was chosen from the S o n g s a d playlist and was played using a media player. At the backend, a timer was simultaneously started. As soon as the timer reached its threshold value of 5 min, the song was stopped automatically. Then, the same procedure from Equations (1) to (16) was followed. Let us consider, again, that the recognized facial emotion was Sad and the overall interpreted aura was depressed, stressed, or impulsiveness. From Equations (17) and (18), the next song from the S o n g s a d playlist was played. This process was repeated until positive aura and emotions were observed. Suppose that the recognized facial emotion was Normal and the overall interpreted aura was Optimism or Peace.
E m o t i o n t e x t = { S a d }
A u r a V i s u = { d e p r e s s e d   o r   s t r e s s e d }
E m o t i o n t e x t = { N o r m a l }
A u r a V i s u = { o p t i m i s m   o r   p e a c e }
In this scenario, a song from the S o n g n o r m a l playlist was played using the media player. Using the proposed methodology in Equations (15)–(19), the positive and negative emotions of a person could be analyzed, and the change in the person’s emotions from negative to positive using sound therapy could be mathematically proven.

5. Results and Discussion

This section describes the results of the computed precision, recall, accuracy of emotion prediction, aura prediction, and healing through sound therapy. The polarities of emotion prediction, aura prediction, and healing through sound therapy are defined in Equations (21)–(23), respectively. Table 2 describes the confusion matrix.
P o l a r i t i e s E m o t i o n = { P r e d i c t i o n e m o t i o n   a b o v e   35   %   N o t i c e a b l e   I m p a c t   P r e d i c t i o n e m o t i o n 35   %   U n N o t i c e a b l e   I m p a c t
P o l a r i t i e s A u r a = { P r e d i c t i o n e m o t i o n   a b o v e   35   %   N o t i c e a b l e   I m p a c t   P r e d i c t i o n e m o t i o n 35   %   U n N o t i c e a b l e   I m p a c t
P o l a r i t i e s S o u n d = { P r e d i c t i o n e m o t i o n   a b o v e   35   %   N o t i c e a b l e   I m p a c t   P r e d i c t i o n e m o t i o n 35   %   U n N o t i c e a b l e I m p a c t
Subject: Healing through Sound Therapy
Opinion Holder: Participants for evaluation

5.1. Demography of the Participants

This section describes the demography of the participants in the experiment analysis. A total of 62 participants, chosen randomly (providing 411 samples after all the iterations), from anonymous fields, such as research organizations, student communities, and teaching fraternities, volunteered for this study. Before beginning the evaluation process, a consent letter was signed by all participants through personal visits and hardcopy delivery. The demographic information of the participants is presented in Table 3. The reason behind the random selection from various age groups and backgrounds was that the psychological nature of an individual varies accordingly. At different stages of life, mind and body behave differently.

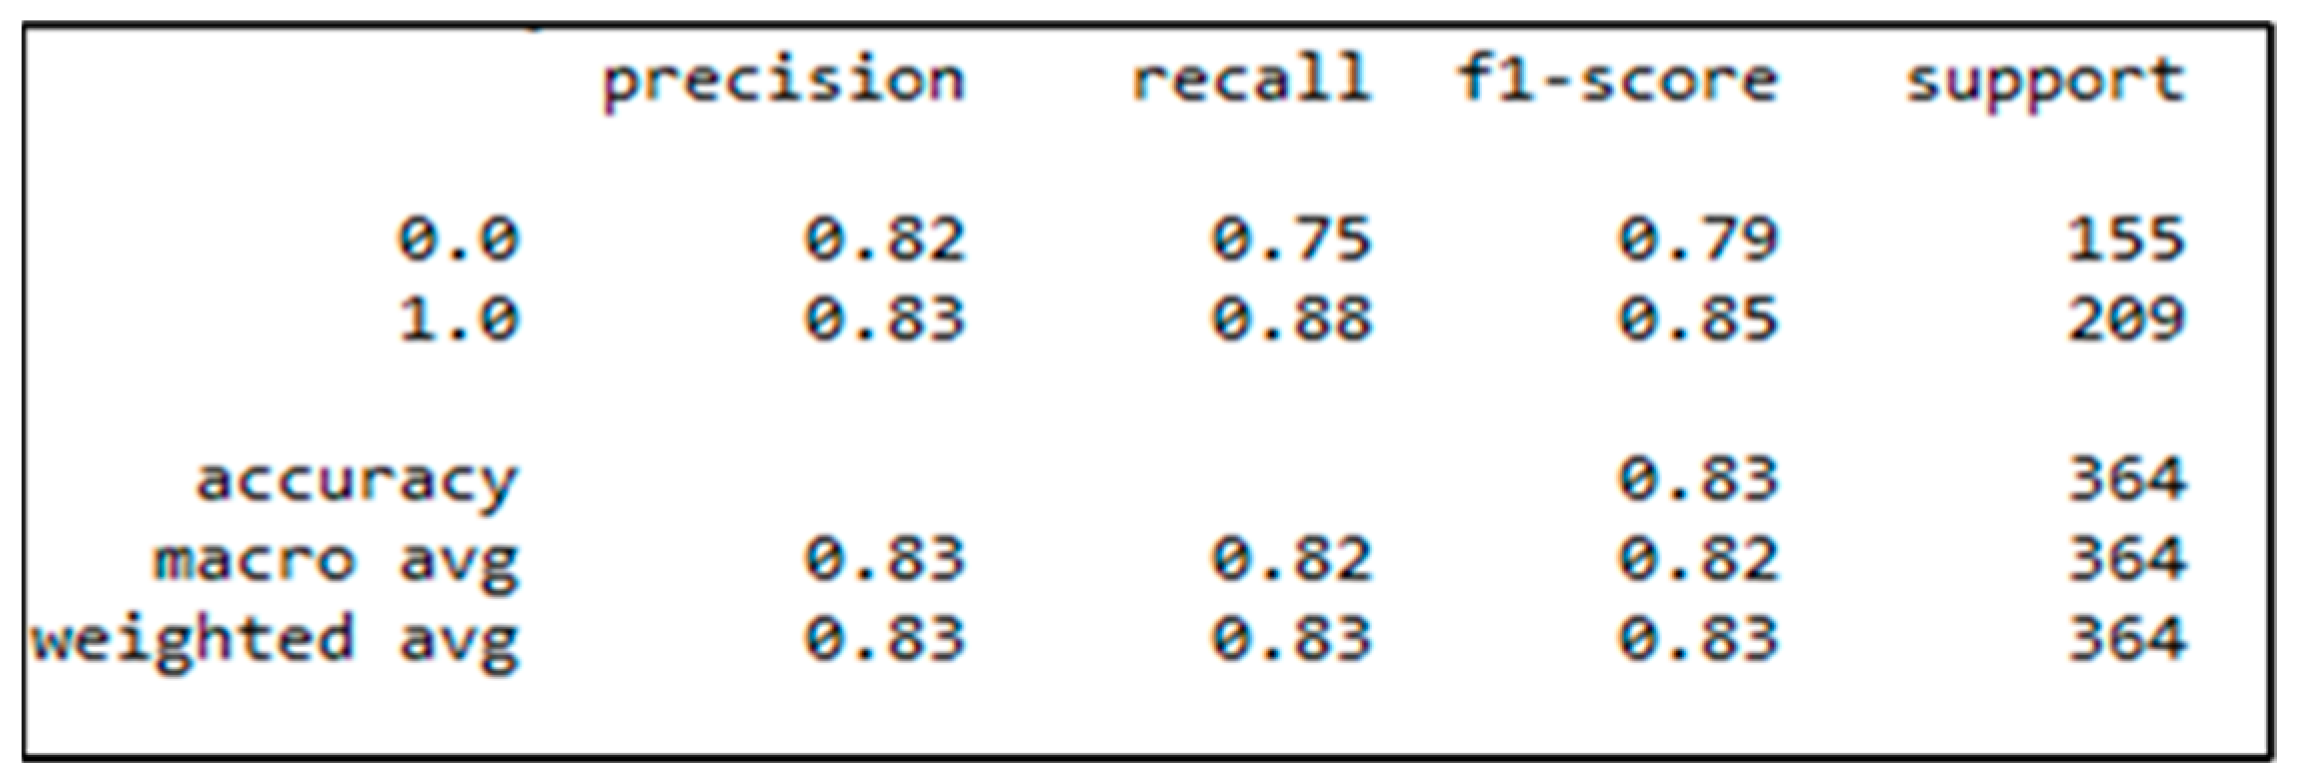
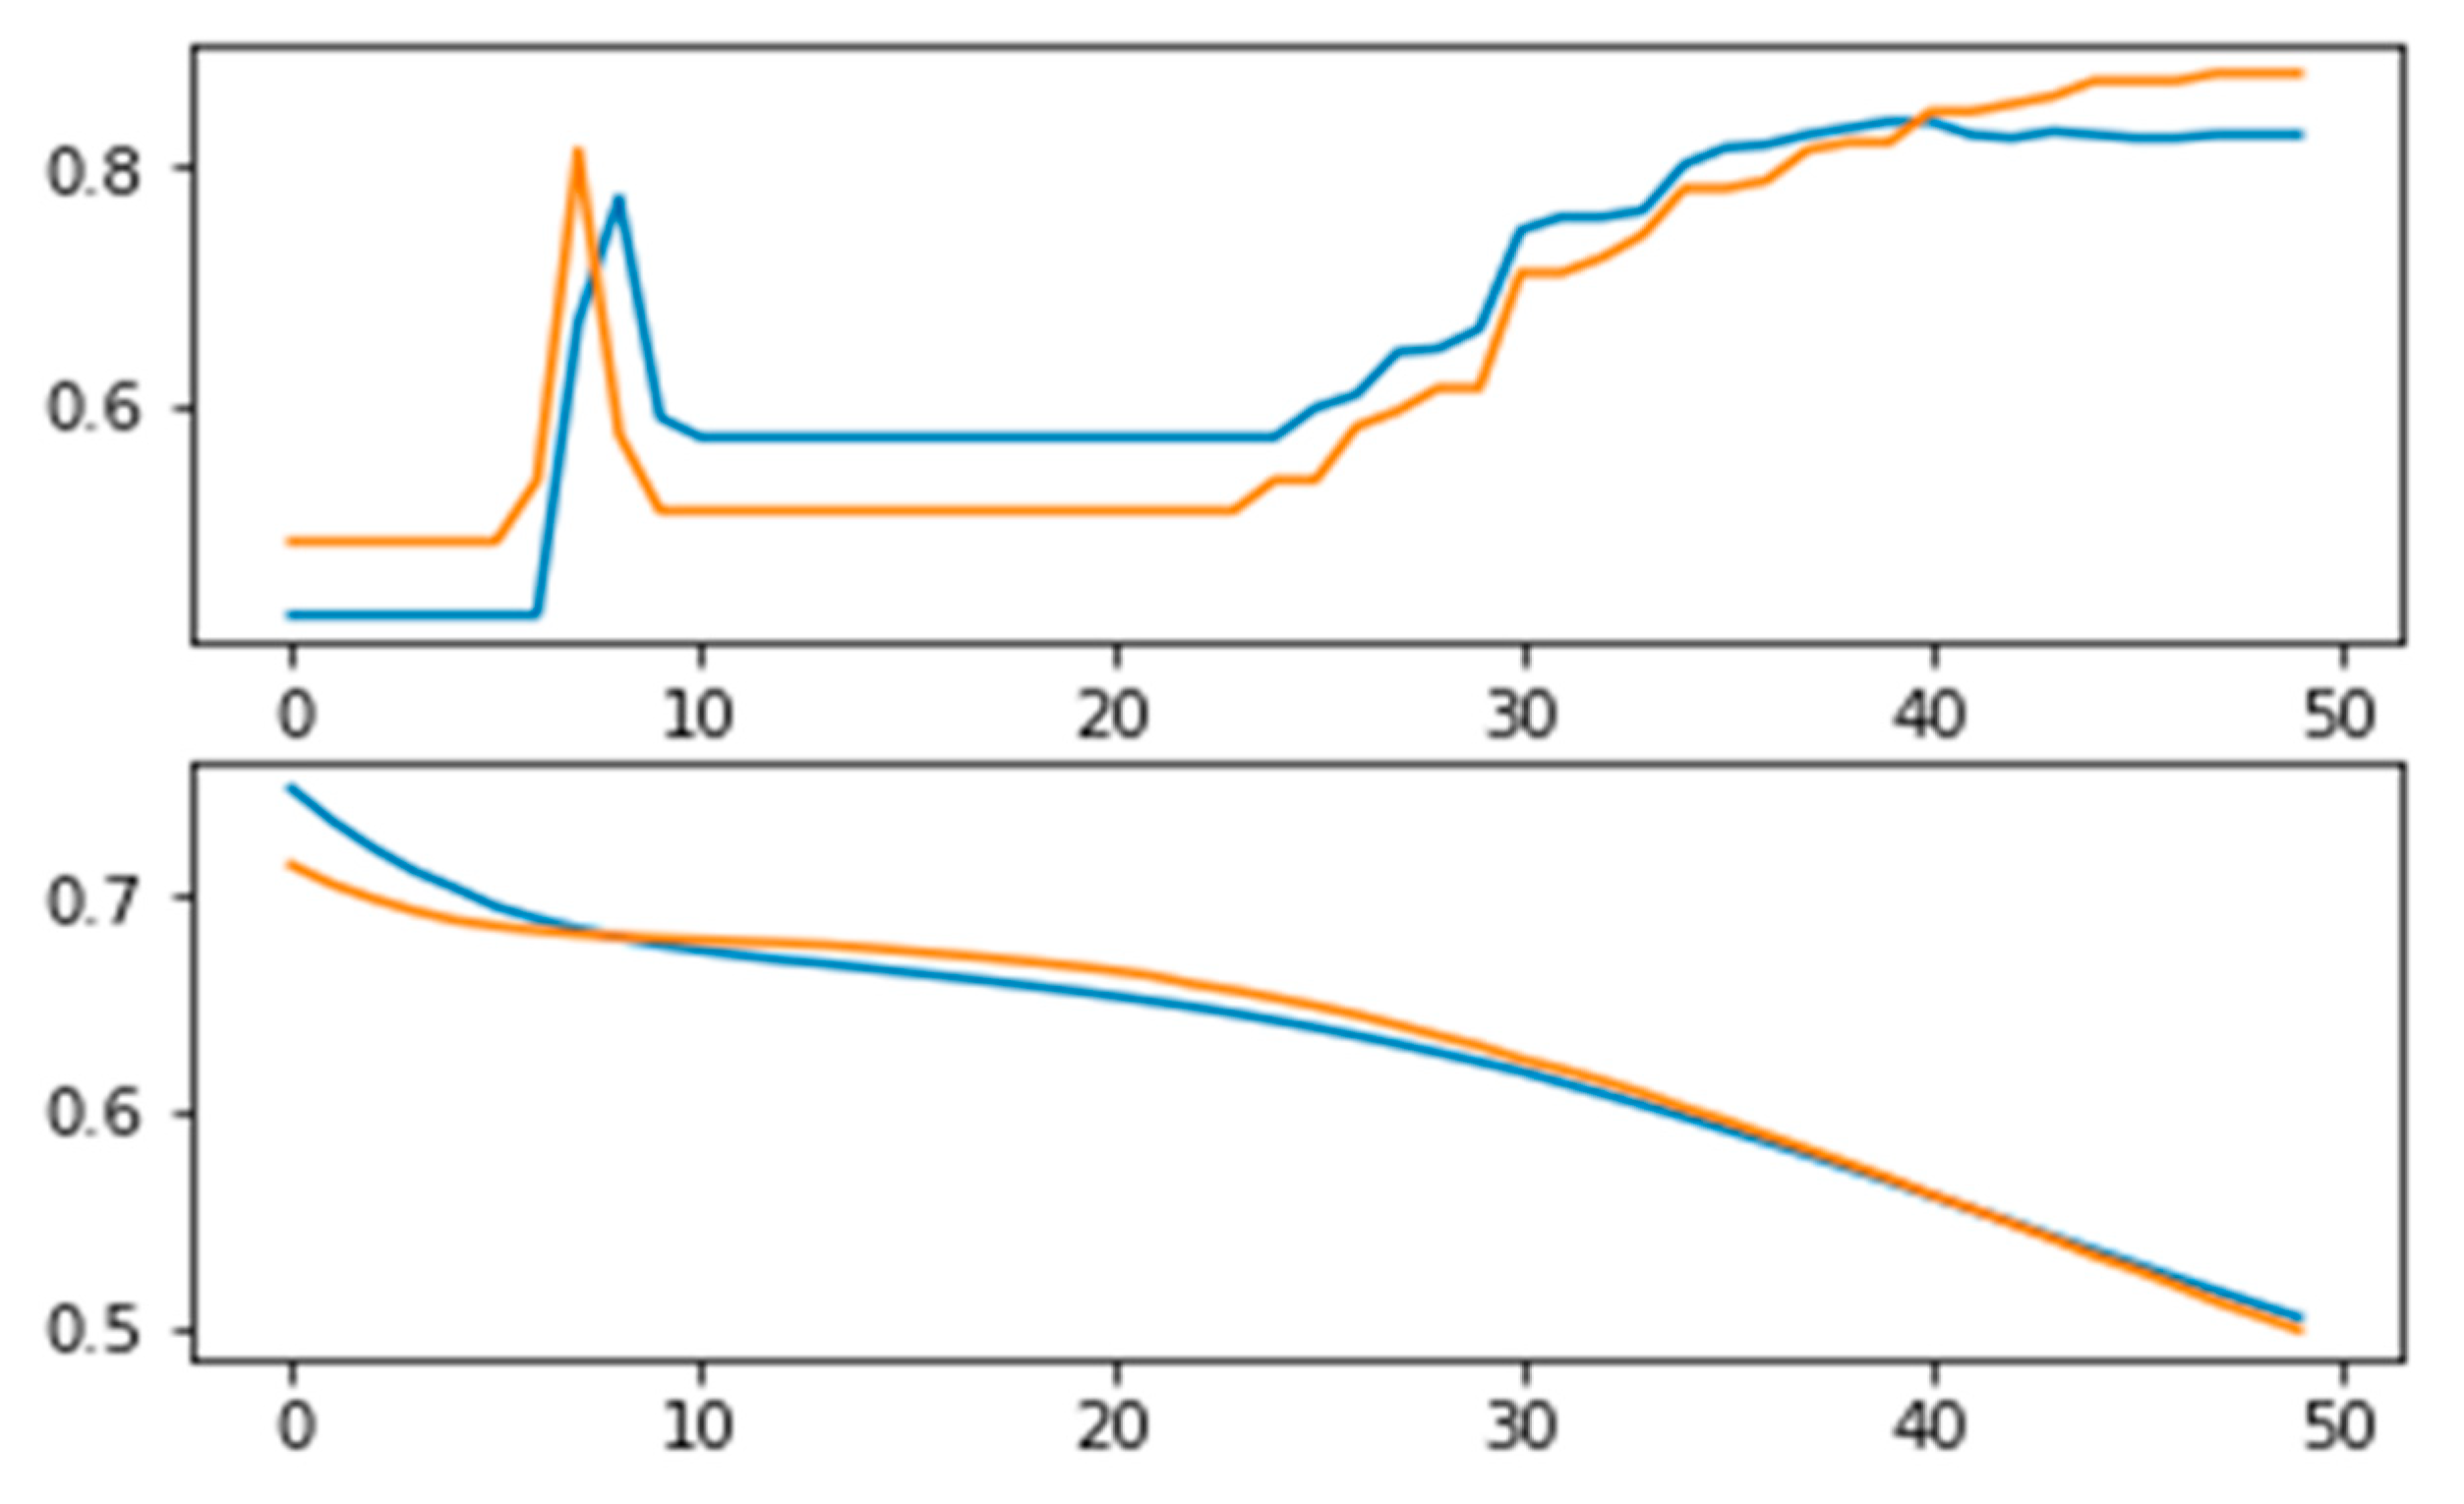
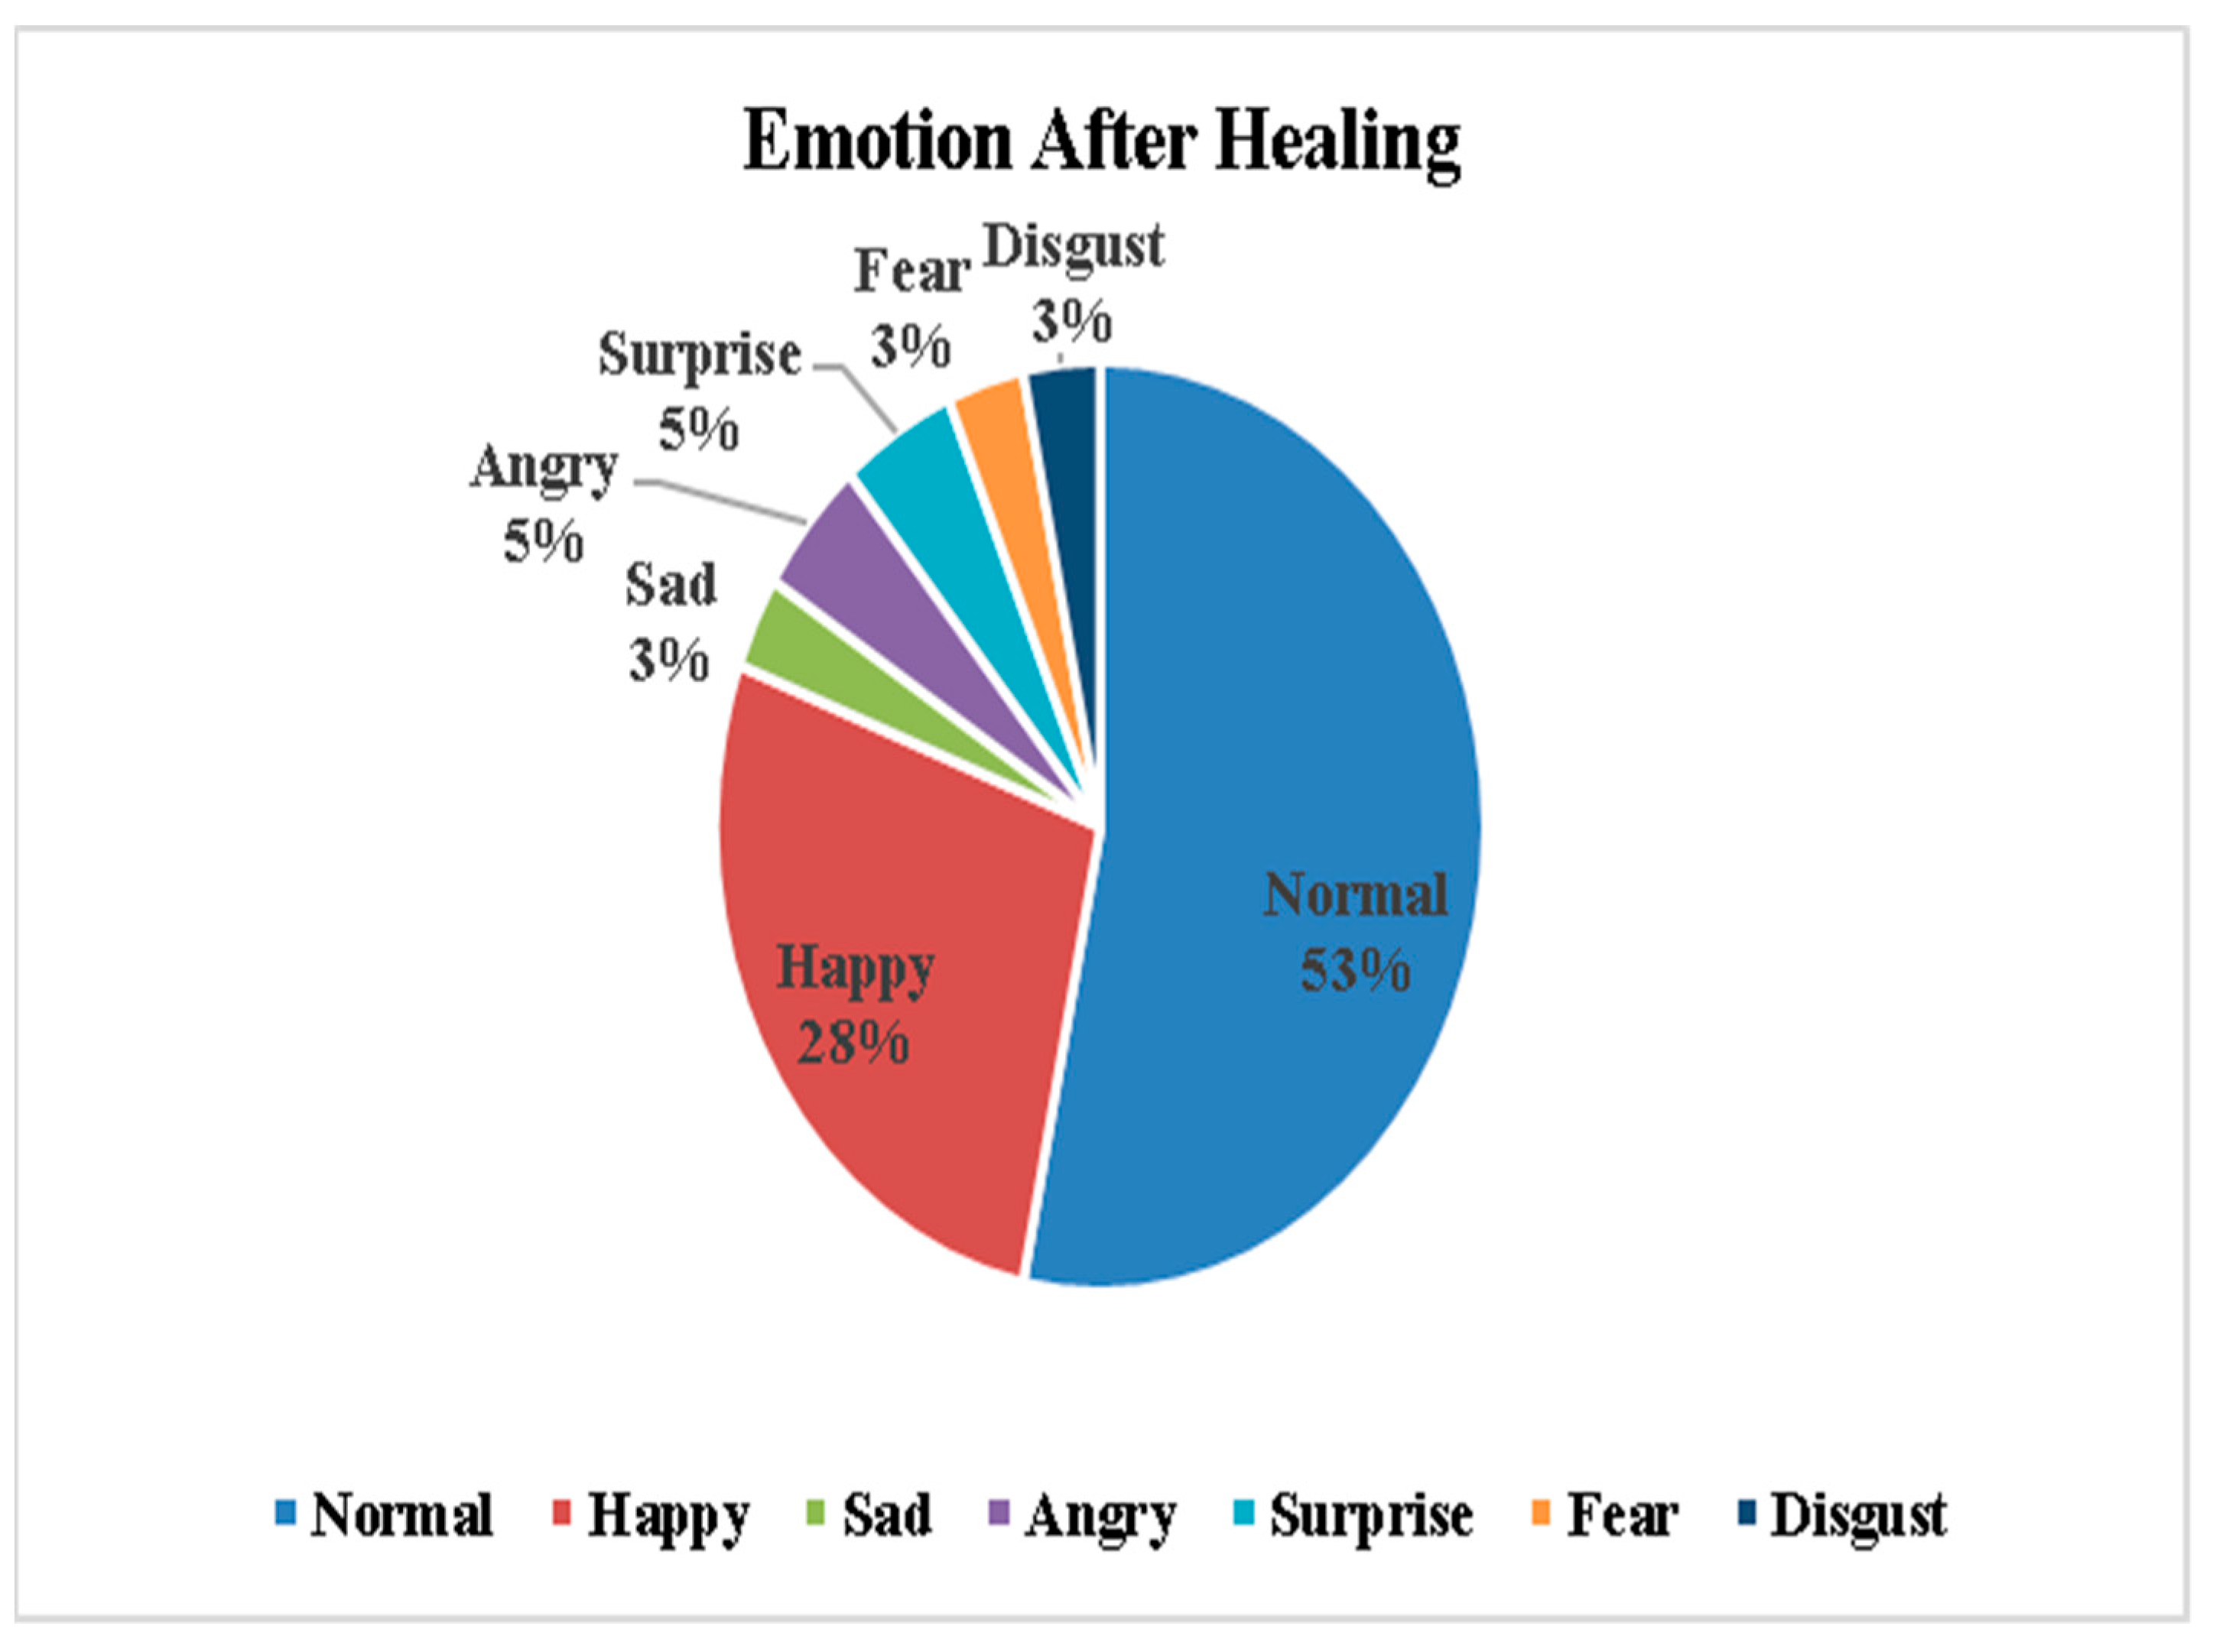
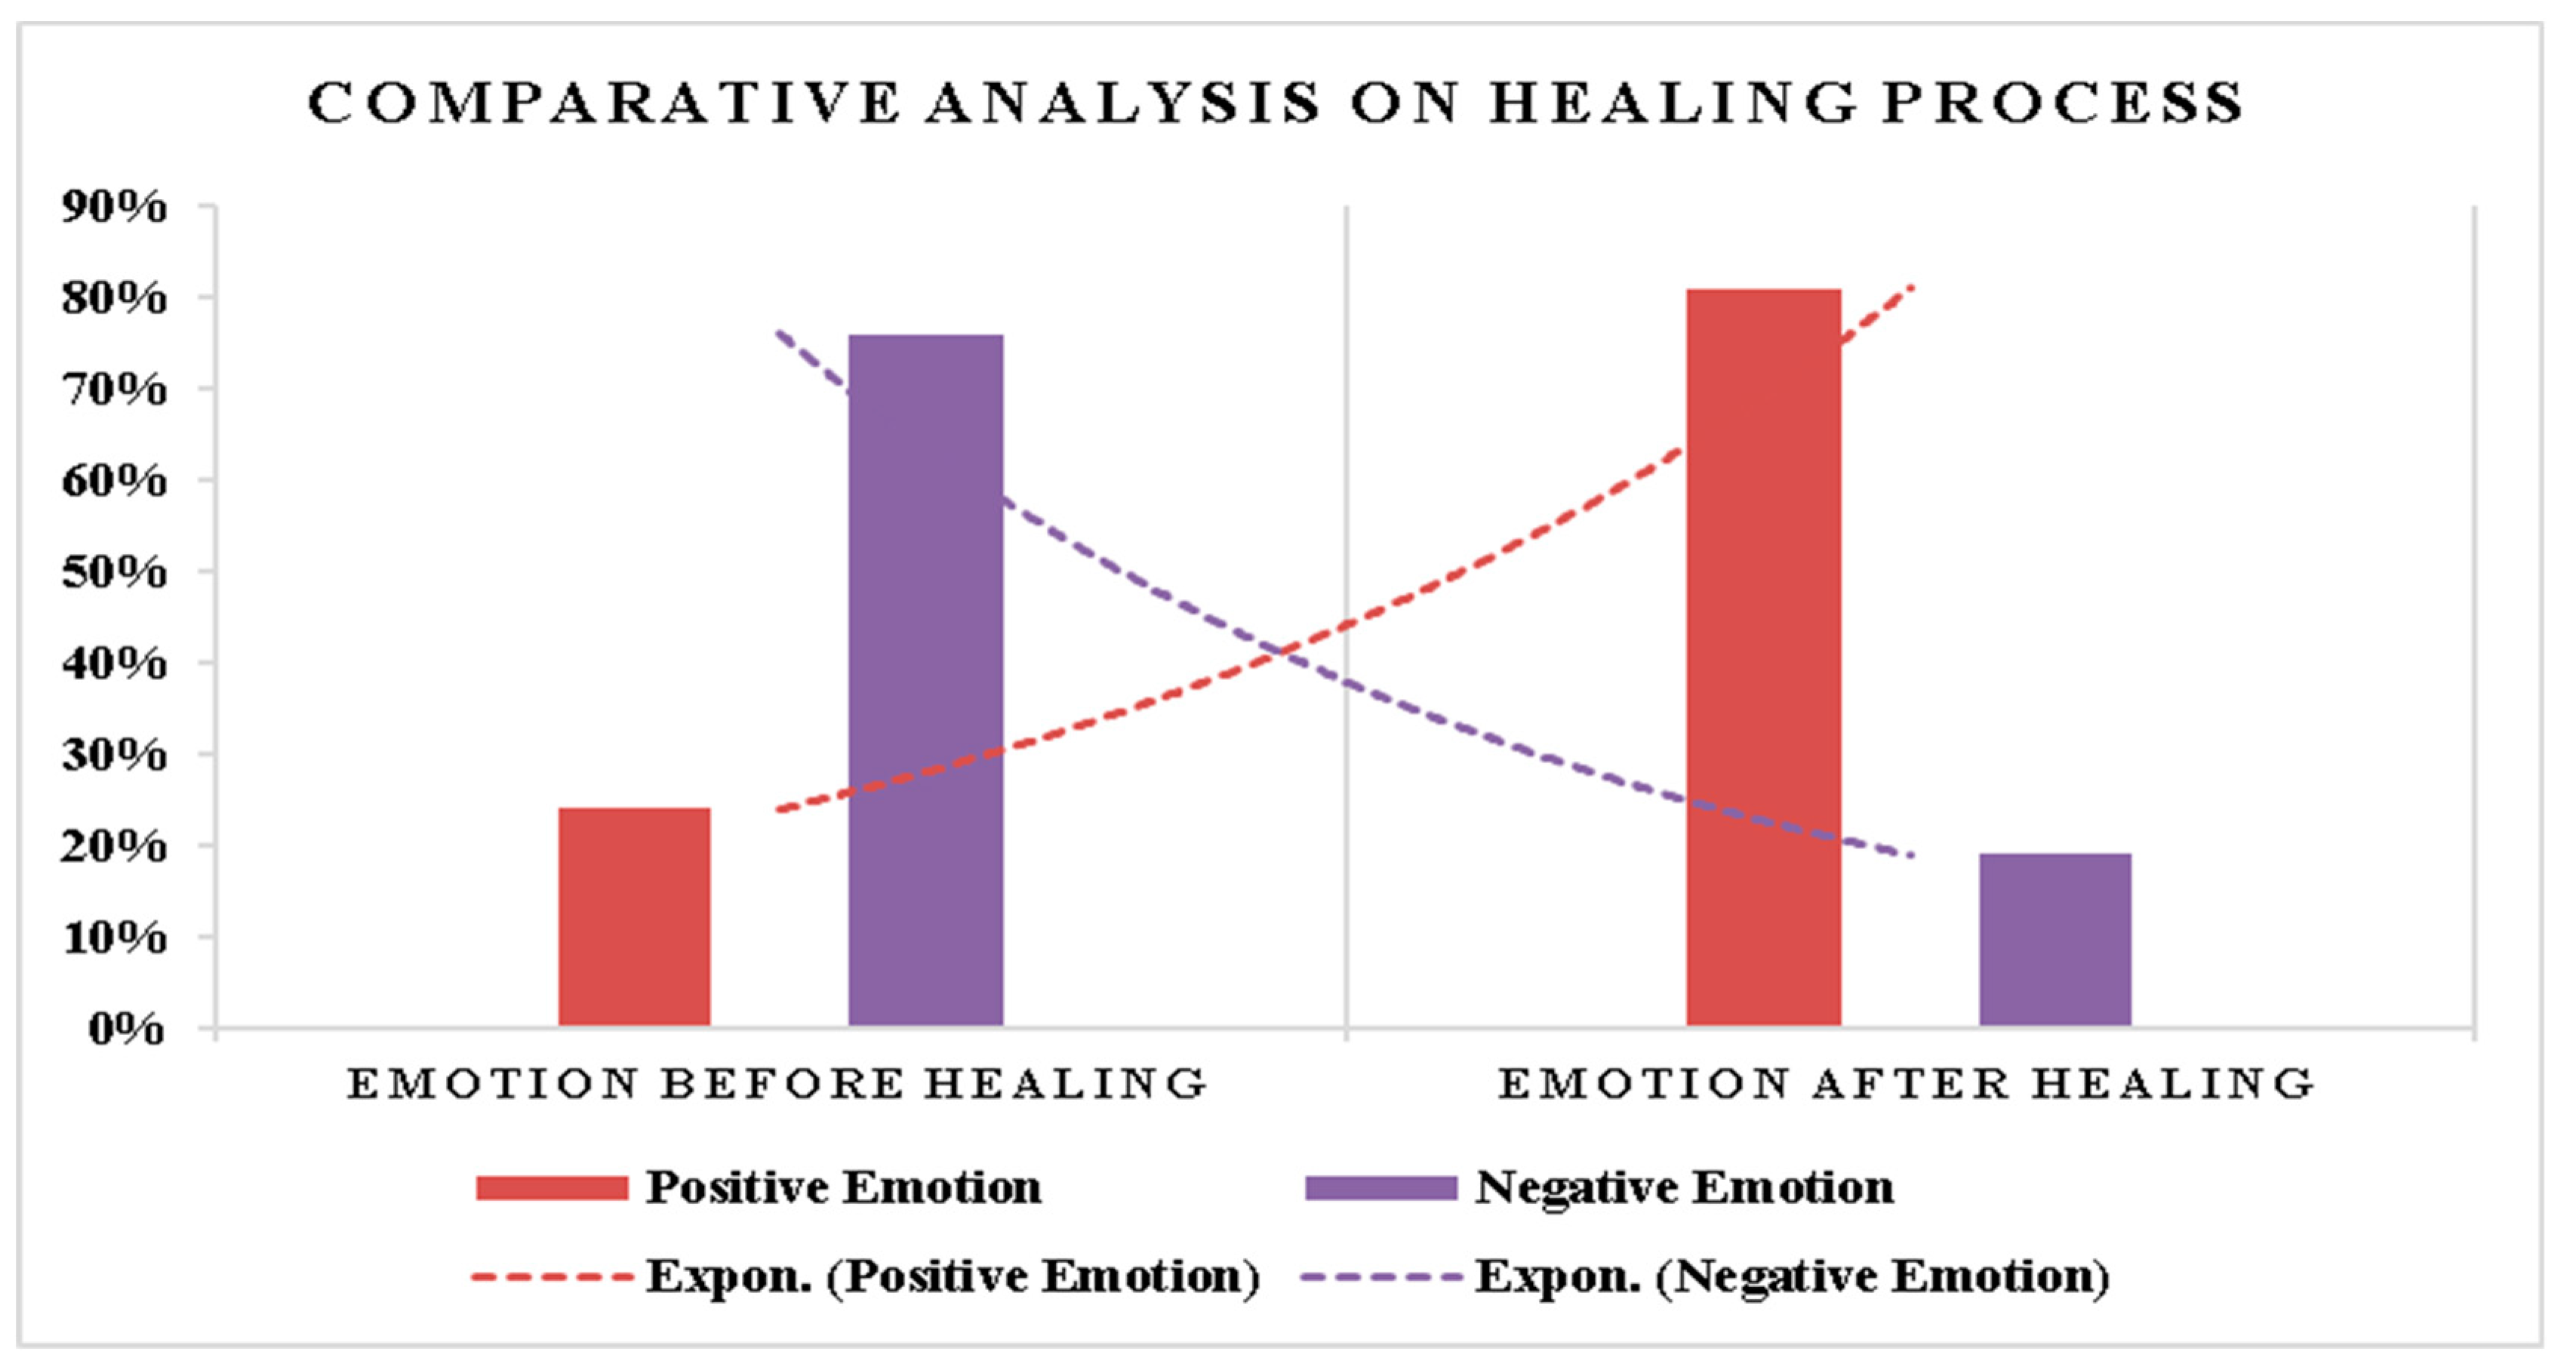
5.2. Result Analysis

This section presents the results analysis of the experiments performed with the above-mentioned participants to determine the effectiveness of healing negative energy through sound therapy.
P r e c i s i o n p r e d i c t = T r u e P o s i t i v e T r u e P o s i t i v e + F a l s e P o s i t i v e
R e c a l l p r e d i c t = T r u e P o s i t i v e T r u e P o s i t i v e + F a l s e N e g a t i v e
A c c u r a c y p r e d i c t = T r u e P o s i t i v e + T r u e N e g a t i v e T r u e P o s i t i v e + F a l s e P o s i t i v e + T r u e N e g a t i v e + F a l s e N e g a t i v e
In the above equations, precision indicates the accurate prediction of positive cases, recall refers to the proportion of accurate prediction, and accuracy is the accurate prediction of both positive and negative cases. For quantifying the prediction model, the feedback from the participants was used as the control parameters, and the healing process through sound therapy was applied as a predictive model. Considering the total of 62 participants and healing as an iterative process, the total number of samples for the experiment was 411. Figure 3 describes the classification matrix for the emotion module, supposing T h r e s h o l d v a l u e = 2 . From these results, the predictive accuracy and recall of the emotion module were determined to be 83% and 83%, respectively.
The graphs in Figure 4 reveal the high accuracy and reduced loss during the training and validation of the data.
Similarly, the predictive accuracy for the human biofield module was quantified for T h r e s h o l d v a l u e = 2 , resulting in the classification matrix in Figure 5. The predictive accuracy and recall of the human aura module were both determined to be 72%.
The graphical representation in Figure 6 illustrates the accuracy and loss graphs obtained after performing training and validation for the human aura module. Likewise, the predictive accuracy for the combined emotion and aura modules was quantified for T h r e s h o l d v a l u e = 2 , and the resulting classification matrix is presented in Figure 7. The predictive accuracy and recall of the combined emotion and aura modules were determined to be 88% and 88%, respectively, hence demonstrating that the hybrid approach provided better results. Figure 8 and Figure 9 present the training and validation loss and accuracy graphs, respectively.
The comparative analysis of the predictive models, i.e., Emotion Recognition Module, Aura Visualization Module, and Emotion_Aura Module, is shown in Figure 10. The participants’ feedback was used for further analysis based on the satisfaction level, i.e., prediction (emotion and human biofield) and overall satisfaction (including the healing process and future recommendations). The feedback analysis revealed that 81% of the participants were strongly satisfied with the prediction capability, and 84% were satisfied with the healing process and future recommendations of the proposed module (Figure 11).
Figure 12 and Figure 13 demonstrate the overall percentage of emotions before and after healing. Before healing, 47 participants exhibited negative emotions, and 15 displayed positive emotions. After healing through sound therapy, the number of participants with negative emotions decreased by 35 participants (resulting in 12 participants, 57%), and the number with positive emotions increased by 35 participants (resulting in 50 participants). Subsequently, a comparative analysis of these results validated that sound therapy had a positive impact on healing the negative aura of the participants, as shown in Figure 14.
Furthermore, Figure 15 and Figure 16 display the effects before and after sound therapy on the human biofield, in which dark colors represent negative emotions, and lighter colors indicate positive emotions. The meaning of each color is provided in Table 1 (elaborated in previous sections). The change in color shows the effectiveness of sound therapy on the human body and mind. Secondly, these outcomes highlight that a better understanding of the effects of sound on the psychological status of humans can be achieved by visualizing the human biofield. This study expands our knowledge and could also improve cybersecurity and possibly enhance healthcare delivery [10,28,29,30].

5.3. Limitations and Future Enhancements

This section discusses the limitation of this study. The experiments were conducted under various constraints and with certain limitations. Firstly, the experiments were performed in a static and controlled environment using a closed room with a static background. Hence, the results may vary in a dynamic environment. The results can be improved using the latest techniques of Artificial Intelligence and Machine learning. There is a possibility of various errors such as instrumentation noise, selection bias, and others during the experiment analysis. Thus, to validate the results, the experiments were performed in different stages, with different combinations of individuals.

6. Conclusions

This work examined the effect of sound therapy as a method to heal negative emotions based on rebalancing the chakras. Predictive analysis was performed on a CNN-based emotion recognition module, aura visualizer color–space module, and a module combining both emotion and aura. Based on the quantification results, the accuracies of the respective modules were determined to be approximately 83%, 72%, and 88%. The feedback from the participants was recorded and analyzed according to two satisfaction levels: prediction (emotion and human biofield) and overall satisfaction (healing process and future recommendations). The findings indicated that 81% of the participants were strongly satisfied with the prediction capability and 84% were strongly satisfied with the healing process and future recommendations of the proposed module. Additionally, the effectiveness of the healing process was examined and quantified according to the participants’ emotion profiles before and after sound therapy. The experimental analysis revealed that 24% of the participants showed positive emotions, and 76% had negative emotions before healing. After healing through sound therapy, there was a 57% increase in positive emotions, i.e., 81% of all participants experienced positive emotions. Considering that 57% of the participants’ inner perceptions and feelings were altered in this study, it can be concluded that sound therapy has an effective impact on healing negative emotions.

Author Contributions

Conceptualization, E.M.O. and S.M.; Methodology, S.K.; Validation, C.I.; Formal analysis, E.M.O. and M.G.; Investigation, S.K. and M.G.; Data curation, G.C.; Writing—original draft, G.C. and S.K.; Writing—review & editing, C.I.; Project administration, S.M. All authors have read and agreed to the published version of the manuscript.

Funding

The authors received no specific funding for this study.

Institutional Review Board Statement

Not applicable.

Informed Consent Statement

Not applicable.

Data Availability Statement

Not applicable.

Conflicts of Interest

The authors declare no conflict of interest.

Nomenclature

V i d c a p Captures the image frame from the video.
B g r _ i m g Reads the captured image frame in BGR format.
G r a y _ i m a g e Converts the BGR image into a grayscale image.
R g b _ i m g Converts the BGR image into an RGB image.
F a c i a l e m o t i o n Set of emotions predicted by the emotion recognition module.
A u r a I n t e r Set of seven chakras around which the aura is interpreted.
H e a r t I n t e r Set of colors responsible for expression or facial artifacts prediction.
S o n g h a p p y Playlist for the happy emotion.
S o n g s a d Playlist for the sad emotion.
S o n g a n g r y Playlist for the angry emotion.
S o n g s u r p r i s e Playlist for the surprise emotion.
S o n g f e a r Playlist for the fear emotion.
S o n g d i s g u s t Playlist for the disgust emotion.
S o n g n o r m a l Playlist for the normal emotion.
E m o t i o n t e x t Name of the emotion predicted by the emotion recognition module.
Aura V i s u Contains the interpreted aura by the aura visualization module.

References

  1. Filippini, C.; Perpetuini, D.; Cardone, D.; Chiarelli, A.M.; Merla, A. Thermal infrared imaging-based affective computing and its application to facilitate human robot interaction: A review. Appl. Sci. 2020, 10, 2924. [Google Scholar] [CrossRef] [Green Version]
  2. Seyeditabari, A.; Tabari, N.; Zadrozny, W. Emotion detection in text: A review. arXiv 2018, arXiv:1806.00674. [Google Scholar]
  3. Wagh, K.P.; Vasanth, K. Electroencephalograph (EEG) based emotion recognition system: A review. In Innovations in Electronics and Communication Engineering; Springer: Singapore, 2019; Volume 33, pp. 37–59. [Google Scholar]
  4. Garcia-Garcia, J.M.; Penichet, V.M.; Lozano, M.D. Emotion detection: A technology review. In Proceedings of the XVIII international conference on human computer interaction, Cancun, Mexico, 25–27 September 2017; pp. 1–8. [Google Scholar]
  5. Dzedzickis, A.; Kaklauskas, A.; Bucinskas, V. Human emotion recognition: Review of sensors and methods. Sensors 2020, 20, 592. [Google Scholar] [CrossRef] [PubMed] [Green Version]
  6. Chhabra, G.; Prasad, A.; Marriboyina, V. Novice methodology for detecting the presence of Bio-Field. Int. J. Pure Appl. Math. 2018, 118, 149–154. [Google Scholar]
  7. Chhabra, G.; Prasad, A.; Marriboyina, V. Comparison and performance evaluation of human bio-field visualization algorithm. Arch. Physiol. Biochem. 2019, 128, 321–332. [Google Scholar] [CrossRef] [PubMed]
  8. Gosai, D.D.; Gohil, H.J.; Jayswal, H.S. A review on a emotion detection and recognization from text using natural language processing. Int. J. Appl. Eng. Res. 2018, 13, 6745–6750. [Google Scholar]
  9. Ko, B.C. A brief review of facial emotion recognition based on visual information. Sensors 2018, 18, 401. [Google Scholar] [CrossRef] [PubMed]
  10. Onyema, E.M.; Dalal, S.; Romero, C.A.T.; Seth, B.; Young, P.; Wajid, M.A. Design of Intrusion Detection System based on Cyborg intelligence for security of Cloud Network Traffic of Smart Cities. J. Cloud Comp 2022, 11, 1–20. [Google Scholar] [CrossRef]
  11. Tian, Y.I.; Kanade, T.; Cohn, J.F. Recognizing action units for facial expression analysis. IEEE Trans. Pattern Anal. Mach. Intell. 2001, 23, 97–115. [Google Scholar] [CrossRef] [PubMed] [Green Version]
  12. Ming, Z.; Rouas, J.; Shochi, T. Facial Action Units Intensity Estimation by the Fusion of Features with Multi-kernel Support Vector Machine. In Proceedings of the 2015 11th IEEE International Conference and Workshops on Automatic Face and Gesture Recognition (FG), Ljubljana, Slovenia, 4–8 May 2015; Volume 6, pp. 1–6. [Google Scholar]
  13. Gudi, A.; Tasli, H.E.; Den Uyl, T.M.; Maroulis, A. Deep learning based facs action unit occurrence and intensity estimation. In Proceedings of the 2015 11th IEEE International Conference and Workshops on Automatic Face and Gesture Recognition (FG), Ljubljana, Slovenia, 4–8 May 2015; Volume 6, pp. 1–5. [Google Scholar]
  14. Taheri, S.; Qiu, Q.; Chellappa, R. Structure-preserving sparse decomposition for facial expression analysis. IEEE Trans. Image Process. 2014, 23, 3590–3603. [Google Scholar] [CrossRef] [PubMed] [Green Version]
  15. Valstar, M.F.; Almaev, T.; Girard, J.M.; McKeown, G.; Mehu, M.; Yin, L.; Pantic, M.; Cohn, J.F. Fera 2015-second facial expression recognition and analysis challenge. In Proceedings of the 2015 11th IEEE International Conference and Workshops on Automatic Face and Gesture Recognition (FG), Ljubljana, Slovenia, 4–8 May 2015; Volume 6, pp. 1–8. [Google Scholar]
  16. Wang, L.; Li, R.; Wang, K. A Novel Automatic Facial Expression Recognition Method Based on AAM. JCP 2014, 9, 608–617. [Google Scholar] [CrossRef] [Green Version]
  17. De la Torre, F.; Cohn, J.F. Facial expression analysis. In Visual Analysis of Humans; Springer: London, UK, 2011; pp. 377–409. [Google Scholar]
  18. Wu, Y.; Ji, Q. Discriminative deep face shape model for facial point detection. Int. J. Comput. Vis. 2015, 113, 37–53. [Google Scholar] [CrossRef]
  19. Liliana, D.Y.; Basaruddin, C.; Widyanto, M.R. Mix emotion recognition from facial expression using SVM-CRF sequence classifier. In Proceedings of the International Conference on Algorithms, Computing and Systems, Jeju Island, Republic of Korea, 10–13 August 2017; pp. 27–31. [Google Scholar]
  20. Smith, R.S.; Windeatt, T. Facial action unit recognition using multi-class classification. Neurocomputing 2015, 150, 440–448. [Google Scholar] [CrossRef]
  21. Sudha, V.; Viswanath, G.; Balasubramanian, A.; Chiranjeevi, P.; Basant, K.P.; Pratibha, M. A fast and robust emotion recognition system for real-world mobile phone data. In Proceedings of the 2015 IEEE International Conference on Multimedia & Expo Workshops (ICMEW), Torino, Italy, 29 June–3 July 2015; pp. 1–6. [Google Scholar]
  22. Liliana, D.Y.; Basaruddin, C. A review on conditional random fields as a sequential classifier in machine learning. In Proceedings of the 2017 International Conference on Electrical Engineering and Computer Science (ICECOS), Palembang, Indonesia, 22–23 August 2017; pp. 143–148. [Google Scholar]
  23. Pitaloka, D.A.; Wulandari, A.; Basaruddin, T.; Liliana, D.Y. Enhancing CNN with preprocessing stage in automatic emotion recognition. Procedia Comput. Sci. 2017, 116, 523–529. [Google Scholar] [CrossRef]
  24. Arriaga, O.; Valdenegro-Toro, M.; Plöger, P. Real-time convolutional neural networks for emotion and gender classification. arXiv 2017, arXiv:1710.07557. [Google Scholar]
  25. Chhabra, G.; Prasad, A.; Marriboyina, V. Implementation of aura colourspace visualizer to detect human biofield using image processing technique. J. Eng. Sci. Technol. 2019, 14, 892–908. [Google Scholar]
  26. Cram, J.R. A Psychological and Metaphysical Study of Dr. Edward Bach‘s Flower Essence Stress Formula. Subtle Energy Energy Med. J. Arch. 2000, 11, 1. [Google Scholar]
  27. Barrick, M.C. Emotions: Transforming Anger, Fear and Pain: Creating Heart-Centeredness in a Turbulent World; Summit University Press: Gardiner, MT, USA, 2002. [Google Scholar]
  28. Onyema, E.M.; Dinar, A.E.; Ghouali, S.; Merabet, B.; Merzougui, R.; Feham, M. Cyber Threats, Attack Strategy, and Ethical Hacking in Telecommunications Systems. In Security and Privacy in Cyberspace; Blockchain Technologies, Kaiwartya, O., Kaushik, K., Gupta, S.K., Mishra, A., Kumar, M., Eds.; Springer: Singapore, 2022; pp. 25–45. [Google Scholar] [CrossRef]
  29. Ruiz, L.Z.; Alomia, R.P.V.; Dantis, A.D.Q.; Diego, M.J.S.S.; Tindugan, C.F.; Serrano, K.K.D. Human emotion detection through facial expressions for commercial analysis. In Proceedings of the 2017 IEEE 9th International Conference on Humanoid, Nanotechnology, Information Technology, Communication and Control, Environment and Management (HNICEM), Manila, Philippines, 1–3 December 2017; pp. 1–6. [Google Scholar] [CrossRef]
  30. Ghosh, R.; Sinha, D. Human emotion recognition by analyzing facial expressions, heart rate and blogs using deep learning method. Innov. Syst. Softw. Eng. 2022, 1–9. [Google Scholar] [CrossRef]
Figure 1. Working model of the proposed methodology.
Electronics 11 04059 g001
Figure 2. CNN-based facial emotion recognition technique [24].
Electronics 11 04059 g002
Figure 3. Classification matrix for the emotion module.
Electronics 11 04059 g003
Figure 4. Training and validation accuracy (above) and loss (below) for the emotion module.
Electronics 11 04059 g004
Figure 5. Classification matrix for the emotion module and the human aura module.
Electronics 11 04059 g005
Figure 6. Training and validation accuracy (top) and loss (down) for the human aura module.
Electronics 11 04059 g006
Figure 7. Classification matrix for the emotion and aura modules.
Electronics 11 04059 g007
Figure 8. Training and validation loss for the emotion and aura modules.
Electronics 11 04059 g008
Figure 9. Training and validation accuracy for the emotion and aura modules.
Electronics 11 04059 g009
Figure 10. Comparative analysis of the modules.
Electronics 11 04059 g010
Figure 11. Participant feedback analysis based on the satisfaction level.
Electronics 11 04059 g011
Figure 12. Participants’ emotions before healing.
Electronics 11 04059 g012
Figure 13. Participants’ emotions before healing.
Electronics 11 04059 g013
Figure 14. Comparative analysis of the healing process.
Electronics 11 04059 g014
Figure 15. Aura visualization before the therapy.
Electronics 11 04059 g015
Figure 16. Aura visualization after the therapy.
Electronics 11 04059 g016
Table 1. Chakras and related psychological functioning effects [7].
Name of ChakraLocationColorEmotionsPsychological Functions
DeficientBalancedExcessive
CrownTop of the headWhite/VioletBliss, SpiritualityLack of creativity, Indecisive, Lack of joyNo fear of death, Miracle worker, Open to the divineFrustrated, Depressive, Migraines, Manic
Third EyeBetween eyebrowsIndigoImagination, IntuitionsUndisciplined, Afraid of success, OversensitiveNon-material, No fear, Total vision, Master of oneselfEgoistic, Arrogant, Manipulative
ThroatCenter base of the neckBlueSelf-expression, HealingUnable to express thoughts, Unreliable, ManipulativeExcellent speaker, Artistic, Live in the now, Centered.Will force opinions on others, Arrogant, Talks excessively
HeartCenter of chestGreenBalance, LoveFeels unloved, Afraid of letting go, Self-pity Unconditional love, Emotionally balanced Very critical, Mood swings, Tense, Demanding, Depressive
Solar PlexusBelow the sternum and above the navelYellowPurpose, Self-definitionLack of personal energy, Confusion, InsecurityJoyful, Content with oneself, Self-esteemed, Multi-skilled, RelaxedWorkaholic, Too intellectual, Resents authority
SacralBetween the navel and above the genitalsOrangeEmotions, DesiresVery shy, Untrusting, Buries emotions, Sexual guiltCreative, Friendly, Concerns for othersAggressive, Self-serving, Manipulative
RootBase of the spineRedPassions, Self-preservationLow sex drive, Insecure, Lack of Self-esteemMaster of oneself, Limitless energy, GroundedEgoistic, selfish, Dominating
Table 2. Confusion Matrix (2 × 2).
True Positive
Criteria: Noticeable impact if accurately predicted
False Positive
Criteria: Noticeable impact if accurately predicted
False Negative
Criteria: Unnoticeable impact if not-accurately predicted
True Negative
Criteria: Unnoticeable impact if not-accurately predicted
Table 3. Demographic characteristics of the participants.
Demographic Characteristics
CharacteristicN = 62
FrequencyPercentage (%)
GenderMale3861
Female2439
Age16–20711
20–241016
24–281118
28–321931
32–341524
34>00
EducationDiploma1118
High/Secondary School1118
Graduation2744
Post-Graduation1321
Publisher’s Note: MDPI stays neutral with regard to jurisdictional claims in published maps and institutional affiliations.

