1. Introduction
Electric vehicles (EVs) have become more popular in recent years due to reduced battery prices and the reinforcement of regulations [
1]. At the end of 2020, there were 10 million EVs on the road, which is expected to rise to 150 million by 2030. Around 20 countries have announced bans on the sales of new conventional cars by 2040 to reach the target of zero emissions due to mobility [
2]. However, the increase in EVs on the road will demand more energy from the electrical system, and a shift in the peak demand may occur. This situation will cause an increase in energy production at certain times of the day, resulting in significant stress on the system. Since the primary energy source for electricity is fossil fuels, reductions in
emissions from the use of EVs will not be achieved and could be higher than the emissions from the use of conventional cars [
3,
4]. Nevertheless,
emissions could be reduced by up to 50% if the power generation is based entirely on renewable energy [
5]. Thus, increasing the number of charging stations based on renewable energy is extremely important for the upcoming increase in EVs and the zero-energy emissions target. In this sense, developing charging stations based on photovoltaic (PV) and battery energy storage systems (BESS) for residential and commercial buildings is a viable solution. These charging stations can help reduce the operation costs, as well as the emissions, and guarantee the use of renewable energy for charging the EV [
6]. Unfortunately, due to the variability of the solar irradiance level depending on the day, season, and location, the grid connection of these charging stations is often mandatory.
The PV/BESS charging station reduces
emissions but its high cost reduces its attractiveness. According to [
7], the prices of a BESS for a PV charging station can vary between 350 and 450 EUR/kWh, which can be economically inconvenient for increasing its use. Unfortunately, this study does not analyze the contribution of the BESS to the reduction of
emissions or its dependency on the electrical grid. Thus, it is essential to approach the analysis from three main axes: energy, economic, and environmental, but only a few studies consider all of them. For instance, in [
8], the authors present an analysis of a charging station used at night. The modeling and simulation consider different battery capacity values, the distance traveled, and the type of operation of the charging station. However, this study does not consider real applications or field data. In [
9], a feasibility study of a PV charging station for e-vehicles in the Netherlands, Norway, Brazil, and Australia is presented. It analyzes the environmental impact using the average
emissions factor but not its variation over time. According to [
10], the analysis of the footprint of the EV’s connection to the grid should use a variable energy mix over time to obtain a more reliable value.
EV charging can occur at any time of the day; thus, its effect on costs, the environment, and energy varies. Several studies and algorithms have been proposed for the EMS for EV charging stations for small or large applications [
11,
12]. However, they mainly focus on optimizations to reduce the impact on the grid [
13], profit [
14], charging station capacity [
15], or driver behavior [
16] but not the optimization of the energy delivered to the EVs considering
emissions. In this sense, limited literature is available on this topic. In [
17], an analysis of the impact of different scheduling strategies on
emissions from electricity generation and EV batteries by 2050 is presented. Such a study shows that a suitable control system helps achieve zero emissions due to mobility, but neither the impact of the charging technology nor its costs were considered. In [
18], an EMS based on one-stage optimization using model predictive control is proposed for EV charging in a PV parking lot. The authors forecast the EV’s connection or disconnection and the PV power production, which helped to minimize the energy consumption from the grid by 30%. A similar approach is taken in [
19], where a schedule is developed every hour and considers the forecast data to calculate the control variables. However, these do not consider the
emissions from the EV’s connection to the grid. The authors in [
20] present an explicit model predictive control where uncertainties, such as PV production, emissions, and price, are considered. However, as the control output was not the EV’s power consumption, the effectiveness of this approach was limited by the power capacity of the PV/BESS power station and the driver’s behavior. The uncertainty of the EV’s arrival time and disconnection can be taken into account with fuzzy [
21] or robust optimizations [
22]; however, these techniques may give a day-ahead solution with the disadvantage of higher operation costs and an impact on the EV’s connection time. The study in [
23] presents the use of reinforcement learning to maximize the profit of the charging station to manage the connection and charging time of a conventional charging station that is only connected to the grid. However, this solution needed information on the EVs and charging station location, which can be a drawback due to privacy restrictions. The main disadvantage of these algorithms is that they can be challenging to implement and may have operational errors due to the uncertainty of the EV’s energy demand, connection time, PV production, and battery’s state of charge. Moreover, the variable
emissions factor adds another uncertainty that can cause errors in real-time control.
Thus, for real-time energy management of charging stations, model predictive control (MPC) is commonly used as it optimizes the energy to be delivered to the EV in every step, taking into account the constraints and the actual energy availability [
24]. An MPC for a charging station is proposed in [
25] to enhance the charging profile of the EV’s battery but not the reduction of the emissions or electricity price. Although model predictive control helps to optimize the charging station in real time, it needs a prior stage of optimization where the EV’s maximum power is scheduled for the day [
26]. Thus, the two-stage optimization could provide an optimal solution for reducing the emissions and energy costs of the charging station. In [
27], a two-stage model predictive control is proposed for an island microgrid operation. However, it only focuses on the economic aspect and not the emissions. The authors in [
28] present a two-stage optimization for a large charging station to schedule EVs’ admissions and connection times. The main limitation considered is the maximum energy capacity of the charging station. Although this offers an effective solution for a large capacity, it does not provide a solution for the environmental and economic aspects. For PV/BESS charging stations such as the ones available in homes or buildings where the number of EVs is known and specific times can be imposed, the optimization can help to reduce the energy taken from the grid, operation costs, and
emissions. In the literature, there is a gap in the research of these applications taking into account the environmental aspect and management of the EV’s energy demand.
Thus, the current paper presents a multi-objective two-stage optimization for an EMS to reduce
emissions and operation costs. The day-ahead optimization provides the energy schedule of the maximum energy that can be delivered to the EV from the grid using multi-objective quadratic programming. Then, in the second stage, model predictive control is used to manage the energy flow from the PV/BESS and the grid, where the constraints are the limits imposed by the first stage of optimization. The main advantage of the proposed algorithm is the easy implementation and reduced error margin. The efficiency and reliability of the proposed EMS are demonstrated and evaluated using the charging station located at the University of Trieste, Italy. The analysis of the results considers three aspects: energy, the economy, and the environment. This work also considers the data from the electrical system in Italy [
29]. This paper is structured as follows.
Section 2 describes the charging station implemented at the University of Trieste and its conventional operation of the EMS.
Section 3 explains the proposed two-stage optimization for the EMS. The platform developed for its supervision, control, and monitoring is explained in
Section 4. Then, the results and the economic, environmental, and energy analysis are presented in
Section 5. Finally, the conclusions are drawn in
Section 6.
2. Conventional EMS of the Charging Station
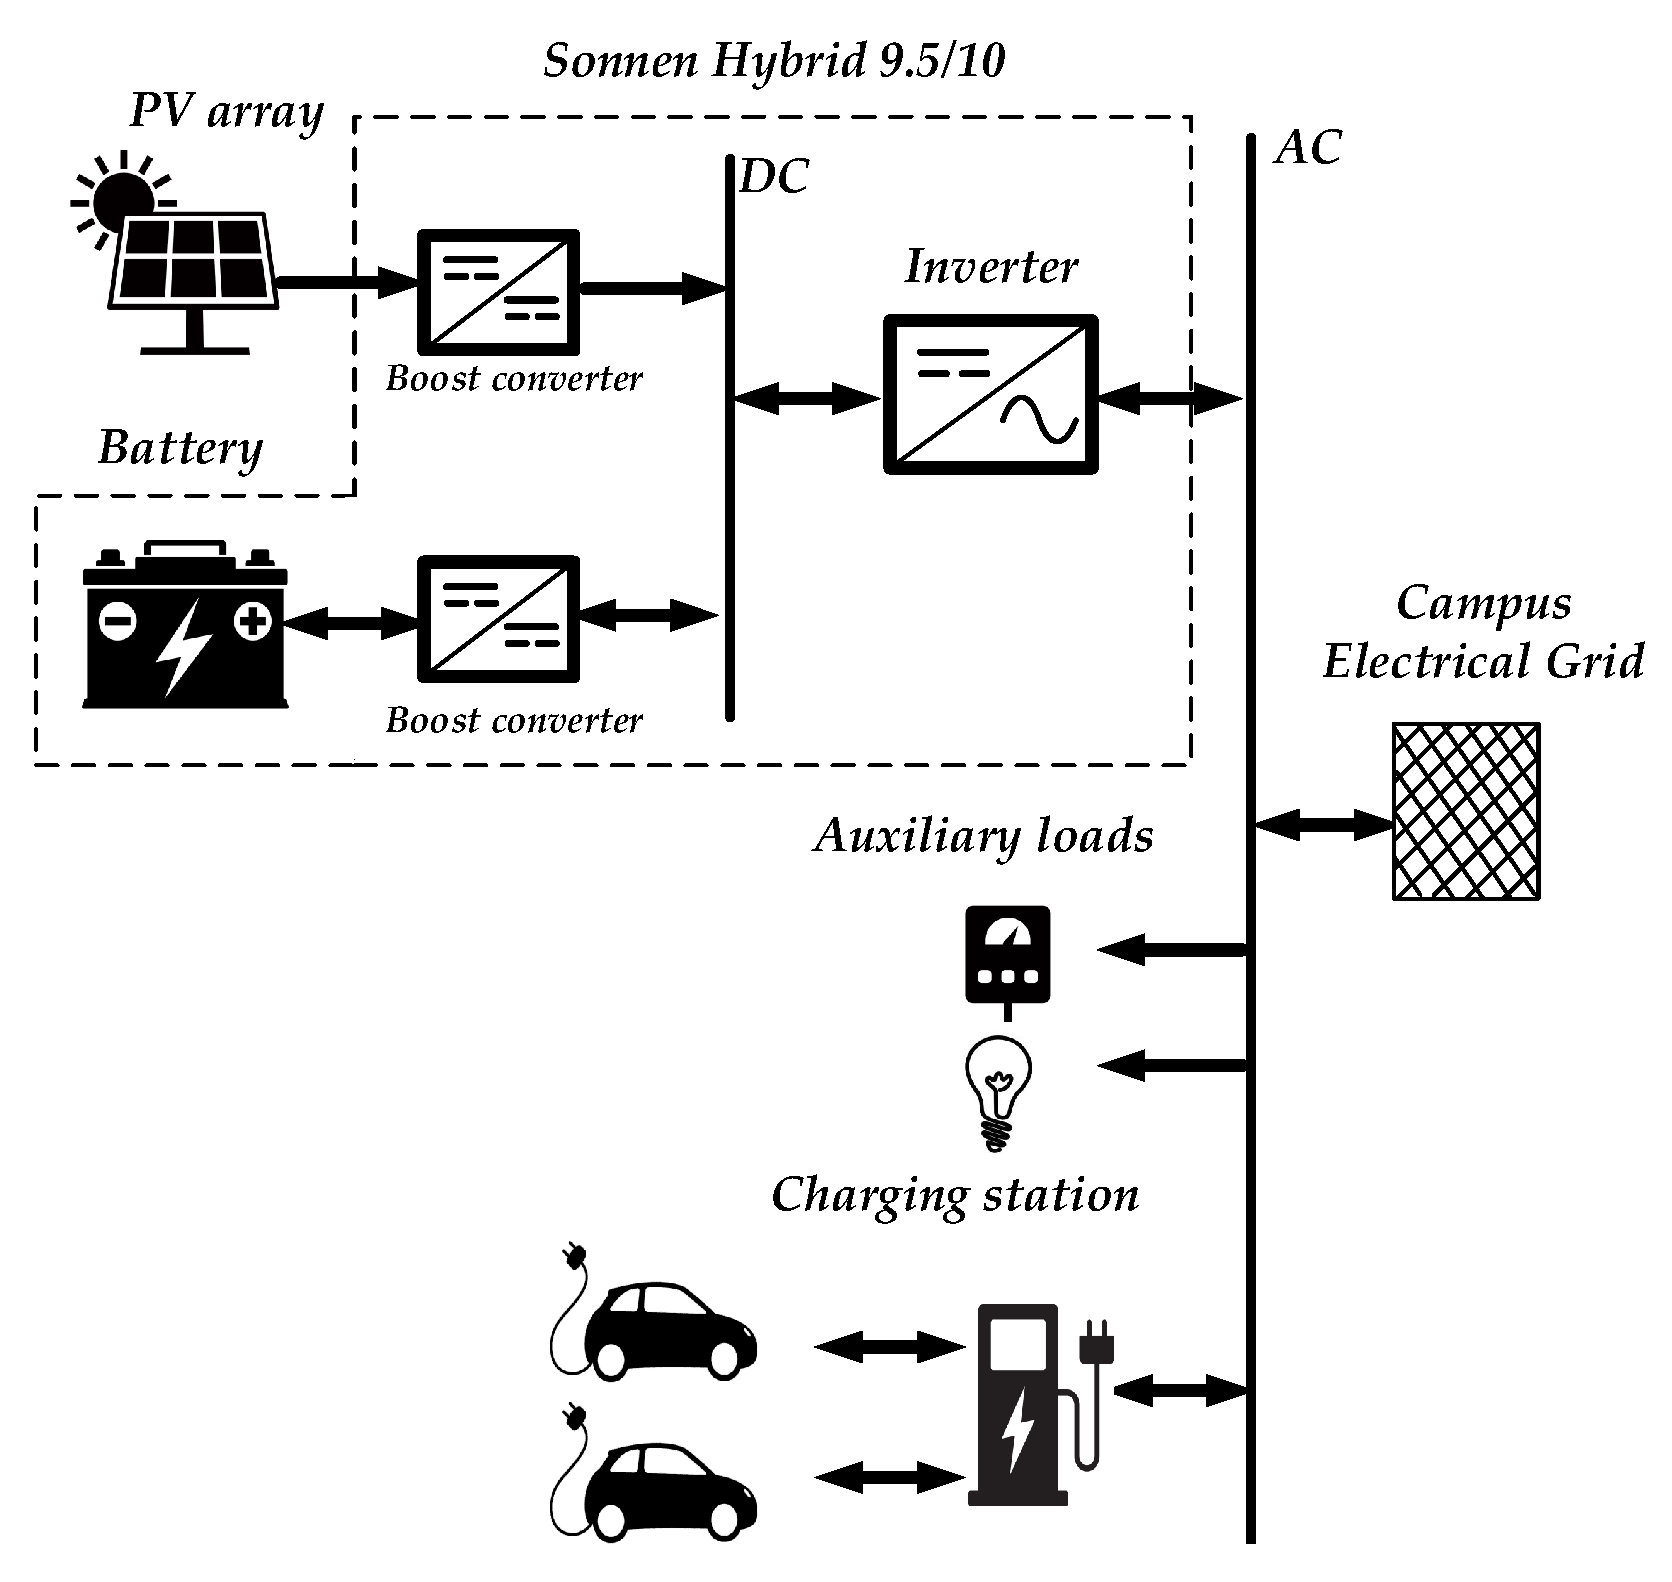
The charging station under study implemented at the University of Trieste has three main elements: the PV array, the battery, and the two-stage inverter. The charging station can supply power to two EVs simultaneously (
Figure 1). The PV array consists of two strings of seven PV modules each and can supply a maximum power of 3.9 kW in standard conditions. The inverter is a Sonnen Hybrid 9.5/10, which converts the DC power from the PV array and the battery to AC. The maximum rated power of the inverter is 4.5 kW. The technology of the battery is lithium iron phosphate (LiFePO), with a maximum power of 3.3 kW and a nominal capacity of 10 kWh.The charging station can supply a maximum power of 22 kW. The charging station users are people working at the University of Trieste where the charging station is installed. Currently, there are ten EV users with a power capacity ranging from 3 kW to 26 kW. The charging station can only permit two EVs to charge at a time. The connection of any user is limited to two ranges of time. In the morning, the user can connect the EV from 8 am to 2 pm, and in the afternoon, the EV can connect at any time from 3 pm onward. The maximum length of time it can connect is 6 h so that other users can connect. The monitoring of the charging station is developed using a human—machine interface (HMI), where the user can see the status of the charging station and, thus, decide whether to connect or not.
The conventional EMS is embedded in the inverter. Its main objective is to control the power provided by the inverter, thus controlling the charging/discharging of the battery and the power flow from the PV production. The EMS controls the charging station by prioritizing charging the EV when connecting to the station. The second priority is to charge the battery of the charging station and the last priority is to supply power to the campus electrical grid when there is a surplus of PV production.
When the PV power production is greater than the power needed by the EV, the PV array can charge the battery (when the SoC < 90%). If there is still extra power, the charging station supplies power to the campus grid. The PV power production feeds the EV and the campus electrical grid if the battery is fully charged. All the PV production feeds into the grid if any EV is connected. When the PV power production is lower than the power required by the EV and the battery has an SoC > 10%, the PV power and the battery can feed the EV. The power can come from the PV and the campus electrical grid if the battery is completely depleted.
3. Two-Stage Optimization
The two-stage optimization aims to reduce the emissions and operation costs of the charging station. A day-ahead optimization (first stage) is developed to obtain the maximum possible power the charging station can supply to the EVs. Plus, it also provides the profile for the battery charging/discharging and the maximum power coming from the grid. The input values are the forecasts for the PV production, emissions from the power generation, initial state of charge of the BESS, and connection times of the EV for the day. The emissions from the EV connection are calculated using the variable emissions factor ().
To calculate this factor, the daily forecast for the power generation (capacity and type) for every hour is taken from ENTSO-e [
29]. The day-ahead electricity price is also taken from ENTSO-e. The forecast for the PV production is assumed as certain with no error. The output of this first stage is the maximum power that the EV can request, maximum power delivered by the grid, and power profile of the BESS. Multi-objective quadratic programming is formulated for the first stage, with a time step of one hour. This optimization is developed every 24 h due to the availability of the data from ENTSO-e.
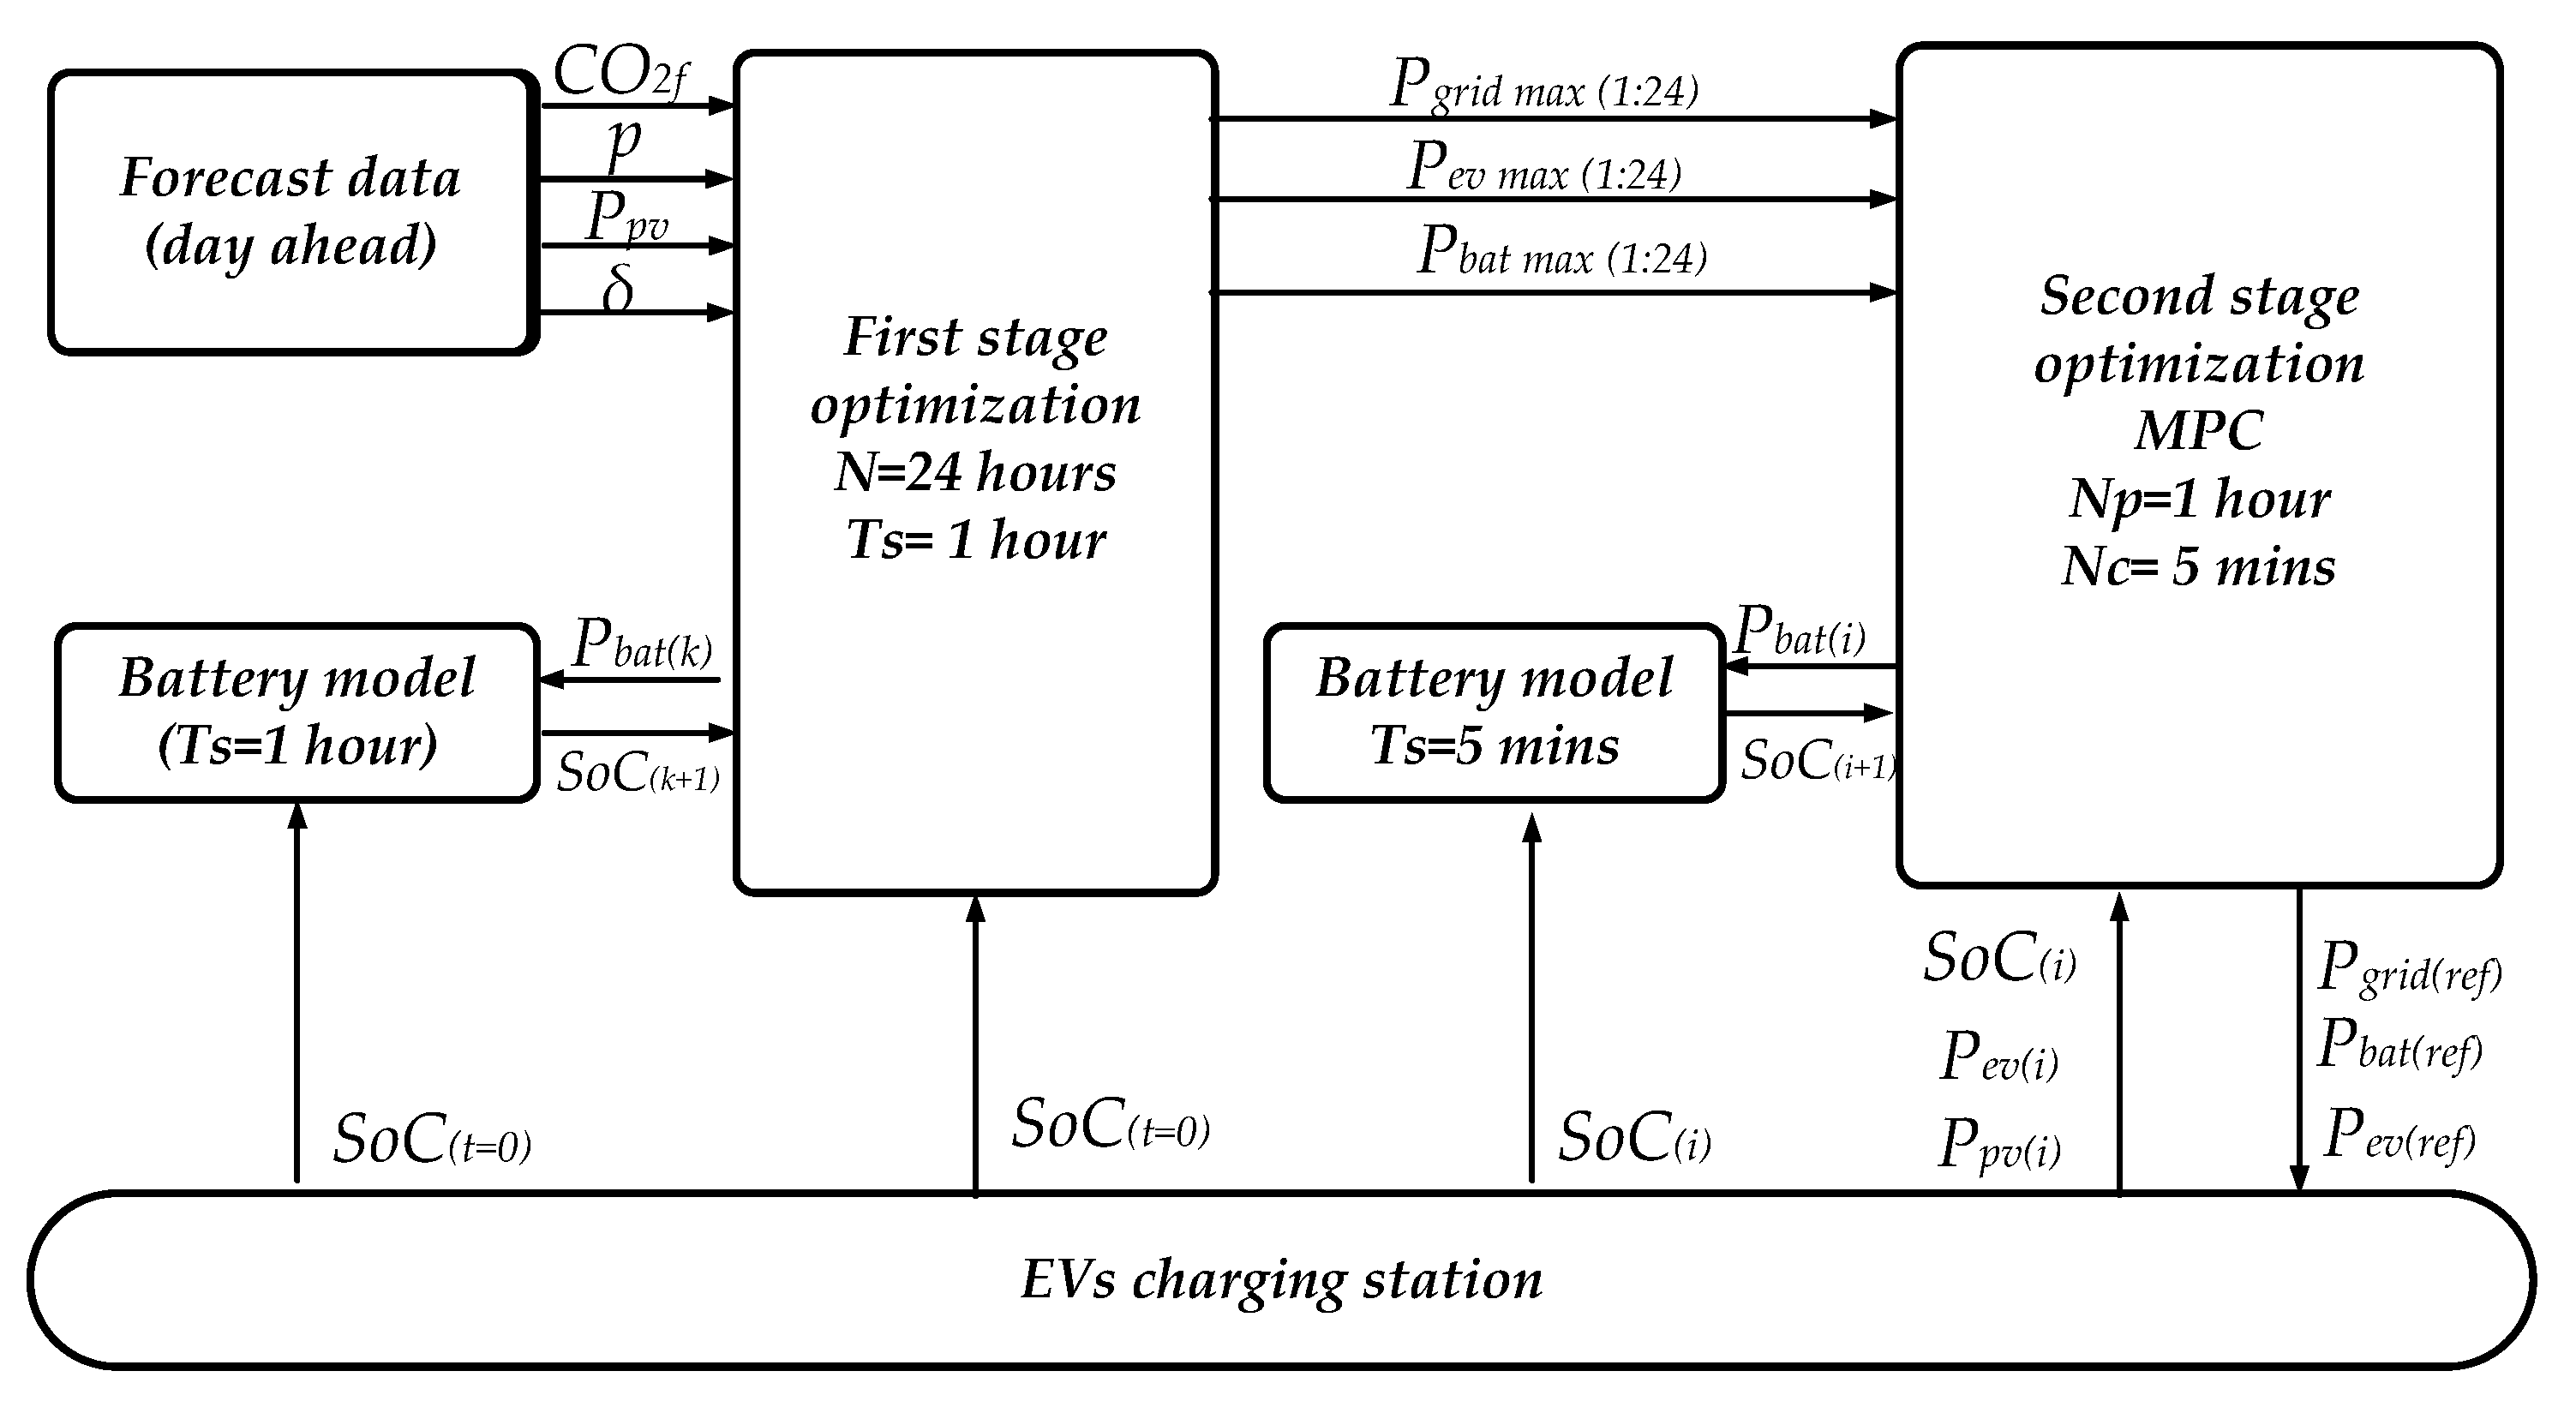
Then, the second stage develops any corrections to the schedule in real time due to PV production forecast errors and the EV’s connection/disconnection. This stage develops real-time control and provides an optimal response depending on the future state of charge of the BESS. This stage considers the uncertainties as real-time disturbances and the first stage’s output as constraints. For this second stage, model predictive control is chosen. The proposed EMS is presented in
Figure 2. The following subsection explains the problem formulation for each stage and the real-time control.
3.1. First Stage of Optimization
The first stage provides the optimized energy schedule for the day ahead (24 h) and starts at midnight. The performance of the PV/BESS depends on the available power during the day and the BESS’s SoC. In addition, it will interact with the grid when the power from the PV/BESS is not enough. Thus, the state of charge of the BESS
at every hour (
k) is what helps to provide a power profile for the charging station. The
depends on the ratio between its maximum capacity
,
for a determined sampling time (
). For the day ahead, the sampling time is one hour. Thus, the
should satisfy
The energy balance governing the charging station completes the problem formulation. The balance is the net sum of the power generation and consumption. Taking into account the PV power production forecast for every hour (
), grid’s power (
), battery’s power (
), and EV’s power demand (
), the power balance is
where
is the connection or disconnection variable of the EV. It is equal to 1 if an EV is connected and otherwise it is 0.
The multi-objective function for the first stage looks to minimize
emissions and operation costs. Thus, the first term is
, which looks to minimize the
emissions from the connection to the grid. The second term is
, which will minimize the operation costs. These two objective functions are expressed as follows:
where the 239 given in g/kWh is the variable
emissions factor due to the nature of the power generation from the grid (see
Appendix A). Meanwhile,
p is the electricity price given in EUR/kWh. Then, the multi-objective function takes the following form:
where
and
are coefficients that define the priority of the optimization, with
. The proposed EMS assumes that the two values are equal to 0.5. Thus, it gives the same priority to both objectives.
The constraints of the first stage of optimization are formulated by considering the rated power of each of the components, which are summarized as follows:
3.2. Second Stage of Optimization
The second stage of optimization uses the output from the first stage (, , ), which corresponds to the maximum values that the second stage of optimization should provide. These values are considered in the constraints of the second optimization. The objective of this second stage is to reduce the grid’s consumption and control the PV/BESS together with the grid depending on the demand, PV production, and BESS’s SoC. For the second stage, the sampling time is 5 min but the prediction horizon is one hour. In this case, the control time is the same as the sampling time.
In the current application, MPC is used to give the optimal response of the charging station under disturbances looking for the future performance of the BESS’s SoC. At every time step (i), the control checks the system’s state. This means that it measures the , EV’s power consumption (), and PV power production. Then, it calculates the optimal control output ( and ) considering the future behavior of the BESS’s SoC for a given prediction time (). Then, only the output corresponding to the first time step (control horizon ) is applied and sent to the charging station. This process is repeated throughout the day.
In the current application, in the state-space model of the charging station, the SoC of the battery represents the state variable (
); the control variables (
) are the power exchanged with the battery (
) and the power exchanged with the grid (
). The prediction of the SoC depends on its actual value and the performance of the battery, defined by the battery’s efficiency
and its maximum capacity (
). Thus, the state of charge of the battery is defined as
where
is the sampling time of 5 min and
i is the time step. The power balance at the point of connection with the grid represents the dynamics of the charging station and it is expressed as follows:
The main objective function aims to minimize the use of the grid to provide power to the EV and BESS when it is discharged, which is a good time to charge it without causing an increase in emissions or costs.
The minimization is calculated for a prediction horizon (
). The objective function (
) includes the power from the grid, BESS, and PV. The EV can charge with a combination of power from these three sources. Furthermore, the grid or PV panels can also charge the BESS. Thus, the same priority is given to each power source. The objective function is expressed as follows:
The constraints for the SoC’ and the inverter are the same as the first stage of optimization detailed in Equation (
6). However, the maximum values permitted for
,
, and
are determined by the output of the first stage of optimization of the corresponding hour and are defined as
3.3. Real-Time Operation
The control operation of this algorithm happens on various time scales. At the beginning of the day (t = 00:00), the state of the charging station is evaluated; this means measuring the BESS’s SoC and the EV’s power consumption in cases where it is connected. The initial state is loaded with the daily forecasts for the
emissions, price, PV power production, and EV’s connection time. Then, the first stage of optimization runs, and the maximum power profile for the day per hour is calculated and saved. Then, at every time step (
i), the state of the charging station is measured:
,
,
. At every time step (5 min), the MPC is run, and the optimal values of
and
are calculated for the next time step and applied. This process is repeated every sampling time all day. The steps for the algorithm are shown in Algorithm 1:
| Algorithm 1 Real-time control. |
| 1: Control laws |
| 2: if then |
| 3: , , |
| 4: , |
| 5: end if |
| 6: |
| 7: for k = 1:24 do |
| 8: Run first stage of optimization |
| 9: , |
| 10: , |
| 11: end for |
| 12: for i = 1:288 do |
| Require:, (i), |
| 13: if then |
| 14: |
| 15: |
| 16: end if |
| 17: Run MPC |
| 18: , |
| 19: Sent control variables to the charging station |
| 20: end for |
4. EMS Platform
This section explains the platform used to develop the supervisory control and data acquisition system (SCADA) from its components to the communication protocol used. The main functions of the SCADA for the charging station are:
Control and supervise the charging station.
Real-time measurement of the charging station status, Sonnen Hybrid inverter, and ambient conditions.
Daily communication with ENTSO-e to request the type of power generation forecast.
Data storage of power, voltage, and current of every component of the charging station, battery state, and ambient conditions.
Visualization of the current state of the charging station: PV production, grid power production, emissions, occupancy, and EV power consumption.
4.1. Control and Supervision:
The central control is in the dSPACE platform, where the optimization and control are developed. dSPACE receives the information from the Sonnen Hybrid (inverter and BESS), charging station (EV connection/disconnection), ambient conditions, and ENTSO-e at various times. dSPACE sends the power schedule at every time step to the Sonnen Hybrid () and the charging station ().
4.2. Data Storage
A personal computer (host PC) is used to store every three seconds the data coming from the Sonnen Hybrid system (, , , , , , f, phase angle, , number of cycles, etc.). The ambient conditions, such as solar irradiance, ambient temperature, humidity, and wind, are taken from the environment data server and saved every five minutes.
4.3. Monitoring and Visualization
The charging station status can be seen in the University’s installation on three smart TVs located at different points. These TVs display the PV/BESS power production, power coming from the grid, ambient conditions, emissions generated and saved, and EV power consumption. Additionally, the dashboard shows instantaneous power flows over time, environmental data related to the PV system, real-time carbon intensity for the current day, and cumulative energy produced in different time intervals (daily, weekly, monthly, and total). The host PC uses a Thingboard Server Nodel to transfer the data to the smart TV.
4.4. Communication
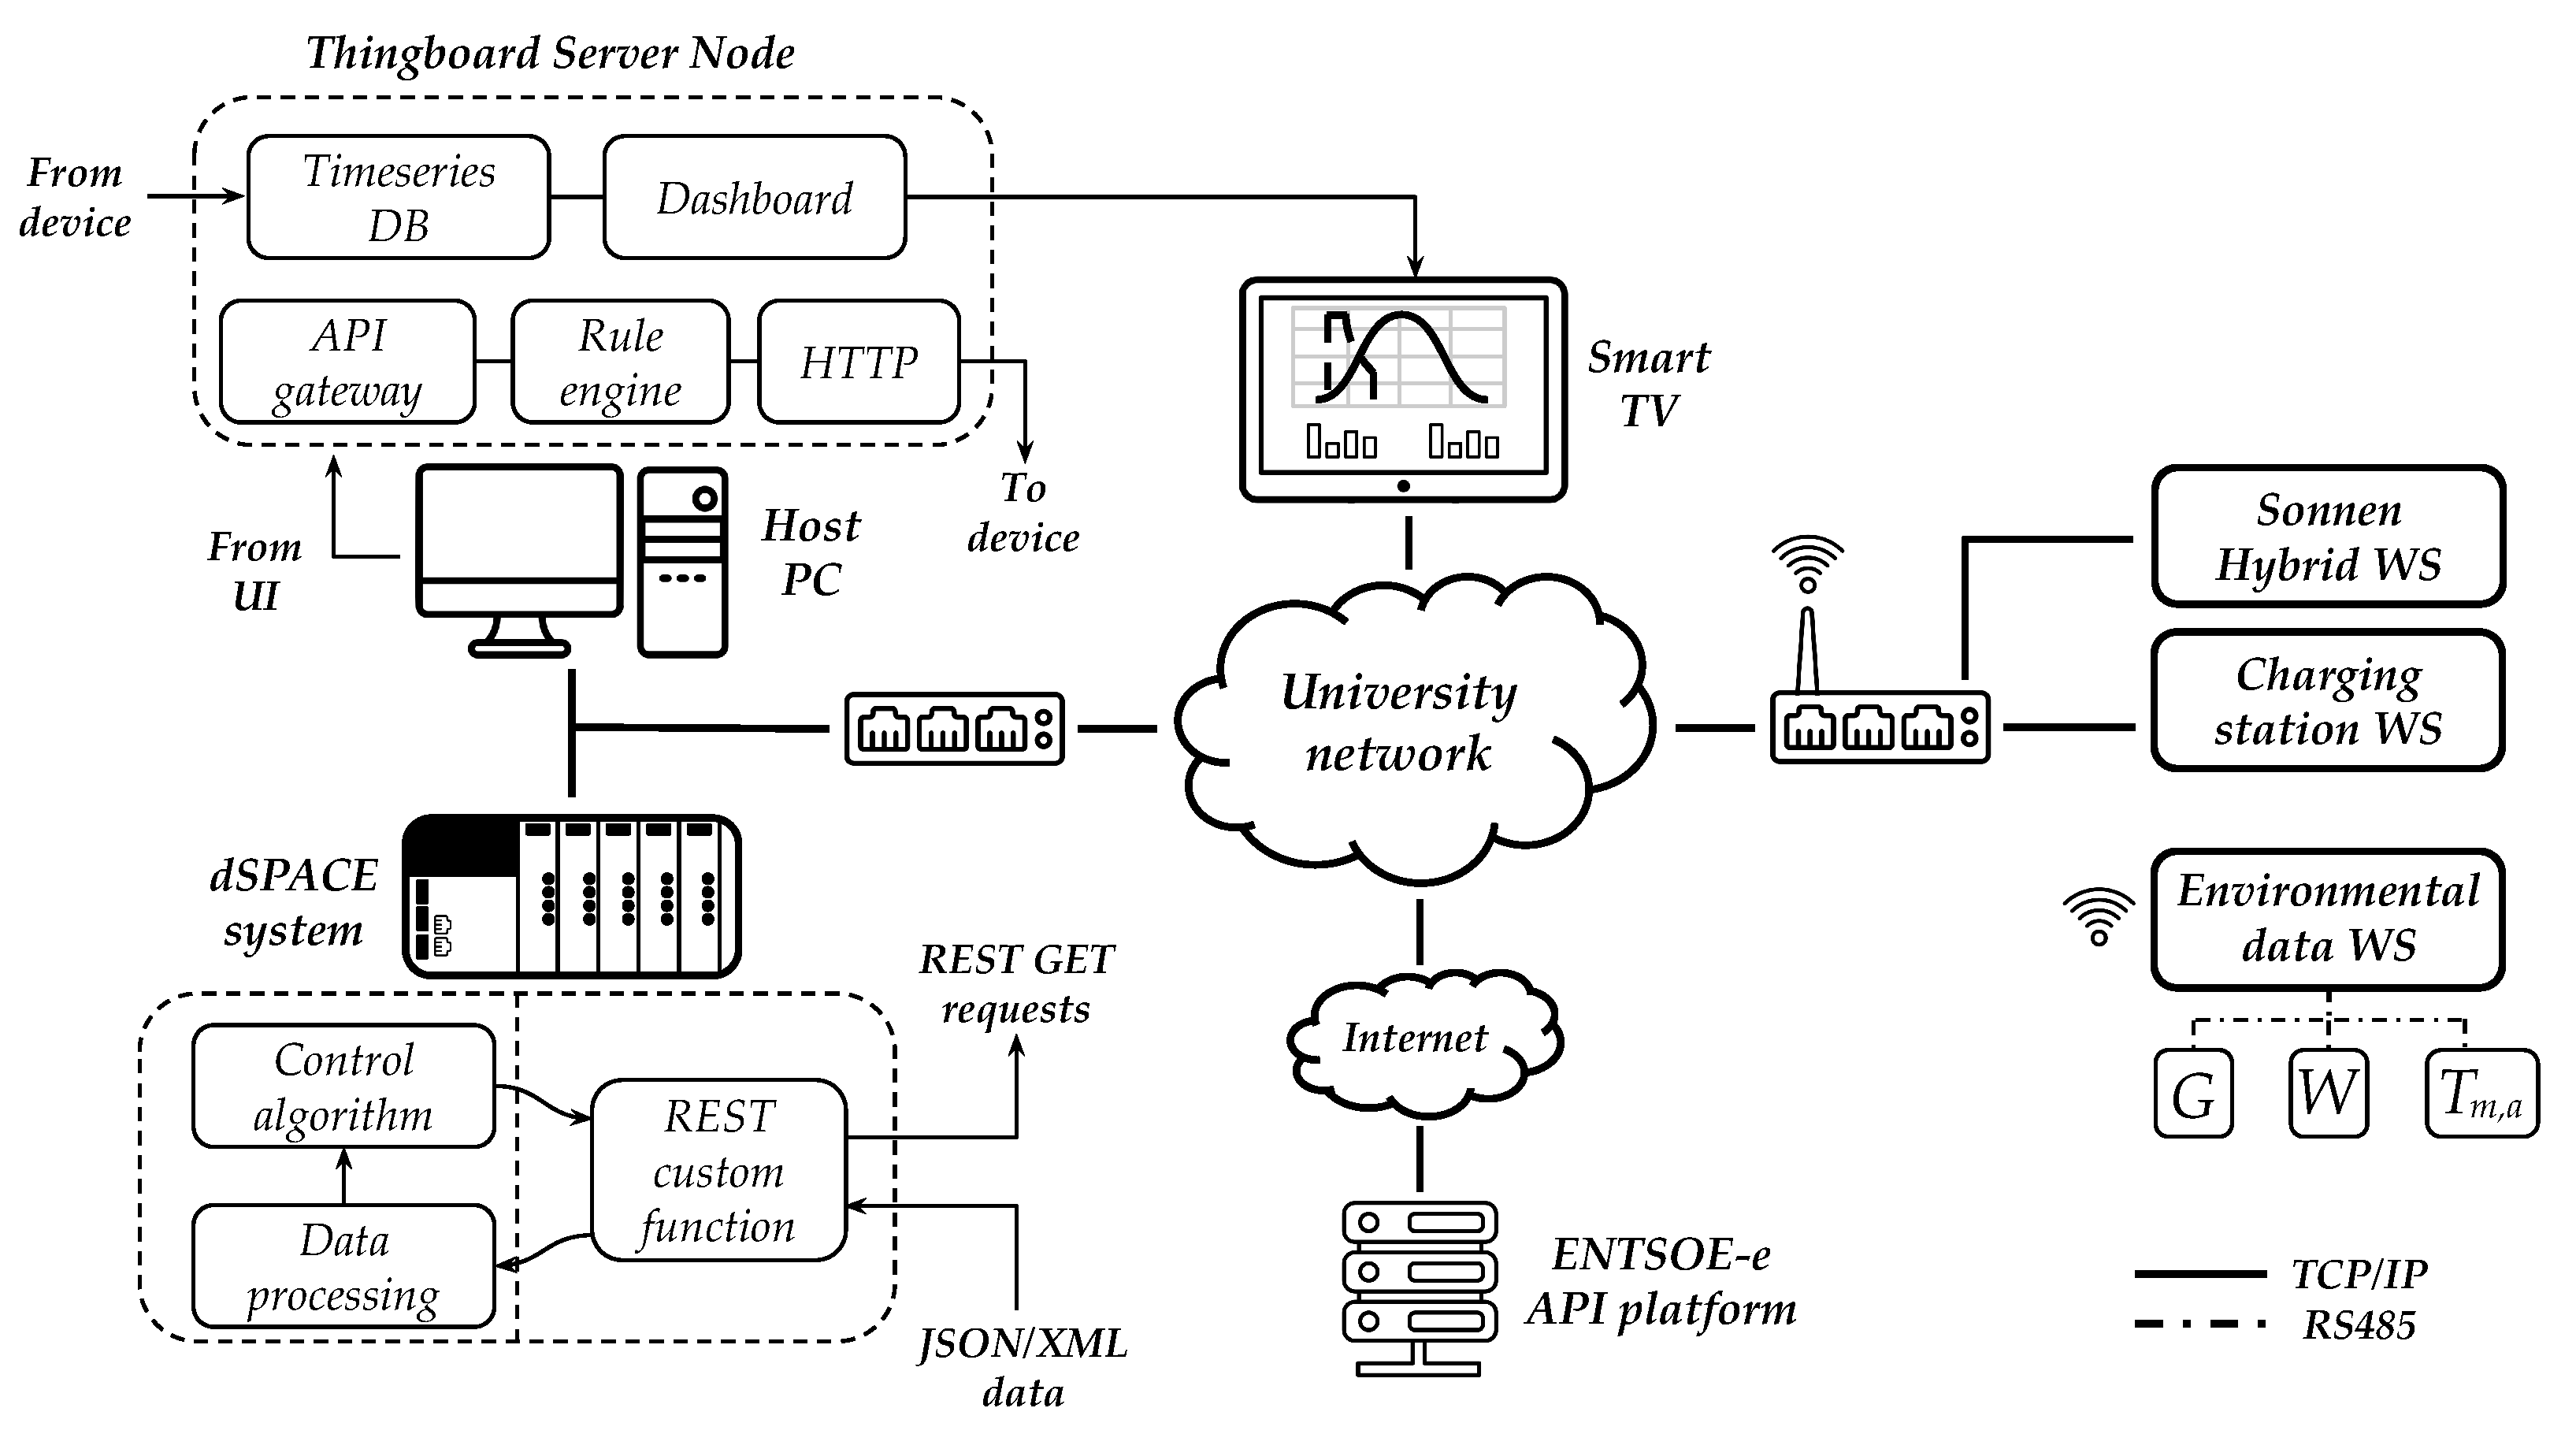
The components, i.e., the Sonnen Hybrid inverter, charging station, dSPACE, host PC, and smart TVs, are all linked to the University’s network using an Internet Protocol (IP)-based configuration (
Figure 3). The Sonnen Hybrid inverter and charging station also implement a web service (WS) that can communicate via HTTP to any network client. The web services are implemented to allow the communication of the measured variables through the widespread Representational State Transfer Application Programming Interface (RESTful API). Furthermore, the host PC communicates with the ENTSO-e API platform web service through the Internet. The ambient monitoring system uses field sensors for irradiance (
G), wind speed (
W), and ambient temperature (
). These sensors communicate using an RS485 serial protocol, and the information can be acquired by wireless communication.
5. Analysis and Results
This section presents the evaluation of the two EMSs: (a) conventional and (b) two-stage optimization. The two EMSs’ evaluations used data from the charging station corresponding to May 2022 with a time step of five minutes. The constraints for both EMSs are shown in
Table 1. The data on the energy mix coming from the electrical grid were obtained from ENTSO-e with a sample time of one hour [
29]. Furthermore, both EMSs were validated in the charging station located at the University of Trieste, presenting a similar performance to the results described in this section. The software used for the simulations was Matlab/Simulink. In this section, an analysis of the function of the energy, economy, and environment for both EMSs is presented.
5.1. Energy Analysis
The EVs arrived at the charging station at various times of the day. The power profile and energy performance are presented in this section for both EMSs.
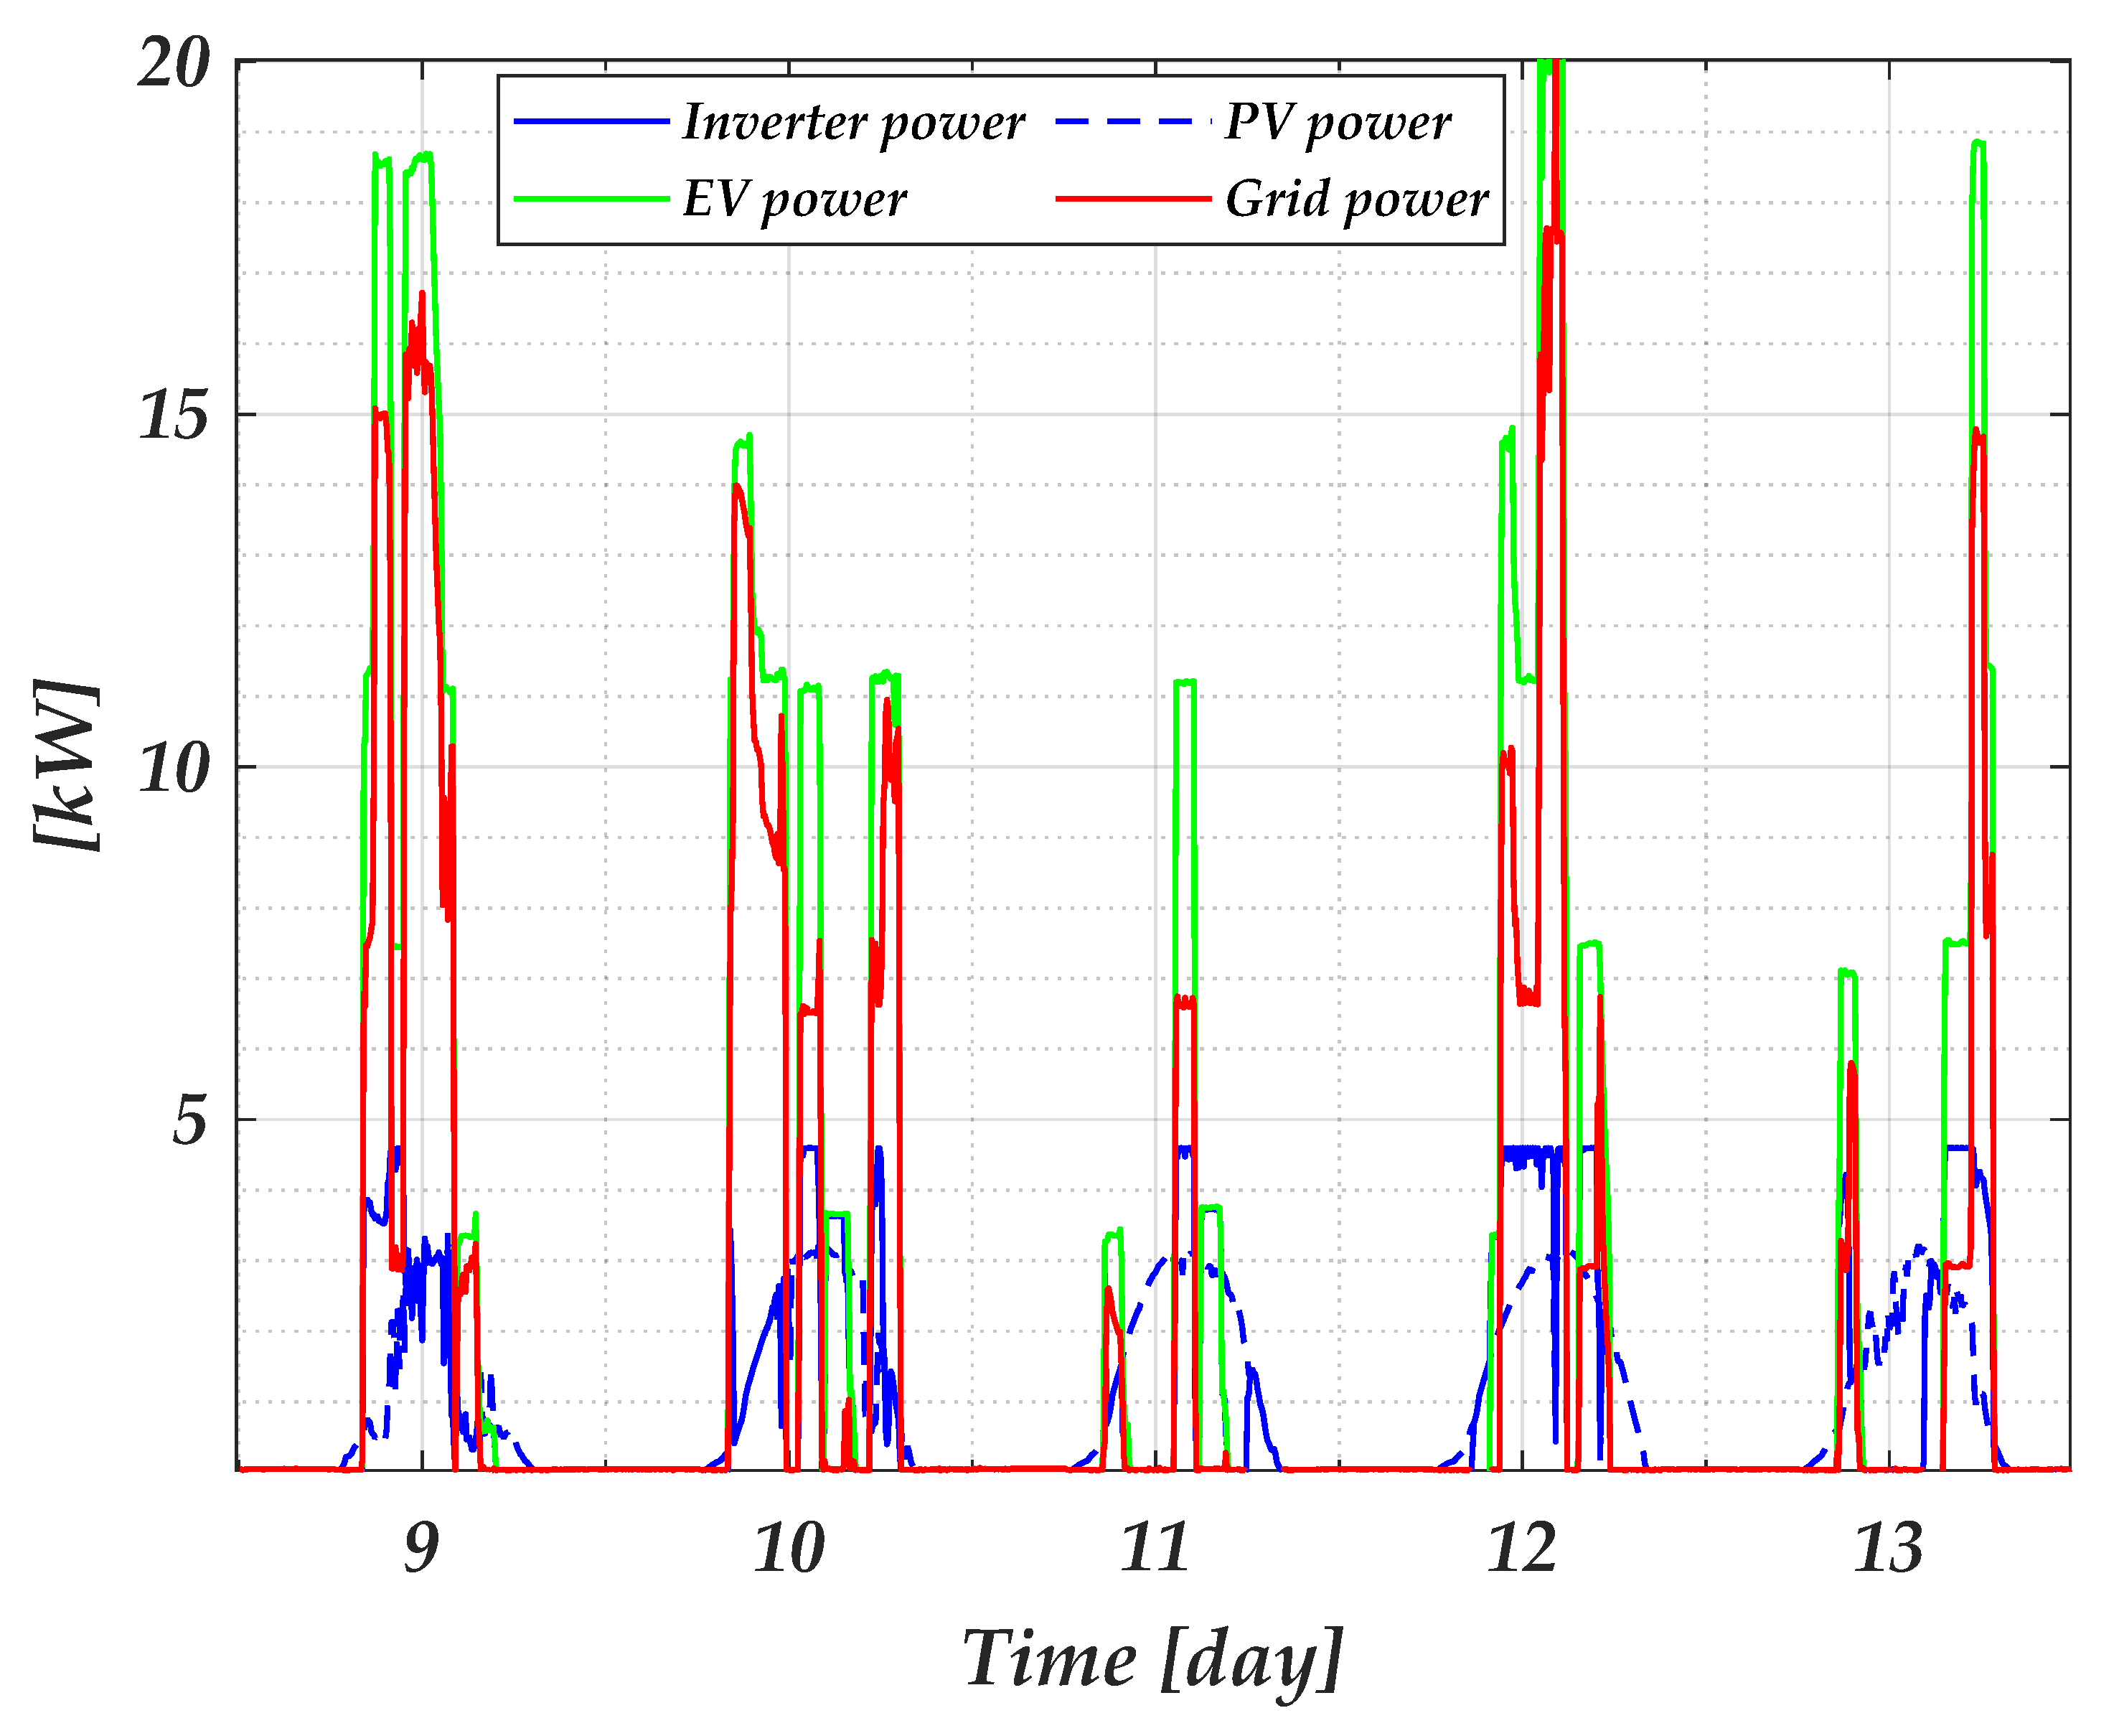
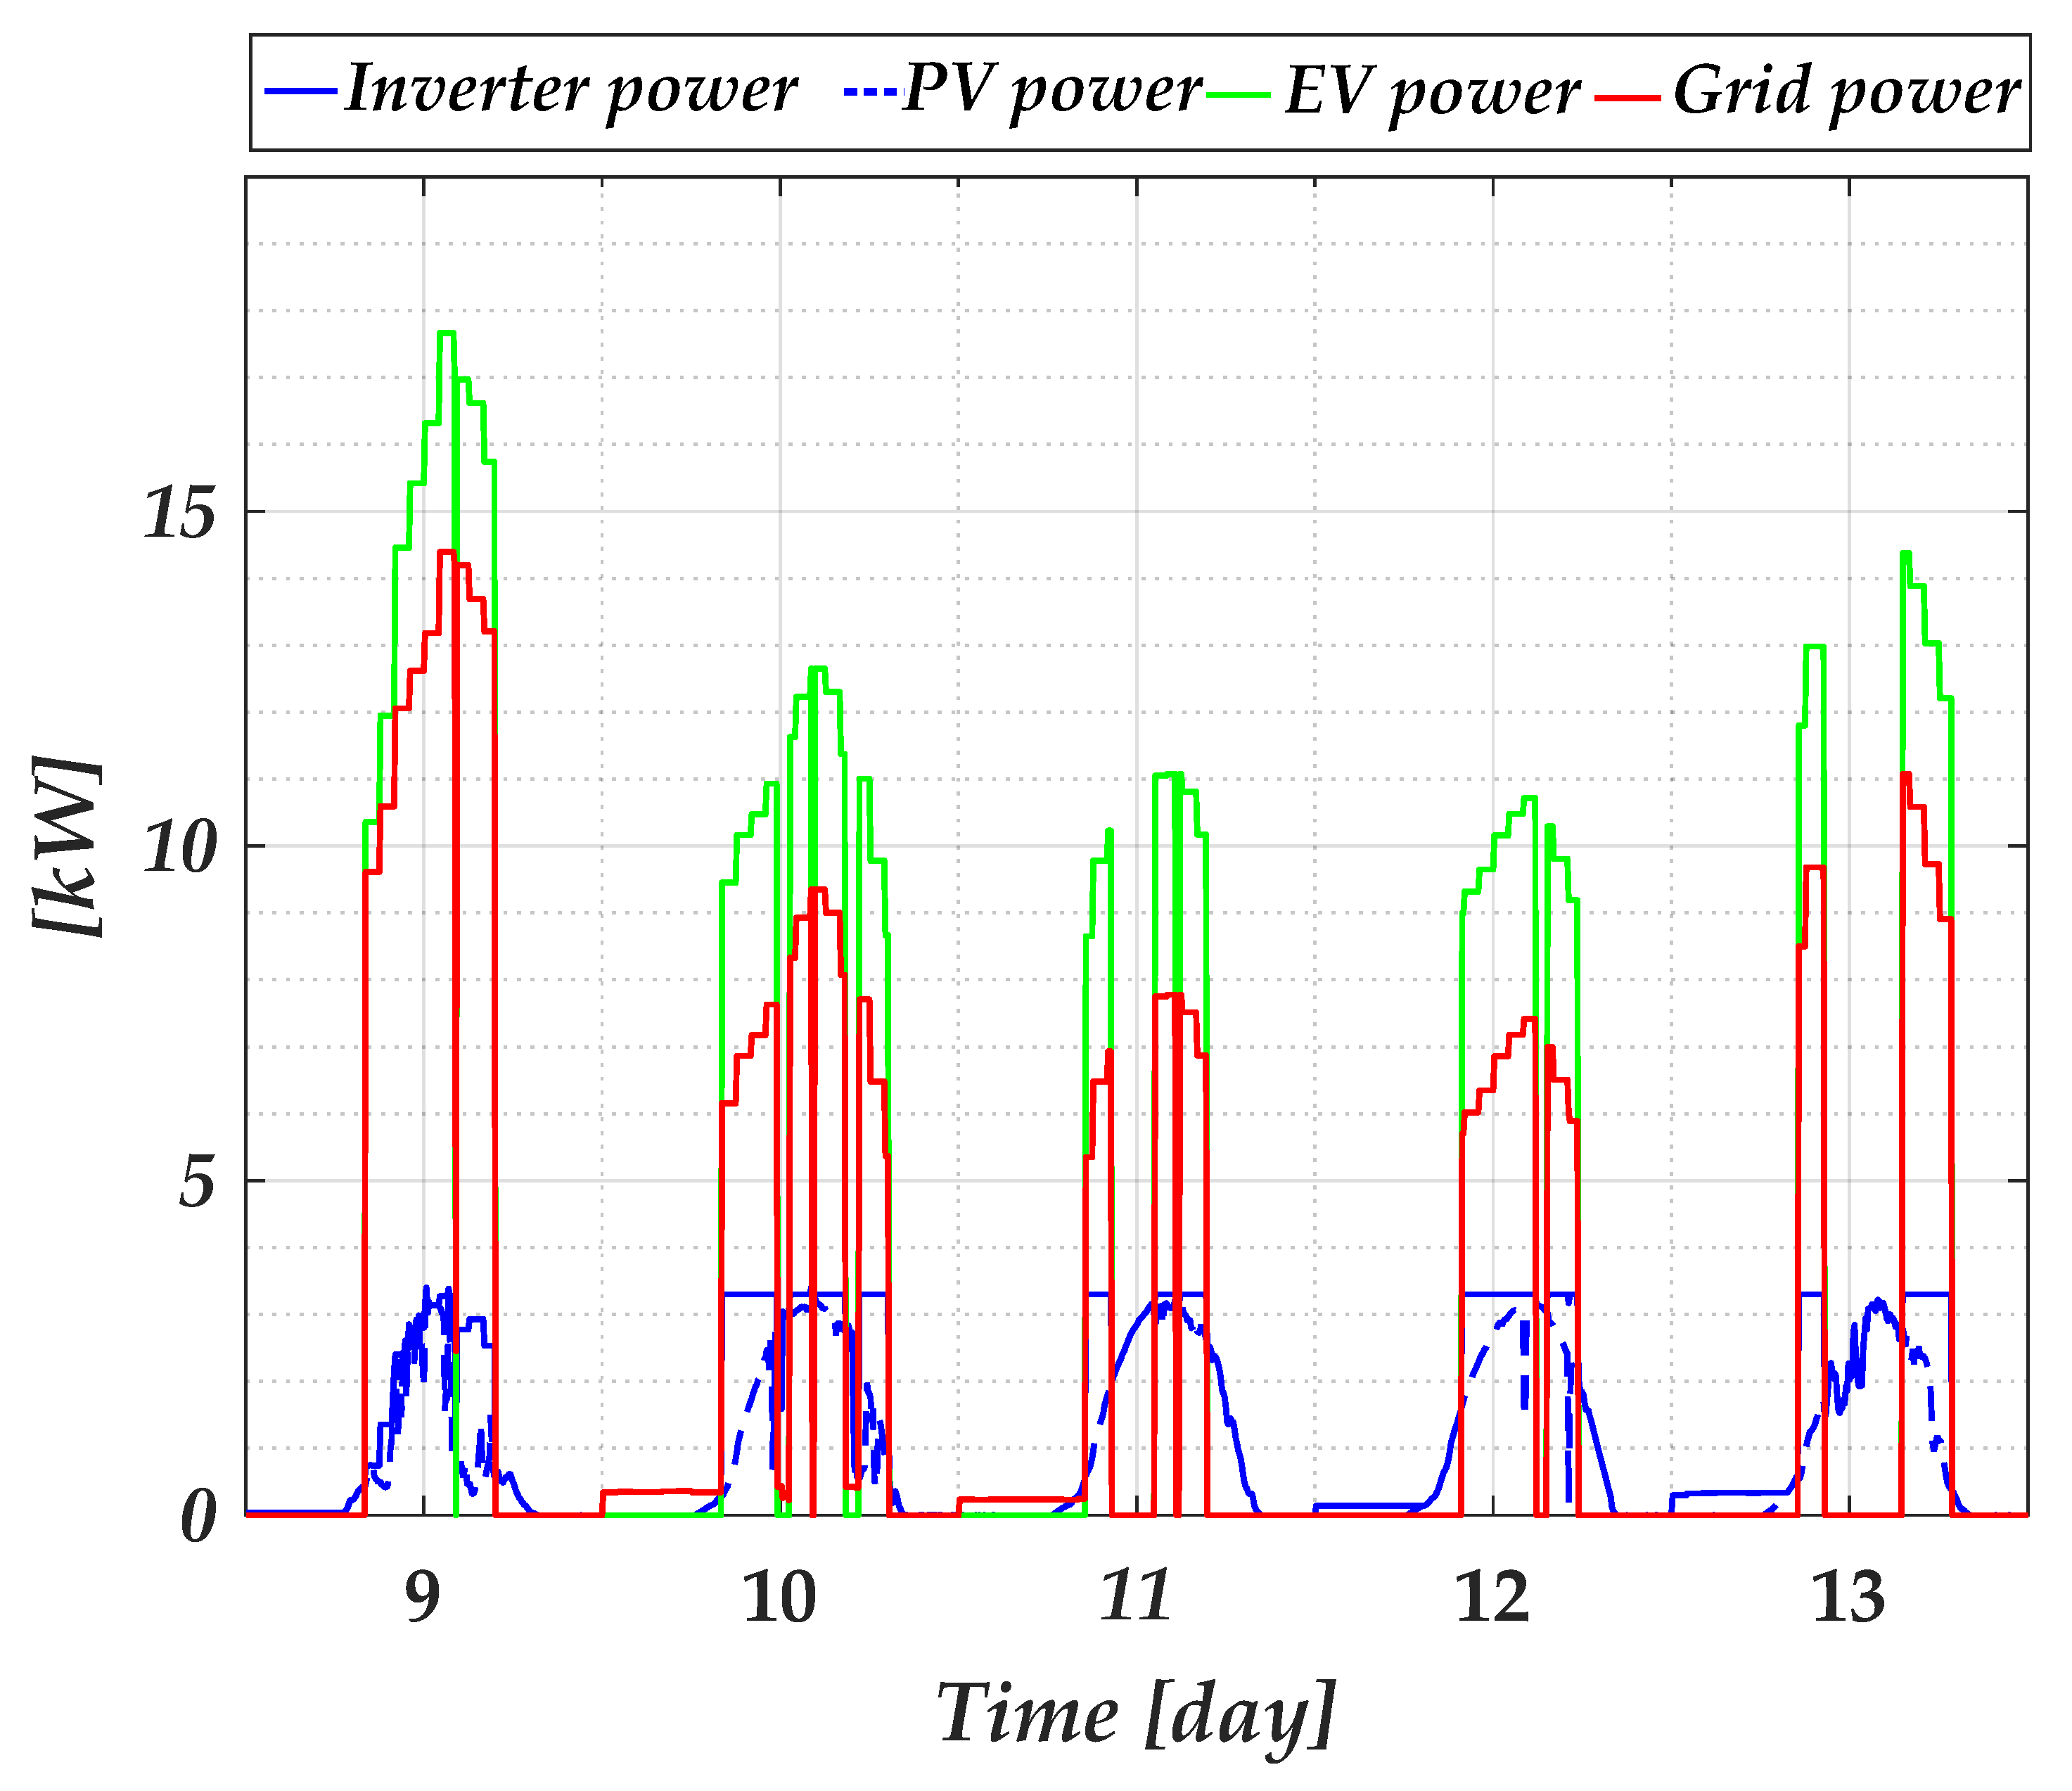
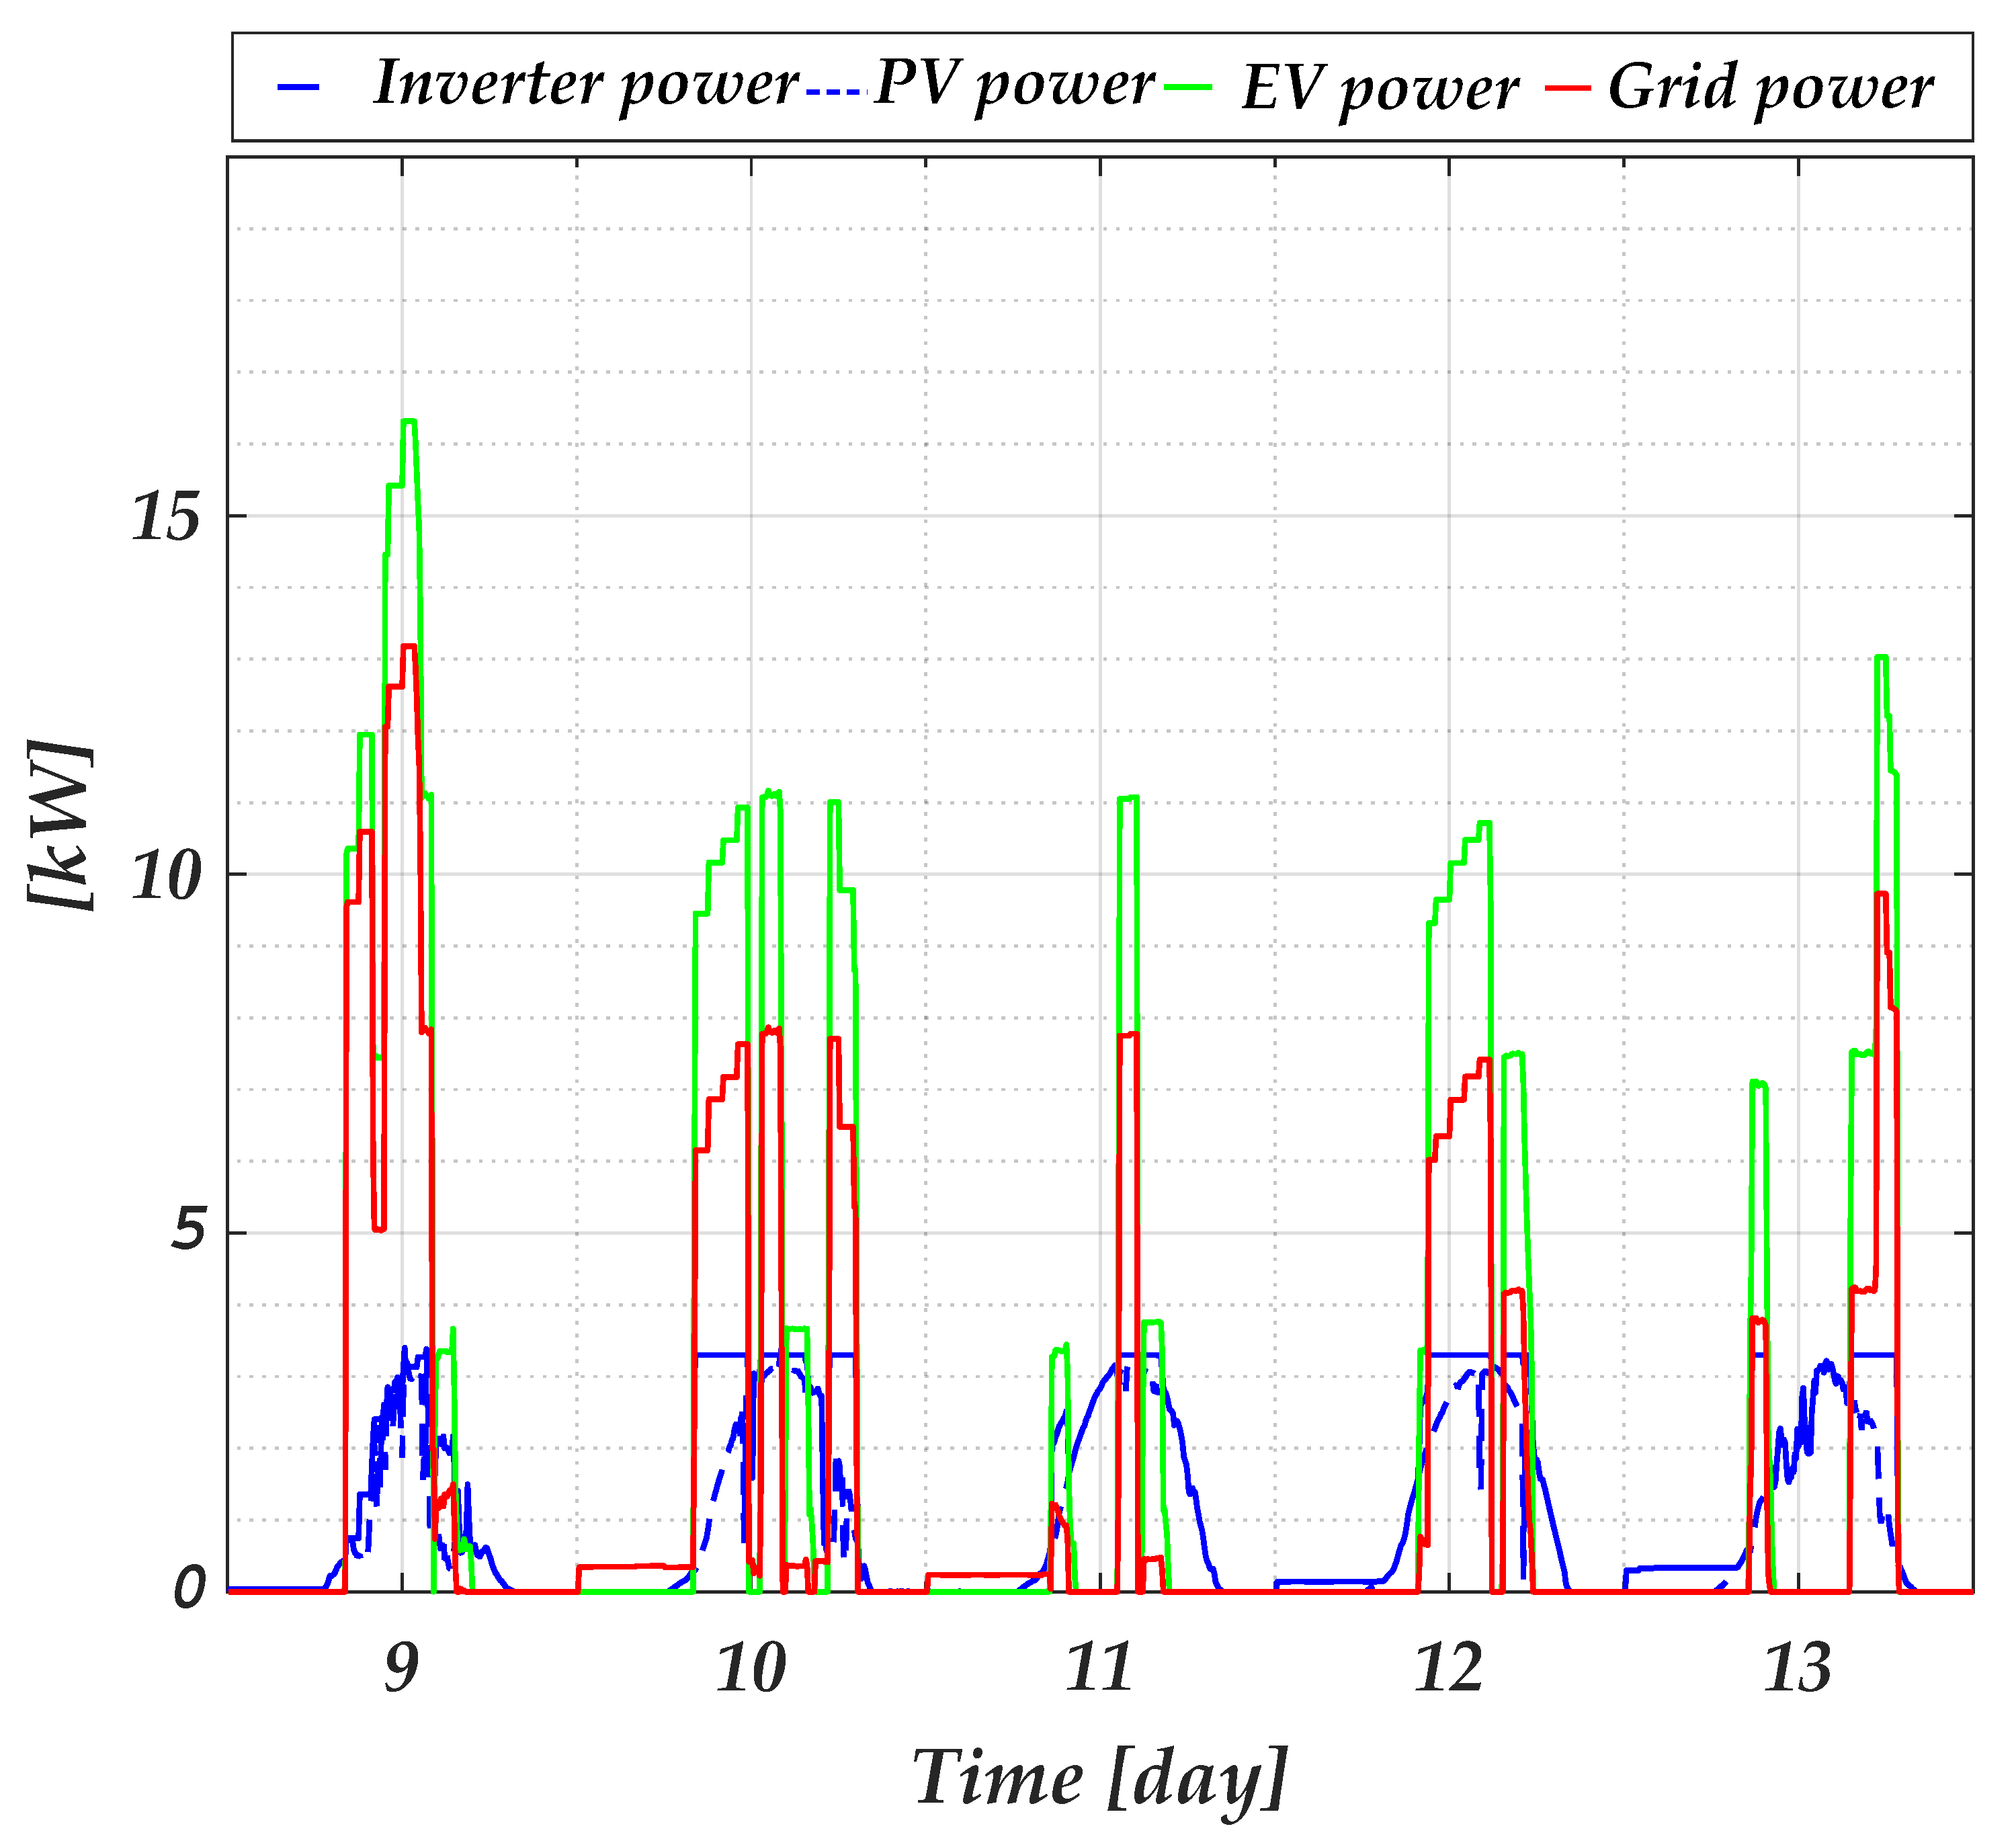
Figure 4 shows the responses during the second week of May (9th to 13th of May) for the conventional EMS. For the two-stage optimization, the power profile for the day ahead is presented in
Figure 5, and the real-time power profile is shown in
Figure 6.
Using the conventional EMS, the maximum power that the inverter provided was 4.1 kW. On day 9, the inverter provided power from the battery and PV in the early morning, depleting its battery before 9 am. Thus, for the cars that followed, most of the power came from the grid and PV, which are variable. For the cars that arrived third, the PV power was low; although the EV demand was low, the power could not be supplied by the PV/BESS charging station which is the grid that feeds the EV. The next day, the grid and the PV system provided power to the EV but not the BESS, as it discharged the day before. Then, the battery charged for an hour until the following EV arrived. The third car to arrive with a lower capacity connected in the afternoon, which was fed by the PV/BESS. In the above-mentioned week, there were two days with high demand: the first day, May 9th, and the second day, May 12th. The emissions and costs on the first day were lower than on May 12th. However, using the conventional EMS, the charging station provides the EV with power, although it affects the emissions and the total cost.
Using the two-stage optimization, the day-ahead operation set the limits of the power from the grid and the maximum power permitted to be supplied to the EV depending on the connection time, intensity factor, and electricity price at that hour. Lower emissions permitted feeding the EV with more energy when necessary. On May 9th, the maximum power that the charging station could provide to the EV varied from 10 kW to 18 kW. Meanwhile, on May 12th, as the costs and emissions factor increased, the maximum power to supply the EV was 11 kW. Although the EV asked for 20 kW on this day, the system did not provide it. The results of the real-time operation showed that the power from the battery was carefully distributed during the day so there was power from the battery at any time. Although it was expected that the battery would be depleted, the battery was charged early in the morning by the grid for later use when the EV arrived. The charging of the BESS occurred when the costs and emissions factor were low.
The summary of the weekly energy performance of the charging station for May is shown in
Table 2. This table presents the energy taken from the grid (
), net energy from the inverter (
), and energy supplied to the EV (
). In the conventional EMS, the energy supplied to the EV was what the EV demanded without any restrictions. However, using the two-stage optimization, this energy was reduced to a maximum of 18%, which happened during the first week, and a minimum of 9%, which occurred during the third week. Moreover, with the conventional EMS, the maximum energy supplied, occurring in week 2, was 4.02 kWh, but with the two-stage optimization, it was 3.38 kWh, which is a reduction of 15%. The reduction in consumption and new allocation of energy reduced the energy required from the grid by about 19%. The maximum energy reduction of the grid was 23% (first week) and the minimum was 8.4% (third week).
The energy performance summary for May is shown in
Table 3. Comparing both EMSs, the EV consumption was reduced by about 15% using the two-stage optimization, which caused a reduction in energy from the grid by about 19%. The energy discharged from the battery was also reduced but only by 3.9%. It is also important to note that the energy required to charge the battery was also reduced by 9.2%, helping to reduce the stress on the battery.
5.2. Environment
In the charging station, the
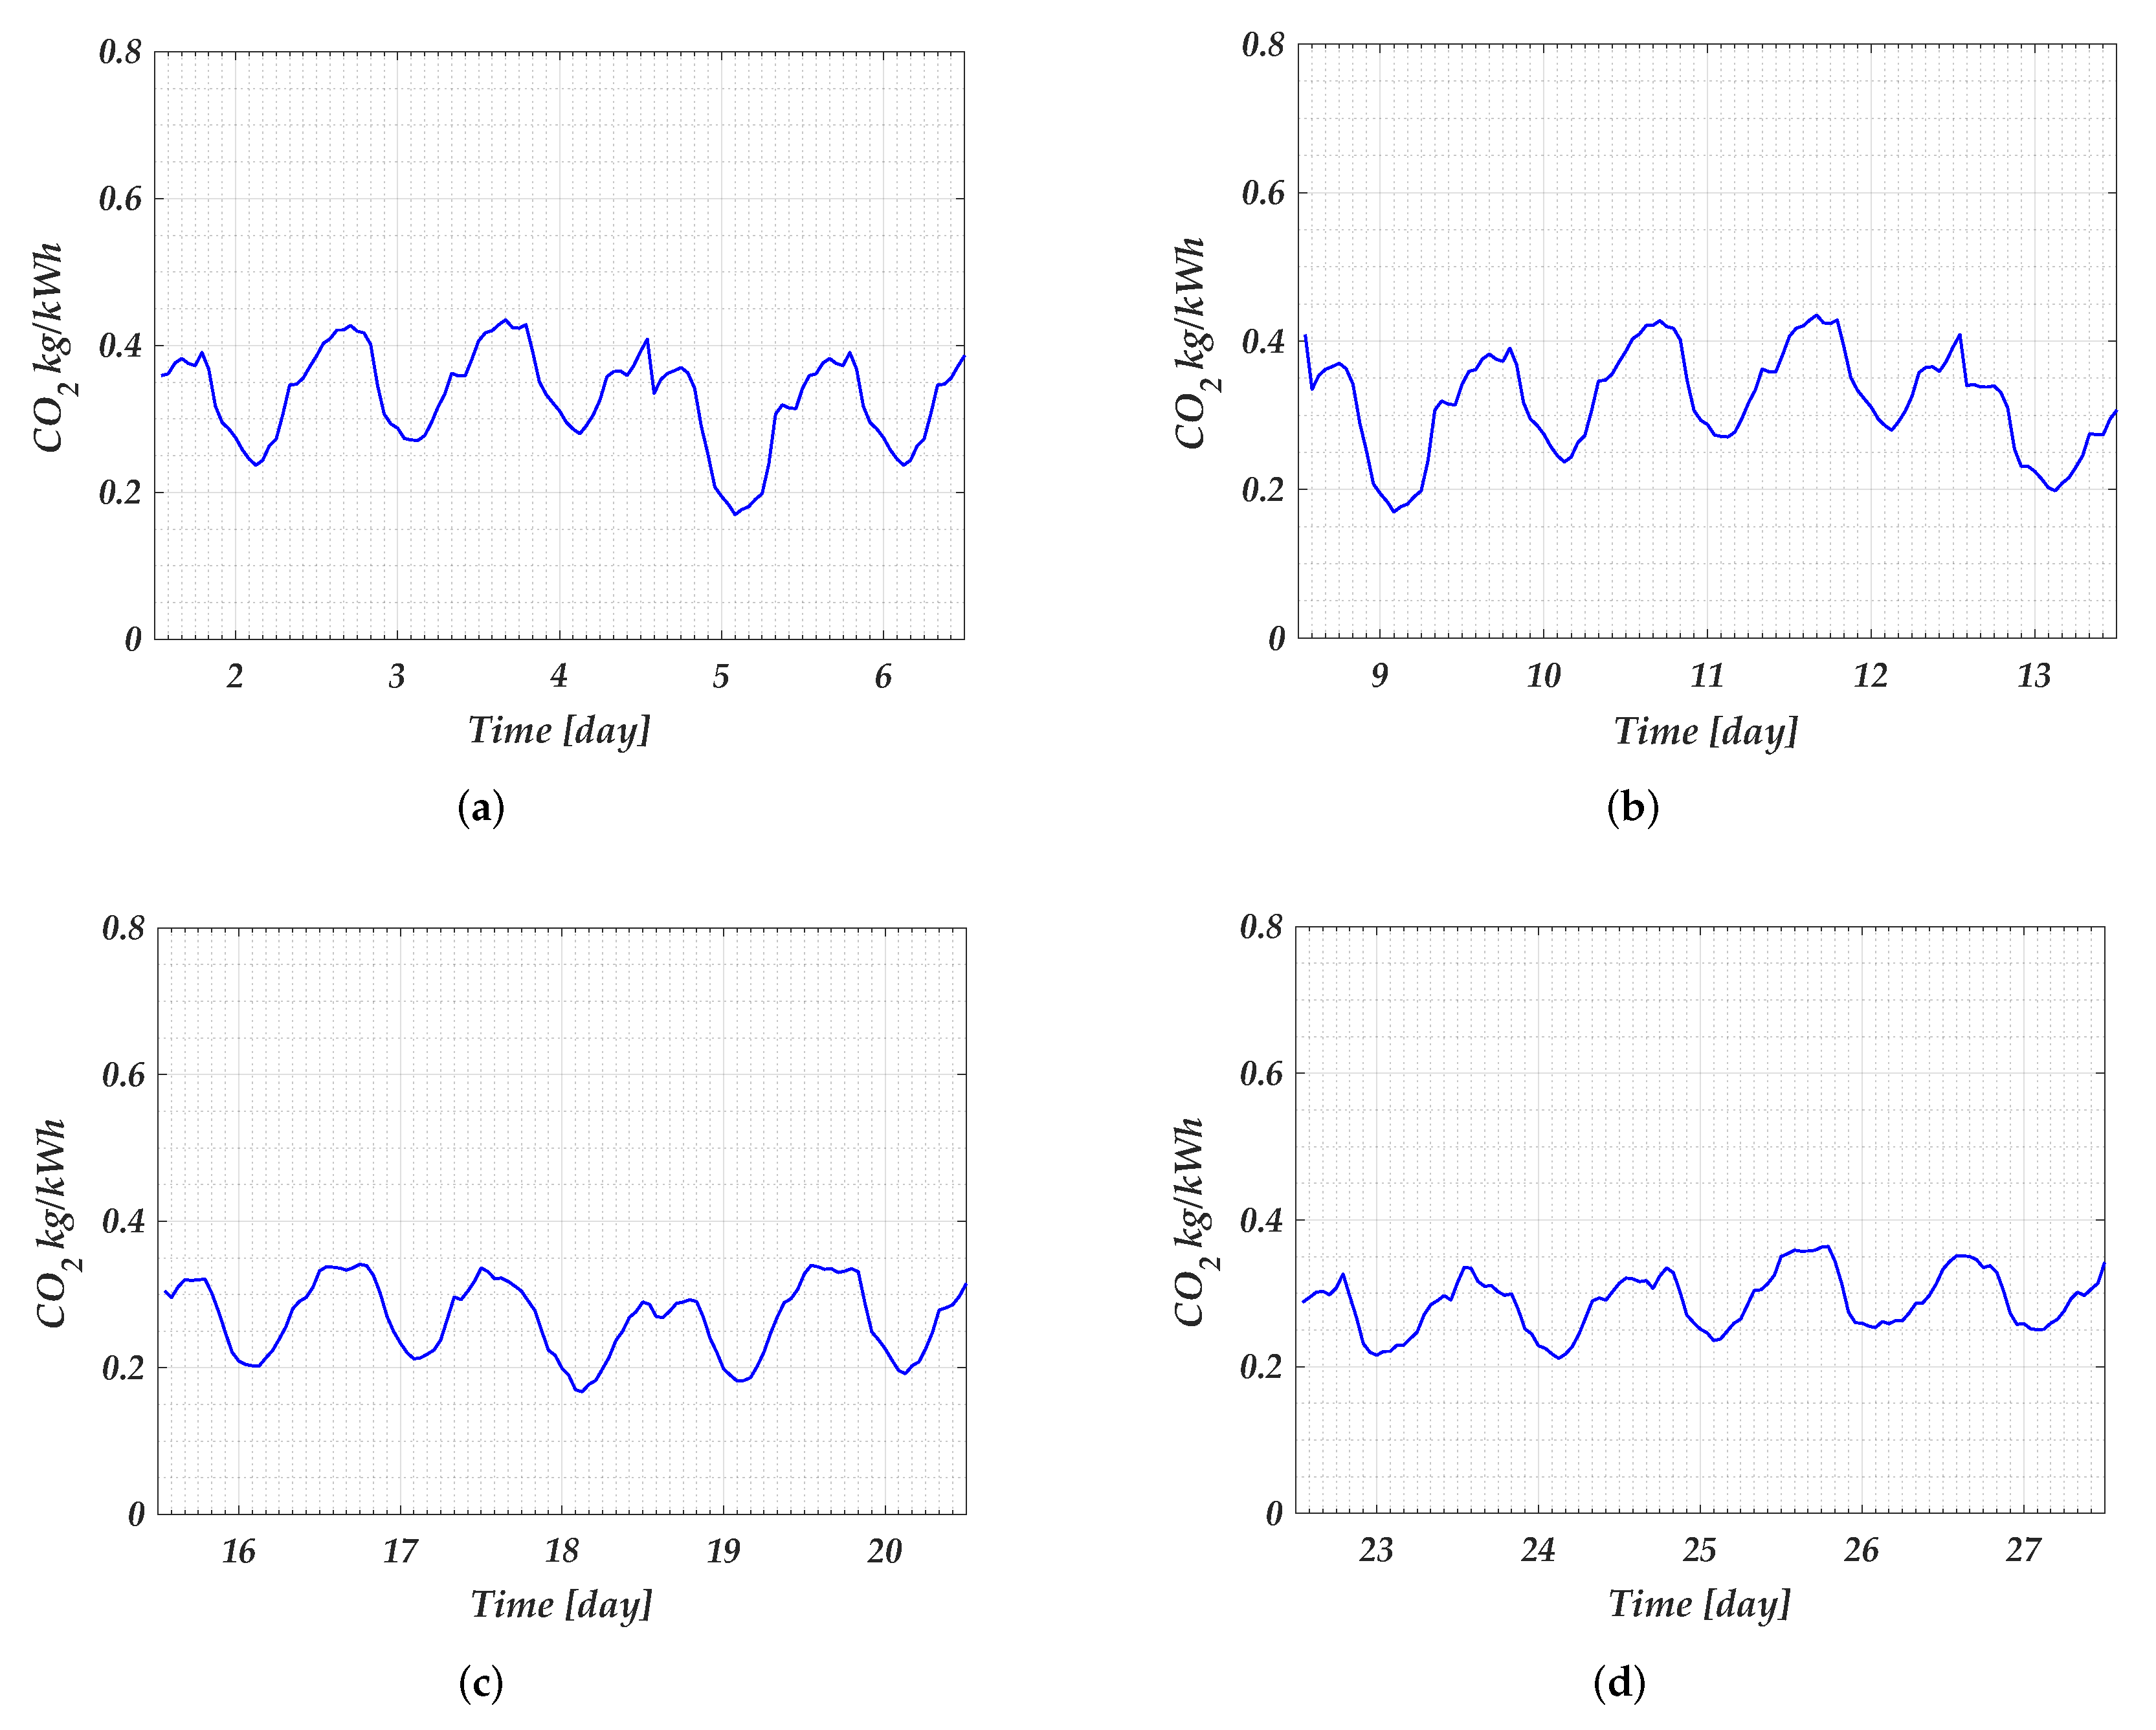
emissions were due to its connection to the grid. The calculation of these emissions depends on the emissions factor, which varies every hour as it depends on the type of power generation. The emissions factor profile for each week is shown in
Figure 7.
Table 4 presents the minimum and maximum
emissions factor for each week. This factor was used to calculate the total emissions generated by the charging station when the grid needed to supply power to the EV.
Every day, the minimum value occurred close to midday. Meanwhile, the maximum occurred between 7 and 9 pm. Then, the started to reduce again until its minimum. During the first and second weeks, the maximum was higher than 0.4 kg/kWh on two days. However, the maximum was lower than 0.36 kg/kWh in the third and fourth weeks.
Table 5 presents the total emissions of the charging station using the
presented above. This table presents a comparison of the emissions generated by both EMSs. Using the conventional EMS, the maximum emissions occurred in weeks one and two because during these weeks,
was also high. However, using the two-stage optimization, the emissions were reduced by 37% for the first week and 27% for the second week. During the month, there was a total reduction of 32% due to the use of the two-stage optimization.
5.3. Economic
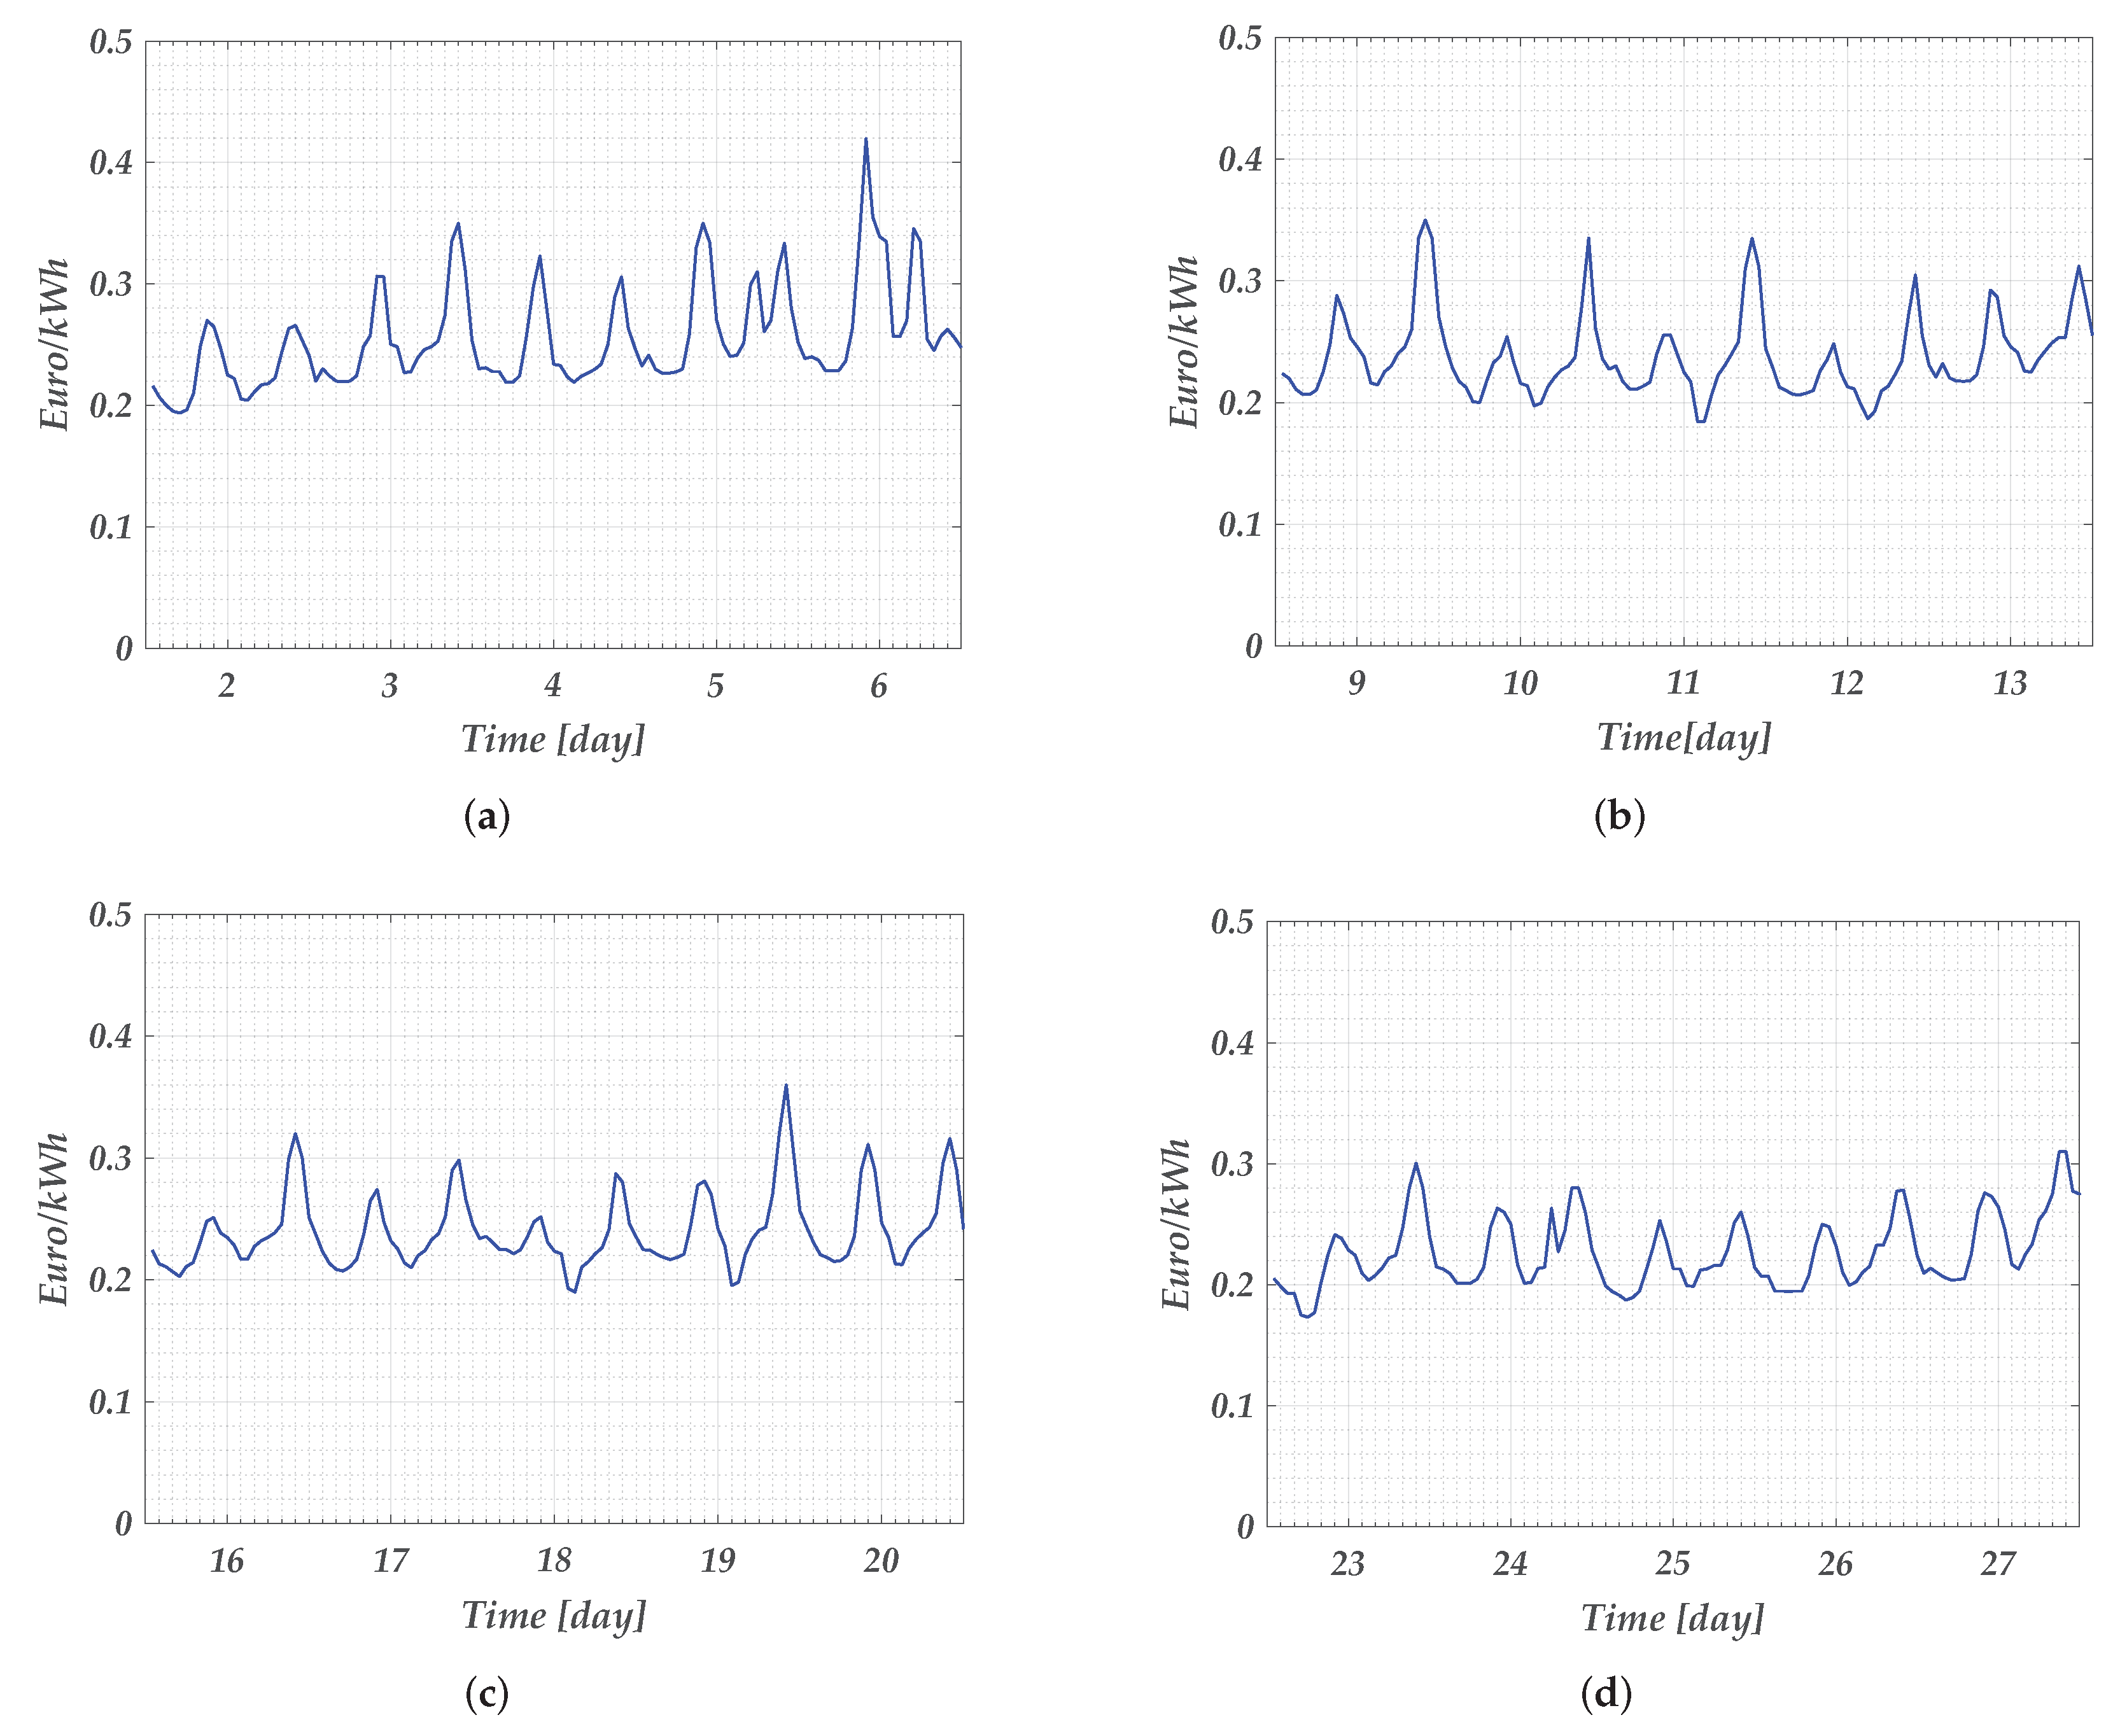
Because the charging station connects to the electrical grid to supply energy to the EV when necessary, the cost of its use depends on the electricity costs. The costs for each week of May are shown in
Figure 8.
Table 6 shows the minimum and maximum values per week. The electricity costs varied cyclically, with two maximums per day, one in the early morning (8 to 10 am) and one in the evening (7 to 9 pm), which was the same for the maximum
. However, the minimum and maximum values were aleatory during the week. In week one, the maximum value for the entire month was reached and was equal to 0.419 EUR/kWh. During the fourth week, the smallest electricity cost variation occurred, with a minimum of 0.17 EUR/kWh and a maximum of 0.31 EUR/kWh.
Table 7 presents the total cost due to the connection of the charging station to the grid using either of the two EMSs presented in this paper. The highest costs were for week one, followed by week two. Using two-stage optimization, week 1 showed a reduction in costs of 31% in comparison with the conventional EMS. The same percentage of cost reduction occurred during week 4. Taking into account the complete month, the reduction of the costs was close to 30% using the two-stage optimization.
5.4. General Discussion
Although the conventional EMS is an easy algorithm to implement and supplies the power that the EVs need, it is not the best solution for the environment and has high operation costs. Moreover, the system is underused by the PV/BESS system and does not take advantage of the presence of solar irradiance and stored energy. Thus, a correct allocation of energy by varying the maximum power the charging station can provide helps to reduce the effect on the environment and the operation costs.
By taking into account the two-stage optimization, a day-ahead energy schedule is developed where the maximum values of the power from the grid are set together with the maximum values that the EVs can demand. During the real-time operation, at every time step, the optimization considers these constraints together with the real-time electricity costs and the to determine the best response. Although the EV’s demand is affected using the two-stage optimization, it is only reduced by 15%. This two-stage optimization reduces the total emissions by 32% and the energy costs by 30%. Thus, using this EMS ensures the correct allocation of energy from the PV/BESS and helps to enhance the operation of the charging station. Moreover, the algorithm proposed in this paper is easy to implement using the EMS’s platform. API communication helps to obtain the necessary data from the electrical system and impose the new control values on the charging station. The computation time for the first stage of optimization is less than 5 s, and for the second stage, optimization takes less than 0.5 s. Because the MPC control time is 5 min, the time to complete the optimization does not affect the system’s operation.


 ,
, 


