Article

Artificial Intelligence Model for the Identification of the Personality of Twitter Users through the Analysis of Their Behavior in the Social Network

by
William Villegas-Ch.
1,2,*,
Daniel Mauricio Erazo
1,
Iván Ortiz-Garces
1,
Walter Gaibor-Naranjo
3 and
Xavier Palacios-Pacheco
4
1
Escuela de Ingeniería en Tecnologías de la Información, Facultad de Ingeniería y Ciencias Aplicadas (FICA), Universidad de Las Américas, Quito 170125, Ecuador
2
Facultad de Tecnologías de Información, Universidad Latina de Costa Rica, San José 10101, Costa Rica
3
Carrera de Ciencias de la Computación, Universidad Politécnica Salesiana, Quito 170105, Ecuador
4
Departamento de Sistemas, Universidad Internacional del Ecuador, Quito 170411, Ecuador
*
Author to whom correspondence should be addressed.
Electronics 2022, 11(22), 3811; https://doi.org/10.3390/electronics11223811
Submission received: 27 September 2022 / Revised: 1 November 2022 / Accepted: 1 November 2022 / Published: 19 November 2022
(This article belongs to the Special Issue Artificial Intelligence Technologies and Applications)

Abstract

:
Currently, social networks have become one of the most used channels by society to share their ideas, their status, generate trends, etc. By applying artificial intelligence techniques and sentiment analysis to the large volume of data found in social networks, it is possible to predict the personality of people. In this work, the development of a data analysis model with machine learning algorithms with the ability to predict the personality of a user based on their activity on Twitter is proposed. To do this, a data collection and transformation process is carried out to be analyzed with sentiment analysis techniques and the linguistic analysis of tweets. Very successful results were obtained by developing a training process for the machine learning algorithm. By generating comparisons of this model, with the related literature, it is shown that social networks today house a large volume of data that contains significant value if your approach is appropriate. Through the analysis of tweets, retweets, and other factors, there is the possibility of creating a virtual profile on the Internet for each person; the uses can vary, from creating marketing campaigns to optimizing recruitment processes.

1. Introduction

Currently, social networks have become the communication channels most used by people. The existing interaction between people and groups has transformed social networks into the largest existing source of data worldwide. According to the studies reviewed, it is established that social network users grew by 227 million over the past year, reaching a total of 4.7 billion at the beginning of July 2022. The global base of social network users has increased by more than 5% in the last 12 months [1,2]. The global total of social network users currently represents 59% of the total world population. These figures point to a slowdown in digital growth compared to the 2020–2021 period, where an exponential increase was recorded at the peak of the 2019 Coronavirus disease (COVID-19) pandemic [3].
However, despite the current slowdown, trends indicate that by 2023, the two strongest populations of the world will be online using at least one social network. Therefore, it is possible to assume that society is at a turning point in digital growth [4]. As a result, the coming years will see a flatter growth curve with an inevitable slowdown. However, the world population will be increasingly connected, which means that social networks are part of the lives of most people in the world. This leads to a change in the paradigm of the use of social networks, to the point that the question is not whether the population is using these technologies, but why they are using them and how they take advantage of the opportunities.
Several works, which validate the data found in the Reuters Institute’s digital news report, mention that people are currently 2.5 times more likely to go to social networks to search for the news [5]. This tendency was evaluated with participation in surveys on the use of social networks [6]. Among the groups surveyed, it was found that six out of ten women use social networks and messaging services to consume news content. Regarding the time that users spend on social networks, related studies mention that the results change according to age and sex, for example, people between 16 and 24 years old dedicate more time to these platforms [7], and it has been identified that the networks have more male than female users with 53.9% versus 46.1%, respectively. However, studies show that women at any age tend to spend more time on social media.
Concerning the most used social networks, the top eight of those that are preferred by people and companies is established. Among these are Facebook, YouTube, WhatsApp, Instagram, TikTok, Twitch, Twitter, and LinkedIn [8,9]. Of these platforms, Twitter stands out, with 436 million active users per month, which makes this a suitable data source for trend analysis and other studies. Twitter is a free social network that is used to send short messages of up to 280 characters. This platform is ideal for user interaction through the expression of feelings, sharing opinions, conversing with different people, reacting to trends and ideas, etc. These characteristics make Twitter data ideal for identifying user behavior and allowing the prediction of their personality [10].
In personality prediction, several works carried out a psychological analysis, and with the results, several researchers have generated different models that allow identifying the traits of people that define their personality. With these models, it is possible to discover the relationships behind personality and psychological disorder [11], job performance [12] and satisfaction, and even in interactions with other people. The large amount of information existing in social networks and their millions of users make this an adequate source for personality analysis of a given population. In the reviewed work, a personality test is applied in the prediction of the personality of users on Twitter. In other works, such as [13], neural networks and the Twitter user personality prediction test was applied. Using the information from Twitter, they have tried to solve problems of various origins, for example, they have tried to identify the mood of people [14], predict fluctuations in the stock market, identify pedophiles on chat websites, generate user profiles [15], and more.
Social networks have become a means to make our ideas and thoughts public, giving way to an increase in user discourse that leads to determining their state of mind. There are even cases where it is common to spread racist, xenophobic, and intolerant messages or point out others as a threat. These behaviors on social networks are mainly directed toward groups of vulnerable people [16]. It is for this reason that a method able to capture the data of social networks is necessary, and with this, the emotions of the users identified. By having a method that can be replicated, the fields of application are various and can help organizations improve the quality of life of people in all aspects that society requires.
Currently, one of the problems that needs solving in natural language processing (NLP) is author profiling; this is the problem of identifying, through the text that the user writes, the demographic characteristics of the author of that text [17]. The most common traits identified are gender and age range. However, other demographic aspects are of interest, not only to the computing community, but also to areas of the social sciences, particularly psychology [18,19]. This aspect is known as the identification of personality traits, which is considered as one more dimension to the problem of author profiling. This work proposes the development of a machine learning model for personality prediction. For this, Twitter data is taken and processed to identify the behavioral traits of a given population [20,21].

2. Materials and Methods

According to related work, social networks are capable of highlighting attributes that people do not transmit to the outside world on a day-to-day basis. This breaks the paradigm of those who believe they know themselves when the Internet can know them more than the person himself. Likewise, the work [22] mentions that the tweets that users write every day have a strong correlation with their personality, specifically with the five great personality traits [23]. What can be discovered by performing a textual analysis of the words that people write in their tweets? For example, in the results found by the authors, they identify that the words related to the family have a stronger correlation with the extraversion trait, or the words related to health have a higher correlation with the conscientiousness trait. According to the article [24], the most popular social networks are Facebook and Twitter. In article [25], a business analysis functionality is offered that contemplates the use of opinions carried out in software applied to companies in general and, thus, facilitates the polarity of the content. Based on the study carried out in [26], the development of a technology capable of helping opinion-free exploration and perception with the help of vector support machines is recommended, that is, the opinions represent the analysis; however, it lacks a specific topic since tweets in general are analyzed. In this way, you can identify how they use systematized processes to find the result. The work [27] presents the development of a tweet classification model using supervised machine learning with artificial neural networks, which segmented the users of a Twitter account into categories. In this work, information was collected from a representative sample of network users with personal online surveys, using the qualitative methodology, which consisted of conducting personal interviews. This work achieves an analysis of the perception of users through their digital images. Other projects have developed an automatic summary system that is based on the extraction of the most representative tweets with the help of systems based on latent semantic analysis which counts the popularity of a tweet [28].
Another of the works reviewed [29] estimates the personality of individuals, preparing a survey using the characteristics of the Big Five Inventory (BFI) and applying it to 295 Twitter users. This research uses three machine learning methods known as support vector machine (SVM), K-Nearest-Neighbor (KNN), and Multinomial Naive Bayes (MNB) [30], where they combine Linguistic Inquiry Analysis and Word Count (LIWC) to obtain a better performance of the personality prediction system. These methodologies are taken as the basis for the design of a model capable of predicting the personality of university students through the application of automatic learning techniques and algorithms [31]. In addition to the hypotheses found in the related works, several concepts that are part of the proposed method are used in this one. In addition to these models, the work [28] discusses the design of a data mining strategy to analyze the sentiments of the tweets regarding the special jurisdiction for peace, carrying out an investigation with which it is sought to order and execute a series of steps to perform this process optimally and sustainably [32]. In its results, a data mining model is implemented to classify the corresponding tweets based on the feelings of the users to know their position regarding a specific topic and its processes.

2.1. Development Tools

For the development of the machine learning algorithm, the use of open-source software has been arranged. This selection is so the method can be replicated by as many sectors as possible, without licensing limitations. Another factor that influences the use of this type of tool is the volume of existing information on their use, as well as the availability of libraries and datasets that can be used for algorithm training [33].
Python version 3.11.0, created by Guido van Rossum in 1991 in the USA, has several libraries that allow the use or integration of various additional features. Of those that have been considered for this work is Tweepy, which allows easy and automated access to Twitter’s application programming interface (API) that uses functions associated with the original endpoints of the application. The next library is Pandas, which is used for the management and analysis of data structures, with the option of creating new structures with more functionalities based on arrays from the NumPy library. Another library is Seaborn, which allows the presentation of the results through detailed graphics, it is based on Matplotib, and provides a high-level interface [34]. For the NLP tasks, the natural language toolkit and TextBlod are used, which allow morphological analysis, entity extraction, opinion analysis, sentiment analysis, and automatic translation, among other tasks.

2.2. Machine Learning

Machine learning belongs to the field of AI, which creates systems that learn automatically. In this context, learning means that systems can identify complex patterns in millions of data [35,36]. The machine that learns is an algorithm that reviews the data and can predict future behavior. Machine learning is classified in different ways depending on how you want to train the algorithm, among these types the following stand out:
  • Supervised learning;
  • Unsupervised learning;
  • Reinforced learning;
  • Semi-supervised learning;

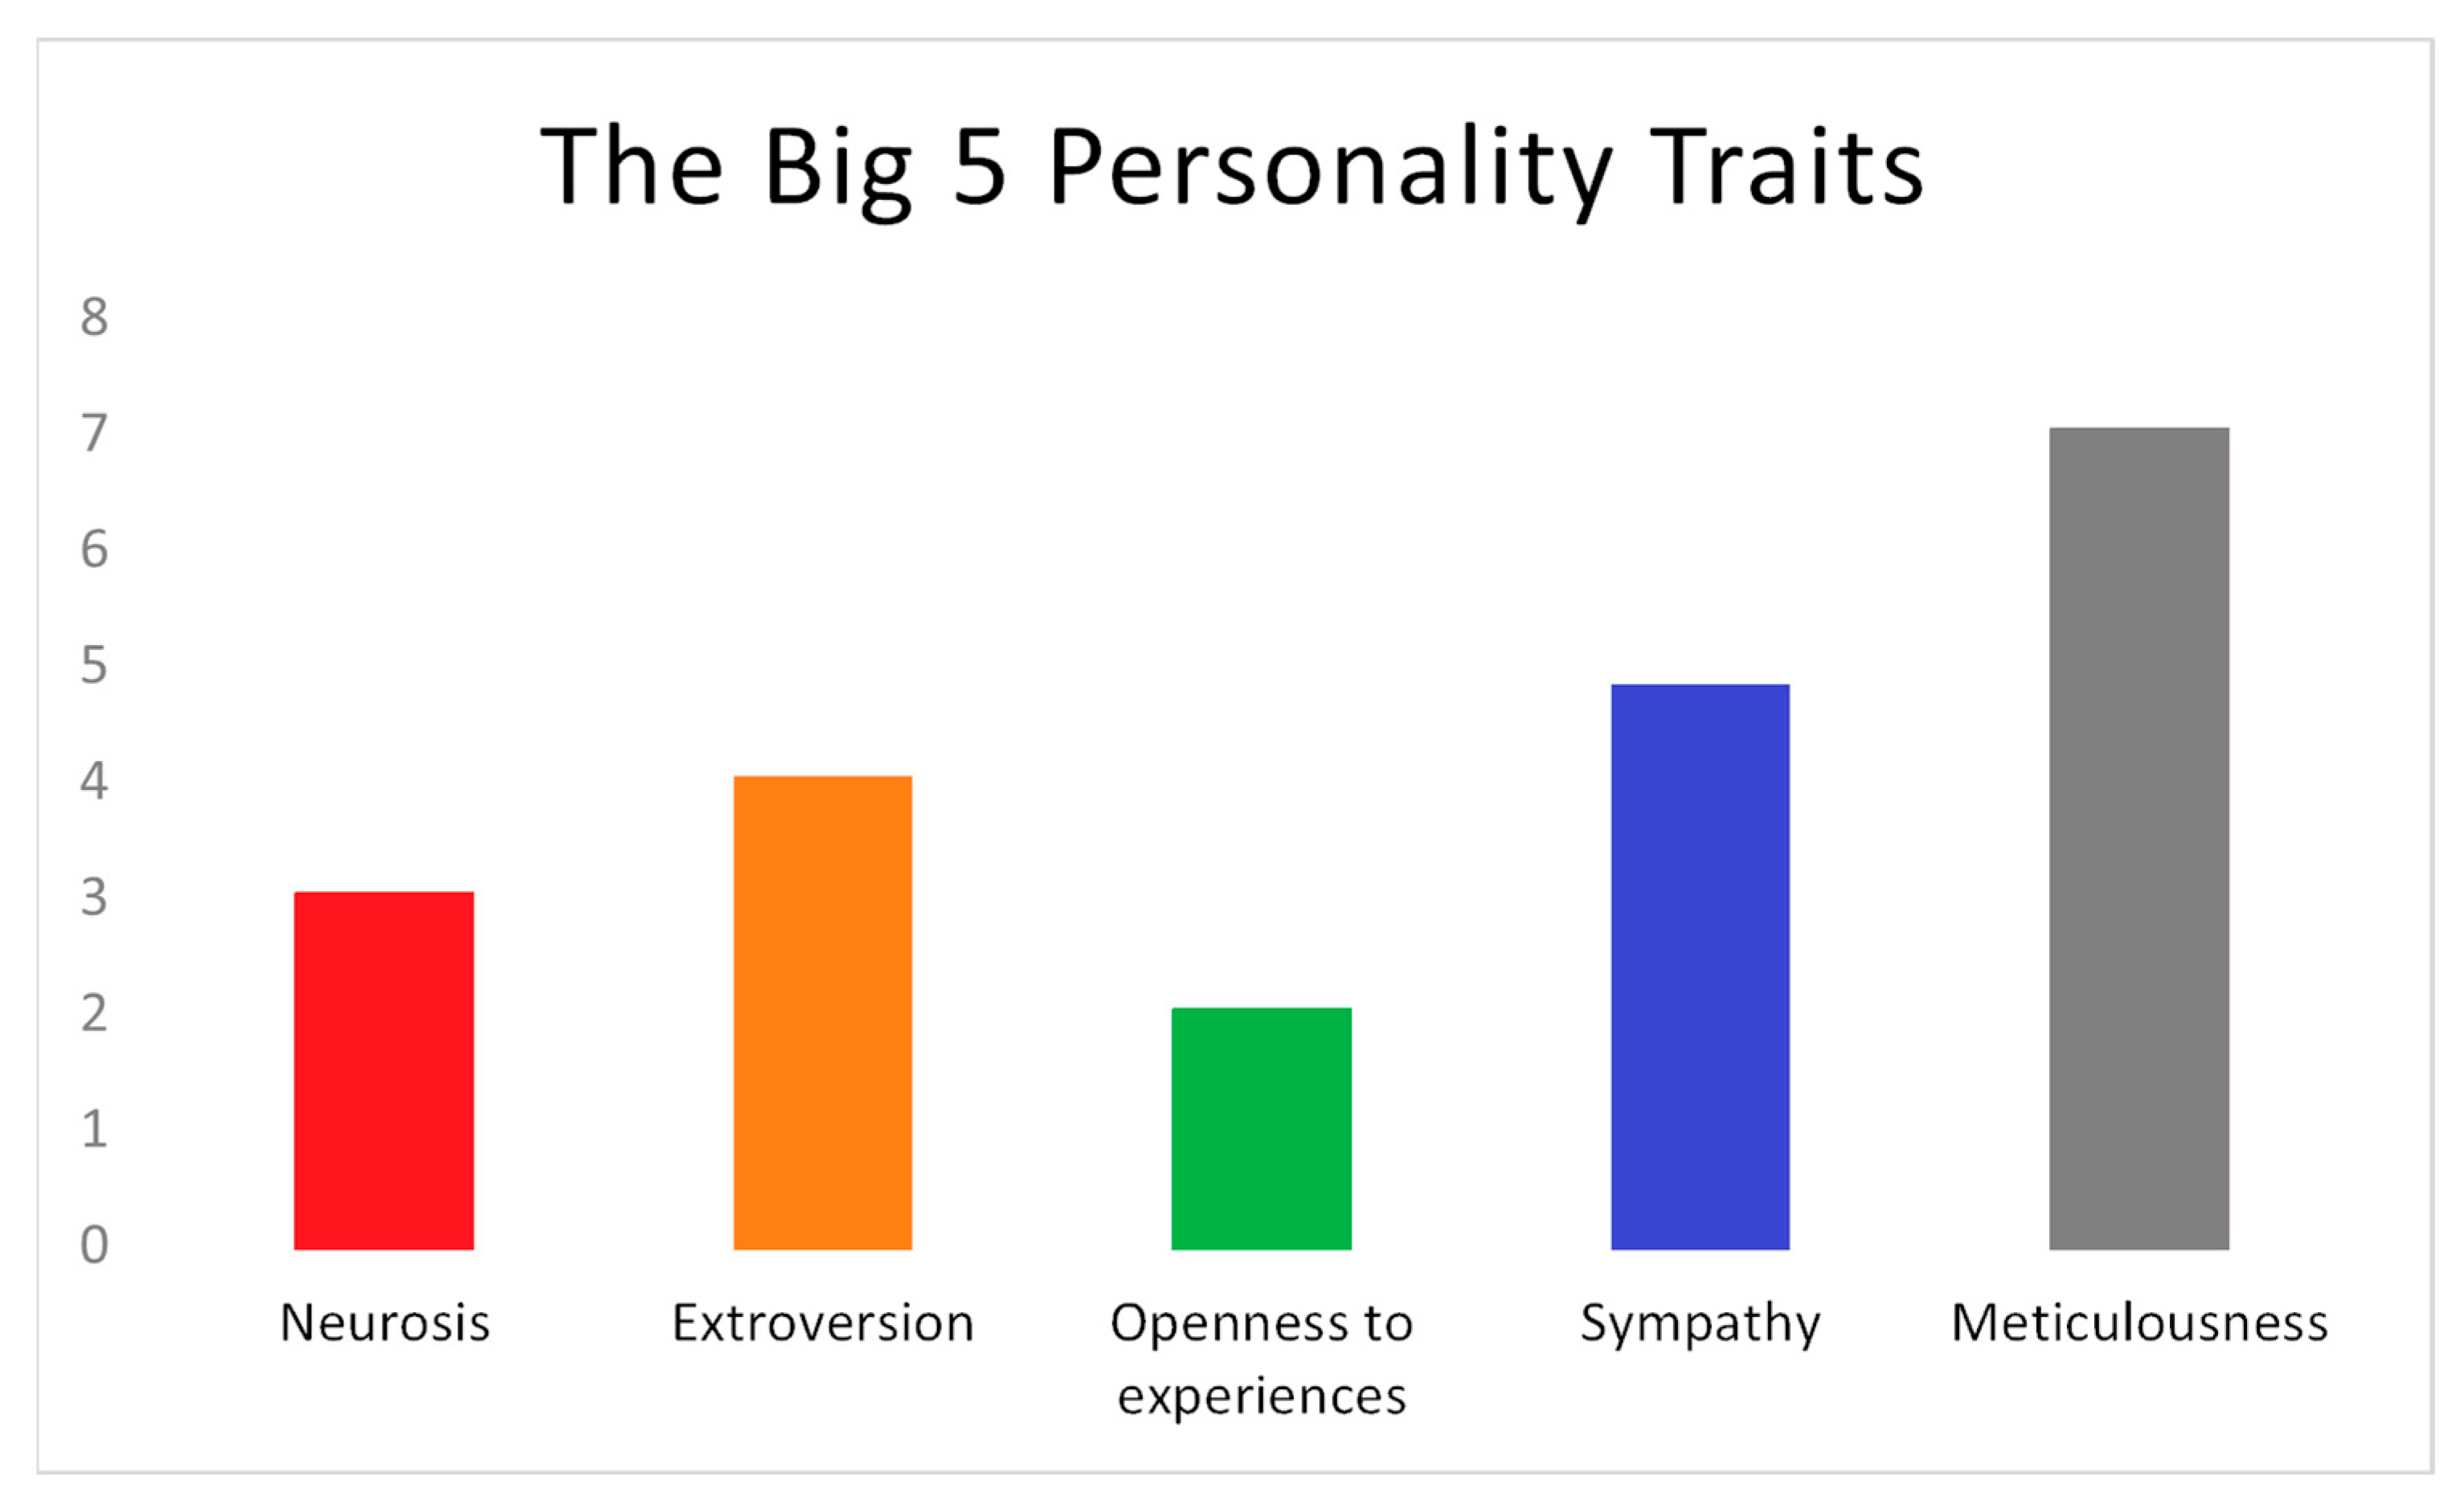
2.3. The Big Five Personality Traits

Why does everyone behave differently in different situations and contexts? How can we explain that brothers raised in the same environment are so opposed to each other? In recent centuries, these types of questions about the personality of human beings have been finding certain answers thanks to research in the field of the psychology of individual differences [29]. The Big Five model is a pattern in the study of personality that examines its structure, based on five broad elements or personality traits. It is one of the most used theoretical bodies to define and measure what the personality of everyone is like, and these are:
  • Openness to experiences: people with this personality tend to seek new personal experiences and prefer to break the routine. These types of people are more creative and know different topics thanks to their intellectual curiosity.
  • Meticulousness: in this case, this type of person usually has self-control, they have a great ability to plan and organize. In addition, they tend to be introverted and develop a behavior of perfectionism or obsession, usually requiring a balance to avoid reaching these extremes.
  • Extraversion: the subject with this personality is open with others and is focused on social environments. These people have a better type of communication with large groups of people and tend to relate more personally than on social networks.
  • Kindness: people in this category rely on honesty and are willing to lend help to people in need, and tend to be respectful, tolerant, and calm people.
  • Neurosis or emotional instability: those who have this personality have unpredictable behavior, are reactive people in intense situations, and tend to have negative thoughts.
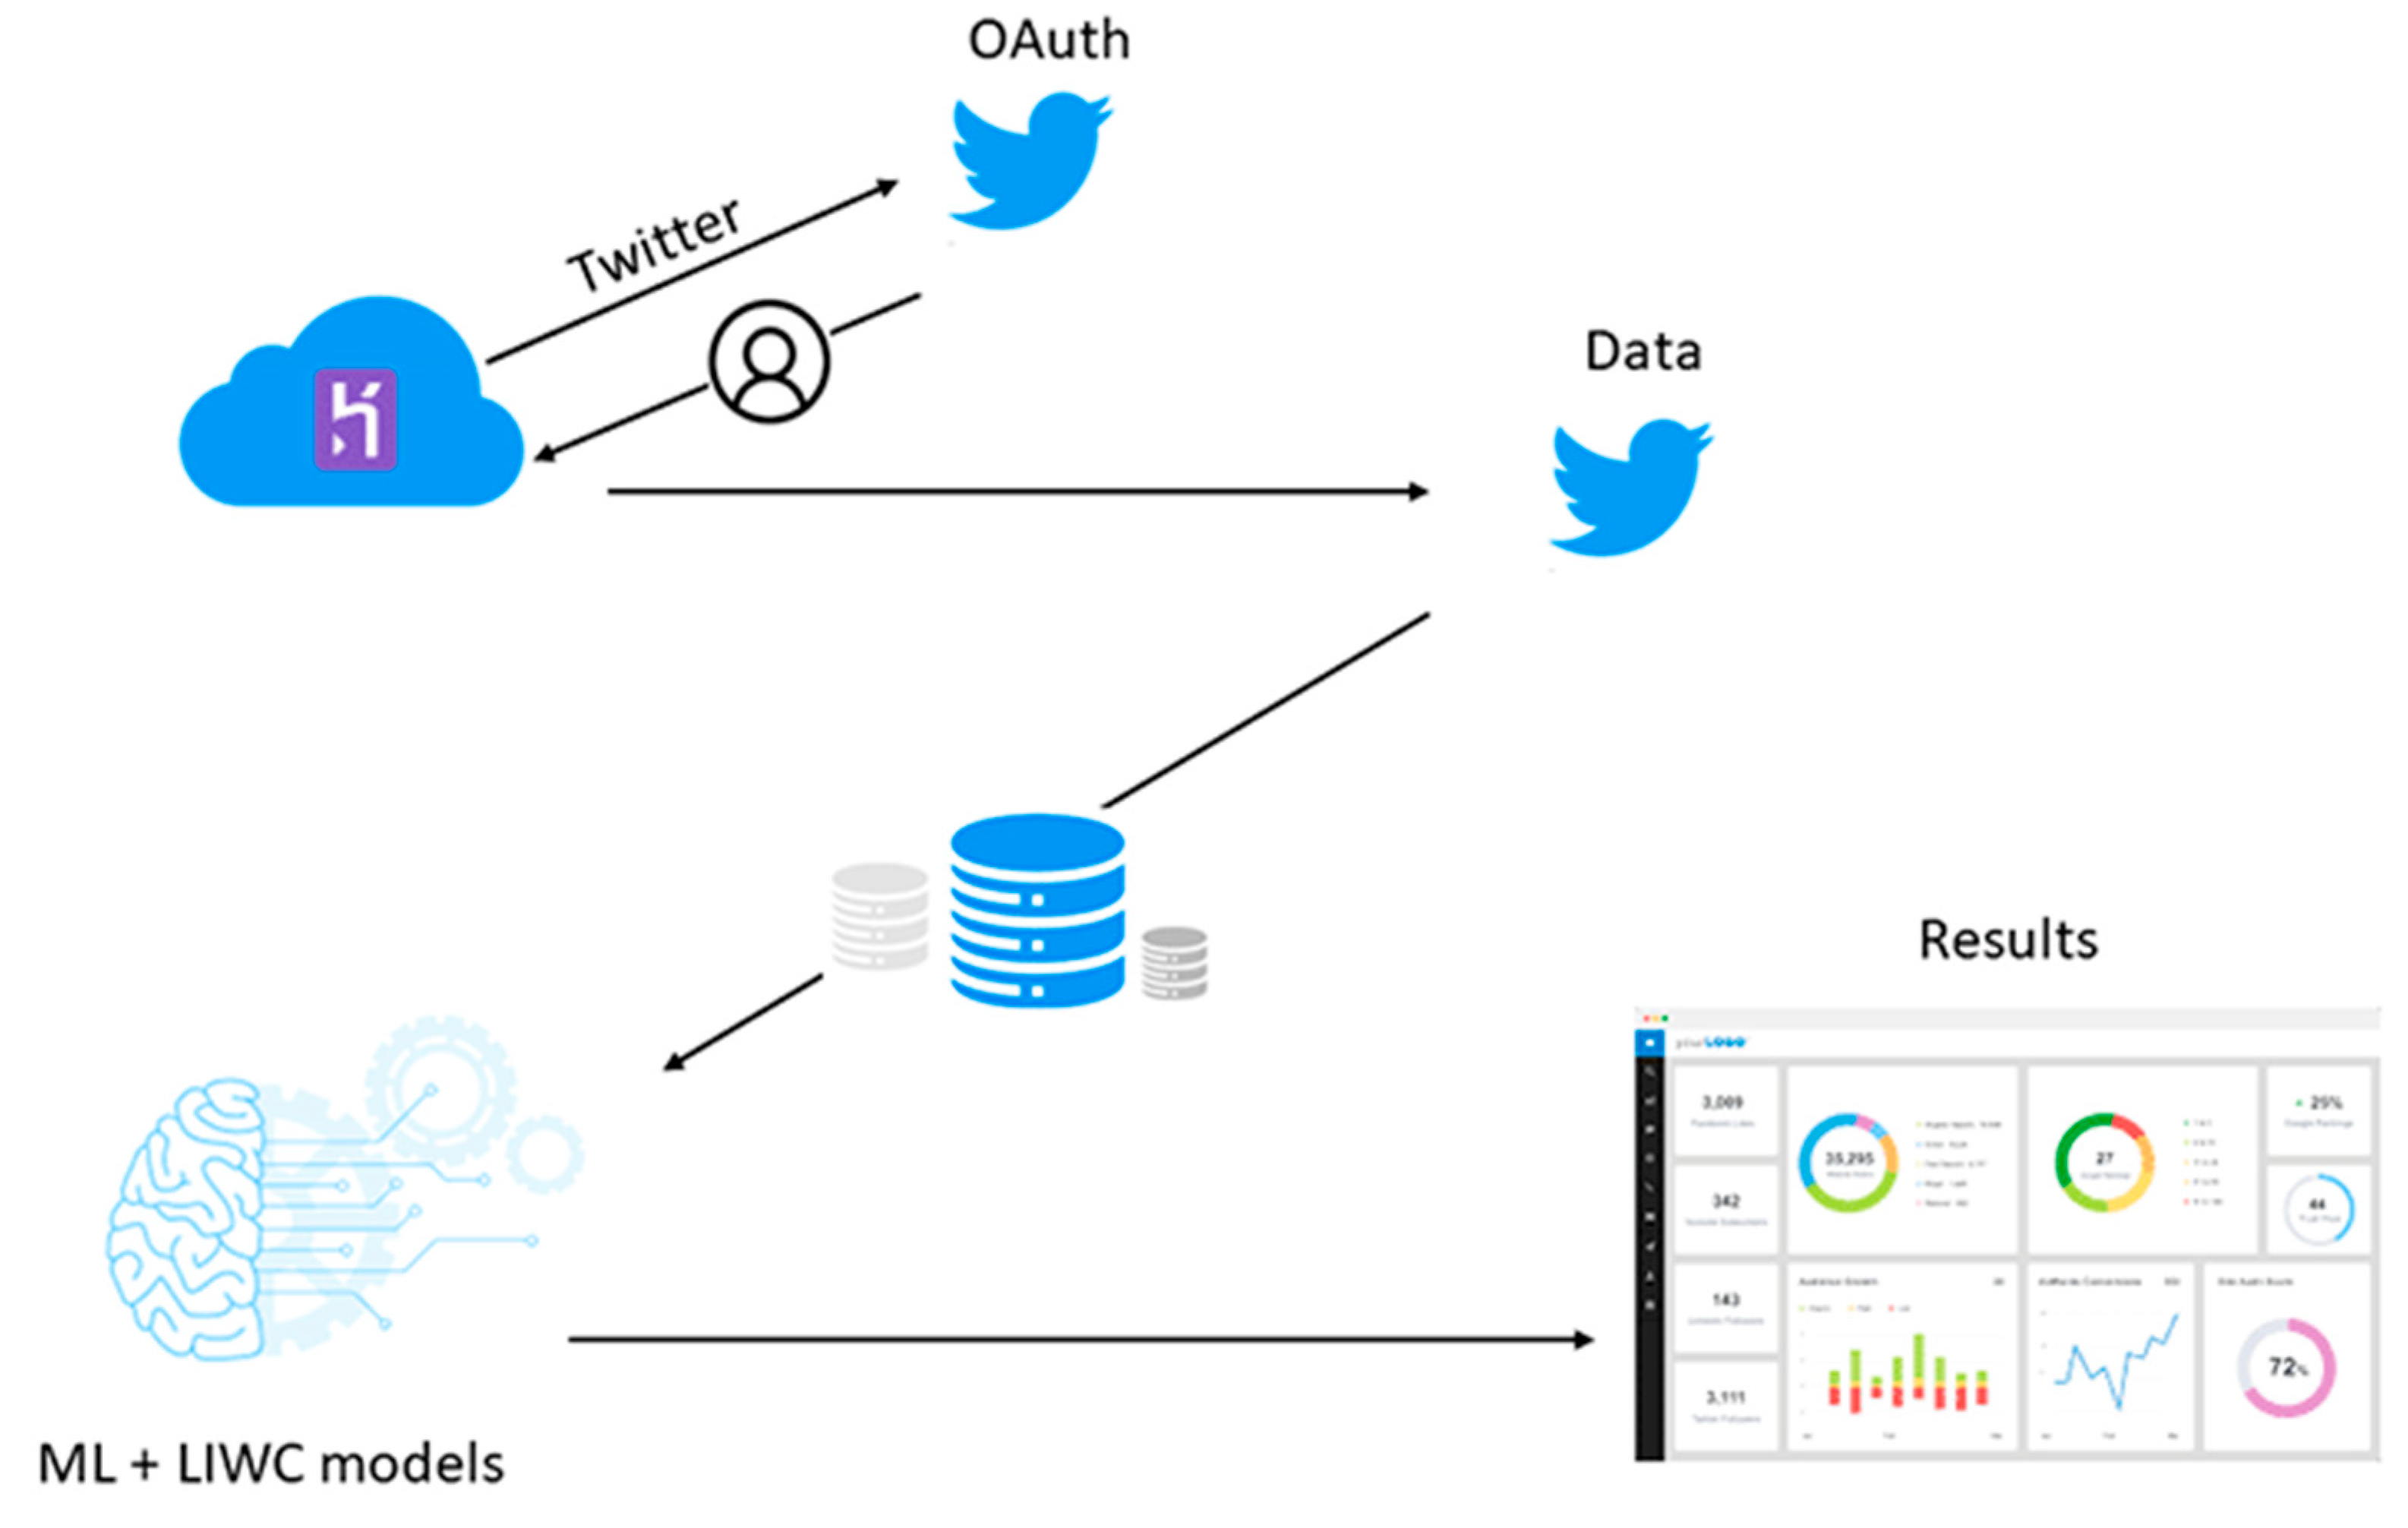
2.4. Method Design

The method focuses on the development of a machine learning model for personality prediction based on the behavior of a person on the social network Twitter. To meet this objective, the use of a method by phases aligned to knowledge discovery in databases (KDD) is proposed for the first two stages and the final stages focus on the design of the AI model [37,38].
  • Population identification and data collection;
  • Data preprocessing;
  • Sentiment analysis;
  • Training and evaluation of the AI model;
  • Implementation of the model in a real environment.

2.4.1. Population Identification and Data Collection

The selected population is part of a focus group of users that allows a quantitative or qualitative analysis of the study phenomenon. The group is made up of 21 students who belong to a university in Ecuador. These students belong to an administration career course. Of the group, 21 students are active Twitter users to whom a survey was applied where they must select their personality type [39]. This is based on the five personality traits; the results are presented in Figure 1. Of the 21 people surveyed, 7 are considered in the sympathy group, 5 in conscientiousness, 4 people are considered extraverted, 3 are in the category of neurosis, and 2 are open to experiences.
An important aspect in handling the data of a given population is the security of the information and that people know what the data is used for. For this reason, the group was informed that the use of their data from the use of the survey is part of an academic study seeking to establish initial parameters to determine the personality of people by using information technologies [40] and communication (ICT). In the survey, in addition, to the five major personality traits, additional data has been obtained that is used for subsequent analysis, one of the important data extracted is the Twitter username.
Once the population has been identified, the extraction phase begins with the creation of functions for data collection, for which the Jupyter Notebook cloud platform known as Deepnote is used. One factor that has been considered in the development of the model is that the data collection process is automatic and reusable. To achieve this goal, the Tweepy library is used to interact with the Twitter API and make requests to obtain the following data:
  • The number of followers;
  • The number of people you follow;
  • The total number of tweets;
  • Twitter ID of the user;
  • Retweets;
  • Total retweets;
  • The number of user mentions;
  • Tweets where the user is mentioned;
  • A total number of tweets the user has liked;
  • Tweets that the user has liked;
  • Tweets are written by the user.
For the collection of data, certain guidelines are followed, for example, the retweets of the users considered are those that are shown in the personal timeline. Mentions or labels to a user are also contemplated either by a response to another tweet or by interactions [41]. For data limitation, the last 100 original tweets, retweets, mention tweets, and tweets that the user has liked were collected.
The collection of retweets and tags affects the collection of data since these become data from random users. The collection of data from random users aims to create a basis for a correlation between the focus group whose personality traits are already known and their behavior on Twitter versus the data of random users that are the object of study for the training and validation of the machine learning model. The tweets generated by the focus group of users are processed to identify the frequent words used when writing a tweet, in addition to the most frequent words that they liked in the tweet, this information allows random users to be selected. Therefore, with the frequent words identified, a search of 50 tweets is generated for every 10 most-used words, and with these results, 21 selected users are identified [42]. For the data to be valid, the search tweets to be collected must be original and must have likes. From each collected tweet, the author is extracted, resulting in more than 2000 random users. However, for the analysis process, and considering the technological resources available, the sample is limited to 1,000 users. To avoid blocking the collection requests made to the Twitter APIs, the process is divided into batches of 500 users.

2.4.2. Data Preprocessing

Preprocessing takes the raw data and transforms it into a machine-readable format. Preprocessing includes two stages, data cleansing and data transformation. Data cleaning allows the fixing or removal of incorrect, corrupt, duplicate, or incomplete data from a dataset [43]. When analyzing data, you must verify that the dataset you are working with is as clean and complete as possible. In the data collected from the focus group and the group of random users, it is verified that there are no data that negatively affect the training of the AI algorithm.
For the preparation of textual data to functional data for the application of sentiment analysis algorithms, a procedure consisting of three steps is applied. Tokenization separates or segments each string of text into individual words. That is, it transforms a text string that is understandable for people into a string that is understandable for analysis. For example, if we clean a text string that is in Spanish because this is the language of the country where the work is carried out, we have “Ayer regrese a la casa tarde!!!”, and with the tokenization applied, [“Ayer”, “regrese”, “a”, “la”, “casa”, “tarde”, “!!!”] is obtained. In the next step, reserved words are removed, this includes all those words in common use that a search engine has been programmed to ignore, for example, la, a, en, le, etc. Therefore, the previous string would be [“Ayer”, “regrese”, “casa”, “tarde”, “!!!”]. In the next step, special characters that are within the text, such as punctuation, exclamation, question marks, etc., are removed. The text string is finally [“Ayer”, “regrese”, “casa”, “tarde”].
Data transformation is the process of converting data into appropriate formats for analysis or model training [44]. One of the common transformations that you need to perform on Twitter data is to identify the appropriate column to get the average number of words per tweet and the average number of hashtags per tweet. The averages allow us to analyze the relationship between the average number of words a person writes when posting a tweet and their personality. In addition, it is possible to identify the average number of hashtags that you can use when writing your tweets.

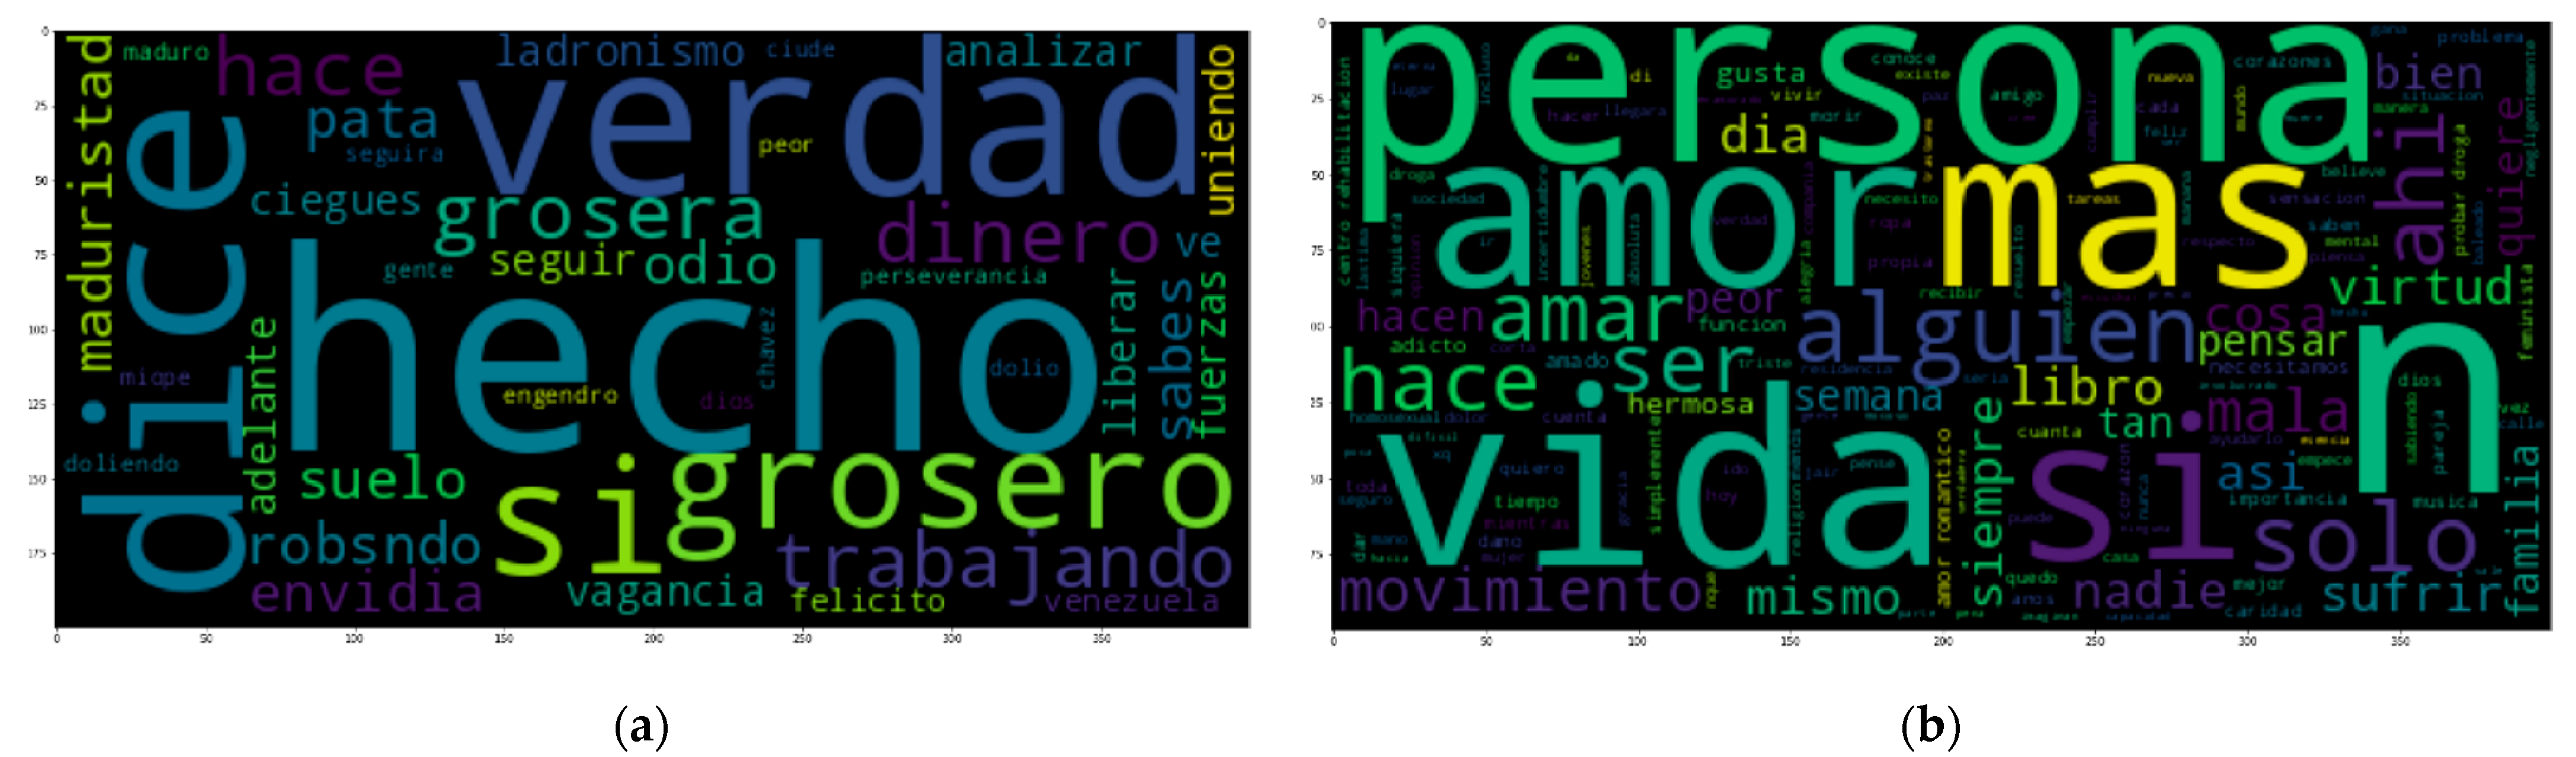
2.4.3. Sentiment Analysis

Sentiment analysis is the process that uses AI models and algorithms to categorize text into three polarized sentiments. The polarity of a text is a value that measures the strength of a positive, neutral, or negative feeling [45]. Currently, there are pre-trained machine learning algorithms that specialize in NLP [46]. The sentiment analysis process focuses on the polarity of the text, where there are values ranging from −1 to 1. Those values less than 0 are marked with a negative polarity, values equal to 0 are marked with a neutral polarity, and those values greater than 0 and close to 1 belong to a positive polarity. For this proposal, the Python TextBlob library is used in the sentiment analysis model. This library is widely used in the processing of textual data since it has a very simple API to perform NLP tasks, sentiment analysis, noun extraction, text translation, etc. Tweets present in the extracted dataset are the original tweets, those that have been liked, and the retweets of each user [47].
Once the categories have been identified, three tasks are applied for the analysis. The first is to obtain the average polarity of all the users’ tweets. In this process it is important to establish the language of the tweets, this depends on the country of the users. This work is carried out in Ecuador, therefore, most of the tweets are in Spanish. When using TextBlob, the process allows us to translate the tweets into English and perform the text analysis. The second task is to label the averages based on the range from −1 to 1, to define whether the comments are negative, neutral, or positive. The third task labels the polarities based on the feelings that are repeated the most.
Figure 2 shows the total number of negative, neutral, and positive sentiments in the analysis data set. Figure 2a shows the average number of negative, neutral, and positive sentiments for each category of tweets. The average obtained indicates that there are many tweets with positive feelings, followed by negative tweets, and with a lower percentage are tweets with neutral feelings. In Figure 2b, the common feelings found by category of tweets are presented, the results that it presents refer to the fact that there is a greater number of neutral feelings than positive feelings.
For the next stage of the analysis, the LIWC tool is used. This uses a dictionary of words that associates them with more than 70 linguistic categories, such as first-person pronouns, social categories, negative and positive content categories, etc. The tool uses the Open-Source library, and Empath, which analyzes and compares each existing word in a tweet with a dictionary of words available in the tool or custom dictionaries. From this information, the tool calculates the frequency of appearance of the words by category and finally returns the average appearance [24]. Below is an example of the configuration of the LIWC analysis model in a text with a negative connotation applied to three categories of tweets from the dataset used. The analyze_lexicon function is used in a text with a negative connotation and returns a series of linguistic categories based on the frequency with which they appear. In the example, categories whose words appear at least 25% within the phrase are filtered. The negative phrase is “I hate life I hate my family”, the results fall into three categories, hate, envy, and negative emotions, each with an appearance percentage of 25%. These results demonstrate the relationship between the phrase, the categories, and the effectiveness of the analysis tool.
  • result = analyze_lexicon (“I hate the life I hate my family”)
  • for k,v in result.items ( ):
    • if v >= 0.25:
    • print (f”{k}:{v}”)
  • Resulted:
    • hate = 0.25;
    • envy = 0.25;
    • nagtive_emotion = 0.25;
When making a comparison of the analysis using a text with a positive connotation, it is obtained in a small sentence, and there may be several categories of words, among the most relevant are love, science, school, reading, and positive emotions. The phrase used in this analysis is “I love learning”, the configuration and results are below.
  • result = analyze_lexicon (“I hate the life I hate my family”)
  • for k,v in result.items( ):
    • if v >= 0.25:
    • print (f”{k}:{round (v,3)}”)
  • Resulted:
    • school = 0.333;
    • love = 0.333;
    • science= 0.333;
    • reading = 0.333;
    • positive_emotion = 0.333;
An important aspect of text analysis is the elimination of stop words, within this group are those common words within a text that do not generate an added value or meaning. For example, the articles or prepositions that are used in the language such as the, or words such as for, with, of, etc. By eliminating the stop words, the complete words of the tweets are obtained for the calculation of frequent words used by users. The elimination of the stop words, the natural language toolkit (NLTK) and WordCloud libraries are used. NLTK allows you to perform text analytics and remove stop words through its list of stop words in Spanish and English. WordCloud is a library that calculates the frequency with which words appear within a text and graphs them in a word cloud.
The results of the analysis are presented with the use of a cloud of words; the larger the size of the word in the cloud, the greater the incidence of it being in the analyzed text. Figure 3 presents an example of frequent words from the original tweets of a user who, on average, has negative feelings, and another user whose tweets, on average, have positive feelings. In the negative connotation, Figure 3a, words such as rude, hate, envy, and thief are identified, all in Spanish. Figure 3b shows words with neutral and positive connotations, such as love, person, life, and virtue. In this figure, there is a word with a negative meaning, this is suffering, and it has a small size compared to the rest.

2.4.4. Training and Evaluation of the AI Model

In this stage, a machine learning model is used to recognize patterns in the analyzed dataset. The applied algorithm is regression, which considers the five columns of personalities with numerical values that result in the frequency percentages of each personality [48]. For the selection of the algorithm to train, an evaluation of three algorithms is carried out, which are linear regression, logistic regression, and random forest regression. Each of the statistical algorithms evaluated performs both classification and regression tasks, the latter being the one with the best performance.
For the evaluation, a dataset of 942 rows of data was segmented into 80% for training data and 20% for test data. Once the three algorithms have been trained with the training set, the error metrics are evaluated with the test data. The three algorithms obtained satisfactory results; however, the random forest regression algorithm stood out from the others because the resulting mean square error (MSE) was the lowest of all. In addition, this algorithm has the following advantages:
  • It is an algorithm of easy use and understanding of results;
  • It adjusts to large data sets since it can generate as many decision trees as necessary;
  • It tends to handle data overfitting through the random generation of trees based on the training set;
  • This algorithm tends to generate better accuracy in its predictions compared to decision trees or other similar algorithms.
For the regularization of the model, several hyperparameters have been established when training a machine learning AI model, and several hyperparameters are considered typical within the training, including the estimators, the precision, the percentage of the data used, etc. The evaluation of the hyperparameters is the result of experimentation; however, it is possible to use libraries that allow establishing the hyperparameters that fit the proposed models. For example, for RadomRorestClassifier, the get_params () method is used, which presents the potential hyperparameters that can be included in the learning; however, it is necessary to consider that the greater the number of hyperparameters, the higher the computational cost, among these they find each other:
  • Class_weight;
  • Criterion;
  • Max-depth;
  • Max_features;
  • Max_leaf_node;
  • N_estimators;
  • Max-samples, etc.
To begin processing of the data, the use of n_estimator is established, this has by default several estimates of 100; however, it is possible to adjust this value and create several models with smaller estimates, such as 10, 20, 30, etc. Another hyperparameter selected is the max_samples, which is the percentage of data used to build each tree, for example, a tree can be built with 10% of the data, and another with 30% or 60%. This hyperparameter allows variation in the creation of the trees that correspond to the forest. Another important hyperparameter is the criterion with which the variables are evaluated, for which it is possible to use the entropy or the Gini impurity, even including both in the same analysis. These criteria are included in the hyperparameter “criterion”. The configuration of the hyperparameters in the application has the following format:
  • Parameters = {“criterion”: (“gini”, “entropy”);
  • “n_estimators”: (10, 20, 30);
  • “max_samples”: (1/3, 2/3)}.
Once selected and given the values in each hyperparameter, it is necessary to establish the metric that interests optimizing, this metric is the most important in the domain and is generally the accuracy.
There are other methods by which the training of AI models is possible, for example, the Sklearn Python library allows the use of various machine-learning algorithms. Among them is RandomForestRegressor, which is the one applied in the analysis, the required hyperparameters are the number of estimators or decision trees to be generated and the maximum number of nodes in the tree. The values of the parameters are:
  • Estimators or decision trees = 100;
  • Maximum number of nodes = 100.
The model is trained with 754, where the numerical values to be predicted are the frequency percentages of the personality columns. The predictive variables are the following:
  • Number of followers;
  • Number of followed;
  • Total, user tweets;
  • Total number of tweets that the user has liked;
  • Average sentiment polarity of the user’s original tweets;
  • Average sentiment polarity of user retweets;
  • The average polarity of the sentiment of the tweets that the user has liked.
Another personality classification model is a multiple-label classification. This implies that a person may have more than one personality trait or no dominant personality trait at all. The multiple-label method used is a binary relevance that transforms each label into a binary with an independent assumption [16]. It uses a classifier for each tag and trains a classifier based on the transformed data. Naive Bayes is a classification algorithm based on the application of Bayes’ theorem [17]. Multinomial Naive Bayes (MNB) is a variation of Naive Bayes designed to solve the classification of text documents. MNB uses a multinomial distribution with the number of occurrences of a word or the weight of the word as the classification feature. The MNB equation is shown in Formula (1), where:
  • P(X|c) =probability document X in class c;
  • Nc = total documents in class c;
  • N = total documents;
  • t1 = weight term t;
  • ∝ = smoothing parameter.
    P   c = l o g N c N + i = 1 n l o g t i + i = 1 n t +

2.4.5. Implementation of the Model in a Real Environment
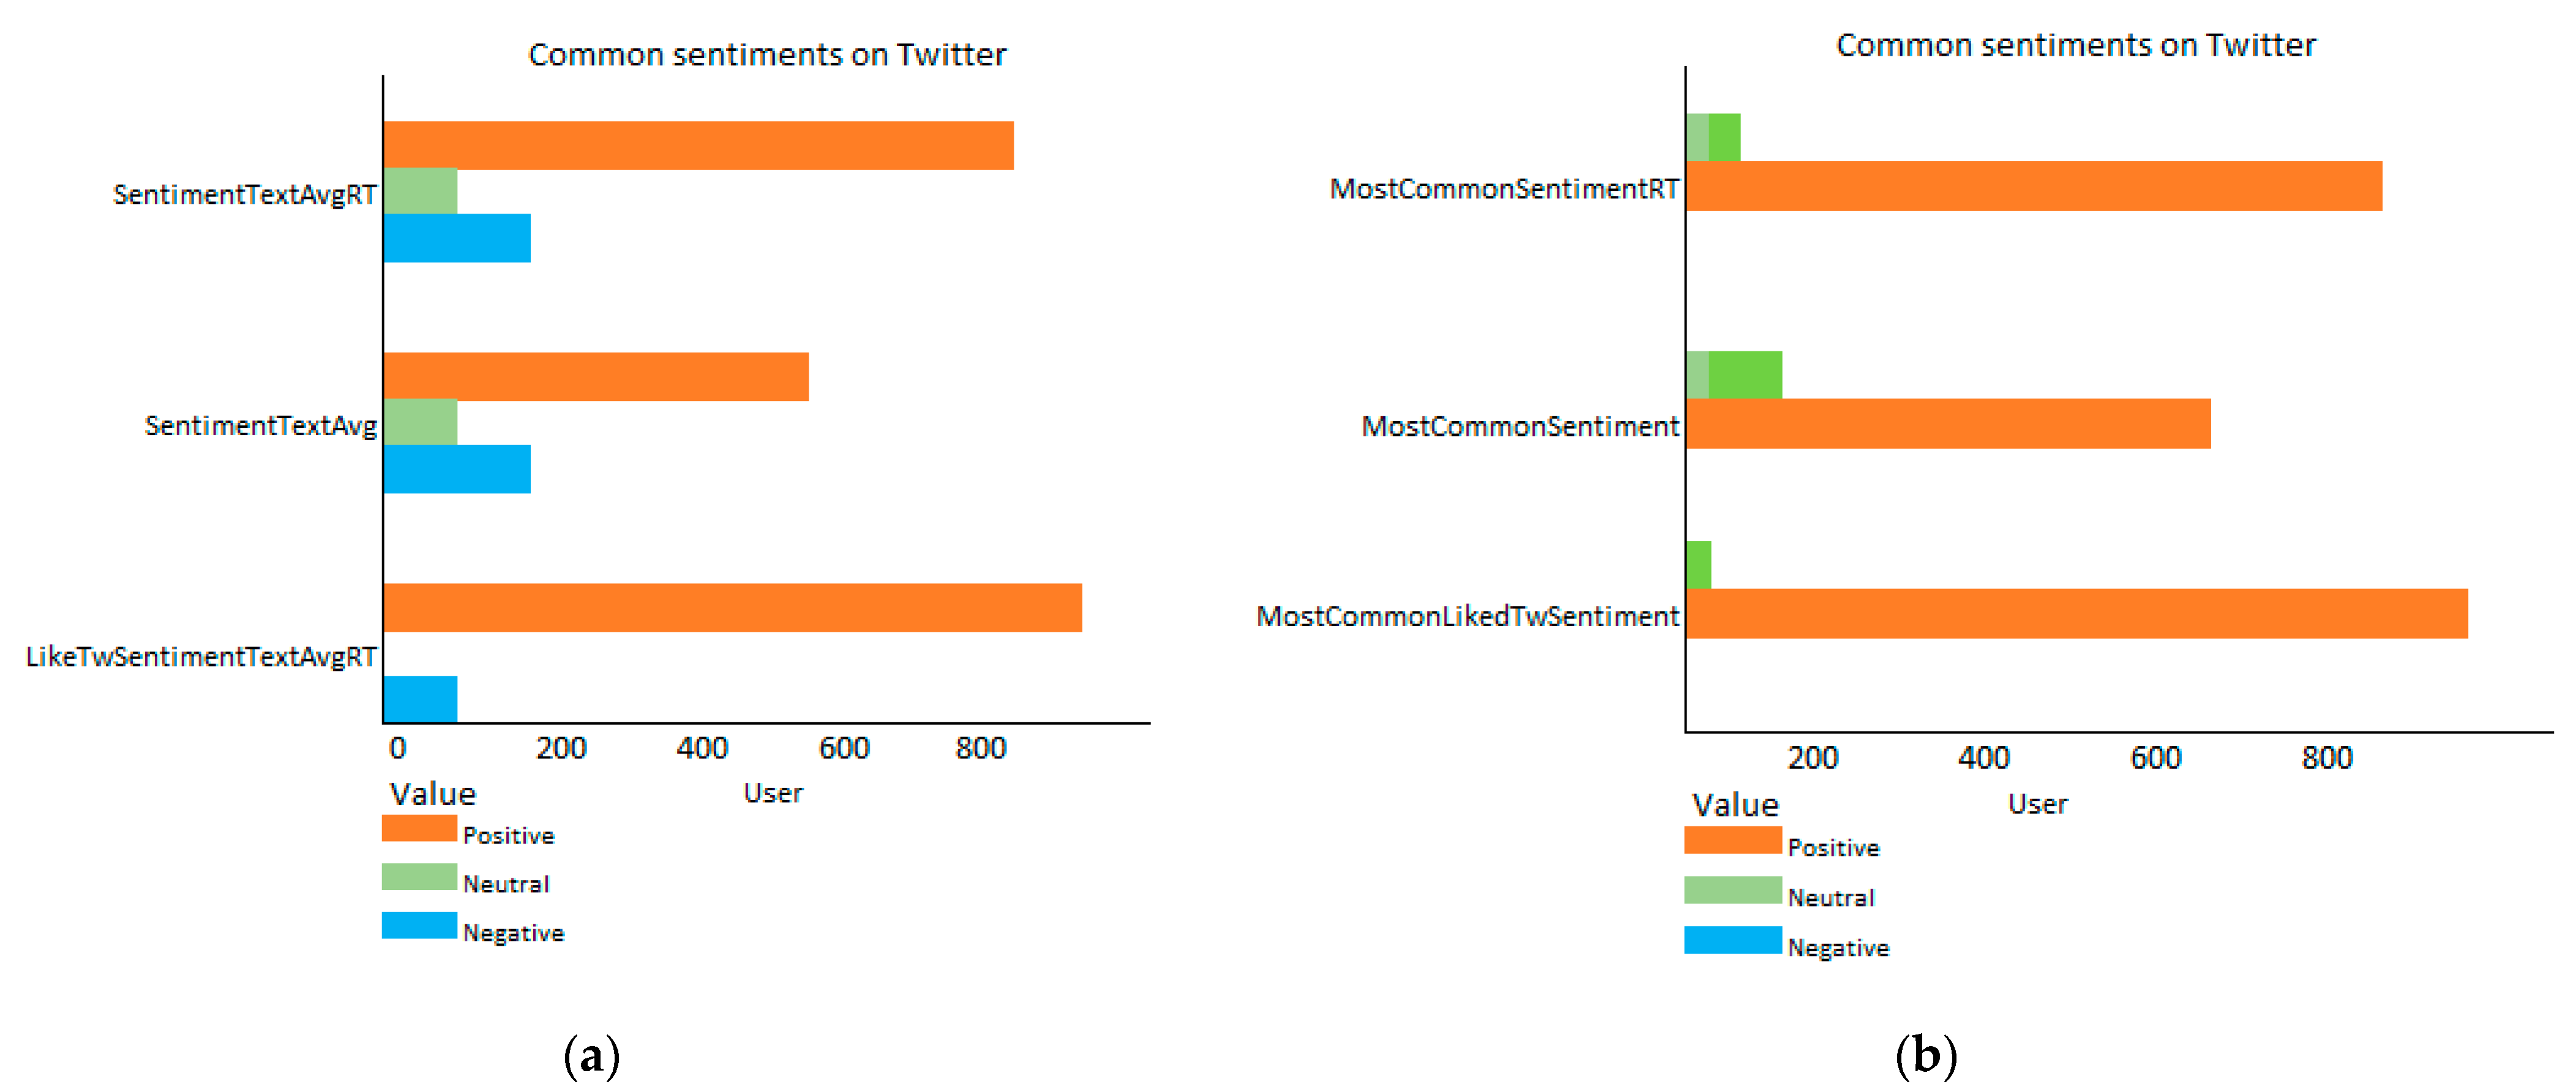
The implementation of the machine learning model is carried out in a production environment, in which both users and business stakeholders can interact with it and make decisions based on the results obtained from the model. To meet this objective, a hosting location that allows rapid data consumption is important. The option proposed in the method is the development of a web page. For the development of the page, the Python Flask micro-framework is used, this tool allows to easily develop the back end and front end of a web application using HTML templates created with a proprietary language called Jinja2. The selection of Flask is mainly due to the ease of deployment of the machine learning models that the tool has [49].
In Figure 4, the architecture of the web application is presented, where the five models deployed are shown. Access to the endpoint is conducted through a URL, depending on the domain where it was applied. The endpoint makes a connection to the Twitter login using its authentication API to a user’s account. The application looks up the username of the authenticated account and the user can initiate data processing and analysis.

3. Results

For the analysis, 1000 random users collected were considered, in the cleaning phase it was found that there was duplicate usernames, specifically 31 users who were eliminated from the dataset. Additionally, users were found who strangely had no data on the tweets they liked, or their original tweets were all very similar. When performing manual checks of their activity on Twitter, it was discovered that these users were possibly bots or people who did not use the platform or generated very little activity. These users, likewise, were removed from the dataset due to their null relevance in the analysis. In addition, URLs, hashtags, mentions, emojis, or any other type of character that could negatively affect the analysis of tweets were removed. Thus, the final dataset was reduced from 1000 rows of users to 942 rows of users.
After cleaning and analysis, several results were obtained that guaranteed the sentiment analysis process. Among the most relevant results that stood out was the correlation between the personality trait of the users and their number of followers. Figure 5 presents the extraversion trait, where on average, users had fewer followers than the conscientiousness or neurosis trait.
Figure 6 analyzes the relationship between the average of the negative sentiments of the original tweets and the predominant personalities of the users. Figure 6a shows that there is no absolute dominance of a single personality, there are several users with a predominant personality of neurotic who have more negative feelings in their tweets. However, the remaining users are very close in the count, such as agreeableness or extraversion. In this way, it is concluded that, although negative feelings are related to negative personalities, such as neurosis, this is not always the case, and the rest of the personalities can also have negative feelings associated with tweets. The opposite happens in Figure 6b, where the relationship between the positive sentiment of the original tweets of the users and their predominant personalities is observed. Those positive personalities are more frequent in the count of positive feelings, dominating the agreeable trait, along with extraversion and conscientiousness. However, as in the previous result, the fact that the tweets have a high positive polarity on average does not mean that personalities, such as neurosis, do not contain some type of relationship, although, to a lesser extent, there is a relationship.
For data labeling, human-in-the-loop (HITL) involvement is required. In this process, the developers are responsible for labeling the data, according to certain criteria. For dataset data labeling, correlation Table 1 is used, where the existing level between the LIWC categories and the five major personality traits is identified.
Figure 7 presents the Pearson correlation between the LIWC categories and the five broad traits considered in the study [40]. The correlations focus on the personal pronouns, in the first, second, and third person. The results show that texts written with pronouns in the first-person singular have a positive correlation with the Neurosis trait, while pronouns in the first person plural have a positive correlation with both the extraversion trait and the trait of sympathy. With this information, a keyword dictionary is created, these are the ones found in the Empath analysis, as well as LIWC’s own words. Dictionary values are a list of positively correlated personality traits targeting one or more categories. The features represented in letters form the acronym OCEAN. In the next stage, the categories previously obtained based on the three categories of tweets in the dataset are compared, and the data is labeled by calculating the frequency of appearance of each of the five letters of the traits.

4. Discussion

According to the results obtained, it can be identified that the performance of the machine learning algorithm in the personality trait recognition task has been effective. For this, an evaluation was carried out using quintuple-crossed controls. Table 2 reports the precision result for the analyzed data set, the precision calculation is performed using the standard deviation, for which it is possible to use two formulas. One of them is used if the measured data represents a complete population, while a second formula is used in case the measured data comes from only a sample of the population. For this work, a set of samples is used, where Formula (2) for the standard deviation to be used for a set of samples is presented below:
σ = x μ 2 n 1
As with calculating the mean deviation, the first step is to find the mean of the data values by using the set of measurements on each factor. In the second step, the square of each variation is calculated, for which, for each data point, the data value is subtracted from the mean and the result is squared. The square of the difference will always be positive in each case of the five sample data values. Finally, the square root of the result is calculated, this represents the variance of the data set. The standard deviation is the square root of the variance, using this calculation, the precision of the balance is represented by giving the mean, plus or minus the standard deviation. For example, the accuracy of AGR is 60.45 ± 1.98.
In the validation tests, MNB had the best precision of the three methods tested with an average value of 59%, while SVM and KNN presented a similar performance. The MNB method works more efficiently than SVM since it presents certain difficulties to separate a class from a word when the data set is not exact. The KNN method about MNB has a lower precision, this is due to the difficulty in determining the optimal value of K [18,19]. The total value of K is crucial because the probability result of KNN is calculated from the K samples. The opposite is seen in MNB, which uses pure probability calculations on existing features, based on average scores of 60% and 61%. This limits the analysis and fails to improve accuracy since the results are equal to the best score of similar investigations with 60%.
Other results analyzed and that is relevant is the test of respondents. This process aimed to identify how this automatic personality prediction model compares to more traditional personality prediction. Currently, one of the most popular personality prediction tests is the test based on the big five personality traits that are applied in online questionnaires [22,23]. Therefore, we compared the result of the Figure 2 system with the predicted result of the questionnaires [50]. The system will retrieve the text data of users’ Twitter accounts and classify them using three methods and the combined method. Users then complete the questionnaire test and report the results. The respondents consisted of 21 people. Elected respondents must have a Twitter account, and the ranking language selection is based on the user’s primary language [51]. The test results are shown in Table 3.
The combined method is the final prediction of the application, in which the best analysis results of the respondents were obtained with an accuracy of 63%. The combined method can produce higher precision because it presents improvements in the classification model. The overall accuracy is not very good, but it may show that automatic text personality recognition can be an alternative to survey-based analysis.

5. Conclusions

In this work, an AI model is developed to demonstrate the reliability of estimating the personality traits of a user using the tweets it generates. We incorporate language-based functions based on sentiment analysis and NLP, with an ensemble prediction algorithm consisting of decision trees and an SVM classifier. The results indicate that the accuracy of the prediction varies across the five personality categories, with the labels for the neurosis and extraversion dimensions being the most reliable.
The performance of the model is directly related to the state of the art in this domain and is validated on the Twitter dataset used. During analysis processing, it was found that simple language-based models can reliably identify certain personality traits, although some aspects can be evaluated with greater confidence than others. However, language-based prediction models do not efficiently capture a person’s behavior, especially on Twitter, as its format limits posts to 280 characters.
Multimodal information fusion has been effective for analysis as it feeds into a diverse set of features that may be important in improving prediction accuracy. An important challenge in this work has been the process of acquiring reliable data containing sets of information aligned to the proposed research. Several works have been reviewed that aim to predict the personality traits of social networks, these incorporate different sources of information that include text tweets/posts, photos, videos, URLs and activities likes, comments, retweets, mentions, follows, etc.
In future work, the plan is to collect and represent different forms of interactions such as tweets, retweets, mentions, comments, URLs, and likes as a multi-layered graph and explore the usefulness of incorporating data from multiple social networks such as Facebook and Instagram for data-driven analytics, text, and images.

Author Contributions

Conceptualization, I.O.-G.; Data curation, W.V.-C. and W.G.-N.; Formal analysis, W.V.-C. and I.O.-G.; Investigation, D.M.E.; Methodology, D.M.E. and W.G.-N.; Software, D.M.E. and X.P.-P.; Supervision, W.V.-C.; Validation, I.O.-G. and X.P.-P.; Writing—original draft, D.M.E. and W.G.-N.; Writing—review & editing, W.V.-C. and X.P.-P. All authors have read and agreed to the published version of the manuscript.

Funding

This research received no external funding.

Conflicts of Interest

The authors declare no conflict of interest.

References

  1. Bullini Orlandi, L.; Zardini, A.; Rossignoli, C.; Ricciardi, F. To Do or Not to Do? Technological and Social Factors Affecting Vaccine Coverage. Technol. Forecast. Soc. Chang. 2022, 174, 121283. [Google Scholar] [CrossRef]
  2. Tankovska, H. Global social network penetration rate as of January 2022, by region. In Social Media—Statistics & Facts; EEUU: New York, NY, USA, 2019. [Google Scholar]
  3. Social Media Statistics. 2018. Available online: Statista.com (accessed on 23 June 2022).
  4. Zhu, Q. Citizen-Driven International Networks and Globalization of Social Movements on Twitter. Soc. Sci. Comput. Rev. 2017, 35, 68–83. [Google Scholar] [CrossRef]
  5. Li, Z.; Huang, X.; Ye, X.; Jiang, Y.; Martin, Y.; Ning, H.; Hodgson, M.E.; Li, X. Measuring Global Multi-Scale Place Connectivity Using Geotagged Social Media Data. Sci. Rep. 2021, 11, 14694. [Google Scholar] [CrossRef] [PubMed]
  6. Li, Z.; Huang, X.; Ye, X.; Jiang, Y.; Yago, M.; Ning, H.; Hodgson, M.E.; Li, X. Measuring Place Connectivity Using Big Social Media Data. arXiv 2021, arXiv:2102.03991v1. [Google Scholar]
  7. Choi, H.; Kim, S.H.; Lee, J. Role of Network Structure and Network Effects in Diffusion of Innovations. Ind. Mark. Manag. 2010, 39, 170–177. [Google Scholar] [CrossRef]
  8. Zaidi, F.; Sallaberry, A.; Melançon, G. Generating Artificial Social Networks with Small World and Scale Free Properties. Hal-00659971 2012, 7861, 34. [Google Scholar]
  9. Zerubavel, N.; Bearman, P.S.; Weber, J.; Ochsner, K.N. Neural Mechanisms Tracking Popularity in Real-World Social Networks. Proc. Natl. Acad. Sci. USA 2015, 112, 15072–15077. [Google Scholar] [CrossRef] [Green Version]
  10. Lloyd, P.; Mahutga, M.C.; de Leeuw, J. Looking Back and Forging Ahead: Thirty Years of Social Network Research on the World-System. J. World Syst. Res. 2009, 15, 48–85. [Google Scholar] [CrossRef] [Green Version]
  11. Indu, V.; Thampi, S.M. A Systematic Review on the Influence of User Personality in Rumor and Misinformation Propagation Through Social Networks. In Communications in Computer and Information Science; Springer: Singapore, 2021. [Google Scholar] [CrossRef]
  12. Golbeck, J.; Robles, C.; Turner, K. Predicting Personality with Social Media. In Proceedings of the Conference on Human Factors in Computing Systems, Vancouver, BC, Canada, 7–12 May 2011; pp. 253–262. [Google Scholar]
  13. González-Varona, J.M.; López-Paredes, A.; Poza, D.; Acebes, F. Building and Development of an Organizational Competence for Digital Transformation in SMEs. J. Ind. Eng. Manag. 2021, 14, 15–24. [Google Scholar] [CrossRef]
  14. Shahi, C.; Sinha, M. Digital Transformation: Challenges Faced by Organizations and Their Potential Solutions. Int. J. Innov. Sci. 2021, 13. [Google Scholar] [CrossRef]
  15. Bazkiaei, H.A.; Heng, L.H.; Khan, N.U.; Saufi, R.B.A.; Kasim, R.S.R. Do Entrepreneurial Education and Big-Five Personality Traits Predict Entrepreneurial Intention among Universities Students? Cogent Bus. Manag. 2020, 7, 1801217. [Google Scholar] [CrossRef]
  16. Kouadri, W.M.; Ouziri, M.; Benbernou, S.; Echihabi, K.; Palpanas, T.; Amor, I. ben Quality of Sentiment Analysis Tools: The Reasons of Inconsistency. Proc. VLDB Endow. 2020, 14, 668–681. [Google Scholar] [CrossRef]
  17. Hirschberg, J.; Manning, C.D. Advances in Natural Language Processing. Science 2015, 349, 221–266. [Google Scholar] [CrossRef]
  18. Patel, R.; Patel, S. Deep Learning for Natural Language Processing. In Proceedings of the Lecture Notes in Networks and Systems, Rabat, Morocco, 17–18 March 2021; Volume 190. [Google Scholar]
  19. Otter, D.W.; Medina, J.R.; Kalita, J.K. A Survey of the Usages of Deep Learning for Natural Language Processing. IEEE Trans Neural Netw. Learn. Syst. 2021, 32, 604–624. [Google Scholar] [CrossRef] [PubMed] [Green Version]
  20. Baloglu, O.; Latifi, S.Q.; Nazha, A. What Is Machine Learning? Arch. Dis. Child Educ. Pr. Ed. 2021, 107, 386–388. [Google Scholar] [CrossRef] [PubMed]
  21. Tiezzi, J.; Tyler, R.; Sharma, S. Lessons Learned: A Case Study in Creating a Data Pipeline Using Twitter’s API. In Proceedings of the 2020 Systems and Information Engineering Design Symposium, SIEDS, Charlottesville, VA, USA, 24 April 2020; pp. 1–6. [Google Scholar]
  22. Golbeck, J.; Robles, C.; Edmondson, M.; Turner, K. Predicting Personality from Twitter. In Proceedings of the 2011 IEEE International Conference on Privacy, Security, Risk and Trust and IEEE International Conference on Social Computing, PASSAT/SocialCom, Boston, MA, USA, 9–11 October 2011. [Google Scholar]
  23. Şahin, F.; Karadağ, H.; Tuncer, B. Big Five Personality Traits, Entrepreneurial Self-Efficacy and Entrepreneurial Intention: A Configurational Approach. Int. J. Entrep. Behav. Res. 2019, 25, 1188–1211. [Google Scholar] [CrossRef]
  24. Zimbra, D.; Abbasi, A.; Zeng, D.; Chen, H. The State-of-the-Art in Twitter Sentiment Analysis: A Review and Benchmark Evaluation. ACM Trans. Manag. Inf. Syst. 2018, 9, 5. [Google Scholar] [CrossRef]
  25. Carvalho, J.; Plastino, A. On the Evaluation and Combination of State-of-the-Art Features in Twitter Sentiment Analysis. Artif. Intell. Rev. 2021, 54, 1887–1936. [Google Scholar] [CrossRef]
  26. Sánchez-Holgado, P.; Martín-Merino Acera, M.; Blanco Herrero, D. Del Data-Driven al Data-Feeling: Análisis de Sentimiento En Tiempo Real de Mensajes En Español Sobre Divulgación Científica Usando Técnicas de Aprendizaje Automático. Anu. Electrónico De Estud. En Comun. Soc. “Disert.” 2020, 13, 35–58. [Google Scholar] [CrossRef]
  27. Sharma, S.; Jain, A. Hybrid Ensemble Learning with Feature Selection for Sentiment Classification in Social Media. Int. J. Inf. Retr. Res. 2020, 10, 1183–1203. [Google Scholar] [CrossRef]
  28. Hourrane, O.; Idrissi, N.; Benlahmar, E.H. Sentiment Classification on Movie Reviews and Twitter: An Experimental Study of Supervised Learning Models. In Proceedings of the ICSSD 2019—International Conference on Smart Systems and Data Science, Rabat, Morocco, 3–4 October 2019. [Google Scholar]
  29. Salsabila, G.D.; Setiawan, E.B. Semantic Approach for Big Five Personality Prediction on Twitter. J. RESTI (Rekayasa Sist. Dan Teknol. Inf.) 2021, 5, 680–687. [Google Scholar] [CrossRef]
  30. Zheng, X.; Schweickert, R. Comparing Hall Van de Castle Coding and Linguistic Inquiry and Word Count Using Canonical Correlation Analysis. Dreaming 2021, 31, 207–224. [Google Scholar] [CrossRef]
  31. McDonnell, M.; Owen, J.E.; Bantum, E.O.C. Identification of Emotional Expression with Cancer Survivors: Validation of Linguistic Inquiry and Word Count. JMIR Res. 2020, 4, e18246. [Google Scholar] [CrossRef] [PubMed]
  32. Long, Y.; Xiang, R.; Lu, Q.; Huang, C.R.; Li, M. Improving Attention Model Based on Cognition Grounded Data for Sentiment Analysis. IEEE Trans. Affect. Comput. 2021, 12, 900–912. [Google Scholar] [CrossRef]
  33. Sravya, K.; Sowmya, G.; Yamini, P.; Anusha, P.; Sandhya Krishna, P. Sentiment Analysis on Twitter K. SSRN Electron. J. 2021, XIII, 925–930. [Google Scholar] [CrossRef]
  34. Adwan, O.Y.; Al-Tawil, M.; Huneiti, A.M.; Shahin, R.A.; Abu Zayed, A.A.; Al-Dibsi, R.H. Twitter Sentiment Analysis Approaches: A Survey. Int. J. Emerg. Technol. Learn. 2020, 15, 79–93. [Google Scholar] [CrossRef]
  35. Xue, Y.; Wang, Y. Artificial Intelligence for Education and Teaching. Wirel. Commun. Mob. Comput. 2022, 2022, 4750018. [Google Scholar] [CrossRef]
  36. Cumming, G. Artificial Intelligence in Education: An Exploration. J. Comput. Assist. Learn. 1998, 14, 251–259. [Google Scholar] [CrossRef]
  37. Villegas-Ch, W.; Buenaño-Fernández, D.; Luján-Mora, S. Educational Data Analysis Applying a Kdd Methodology. In Proceedings of the 16th International Conference e-Society, Lisbon, Portugal, 14–16 April 2018; pp. 301–305. [Google Scholar]
  38. Fayyad, U.; Piatetsky-Shapiro, G.; Smyth, P. The KDD Process for Extracting Useful Knowledge from Volumes of Data. Commun. ACM 1996, 39, 27–34. [Google Scholar] [CrossRef]
  39. Zhang, L.; Chen, Z.X.; Yang, B. Personality Analysis and Prediction of Social Network Users. Jisuanji Xuebao/Chin. J. Comput. 2014, 37. [Google Scholar] [CrossRef]
  40. Villegas-Ch, W.; Palacios-Pacheco, X. Proposal for a Secure Architecture for the Internet of Things on a Smart Campus. In Advances in Intelligent Systems and Computing; Springer: Quito, Ecuador, 2021; Volume 1277, pp. 269–280. [Google Scholar]
  41. Villegas-Ch., W.; Palacios-Pacheco, X.; Ortiz-Garcés, I.; Luján-Mora, S. Management of Educative Data in University Students with the Use of Big Data Techniques. RISTI Rev. Iber. Sist. E Tecnol. Inf. 2019, 2019, 227–238. [Google Scholar]
  42. Villegas-Ch, W.; Palacios-Pacheco, X.; Roman-Cañizares, M.; Luján-Mora, S. Analysis of Educational Data in the Current State of University Learning for the Transition to a Hybrid Education Model. Appl. Sci. 2021, 11, 2068. [Google Scholar] [CrossRef]
  43. Goeuriot, L.; Pasi, G.; Viviani, M.; Villegas-Ch, W.; Molina, S.; de Janón, V.; Montalvo, E.; Mera-Navarrete, A. Proposal of a Method for the Analysis of Sentiments in Social Networks with the Use of R. Informatics 2022, 9, 63. [Google Scholar] [CrossRef]
  44. Anand, N.; Kumar, M. Modeling and Optimization of Extraction- Transformation-Loading (ETL) Processes in Data Warehouse: An Overview. In Proceedings of the 2013 Fourth International Conference on Computing, Communications and Networking Technologies (ICCCNT), Tiruchengode, India, 4–6 July 2013; pp. 1–5. [Google Scholar]
  45. Shetty, S.D. Sentiment Analysis, Tweet Analysis and Visualization on Big Data Using Apache Spark and Hadoop. IOP Conf. Ser. Mater. Sci. Eng. 2021, 1099, 012002. [Google Scholar] [CrossRef]
  46. Zhang, L.; Wang, S.; Liu, B. Deep Learning for Sentiment Analysis: A Survey. Wiley Interdiscip. Rev. Data Min. Knowl. Discov. 2018, 8, e1253. [Google Scholar] [CrossRef] [Green Version]
  47. Ligthart, A.; Catal, C.; Tekinerdogan, B. Systematic Reviews in Sentiment Analysis: A Tertiary Study. Artif. Intell. Rev. 2021, 54, 4997–5053. [Google Scholar] [CrossRef]
  48. Gandía, J.L.; Huguet, D. Textual Analysis and Sentiment Analysis in Accounting. Rev. Contab. Span. Account. Rev. 2021, 24, 168–183. [Google Scholar] [CrossRef]
  49. Kian, T.P.; Boon, G.H.; Fong, S.W.L.; Ai, Y.J. Factors That Influence the Consumer Purchase Intention in Social Media Websites. Int. J. Supply Chain Manag. 2017, 6, 214. [Google Scholar]
  50. Mlačić, B.; Goldberg, L.R. An Analysis of a Cross-Cultural Personality Inventory: The IPIP Big-Five Factor Markers in Croatia. J. Pers. Assess. 2007, 88, 168–177. [Google Scholar] [CrossRef]
  51. Wang, S.S. To Tweet or Not to Tweet: Factors Affecting the Intensity of Twitter Usage in Japan and the Online and Offline Sociocultural Norms. Int. J. Commun. 2016, 10, 24. [Google Scholar]
Figure 1. Result of the application of the test of the 5 major traits of personality to a population of 21 people.
Electronics 11 03811 g001
Figure 2. Sentiment analysis and category identification: (a) shows the average of mixed feelings by category of tweets; (b) presents the common sentiments by category of tweets.
Electronics 11 03811 g002
Figure 3. Categories of feelings represented in word clouds: (a) presents the LIWC categories of a user with negative feelings in a text in Spanish; (b) presents a cloud of words with the identification of LIWC categories of users with positive feelings.
Electronics 11 03811 g003
Figure 4. Architecture for the implementation of the personality prediction model based on the behavior of a person on Twitter in a WEB portal.
Electronics 11 03811 g004
Figure 5. Identification of the number of followers by user personality trait.
Electronics 11 03811 g005
Figure 6. Analysis of relevant sentiments of predominant personalities: (a) negative sentiments of tweets by predominant personality; (b) the positive sentiment of tweets by predominant personality.
Electronics 11 03811 g006
Figure 7. Distribution of personalities of all users of the dataset results in relative differences between the percentage of one personality and another.
Electronics 11 03811 g007
Table 1. Pearson correlation between the LIWC categories and the Big 5 personality traits.
LIWCNEUEXTOPNAGRCON
Total pronouns0.060.06−0.210.11−0.02
First person sings0.120.01−0.160.050
First person plural−0.070.11−0.10.180.03
First person0.10.03−0.190.080.02
Second person−0.150.16−0.120.080
Third person 0.020.04−0.060.08−0.08
AGR = Agreeableness; CON = Conscientiousness; EXT = Extraversion; NEU = Neuroticism; OPN = Openness.
Table 2. Accuracy of the dataset in Spanish.
ACCMNBKNNSVM
AGR60.45 ± 1.9859.38 ± 1.5462.75 ± 1.36
CON59.86 ± 1.6561.95 ± 1.7561.74 ± 1.23
EXT61.02 ± 1.2163.51 ± 2.0658.92 ± 1.81
NEU58.48 ± 1.7555.3 ± 1.4260.12 ± 1.15
OPN63.98 ± 1.9465.71 ± 2.5159.66 ± 1.61
Third person 60.75 ± 1.7161.17 ± 1.8560.63 ± 1.43
Table 3. Accuracy of respondent testing.
MethodACC
MNB61%
KNN59%
SVM60%
Combined63%
Publisher’s Note: MDPI stays neutral with regard to jurisdictional claims in published maps and institutional affiliations.

