Article

Poisonous Plants Species Prediction Using a Convolutional Neural Network and Support Vector Machine Hybrid Model

1
College of Computer Science and Engineering, Taibah University, Yanbu 966144, Saudi Arabia
2
College of Computer Science and Engineering, Taibah University, Madinah 42392, Saudi Arabia
3
Computer Science Division, Faculty of Science, Tanta University, Tanta 31527, Egypt
*
Author to whom correspondence should be addressed.
These authors contributed equally to this work.
Electronics 2022, 11(22), 3690; https://doi.org/10.3390/electronics11223690
Submission received: 15 October 2022 / Revised: 1 November 2022 / Accepted: 8 November 2022 / Published: 11 November 2022

Abstract

:
The total number of discovered plant species is increasing yearly worldwide. Plant species differ from one region to another. Some of these discovered plant species are beneficial while others might be poisonous. Computer vision techniques can be an effective way to classify plant species and predict their poisonous status. However, the lack of comprehensive datasets that include not only plant images but also plant species’ scientific names, description, poisonous status, and local name make the issue of poisonous plants species prediction a very challenging issue. In this paper, we propose a hybrid model relying on transformers models in conjunction with support vector machine for plant species classification and poisonous status prediction. First, six different Convolutional Neural Network (CNN) architectures are used to determine which produces the best results. Second, the features are extracted using six different CNNs and then optimized and employed to Support Vector Machine (SVM) for testing. To prove the feasibility and benefits of our proposed approach, we used a real case study namely, plant species discovered in the Arabian Peninsula. We have gathered a dataset that contains 2500 images of 50 different Arabic plant species and includes plants images, plant species scientific name, description, local name, and poisonous status. This study on the types of Arabic plants species will help in the reduction of the number of poisonous plants victims and their negative impact on the individual and society. The results of our experiments for the CNN approach in conjunction SVM are favorable where the classifier scored 0.92, 0.94, and 0.95 in accuracy, precision, and F1-Score respectively.

1. Introduction

Plant species plays a vital role in the environment ecosystem. According to [1], every year scientists are discovering new plant species where the total number of discovered species reached 1942 in 2020. It is predicted that the overall number of discovered plant species will reach 391,000 where only 94% have been discovered [2]. The plant species differ from one region to another. For example, the Arabian Peninsula has 2288 plant species [3]. Some of these discovered plant species are beneficial while others might be poisonous. For example, over 100,000 people a year are exposed to toxic plants and are reported to poison centers throughout the United States [4]. Thus, appropriate solutions such as computer vision techniques are required to identify plant species and distinguish between beneficial and poisonous ones [5].
Due to the increased number of discovered plant species and the similarity in the plants’ leaves, textures and features, identifying plant species and distinguishing between beneficial and poisonous ones is hard for inexpert people, unlike planters and agricultural scientist (i.e., botanists) [5]. Therefore, computer vision techniques can help inexpert people in identifying plant species through their images. In computer vision, image acquisition, image processing, feature extraction, and image identification are used to classify images (e.g., plant species images). Computer vision provides several classifiers to classify images such as plant species images including (i) Multi-Layer Perception (MLP), (ii) Support Vector Machine (SVM), (iii) Hidden Markov Model (HMM), (iv) Convolutional Neural Network (CNN), and others [6,7,8,9]. Computer vision techniques can be an effective way to classify plant species and predict their poisonous status. On the other hand, there is a need of comprehensive datasets that include plants images, plant species scientific name, local name, description, and poisonous status, which will be beneficial for the research community and the industry.
Different image-based classification techniques for plants species have been reported in the literature, which can be classified into four different categories: leaf classification, seeds classification, architecture classification, and disease classification [7,8,10]. In the leaf classification technique, the researchers focus on extracting features (e.g., texture and shape) from plants species leaves’ images in order to distinguish one plant species from another. While in the seeds classification technique, the researchers focus on spotting differences in seeds images in term of color, shape, and structure [11]. In the architecture classification technique, the researchers focus on extracting features in the image of the whole plant species such as in [12]. In the disease classification technique, the researchers also focus on extracting features from plants species leaves’ images (e.g., gray spots, textures, and other disease features).
The motivation for this work is that the inexpert people have the ability not only to identify the type and the name of plants species, but also can search for useful information about this plant and whether this plant represents any danger or not when dealing with it. This information helps and reduces the risk of contact with poisonous plants. In this work, we focus on plant species discovered in the Arabian Peninsula as a real case study. About 2500 images of 50 different Arabic plants species were gathered and analyzed for this study where the dataset includes scientific name, description, poisonous status, image, and local name (i.e., plants species local names were collected from the locals in the Saudi Arabia). To categorize the images in this dataset and make poisonous status prediction, a hybrid model was created. Using the ResNet50, EfficientNetB0, Mobilenet, and Xception architectures, the features of the data are retrieved and then used as input to a Convolutional Neural Network (CNN) in conjunction with the SVM for prediction after the optimization process.
The main contributions of our research work include:
  • To the best of our knowledge, this work is the first that focuses on the issue of Arabic plant species classification and poisonous prediction.
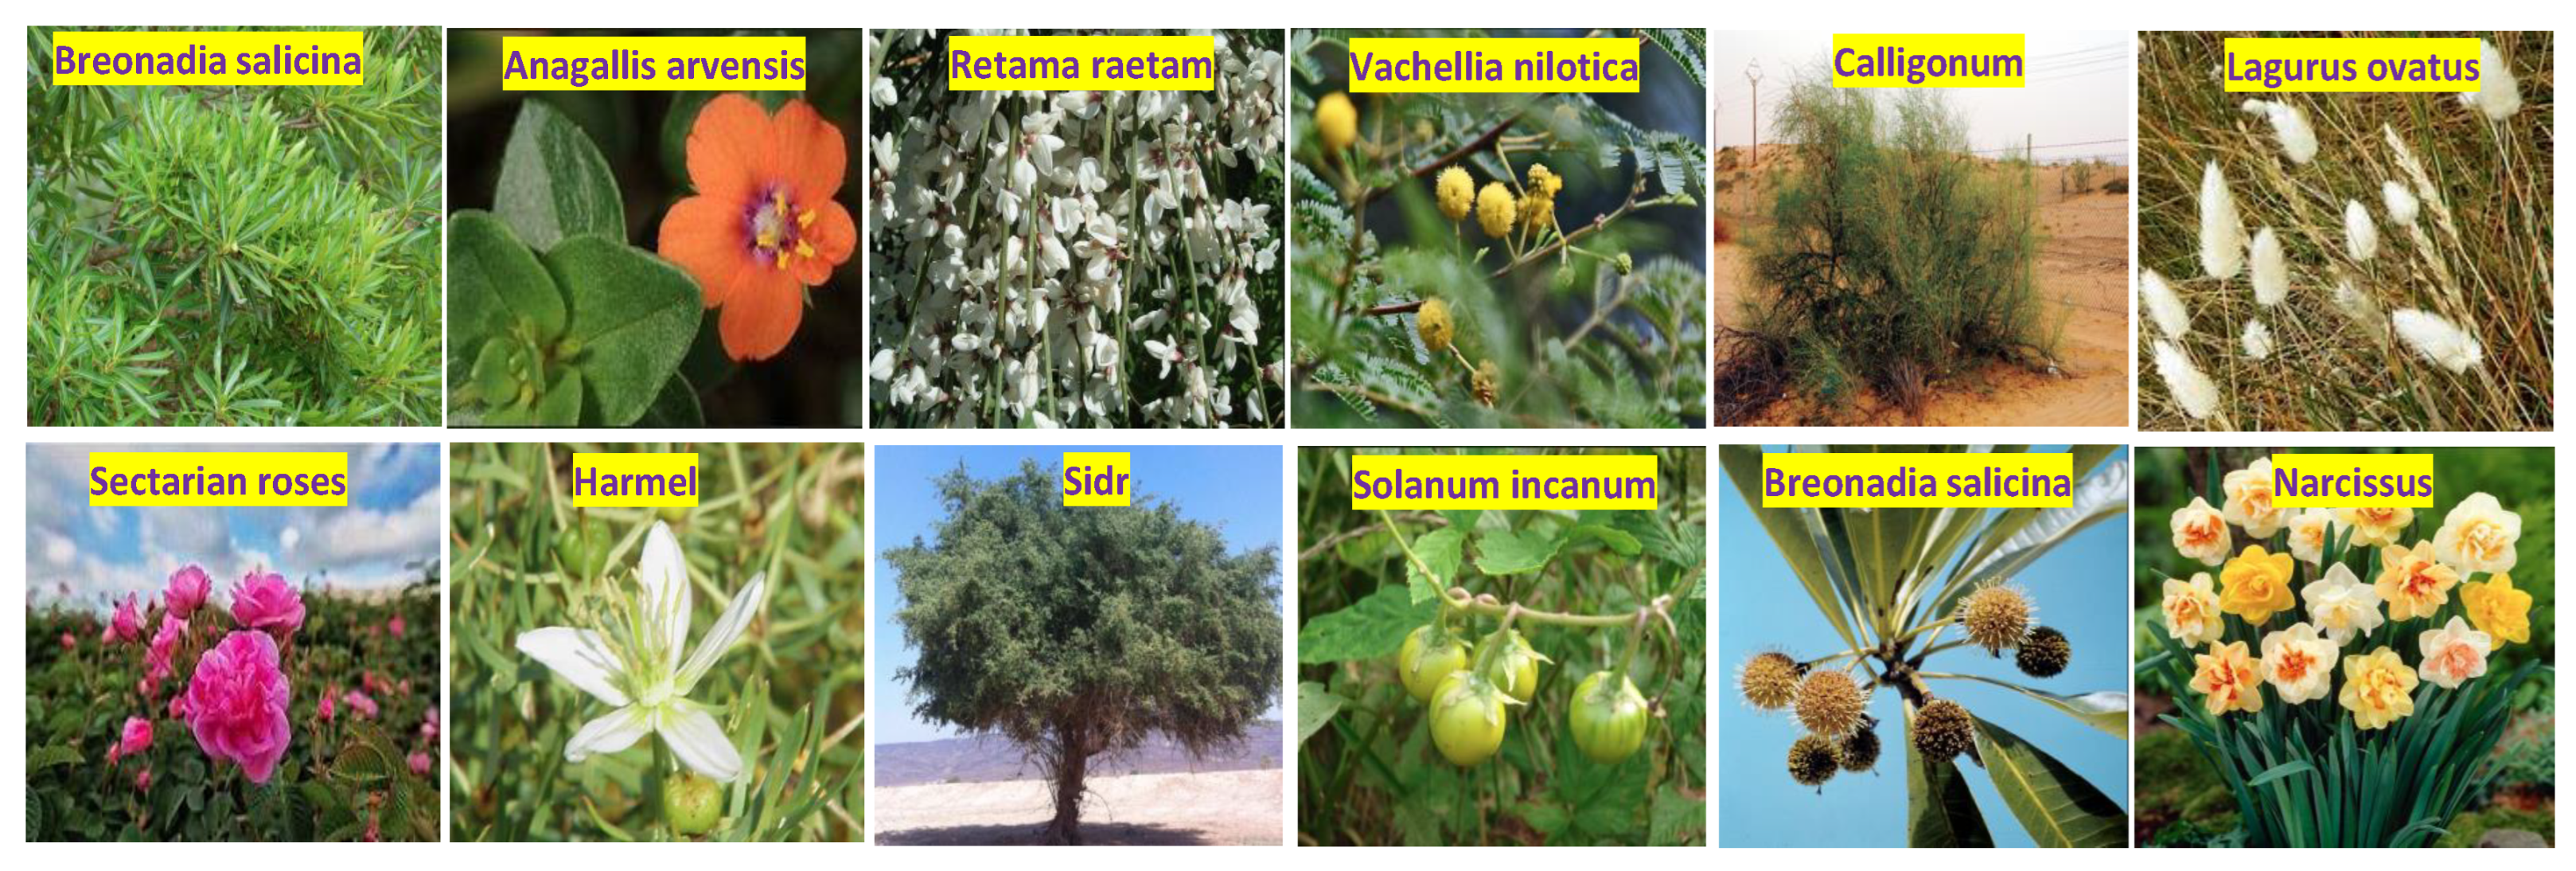
  • Create our own database for Arabic plants that includes 2500 different images of 50 types of plant species, some of which are poisonous, and others are non-poisonous.
  • Study and analysis of Arabic plants to identify them with high accuracy using more than one classifier.
  • Integration between different classifiers as a result of comparing the classifications, each separately.
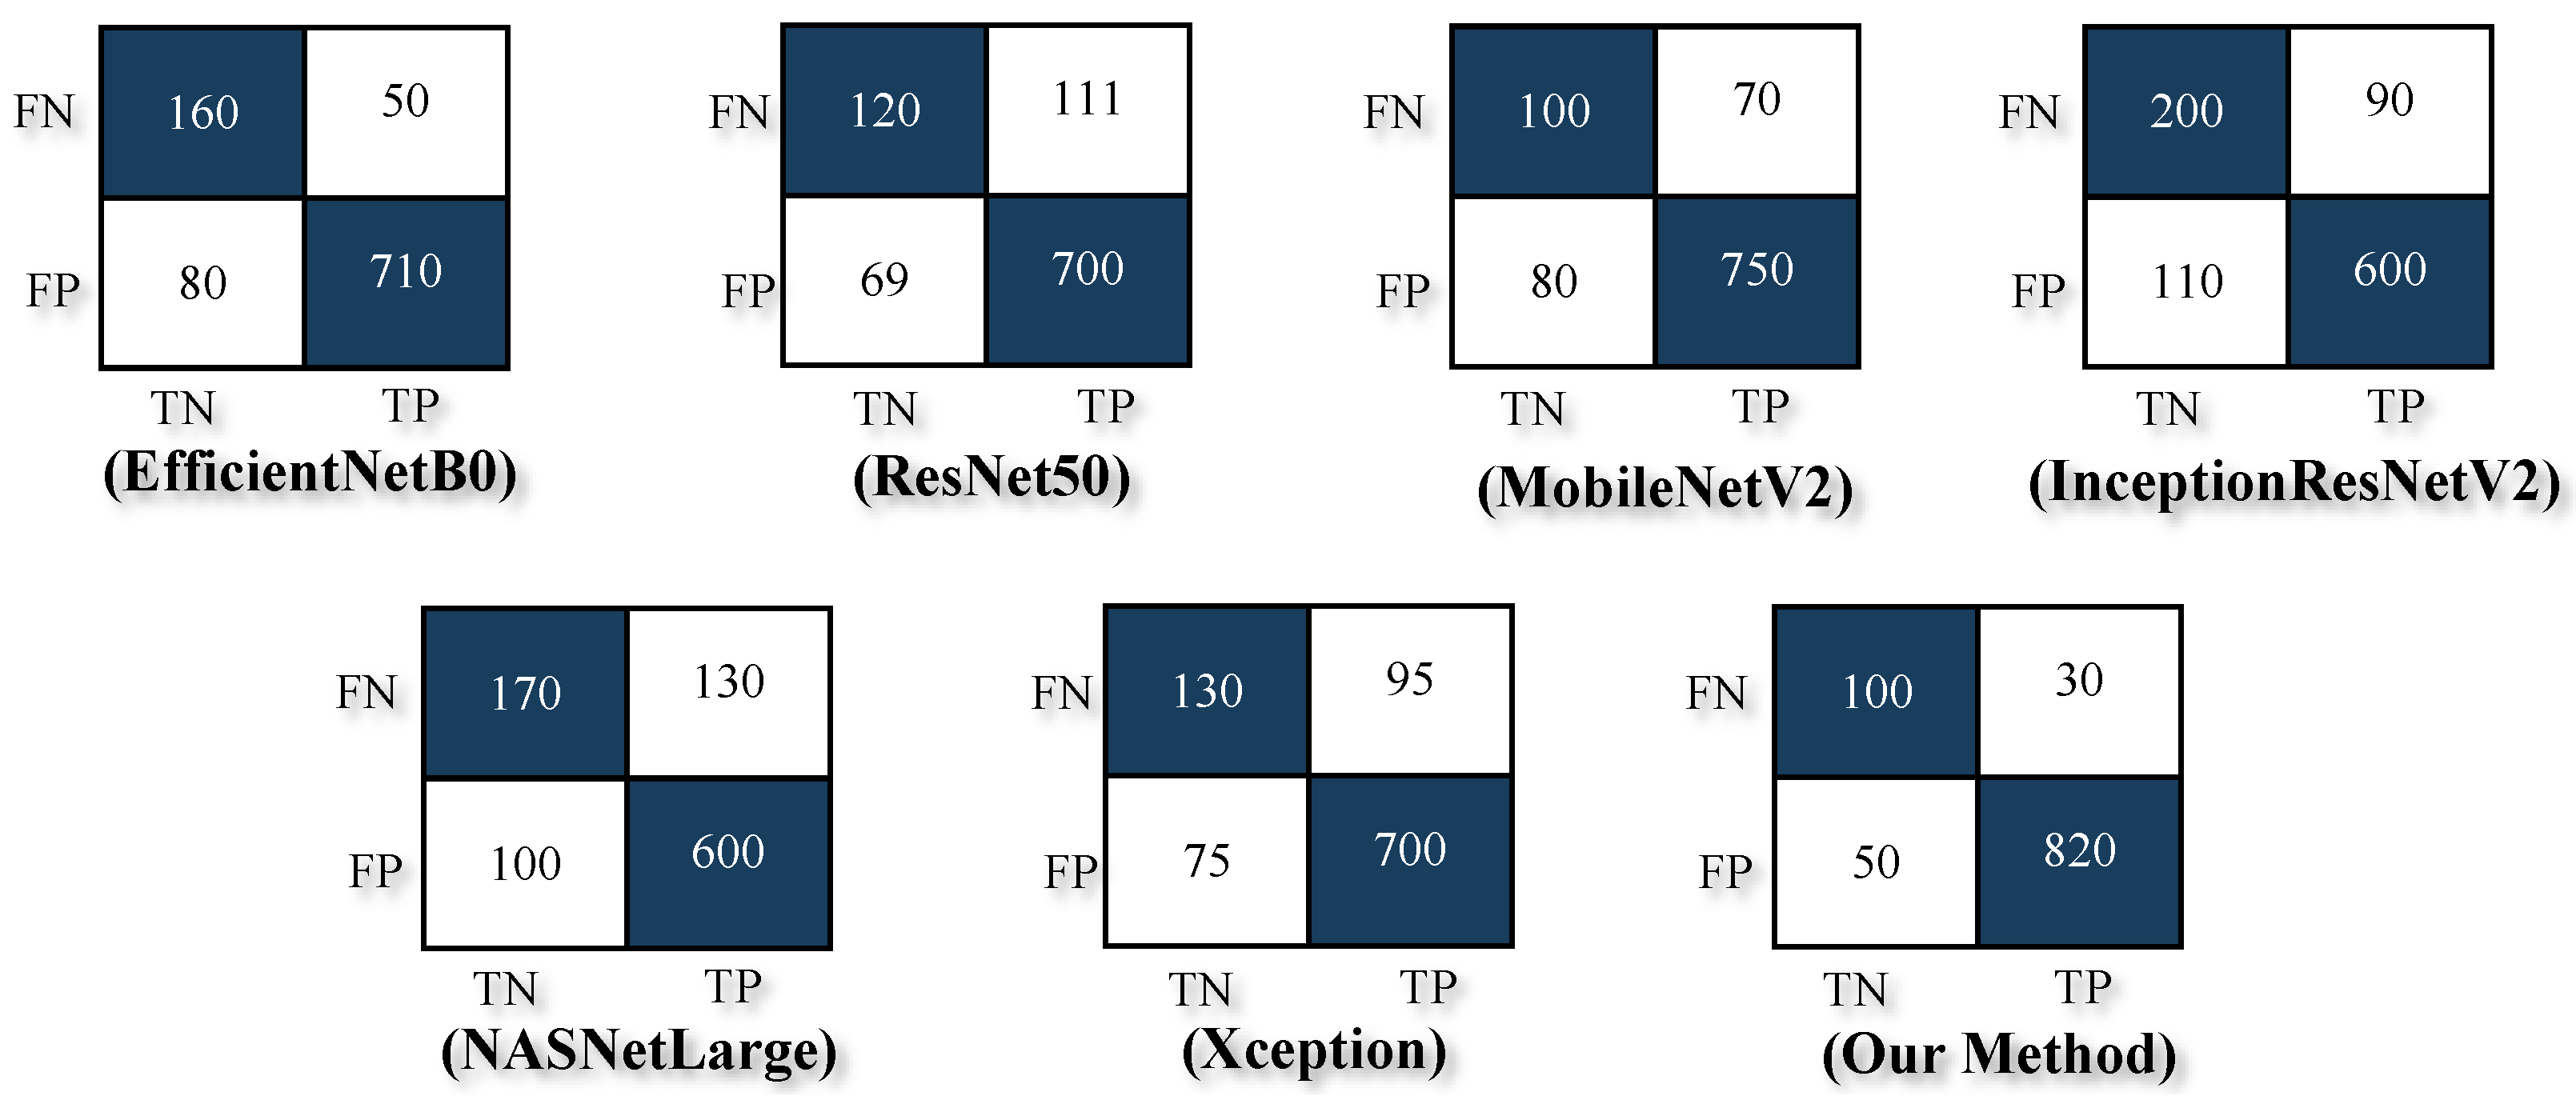
  • The outcome of our experiments for the convolutional neural network approach in conjunction with SVM was favorable and was achieved where the integration scored 0.92 in accuracy.
The remainder of the paper is organized as follows. Section 2 gives an overview of the literature review. Section 3 describes the details of the convolutional neural network and support vector machine hybrid model. Section 4 reports the implementation of the plant species classification and poisonous status prediction system and presents the experimental evaluations. Section 5 discusses the results and the complexity of the proposed approach. Last but not least, Section 6 provides the concluding remarks and the future work.

2. Literature Review

Plant species can be identified through their images using computer vision techniques. In the past few years, several research works focused on plant species identification and several computer vision techniques were proposed [5,6,7,8,10,13]. For example, Vizcarra et al. [14] proposed a classification corpus for plant species identification. In particular, the proposed classification corpus uses leaf images for the identification of plant species. To validate their proposed approach, the authors managed to gather a Peruvian Amazon forestry dataset for ten plant species. Furthermore, the authors compared four pre-trained models including: (i) AlexNet, (ii) VGG-19, (iii) ResNet-101, and (iv) DenseNet-201 (i.e., all four models have been pre-trained using ImageNet dataset). Prasad and Senthilrajan [15] focused on the issue of plant species classification. In particular, the authors proposed a novel hybrid method namely, Convolutional Neural Network (CNN) and K-Nearest Neighbors (KNN) method to classify plant species leaf images. To evaluate their proposed method, they used two different datasets available in the research community, namely LeafSnap and Flavia. Chaki and Parekh [16] focus on the issue of plant leaf recognition. In particular, the authors propose to use three different models including: (i) Moments Invariant (MI) model, (ii) Centroid Radii (CR) model and (iii) Binary Superposition (BS) model. To validate their proposed approach, the authors conducted experiments using a dataset which consists of three plant species using 180 plant leaf images. Tavakoli et al. [17], focus on the issue of bean plant species classification such as White bean, Red bean, and Pinto bean. In particular, the authors propose Convolutional Neural Network (CNN) approach to classify twelve different bean plant species using their leaf images. To demonstrate their proposed approach the CNN classifier is experimented using two different datasets including BeanLeafBS and BeanLeafFS. Naeem et al. [18] focus on the issue of medicinal plant species classification such as Stevia, Lemon balm, and Tulsi. In particular, the authors propose to use five different classifiers including: (i) multi-layer perceptron (MLP), (ii) LogitBoost (LB), (iii) Bagging, (iv) Random Forest (RF), and (v) Simple Logistic (SL). to classify six different medicinal plant species using their leaf images. To evaluate the proposed approach, the authors gathered a dataset of the medicinal plant species from the Department of Agriculture in the Islamia University of Bahawalpur, Pakistan. Sujith and Neethu [19] focus on the issue of plant species leaf classification based on their texture and shape. In particular, the authors present a hybrid feature extraction approach namely, (i) Pyramid Histogram of Oriented Gradients (PHOG), (ii) Local Binary Pattern (LBP), and (iii) Gray Level Co-occurrence Matrix (GLCM). Moreover, the feature vector is normalized using Neighborhood Components Analysis (NCA). To demonstrate their proposed approach the hybrid feature extraction is evaluated using two different datasets including, (i) Flavia which contains 32 plant species and (ii) Swedish Leaves dataset which contains 15 plant species. Loddo and Ruberto [11] focus on the issue of plant species classification based on images of their seeds. In particular, the authors propose to explore several Convolutional Neural Networks (CNNs) such as VGG19, AlexNet, GoogLeNet and SeedNet that they proposed earlier for deep features extraction. To evaluate the proposed approach, the authors experimented using Canada and Cagliari datasets where 6 plant species and 23 plant species are used for experimentation purposes respectively. Kumar et al. [20] focus on plant species identification. In particular, the authors propose a computer vision system namely, Leafsnap, that exploits a novel algorithm for plant species identification and a Support Vector Machine (SVM) classifier. To validate their proposed system, the authors conducted experiments using a dataset of the Northeastern United States which consist of 184 plant species. Koh et al. [21] focus on plant phenotyping. In particular, the authors propose an automatic machine learning approach to classify wheat lodging into non-lodged and lodged. To evaluate the proposed approach, the authors managed to gather data that include 1248 images of wheat lodging where 528 image represent the non-lodged and 720 represent the lodged. Moreover, a comparison between the proposed automatic machine learning approach and Convolutional Neural Networks (CNNs) such as VGG16, ResNet-50, and ResNet-101. As a result, CNN overcomes the proposed automatic machine learning approach.
Other work works focus on the issue of plant species disease identification. For example, Patil and Lad [22] focus on the issue of plant leaf disease detection. In particular, the authors present a novel classification approach namely, Support Vector Machine (SVM) and K-Nearest Neighbor (KNN) to classify chili plant species leaf diseases such as bacterial leaf spot, cercospora leaf spot, chili mosaic, leaf curl, and powdery mildew. Moreover, the authors proposed to use the Gray Level Co-occurrence Matrix (GLCM) for feature extraction. To demonstrate their proposed approach the classifiers were evaluated against a real-time dataset where KNN results overcomes SVM results in terms of overall accuracy. Ahmed et al. [23] focus on the issue of leaf disease identification. In particular, the authors propose to use the Gray Level Co-occurrence Matrix (GLCM) for features calculation. In addition, the authors propose Support Vector Machine (SVM) for plant leaf disease classification. To evaluate their proposed approach, they used a dataset of 227 images of plant leaves’ images. Negi et al. [24] on focus on the issue of plant disease recognition. In particular, the authors present a Deep Convolutional Neural Network (DCNN) model to identify plant species’ diseases based on plant leaf disease images classification. To validate their proposed model, the authors conducted experiments using a dataset which consists of ten plant diseases such as black spot, gray leaf spot, citrus greening, and bacterial spot. Thakur et al. [25] focus on the issue of plant disease detection. In particular, the authors propose a novel algorithm to predict plant species diseases based on leaf images using a Convolutional Neural Network (CNN) model. The outcome of this research work is a mobile application that classifies the plant species diseases, provides the user with the disease symptoms, and proposes the treatment management. Granwehr and Hofer [26] focus on plant health monitoring by identifying plant species diseases. In particular, the authors propose a Deep Convolutional Neural Network (DCNN) model to identify plant species diseases based on plant leaf disease images classification. To evaluate their proposed approach they used two different dataset namely CASC-IFW and plant village datasets. Atila et al. [27] focus on plant leaf diseases identification. In particular, the authors present a deep learning model namely, EfficientNet for plant leaf diseases identification. To validate their proposed model, the authors used PlantVillage and compared the EfficientNet and other Convolutional Neural Network (CNN) architectures such as VGG16 and Inception V3.
Unlike previous works that focus on the classification of medicinal, bean, and Peruvian Amazon forestry plant species (i.e., the classification of three to ten different plant species) using seeds, leaf, or disease classification techniques by extracting features (e.g., texture, shape, gray spots, and other disease features) from plants species leaves and seeds images (i.e., where some of the previous works use publicly available datasets such as LeafSnap and Flavia) in order to distinguish one plant species from another, in this work, we focus on the classification of Arabic plant species (i.e., plant species discovered in the Arabian Peninsula) and poisonous prediction. It is worth mentioning, that we managed to gather our own dataset that consists of 2500 images of 50 different Arabic plants species. The dataset includes the plant species scientific name, description, poisonous status, image, and local name (i.e., plants species local names were collected from the locals in the Saudi Arabia). To categorize the images in this dataset and make poisonous status prediction, a hybrid model was created. Using the ResNet50, EfficientNetB0, Mobilenet, and Xception architectures, the features of the data are retrieved and then used as input to a Convolutional Neural Network (CNN) in conjunction with the SVM for prediction after the optimization process (i.e., more details can be found in Section 3).

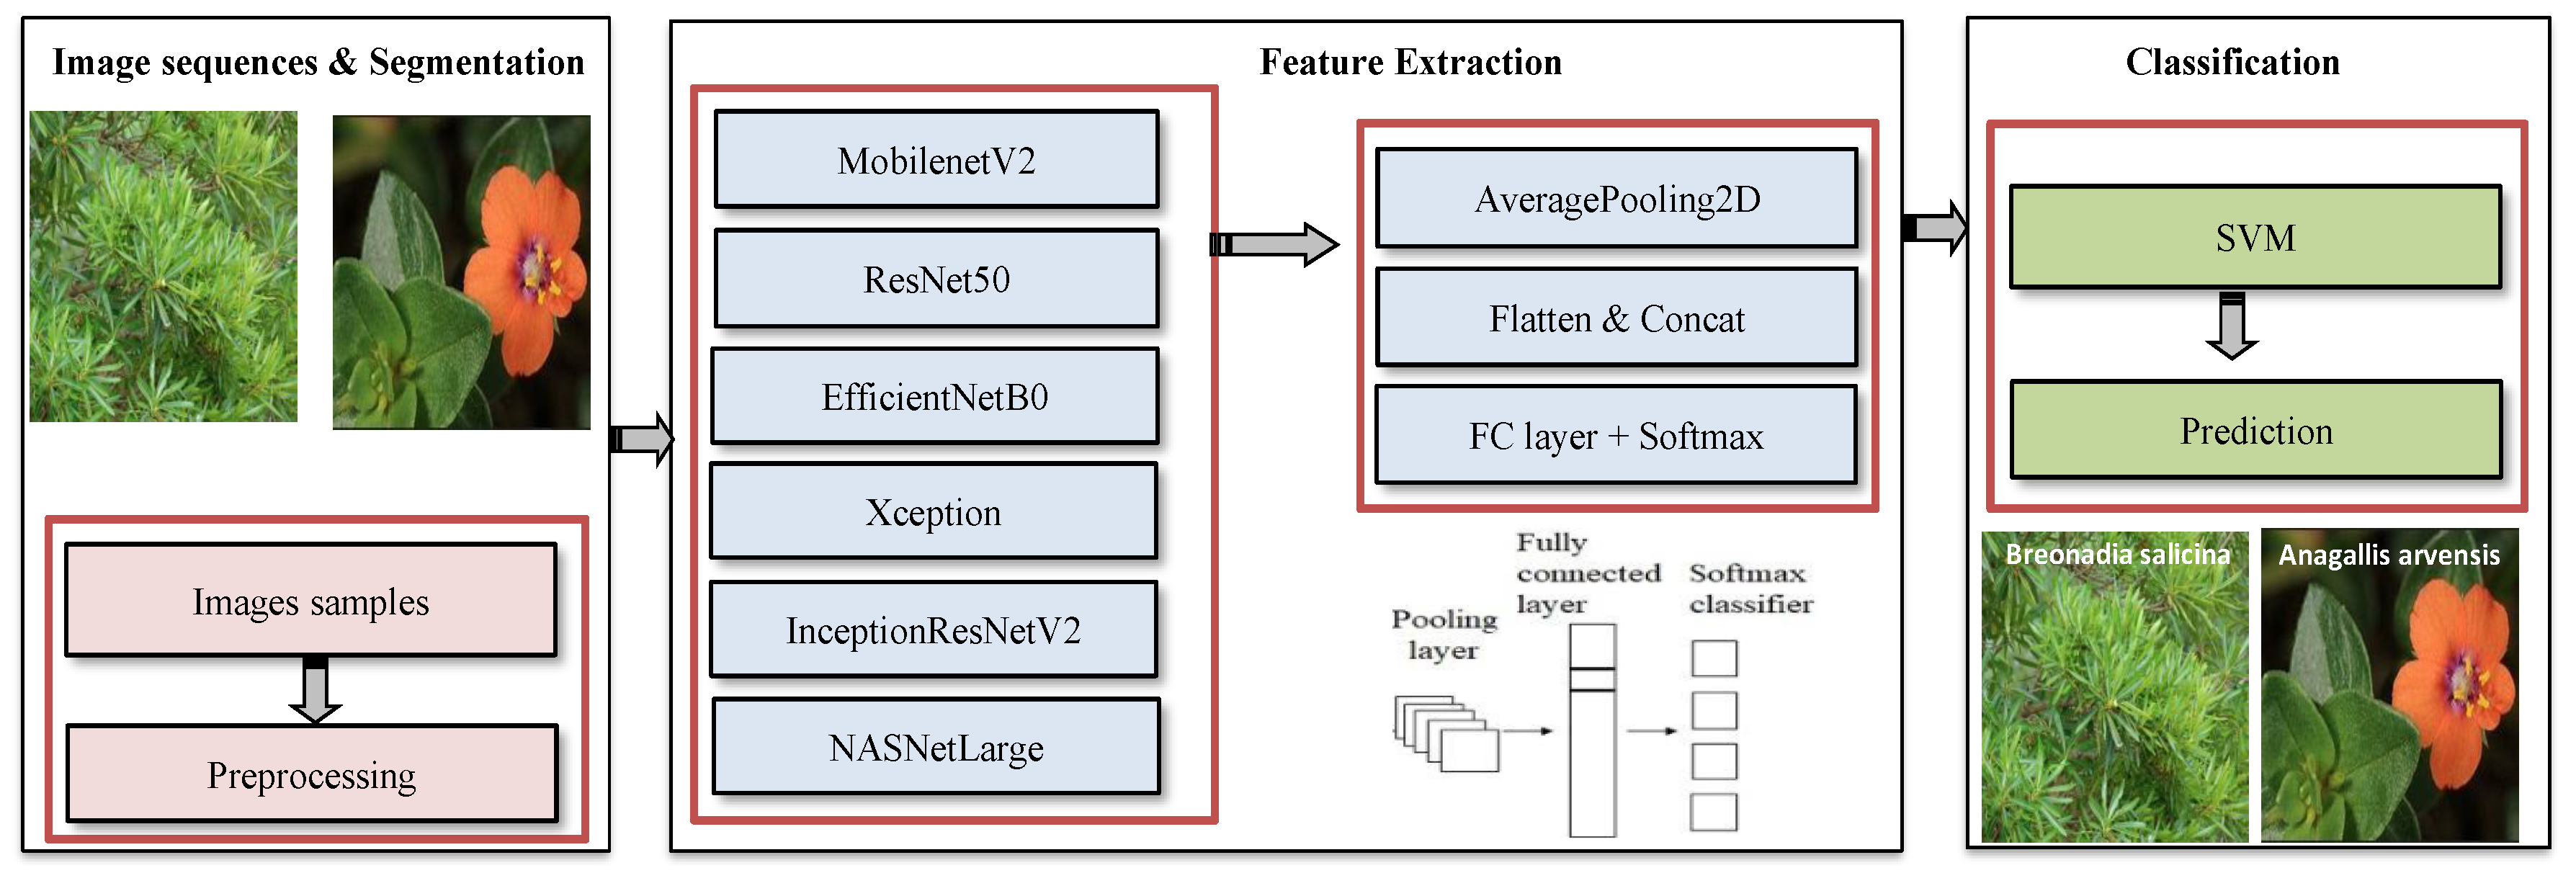
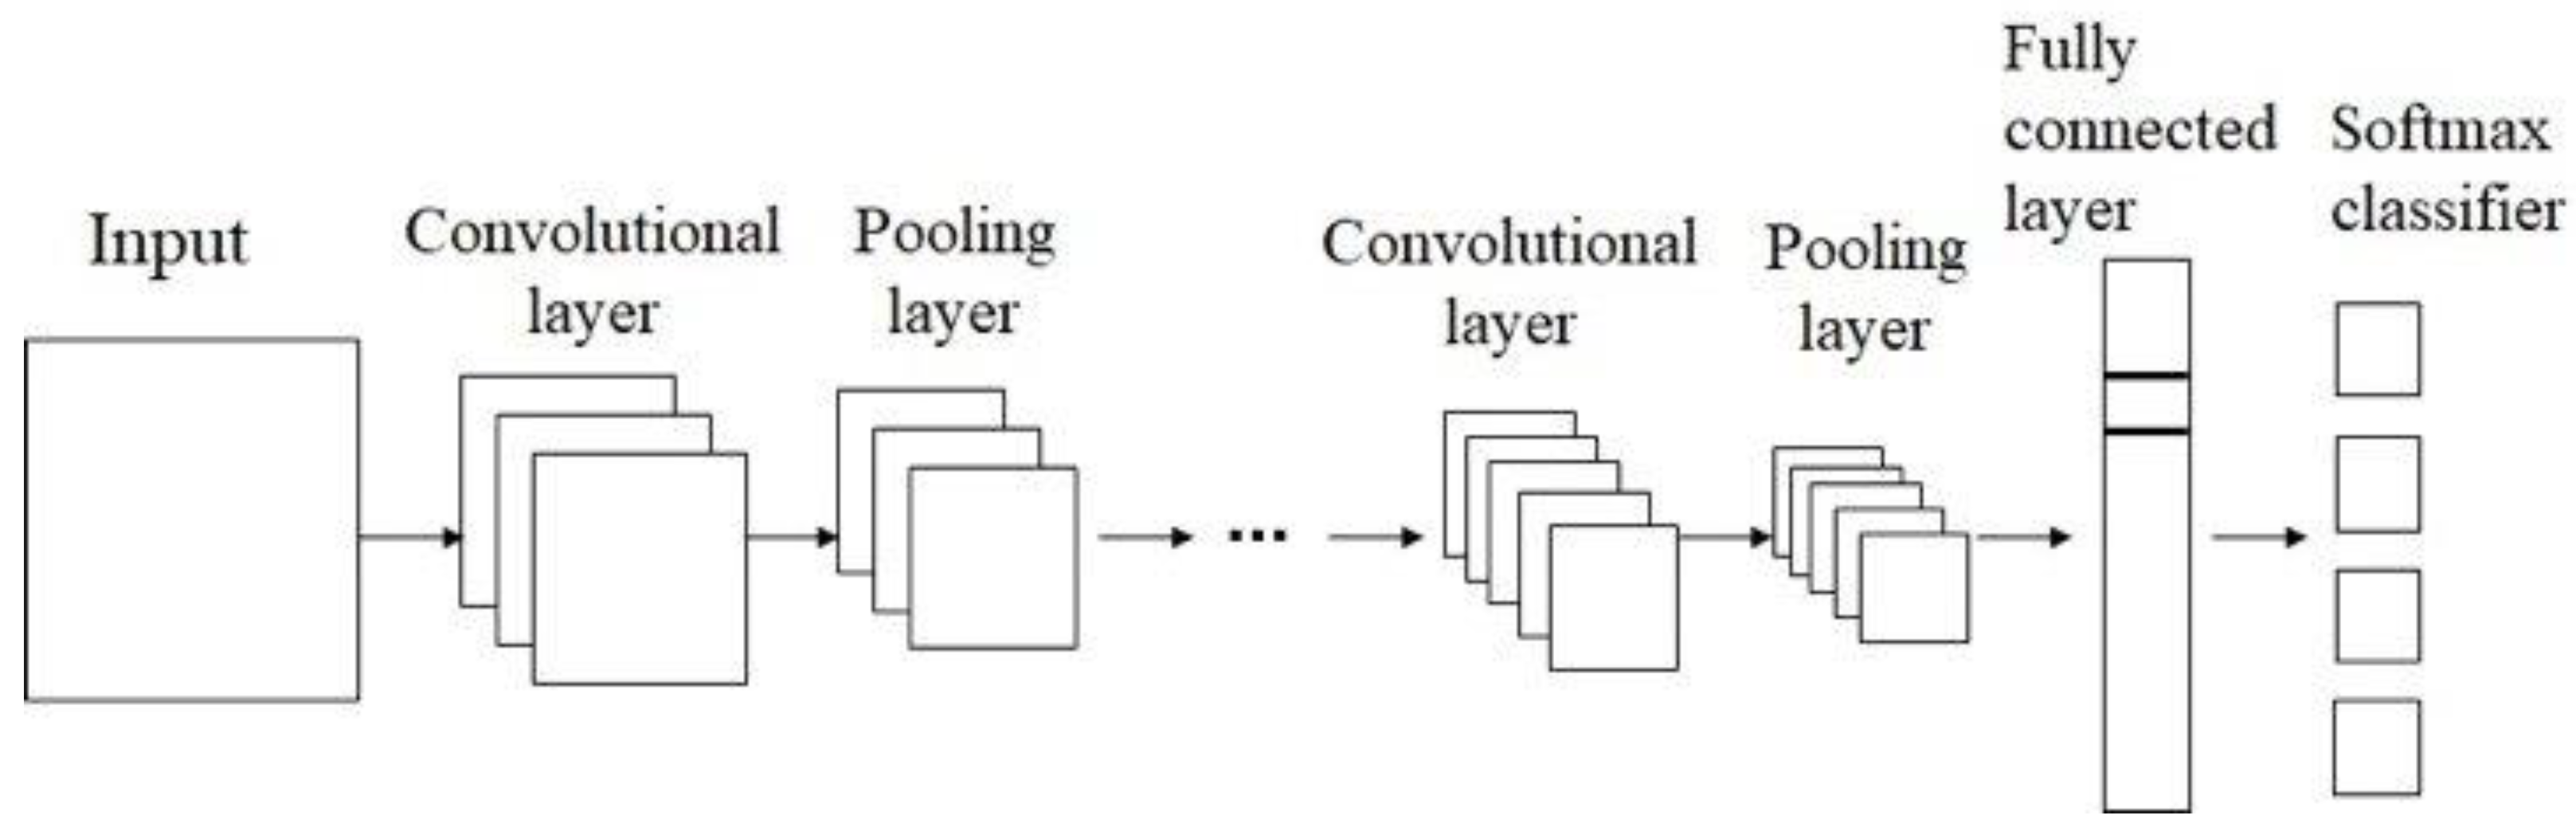
3. Convolutional Neural Network and Support Vector Machine Hybrid Model

Numerous CNN architecture models, including EfficientNetB0, MobileNetV2, ResNet-50, and Xception, as well as SVM classification models, are explored in detail in the next subsections (see Figure 1).

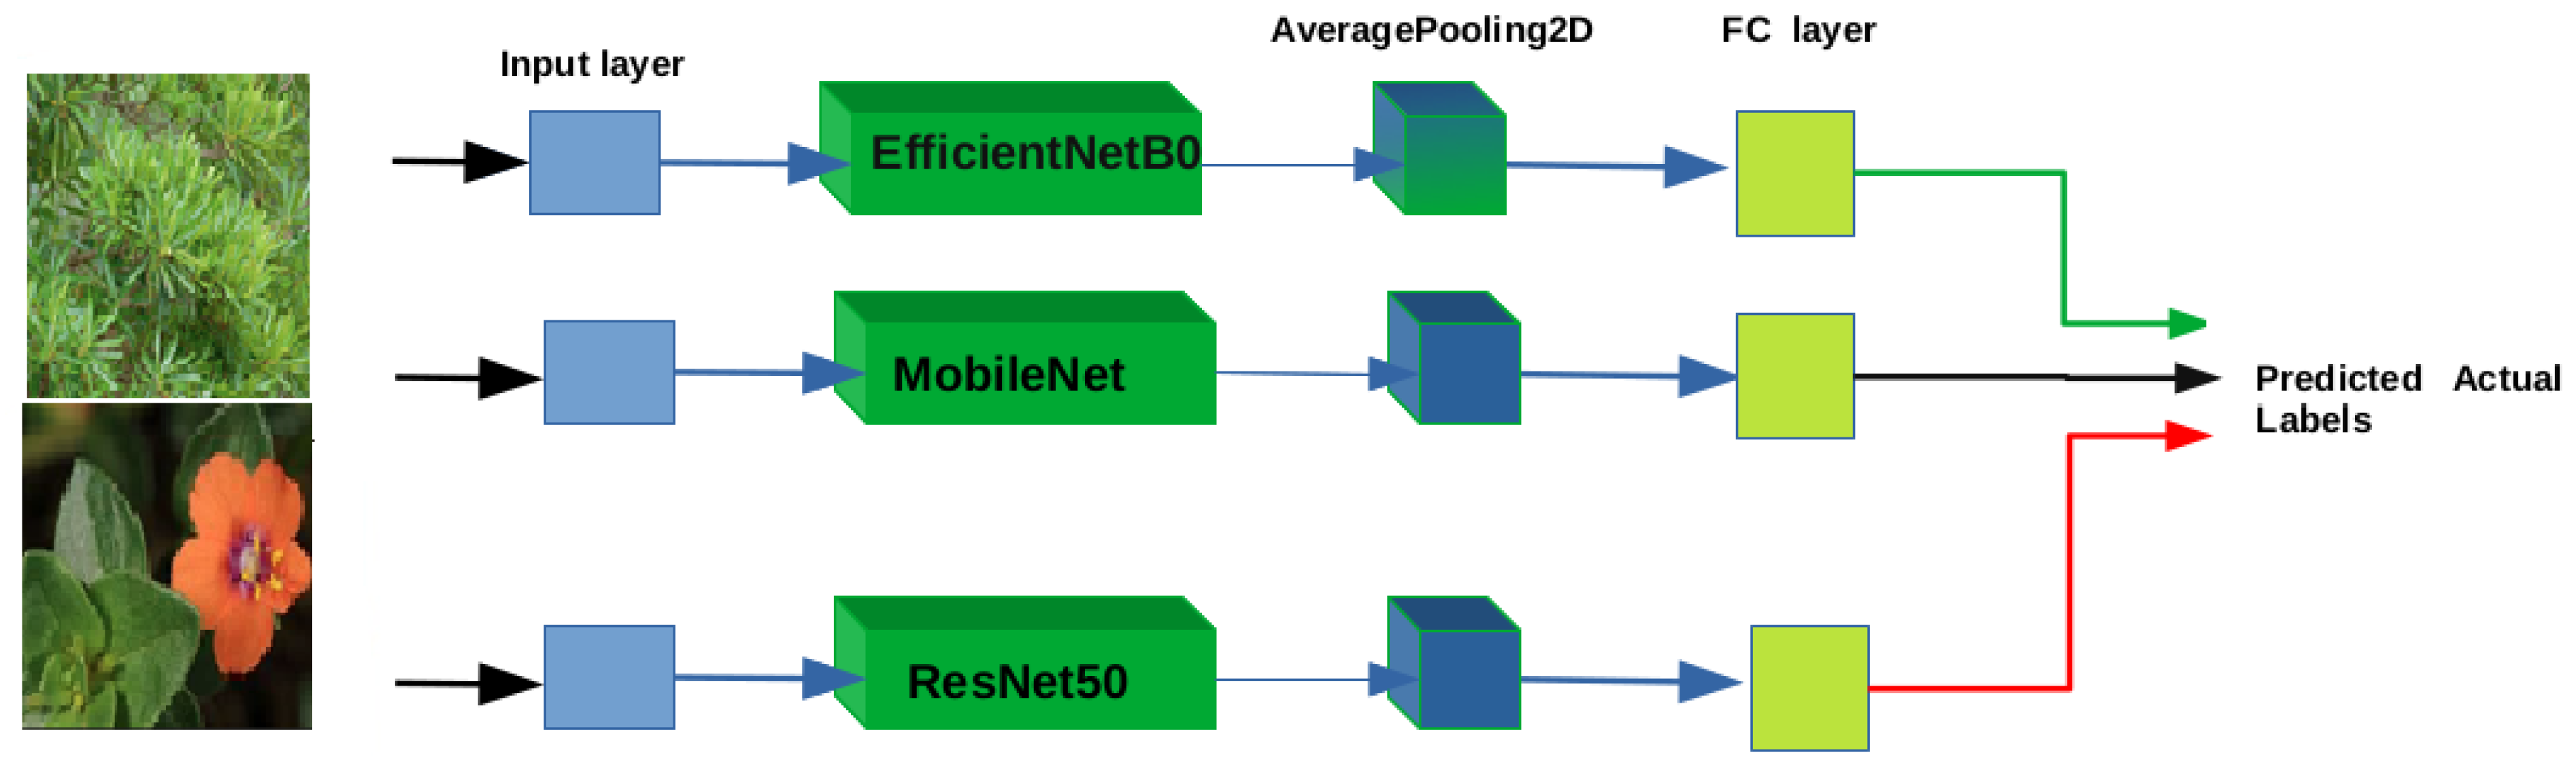
3.1. Pre-Trained Models

The study makes use of CNN models, which are becoming increasingly common as technology develops [28,29]. The work is conducted in three stages by us. The first stage’s preprocessing is used over own a dataset of 2500 images of fifty Arabic plants, in which 80% of images are used for training and 20% of images are used for testing.
The most well-known six pre-trained architectures, including MobileNetV2, ResNet50, EfficientNetB0, InceptionResNetV2, Mobilenet, NASNetLarge, and Xception, are used in the second stage (Figure 1). The initial model used in this study was the Mobilenet, which was created by Howard et al. [30]. The Depthwise Separable Convolutions method is used in this model to extract features rather than the conventional convolution method. With this method, it is possible to extract features with eight or nine times fewer parameters than with a typical convolution process. To make the model quicker and more effective, various updates were made in 2019 [31]. Additionally, the use of 1 × 1 convolutions has decreased the size of feature maps.
The second model used in this study is EfficientNetB0. To improve SVM performance, the GoogleBrain team created the Efficientnet model. They explained that the term “depth” refers to the addition of new layers over or between already existing deep convolution models. As a result, the increase in depth may rebound since it demands more computing resources. Depth, width, and resolution parameters were taken into account at the same time when creating the Efficientnet model, according to Tan [32].
A very advanced CNN architecture called ResNet-50 uses residual learning to address the degradation issue. Because the initial weights were created using entirely different types of data and are therefore unlikely to be useful, the ResNet-50 architecture was used to fit the training data without the use of transfer learning [33]. Identity mapping and residual learning are ResNet’s key features.
For the block inputs, the skip connection serves as an identity mapping. The performance of a typical convolutional network is significantly impacted by going deeper. These networks are vulnerable to the problem of vanishing gradients, in which successive multiplication causes the gradient value to become too small during back propagation. Reverse propagation is guaranteed to be unhindered by the remaining blocks. Alternatively, input data are directly fed into the output of a single layered or multi layered convolutional network, combined, and then the ReLU activation function is applied to achieve residual learning. The required padding is applied to the output convolution network in order to make it the same size as the input. In addition to resolving the issue of vanishing gradients, the network also encourages feature reuse, which raises the feature variance of the outputs [34]. Xception is a deep convolution neural network architecture based on depth-wise separable convolutions. An Inception module’s “extreme” variation is referred to as Xception. Multiple transformations are applied to the same input by an Inception module before the results are combined, giving the model the ability to choose which features to adopt and by how much. The computational efficiency is still poor. Each additional filter causes these convolutions to become deeper as well as spatial, as a result. This reduction allowed the Inception module researchers to combine multiple layer modifications simultaneously, creating a CNN that was broad and deep [35]. A convolutional neural network called InceptionResNetV2 is based on the Inception family of designs, but it has residual connections instead of the filter concatenation step that is present in the Inception architecture [36]. A larger number of images from a database are used to train the NASNet-Large convolutional neural network. The network can classify images into item categories and produces a pre-trained NASNet-Large convolutional neural network [36].
The NASNet-Large convolutional neural network is trained on a larger number of photos from a database. The network can categorize photos into item categories and outputs a NASNet-Large convolutional neural network that has been pre-trained [36]. Figure 2 provides the operational logic of the pre-trained EfficientNetB0, MobileNetV2, and ResNet-50 architectures on the data set. The outcomes at this stage mirror the outcomes from the first stage, which involved CNN architectures that had already been trained.
As many features as there are images in the dataset are extracted by each architecture and combined. Finally, these features are refined before being fed into the SVM to determine whether plant is classified to a specific class images (i.e., poisonous plant or not). The MobileNetV2, EfficientNetB0, Xception, InceptionResNetV2, NASNetLarge and ResNet50 architectures, which are CNN architectures, were used to extract the image properties in the dataset containing the Arabic plants’ images. Each architecture’s layer before the Softmax layer is where these features are found. Data properties in the MobileNetV2 architecture are derived from the “Logits” layer, while in the EfficientNetB0 architecture they are derived from the “efficientnet-b0|model|head|dense|MatMul” layer. To achieve these properties using conventional techniques is a challenging process. Because these features must be manually extracted, this process is expensive and necessitates specialized knowledge. Feature extraction is carried out automatically by deep learning architectures, according to [37]. The SVM classifier receives features that are automatically acquired in the MobileNetV2, EfficientNetB0, Xception, InceptionResNetV2, NASNetLarge and ResNet50 architectures. The second stage of the study is comprised of the results. This phase operates as shown in Figure 1.
The features obtained independently in the MobileNetV2, EfficientNetB0, Xception, InceptionResNetV2, NASNetLarge and ResNet50 architectures were combined in the third step of the study. Each architecture uses an attribute map that is 1500 × 1000 in size. After merging, a feature map with a size of 1500 × 3000 pixels was produced. The number of features involved in the merging process remains unchanged. Each architecture’s features are combined side by side, not underneath one another. The purpose of this is to compare the properties of each data set across various architectures. In this way, three architectures’ features are used (Eroglu, Yildirim, Cinar). The proposed model’s classification process is applied to the concatenated features. The working logic of the suggested model is shown in Figure 1.

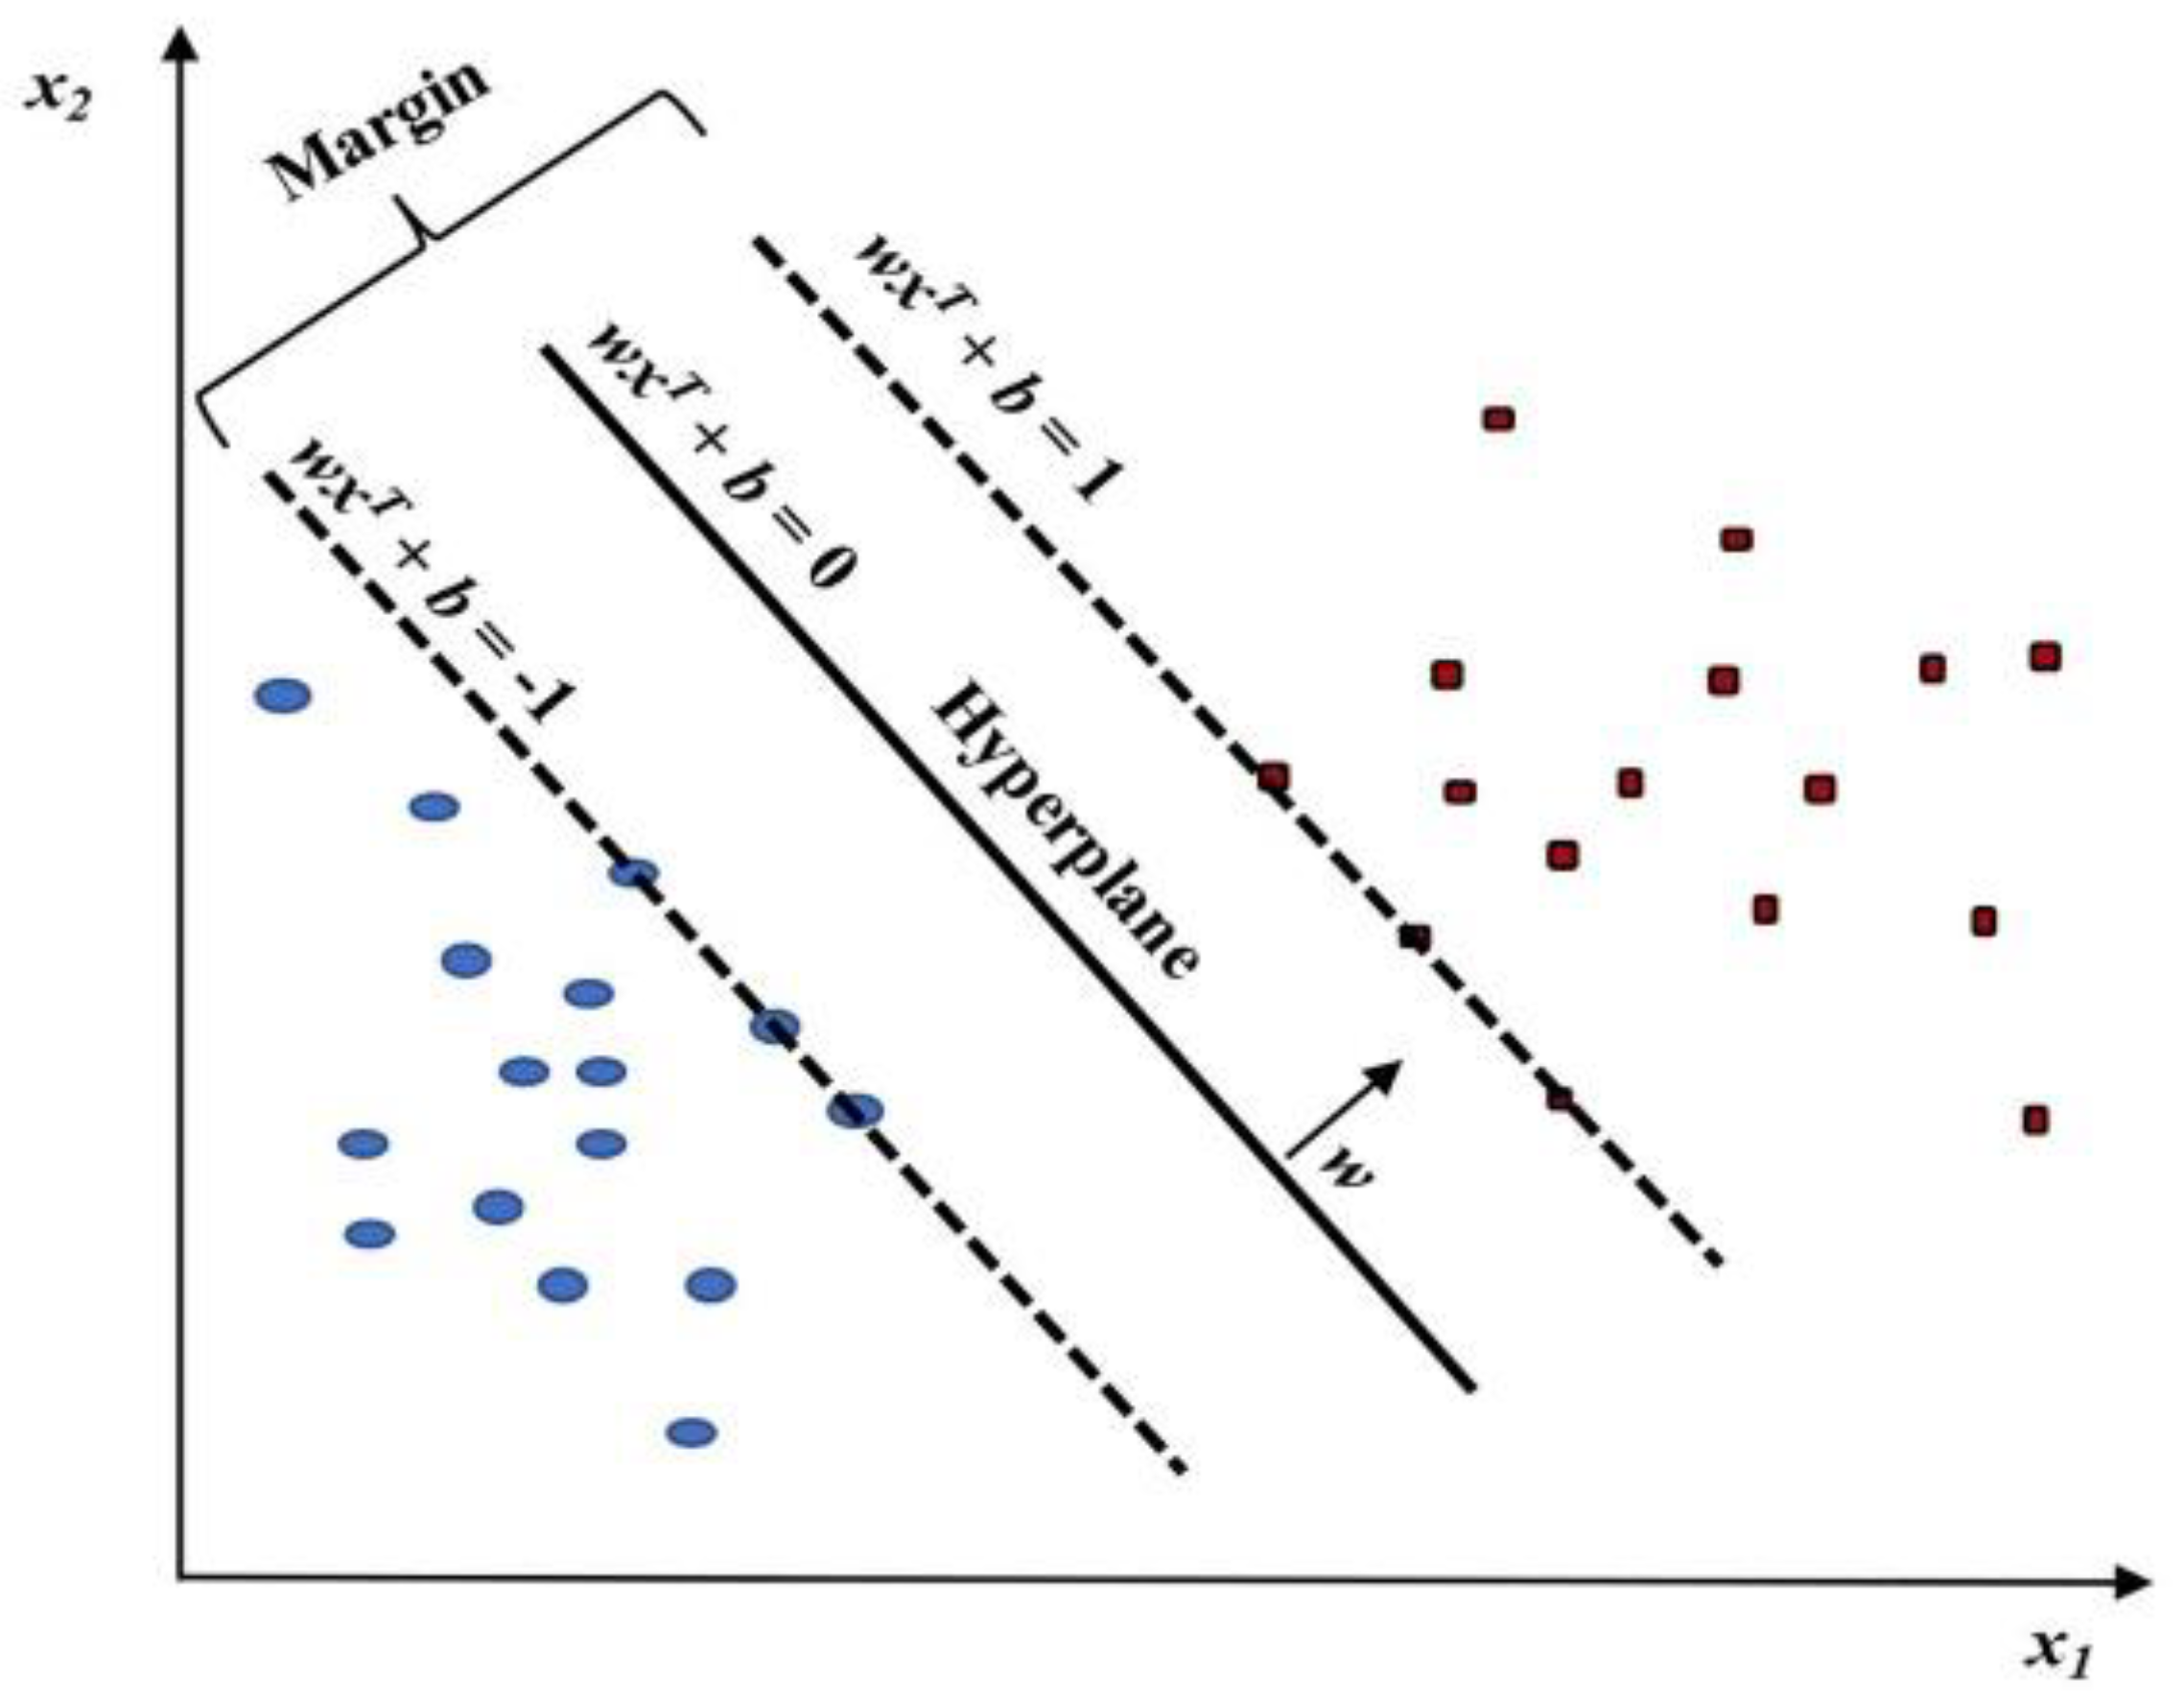
3.2. SVM Classification

The suggested method is based on the SVM, a very precise paradigm with excellent generalization. The main justification for using SVM is to address the overfitting issue and predict data from two classes. We will therefore examine the fundamental concept of SVM, whose design enables them to operate on dichotomic classes, particularly in higher-dimensional space, and hypothesize a maximal separation hyper-plane. The policy of our suggested method depends on maximizing the distance between two parallel hyper-planes, as shown in Figure 3.
As a result, the biggest distance is effectively separated, leading to a classifier with a low generalization error over the hyper-plane.
Suppose the learning dataset is displayed as D = { ( x i , y i ) | x i R d , y i { 1 , + 1 } } , in which x is to the observation features, y refers to the labels of SVM, and D is to the dataset dimension.
Additionally, Vapnik et al. [38] address the learning issue by offering a few examples that enable them to exceed the margin restrictions. The lack parameters are used to define potential margin violations as well as the sanctions needed to stop them. The following function is utilized to linearly learn SVM:
f ( x ) = s i g n ( w . x + b )
where x represents the number of input samples and w stands for a weight vector. b is the threshold value. The maximum margin for data hyper-planes is significantly increased when using a learning SVM trainner. To obtain the shortest distance between the hyper-plane and the support vector, the hyper-plane margin is maximized. SVM are therefore written as follows:
γ = 2 w
In this instance, the input data are split and linearly mapped using SVM in the height dimension domain, and the maximized margin for hyper plane is displayed as in Figure 3.
Based on relevance scores calculated with respect to two classes with identical values, the SVM’s conclusion, which assigns high scores to all labels, is based.
The mapping has no impact on a method’s learning time due to the dot product and kernel trick. The best and most effective classifier against dimensional obscenity is SVM, especially when more features are extracted. Additionally, a number of studies using SVM have generated results that are acceptable when compared to broad domains. The benefit of SVM is that regression optimization can be fixed through testing and leaning procedures. In terms of domain difficulty, the SVM Technique can be reorganized using dualities features, margins, and kernel types. SVM is used to solve issues such as nonlinearity and local minima [39,40]. SVM can also differentiate between labels and properly separate them. Thus, our algorithm generates the following tracks:
Assume that a learning data set with the names ( v 1 , l 1 ) , . . . , ( v N , l N ) , contains v i R d , which represents a reduced feature vector over an input i of a given image. Furthermore, the label of the class density level is represented by l i C 1 , , C k . Calculating each binary classifier using revelence score, a metric for creating graded ground truth, is the key idea. We can rate the gesture automatically using this score and fuzzy membership. In this instance, there is no need for manual determination because the ground truth is built into the binary label. As a result, in order to best distinguish between the two classes, the SVM binary classifier regulates hyper-plane. In order to classify the samples, they also compute their separation from the hyper-plane. The fuzzy score indicates, according to the sigmoid function’s fitting, the likelihood of a positive or negative class posterior. Following an estimation of the decision value to f ( x s ) for each x s learning sample, the fuzzy score will be as follows;
σ = 1 1 + e x p ( a f ( x s ) + b )
The learning database influences the revision of the two parameters, a , b . Additionally, learning samples that are positive or negative are saved according to the fuzzy revelence score. Therefore, for each set of data, we adaptively decide on a threshold value to reclassify data samples into a key class. The use of SVM has two benefits. First off, because it creates ( k 1 ) binary SVM, the time complexity is reduced. Using relevance scores σ s , each binary classification is easily shifted for multi-class analysis at the end. The learning database is used to modify the two parameters a , b . Additionally, learning samples are saved whether they have a negative or positive fuzzy revelence score. As a result, we adaptively determine a threshold value for each set in order to reclassify data samples into a variety of graded gesture levels. A SVM classifier is then used to connect the classes in order to increase the relevance score. SVM usage has two benefits. It first lessens the complexity of time. Applying relevance scores σ s to each binary classification is the final step.

3.3. Integrating Model: CNN and SVM

An essential step in training SVM is becoming familiar with the observation model. In this work, CNN for modeling observation features is employed to SVM. An input layer, two or more hidden layers, and an output layer make up a CNN, a type of neural network model. The CNN model is depicted graphically in Figure 4.
The nodes represent the variables, and the linkages between the nodes represent the weighted parameters. Arrows show the direction of information flow through the network. A CNN has a lot more parameters than a typical three-layer ANN because it has many hidden layers, each of which has more units. Because there are so many parameters, CNN can automatically extract features from raw sensor data for categorization. The input units of a CNN receive the data vector from a frame. The activation probability y j of each hidden unit j is calculated using the inputs from the previous layer, as shown in Equation (4).
y j = 1 1 + e m j , m j = b j + i y i w i j
such that the weight of the connection between the units j and i is denoted by the symbol w i j . The bias of unit j is b j . i is the input for unit y i in the preceding layer the subsequent layer receives the activation probabilities of the units in this layer as inputs. In order to transform the inputs from the previous layer into a classification probability p j , the output unit j, like Equation (5), uses “softmax”.
p j = e m j k e m k , m j = b j + i y i w i j
where a class-specific index k is used. Hinton’s pre-training method [41,42], which involves treating each of the two adjacent layers as a Restricted Boltzmann Machine, can be used to set the weights and biases of CNN instead of a random initialization strategy (RBM). The back propagation algorithm is used to optimize the parameters after initializing the parameters and training the entire network with data from the labels. The class probabilities p ( Z t | x t ) for an observation x t at time step t are generated by the CNN after training. If there are N classes, Equation (5) produces ( P 1 , P 2 , . . . , P N ) for p ( Z t | x t ) . By dividing CNN outputs by the total number of the corresponding class, the emission probability is calculated.

4. Dataset and Experimental Results

The results of the model and the dataset used in this study are carefully examined. In addition, step-by-step figures explore the experimental evaluations for the proposed approach.

4.1. Data Collection

For this study, 2500 images of Arabic plants were retrieved and examined. The authors and numerous students collected the dataset. We have gathered a dataset with 50 images for each of the 50 Arabic plant species (i.e., those found in the Arabian Peninsula) and their regional names (i.e., collected from the locals). It was obtained from free Internet resources such as Unsplash and Pixabay, where all of the photos, illustrations, and HD videos are released under a Creative Commons Attribution (CC0) license, making them suitable for both personal and commercial use without requesting permission. According to https://unsplash.com/s/photos/cyberbullying (accessed on 7 February 2022) and https://pixabay.com/images/search/cyberbullying/(accessed on 7 February 2022), the data set that has been gathered is divided into fifty main classes.
Table 1 shows fifty famous Arabic plants that were selected for study and analysis according to the proposed model, in addition to the type of plant whether it is poisonous or not. The proposed CNN-SVM model is intended to accurately predict the type of plant if it is poisonous or not using the images in these datasets. For each Arabic plant, there are 50 frames of various images in our own data set. We divided the dataset into two thirds for learning and one third for testing processes (i.e., 30 images for training and the remaining 20 images for testing with respect to each plant) in order to provide neutral estimation for CNN-SVM classifier, keeping in mind that the sample for learning process is completely different from testing process. To just be definite, 1500 images total were used for the training samples, while only 1000 images were used for the test. Figure 5 shows some of the selected samples of some Arabic plants that belong to our own data set and on which the experiment was carried out.

4.2. Evaluation

Several metrics, including accuracy, precision, recall, and F 1 score, can be used to evaluate the effectiveness of various categorization techniques. Every binary classification model’s outputs can be divided into the following four categories: True Positive ( T P ), True Negative ( T N ), False Positive ( F P ), and False Negative ( F N ) [41].
The accuracy of a model is determined by the total number of correctly categorized (True Negatives and True Positives) forecasts made across all types of forecasts. The definition of accuracy in mathematics is as follows:
A c c u r a c y = T P + T N T P + T N + F P + F N
Precision is the percentage of items correctly classified as positive relative to all items correctly classified as positive.
P r e c i s i o n = T P T P + F P
Recall is the proportion of correctly identified positive objects among all true positives.
R e c a l l = T P T P + F N
The F 1 score is calculated using precision and recall, with 1 representing the best and 0 representing the worst. The harmonic mean of recall and precision is used to calculate the F 1 score.
F 1 = 2 · p r e c i s i o n · r e c a l l p r e c i s i o n + r e c a l l

4.3. Analysis

Our approach focuses primarily on visuals that show Arabic Plants in action. A GUP video card, 16 GB of RAM, and Windows operating system were installed on the computer used for the study. Confusion matrices were used to assess the performance of the models under consideration and gauge their efficacy. Using confusion matrices, accuracy, precision, recall, and F1-score were all image’s class calculated.
Six previously trained CNN architectures were used to produce the results of the first stage of implementation. The data set was divided into two parts, each of which contained 80% and 20% of the total. The remaining 20% was used to evaluate the trained model, with the remaining 80% going toward training the model. Figure 6 shows the accuracy and the loss values for achieving the optimal parameters of our proposed approach with respect to 750 iterations and 20 epoch.
Table 2 shows that, out of 1000 test images, 750 were correctly classified by the MobileNetV2 model, and 100 were incorrectly classified. The model’s average accuracy value was 85%. Precision for the MobileNetV2 model was 0.90, and recall was 0.91. On the other hand, as shown in Table 2, the EfficientNetB0 model correctly predicted 710 of the 1000 images used for testing, while 160 predictions were incorrect. This model has an average accuracy value of 87%. The efficiency of the EfficientNetB0 model was 0.90 for precision and 0.93 for recall. In addition, out of the 1000 images tested with the InceptionResNetV2 model, 600 were classified correctly and the remaining 200 were falsely classified. The model’s achieved accuracy value on average is 80%. The model’s f1-score was 86 percent.
Table 2 and Figure 7 show that, of the 1000 images used in the test, 600 were correctly predicted by the NASNetLarge model, while 170 were incorrectly predicted. The average accuracy of the model is 77 percent. The NASNetLarge model had a f1-score of 84 percent and a precision of 0.86. Finally, of the 1000 test images, 700 were classified correctly in the ResNet50 model, while 120 were incorrectly classified. The model’s average accuracy value was 82 percent with a f1-score of 89 percent.
The second stage of the study was then successfully completed. To extract features, the six best models; MobileNetV2, ResNet50, EfficientNetB0, Xception, InceptionResNetv2 and NasNetLarge were used. Each architecture extracts and concatenates the same number of features as the total number of images in the data set. The characteristics obtained in each architecture are given to the multiSVM classifier and combined. These features were identified using the MultiSVM classifier after optimization. The proposed model correctly predicted 820 out of 1000 images, while 100 images were incorrectly predicted. The multiSVM classifier and combined models’ accuracy was 92 percent. This combined model achieved a precision of 0.94, a recall of 0.96, and a 95 percent f1-score. Table 2 and Figure 7 contain a list of the performance requirements for the proposed approach. Of all the models taken into consideration, the merged model had the highest accuracy value. Making sense of the data that emerges from a machine learning model is simple when done by visualizing the model’s performance. With the aid of this knowledge, we can decide which changes to make to the model’s parameters or hyper parameters that have an effect on the machine learning model. The performance of the model can be greatly influenced by the number of nodes per layer and the overall number of layers in the neural network. Optimizing these parameters and creating a more accurate model can both benefit from visualizing the fitness of the training and validation sets. Generalizing the model to make it effective at predicting reasonable results with additional data is one of the trickiest parts of any deep learning technique. To check if the model has been trained correctly, it is helpful to visualize the relationship between training accuracy and validation accuracy over a number of epochs. One of the curves that is most frequently used to analyze the behavior of neural networks is the accuracy curve. A curve with accuracy in training and testing is more significant. The relationship between training and testing accuracy as a function of the number of epochs is depicted in Figure 6.

5. Discussion

Many of us are unable to distinguish between specific plant species and warning others about poisonous plants. Over 100,000 people are exposed to toxic plants each year, and these cases are reported to poison control centers across the country. Every plant has a name under a specific class (the plant name), and we will use tensor flow to connect the manually gathered dataset with the plant name of the class that corresponds to the description of the plant and whether it is poisonous or not. We have manually compiled a dataset for various toxic and nontoxic Arabic plants. Text files containing information in both Arabic and English were added. To gather the information, we conducted an internet search.
It will be able to carry out the classification of the real images gathered from various locations using artificial intelligence techniques. To create a classification model for Arabic plants, deep learning architectures were used in this study. Impressively, the proposed method had a rate of 92 percent accuracy. The features were created by combining the trained ResNet50, EfficientNetB0, MobileNet, Xception, NASNetLarge, MobileNetV2, and InceptionResNetV2 architectures. The MultiSVM classifier is then used to categorize the features extracted from the input image. The SVM classifier produced the best results when these combined features were categorized. The accuracy results from the first and second phases of the experiments are displayed in Table 2. The results generated by the combined model outperform those attained by pre-trained models in terms of accuracy.
There are two levels of complexity: during testing and during training. For linear SVMs, we solve a quadratic problem to estimate the vector w and bias b, and the prediction is linear in the number of features and constant in the volume of training data at test time. The training process establishes the number of support vectors (which can be constrained by training set size * training set error rate) and the number of features, and the difficulty of the test is determined by the number of support vectors (which can be constrained by training set size * training set error rate) and the number of features. The training set for our suggested method consists of 1500 images with an error rate of 0.009; consequently, the time complexity is O (1500 × 0.001).
The values in Table 2 are presented in ascending order of accuracy, with the lowest values appearing first. It is evident that the suggested merged method performs best in terms of accuracy, recall, precision, and F1-score. Table 2 clearly demonstrates that the NasNetLarge model, out of all the models tested in this study, has the lowest accuracy, recall, precision, and F1-score. Successful results are also obtained when the proposed model is compared to other studies in the literature.

6. Conclusions

In this article, we described the design and implementation of six various convolutional neural network approaches in conjuction with SVM for plants poisonous prediction. We focus on plant species discovered in the Arabian Peninsula. To proove the feasibility and benefits of our proposed approach, we have gathered a dataset which includes 2500 images of 50 Arabic plant species (i.e., which are found in the Arabian Peninsula). The features were created by combining the trained ResNet50, EfficientNetB0, MobileNet, Xception, NASNetLarge, MobileNetV2, and InceptionResNetV2 architectures. After that, the SVM classifier categorized these extracted features either for training or testing from the input image. It is noted that the SVM classifier produced the best results when these combined features were categorized. The results of our experiments for the convolutional neural network approach in conjunction SVM are favorable where the classifier scored 0.92, 0.94, and 0.95 in accuracy, precision, and F1-Score respectively. In the future, we will develop our approach to classify more than 50 Arabic plants and display all English and Arabic information of a specific plant as well as the prediction of other plant species useful information such as how to take care of it.

Author Contributions

Conceptualization, T.H.N., A.N. and M.E.; methodology, M.E. and T.H.N.; software, A.N.; validation, M.E. and T.H.N.; formal analysis, M.E.; investigation, T.H.N. and M.E.; resources, A.N.; data curation, T.H.N. and M.E.; writing—original draft preparation, T.H.N. and M.E.; writing—review and editing, T.H.N.; visualization, M.E.; supervision, M.E. and T.H.N.; project administration, M.E.; funding acquisition, M.E. All authors have read and agreed to the published version of the manuscript.

Funding

This research received no external funding.

Conflicts of Interest

The authors declare no conflict of interest.

References

  1. Cheek, M.; Nic Lughadha, E.; Kirk, P.; Lindon, H.; Carretero, J.; Looney, B.; Douglas, B.; Haelewaters, D.; Gaya, E.; Llewellyn, T.; et al. New Scientific Discoveries: Plants and Fungi. Plants People Planet 2020, 2, 371–388. [Google Scholar] [CrossRef]
  2. Dasgupta, S. How Many Plant Species Are There in the World? Scientists Now Have an Answer. 2016. Available online: https://news.mongabay.com/2016/05/many-plants-world-scientists-may-now-answer/ (accessed on 15 July 2022).
  3. Jacob Thomas, H. Flora of Saudi Arabia. 2020. Available online: http://www.plantdiversityofsaudiarabia.info/Biodiversity-Saudi-Arabia/Flora/Flora.htm (accessed on 15 July 2022).
  4. Rebekah, R.; Scottie, A. Nearly 1000 of Florida’s Beloved Manatees Have Died This Year as Toxic Algae Blooms Choke Off Their Food Source. 2021. Available online: https://edition.cnn.com/2021/10/28/us/florida-manatee-deaths-starvation/index.html (accessed on 15 July 2022).
  5. Kolhar, S.; Jagtap, J. Plant Trait Estimation and Classification Studies in Plant Phenotyping Using Machine Vision—A Review. Inf. Process. Agric. 2021, in press. [Google Scholar] [CrossRef]
  6. Li, L.; Zhang, S.; Wang, B. Plant Disease Detection and Classification by Deep Learning—A Review. IEEE Access 2021, 9, 56683–56698. [Google Scholar] [CrossRef]
  7. Xiong, J.; Yu, D.; Liu, S.; Shu, L.; Wang, X.; Liu, Z. A Review of Plant Phenotypic Image Recognition Technology Based on Deep Learning. Electronics 2021, 10, 81. [Google Scholar] [CrossRef]
  8. Kaur, P.; Singh, S.K.; Singh, I.; Kumar, S. Exploring Convolutional Neural Network in Computer Vision-based Image Classification. Proceeding of the International Conference on Smart Systems and Advanced Computing (Syscom-2021), New Delhi, India, 26–27 December 2021; pp. 1–9. [Google Scholar]
  9. Noor, T.H. Behavior Analysis-Based IoT Services For Crowd Management. Comput. J. 2022, 65, bxac071. [Google Scholar] [CrossRef]
  10. Lu, J.; Tan, L.; Jiang, H. Review on Convolutional Neural Network (CNN) Applied to Plant Leaf Disease Classification. Agriculture 2021, 11, 707. [Google Scholar] [CrossRef]
  11. Loddo, A.; Di Ruberto, C. On The Efficacy of Handcrafted and Deep Features for Seed Image Classification. J. Imaging 2021, 7, 171. [Google Scholar] [CrossRef]
  12. Zahan, N.; Hasan, M.Z.; Malek, M.A.; Reya, S.S. A Deep Learning-Based Approach for Edible, Inedible and Poisonous Mushroom Classification. In Proceedings of the International Conference on Information and Communication Technology for Sustainable Development (ICICT4SD), Dhaka, Bangladesh, 27–28 February 2021; pp. 440–444. [Google Scholar]
  13. Liu, J.; Wang, X. Plant Diseases and Pests Detection Based on Deep Learning: A Review. Plant Methods 2021, 17, 1–18. [Google Scholar] [CrossRef]
  14. Vizcarra, G.; Bermejo, D.; Mauricio, A.; Gomez, R.Z.; Dianderas, E. The Peruvian Amazon Forestry Dataset: A Leaf Image Classification Corpus. Ecol. Inform. 2021, 62, 101268. [Google Scholar] [CrossRef]
  15. Prasad, M.P.S.; Senthilrajan, A. A Novel CNN-KNN based Hybrid Method for Plant Classification. J. Algebr. Stat. 2022, 13, 498–502. [Google Scholar]
  16. Chaki, J.; Parekh, R. Designing an Automated System for Plant Leaf Recognition. Int. J. Adv. Eng. Technol. 2012, 2, 149–158. [Google Scholar]
  17. Tavakoli, H.; Alirezazadeh, P.; Hedayatipour, A.; Nasib, A.B.; Landwehr, N. Leaf Image-based Classification of Some Common Bean Cultivars Using Discriminative Convolutional Neural Networks. Comput. Electron. Agric. 2021, 181, 105935. [Google Scholar] [CrossRef]
  18. Naeem, S.; Ali, A.; Chesneau, C.; Tahir, M.H.; Jamal, F.; Sherwani, R.A.K.; Ul Hassan, M. The Classification of Medicinal Plant Leaves Based on Multispectral and Texture Feature Using Machine Learning Approach. Agronomy 2021, 11, 263. [Google Scholar] [CrossRef]
  19. Sujith, A.; Neethu, R. Classification of Plant Leaf Using Shape and Texture Features. In Inventive Communication and Computational Technologies; Ranganathan, G., Chen, J., Rocha, Á., Eds.; Springer: Singapore, 2021; pp. 269–282. [Google Scholar]
  20. Kumar, N.; Belhumeur, P.N.; Biswas, A.; Jacobs, D.W.; Kress, W.J.; Lopez, I.C.; Soares, J.V. Leafsnap: A Computer Vision System for Automatic Plant Species Identification. In Proceedings of the 12th European Conference on Computer Vision (ECCV), Florence, Italy, 7–13 October 2012; Springer: Berlin/Heidelberg, Germany, 2012; pp. 502–516. [Google Scholar]
  21. Koh, J.C.; Spangenberg, G.; Kant, S. Automated Machine Learning for High-throughput Image-based Plant Phenotyping. Remote. Sens. 2021, 13, 858. [Google Scholar] [CrossRef]
  22. Patil, A.; Lad, K. Chili Plant Leaf Disease Detection Using SVM and KNN Classification. In Rising Threats in Expert Applications and Solutions; Rathore, V., Dey, N., Piuri, V., Babo, R., Polkowski, Z., Tavares, J., Eds.; Springer: Singapore, 2021; pp. 223–231. [Google Scholar]
  23. Ahmad, N.; Asif, H.M.S.; Saleem, G.; Younus, M.U.; Anwar, S.; Anjum, M.R. Leaf Image-based Plant Disease Identification Using Color and Texture Features. Wirel. Pers. Commun. 2021, 121, 1139–1168. [Google Scholar] [CrossRef]
  24. Negi, A.; Kumar, K.; Chauhan, P. Deep Neural Network-Based Multi-Class Image Classification for Plant Diseases. In Agricultural Informatics: Automation Using the IoT and Machine Learning; Amitava, C., Arindam, B., Manish, P., Amlan, C., Eds.; Wiley Online Library: Hoboken, NJ, USA, 2021; pp. 117–129. [Google Scholar]
  25. Thakur, S.; Patil, D.; Sarse, R.; Bharambe, M. Plant Disease Detection and Solution Using Image Classification. Int. J. Sci. Res. Eng. Trends 2021, 7, 1534–1540. [Google Scholar]
  26. Granwehr, A.; Hofer, V. Analysis on Digital Image Processing for Plant Health Monitoring. J. Comput. Nat. Sci. 2021, 1, 1–8. [Google Scholar] [CrossRef]
  27. Atila, Ü.; Uçar, M.; Akyol, K.; Uçar, E. Plant Leaf Disease Classification Using EfficientNet Deep Learning Model. Ecol. Inform. 2021, 61, 101182. [Google Scholar] [CrossRef]
  28. Emine Cengil, A.C. Multiple Classification of Flower Images Using Transfer Learning. In Proceedings of the 2019 International Artificial Intelligence and Data Processing Symposium (IDAP), Malatya, Turkey, 21–22 September 2019. [Google Scholar] [CrossRef]
  29. Hark, C.; Uçkan, T.; Seyyarer, E.; Karci, A. Extractive Text Summarization via Graph Entropy Çizge Entropi ile Çıkarıcı Metin Özetleme. In Proceedings of the 2019 International Artificial Intelligence and Data Processing Symposium (IDAP), Malatya, Turkey, 21–22 September 2019; ACM Press: New York, NY, USA, 2019. [Google Scholar] [CrossRef]
  30. Harjoseputro, Y.; Yuda, I.P.; Danukusumo, K.P. MobileNets: Efficient Convolutional Neural Network for Identification of Protected Birds. Int. J. Adv. Sci. Eng. Inf. Technol. 2020, 10, 2290. [Google Scholar] [CrossRef]
  31. Sandler, M.; Howard, A.; Zhu, M.; Zhmoginov, A.; Chen, L.C. MobileNetV2: Inverted Residuals and Linear Bottlenecks. In Proceedings of the 2018 IEEE/CVF Conference on Computer Vision and Pattern Recognition, Salt Lake City, UT, USA, 18–22 June 2018. [Google Scholar] [CrossRef] [Green Version]
  32. Tan, M.; Le, Q. EfficientNet: Rethinking Model Scaling for Convolutional Neural Networks. Proceedings of the 36th International Conference on Machine Learning, Proceedings of Machine Learning Research, 97:6105–6114. 2019. Available online: https://proceedings.mlr.press/v97/tan19a.html (accessed on 15 July 2022).
  33. Tripathi, K.; Gupta, A.K.; Vyas, R.G. Deep Residual Learning for Image Classification using Cross Validation. Int. J. Innov. Technol. Explor. Eng. 2020, 9, 1525–1530. [Google Scholar] [CrossRef]
  34. Radhika, K.; Devika, K.; Aswathi, T.; Sreevidya, P.; Sowmya, V.; Soman, K.P. Performance Analysis of NASNet on Unconstrained Ear Recognition. In Nature Inspired Computing for Data Science; Springer International Publishing: Berlin/Heidelberg, Germany, 2019; pp. 57–82. [Google Scholar] [CrossRef]
  35. Cleetus, L.; Sukumar, A.R.; Hemalatha, N. Computational Prediction of Disease Detection and Insect Identification using Xception model. bioRxiv 2021. [Google Scholar] [CrossRef]
  36. Zhang, H.; Liu, C.; Zhang, Z.; Xing, Y.; Liu, X.; Dong, R.; He, Y.; Xia, L.; Liu, F. Recurrence Plot-Based Approach for Cardiac Arrhythmia Classification Using Inception-ResNet-v2. Front. Physiol. 2021, 12, 648950. [Google Scholar] [CrossRef] [PubMed]
  37. Eroğlu, Y.; Yildirim, M.; Çinar, A. Convolutional Neural Networks based classification of breast ultrasonography images by hybrid method with respect to benign, malignant, and normal using mRMR. Comput. Biol. Med. 2021, 133, 104407. [Google Scholar] [CrossRef] [PubMed]
  38. Redi, M.; Merialdo, B. A Multimedia Retrieval Framework Based on Automatic Graded Relevance Judgments. In Lecture Notes in Computer Science; Springer: Berlin/Heidelberg, Germany, 2012; pp. 300–311. [Google Scholar] [CrossRef]
  39. Elmezain, M.; Al-Hamadi, A.; Rashid, O.; Michaelis, B. Posture and Gesture Recognition for Human-Computer Interaction. In Advanced Technologies; InTech: London, UK, 2009. [Google Scholar] [CrossRef] [Green Version]
  40. Elmezain, M.; Al-Hamadi, A.; Michaelis, B. Discriminative Models-Based Hand Gesture Recognition. In Proceedings of the 2009 Second International Conference on Machine Vision, Dubai, United Arab Emirates, 28–30 December 2009. [Google Scholar] [CrossRef]
  41. Elmezain, M.; Malki, A.; Gad, I.; Atlam, E.S. Hybrid Deep Learning Model–Based Prediction of Images Related to Cyberbullying. Int. J. Appl. Math. Comput. Sci. 2022, 32, 323–334. [Google Scholar] [CrossRef]
  42. Elmezain, M.; Mahmoud, A.; Mosa, D.T.; Said, W. Brain Tumor Segmentation Using Deep Capsule Network and Latent-Dynamic Conditional Random Fields. J. Imaging 2022, 8, 190. [Google Scholar] [CrossRef]
Figure 1. Estimating the types of plants with the proposed model.
Electronics 11 03690 g001
Figure 2. Estimating the type of plants with the CNN model.
Electronics 11 03690 g002
Figure 3. The structure of hyperplane’s margin for SVM.
Electronics 11 03690 g003
Figure 4. The Structure of CNN model.
Electronics 11 03690 g004
Figure 5. Some selected samples from our own data set.
Electronics 11 03690 g005
Figure 6. Accuracy and loss curves of the proposed approach.
Electronics 11 03690 g006
Figure 7. Confusion matrix for EfficientNetB0, ResNet50, MobileNetV2, InceptionResNetv2, NasNetLarge, Xception and our intergated model.
Electronics 11 03690 g007
Table 1. Type of Arabic plants: selected 50 various plants.
Plant Scientific NamePlant Type
prickly pearNot poisonous
ArtemisiaNot poisonous
Rhanterium epapposumNot poisonous
UrticaNot poisonous
African loan treeNot poisonous
Toxicodendron radicansPoisonous
Haplophyllum tuberculatumNot poisonous
Dum tree (Hyphaene Thebaica )Not poisonous
ProsopisNot poisonous
Abutilon pannosumNot Poisonous
Calligonum comosumNot Poisonous
Halocnemum strobilaceumNot Poisonous
Rumex vesicariusNot Poisonous
Vachellia niloticaNot Poisonous
Adenium obesumPoisonous
Retama raetamNot Poisonous
Breonadia salicinaNot Poisonous
Jasminum grandiflorumNot Poisonous
BeshamNot Poisonous
common nimNot Poisonous
fiery mufflerNot Poisonous
HandyPoisonous
HarmelNot Poisonous
HennaNot Poisonous
InfernalNot Poisonous
OatmealNot Poisonous
SidrNot Poisonous
Anagallis arvensisPoisonous
Salvadora persicaNot Poisonous
AlashkerPoisonous
AlbangPoisonous
alkhnsorNot poisonous
alHalafaNot poisonous
RicinusPoisonous
Echinops spinosissimusNot poisonous
Rhanterium epapposumNot poisonous
CloverNot poisonous
AlRamramPoisonous
Boswellia sacraNot poisonous
Breonadia salicinaNot poisonous
Solanum incanumPoisonous
Olea algirusNot poisonous
EucleaNot poisonous
NarcissusPoisonous
Scadoxus multiflorusNot poisonous
Nerium oleanderPoisonous
Sectarian rosesNot poisonous
Rabbit hairNot poisonous
Reichardia tingitanaNot poisonous
A poisonous or sperm-likePoisonous
Table 2. Classification report for the used seven models in our study.
PrecisionRecallF1-ScoreAccuracy
NASNetLarge0.860.820.840.77
InceptionResNetV20.850.860.850.80
ResNet500.910.860.890.82
Xception0.900.880.890.83
MobilenetV20.900.910.910.85
EfficientNetB00.900.930.920.87
Our Method (CNN-SVM)0.940.960.950.92
Publisher’s Note: MDPI stays neutral with regard to jurisdictional claims in published maps and institutional affiliations.

