1. Introduction
Problem behaviors such as hitting, screaming, and wandering may result from sensory imbalance. Research has indicated that environmental factors aimed at restoring equilibrium, such as multi-sensory environment (MSE) interventions, might improve the quality of life for patients with disabilities and their caregivers [
1,
2,
3]. This MSE intervention has been reported to positively impact behavioral and psychological symptoms (BPS) by reducing wandering, lowering agitation during bathing, and increasing positive engagement. In addition, MSE interventions may improve cognition and function, reducing caregiver burden [
4,
5]. Sensory equilibrium may be accomplished within an MSE through controlled visual, auditory, tactile, and olfactory stimuli designed to mitigate overactive or underactive behaviors. Specifically, MSE interventions indicate some event that stimulates sensory organs to achieve positive psychological stimuli.
The question then becomes how to be certain that this kind of event for supporting the convalescent phase is always helpful for increasing positive psychological stimuli. Although it seems that most disabled patients enjoy MSE interventions that caregivers prepare, clinical experiential knowledge has shown that a patient sometimes has difficulty breathing or faints from fright during or immediately after MSE. Because there is no diagnosis, it is difficult to understand why this patient shows this kind of symptom at the clinical site [
6,
7,
8,
9,
10]. Thus, it is considered necessary to have a healthcare monitoring or management method to evaluate emotional arousal and perform a risk assessment to prevent medical accidents. Sudden cardiac death (SCD) accounts for 300,000 to 400,000 deaths annually in the United States, and 88% of those were due to cardiac disease [
6]. It is well-known that SCD occurs during or immediately after a stressful event. In addition, some studies have reported the rare risk of SCD associated with psychological stimuli.
Although MSE interventions should be implemented with careful consideration of the individual preferences and sensitivities of participants in order not to induce BPS through unintended over-stimulation, most studies focused on the only positive impact of MSE on patients with disabilities. However, according to the level and categorization of disability, it is possible to measure the negative effect of MSE on patients with disabilities. Thus, evaluating the emotional change with continuous non-invasive measurement is necessary to grasp the overstimulated symptom.
Therefore, the primary purpose of the present study was to propose a continuous non-invasive measurement of nasal temperature while evaluating emotional arousal in MSE interventions using thermal images. In addition, this study addressed the precaution or cause and why one group would be helped and the others would be harmed by MSE interventions using electrocardiography (ECG). In this study, two groups of disabled patients participated: ten with muscular dystrophy (MD) and ten with severe motor and intellectual disabilities (SMID). Patients with MD have a clear consciousness to communicate with each other despite no body movement. Patients with SMID do not have communication despite possible body movement.
The contribution was that the continuous measurement of nasal temperature enabled us to evaluate the emotional arousal of disabled patients in MSE while cross-checking the results of ECG.
2. Human Subjects
Twenty patients with disabilities participated in an experiment to experience a virtual aquarium for 12 min through a projector. In addition, they prepared music as audio-visual stimuli: ten patients with MD (age: 55.0 ± 13.6 years old, gender: five males and five females), and ten with SMID (age: 48.5 ± 0.8 years old, gender: five males and five females).
MD [
11,
12] causes muscle weakness and loss. Some forms of MD appear in infancy or childhood. Others may only appear in middle age or later. The different types can vary in whom they affect, which muscles they affect, and what symptoms appear. All forms of MD grow worse as the person’s muscles gradually weaken. Most patients with MD eventually lose the ability to walk, although they have intention. All the patients in this study could not walk by themselves. They could move in their motorized wheelchairs. However, they had clear consciousness. Furthermore, they could recognize marine organisms such as fish, then track their favorite scene at will. Above all, they had the experience of watching a natural aquarium.
SMID [
13,
14] is a term used to describe a heterogeneous group of disorders with severe physical disabilities and profound mental retardation, and epilepsy is a frequent complication. SMID is complicated by epilepsy in 70∼80% of cases, and intractable epilepsy is predominant. Some patients achieve seizure control by adolescence, but most do not. It appears that the prognosis of activities of daily living (ADL) is worse with uncontrolled epilepsy. Most patients cannot walk or eat by themselves. Those in this study could not move without the help of caregivers or family. They had no clear consciousness. Furthermore, they could not recognize marine organisms or track their favorite scene at will. They have never been to a natural aquarium.
All subjects gave their informed consent for inclusion before participating in the study. The study was conducted under the Declaration of Helsinki. The protocol was approved by the Ethics Committee of the Clinical Trial Center at the National Hospital Organization Nara Medical Center in Japan [
15] (No. 20160826).
3. Methodology
3.1. Experimental Environment and System
All of the experiments were performed under the same conditions. Please refer to
Supplementary Materials. For Phase 1, a subject was moved to the experimental room and was then ready for measurements for 3 min after setting all of the practical sensing systems. For Phase 2, a subject attended the MSE intervention of a virtual aquarium for 12 min. Finally, the subject was moved to another room of the virtual aquarium after all the experimental systems were eliminated.
To increase the comfort of all disabled patients during Phase 2, caregivers familiar with a patient were always with them. The caregiver also wrote down the condition of his or her patient based on the caregiver’s assessment [
1]. All experiments were performed in Japan’s National Hospital Organization Nara Medical Center.
Figure 1 shows examples of the virtual aquarium used in this study. The virtual aquarium was introduced by a hospital nurse: “I would like to show you a movie for children who have no chance to go outside.” The movie produced an exciting emotion while activating the multi-sensory stimulation by using multi-colored lights from the projector and some music. For a much deeper understanding, please refer to the Japanese website of EPSON Corporation (
https://www.epson.jp/SR/citizenship/fantas_aquarium/fantas_projection/ (accessed on 16 November 2021)).
Figure 2 shows an overview of the experimental environment for MSE interventions and a description of the practical system and arrangement. A subject experienced the movement of many kinds of marine organisms on the projected screen made by a curtain while sitting in a wheelchair. In this study, the room of the virtual aquarium consisted of a projector and some volunteers who prepared music [
16]. For a long time, they have been dedicated to giving disabled patients the virtual aquarium as a dramatic event. All subjects could see many types of marine organisms and ocean scenes, then touch the curtain screen and listen to music tuned with the prepared set. While activating multi-sensory stimulation, most caregivers believe that most disabled patients have exciting emotions in MSE interventions.
The 2-lead electrocardiography (ECG) (ADInstruments PowerLab) was used for measuring RR and QT intervals [
17]. PowerLab was the strongest DAQ (Data Acquistion Hardware System) system, with 16 analog input channels, an isolated amplifier (such as Bio Amplifier), and 2-lead ECG electrodes [
18]. Next, a thermal imager (Fluke Ti450, with width × height = 320 × 240 resolution and a sampling frequency of 60 Hz) and an infrared camera (NET COWBOY DC-NCR131, a 1.3-megapixel digital camera, with a sampling frequency of 30 Hz, and width × height × depth = 52 × 70 × 65 resolution) was used to measure the facial temperature distribution and both the facial detection/expressions and body movements. The thermal image was connected to the computer using a USB cable in order to save the measured data and process the real-time facial detection. At the same time, heart rate variability (HRV) analysis, received from biological signal acquisition, was utilized to verify our experimental results. Precisely, the ratio of low and high-frequency power of HRV, namely the LF/HF ratio, was calculated for emotional arousal.
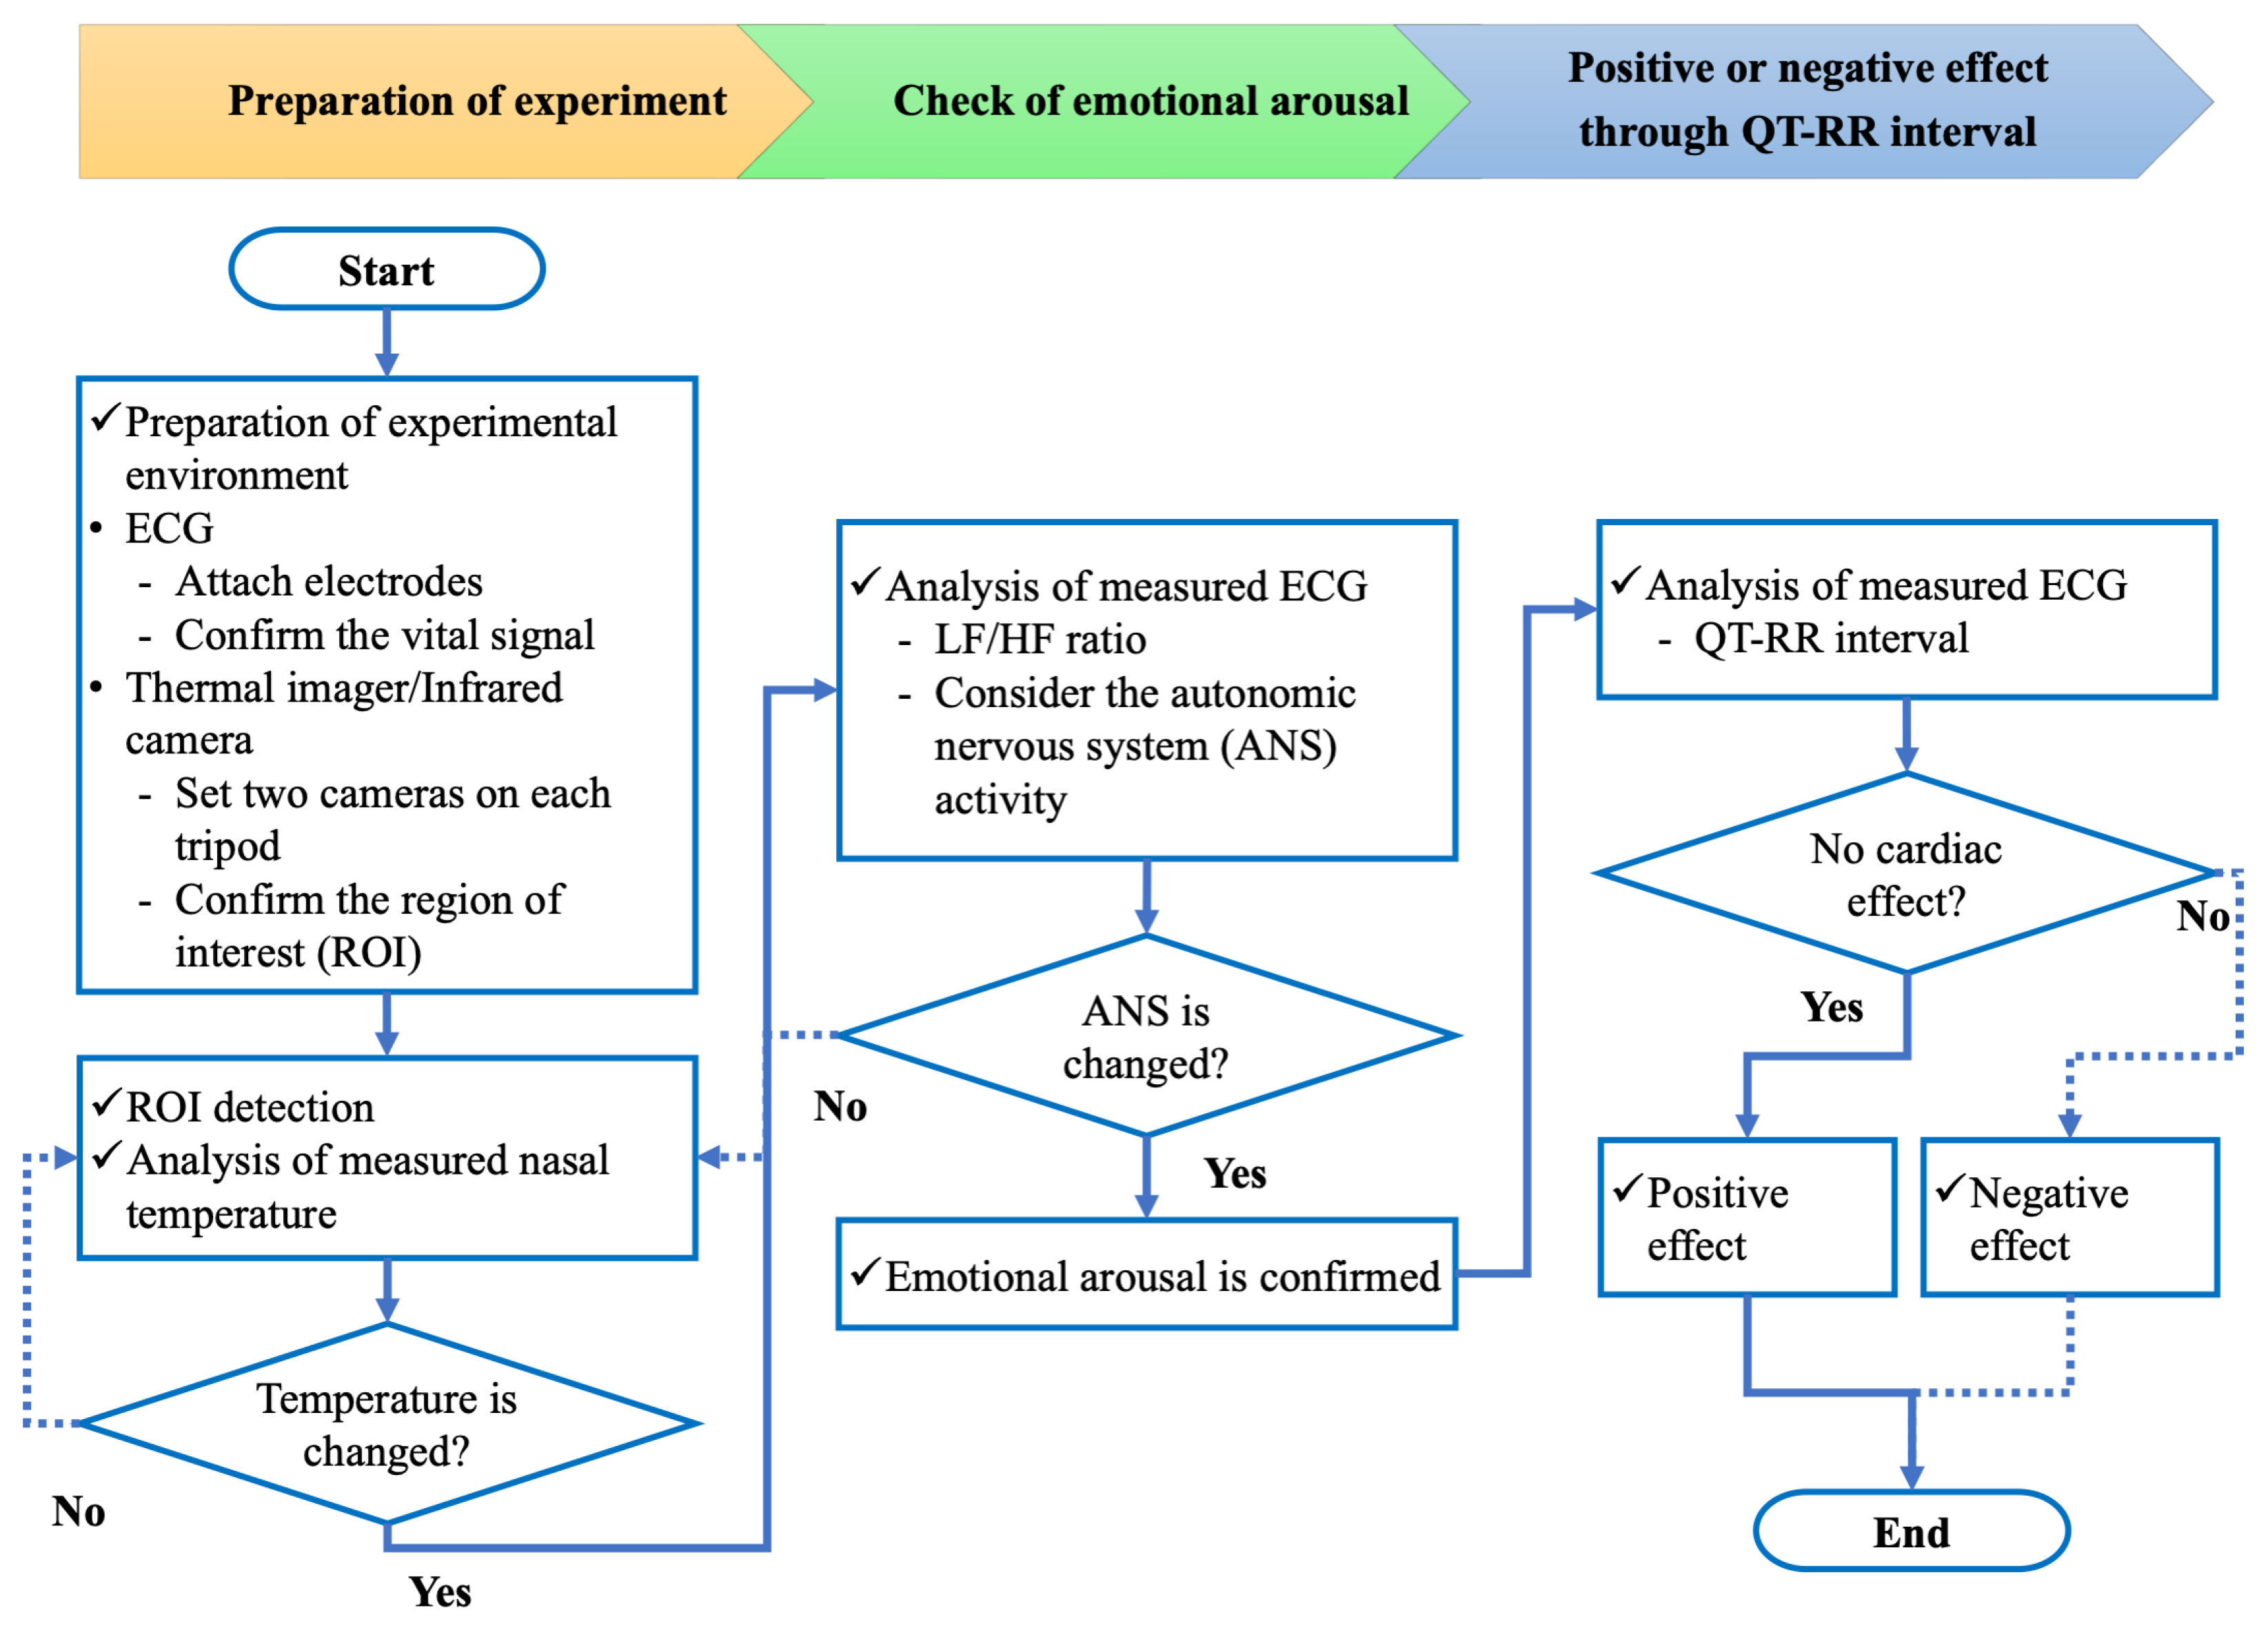
3.2. Flowchart
Figure 3 shows a flowchart to verify whether the effect of multi-sensory environment (MSE) interventions on disabled patients is positive or negative. The procedure is divided into three parts: preparation of the experiment, check of emotional arousal based on autonomic nervous system (ANS) activity, and verification of positive or negative effects through ECG. The experimental environment and systems utilized are described in the previous subsection.
First, it is necessary to measure the ANS activity through a non-invasive and contactless method. The thermal imager is a non-invasive, contactless method that reflects ANS activity. The change in nasal temperature is double-checked with the LF/HF ratio results. When the change of nasal temperature and LF/HF ratio is found simultaneously, it is possible to say that the emotional arousal comes from the MSE stimulus. However, when there is no LF/HF ratio change, it is not easy to say that emotional arousal comes from the MSE.
Next, it is necessary to verify whether the effect of MSE stimulus on disabled patients is positive or negative. It is known that MSE interventions indicate some event that stimulates sensory organs to achieve positive psychological stimuli. However, people are still determining if this kind of event supporting the convalescent phase is always helpful for increasing positive psychological stimuli. This study examined whether sudden MSE stimuli may increase a heart attack risk. Thus, the relationship between QT and RR intervals is used for checking the direct cardiac effect.
3.3. Continuous Non-Invasive Measurement of Nasal Temperature
Many studies have reported that thermal images indicate decreasing facial temperature during unpleasant stimulation and increasing temperature during rest. However, there has yet to be a study with continuous measurement. Thus, we propose continuous non-invasive measurement of nasal temperature with thermal imaging in this study.
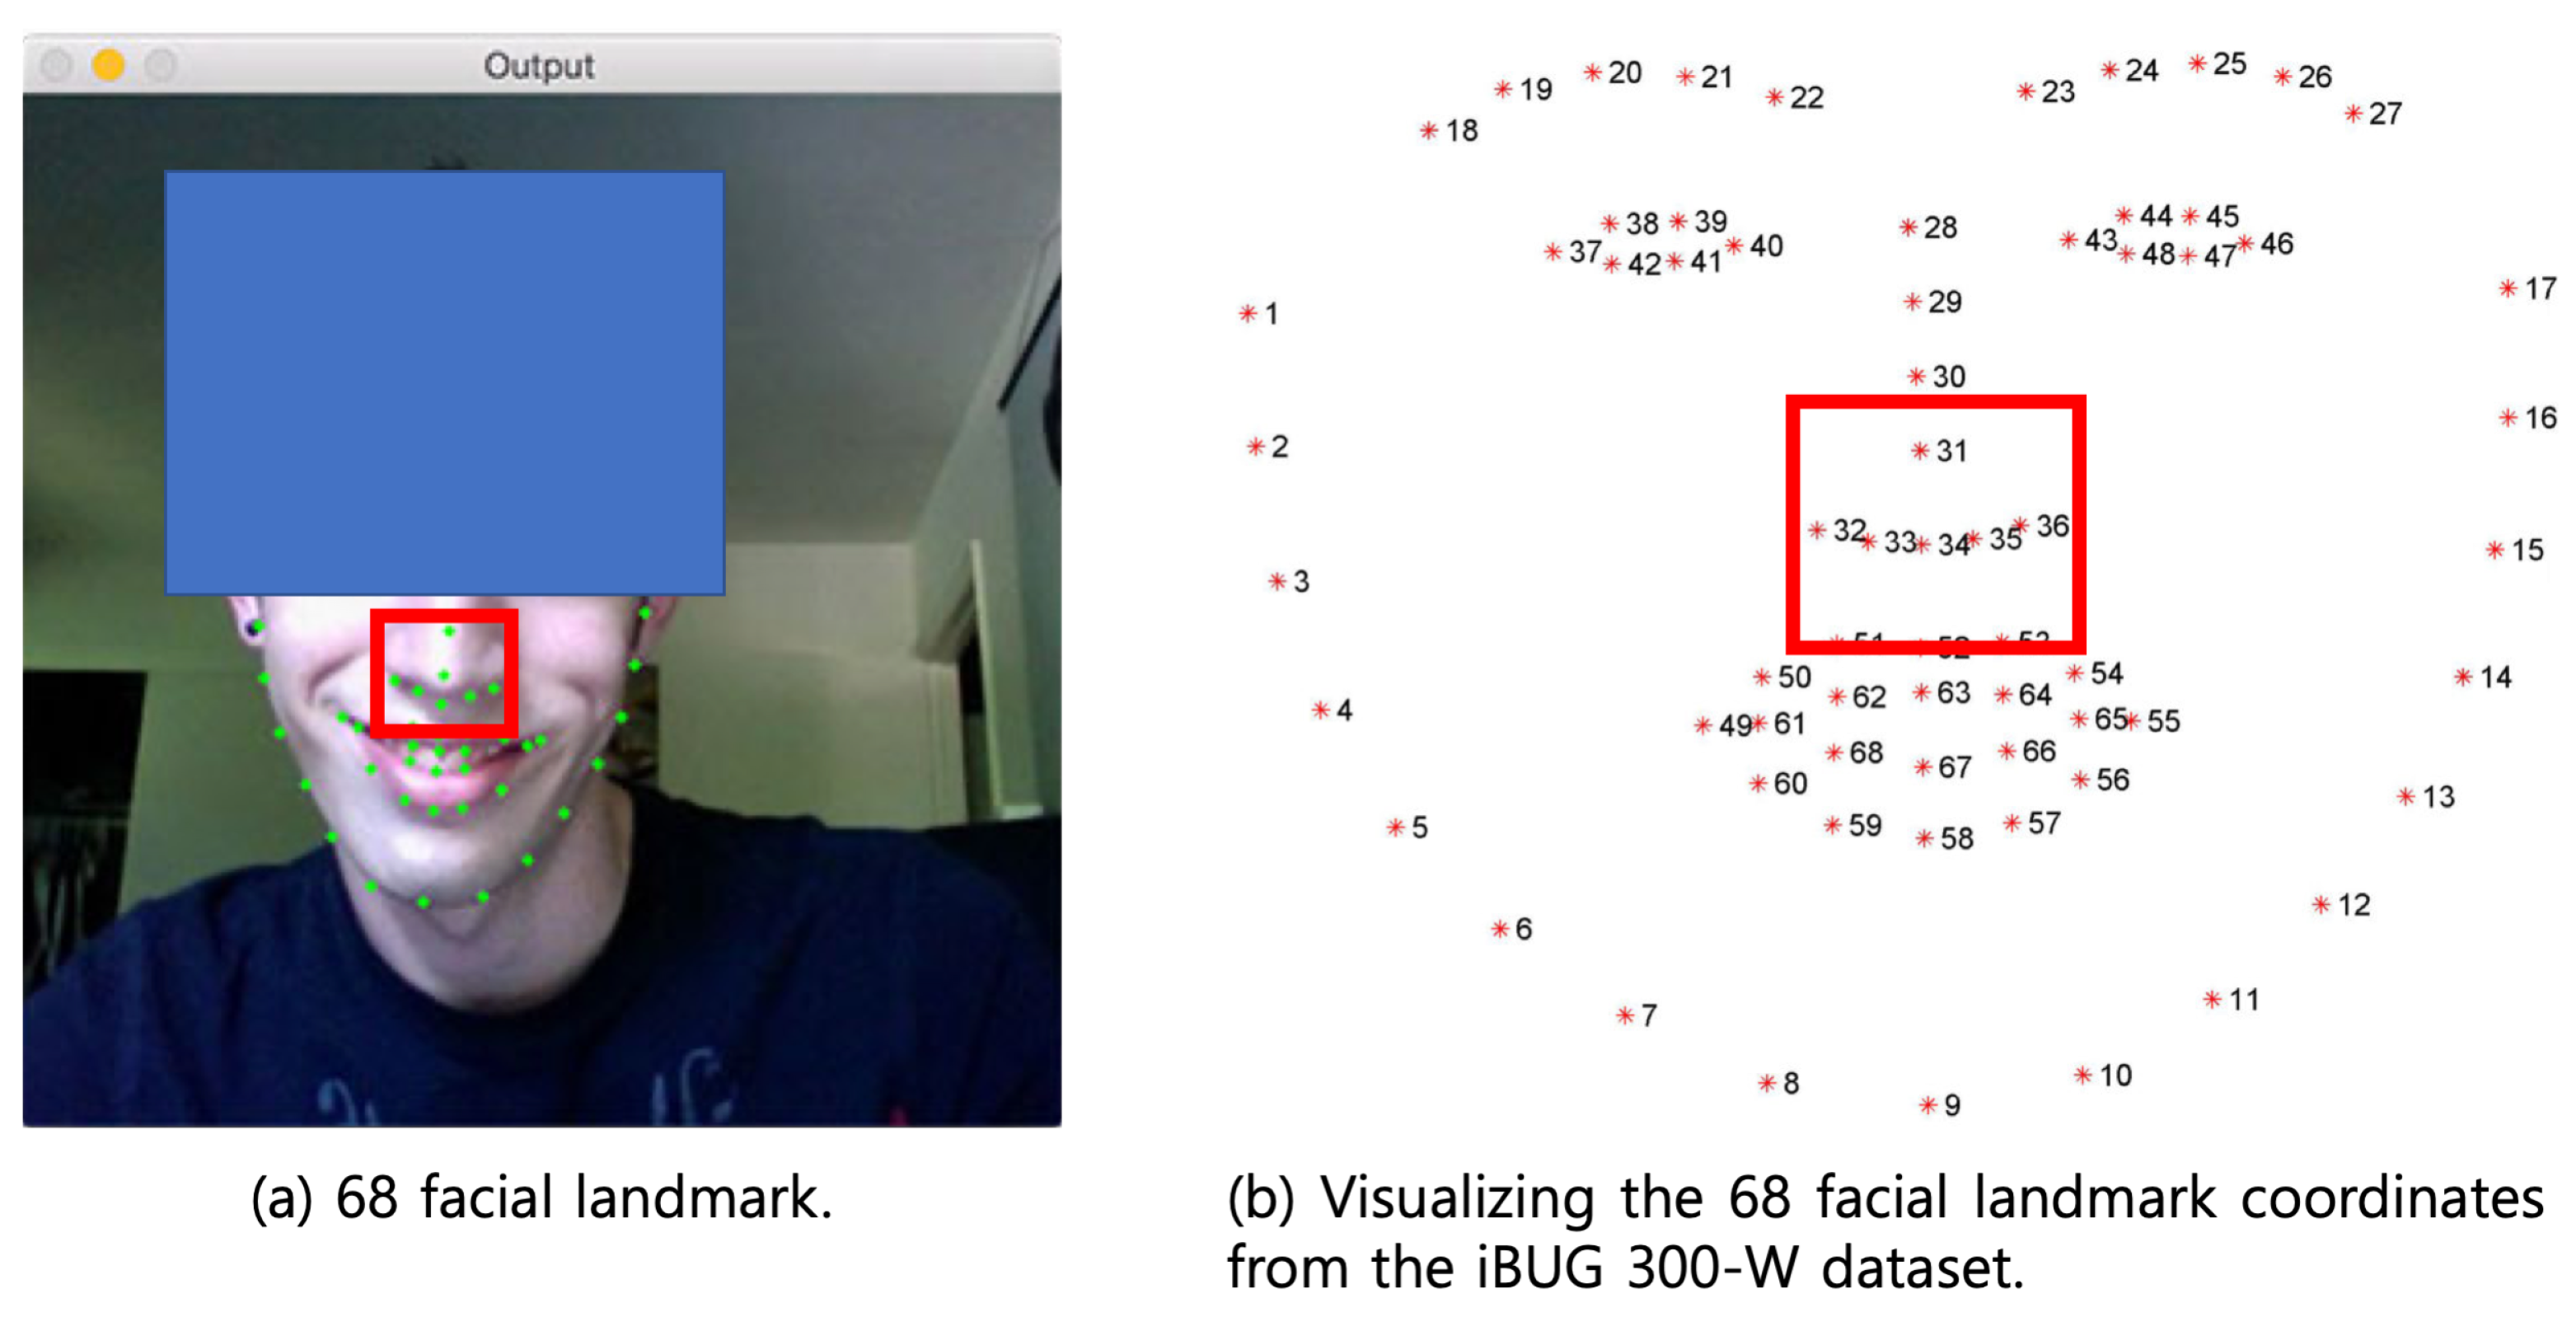
Detecting facial landmarks is a subset of the shape prediction problem. Given an input image (and usually a region of interest (ROI) that specifies the object of interest), a shape predictor attempts to localize critical points of interest along the shape. In the context of facial landmarks, our goal is to detect critical facial structures on the face using shape prediction methods. Detecting facial landmarks is, therefore, a two-step process: Step 1: Localize the face in the image, Step 2: Detect the key facial structures on the ROI.
Face detection (Step 1) can be achieved in many ways. We could use OpenCV’s built-in Haar cascades [
19]. We might apply a pre-trained HOG + Linear SVM object detector specifically for face detection. Alternatively, we could use deep learning-based algorithms for face localization. In any case, the actual algorithm used to detect the face in the image does not matter. What is essential is that we obtain the face bounding box (i.e., the (x, y)-coordinates of the face in the image) through some method.
Figure 4a shows an example of 68 facial landmarks where the Haar cascade performs facial detection.
Given the face region, we can then apply Step 2: detecting fundamental facial structures in the face region. There are a variety of facial landmark detectors. All methods try to localize and label the following facial regions: mouth, right eyebrow, left eyebrow, right eye, left eye, nose, and jaw. The facial landmark detector included in the dlib library implements the One Millisecond Face Alignment with an Ensemble of Regression Trees [
20]. Given these training data, an ensemble of regression trees is trained to estimate the facial landmark positions directly from the pixel intensities (i.e., no “feature extraction” is taking place). The result is a facial landmark detector that can detect facial landmarks in real time with high-quality predictions.
Figure 4b shows the visualization of the 68 facial landmark coordinates from the iBUG 300-W dataset. The nose as ROI was chosen at the two points of 34 and 36, which are related to the width × height of the square.
3.4. QT-RR Relation
This medical procedure’s plot of voltage versus time is from electrocardiography (ECG), as shown in
Figure 5. ECG records the heart’s electrical activity over time using electrodes placed on the skin. These electrodes detect tiny electrical changes on the skin that arise from the heart muscle’s electrophysiologic pattern of depolarizing and re-polarizing during each heartbeat. The p wave is the atrial systole contraction pulse, the Q wave is a downward deflection immediately preceding the ventricular contraction, the R wave is the peak of the ventricular contraction, the S wave is the low deflection immediately after the ventricular contraction, and the T wave is the recovery of the ventricles.
Here, RR intervals reveal information about sinus node activity with sufficient accuracy, as the spontaneous fluctuations of the PR interval are mostly lower than 2∼4 ms. Excluding arrhythmic events and artifacts from the RR interval time series, we obtain the normal-to-normal-time series representing sinus node activity. The RR interval time series plotted over time or beats are called tachograms. The term RR denotes beat-to-beat intervals resulting from the normal SA-node depolarization. If we assume that the ECG recording includes
heartbeats, then the RR interval series has
N data points [
21,
22,
23],
On the other hand, the length of the QT interval is an important indicator of the heart’s electrical stability. As the depolarization process reflected by the QRS complex is relatively stable, the QT interval is clinically used to measure the prolongation or shortening of the ventricular re-polarization process. QT is typically measured over 5-min intervals under quasi-stationary conditions. Ventricular regularization is inversely related to RR intervals; for example, the QT interval is shortened as the RR interval decreases. Consequently, an evaluation of QT interval changes must always accommodate the underlying changes in the RR interval. The QT interval series also has
N data points [
24,
25,
26,
27,
28],
By using Equations (
1) and (
2), it is possible to calculate the relation between RR and QT intervals (QT-RR relation).
Although the measurement of RR and QT intervals enables us to recognize the physical movement condition of the heart, there are some limitations to recognizing the influence of autonomic function on the heart. Autonomic tone influences the RR interval and the heart rate-corrected QT interval. QT and RR improve the characterization of sympathovagal control and estimation of the risk of primary cardiac arrest. Since a study reported that the risk of prior cardiac arrest (odds ratio [95% CI]) was 0.95 [0.73–1.23] at low RR and QT, 1.23 [0.97–1.57] at high RR and QT, and 1.55 [1.16–2.06] at low RR and high QT, autonomic dysfunction is associated with an increased risk of primary cardiac arrest among persons without clinically recognized heart disease. Thus, in this study, the risk evaluation is performed on the physical condition of the heart as well as the autonomic function at the same time.
4. Risk Analysis
4.1. Standard QT-RR Curve
In this study, the method by Karjalainen et al. [
24] was regarded as the standard curve to establish the relation between QT intervals and a wide range of resting heart rates. Although previously there were three different equations (the Bazett formula, which was the most often used; the Fridericia cubic root formula, which ranked best in the evaluation of 10 QT prediction formulas in the study of Puddu et al.; and the linear regression formula from the Framingham Study, which is the most recent one), the adopted curve of QT-RR relation permits a wide range of heart rates with 324 healthy young men. This curve is then compared with three previous adjustment equations and double-checked by a different aged group with a high risk for coronary heart disease. Thus, there is no problem regarding the adopted curve as the standard curve for accuracy and reliability. Equations for the regression line are as follows:
where the unit for the RR interval is milliseconds.
As a result, it is possible to observe the physical movement condition of the heart by Equations (
1) and (
2) as well as evaluate the autonomic function by Equation (
3).
4.2. Risk Assessment
When we regard Equation (
3) as the standard, it is possible to evaluate the risk assessment of heart disease with the shortest distance from a fixed point to any point on a fixed infinite line in Euclidean geometry. Here, the fixed issue indicates the mean value of the measured QT-RR relation through Equations (
1) and (
2). The line shows the standard of QT-RR relation through Equation (
3). In the case of a line in the plane given by the equation
, where
a,
b, and
c are real constants with
a and
b not both zero, the distance from the line to a point (
) is [
29]
In this study, it is considered that the long distance of
d represents the higher risk, and the shorter distance represents the lower risk for SCD under the heart condition. A long distance indicates a big difference between a healthy group and a disabled patient, whereas a short distance indicates significant similarity between a healthy group and a patient. Constants in Equation (
4) are decided by the RR interval, as shown in Equation (
3).
5. Results
5.1. Results of Continuous Emotion Arousal
Experimental results, including thermal images, nasal temperature, and emotional arousal, are shown in
Figure 6 (top). The thermal images showed facial temperature distribution at different stages of the experiment. It was observed that before stimulation began, the nose color turned to dark blue for all patients; in other words, the temperature around the nose decreased. The decreased nasal temperature came from the tension of patients with several strangers and an experimental system in the hospital. Then, the average nose temperature stopped increasing for the next 10 min. This phenomenon can be observed from the line chart in
Figure 6 (middle). The line dropped at the time point labeled as “standby,” which means the start of MSE interventions. After that, the temperature of the nose area kept seesawing until the end of the experiment.
The line chart in
Figure 6 (bottom) shows the change of LF/HF. A higher value demonstrates emotional arousal; a lower amplitude of LF/HF shows the relaxation and peaceful states. It was observed that after MSE interventions began, LF/HF increased dramatically. Namely, patients underwent emotional arousal when they were receiving MSE interventions. Similar results were found in [
30]; decreased nose temperature indicated emotional arousal. Thus it was speculated that, with the stimulation, patients’ emotional arousal took place. Beyond nonverbal and verbal description, this emotional information could be constantly measured by an infrared thermometer from nasal temperature.
As a result, it was found that the proposed method could provide a non-invasive approach for evaluating patients’ emotional arousal during MSE interventions by measuring the continuous nasal temperature through thermal images.
5.2. Results of Electrocardiography
5.2.1. Results of Relation between RR-Interval and QT-Interval
Figure 7 shows the results of total measured ECG for eight disabled patients: (a)∼(d) represent the results for four patients with MD; (e)∼(h) represent those for four patients with SMID. Time series data of ECG were used to construct these plots. All the accumulated 15 min ECG data, including Phases 1 and 2, can be seen with these plots. In addition, these plots enabled us to understand what kinds of ECG data were measured for evaluation and how the patients’ heart conditions changed before and during MSE interventions. Patients 1∼4 with MD had a clear R wave. The P wave for patient 2 was unclear, whereas those for patients 1, 3, and 4 were clear. The Q wave for patients 2 and 3 was not observed compared with patients 1 and 4. It was confirmed that the R wave for patient 2 had some fluctuation. Patients 5∼8 with SMID did not have a clear R wave. Moreover, the R wave for patient 8 had severe random fluctuations. Therefore, the P, Q, and T waves for all patients needed to be clarified. Accordingly, compared with the MD patients, those with SMID showed abnormal fluctuation for PQRST waves in the ECG. However, there was no significant difference between Phases 1 and 2. The irregular PQRST waves resulted in abnormal physical heart movement. Remarkably, the R wave represents the electrical stimulus as it passes through the central portion of the ventricular walls. Because the walls of the ventricles are very thick due to the amount of work they have to do, more voltage is required. That is why the R wave is the most significant wave generated during normal conduction.
5.2.2. Results of Risk Assessment
Figure 8 shows the result of the relation between RR-interval and QT-interval for 20 patients: blue-colored points represent the group of MD, and red-colored points represent that of SMID. Although there was no significant difference in RR-interval between the two different groups except for patient no. 2, it was considered that there was a substantial difference in QT-interval.
Figure 8 shows all patients’ QT-RR relation and risk assessment results. The green line indicates the standard under the heart condition for healthy young subjects, as shown in Equation (
3). Two different color data points for each plot indicate measured results of the QT-RR relation for each patient.
The risk assessment for SCD was evaluated by Equation (
4). Although the risk for nine patients with 1∼9 with MD, as shown in
Figure 8, showed relatively lower values (1∼37), that for one patient with MD and the ten patients with SMID showed somewhat higher values (112∼186). Although the difference between the measured QT-RR relation and the standard was easy enough to recognize without computation of distance for risk degree, the proposed method enabled us to evaluate the risk assessment with the quantitative measurement. We would like to emphasize that the proposed method is helpful for the medical criterion after enough disabled patients are examined in the future.
As a result, it was found that the risk for ten patients with SMID and patient 2 with MD was an average of 17 times higher than that for the other nine patients with MD. It was considered that the cause of higher risk for the ten patients with SMID came from the 0.645 times shorter mean of QT interval and the 2.930 times larger SD of RR interval than that for the other nine subjects with MD in this study.
6. Discussion
6.1. Positive and Negative Impacts of Multi-Sensory Environment Interventions on Psychological State
Figure 6 shows the results of nasal temperature by thermal image and LF/HF ratio by ECG during MSE interventions. Through the gradually decreasing RR intervals (increasing LF/HF ratio) for 3 min, a patient seemed nervous because strange persons who were the research team members were with them during MSE in the same experimental room. Then, it appeared that the patients enjoyed the virtual aquarium because the RR interval was gradually increasing, which meant the heart rate (HR) increased (decreasing LF/HF ratio). The decreased RR interval indicated the strong activation of the sympathetic nerve, and the increase showed the strong activation of the parasympathetic nerve. Thus, these results resulted in the relation between the MSE intervention and autonomous nervous system (ANS) activity [
31].
Furthermore, it confirmed that the skin temperature depended on the ANS activity. However, there was little linear relation in this study. Therefore, the thermal image was proposed as a potential system for the computational assessment of human autonomic nervous activity and psychophysiological states in a contactless and non-invasive way. Regions of interest (ROIs) are used to extract information from the practical environment. ROIs for this study used the nose and nose tip. The regions on which most observations were based were the nose or nose tip and the periorbital and supraorbital vessels of the face, usually associated with the corrugator muscle. According to the patient’s response to the emotional stimulus and the ROI, temperature elevated or decreased [
32,
33,
34,
35].
As a result, it was found that there was a positive impact of MSE interventions on the psychological state through the measurement of ANS activity and skin temperature. Although this result was consistent with the findings of conventional studies, it was impossible to perceive the body’s burden according to the emotional stress changed by the psychological state. As the authors noted in the introduction, there might be a risk of SCD, which could occur in the case of over-stimulation. It should be noted that environmental interventions should be implemented with careful consideration of participants’ individual preferences and sensitivities so as not to induce BPS through unintended over-stimulation [
5]. That was the reason why the QT-RR relation was applied to this study.
6.2. Possibility of Drug-Induced Short QT Syndrome
Table 1 shows the list of prescribed medications that all patients should take regularly. Patients with MD tend to commonly take the drugs to relieve constipation. Those patients with SMID tend to take anti-epileptic and anti-psychotic drugs, mainly for constipation. The arrhythmogenic potential of short QT intervals has recently been highlighted in patients with a short QT syndrome (SQTS) [
8,
36]. Drug-induced QT-interval prolongation is a well-known risk factor for ventricular tachyarrhythmias. However, reports on drug-induced QT-interval shortening are rare, and pro-arrhythmic effects remain unclear because SQTS is an inheritable primary electrical disease of the heart that was discovered in 1999. This disorder is characterized by an abnormally short QT interval (<300 ms) and a propensity to atrial fibrillation, SCD, or both.
Thus, the short QT interval has emerged as a new clinical entity and a risk factor for sudden cardiac death similar to the prolonged QT interval. Whenever it is encountered as a primary abnormality, the possibility of SQTS should be suspected. The QT interval for heart rate can conceal a persistently short QT interval. For example, suppose the QT interval of 300 ms is encountered on ECG with the HR at 85 beats/min. In that case, the corrected QT interval is 357 ms and thus above the lower limit of normal, as shown in
Figure 5b. This result means that a patient with SQTS will only have short QT intervals (<350 ms) at an HR lower than 85 beats/min. At an HR higher than that value, a patient with SQTS will have a standard QT, as shown in Equation (
3). Risk assessment and treatment of this new syndrome are still not fully established [
37]. Although it is considered that atrial fibrillation responds to propafenone and an implantable cardioverter defibrillator offers the best protection against SCD, it does not look easy to respond to this recommendation as soon as possible at the current clinical site.
As a result, it was confirmed that all patients with SMID in this study revealed SQTS, which indicated the high-risk possibility of SCD. However, it was only possible to clarify whether their SQTS was drug-induced or hereditary. Because the risk assessment and treatment are not still established [
38], it is considered that it is best for caregivers to be well-informed of prior notice for the risk group in order to deal with an emergency [
37].
7. Conclusions
Although most studies have focused on the only positive impact of MSE interventions on patients with disabilities, the experimental results here showed that there could be harmful effects of MSE interventions on patients according to the level and categorization of disabilities. The measured results of facial skin temperature and RR interval through the autonomous nervous system activity usually showed the positive impact of MSE interventions on disabled patients. However, the proposed method through the QT-RR relation enabled us to recognize who needed to be observed to prevent medical accidents. Furthermore, it was found that all patients with SMID had SQTS, which represented a high risk of SCD, although it was not possible to clarify the reason. Thus, it is recommended that caregivers are well-informed of prior notice for the risk group because the risk assessment and treatment for SQTS are not still fully established in this research field.
The authors would like to continue to experiment to increase the number of human subjects while considering the possibility of drug-induced short QT syndrome in the future.
Supplementary Materials
For 3 min, patients were waiting for the start. Then, the stimulation of multi-sensory environment interventions began. The link (
https://youtu.be/ziCjG6Q8VmY (accessed on 16 November 2021)) is related to the patients with SMID. The link (
https://youtu.be/DYQXnbuO2j8 (accessed on 16 November 2021)) is related to the patients with MD.
Author Contributions
Conceptualization, methodology, writing—original draft, H.J.; data curation, H.J. and Y.O.; formal analysis, investigation, H.J.; project administration, supervision, Y.O.; software, H.J.; visualization, H.J.; writing—review and editing, H.J and Y.O. All authors have read and agreed to the published version of the manuscript.
Funding
This research was funded by the Basic Science Research Program through the National Research Foundation (NRF) of Korea grant, funded by the Ministry of Education (NRF-2021R1I1A3055210), and by the Korea Institute of Marine Science & Technology Promotion (KIMST) funded by the Ministry of Oceans and Fisheries, Korea (20220596, Development of Digital Flow-through Aquaculture System).
Institutional Review Board Statement
The study was conducted according to the guidelines of the Declaration of Helsinki and approved by the Institutional Review Board (or Ethics Committee) of Applied Sciences (ISSN 2076-3417; CODEN: ASPCC7), which is an international, peer-reviewed, open access journal on all aspects of applied natural sciences published semimonthly online by MDPI.
Informed Consent Statement
Informed consent was obtained from all subjects involved in the study.
Acknowledgments
The authors would like to thank the BK21 Plus program at Chonnam National University through the National Research Foundation, funded by the Ministry of Education of Korea. The authors also would like to express our deepest gratitude for the social contribution activities with the virtual aquarium as one kind of MSE of EPSON Japan Corp. The authors wish to thank Nara Medical Center in Japan, which helped us find this avenue of research to begin. They also greatly assisted in developing this particular experiment and preparing this manuscript. During his year in Osaka, Hieyong Jeong benefited greatly from discussions at National Hospital Organization Nara Medical Center in Japan. He would like to thank the members who participated in the experiments for commenting on his work. Primarily, he is grateful for the support of the Director of the hospital, Tooru Hoshida (2017); the head of the nursing, Chigusa Hongo (2017); and the head of the SMID and MD ward, Hiroko Nagao (2017). They ensured the participation of patients in our study. Finally, the authors would like to thank four students, Tiyani Wang, Takafumi Ohno, Hideto Imai, and Yutaka Matsuura, Osaka University, for their support and devotion.
Conflicts of Interest
The authors declare no conflict of interest.
References
- van Weert, J.C.M.; Kerkstra, A.; van Dulmen, A.M.; Bensing, J.M.; Peter, J.G.; Ribbe, M.W. The implementation of snoezelen in psychogeriatric care: An evaluation through the eyes of caregivers. Int. J. Nurs. Stud. 2004, 41, 397–409. [Google Scholar] [CrossRef] [PubMed] [Green Version]
- Maseda, A.; Sa´nchez, A.; Marante, M.P.; Gonza´lez-Abraldes, I.; Buja´n, A.; Milla´n-Calenti, J.C. Effects of Multisensory Stimulation on a Sample of Institutionalized Elderly People With Dementia Diagnosis: A Controlled Longitudinal Trial. Am. J. Alzheimer’s Dis. Other Dementias 2014, 29, 463–473. [Google Scholar] [CrossRef] [PubMed] [Green Version]
- Maseda, A.; Sa´nchez, A.; Marante, M.P.; Gonza´lez-Abraldes, I.; de Labra, C.; Milla´n-Calenti, J.C. Multisensory stimulation on mood, behavior, and biomedical parameters in people with dementia: Is it more effective than conventional one-to-one stimulation? Am. J. Alzheimer’s Dis. Other Dementias 2014, 29, 637–647. [Google Scholar] [CrossRef] [PubMed] [Green Version]
- Baillon, S.; van Diepen, E.; Prettyman, R.; Rooke, N.; Redman, J.; Campbell, R. Variability in Response of Older People with Dementia to Both Snoezelen and Reminiscence. Br. J. Occup. Ther. 2005, 68, 367–374. [Google Scholar] [CrossRef] [Green Version]
- Riley-Doucet, C.K.; Dunn, K.S. Using multisensory technology to create a therapeutic environment for people with dementia in an adult day center: A pilot study. Res. Gerontol. Nurs. 2013, 6, 225–233. [Google Scholar] [CrossRef]
- Douglas, P.Z.; Hein, J.J.W. Sudden Cardiac Death. Circulation 1998, 98, 2334–2351. [Google Scholar] [CrossRef]
- Reddy, K.S.; Yusuf, S. Emerging epidemic of cardiovascular disease in developing countries. Circulation 1998, 97, 596–601. [Google Scholar] [CrossRef]
- Melissa, H.K.; Gregg, C.F.; Eric, D.P.; Anne, B.C.; Adrian, F.H.; Gillian, D.S.; Kevin, L.T.; David, L.H.; Sana, M.A. Systematic Review of the Incidence of Sudden Cardiac Death in the United States. J. Am. Coll. Cardiol. 2011, 57, 794–801. [Google Scholar] [CrossRef] [Green Version]
- Solberg, E.E.; Borjesson, M.; Sharma, S.; Papadakis, M.; Wilhelm, M.; Drezner, J.A.; Harmon, K.G.; Alonso, J.M.; Heidbuchel, H.; Dugmore, D.; et al. Sport Cardiology Section of the EACPR of the ESC. Sudden cardiac arrest in sports-need for uniform registration: A Position Paper from the Sport Cardiology Section of the European Association for Cardiovascular Prevention and Rehabilitation. Eur. J. Prev. Cardiol. 2016, 23, 657–667. [Google Scholar] [CrossRef]
- Becker, L.; Eisenberg, M.; Fahrenbruch, C.; Cobb, L. Public locations of cardiac arrest: Implications for public access defibrillators. Circulation 1998, 97, 2106–2109. [Google Scholar] [CrossRef]
- Laurent, S.; Genevie´ve, A. Muscular Dystrophy. N. Engl. J. Med. 2014, 371, e35. [Google Scholar] [CrossRef] [Green Version]
- Rupam, S.; Soumyabrata, S.; Tanya, K.; Soumyajit, D. Duchenne muscular dystrophy: Case report and review. J. Fam. Med. Prim. Care 2017, 6, 654–656. [Google Scholar] [CrossRef]
- Zhang, H.; Zhang, B.; Jia, F.; Liang, D.; Li, H.; Chen, Y.; Yang, L.; Ge, P.; Liang, J. The effects of motor and intellectual functions on the effectiveness of comprehensive rehabilitation in young children with cerebral palsy. J. Int. Med. Res. 2014, 43, 125–138. [Google Scholar] [CrossRef] [Green Version]
- Morris, C. Definition and classification of cerebral palsy: A historical perspective. Dev. Med. Child Neurol. 2007, 109, 3–7. [Google Scholar] [CrossRef]
- National Hospital Organization Nara Medical Center in Japan. Available online: http://www.nho-nara.jp/ (accessed on 16 November 2021).
- Seiko Epson Corp./ Epson Sales Japan Corp., Fantas Projection. Available online: https://www.epson.jp/SR/citizenship/dream_aquarium/fantas_projection/ (accessed on 16 November 2021).
- ADInstruments, PowerLab. Available online: https://www.adinstruments.com/products/powerlab (accessed on 16 November 2021).
- ADInstruments, Electrocardiography (ECG/ECK). Available online: https://www.adinstruments.com/research/human/autonomic/electrocardiography-ecgekg (accessed on 16 November 2021).
- Viola, P.; Jones, M. Rapid Object Detection using a Boosted Cascade of Simple Features. In Proceedings of the 2001 IEEE Computer Society Conference on Computer Vision and Pattern Recognition, CVPR 2001, Kauai, HI, USA, 8–14 December 2001; pp. 1–9. [Google Scholar] [CrossRef]
- Sagonas, C.; Antonakos, E.; Tzimiropoulos, G.; Zafeiriou, S.; Pantic, M. 300 faces In-the-wild challenge: Database and results. Image Vis. Comput. (IMAVIS) 2016, 47, 3–18. [Google Scholar] [CrossRef] [Green Version]
- Pan, J.; Tompkins, W.J.A. Real-time QRS detection algorithm. IEEE Trans. Biomed. Eng. 1985, 32, 230–236. [Google Scholar] [CrossRef]
- Tarvainen, M.P.; Niskanen, J.P.; Lipponen, J.A.; Ranta-aho, P.O.; Karjalainen, P.A. Kubios HRV-Heart rate variability analysis software. Comput. Methods Programs Biomed. 2014, 113, 210–220. [Google Scholar] [CrossRef]
- Barbieri, R.; Brown, E.N. Application of dynamic point process models to cardiovascular control. BioSystems 2008, 93, 120–125. [Google Scholar] [CrossRef] [Green Version]
- Karjalainen, J.; Viitasalo, M.; Manttari, M.; Manninen, V. Relation Between QT Intervals and Heart Rates From 40 to 120 beats/min in Rest Electrocardiograms of Men and a Simple Method to Adjust QT Interval Values. JACC 1994, 23, 1547–1553. [Google Scholar] [CrossRef]
- Sacre, J.W.; Franjic, B.; Coombes, J.S.; Marwick, T.H.; Baumert, M. QT interval variability in type 2 diabetic patients with cardiac sympathetic dysinnervation assessed by 123I-metaiodobenzylguanidine scintigraphy. J. Cardiovasc. Electrophysiol. 2013, 24, 305–313. [Google Scholar] [CrossRef]
- Whitsel, E.A.; Raghunathan, T.E.; Pearce, R.M.; Lin, D.; Rautaharju, P.M.; Lemaitre, R.; Siscovick, D.S. RR interval variation, the QT interval index and risk of primary cardiac arrest among patients without clinically recognized heart disease. Eur. Heart J. 2001, 22, 165–173. [Google Scholar] [CrossRef] [PubMed] [Green Version]
- Bazett, H.C. An analysis of the time-relations of electrocardiograms. Ann. Noninvasive Electrocardiol. 1997, 2, 177–194. [Google Scholar] [CrossRef]
- Fridericia, L.S. The Duration of Systole in an Electrocardiogram in Normal Humans and in Patients with Heart Disease. Ann. Noninvasive Electrocardiol. 2003, 8, 343–351. [Google Scholar] [CrossRef] [PubMed]
- Deza, M.M.; Deza, E. Chapter 4 Metric Transform. In Encyclopedia of Distances, 2nd ed.; Springer: Berlin, Germany, 2013; pp. 79–87. [Google Scholar] [CrossRef]
- Kosonogov, V.; De Zorzi, L.; Honore, J.; Martinez-Velazquez, E.S.; Nandrino, J.L.; Martinez-Selva, J.M.; Sequeira, H. Facial thermal variations: A new marker of emotional arousal. PLoS ONE 2017, 12, e0183592. [Google Scholar] [CrossRef]
- Kreibig, S.D. Autonomic nervous system activity in emotion: A review. Biol. Psychol. 2010, 84, 394–421. [Google Scholar] [CrossRef]
- Ioannou, S.; Gallese, V.; Merla, A. Thermal infrared imaging in psychophysiology: Potentialities and limits. Psychophysiology 2014, 51, 951–963. [Google Scholar] [CrossRef] [Green Version]
- Matsuura, Y.; Jeong, H.; Yamada, K.; Watabe, K.; Yoshimoto, K.; Ohno, Y. Screening Sleep Disordered Breathing with Noncontact Measurement in a Clinical Site. J. Robot. Mechatron. 2017, 29, 327–337. [Google Scholar] [CrossRef]
- Jeong, H.; Ohno, Y. Cordless monitoring system for respiratory and heart rates in bed by using large-scale pressure sensor sheet. Smart Health 2018, 13, 100057. [Google Scholar] [CrossRef]
- Jeong, H.; Matsuura, Y.; Ohno, Y. Measurement of Respiration Rate and Depth Through Difference in Temperature Between Skin Surface and Nostril by Using Thermal Image. In Studies in Health Technology and Informatics; IOS Press: Amsterdam, The Netherlands, 2017; Volume 245, pp. 417–421. [Google Scholar] [CrossRef]
- Shah, R.R. Drug-induced QT interval shortening: Potential harbinger of proarrhythmia and regulatory perspectives. Br. J. Pharmacol. 2010, 159, 58–69. [Google Scholar] [CrossRef] [Green Version]
- Bjerregaard, P.; Gussak, I. Short QT syndrome: Mechanisms, diagnosis and treatment. Nat. Clin. Pract. 2005, 2, 84–87. [Google Scholar] [CrossRef]
- Wang, T.; Jeong, H.; Watanabe, M.; Iwatani, Y.; Ohno, Y. Fault classification with discriminant analysis during sit-to-stand movement assisted by a nursing care robot. Mech. Syst. Signal Process. 2018, 113, 90–101. [Google Scholar] [CrossRef]
| Publisher’s Note: MDPI stays neutral with regard to jurisdictional claims in published maps and institutional affiliations. |
© 2022 by the authors. Licensee MDPI, Basel, Switzerland. This article is an open access article distributed under the terms and conditions of the Creative Commons Attribution (CC BY) license (https://creativecommons.org/licenses/by/4.0/).


