Article

Gated Multi-Attention Feedback Network for Medical Image Super-Resolution

1
School of Electrical and Electronic Engineering, Shandong University of Technology, Zibo 255000, China
2
School of Electronic Engineering and Computer Science, Queen Mary University of London, London E1 4NS, UK
*
Author to whom correspondence should be addressed.
Electronics 2022, 11(21), 3554; https://doi.org/10.3390/electronics11213554
Submission received: 27 September 2022 / Revised: 21 October 2022 / Accepted: 28 October 2022 / Published: 31 October 2022
(This article belongs to the Special Issue High-Performance Embedded Computing)

Abstract

:
Medical imaging technology plays a crucial role in the diagnosis and treatment of diseases. However, the captured medical images are often in a low resolution (LR) due to the limited imaging condition. Super-resolution (SR) technology is a feasible solution to enhance the resolution of a medical image without increasing the hardware cost. However, the existing SR methods often ignore high-frequency details, which results in blurred edges and an unsatisfying visual perception. In this paper, a gated multi-attention feedback network (GAMA) is proposed for medical image SR. Specifically, a gated multi-feedback network is employed as the backbone to extract hierarchical features. Meanwhile, a layer attention feature extraction (LAFE) module is introduced to refine the feature map. In addition, a channel-space attention reconstruction (CSAR) module is built to enhance the representational ability of the semantic feature map. Furthermore, a gradient variance loss is tailored as the regularization in guiding the model learning to regularize the model in generating a faithful high-resolution image with rich textures and sharp edges. The experiments verify the effectiveness of the proposed GAMA compared with the state-of-the-art approaches.

1. Introduction

High-resolution medical images can reflect the structural and functional features of the human body in a non-invasive manner with rich contrast and play a pivotal role in clinical diagnosis. However, due to the limitations of the hardware devices, medical images often have a limited resolution and are contaminated by inherent noise, resulting in a lack of detailed information. Image super-resolution (SR) technology is favored due to its advantages of security risk, great convenience, and high confidentiality.
The existing SR methods can be roughly divided into three categories, namely the interpolation-based methods, reconstruction-based methods, and CNN-based methods [1,2,3]. The interpolation-based approaches mainly employ interpolation strategies, e.g., nearest neighbor interpolation, bilinear interpolation, and bicubic interpolation, to predict the pixel values using their neighborhoods [4]. Although these methods are theoretically simple and easily executable, the high-frequency details of the image cannot be captured. The reconstruction-based methods aim to estimate the missing details with the assistance of several elaborate priors [5]. As the pioneering work, Gerchberg et al. [6] introduced the first iterative SR algorithm in the frequency domain based on Fourier transform to improve the resolution. The reconstruction-based methods perform well in preserving edges on the premise that a rational prior has been imposed. However, these methods still have their limitation to regularize the prior knowledge in the spatial domain. With the development of CNNs, the medical image SR has made considerable progress and gradually become a hot issue attracting much attention. Dong et al. [7] introduced a super-resolution convolutional network (SRCNN) in which the low-resolution input image is fed to the encoder–decoder network. Li et al. [8] proposed the SRFBN to refine the representation of low-level features through the feedback of high-level feature information. This work is the cornerstone of the feedback mechanism applied to image super-resolution. Li et al. [9] used multiple feedback connections for the transfer of multiple high-level features to the shallow layers so as to extract the contextual information.
Compared with the single natural image SR task, the sensitive texture and edge contour details are the principal features to be considered for retention in the medical image SR task [10,11]. The CNN-based approaches supervised by the L 1 / L 2 loss functions and their derivatives can achieve an outstanding performance in terms of the numerical criteria but fail to generate sufficient high-frequency details, e.g., fine textures and edges [12,13]. In addition, the existing CNN-based SR methods ignore the original features of the difference in and correlation of information, and all the feature information is generally processed in a unified manner. Moreover, the subsequent feature processing networks fail to preserve the detailed textures and restore the natural details.
To address these problems, we propose thegatedmulti-attention feedback network (GAMA) for medical image super-resolution. Specifically, we build a layer attention feature extraction (LAFE) module to enable the network to pay more attention to the information-rich feature channels and a channel-space attention reconstruction (CSAR) module to weight features from multiscale layers and pay attention to the channel dimension information and the scale information of features. Moreover, to preserve the details of medical images, we introduce the gradient variance loss to generate rich texture details and sharp edges. The comparative experiments illustrate that the proposed GAMA is superior to the state-of-the-art medical image SR approaches. In summary, the contributions of this work are as follows.
  • An LAFE module is designed to highlight the vital feature information while removing redundancy to refine the feature map.
  • A CSAR module that can facilitate an information exchange between different channel dimensions is built to enhance the representation of semantic feature maps.
  • A gradient variance loss is tailored to guide the model learning for the generation of images with rich texture details and sharp edges.
The remainder of this paper is organized as follows: Section 2 presents the related works on the feedback mechanism and attention mechanism, which are mostly related to the proposed GAMA. Section 3 introduces the framework and details of the proposed model. Section 4 verifies the effectiveness by comparative experiments. The conclusion is drawn in Section 5.

2. Related Work

In this section, the two most relevant works of the proposed model will be briefly reviewed, i.e., the feedback mechanism and attention mechanism.

2.1. Feedback Mechanism

The feedback mechanisms [14,15,16] enable the network to carry the concept of output to rectify prior states. To make the basic features more representative and informative, the feedback mechanisms [17,18,19,20,21,22] are often employed in deep networks to backward advanced information from deep to shallow layers. The most common type of feedback connection is the single-to-single connection, where the merely optimal features are allowed to be passed to a single shallow layer. The SRFBN [8] method is a typical single-to-single feedback approach in which superior information is offered in a top–down feedback flow. Chen et al. proposed the FAWDN [16] by adding adaptive weighted dense blocks to the SRFBN [8] to explore the advanced feature representations. Unlike the previous works, the GMFN [9] has been proposed to transfer refined features to the shallow layers, with the assumption that sufficient contextual information can be swallowed to refine the basic layers. The feature maps extracted at different layers are captured in different receptive fields, each of which contains complementary information for image reconstruction. Then, the feedback connection [9] is adopted to optimize the elementary information with the help of the advanced counterpart.

2.2. Attention Mechanism

The core idea of the attention mechanism is to re-adjust the weights of the features in various dimensions according to the importance of the input image [23,24]. Recently, it has been widely utilized in CNN-based SR methods. Zhang et al. [25] constructed a residual network, which built a channel attention (CA) block to improve the network performance. The CA block can adjust channel weights and drive the model to pay attention to the information-rich channels so as to boost the representational ability. To further improve the network performance, Woo et al. [26] built two different attention units, i.e., a channel attention (CA) unit and spatial attention (SA) units, which are connected in series. Kim et al. [27] built a residual attention fusion network, which contains a global contextual attention (GCA) module. Specifically, the GCA module introduced the spatial attention to retain the context information in the crucial region. Dai et al. [28] introduced a second-order CA mechanism to make the network emphasize more useful information and improve the discriminative learning ability. Inspired by the above work, we integrate the attention into the network and highlight the useful information to enhance the reconstruction performance.

3. The Proposed Approach
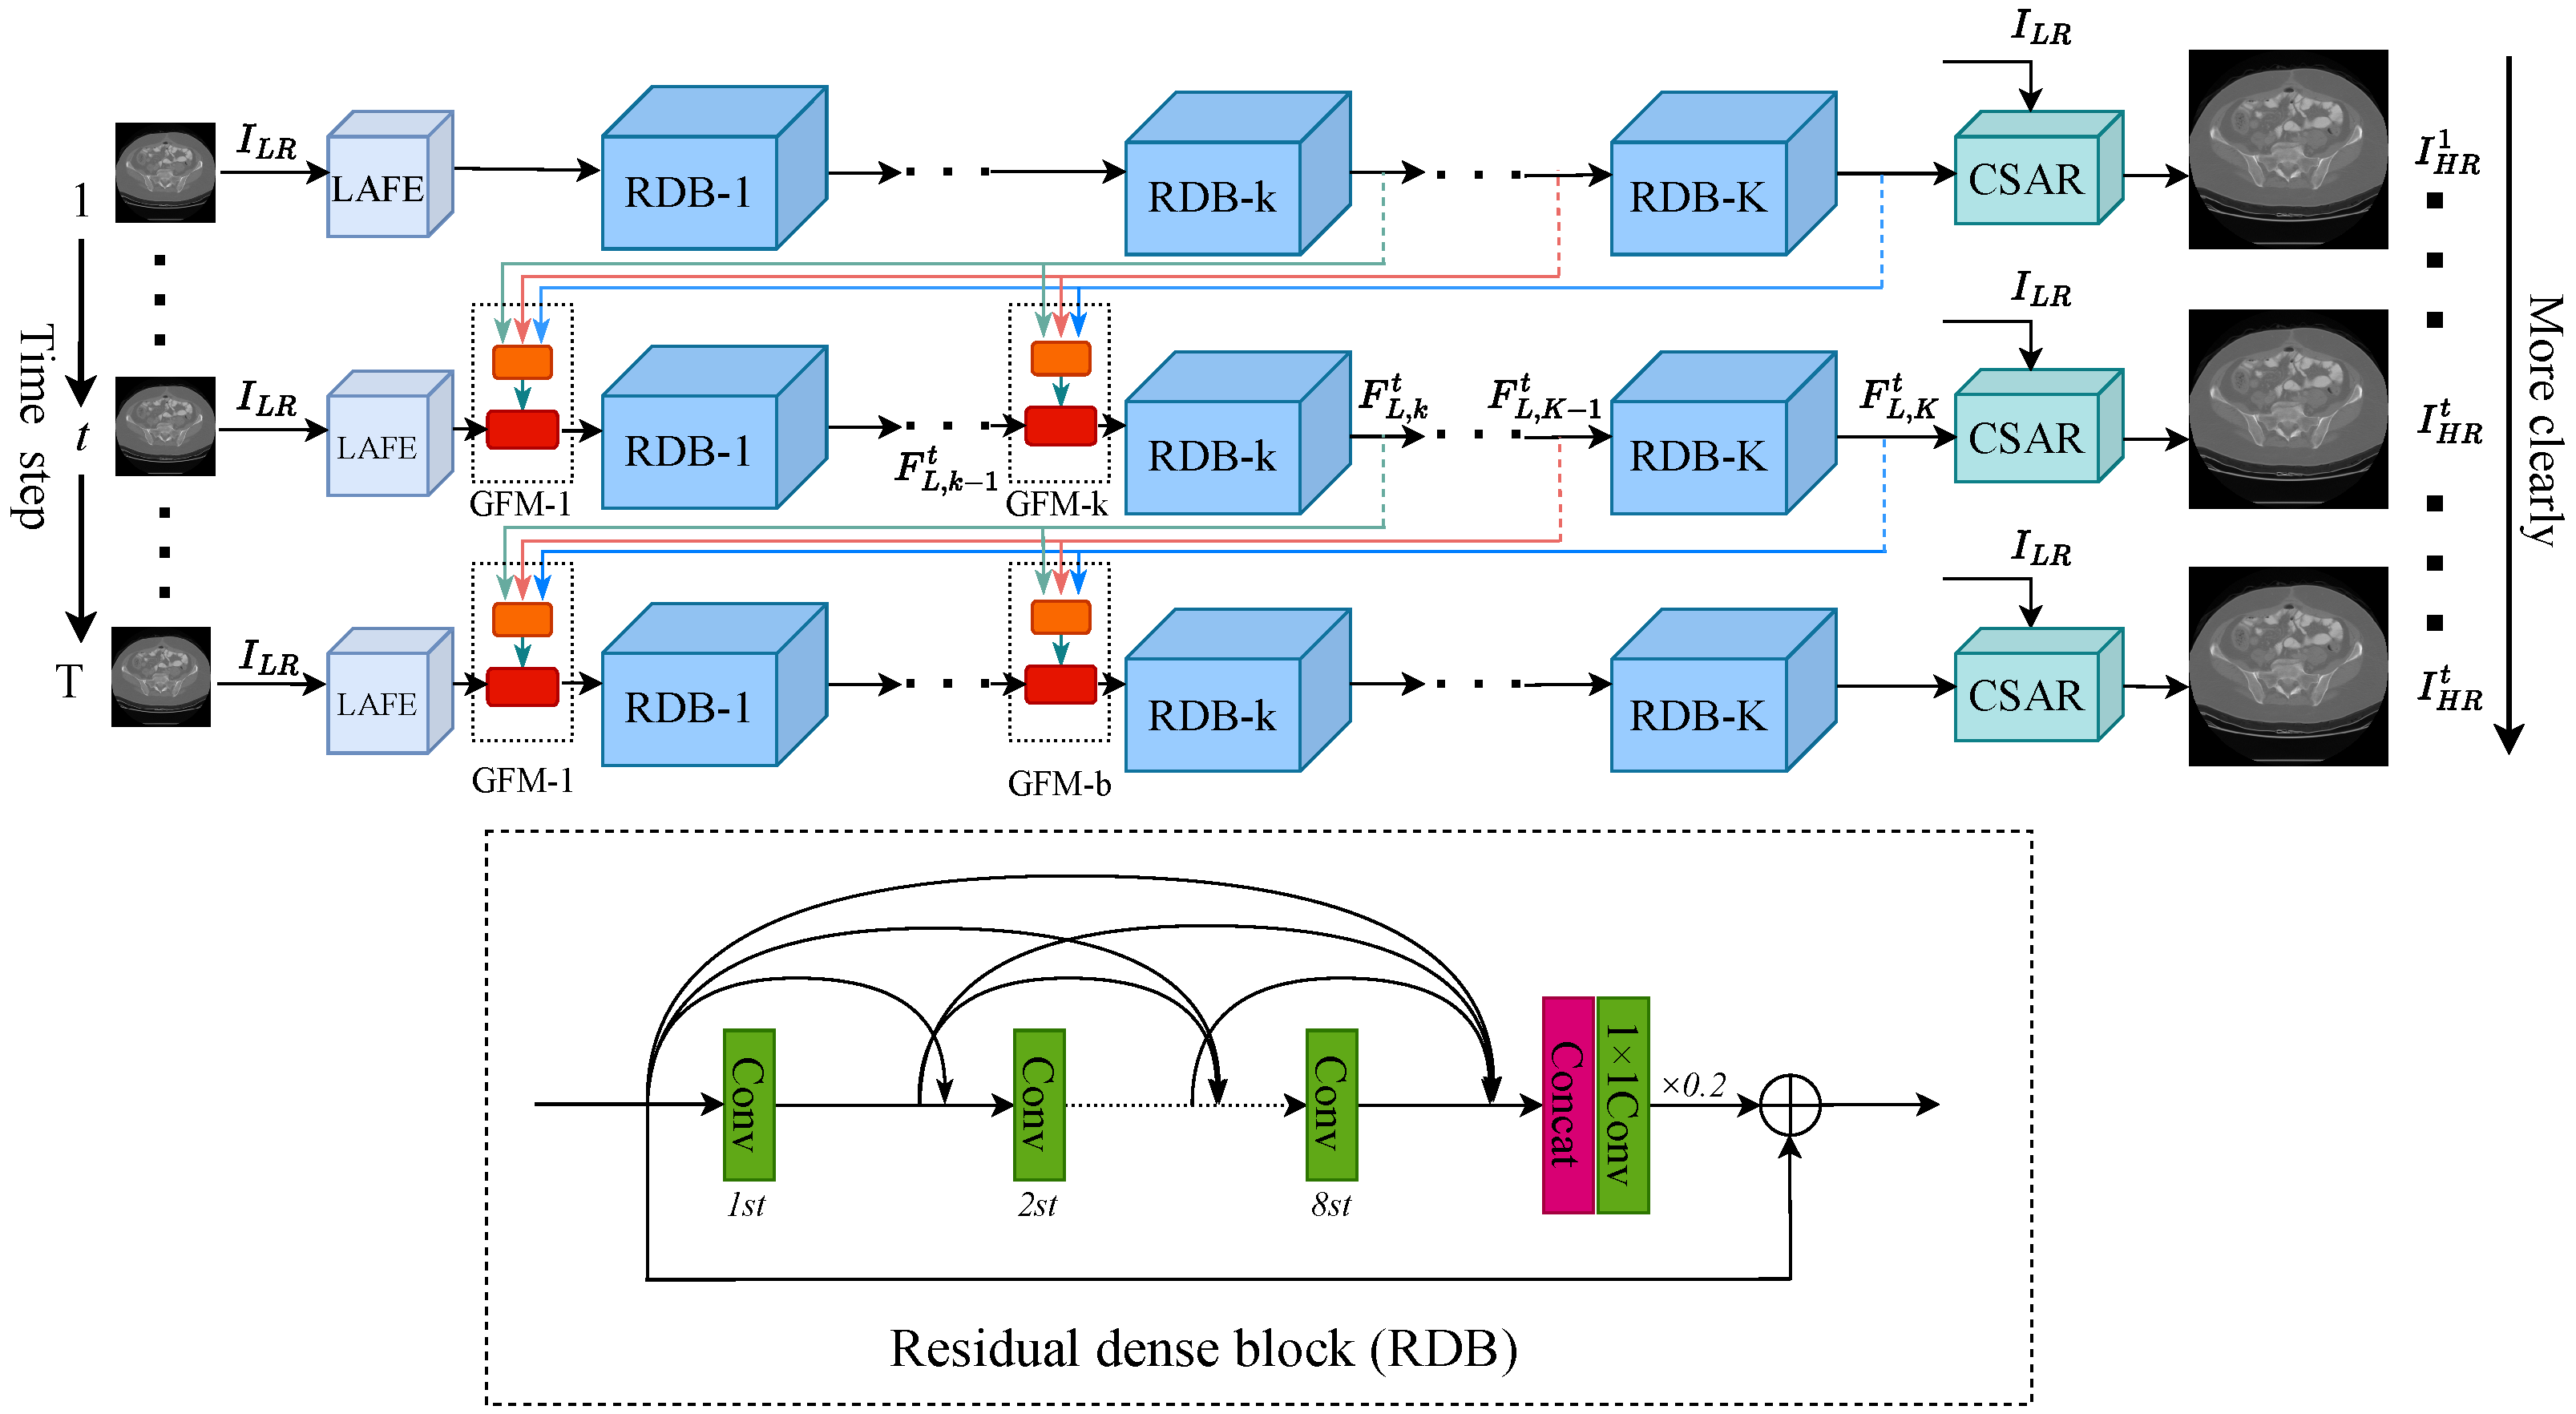
3.1. Network Design

As depicted in Figure 1, the proposed GAMA is composed of T branch networks, and each branch network contains four key components, namely layer attention feature extraction (LAFE) module, gated feedback (GF) module, multiple residual dense block (RDB), and channel-space attention reconstruction (CSAR) module.
The low-resolution image I LR is fed to the LAFE block to extract initial features and produce the weighted features F L , 0 t . The operation of LAFE module is formulated as,
F L , 0 t = H LAFE I LR ,
where H LAFE · represents the function of the LAFE module. Then, the weighted feature F L , 0 t is fed to multiple RDBs to generate features at different hierarchies.
The receptive field in a branch is positively correlated with the number of stacked RDBs, which contributes to obtaining a better feature extraction hierarchy. The feedback connection between the two adjacent branches and the GF module plays a crucial role in turn to complete the refinement of the underlying features. More details about the GF module will be discussed in Section 3.4. The final high-level feature F L , K t can be defined as
F L , K t = H GF - RDB F L , 0 t ,
where H GF - RDB · symbolizes the combining function of RDBs and GF modules.
In the final stage, the extracted high-level feature F L , K t is fed to CSAR module for obtaining SR image I SR t
I SR t = H CSAR F L , B t , I LR ,
where H CSAR · denotes the function of the CSAR module, and I SR t is the super-resolution image generated by the t-th branch network.
We utilize L 1 loss function and gradient variance loss function [29] to train the model. The loss function can be defined as
L θ = L 1 + λ L GV ,
where θ employs the parameter set of the proposed GAMA. L 1 denotes L 1 loss function and L GV represents the gradient variance loss. λ is the weight of gradient variance loss. The gradient variance loss is described in detail in Section 3.5, and L 1 loss function is formulated as:
L 1 θ = 1 T t = 1 T I HR t I SR t 1 ,
where I HR t indicates the high-resolution image in the t-th branch network.

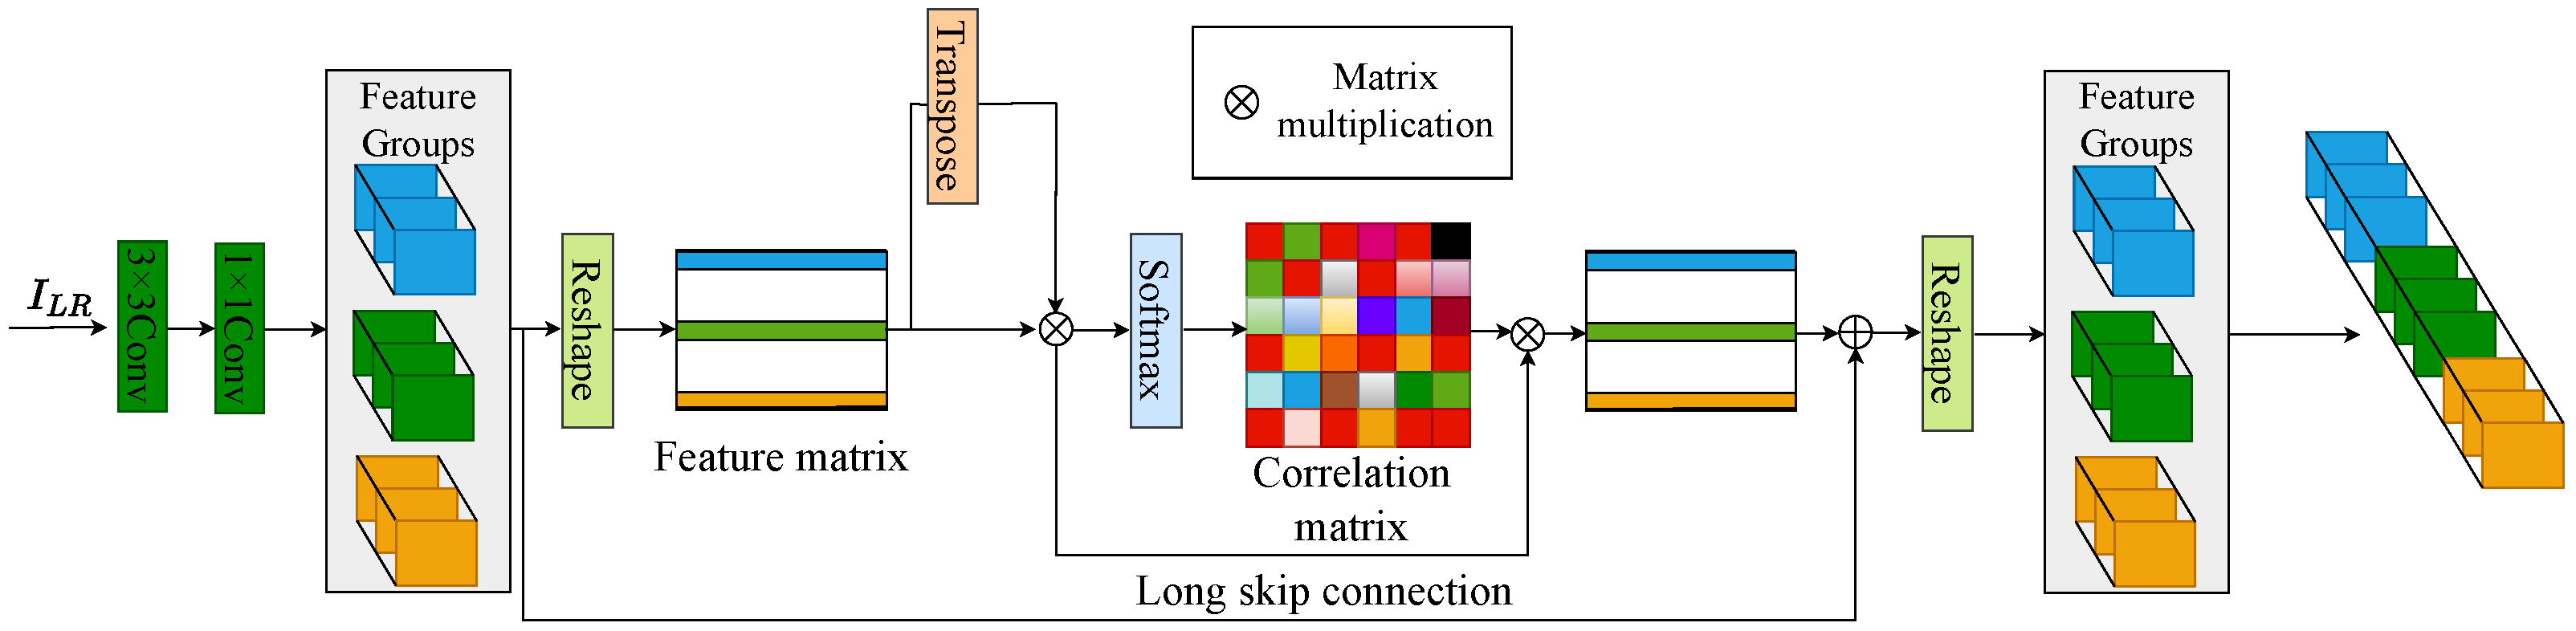
3.2. Layer Attention Feature Extraction Module

In order to highlight vital feature information while removing the redundancy to refine the feature map, we propose a layer attention feature extraction (LAFE) module. The architecture of the proposed LAFE module is shown in Figure 2. It is composed of an original low-level feature extraction unit and a layer attention unit. The low-level feature extraction unit contains a 3 × 3 convolution layer for basic features extraction and a 1 × 1 convolution layer for channel reduction. First, the I LR is fed into the low-level feature extraction unit to obtain the original low-level feature F L , I t
F L , I t = H IFEU I LR ,
where H IFEU · denotes the operation of the original low-level feature extraction unit.
Then, it is transmitted to the following layer attention unit to improve the feature representation ability. Specifically, the F L , I t with dimension N × H × W × C is reconstructed into a two-dimensional matrix with dimension N × ( H W C ) , and the correlation W la is obtained by matrix multiplication operation with its corresponding transpose
W la = δ soft φ re F L , I t · φ re F L , I t T ,
where δ soft · and φ re · symbolize the softmax and reshape functions, respectively.
Ultimately, the weighted features F L , 0 t are formulated as
F L , 0 t = α i = 1 N W la F L , I t + F L , I t ,
where the initial value of α is 0, and there will be network automatic allocation weights in the subsequent epoch. As a result, weighted features make the network focus on low-resolution features with more information.

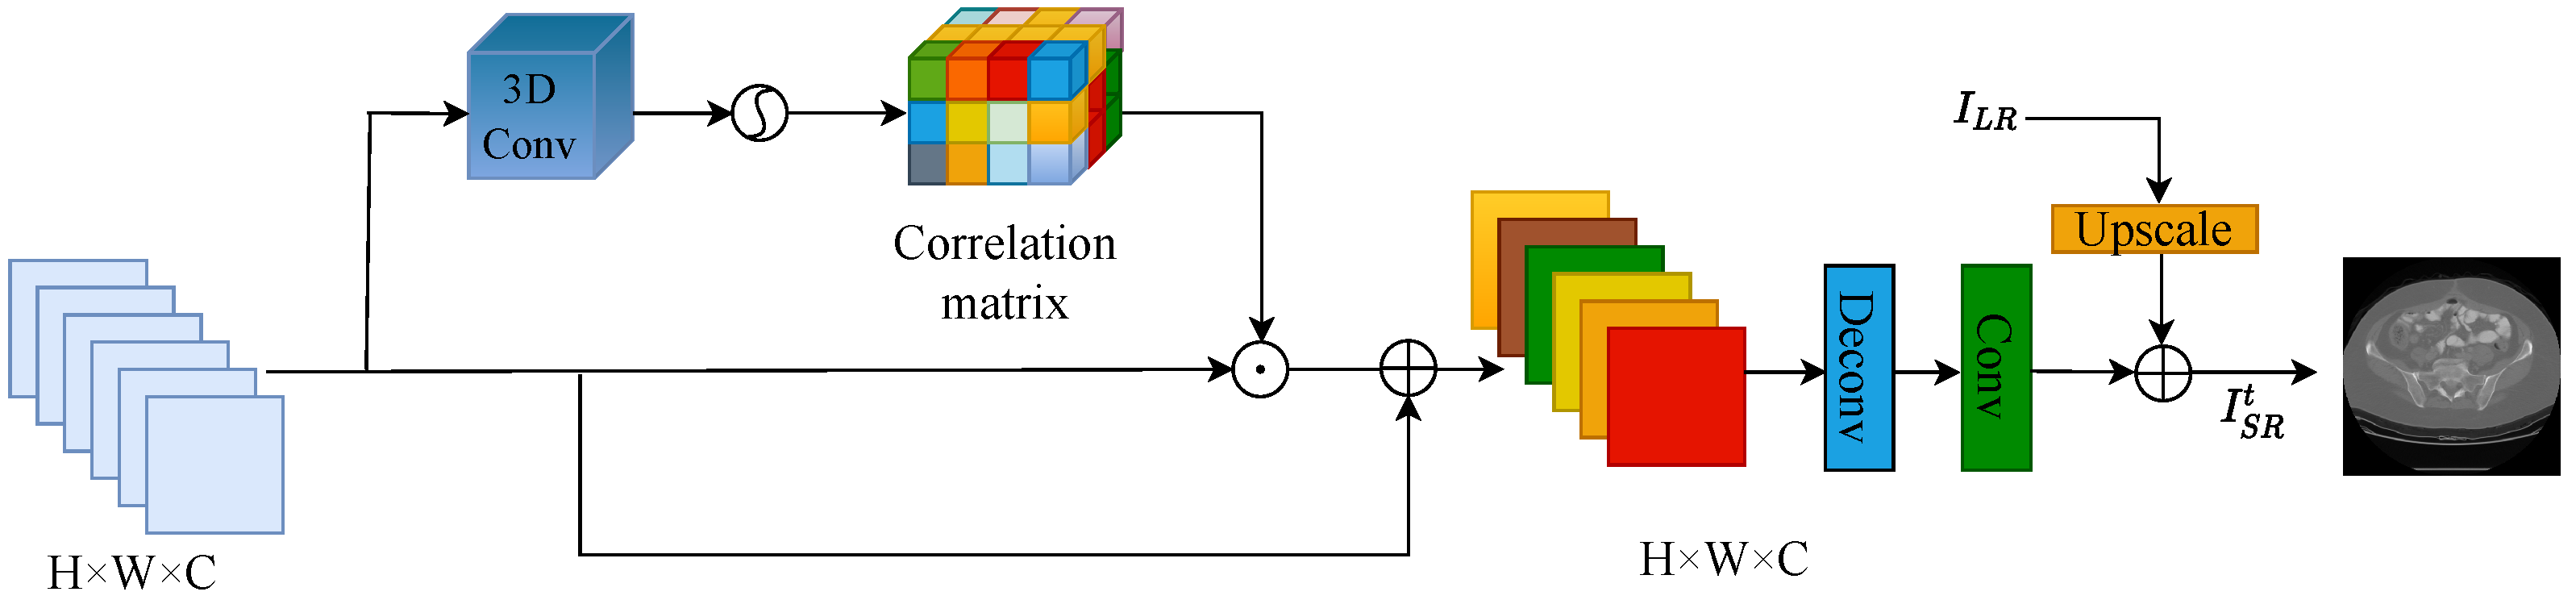
3.3. Channel-Spatial Attention Reconstruction Module

The spatial attention mechanism pays more attention to the scale information of features and less attention to the channel dimension information, while the channel attention mechanism reduces the redundancy in the scale information of features. To utilize the merits of both for the best reconstruction performance, we tailored a novel channel-spatial attention reconstruction (CSAR) module. It is composed of a channel-spatial attention unit and a reconstruction unit consisting of a deconvolution layer and a convolution layer.
The structure of the proposed CSAR is depicted in Figure 3.
Given the output F L , K t of the deepest RDB, F L , K t is the first input to the 3D convolution layer to generate an attention map by capturing joint channels and spatial features. Three-dimensional convolution is realized by convolving the three-dimensional convolution kernel with the cube constructed by multiple adjacent channels of F L , K t . Particularly, the 3D convolution kernel with kernel size of 3 × 3 × 3 and step size of 1 is convolved with the three groups of continuous channels of F L , K t , respectively, to obtain three groups of channel-spatial attention graph W csa . In addition, we use the attention graph W csa and the input property F L , K t to perform element-wise multiplication. Finally, the weighted result multiplied by a scale factor β is added to the input feature F L , K t to obtain the weighted feature F C , S t , which is computed as
F C , S t = β σ s i g W csa F L , K t + F L , K t ,
where σ s i g · represents the sigmoid function, and ⊙ represents the element-wise product. The initial value of the scale factor β is 0, and the weights are automatically allocated by the network in subsequent iterations. Therefore, F C , S t is the weighted sum of the spatial location features of all channels plus the original features. Different from previous spatial and channel attention mechanisms, the interdependencies of the channel and spatial features are explicitly modeled, which enables the proposed CSAR module to learn inter-channel and intra-channel feature responses adaptively.
Then, the weighted features F C , S t are transferred to the reconstruction unit for the recovery of the residual images. Ultimately, the SR image I SR t at the t-th time step is rebuilt from the combination of the recovered residual image and the interpolated low-resolution image. The formulation of I SR t is formulated as
I SR t = H CSAR F C , S t , I LR = H UF F C , S t + H IN I LR ,
where H CSAR · , H UF · , and H IN · represent the functions of the CSAR module, the reconstruction unit, and interpolated kernel, respectively.

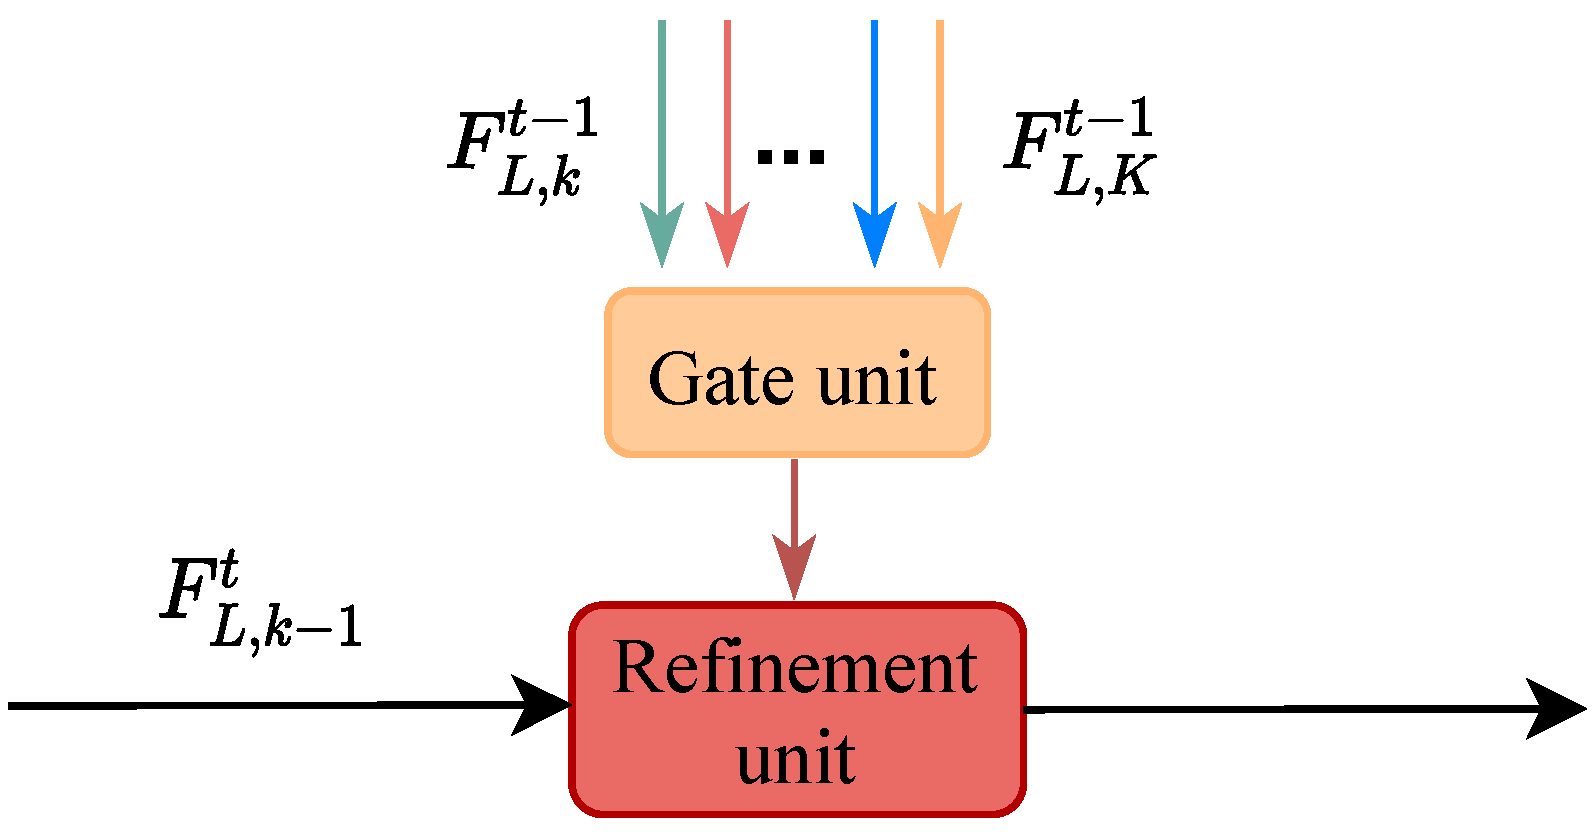
3.4. Gated Feedback Module

The gated feedback (GF) module is built to improve the low-level features extracted from the shallow layer by using several high-level features from the previous time-step re-routing. In Figure 4, it can be depicted that the GF module contains two key subassemblies, namely gate unit and refinement unit. The former unit selectively retains and enhances essential information from multiple high-level features and transmits it to the refinement unit. The latter unit can make use of the high-level information transmitted by the gate unit to refine the low-level features, and then deliver the refined low-level features to the subsequent RDBs. To improve the computational efficiency, two 1 × 1 sized convolutional layers are adopted as the gate unit and the refinement unit in the k-th RDB, respectively.
The GF module is placed after the low-level features that need to be refined. Because the proposed network contains multiple serial RDBs in a time step, we select the inputs of shallow RDBs as low-level features to be refined and the outputs of deep RDBs as rerouted high-level features. A deeper RDB can extract more representative information of the low-resolution space, which will play a crucial role in refining the low-level features. Based on this, we adopt multiple sets of feedback connections to sequentially transfer multiple high-level features from the deepest RDBs to the shallowest ones in turn.
Given that S M = 1 , 2 , M 1 , M is the set of selected indexes of the shallowest M RDBs and the input of S M is low-level features. The D N = N , N + 1 , , K 1 , K is regarded as the set of selected indexes of the deepest ( K N + 1 ) RDBs and the output of D N is utilized to refine the low-level features. At the t-th time, if k S M and t > 1 , the output of the b-th RDB F L , k t can be obtained via
F L , k t = H RDB , k H RU , k F H , k t , F L , k 1 t .
In other cases, the output of the b-th RDB can be derived by
F L , k t = H RDB , k F L , k 1 t ,
where H RDB , k · symbolizes the operation of the k-th RDB and H RU , k · formulates the functions of the refinement unit in the k-th GF module. F H , k t , F L , k 1 t denotes the combination of F H , k t and F L , k 1 t . F H , k t represents the high-level information selected and enhanced from multiple high-level features, which is transmitted to the k-th GF module. The high-level features are collected by the deepest RDBs and then delivered via a series of feedback connections. Hence, the selected and enhanced high-level information F H , k t can be formulated as,
F H , k t = H GU , k F L , N t 1 , , F L , K t 1 , if k < N , H GU , k F L , k t 1 , , F L , K t 1 , otherwise ,
where H GU , k · denotes the operation of the gate unit in the k-th GF module. The formulas of Equations (11)–(13) indicate that the k-th RDB only receive the output of RDBs whose indexes are equal or larger than k from the previous branch network.
According to Equations (11)–(13), the number of low-level features required for refinement and high-level features required for re-routing are determined by the values of M and N in index sets S M and D N , respectively. The single-to-single or single-to-multiple feedback connection described in Section 2.1 can be implemented by setting the values of N and M, which is a special case of the adopted feedback specification. When N = K , the conditions of M 1 and M = 1 are corresponding to single-to-multiple feedback connection or single-to-single feedback connection, respectively. In addition, each high-level feature captured in different reception field is significant for SR reconstruction. Based on this, we set N K to implement multiple-to-single ( M = 1 ) and multiple-to-multiple ( M 1 ) feedback connection modes and take full advantage of advanced feature to refine the underlying features.

3.5. Gradient Variance Loss

In single image SR domain, the most commonly used optimization functions of deep CNNs are L 1 and L 2 loss. However, the models optimized with the two loss functions tend to produce statistical averages of potential high-resolution solutions, which generally performed poorly in recovering sharp edges in high-resolution images. To alleviate this problem, we adopt the gradient variance (GV) loss [29].
For the I LR with the height h, width w, and color channels c, it can be denoted as a tensor with a size of c × h × w . The Sobel operator is applied to the given I SR and I HR transformed gray-scale images to obtain the corresponding gradient graphs G x SR , G y SR , G x HR , and G y HR . These gradient graphs are expanded into n × n patches without overlapping to form a matrix G ˜ x SR , G ˜ y SR , G ˜ x HR , G ˜ y HR , each of which has dimension n 2 × w · h n 2 , and each column represents one patch. Then, the i-th element of the matrix variance can be calculated by,
v i = j = 1 n 2 G ˜ i , j μ i 2 n 2 1 , i = 1 , , w · h n 2 ,
where μ i is the average value of the i-th patch, and G ˜ is an expanded gradient graph.
Given the variance mapping v x SR , v y SR and v x HR , v y HR corresponding to I SR and I HR images, respectively, the gradient variance loss can be expressed as,
L GV = E SR v x SR v x HR 2 + E SR v y SR v y HR 2 .
GV loss is proposed to prevent the gradient graph of the generated SR image from being blurred and enable the SR image to retain edge and texture information. Therefore, the variance of each region of the generated image is lower than the variance of the same region on the I HR image. The model trained by GV loss can minimize the variance difference between I HR and I SR images to generate clearer edges and textures.

4. Experiments and Discussion

4.1. Datasets

We perform the experiments on two large-scale medical image datasets, i.e., Low-Dose CT (LDCT) dataset ([Online]. Available: https://wiki.cancerimagingarchive.net/pages/viewpage.action?pageId=52758026, accessed on 21 October 2022) and QIN LUNG CT dataset ([Online]. Available: https://wiki.cancerimagingarchive.net/display/Public/QIN+LUNG+CT, accessed on 21 October 2022). The LDCT [30] is collected from 299 clinically performed CT examinations on patients. We group the samples into two splits, i.e., LDCT Part_A and LDCT Part_B, according to the scanned position. The former split includes 2272 images (1822 images for training and 450 images for test) which are chest images. The later split contains 1132 images (892 images for training and 240 images for test) which are the abdominal scan images. The QIN LUNG CT dataset [31] contains 3954 images which are published in the TCIA Cancer Imaging Archive. We select 328 images for training and 150 images for test from the QIN LUNG CT dataset. In order to verify the robustness of the proposed method, an experimental analysis is also conducted on the MRI13 dataset [32].

4.2. Evaluation Metrics

Two evaluation metrics, i.e., peak signal-to-noise ratio (PSNR) and structural similarity index measure (SSIM) [33], are adopted for objective assessments. They are formulated as,
P S N R I S R , I H R = 10 · log 10 × L 2 1 N i = 1 N I S R i I H R i 2 ,
where L represents the maximum pixel, and N denotes the number of all pixels in I S R and I H R .
S S I M x , y = 2 u x u y + k 1 u x 2 + u y 2 + k 1 · σ x y + k 2 σ x 2 + σ y 2 + k 2 ,
where x, y represent two images. σ x y symbolizes the covariance between x and y. u and σ 2 represent the average value and variance. k 1 , k 2 denote constant relaxation terms.
The PSNR is the ratio between the peak value power and noise power [34]. The PSNR is the most commonly used evaluation index to measure the quality of the lossy transformation reconstruction. For the image super-resolution, the PSNR is defined by the maximum pixel value between the images and the mean square error. The SSIM is a perception-based model that treats image degradation as a perceptual change in the structural information. The SSIM takes the structural similarity into account by combining the contrast, luminance, and texture of the images. Higher scores of the PSNR and SSIM denote a better reconstruction performance.

4.3. Implementation Details

Following the setting in [9], the number of branch networks T and the RDBs are set as 2 and 8, respectively. Meanwhile, the feedback connection in the proposed GAMA is implemented by setting M = 1 and N = 4 . In each iteration, the medical LR image is cropped randomly into 16 image patches for network training, with each patch size of 48 × 48 . We utilize Adam [35] to optimize the proposed GAMA. The original learning rate is set to 2 × 10 4 , and it reduces by half every 2 × 10 5 iterations. The weight of the gradient variance loss λ is set to 0.01. The deep learning architecture parameters used for the model training and evaluation are PyTorch 1.8.0, CUDAToolkit 10.2, cuDNN 8.1.1, Python 3.8, and two paralleled NVIDIA 3060 GPUs, manufatured in Shenzhen city, Guangdong Province.

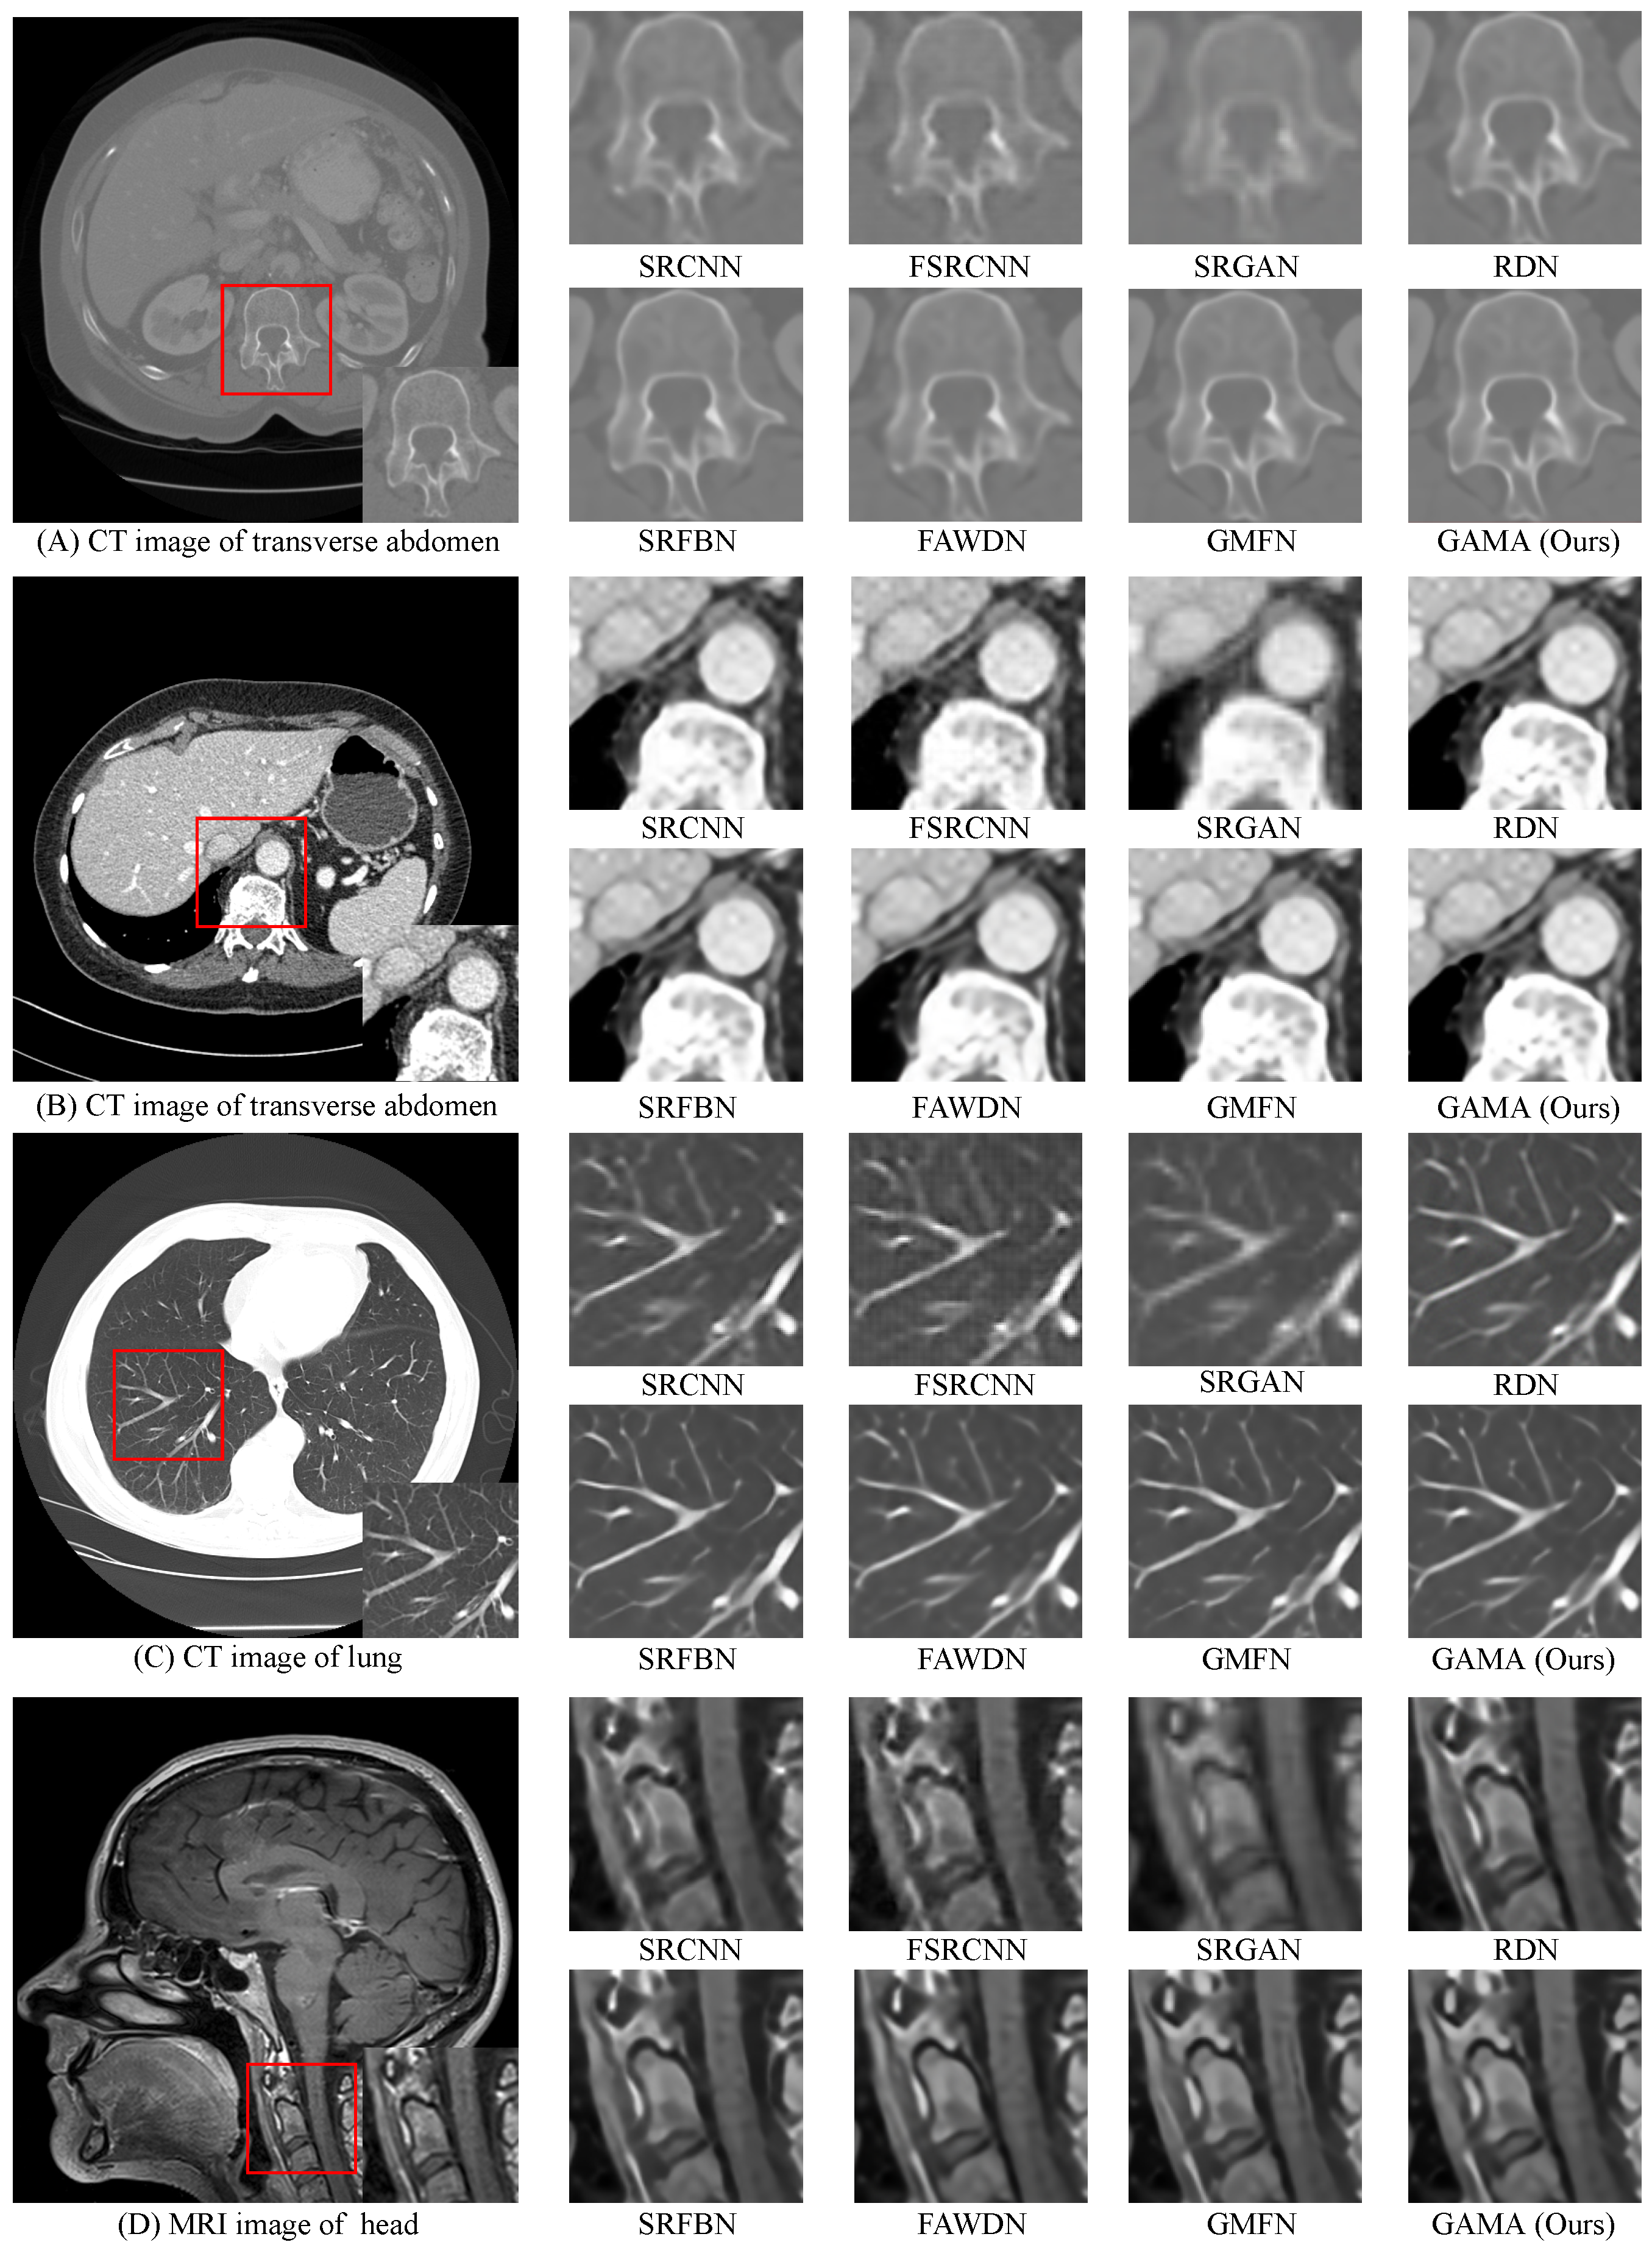
4.4. Comparative Analysis
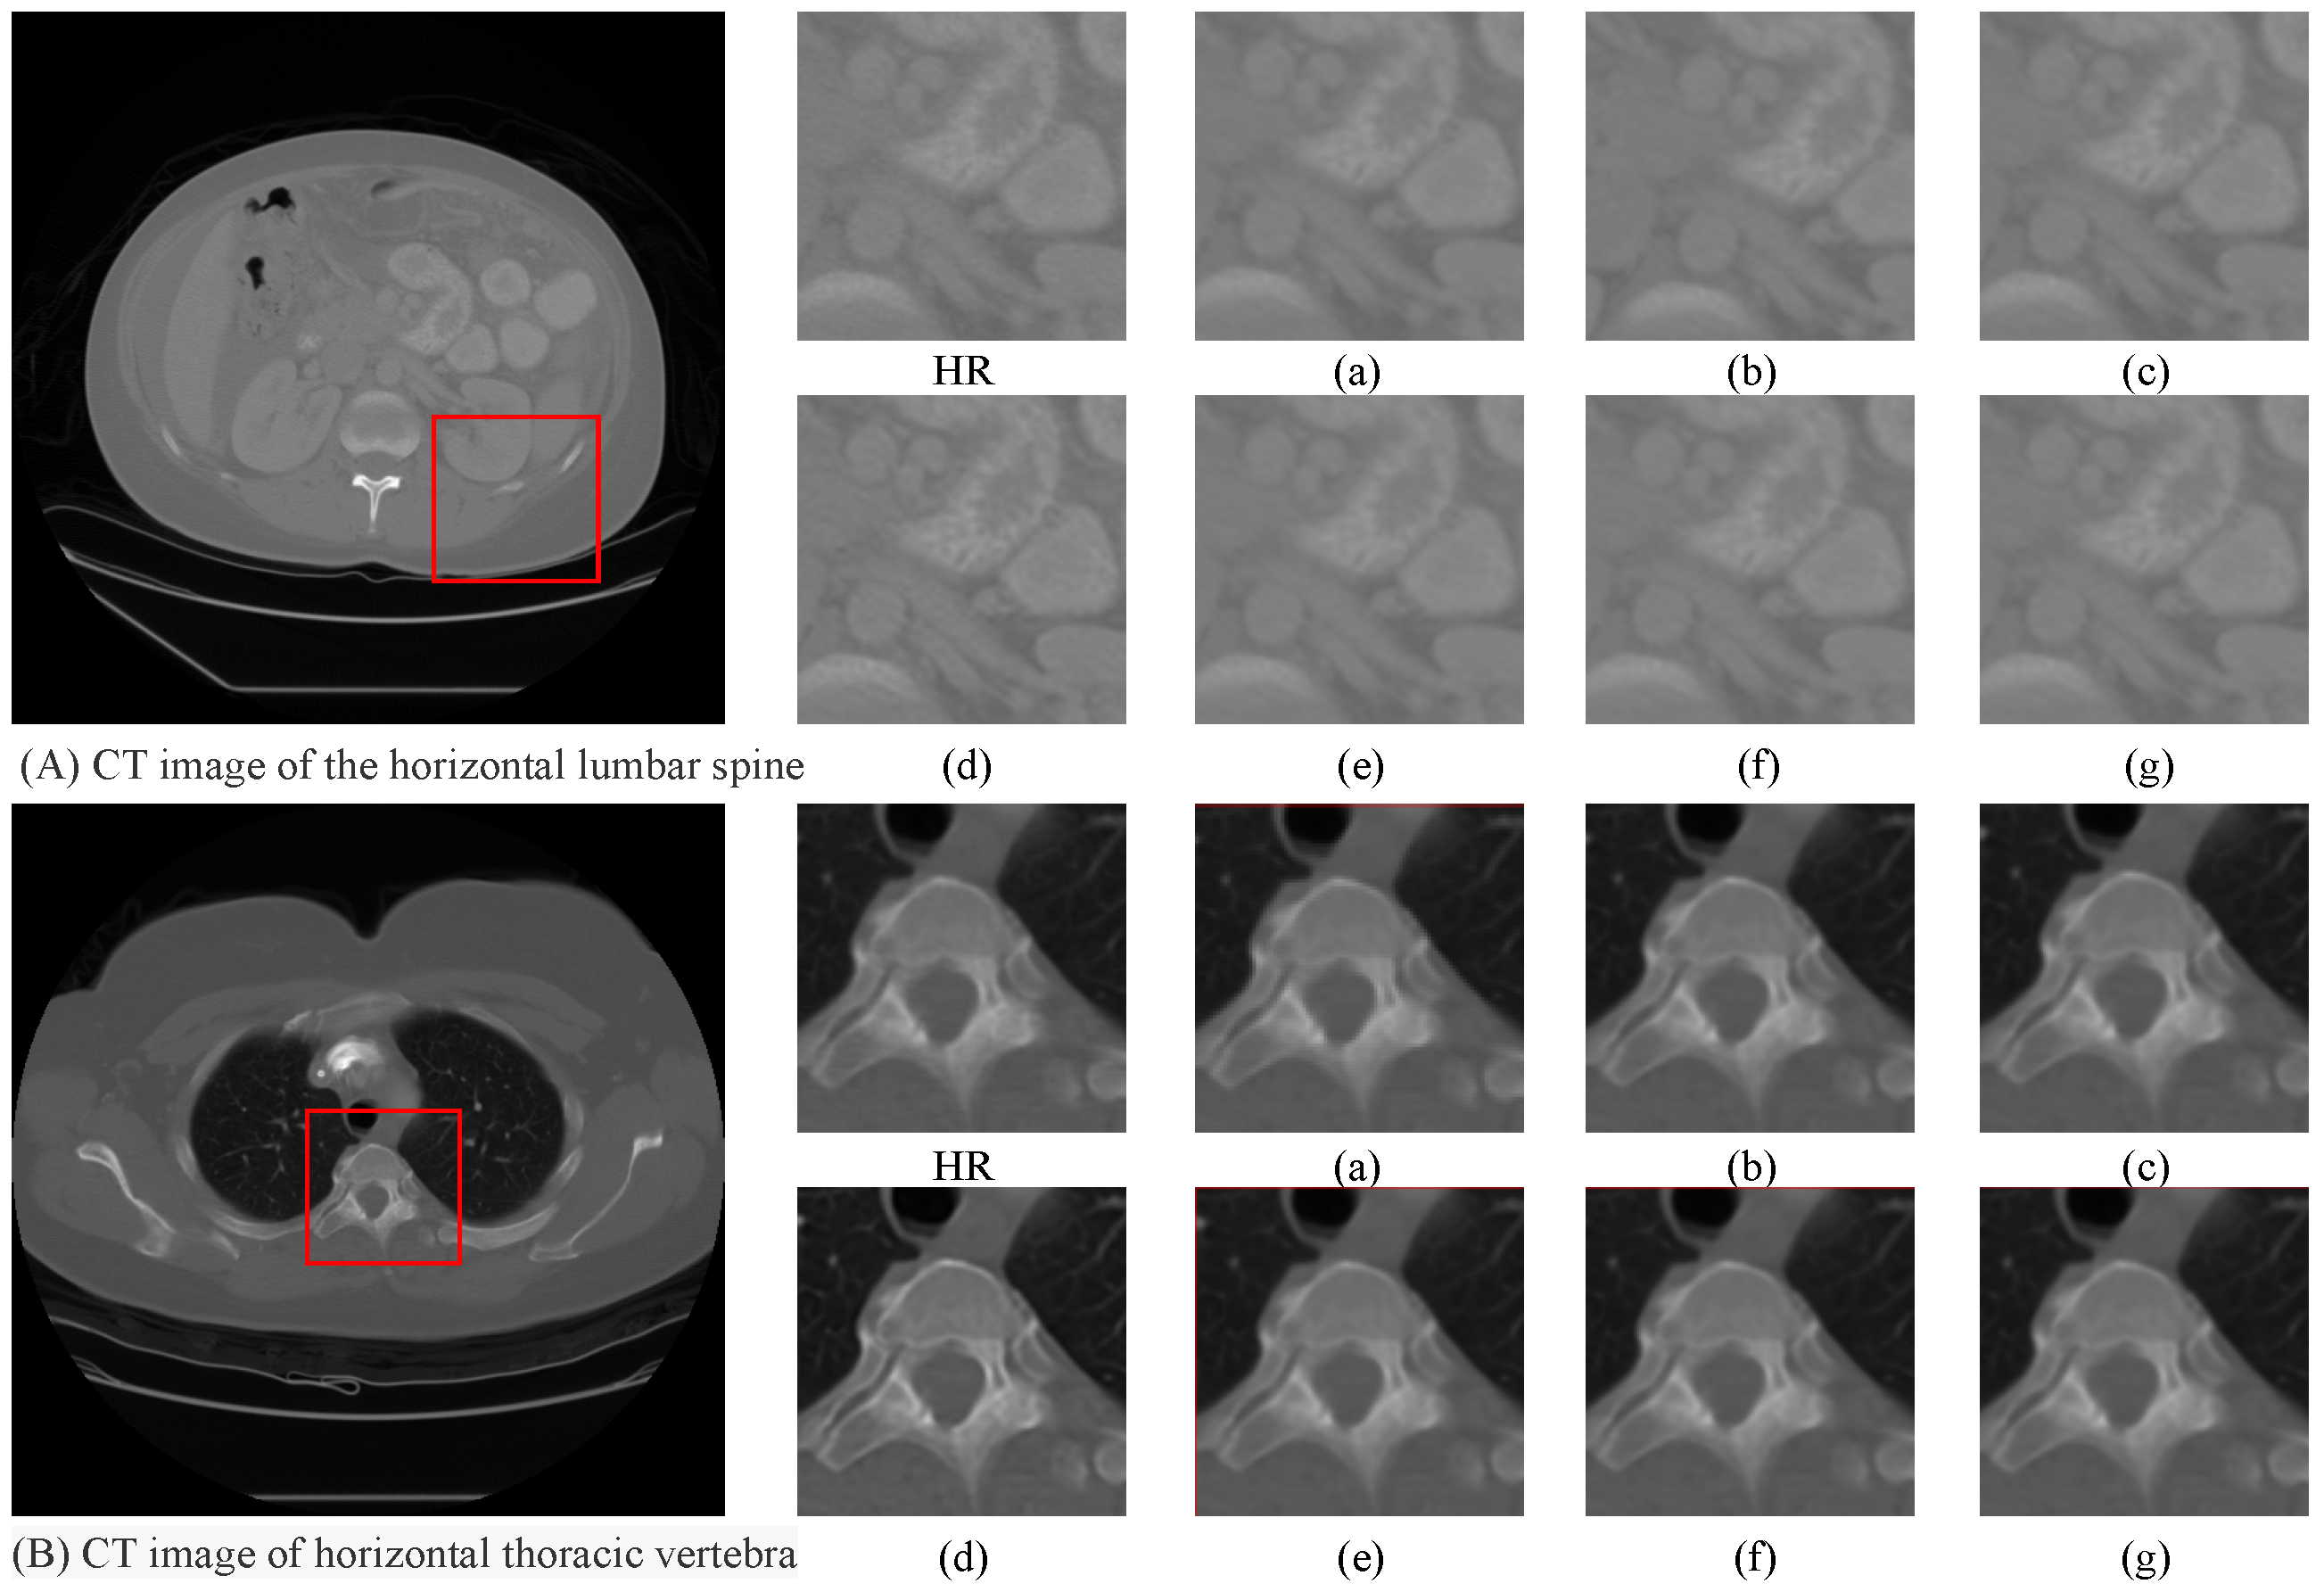
To validate the performance of the GAMA, we conduct the experiments and compare it with some mainstream methods, e.g., SRCNN [7], FSRCNN [36], SRGAN [12], RDN [37], SRFBN [8], FAWDN [16], and GMFN [9]. The objective evaluation and subjective results are evaluated on the LDCT Part_A, LDCT Part_B, and QIN_LUNG test sets with scale factors of × 2 , × 3 , and × 4 .
The comparative results on the LDCT, QIN_LUNG CT, and MRI13 datasets in terms of the PSNR and SSIM are reported in Table 1. The experimental results indicate that the proposed method obtains the best scores on the LDCT and QIN_LUNG CT datasets with different scale factors. Specifically, on the LDCT Part_A test set with a scale factor of × 2 , the average PSNR and SSIM values obtained by the proposed GAMA are improved by 4.79 dB and 0.0055 compared with the SRCNN [7] and 4.59 dB and 0.0040 compared with the FSRCNN [36], respectively. Meanwhile, the average values of the PSNR and SSIM obtained with the scale factors of × 3 and × 4 are also substantially improved. On the LDCT Part_B test set with the scale factor of × 2 , the proposed method increases the score of the PSNR by 0.49 dB and the SSIM by 0.0027 compared with the SRFBN [8] which also adopted the feedback mechanism. With the scale factor of × 3 , the values of the PSNR and SSIM are 0.33 dB and 0.0043 higher than the SRFBN [8]. With the scale factor of × 4 , the PSNR and SSIM of the proposed GAMA are improved by 0.28 dB and 0.0038, respectively. On the QIN LUNG CT test set, the GAMA ranks in first place in both the PSNR and SSIM compared with the competitors. Compared with the GMFN [9], which adopts the similar multiple-to-multiple feedback connection mechanism, the proposed GAMA increases the PSNR by 3.77 dB and the SSIM by 0.0033 at the scale factor of × 2 . With the scale factor of × 3 , the GAMA improves the PSNR and SSIM by 2.14 dB and 0.0065, respectively. With the scale factor of × 4 , the indexes of the PSNR and SSIM are 2.25 dB and 0.0126 higher than the GMFN [9]. The average values of the PSNR and SSIM obtained by the proposed GAMA are improved by 3.35 dB and 0.0183, when compared with the FAWDN [16], with a scale factor of × 4 . Meanwhile, Table 1 indicates that the proposed method wins second place on the MRI13 dataset with different scale factors. Compared with the SRCNN [7] and SRGAN [12] with a scale factor of × 2 , the proposed GAMA improves the average PSNR by 9.56% and 28.87%, respectively.
Figure 5 illustrates the results of the subjective visual comparison on the LDCT Part_A, LDCT Part_B, QIN LUNG CT, and MRI13 test sets with a scale factor of × 4 . Figure 5A–D provide the reconstruction results of the vertebral area, descending aorta area, lung texture area, and human head, respectively. In addition, Figure 5A shows that the vertebral scan images reconstructed by the SRFBN [8], GMFN [9], and proposed GAMA are significantly sharper than those reconstructed by the SRCNN [7] and SRGAN [12]. Although there is no conspicuous difference in the sharpness of the vertebral scan images reconstructed by the SRFBN, GMFN, and proposed GAMA, the contrast of the reconstructed images by the GAMA is significantly improved compared with the high-resolution images. The proposed algorithm has a better reconstruction effect on the edge contour of the vertebral body and the relatively sharp convex part, benefitting from the gradient variance loss. The scan images of the vertebral region reconstructed by the SRCNN [7] and SRGAN [12] algorithm are relatively fuzzy and short of details. Figure 5B shows that the medical images reconstructed by the GAMA have better details of the descending aorta and inferior vena cava of the liver. The exemplar qualitative results of the QIN LUNG CT dataset are depicted in Figure 5C. In the medical image SR domain, the hairline lung texture branches in the lung CT images are the most difficult image details to recover [38]. Particularly, the proposed GAMA can also retain enough fine lung texture branches compared with the other methods. Figure 5D shows the reconstructed MRI images of the human head. The reconstructed MRI images of the GAMA depict abundant tissue details of the human esophagus, spinal cord nerve roots, and the second spine.

4.5. Ablation Study

To figure out the impact of different settings and components on medical image SR, we conduct ablation experiments on the LDCT Part_A and LDCT Part_B test sets with the scale factor of × 2 . We explore the proposed model from three aspects, i.e., the LAFE module, the CSAR module, and the gradient variance loss. The corresponding items are listed as below.
(a)
“baseline” represents the basic model without the LAFE, CSAR, and L GV .
(b)
“baseline + LAFE” refers to the “baseline” with the LAFE module.
(c)
“baseline + CSAR” denotes the “baseline” with the CSAR module.
(d)
“baseline + LAFE + CSAR” represents the “baseline” with the LAFE module and CSAR module.
(e)
“baseline + LAFE + L GV ” refers to the “baseline” with the LAFE module and L GV .
(f)
“baseline + CSAR + L GV ” denotes the “baseline” with the CSAR module and L GV .
(g)
“baseline + LAFE + CSAR + L GV ” represents the final GAMA.
Table 2 shows the quantitative evaluation results on the LDCT Part_A test set. The baseline model scores 48.66 dB and 0.9886 in the PSNR and SSIM, which are the worst across all the entries in the table. When the LAFE module and CSAR module are introduced, the PSNR and SSIM are improved steadily. Especially when the LAFE module and CSAR module are employed simultaneously, the PSNR increased by 0.05 dB, which verifies the effectiveness of the proposed LAFE module and the CSAR module. Because the LDCT dataset is full of low-dose CT scan images with a similar and uniform structure, the SSIM value only increased by 0.0001 from 0.9886. Compared with the algorithm with the LAFE module, the PSNR improved by 0.06 dB after L GV was added. Similarly, the addition of L GV improved the PSNR of the algorithm introduced with the CSAR module by 0.02 dB. These two experimental results prove that L GV contributes to improving the performance of the model. The last group of experimental configurations achieved the highest PSNR value 48.75 dB and SSIM value 0.9887, and the GAMA adopted the corresponding configuration. Figure 6 shows the reconstruction results of the human intestinal CT and human thoracic CT in different configurations. In Figure 6A, compared with the reconstructed images of other configurations, the profile of the intestine and the details of the intestinal clusters are more obvious in the reconstructed images of the proposed GAMA. As shown in Figure 6B, after adding the LAFE and CSAR modules, the sharpness of the reconstructed images is significantly improved. On this basis, with the introduced L GV , the margins of the thoracic vertebrae become sharper.

5. Conclusions

In this paper, we propose a gated multi-attention feedback network (GAMA) for CT image super-resolution. The GAMA adopts the gated multi-feedback network as the backbone to propagate multiple hierarchical high-level features for refining the low-level features. Meanwhile, it consists of two key components, namely the layer attention feature extraction (LAFE) module and the channel-space attention reconstruction (CSAR) module. The LAFE module can highlight important feature information and eliminate redundancy to optimize the feature map, while the CSAR module can enhance the representation of semantic feature graphs by facilitating the information exchange between different channel dimensions. In addition, a gradient variance loss is adopted to preserve the sharp edges and rich textures. The comparative experiments prove that the proposed method performs favorably against the state-of-the-art competitors.

Author Contributions

Conceptualization, J.S. and M.G.; methodology, J.S. and M.G.; software, X.Z. and W.S.; validation, G.Z. and M.G.; formal analysis, J.S. and Q.L.; investigation, J.S. and Q.L; resources, M.G. and X.Z.; writing, J.S.; supervision, M.G.; data collection, J.C. All authors have read and agreed to the published version of the manuscript.

Funding

This research received no external funding.

Institutional Review Board Statement

Ethical review and approval were waived for this study, due to all the datasets are publicly available. 1. Low Dose CT Image and Projection Data (LDCT-and-Projection-data): https://wiki.cancerimagingarchive.net/pages/viewpage.action?pageId=52758026, accessed on 21 October 2022; 2. QIN LUNG CT: https://wiki.cancerimagingarchive.net/display/Public/QIN+LUNG+CT#19039647558d98fcb211404db34fe9f70c7b8d64, accessed on 21 October 2022.

Informed Consent Statement

Informed consent was obtained from all subjects involved in the study.

Data Availability Statement

Not applicable.

Conflicts of Interest

The authors declare no conflict of interest.

References

  1. Su, H.; Zhou, J.; Zhang, Z.H. Survey of super-resolution image reconstruction methods. Acta Autom. Sin. 2013, 39, 1202–1213. [Google Scholar] [CrossRef]
  2. Chavez, H.; Gonzalez, V.; Hernandez, A.; Ponomaryov, V. Super resolution imaging via sparse interpolation in wavelet domain with implementation in DSP and GPU. In Proceedings of the Iberoamerican Congress on Pattern Recognition, Puerto Vallarta, Mexico, 2–5 November 2014; Springer: Berlin/Heidelberg, Germany, 2014; pp. 973–981. [Google Scholar]
  3. Li, Y.; Sixou, B.; Peyrin, F. A review of the deep learning methods for medical images super resolution problems. IRBM 2021, 42, 120–133. [Google Scholar] [CrossRef]
  4. Lehmann, T.M.; Gonner, C.; Spitzer, K. Survey: Interpolation methods in medical image processing. IEEE Trans. Med. Imaging 1999, 18, 1049–1075. [Google Scholar] [CrossRef] [PubMed] [Green Version]
  5. Mu, S.; Zhang, Y.; Qian, X.; Jiang, Y. Research on Super-Resolution Enhancement Algorithm Based on Skip Residual Dense Network. In Proceedings of the 2021 IEEE International Conference on Multimedia and Expo (ICME), Shenzhen, China, 5–9 July 2021; IEEE: Piscataway, NJ, USA, 2021; pp. 1–6. [Google Scholar]
  6. Gerchberg, R. Super-resolution through error energy reduction. Opt. Acta Int. J. Opt. 1974, 21, 709–720. [Google Scholar] [CrossRef]
  7. Dong, C.; Loy, C.C.; He, K.; Tang, X. Learning a deep convolutional network for image super-resolution. In Proceedings of the European Conference on Computer Vision, Zurich, Switzerland, 6–12 September 2014; Springer: Berlin/Heidelberg, Germany, 2014; pp. 184–199. [Google Scholar]
  8. Li, Z.; Yang, J.; Liu, Z.; Yang, X.; Jeon, G.; Wu, W. Feedback network for image super-resolution. In Proceedings of the IEEE/CVF Conference on Computer Vision and Pattern Recognition, Long Beach, CA, USA, 16–17 June 2019; pp. 3867–3876. [Google Scholar]
  9. Li, Q.; Li, Z.; Lu, L.; Jeon, G.; Liu, K.; Yang, X. Gated multiple feedback network for image super-resolution. arXiv 2019, arXiv:1907.04253. [Google Scholar]
  10. Pradhan, A.K.; Mishra, D.; Das, K.; Obaidat, M.S.; Kumar, M. A COVID-19 X-ray image classification model based on an enhanced convolutional neural network and hill climbing algorithms. Multimed. Tools Appl. 2022, 1–19. [Google Scholar] [CrossRef] [PubMed]
  11. Raheja, S.; Kasturia, S.; Cheng, X.; Kumar, M. Machine learning-based diffusion model for prediction of coronavirus-19 outbreak. Neural Comput. Appl. 2021, 1–20. [Google Scholar] [CrossRef] [PubMed]
  12. Ledig, C.; Theis, L.; Huszár, F.; Caballero, J.; Cunningham, A.; Acosta, A.; Aitken, A.; Tejani, A.; Totz, J.; Wang, Z.; et al. Photo-realistic single image super-resolution using a generative adversarial network. In Proceedings of the IEEE Conference on Computer Vision and Pattern Recognition, Honolulu, HI, USA, 21–26 July 2017; pp. 4681–4690. [Google Scholar]
  13. Blau, Y.; Mechrez, R.; Timofte, R.; Michaeli, T.; Zelnik-Manor, L. The 2018 pirm challenge on perceptual image super-resolution. In Proceedings of the European Conference on Computer Vision (ECCV) Workshops, Munich, Germany, 8–14 September 2018. [Google Scholar]
  14. Jin, X.; Chen, Y.; Jie, Z.; Feng, J.; Yan, S. Multi-path feedback recurrent neural networks for scene parsing. In Proceedings of the Thirty-First AAAI Conference on Artificial Intelligence, San Francisco, CA, USA, 4–9 February 2017. [Google Scholar]
  15. Zhang, X.; Wang, T.; Qi, J.; Lu, H.; Wang, G. Progressive attention guided recurrent network for salient object detection. In Proceedings of the IEEE Conference on Computer Vision and Pattern Recognition, Salt Lake City, UT, USA, 18–22 June 2018; pp. 714–722. [Google Scholar]
  16. Chen, L.; Yang, X.; Jeon, G.; Anisetti, M.; Liu, K. A trusted medical image super-resolution method based on feedback adaptive weighted dense network. Artif. Intell. Med. 2020, 106, 101857. [Google Scholar] [CrossRef] [PubMed]
  17. Carreira, J.; Agrawal, P.; Fragkiadaki, K.; Malik, J. Human pose estimation with iterative error feedback. In Proceedings of the IEEE Conference on Computer Vision and Pattern Recognition, Las Vegas, NV, USA, 27–30 June 2016; pp. 4733–4742. [Google Scholar]
  18. Cao, C.; Liu, X.; Yang, Y.; Yu, Y.; Wang, J.; Wang, Z.; Huang, Y.; Wang, L.; Huang, C.; Xu, W.; et al. Look and think twice: Capturing top-down visual attention with feedback convolutional neural networks. In Proceedings of the IEEE International Conference on Computer Vision, Santiago, Chile, 7–13 December 2015; pp. 2956–2964. [Google Scholar]
  19. Zamir, A.R.; Wu, T.L.; Sun, L.; Shen, W.B.; Shi, B.E.; Malik, J.; Savarese, S. Feedback networks. In Proceedings of the IEEE Conference on Computer Vision and Pattern Recognition, Honolulu, HI, USA, 21–26 July 2017; pp. 1308–1317. [Google Scholar]
  20. Haris, M.; Shakhnarovich, G.; Ukita, N. Deep back-projection networks for super-resolution. In Proceedings of the IEEE Conference on Computer Vision and Pattern Recognition, Salt Lake City, UT, USA, 18–22 June 2018; pp. 1664–1673. [Google Scholar]
  21. Han, W.; Chang, S.; Liu, D.; Yu, M.; Witbrock, M.; Huang, T.S. Image super-resolution via dual-state recurrent networks. In Proceedings of the IEEE Conference on Computer Vision and Pattern Recognition, Salt Lake City, UT, USA, 18–22 June 2018; pp. 1654–1663. [Google Scholar]
  22. Sam, D.B.; Babu, R.V. Top-down feedback for crowd counting convolutional neural network. In Proceedings of the Thirty-Second AAAI Conference on Artificial Intelligence, New Orleans, LA, USA, 2–7 February 2018. [Google Scholar]
  23. Hu, J.; Shen, L.; Sun, G. Squeeze-and-excitation networks. In Proceedings of the IEEE Conference on Computer Vision and Pattern Recognition, Salt Lake City, UT, USA, 18–22 June 2018; pp. 7132–7141. [Google Scholar]
  24. Wang, J.; Wu, J.; Wu, Z.; Anisetti, M.; Jeon, G. Bayesian method application for color demosaicking. Opt. Eng. 2018, 57, 053102. [Google Scholar] [CrossRef]
  25. Zhang, Y.; Li, K.; Li, K.; Wang, L.; Zhong, B.; Fu, Y. Image super-resolution using very deep residual channel attention networks. In Proceedings of the European Conference on Computer Vision (ECCV), Munich, Germany, 8–14 September 2018; pp. 286–301. [Google Scholar]
  26. Woo, S.; Park, J.; Lee, J.Y.; Kweon, I.S. Cbam: Convolutional block attention module. In Proceedings of the European Conference on Computer Vision (ECCV), Munich, Germany, 8–14 September 2018; pp. 3–19. [Google Scholar]
  27. Kim, J.H.; Choi, J.H.; Cheon, M.; Lee, J.S. Ram: Residual attention module for single image super-resolution. arXiv 2018, arXiv:1811.12043. [Google Scholar]
  28. Dai, T.; Cai, J.; Zhang, Y.; Xia, S.T.; Zhang, L. Second-order attention network for single image super-resolution. In Proceedings of the IEEE/CVF Conference on Computer Vision and Pattern Recognition, Long Beach, CA, USA, 15–20 June 2019; pp. 11065–11074. [Google Scholar]
  29. Abrahamyan, L.; Truong, A.M.; Philips, W.; Deligiannis, N. Gradient variance loss for structure-enhanced image super-resolution. In Proceedings of the ICASSP 2022—2022 IEEE International Conference on Acoustics, Speech and Signal Processing (ICASSP), Singapore, 22–27 May 2022; IEEE: Piscataway, NJ, USA, 2022; pp. 3219–3223. [Google Scholar]
  30. McCollough, C.; Chen, B.; Holmes, D.; Duan, X.; Yu, Z.; Xu, L.; Leng, S.; Fletcher, J. Low Dose CT Image and Projection Data [Data Set]. The Cancer Imaging Archive. 2020. Available online: https://wiki.cancerimagingarchive.net/pages/viewpage.action?pageId=52758026 (accessed on 21 October 2022).
  31. Kalpathy-Cramer, J.; Napel, S.; Goldgof, D.; Zhao, B. QIN multi-site collection of Lung CT data with nodule segmentations. Cancer Imaging Arch. 2015, 10, K9. [Google Scholar]
  32. Wei, S.; Wu, W.; Jeon, G.; Ahmad, A.; Yang, X. Improving resolution of medical images with deep dense convolutional neural network. Concurr. Comput. Pract. Exp. 2020, 32, e5084. [Google Scholar] [CrossRef]
  33. Wang, Z.; Bovik, A.C.; Sheikh, H.R.; Simoncelli, E.P. Image quality assessment: From error visibility to structural similarity. IEEE Trans. Image Process. 2004, 13, 600–612. [Google Scholar] [CrossRef] [PubMed]
  34. Georgescu, M.I.; Ionescu, R.T.; Miron, A.I.; Savencu, O.; Ristea, N.C.; Verga, N.; Khan, F.S. Multimodal Multi-Head Convolutional Attention with Various Kernel Sizes for Medical Image Super-Resolution. arXiv 2022, arXiv:2204.04218. [Google Scholar]
  35. Kingma, D.P.; Ba, J. Adam: A method for stochastic optimization. arXiv 2014, arXiv:1412.6980. [Google Scholar]
  36. Dong, C.; Loy, C.C.; Tang, X. Accelerating the super-resolution convolutional neural network. In Proceedings of the European Conference on Computer Vision, Amsterdam, The Netherlands, 8–16 October 2016; Springer: Berlin/Heidelberg, Germany, 2016; pp. 391–407. [Google Scholar]
  37. Zhang, Y.; Tian, Y.; Kong, Y.; Zhong, B.; Fu, Y. Residual dense network for image super-resolution. In Proceedings of the IEEE Conference on Computer Vision and Pattern Recognition, Salt Lake City, UT, USA, 18–22 June 2018; pp. 2472–2481. [Google Scholar]
  38. Kumar, S.; Gupta, S.K.; Kumar, V.; Kumar, M.; Chaube, M.K.; Naik, N.S. Ensemble multimodal deep learning for early diagnosis and accurate classification of COVID-19. Comput. Electr. Eng. 2022, 103, 108396. [Google Scholar] [CrossRef] [PubMed]
Figure 1. Framework of the proposed GAMA for medical image super-resolution.
Electronics 11 03554 g001
Figure 2. Architecture of the proposed LAFE module.
Electronics 11 03554 g002
Figure 3. Architecture of the proposed CSAR module.
Electronics 11 03554 g003
Figure 4. Architecture of the GF module.
Electronics 11 03554 g004
Figure 5. Qualitative comparison of the proposed model with other state-of-the-art methods at ×4 super-resolution based on CT and MRI images.
Electronics 11 03554 g005
Figure 6. Qualitative comparison of ablation study at × 2 super-resolution CT images.
Electronics 11 03554 g006
Table 1. Comparative results on the LDCT Part_A, LDCT Part_B [30], QIN LUNG CT [31], and MRI13 [32] datasets. The best results are highlighted in bold.
AlgorithmScaleLDCT Part_ALDCT Part_BQIN LUNG CTMRI13
PSNRSSIMPSNRSSIMPSNRSSIMPSNRSSIM
SRCNN [7] × 2 43.790.982233.820.948834.200.935239.320.9716
FSRCNN [36] × 2 44.140.983734.390.950235.650.936241.320.9769
SRGAN [12] × 2 39.800.965232.920.946327.550.842633.430.9671
RDN [37] × 2 44.530.984135.050.950837.150.940141.720.9785
SRFBN [8] × 2 47.320.987835.410.952338.490.980042.010.9828
FAWDN [16] × 2 47.110.987734.780.951839.070.981743.590.9851
GMFN [9] × 2 48.660.988635.420.952938.580.980242.490.9836
GAMA (Ours) × 2 48.730.988735.900.955042.350.983543.080.9844
SRCNN [7] × 3 39.120.963329.860.807231.850.857833.570.9255
FSRCNN [36] × 3 38.870.962330.190.811632.280.861234.850.9357
SRGAN [12] × 3 --------
RDN [37] × 3 44.700.966831.790.885333.240.891134.980.9381
SRFBN [8] × 3 44.160.980431.750.884334.550.951235.460.9420
FAWDN [16] × 3 43.300.979230.970.879733.730.949836.730.9479
GMFN [9] × 3 44.800.963031.840.885634.550.951635.980.9443
GAMA (Ours) × 3 45.250.981432.080.888636.690.958136.240.9454
SRCNN [7] × 4 36.630.946528.460.833727.480.838130.440.8774
FSRCNN [36] × 4 37.060.936328.490.821527.550.866831.430.8924
SRGAN [12] × 4 35.990.930827.920.830624.440.809728.150.8488
RDN [37] × 4 40.780.954629.830.834630.430.846231.910.8974
SRFBN [8] × 4 41.050.971430.060.839831.780.922632.200.8981
FAWDN [16] × 4 40.590.970328.900.829530.600.918033.210.9086
GMFN [9] × 4 42.550.974830.020.838631.700.923732.580.9022
GAMA (Ours) × 4 43.160.975830.340.843633.950.936332.840.9043
Table 2. Ablation analysis of the key components in the proposed model. (The best results are highlighted in bold).
ComponentsPSNRSSIM
(a) baseline48.660.9886
(b) baseline + LAFE48.670.9887
(c) baseline + CSAR48.680.9887
(d) baseline + LAEF + CSAR48.710.9887
(e) baseline + LAFE + L GV 48.730.9887
(f) baseline + CSAR + L GV 48.700.9987
(g) baseline + LAFE + CSAR + L GV (Ours)48.750.9887
Publisher’s Note: MDPI stays neutral with regard to jurisdictional claims in published maps and institutional affiliations.

