Article

A Hybrid Data Analytics Framework with Sentiment Convergence and Multi-Feature Fusion for Stock Trend Prediction

by
Mohammad Kamel Daradkeh
1,2
1
Department of Information Technology, University of Dubai, Dubai 14143, United Arab Emirates
2
Department of Information Technology, Yarmouk University, Irbid 21163, Jordan
Electronics 2022, 11(2), 250; https://doi.org/10.3390/electronics11020250
Submission received: 16 November 2021 / Revised: 14 December 2021 / Accepted: 21 December 2021 / Published: 13 January 2022
(This article belongs to the Special Issue Big Data Analytics Using Artificial Intelligence)

Abstract

:
Stock market analysis plays an indispensable role in gaining knowledge about the stock market, developing trading strategies, and determining the intrinsic value of stocks. Nevertheless, predicting stock trends remains extremely difficult due to a variety of influencing factors, volatile market news, and sentiments. In this study, we present a hybrid data analytics framework that integrates convolutional neural networks and bidirectional long short-term memory (CNN-BiLSTM) to evaluate the impact of convergence of news events and sentiment trends with quantitative financial data on predicting stock trends. We evaluated the proposed framework using two case studies from the real estate and communications sectors based on data collected from the Dubai Financial Market (DFM) between 1 January 2020 and 1 December 2021. The results show that combining news events and sentiment trends with quantitative financial data improves the accuracy of predicting stock trends. Compared to benchmarked machine learning models, CNN-BiLSTM offers an improvement of 11.6% in real estate and 25.6% in communications when news events and sentiment trends are combined. This study provides several theoretical and practical implications for further research on contextual factors that influence the prediction and analysis of stock trends.

1. Introduction

Financial stock markets have an immense impact on the world economy as well as on financial and social organizations. The stock market, also called the securities market, comprises an aggregated methodology for the purchase and sale of various shares at the public or private level [1]. While financial markets are associated with colossal gains, big gains also carry risks that can lead to misfortune. This makes stock market prediction an interesting but difficult endeavor, as it is extremely difficult to predict stock markets with high accuracy due to high instability, random fluctuations, anomalies, and turbulence. Typically, stock market intelligence involves analyzing stock-related data to predict stock value fluctuations based on time series data, i.e., a chronological compilation of relevant observations, such as daily sales figures and prices of stocks. Verifiable time series data from financial stock exchanges provide detailed information about a particular stock during given stock market cycle [2]. This temporal data includes opening and closing prices, highs and lows, and the volume of stocks traded during a particular time period. Fundamental and technical analysis techniques typically rely on quantitative stock data such as stock costs, volumes, and portfolios, as well as subjective data about the companies involved, their profiles, and their trading strategies [3].
The extant research on stock trend prediction has largely focused on the application of various econometric-based methods to predict stock trends based on structured and linear historical data, mainly using linear regression and parameter estimation techniques [4,5,6,7]. However, stock price fluctuations are influenced not only by historical stock trading data, but also by nonlinear factors such as political factors, investment psychology, and unexpected events. In practice, the unstructured nature of news events and their lack of linearity and consistency have rendered traditional quantitative investment analysis methods ineffective. As technology has advanced, media news has become an important signal that captures the nonlinear factors that influence stock price performance, thereby improving the accuracy of stock price forecasting. Recent studies have suggested that media news and related sentiments can influence corporate and investor behavior as well as stock market performance [8]. Similarly, stock market trends are influenced by various events such as political influences, information security events [9,10], specific news or announcements [2], and national politics [11]. With the proliferation of stock market events, financial news, and investor decisions, it is imperative to understand how these events and sentiments influence stock market trends.
Although stock price movements are stochastic and generally involve non-random events, they can still be predicted by analyzing investor behavior and trading patterns [12,13,14]. While econometrics-based statistical methods can rely on tentative premises, machine learning methods pose challenges due to limited interpretability, the need for manual feature selection, and the problem of overfitting. To address these issues, deep learning methods based on conventional neural networks (CNNs) and Recurrent Neural Networks (RNNs) have been used for predicting stock market trends [15,16,17]. By extracting the underlying features of highly unstructured data, such deep learning prediction techniques can be used to explore the complex inherent patterns of stock price movements based on time series data. CNNs and RNNs generally integrate the concept of time into the network structure and are inherently suited for processing time series data. However, neural network methods encounter the problem that the gradient disappears when the sequence of input time series data becomes too long. To solve this problem, the long short-term memory (LSTM) model has been proposed as an improved version of RNN. Recent studies have shown that the LSTM outperforms the RNN and conventional machine learning algorithms such as random forest (RF), support vector machine (SVM), and decision tree (DT) in addressing stock prediction problems based on time series data [4,18,19,20,21,22].
Recently, researchers have applied deep learning techniques to stock prediction using LSTMs or modified LSTMs such as PSOLSTM, Stacked LSTM, and Time-Weighted LSTM [2,6,23,24]. Stock prediction models based on LSTMs analyze the sentiment polarity of textual information as well as the sentiment polarity of media news with historical trading data as input. Nevertheless, there are a number of research problems that need to be addressed to improve stock trend prediction and performance using both quantitative and qualitative stock-related data:
  • First, while quantitative stock data can provide insight into the performance of the respective stocks, many other factors also play a crucial role in this context. Various country-specific factors such as political events, corporate politics, splits and mergers of different companies as well as global events can have a strong impact on the stock market. However, identifying such events and their linkages to investors investing in the stock market is a challenging task. Such events do have a major impact on the stock market; thus, incorporating them into stock analysis and identifying their correlation with stock performance can greatly contribute to improving stock forecasts;
  • Second, in addition to fluctuations resulting from a variety of events, nonlinear stock markets are also affected by the sentiment associated with these events, which can directly or indirectly affect price movements [25]. For example, using historical stock market data to predict performance at a given point in time can provide clues to the impact of public sentiment. However, it is unclear how unstructured news data can be merged with organized stock market information. Typically, sentiment data from news texts are combined with verifiable stock market information and company financial data to contribute to stock metrics [26,27,28]. However, this method easily loses the sentiment data in the high-dimensional financial data. Stock prediction methods with additional sentiment aspects have been shown to be even less accurate than those without. It is expected that merging these data sources (factors) into a single intelligence would improve the prediction accuracy in the stock market. However, it is challenging to integrate the information from different data sources into one dataset for market analysis because they have different formats (numeric or text);
  • Third, while there are multiple approaches to both machine learning and deep learning, recent studies show that hybrid methods can be used to overcome inherent limitations of isolated approaches, e.g., the vanishing gradient problem in RNN can be largely avoided by deep feed-forward networks. Therefore, the effectiveness of predictive models can be improved by integrating complementary techniques. According to Alotaibi [29], financial markets are inherently non-stationary, non-linear and chaotic. In a volatile stock market, determining inherent patterns requires appropriate data representation. Therefore, due to the adaptability of DNNs and LSTMs for nonlinear financial markets, we propose the integration of DNNs and BiLSTMs with stock market data and evaluate their suitability to provide deeper insights and improve the performance of stock market forecasts.
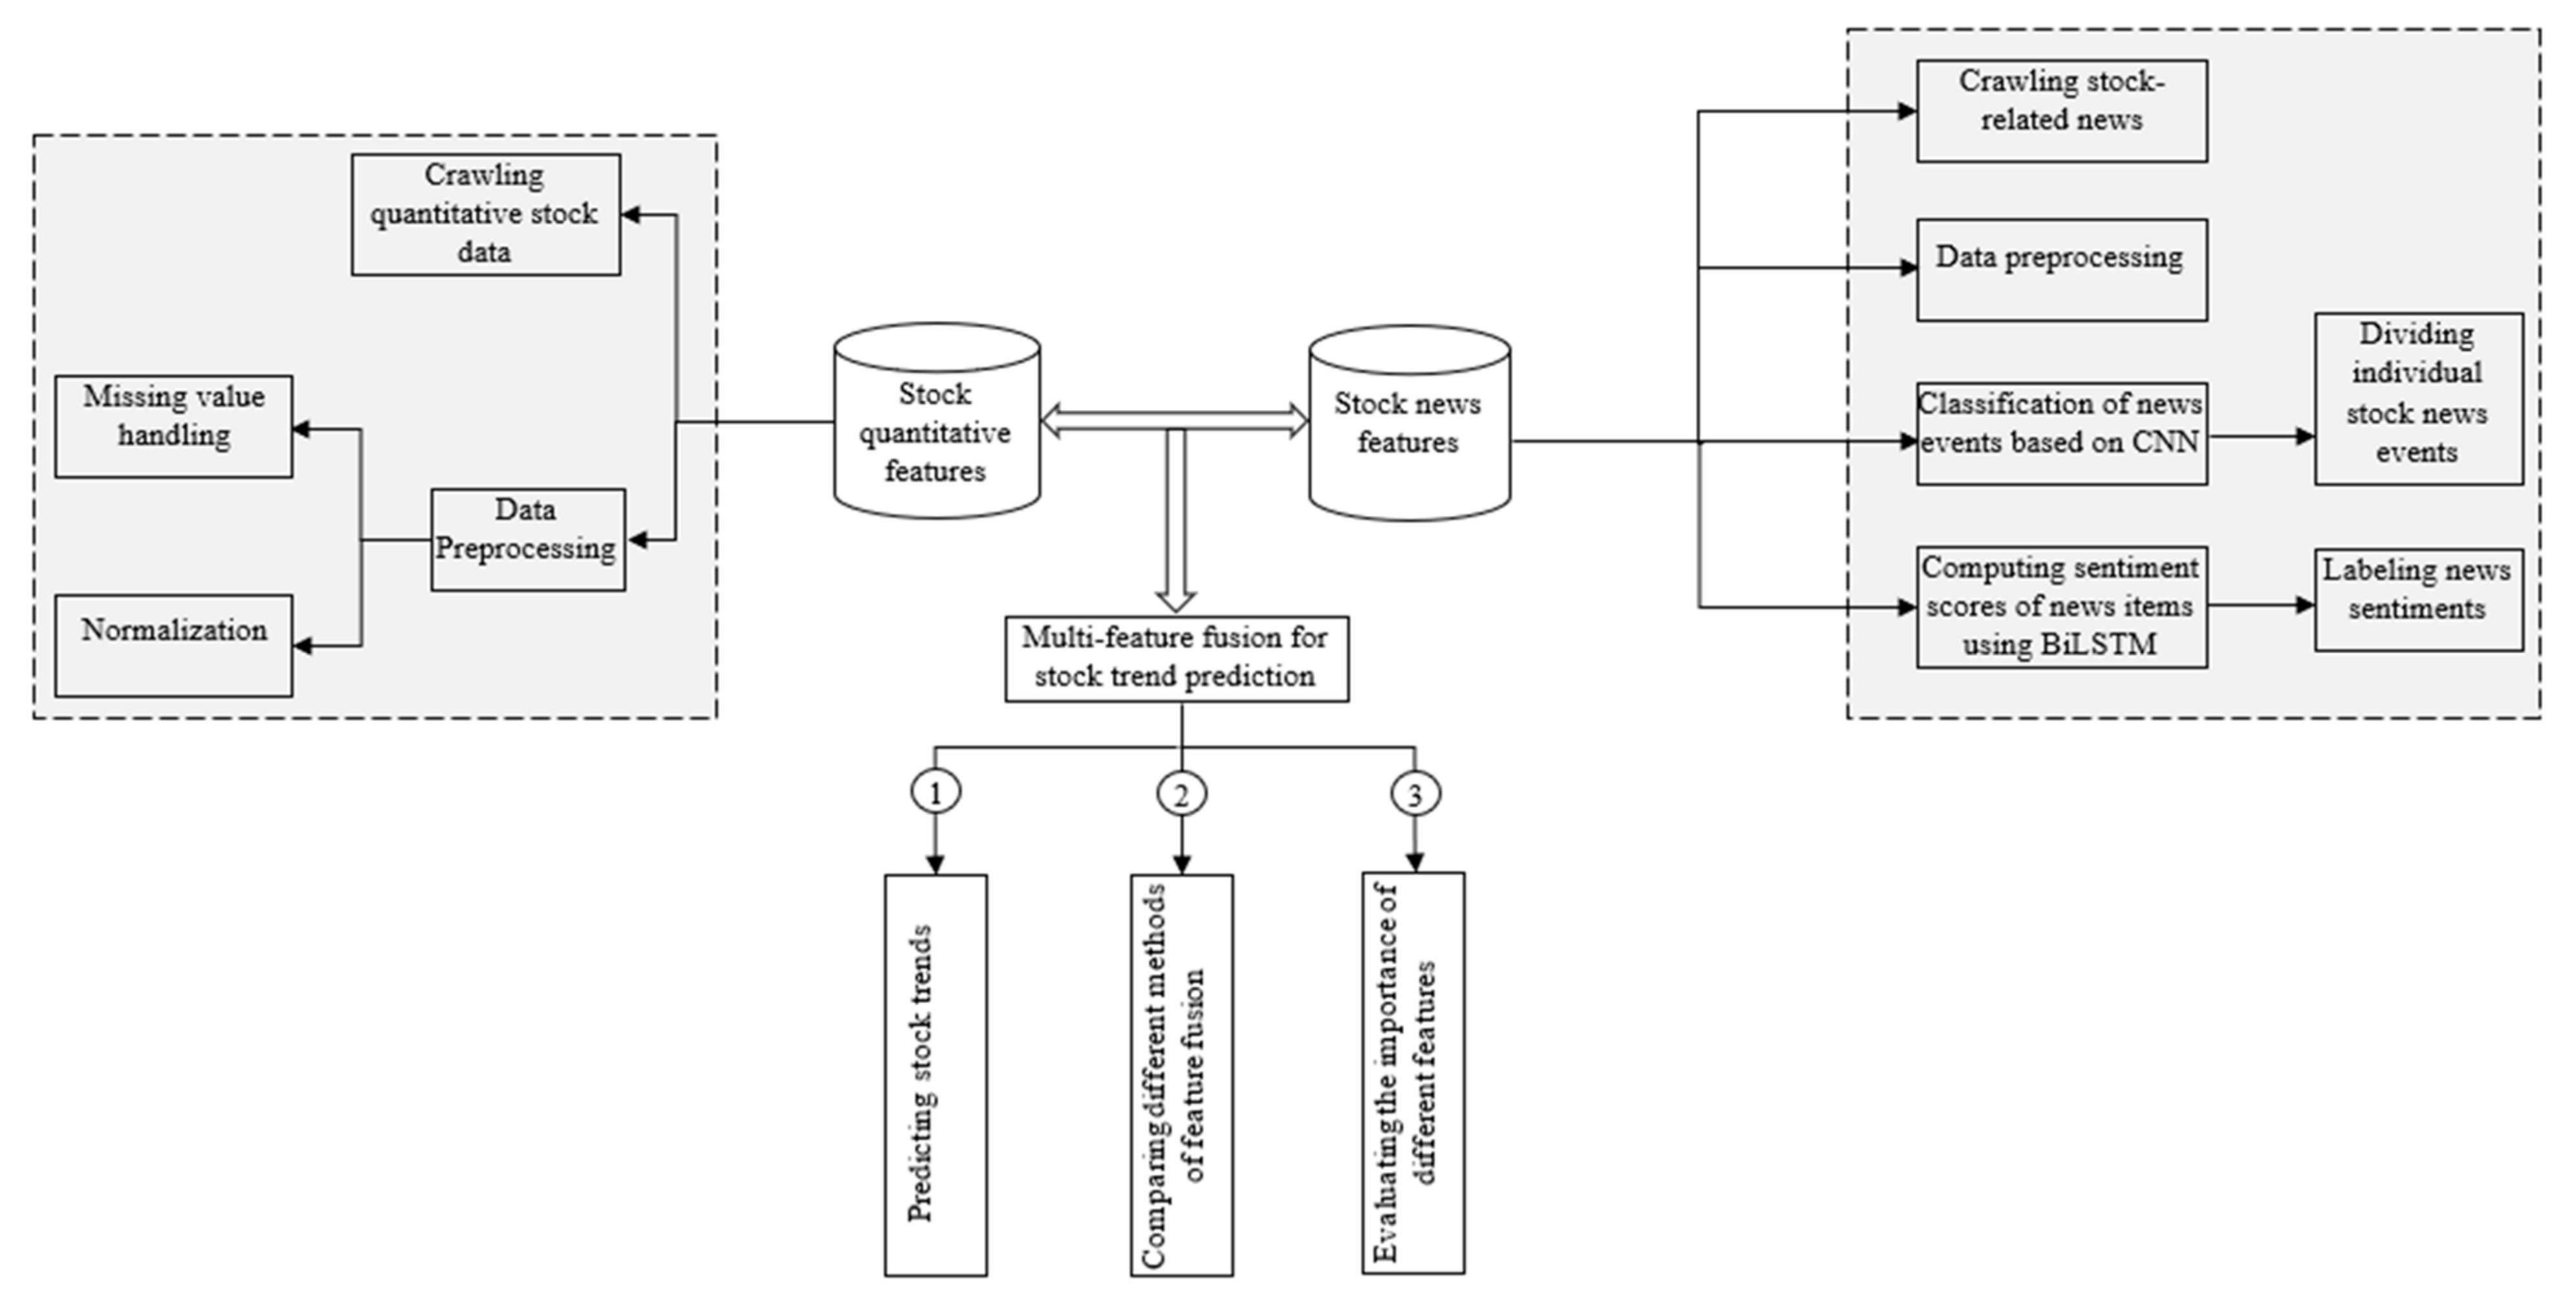
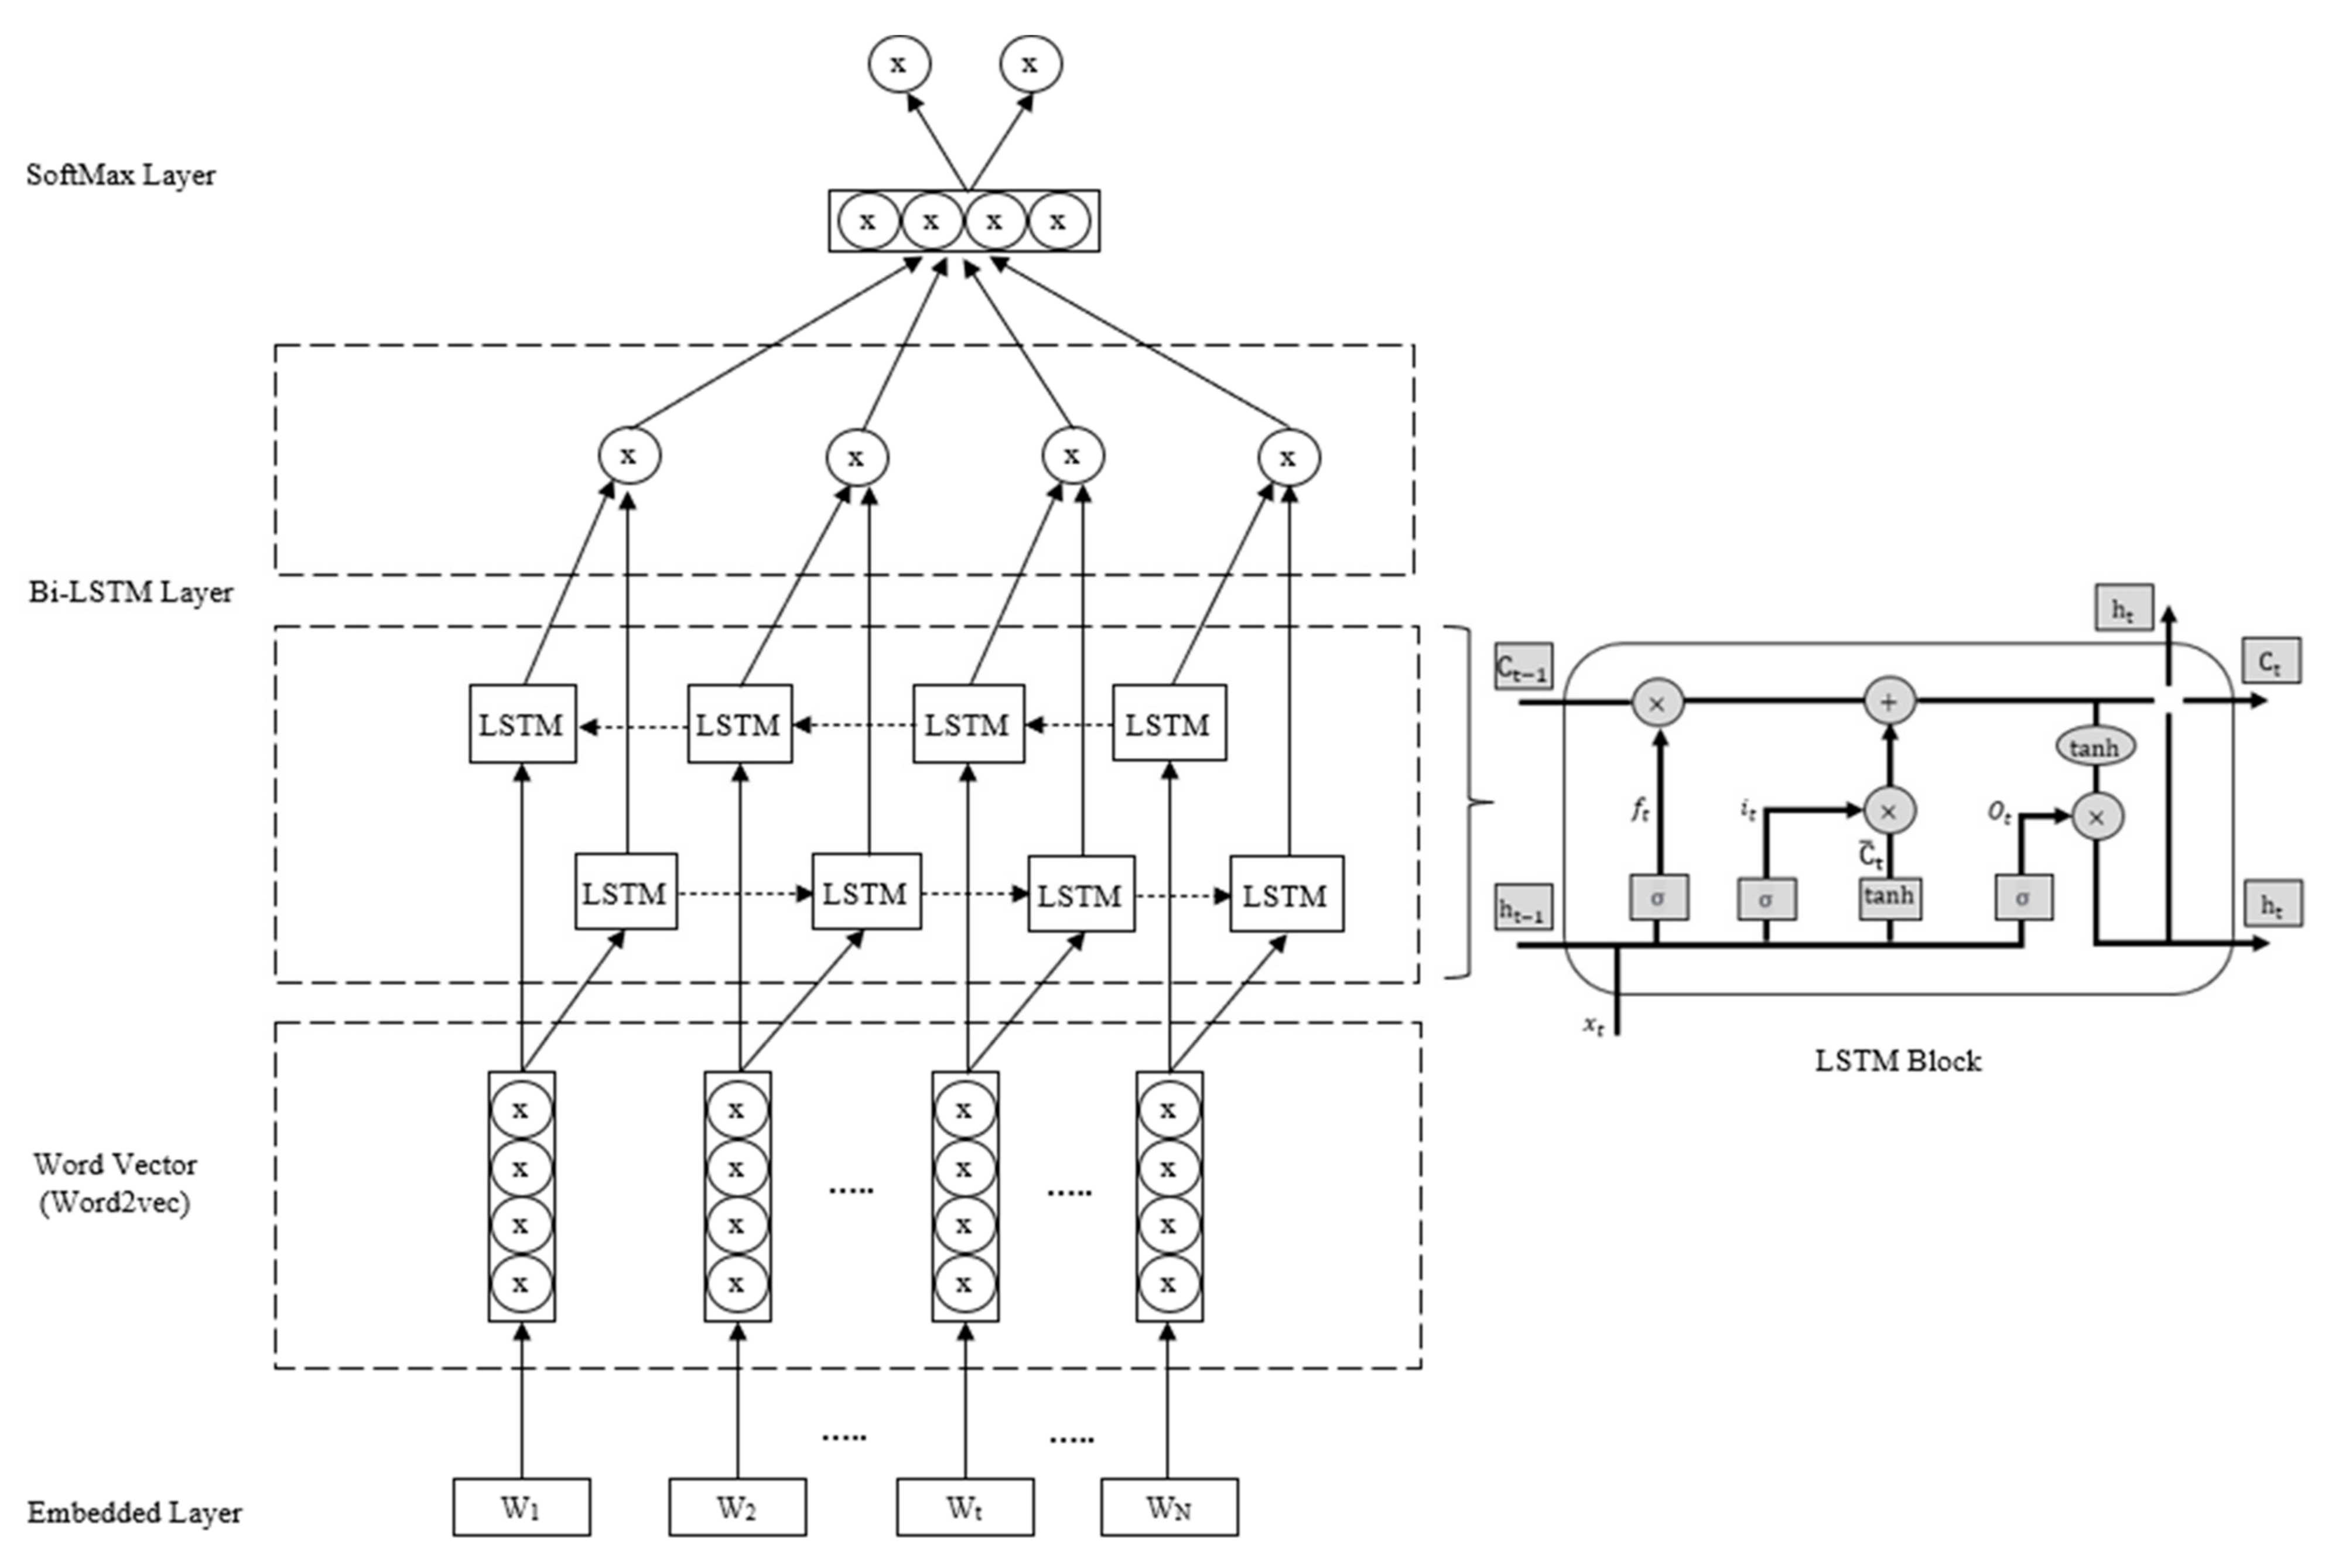
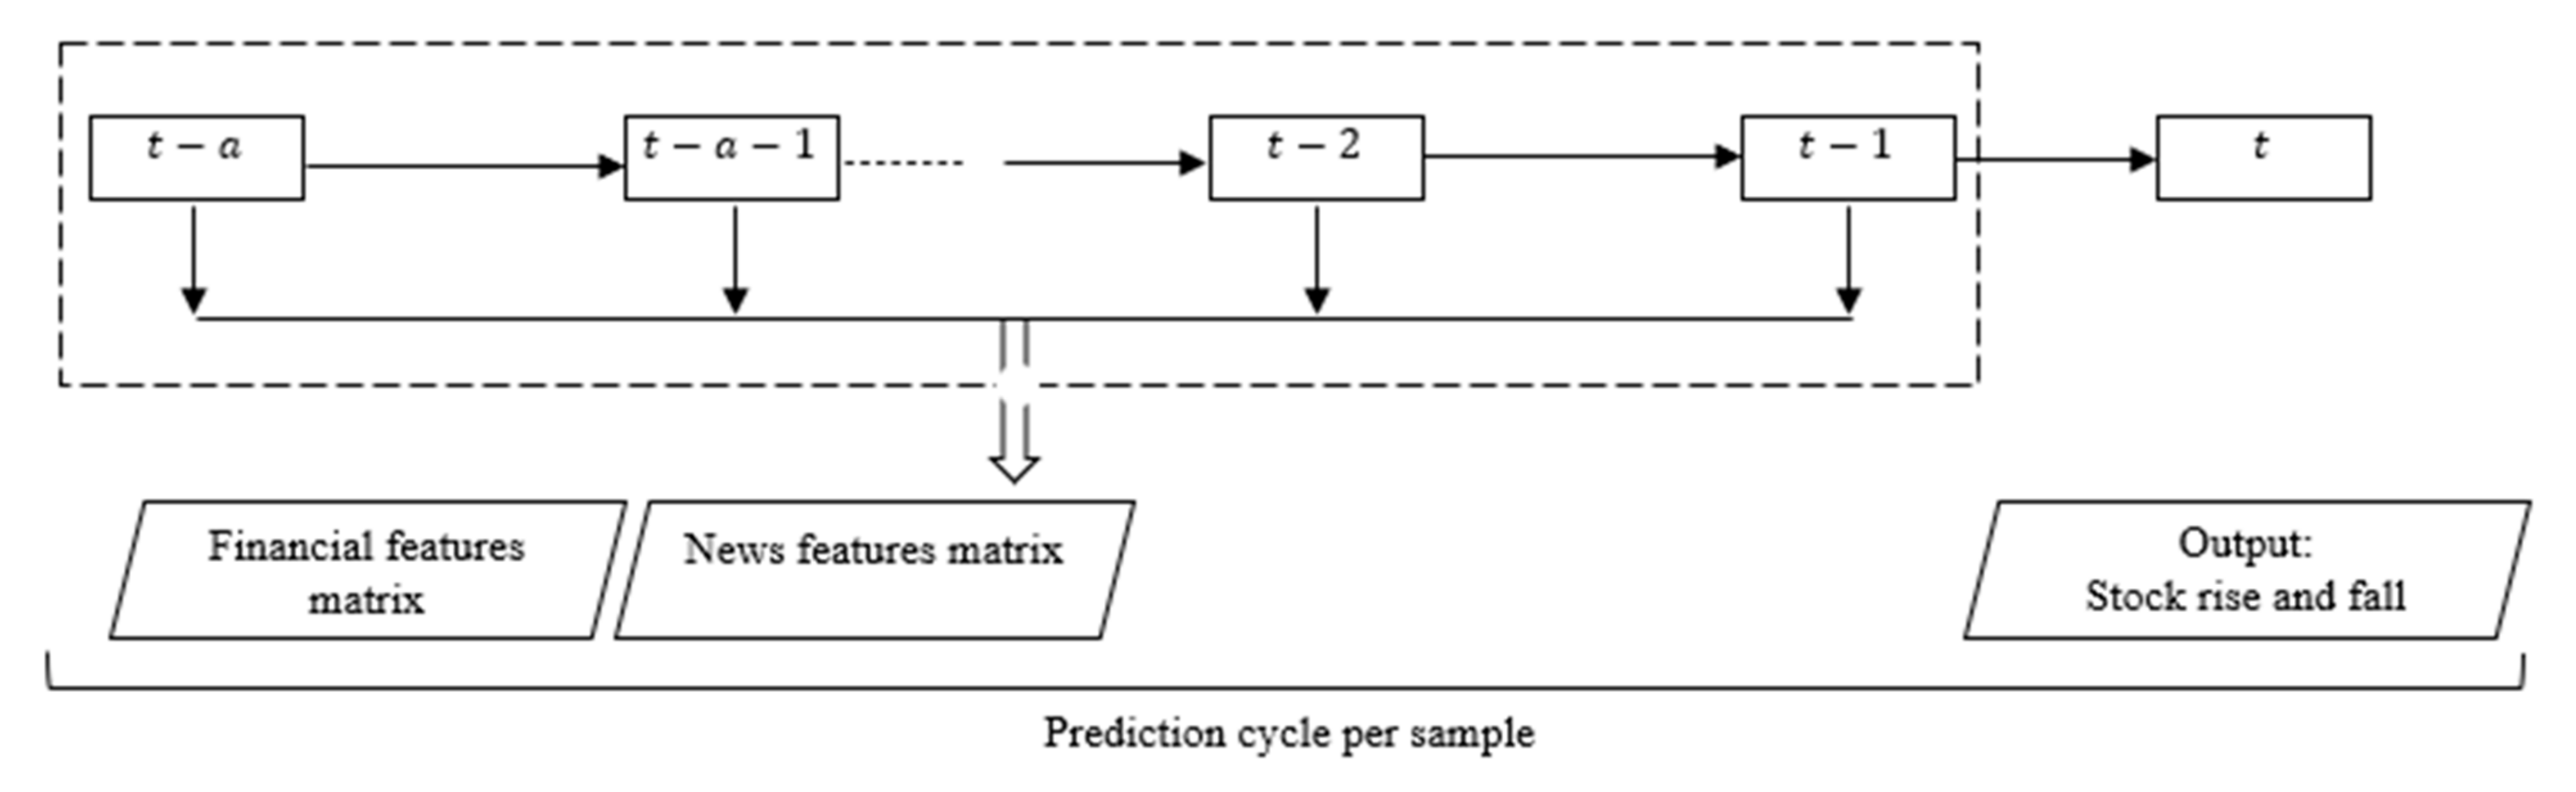
To address the above three research challenges, this study presents a hybrid data analytics framework that integrates convolutional neural networks and bidirectional long short-term memory (CNN-BiLSTM) to evaluate the impact of the convergence of news events and sentiment trends with quantitative financial data on predicting stock trends. CNN is a powerful tool for extracting event features from news text, while BiLSTM uses two LSTM networks to obtain forward and backward contextual information, which is more suitable for discriminating sentiment polarity given context and can improve sentiment analysis compared to a single LSTM [11,15,24]. In this study, we used CNN and BiLSTM because these two techniques allow us to create detailed input features based on the fact that CNN can detect relevant internal structures in time series data through convolution and pooling operations [3]. Moreover, CNN and BiLSTM algorithms have been shown to be more accurate and more resistant to perturbation than state-of-the-art methods in classifying time series data [24,30,31]. CNN and BiLSTM algorithms are therefore able to learn relationships within time series without requiring large amounts of historical time series data. Similarly, BiLSTM and CNN have already been shown to provide highly accurate results for text mining tasks that require sequential modeling information [7]. Moreover, their implementation requires less time and effort [25]. The proposed model uses objective financial events extracted from news reports, such as surcharge events, stock prices and suspension events, on the one hand; on the other hand, BiLSTM is used to analyze the sentiment polarity of news reports and calculate the sentiment values of news texts. The features of stock news, including the types of news events and sentiment values, together with the numerical financial features of the stock are used as input to the LSTM network, and the historical stock information is used to predict the future rise and fall of the stock.
The main contributions of this study are as follows:
  • A hybrid data analytics predictive framework built on CNN and BiLSTM deep learning algorithms that combines heterogeneous stock price indicators (various categories of news events, user sentiments, historical macroeconomic variables, and historical stock price data) to predict future stock price movements. Therefore, this study demonstrates that traditional quantitative analysis techniques combined with investor and expert opinions (fundamental analysis) provide more accurate predictions of stock performance;
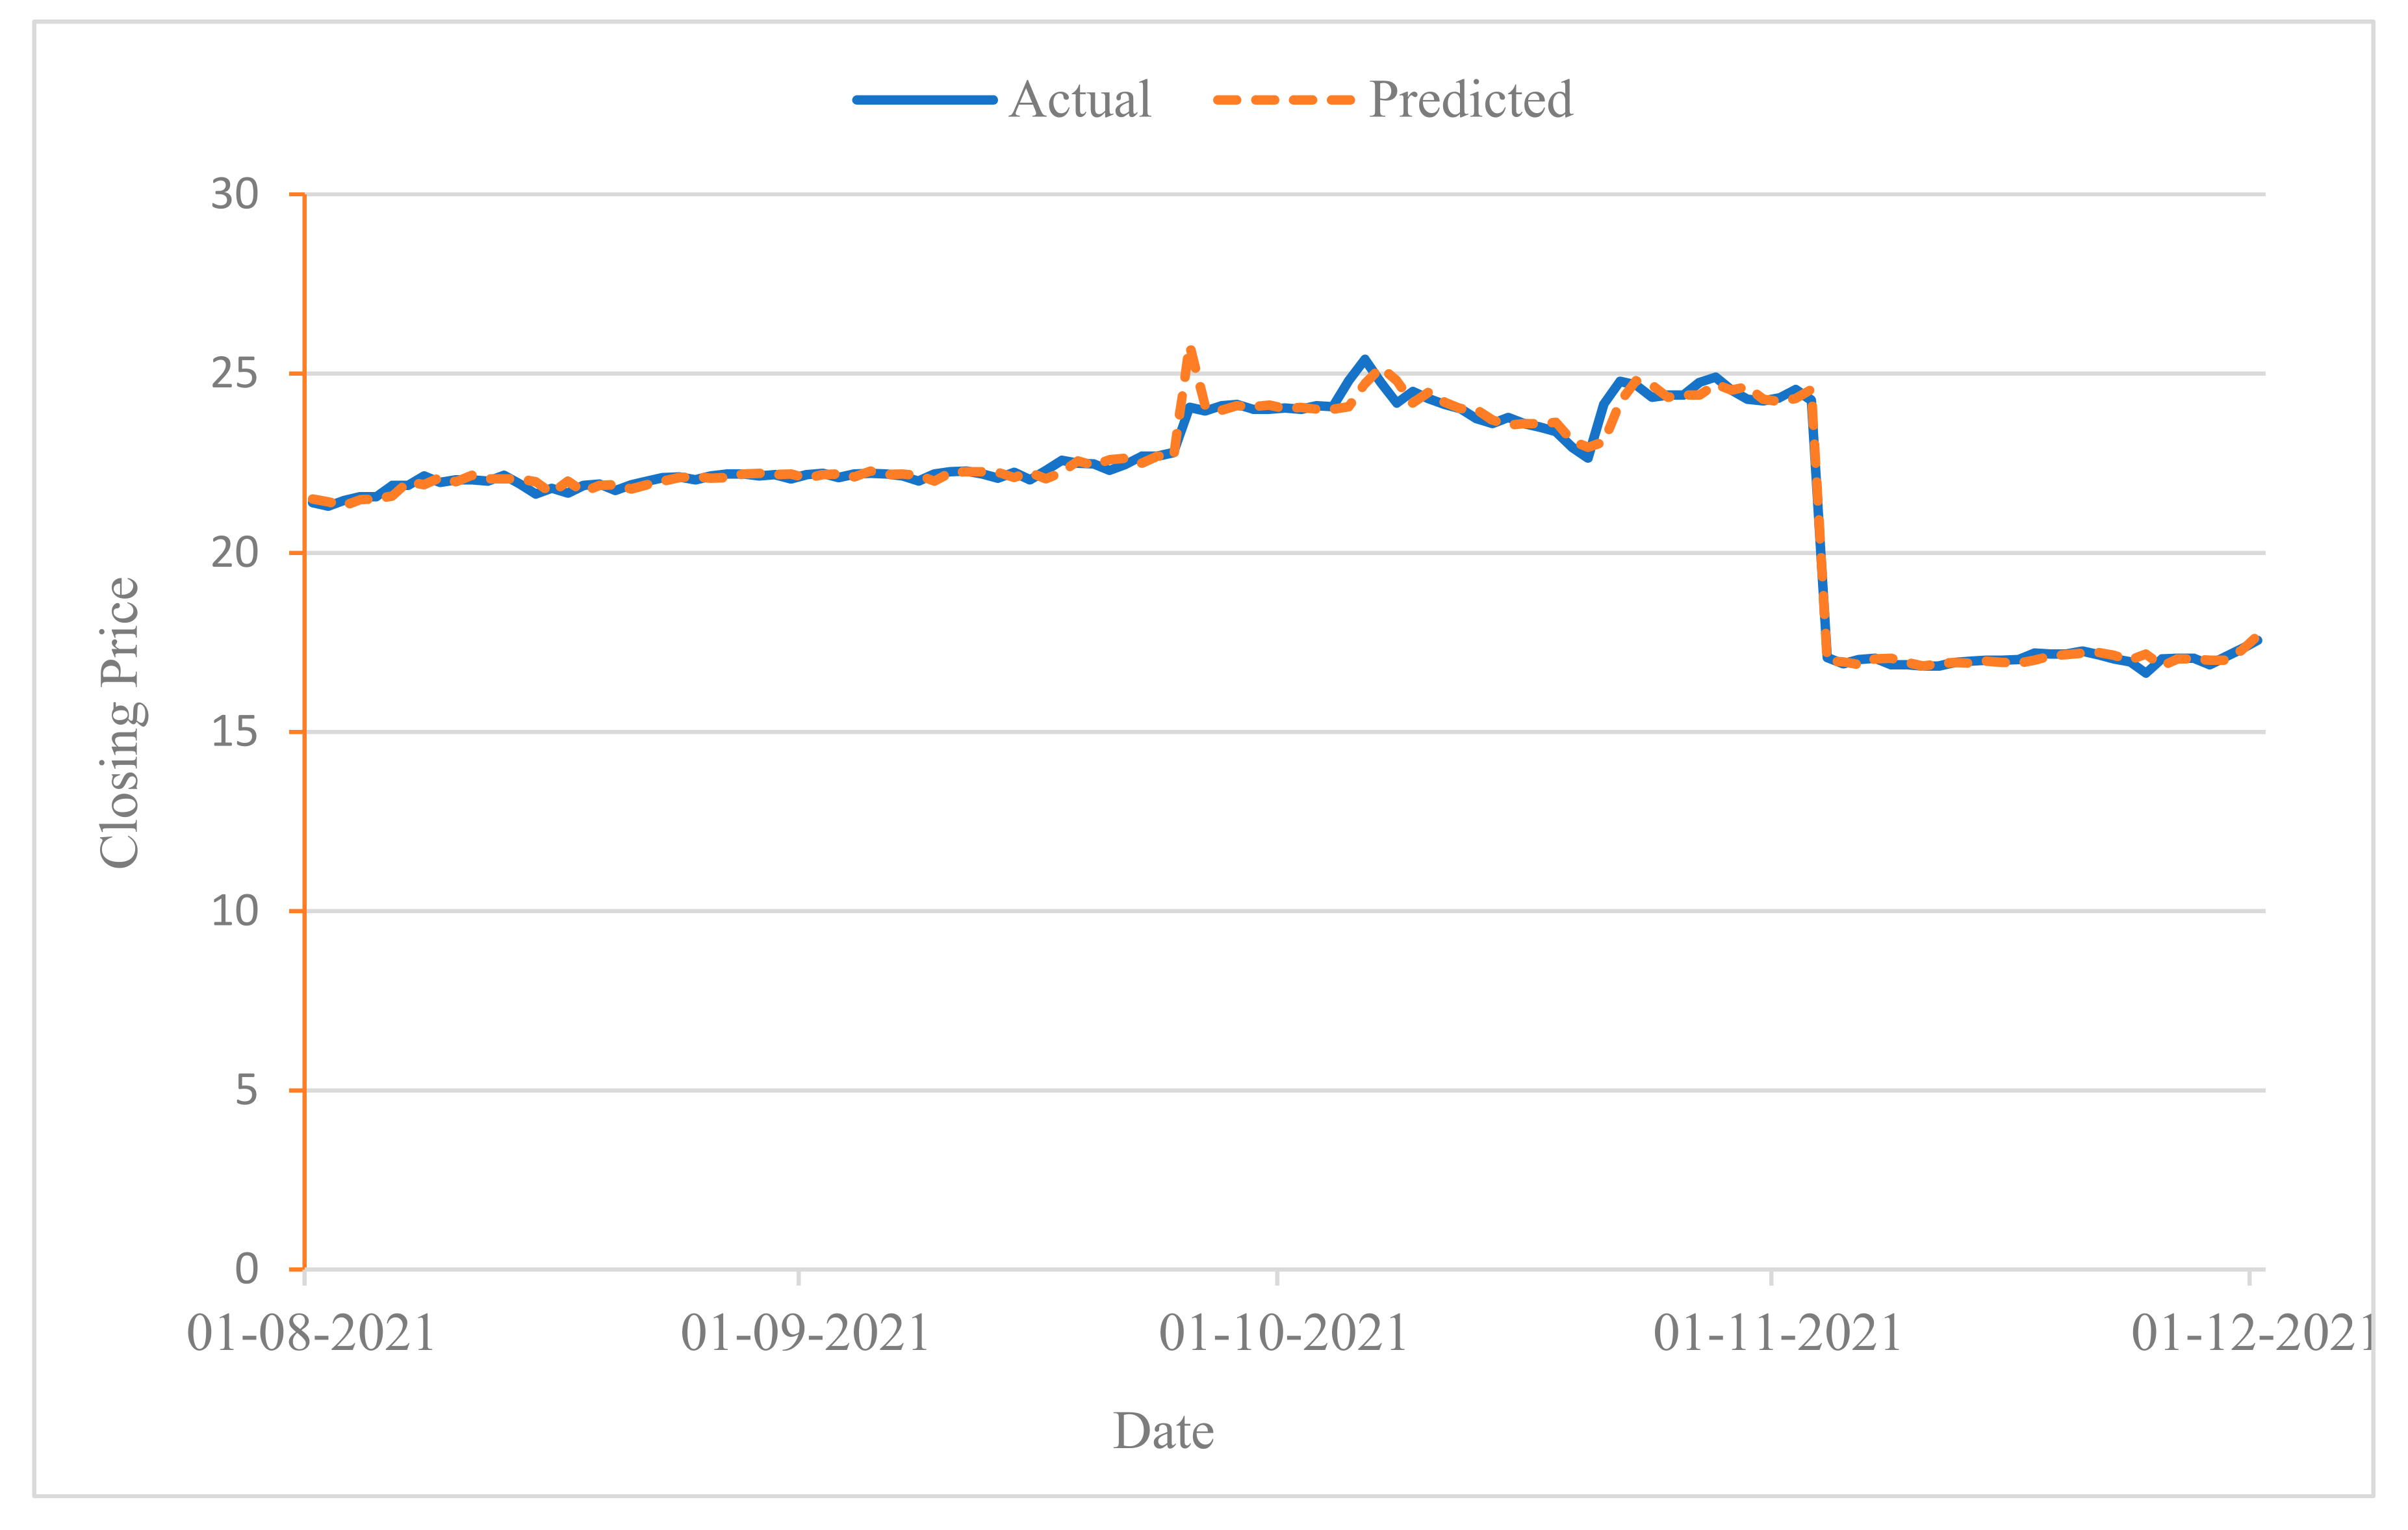
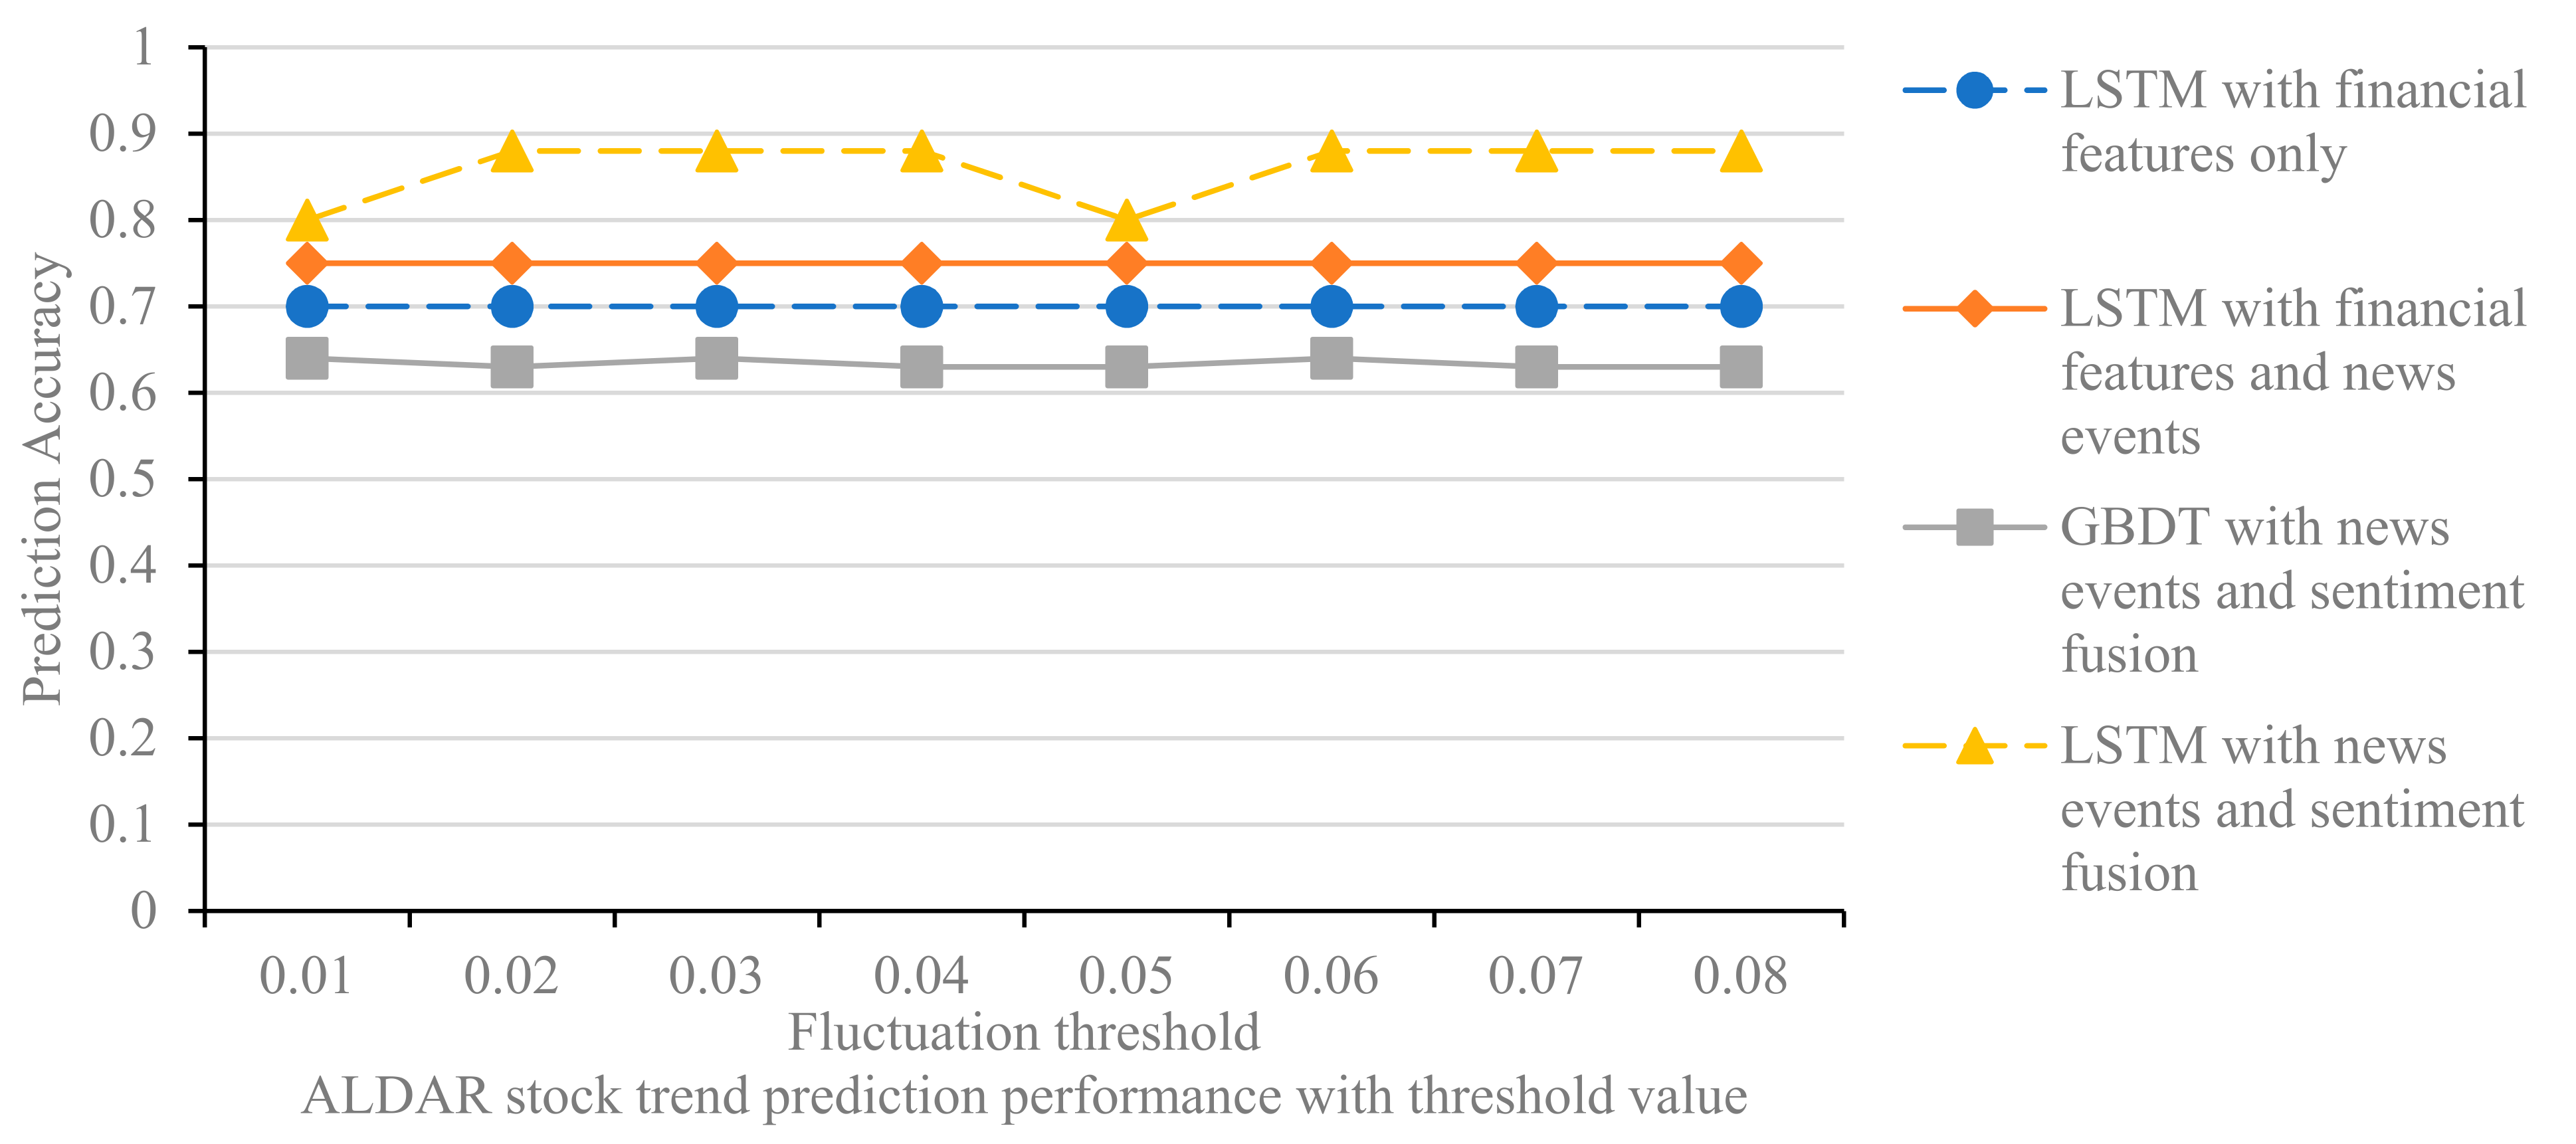
  • We experimentally investigated the effectiveness of the proposed framework with real stock data from the Dubai Financial Market (DFM) using two case studies from the real estate and communications sectors. We provide a comparative analysis of our approach with three basic techniques to investigate the importance of features and sentiment fusion in improving the prediction performance of stock trends. The results show that the prediction performance of machine learning models can be significantly improved by combining different stock-related information;
  • Since the stock market data were collected during the COVID-19 pandemic, the results of this study provide valid arguments to show how news events, and thus the stock market, can be affected by pandemic data. Analysis of news events during the COVID-19 pandemic, as well as the emotional state of the public through analysis of news events, can reveal the economic impact of COVID-19 on stock markets. These insights can then lead to accurate stock market forecasts. Given the recent advances in AI algorithms and the enormous amount of information about the pandemic, this study synthesizes the market data and trains a classifier to predict the direction of the next stock market movement.
The remainder of this paper is organized as follows. Section 2 reviews the current and relevant literature on stock market analysis and forecasting. Section 3 describes the techniques and methods used in this study to integrate stock-related data and analyze their impact on stock market prediction. Section 4 presents the experimental design and case study description used to evaluate the applicability of the proposed model. Section 5 reports the empirical results of this study and discusses its implications for research and practice. Finally, Section 6 presents the conclusions of this work and suggests possible avenues for future research.

2. Literature Review

Stock market prediction is an important research topic that has attracted considerable interest from both researchers and investors. Previous research on stock market prediction can be broadly divided into two main categories: econometrics-based statistical methods, which involve the analysis of time series financial data; and computational intelligence-based techniques, which incorporate both quantitative stock data and textual information [2,3,25].
Econometrics-based statistical analysis relies mainly on historical trading data, corporate financial data, and macro data to identify and describe patterns of change in stock data over time and predict future stock trends [30,32,33]. Several machine learning algorithms were used to detect patterns in the large amount of financial information, including support vector machines (SVM), artificial neural networks (ANN), Parsimonious Bayes, and Random Forest [24,34]. Jiang, Liu [35] showed that machine learning can be used to predict the future performance of individual stocks using historical stock data. Kim, Ku [36] used SVM to predict the rise and fall of individual stocks and verified the effectiveness of SVM in classifying the rise and fall of individual stocks through empirical analysis. Lahmiri [37] compared the performance of ANN and SVM in predicting stock movements and found that ANN outperformed SVM in terms of prediction accuracy, and feedforward ANN has been widely used due to its ability to predict both upward and downward movements of stocks as well as stock prices [38].
However, since stock prices are inherently unpredictable in the short term, using historical trading data to analyze stock prices has its limitations and cannot further improve the prediction results. Behavioral economics theory states that investors are susceptible to personal and social emotions in complex and uncertain decision problems [18]. The main cause of stock price changes is the reaction to new information, and news in the media can be useful as exogenous sources of information for short-term stock price prediction [13,19]. With advances in text analytics and the increasing prevalence of social media, blogs, and user-shared news, incorporating text content into stock market research has become an interesting topic. The combination of news events and social media messages to improve the predictive accuracy of forecasting models has led to the importance of developing appropriate techniques to analyze their impact on the market. In recent years, there has been an increase in the number of studies investigating the combined effect of a user’s social media sentiment and web news on stock price performance. For example, Zhang, Li [39] reported a high correlation between stock price performance and public sentiment, with predictive accuracy ranging from 55% to 63%. They also proposed an extended coupled hidden Markov method to predict stock prices based on Internet news and historical stock data. Ref. [40] proposed a multi-source multi-instance learning system based on three different data sources and found that the accuracy increased when using multiple data sources compared to single sources.
With the advancement of deep learning techniques and applications, more attention has been paid to neural network-based learning models for stock price prediction that incorporate both quantitative stock data and news data. Hiransha, Gopalakrishnan [41] presented four types of deep learning architectures, i.e., multilayer perceptron (MLP), recurrent neural networks (RNN), long short-term memory (LSTM), and convolutional neural networks (CNN) for predicting a company’s stock price based on available historical prices. Similarly, Nabipour, Nayyeri [20] employed RNN and LSTM to investigate whether news about stock prices and the associated sentiment polarity affect stock prices. In their study, they found that LSTM showed more accurate results with the highest model fit. They also reported that the prediction accuracy can be improved when both stock-related news texts and tweets are counted and used as input for stock price prediction. Nasir, Shaukat [42] analyzed Dow Jones index prices based on user sentiment recorded on Twitter and showed that sentiment signals embedded in news are a reliable predictor of stock prices. Polamuri, Srinivas [43] used an RNN model with gated recurrent units to predict stock movements and fused numerical features of stock prices to examine the sentiment polarity of financial news on Twitter. Similarly, Priya, Revadi [26] used CNN and RNN to study the stock trend model that includes both news headlines and technical indicators, and showed that news headlines improve prediction accuracy more than news content. Shobana and Umamaheswari [44] examined the effects of stock market signals embedded in news websites, stock bars, blogs, and other media information and found that investors responded faster and more strongly to positive sentiment.
Recently, hybrid deep learning methods have been proposed to improve the prediction performance of stock market trends. Srivastava, Zhang [45] developed a hybrid model called RCNN, which combines RNN and CNN by exploiting the advantages of both models. Their experiments showed that the combined hybrid system had a positive impact on the performance of the model when text data and technical indicators were used as input data, and the proposed model performed better than the CNN model. Another hybrid model called RNN-boost was applied to predict stock volatility [35]. It extracts LDA and sentiment features from social media data and combines them with stock technical indicators. The proposed model combines RNN and Adaboost to achieve an overall average accuracy of 66.54% [41]. The RNN model uses gated recursive units (GRUs) to predict stock prices. A combination of three forecasting models, namely SVM, adaptive neuro-fuzzy inference system and artificial neural network (ANN), has been proposed for predicting stock prices using public opinion [46]. The proposed models were evaluated using the historical stock index of the Istanbul BIST 100 index and yielded good results. Nti, Adekoya [3] investigated the predictability of stock price movements in four countries based on sentiment in tweets and found a high correlation between stock prices and tweets.
Despite the increasing development and application of hybrid data analysis techniques based on neural network learning approaches for stock market analysis, current models incorporating quantitative stock data and news data largely consider the extraction of information sentiment polarities as a support rather than an integral part of stock trend prediction. Most previous studies have used Twitter and Twitter texts as a source of information data to better convey sentiment [2,5,10,14,20,21,47]. However, considering that news reflects perceived reality and sentiment polarity is usually fuzzy, improving predictive accuracy by highlighting opinions cannot be taken for granted. Arosemena, Pérez [30] proposed to use a latent dirichlet allocation (LDA) topic model to extract keywords from tweet texts, and then analyze the sentiment features of tweet texts based on keywords as input for stock prediction. Unlike previous studies, and considering that news events are more representative of the effects of media information on stock movements than news sentiment, this study uses a multi-feature fusion method that incorporates news events and sentiment convergence to extend the numerical features of stocks and further improve the accuracy of stock prediction.

3. Methodology

The main objective of this study is to improve the accuracy of stock market trend prediction by combining news events and sentiment patterns with quantitative financial data in a hybrid CNN-BiLSTM model. The proposed research methodology is shown in Figure 1. It includes five main steps: (1) the stock-related financial data and news are separately sifted and preprocessed to create the stock database and the news database; (2) the stock news are divided into stock events, and each news event is labeled with an event type; (3) a CNN classifier is developed and trained to classify the event type; (4) the news events are labeled with a sentiment, and a news sentiment classifier is developed using BiLSTM; and (5) the stock news features and stock price features trained in steps (3) and (4) are fed into the LSTM network to evaluate their fusion fitness for predicting the rise and fall of stock trends.

3.1. Extraction of Quantitative Stock Data Features

Previous research on stock market prediction has shown that various indicators such as a company’s price-earnings ratio, price–net ratio, and net cash flow can help predict the performance of individual stocks [6,10,16,17,19]. To obtain the numerical financial features of a stock, we select financial data (e.g., price-earnings ratio and price-net ratio), cash flow data (e.g., inflows and sales ratios), and stock information (e.g., opening and closing prices). In addition, due to their influence on share movements, the general market index and sector index of individual shares are also used as indicators of the financial value of the stocks.
The quantitative financial features for the stocks sampled were then pre-processed to eliminate missing values. For example, if an indicator’s data is missing for a particular day (e.g., during a trading pause), that day’s data is removed. Moreover, given the different type and scale of the various quantitative financial indicators, using the raw values of the indicators directly may cause indicators with higher values to dominate the training and weaken the impact of indicators with smaller values. Therefore, the quantitative financial data were normalized using the z-score to ensure comparability across indicator data. With X j = [ x 1 j , x 2 j , , x ij , , x nj ] as the vector consisting of the values of the j th financial indicator in T n days, and x ij as the value of the j th financial indicator on day i , each value in X j is normalized by the z score , as shown in Equation (1).
x ¯ ij = x ij μ j σ j
where μ j and σ j denote the mean and standard deviation of all values of the financial indicator X j . Table 1 illustrates the quantitative financial stock features composed of p stock indicators over T n days, where X 1 ~ X p denote the p financial features.

3.2. Extraction of News Events Features

Feature extraction of news events was performed to identify and extract objective financial events from news headlines. First, the headline data was preprocessed and the Natural Language Toolkit (NLTK) word tokenizer was used to tokenize words and remove stop words. At the same time, custom stop words and a financial lexicon were added to improve the accuracy of word tokenization. The custom financial lexicon includes common financial words, codes, and abbreviations of listed companies, as well as the names of executives of listed companies. The financial news items were categorized by objective events based on the keyword field of the news items in the Dubai Financial Market (DFM) news classification, resulting in a total of 82 news events. Table 2 shows a list of selected categories of news events and their descriptive terms.

3.3. Classification of News Events Based on CNN Model

To classify stock market news based on the 82 classified news events, we developed a CNN-based news classifier that includes an input layer, a convolution layer, a pooling layer, and a fully connected layer. The output of each layer is the input to the next layer [2,48]. First, the news headlines were trained using Word2Vec, and the resulting word vector matrix was used as the input to the convolutional layer. The convolution layer uses filters to convolve the word vector matrix of the headlines and generate the feature maps. The pooling layer takes samples from the feature maps and extracts the most important features in each feature map to pass to the fully connected layer. Finally, the fully connected layer obtains the final classification result of the headlines using the SoftMax function [12] and outputs the event type of the headlines. The daily news about a particular stock is counted by the CNN news classifier. For each news item input to the news classifier, a single event type is generated; therefore, the frequency of each event per day is counted to obtain the news feature matrix, as shown in Table 3. Here, N 1 ~ N p denote p news events, where p = 82 and n ij denotes the frequency of event feature N j on day T i .

3.4. Detection of News Text Sentiments

The news event describes an objective event, while the sentiment of a news text describes the contextual opinions about the news event, i.e., negative or positive. Therefore, to determine the sentiment of a news text, it is necessary to consider the given contextual information. To this end, BiLSTM is trained with two LSTM networks, a training sequence that starts at the beginning of the text and a training sequence that starts at the end of the text, which are connected to the same output layer. BiLSTM is able to integrate both the front and back sequence information of each point, which is more effective than a single LSTM for determining the sentiment polarity of the text [13,48]. Figure 2 shows the process of calculating the sentiment polarity of news headlines using BiLSTM.
After data preprocessing for BiLSTM-based sentiment analysis, each news headline x is truncated by a maximum of N words, and the processing step of LSTM is set to N . For headlines less than N in length, they are terminated by left zeroing. For each sampling time ( t     N ) , the word vector x t obtained by Word2Vec training is fed to an LSTM layer with L neurons. This neural network layer outputs an implicit state vector h t of dimension L . Each neuron sets three threshold structures, namely forget gate f , input gate i and output gate o . Based on the past implicit state vector h t 1 and the current input x t , it decides what information needs to be forgotten, what new information needs to be input, and what new memory information needs to be encoded to obtain h t as output. The LSTM layer at time t is calculated as shown in Equations (2)–(7).
f t = σ W f     h t 1 , x t   +   b f
i t = σ W i   h t 1 , x t   +   b i
O t = σ W 0   h t 1 , x t   +   b 0
C ¯ t = tanh W c   h t 1 , x t   +   b i )
C t = f t     C t 1 + i t     C ¯ t
h t = tanh C t     O t
First, the forget gate uses the sigmoid activation function σ to determine how meaningful the past memory is to the current memory state, and generates the coefficient f t according to Equation (2). Next, the input gate determines how significant the current word input vector x t is according to Equation (3) and generates the coefficient i t . Then, the neuron updates the state C t of the current time according to Equation (4). Finally, the output gate determines in what sense the new memory can be output based on C t , and the implicit state h t of the output is represented by Equation (7). In Equations (2)–(7), W 0 and b 0 denote the weight matrix and bias vector, respectively.
After the above calculation, the implicit state code h N of the headline n at time t = N is obtained. Based on h N , the vector of the probability distribution of j in the different sentiment categories [13,14], i.e., positive and negative, is obtained by the SoftMax function as shown in Equation (8). Based on y j , the sentiment orientation ( SO ) of heading n is then calculated as shown in Equation (9). Here, SO n   ϵ   [ 1 , 1 ] . If SO n > 0 , the sentiment orientation is positive, otherwise it is negative. Assuming there are m i news items at time T i and the sentiment polarity of each news item is denoted by SO j , j = 1 ,   2 ,     ,   m i , SO j   ϵ   [ 1 , 1 ] , then the overall sentiment value of the news at time T i is obtained from Equation (10). To obtain the stock news matrix, the news sentiment vector S = [ S 1 , S 2 , , S j , , S n ] is added as a column feature to the news event matrix, as shown in Table 3.
y j = Softmax W 0 h N + b 0
SO j = 1 , 1     Y dj
S i = 1 m i j = 1 m i SO j

3.5. Stock Trend Prediction

The final step in the proposed hybrid CNN-BiLTM model is to predict the stock trend by combining the financial feature matrix and the stock news feature matrix by date as input to the stock trend prediction model. As with forward time series modeling, the effects of backward series need not be considered when predicting the stock trend, so an LSTM rather than a BiLSTM is used to predict upward and downward stock trends. However, when the financial matrix and the news matrix are directly merged as input to the LSTM model, the problem of gradient disappearance may occur [35,48]. Therefore, two LSTM neurons were used in this study, and the financial matrix and the news matrix were input to the two LSTMs separately. Then, the results were vectorized together and fed into the fully connected neural network. Finally, the results for stock rise and fall are output. For example, if the sampling interval is one day, the rise and fall of the stock on day t is predicted based on the data of the past t a ~ t 1 days as illustrated in Figure 3.

4. Experiment Setup

4.1. Experiment Dataset

To evaluate the applicability of the proposed model to different sectors, we selected two stocks, Aldar Properties (ALDAR) and Emirates Telecom (ETISALAT), from the real estate development sector and the communications sector as test objects. The real estate sector is cyclical and more affected by national or international economic fluctuations. In contrast, the communications sector is defensive and less affected by cyclical fluctuations and has a relatively stable share price performance. These companies were selected because they had few missing values in their dataset. In addition, they were generally reported on extensively in the media and in web-based media platforms, allowing a considerable amount of subjective data to be collected about them.
In this experiment, a total of 12 financial stock indicators were selected to form the matrix of financial characteristics, including: opening price, minimum price, high price, closing price, net capital inflow, turnover rate, rise/fall rate, price/earnings ratio, price/net ratio, DFM general market index, and sector index. Quantitative stock data for the two companies were mainly downloaded from the Dubai Financial Market (DFM) (https://www.dfm.ae/market-data, accessed on 1 December 2021). DFM is a publicly owned company based in the United Arab Emirates. It operates in the field of financial markets and offers highly reliable and comprehensive online data on financial markets. It uses scientific verification tools and advanced management methods to keep the reliability and accuracy of the data as high as possible. The DFM database was crawled to collect a total of 18,766 news data and 29,352 financial data for ALDAR and 18,796 news data and 29,364 financial data for ETISALAT during the two-year period from 1 January 2020 to 1 December 2021. The source of the tagged data for news event classification is the DFM historical data. A total of 27,800 news events were labeled with the 82 news categories and used to train the event classification model.

4.2. Experiment Hyperparameter Settings

There are several factors that influence the performance of the CNN-based model for news event classification and the BiLSTM model for sentiment analysis, such as the dimensionality of the word vector, the size of the convolutional window, the number of iterations, and the number of filters. In the experiments, the performance of the model was evaluated by 10-fold cross-validation to select the most appropriate parameter combinations. The best parameter combinations for the dataset used in this study are listed in Table 4, where Null means that this parameter setting is not required.

4.3. Evaluation Indicators

The most commonly applied measures of precision, recall, and F 1 were used to evaluate the classification results in this study. As illustrated in Equations (11)–(13), the precision, recall, and F 1 measures for classifying the i th category of news events were expressed by Pre i , R i , and F 1 i , respectively. Where TP i is the number of samples that were correctly classified into category i ; FP i is the number of samples that were incorrectly classified into category i ; and FN i is the number of samples that originally belonged to category i but were incorrectly classified into other categories.
Pre i = TP i TP i + FP i
R i = TPi TP i + FN i
F 1 i = 2 × Pre i × R i Pre i + R i

5. Empirical Results and Discussion

5.1. News Event Classification

The empirical results of news event classification are shown in Table 5. To verify the performance of the CNN-based news event classifier, it was compared with the SVM and maximum entropy methods [9,10,11,12] for news event classification. SVM is widely investigated and applied for modeling, classification, and data-driven error detection as it has been shown to be powerful and generalizable, while maximum entropy is a linear logit model with proven classification capabilities. In the experiment, 90% of the dataset with a total of 25,020 news items was used as the training set and 10% of the dataset with a total of 2780 news items was used as the test set. For time series data, the temporal dimension of the observations means that we cannot randomly divide them into cohorts. Instead, we need to split the data and take into account the temporal sequence in which the samples were observed. For this reason, we used the train-test split method, which takes into account the temporal sequence of observations [49,50]. The training and testing data sets for the stock market forecasting model were divided as follows: data from 1 January 2020 to 31 July 2021 were used to train the model, and data from 1 August 2021 to 1 December 2021 were used to test and validate the applicability of the model. For the dataset analyzed in this study, the CNN-based news classifier achieved an accuracy of 93.0% in the training dataset and 87.7% in the testing dataset, outperforming the SVM-based and Maxent-based news classifiers (see Table 5).
Table 6 shows the classification results of the CNN-based news classifier for different news events, as well as the precision, recall, and F 1 measures for the different news events. Due to space limitations, only selected event types are listed. High recall and F 1 values indicate better predictive power and accuracy of the message events. As shown in Table 6, most event types with high recall and high F 1 values belong to the corporate news category. In general, the content of news events of different companies does not greatly differ, and the news events have certain templates with good classification performance. News events with poor classification performance are mostly predictions of stock price trends; both good and bad trends vary greatly in the news content of different sectors and companies, making the classification accuracy relatively poor.
Table 7 shows the results of news sentiment classification. BiLSTM-based news sentiment classification achieved 94.1% accuracy in the training set and 91.1% in the test set. SVM-based news sentiment classification achieved the second-best performance with 85.5% and 80.2% accuracy in the training set and the test set, respectively; Maxent-based news sentiment classification was the worst. These trained news sentiment classification models were used to classify the news datasets from ALDAR and ETISALAT, calculate the news sentiment scores, and generate the news sentiment vector matrix.

5.2. Stock Trend Prediction

To test the effectiveness of the proposed hybrid CNN-BiLSTM model in improving the prediction of stock trends, we conducted an experiment comparing the effects of the convergence of news events and sentiment trends with quantitative financial data in predicting stock trends based on the following layers of feature fusion:
(1) LSTM with financial features only: stock trend prediction with financial features only;
(2) LSTM with news infusion: stock trend prediction using financial features and news features, as shown in Table 3;
(3) LSTM with news events and sentiment fusion: stock trend prediction using financial features, news event features, and sentiment features;
(4) GBDT with news event and sentiment fusion: stock prediction based on gradient boosting decision tree model (GBDT) [22] with the same inputs as proposed in model no. (3). GBDT is a highly generalized decision tree algorithm that can effectively avoid overfitting and resist noise by training multiple weak regression tree classifiers over multiple iterations [11]. The performance of LSTM and GBDT in predicting stocks is compared under the same input constraints.
The threshold for stock rise and fall was set to 1%, i.e., if the rise is above the threshold of 1%, it is classified as stock rise, which is represented by 1; conversely, a fall above the threshold of 1% is classified as stock fall, which is represented by 0. The sampling interval of the model was set to a = 14 , the data from day t 13 to day t 1 were entered, and the result of predicting the rise and fall of stocks on day t was outputted. The accuracy of the stock trend prediction for different layers of feature fusion is shown in Table 8.
As shown in Table 8, both the LSTM model with news events and the LSTM model with news events and sentiment fusion improved the stock prediction accuracy compared to the LSTM model using only quantitative financial features. The prediction accuracy of ALDAR individual stocks improved from 0.699 to 0.754 and 0.781, an increase of 7.8% and 11.6%, respectively. The predictive accuracy of ETISALAT individual stocks improved from 0.646 to 0.785 and 0.812, representing increases of 21.4% and 25.6%, respectively. Consequently, the qualitative information contained in stock market news has a positive impact on the prediction of stock trends. In particular, the convergence of news events and sentiment trends with quantitative financial data seems to have a significant impact on improving the prediction of stock trends. Compared with the GBDT model, the LSTM model is more advantageous in predicting stock trends because it improves the prediction performance to a certain extent.
Examining the applicability of the model to both sectors, the results show that the LSTM model performed better in the real estate sector than in the communications sector when only the financial characteristics were used. However, when combining news and financial features, the LSTM model performed better in the communications sector than in the real estate sector. Thus, the applicability of the model in this study is higher for the communications sector, which is also consistent with the expectation that defensive sectors have more stable stock prices compared to more cyclical sectors. To visually demonstrate the effectiveness of the proposed model in predicting stock price movements, Figure 4 and Figure 5 show the prediction results of the proposed model for the two stocks ETISALAT and ALDAR from 1 August to 1 December, 2021, respectively, using the test dataset.
Since stock trend prediction is a dichotomous classification problem, the resulting output is either a rising trend or a falling trend. To illustrate the impact of trend prediction, we consider a sample interval of 13 days. If the prediction result on day 14 is rising, the predicted closing price is set as the sum of the actual closing price on day 13 and the difference between the actual closing prices on day 13 and on day 14. Conversely, it is set to the difference between the actual closing price on day 13 and the actual closing prices on days 13 and 14. In Figure 4 and Figure 5, the results of the stock movement prediction and the actual situation are essentially the same, suggesting a good performance of the model in predicting individual stock fluctuations.

5.3. Comparison of Features Significance

To evaluate and compare the importance and contribution of different features in predicting stock trends, we used the ranking function that ranks the features according to their importance in the final GDBT model [13]. The results of the GBDT model to evaluate the importance of different features for two stocks, ALDAR and ETISALAT, are shown in Figure 6 and Figure 7. Considering the large number of dimensions of input features, we classified the quantitative and qualitative features used in this study into 5 categories, namely: (1) the importance of stock price-related features (calculated by summing the importance of opening price, closing price, high price, low price, rise and fall, and the spread between rise and fall); (2) the importance of cash flow features (calculated by summing the importance of net cash inflow and turnover rate); (3) the importance of the company’s financial features (calculated by summing the importance of the price-earnings ratio and the price-earnings ratio); (4) the importance of the general market index and the sector index (calculated by summing the importance of the DFM index and the sector index); and finally (5) the importance of the news and sentiment features (calculated by summing the importance of the news events and the sentiment features).

5.4. Analysis of the Rise and Fall Threshold

The value of the thresholds for rising and falling prices affects the labeling of stocks that rise or fall, and thus the performance of the prediction models. In the experiments, we set the thresholds from 1% to 8%, with 1% as the step size, to test the prediction effect of the different models for the two stocks of ALDAR and ETISALAT. The experimental results are shown in Figure 8 and Figure 9.
Several findings can be derived from the experimental results. First, the predictive accuracy of the model does not increase or decrease linearly when the threshold is increased from 0.01 to 0.08, but fluctuates randomly. The threshold affects the labeling of stock price increases and decreases in the interval [0.01, 0.08], which in turn affects the accuracy of the prediction model. The threshold value is set to eliminate the effect of fluctuations in this part of the data on the model, and the specific value can be determined by combining experience and experimental tests. Second, the LSTM model with news event integration and the LSTM model with news event and sentiment integration outperforms the LSTM model with financial features for all thresholds, confirming that integrating media news features into the stock trend prediction model can improve the stock prediction accuracy. Finally, the comparison of Figure 8 and Figure 9 shows that the performance of the different models in predicting ALDAR’s stock movements is essentially consistent with the changes in the rise and fall thresholds. Examining the financial stock source data, we find that only 1.5% of the ALDAR stock rise and fall data are between 0.01 and 0.08, which is a relatively small percentage; therefore, changing the label of this portion of the data has limited impact on the model’s predictive performance. In contrast, 5% of the data for ETISALAT shares is between 0.01 and 0.08; therefore, changing the threshold has a greater impact on the model’s predictive performance.

6. Limitations and Future Research

This study has a number of limitations that should be considered when interpreting the results. First, the effects of different estimation cycles on the prediction of stock trends were not considered in the proposed CNN-BiLSTM model. Second, the current study relies on a single stock-related information source, which may limit the predictive power of the proposed model. Indeed, stock markets are typically influenced by a variety of text-based information sources, such as monetary news, online media, websites, or corporate statements [8,14,31,38,51,52]. These information sources differ in the way they influence monetary economic entities. Public opinion on online media, news information, and the opinion of monetary news writers, as well as the officiality of improvised statements, can influence the performance of stock prices in different ways. Therefore, it is equally important to study the combination of information from different sources to understand the impact of news information on predicting stock trends. These strategies can be used and extended to include news content from web-based media and monetary news to create a more comprehensive feature map. Sector and market-related information can additionally be used to tap into and explore the realm of organization-related texts (e.g., stock-related texts and administration-related texts) for stock market research.
Possible research and development directions to improve the accuracy of stock forecasts can be considered from two perspectives. First, given that the magnitude of the increase in stock investment has a large impact on investment profitability, the predictive accuracy of the model could be examined by classifying stock investment into four categories (small increase, large increase, small decrease, and large decrease). Second, other stock-related control variables, such as return and crash risk, can be included in the forecasting model and the effects of these control variables on stock forecasting performance can be compared. Since the BiLSTM-based commentary sentiment analysis method takes a long time to train the model, the method could be further developed in the future. In future work, the method could be investigated to effectively speed up the training process of the model. Further experiments with representations from different but related corpus, new deep learning techniques such as generative adversarial network (GAN) models and graph-based deep learning models can be investigated. The applications of graph-based deep learning not only allow us to tap into the rich values underlying existing graph data, but also help us to naturally model relational data as graphs. Hybrid models that integrate different machine learning and deep learning models can also be explored.

7. Conclusions

This paper presents a hybrid CNN-BiLSTM model with multi-feature fusion for predicting stock trends. The objective is to improve the prediction accuracy by incorporating news events and sentiment trends in the media as market signals that influence stock trends into the stock prediction model. We selected two stocks from the real estate sector and the communications sector as objects to test the effectiveness of the proposed model. The stock trend prediction model presented in this paper shows that integrating quantitative stock data with non-numerical stock signals from media events and sentiment trends leads to better stock performance. Specifically, the results show that the prediction accuracy of the proposed model is 11.6% and 25.6% higher than that of the benchmarked methods for two stocks in the real estate and communication sectors, respectively. The relatively high applicability of the model for the communications sector is consistent with the expectation that defensive sectors (e.g., the communications sector) have more stable stock prices than more cyclical sectors (e.g., the real estate sector). This paper also examines the importance of the characteristics that influence stock trend prediction models. The analysis shows that stock price characteristics are the most important, followed by news characteristics, while company financial characteristics are the least important.

Funding

This research received no external funding.

Data Availability Statement

Please refer to https://www.dfm.ae/market-data (accessed on 20 December 2021).

Conflicts of Interest

The author declares no conflict of interest.

References

  1. Nguyen, T.H.; Shirai, K.; Velcin, J. Sentiment analysis on social media for stock movement prediction. Expert Syst. Appl. 2015, 42, 9603–9611. [Google Scholar] [CrossRef]
  2. Thakkar, A.; Chaudhari, K. Fusion in stock market prediction: A decade survey on the necessity, recent developments, and potential future directions. Inf. Fusion 2020, 65, 95–107. [Google Scholar] [CrossRef] [PubMed]
  3. Nti, I.K.; Adekoya, A.F.; Weyori, B.A. A novel multi-source information-fusion predictive framework based on deep neural networks for accuracy enhancement in stock market prediction. J. Big Data 2021, 8, 17. [Google Scholar] [CrossRef]
  4. Padhi, D.K.; Padhy, N.; Bhoi, A.K.; Shafi, J.; Ijaz, M.F. A Fusion Framework for Forecasting Financial Market Direction Using Enhanced Ensemble Models and Technical Indicators. Mathematics 2021, 9, 2646. [Google Scholar] [CrossRef]
  5. Panwar, B.; Dhuriya, G.; Johri, P.; Yadav, S.S.; Gaur, N. Stock Market Prediction Using Linear Regression and SVM. In Proceedings of the 2021 International Conference on Advance Computing and Innovative Technologies in Engineering (ICACITE), Greater Noida, India, 4–5 March 2021; pp. 629–631. [Google Scholar]
  6. Patil, P.; Parasar, D.; Charhate, S. A Literature Review on Machine Learning Techniques and Strategies Applied to Stock Market Price Prediction. In Proceedings of the DDCIOT 2021, Udaipur, India, 20–21 March 2021. [Google Scholar]
  7. Peng, Y.; Albuquerque, P.H.M.; Kimura, H.; Saavedra, C.A.P.B. Feature selection and deep neural networks for stock price direction forecasting using technical analysis indicators. Mach. Learn. Appl. 2021, 5, 100060. [Google Scholar] [CrossRef]
  8. Shields, R.; El Zein, S.A.; Brunet, N.V. An Analysis on the NASDAQ’s Potential for Sustainable Investment Practices during the Financial Shock from COVID-19. Sustainability 2021, 13, 3748. [Google Scholar] [CrossRef]
  9. Song, D.; Baek, A.M.C.; Kim, N. Forecasting Stock Market Indices Using Padding-Based Fourier Transform Denoising and Time Series Deep Learning Models. IEEE Access 2021, 9, 83786–83796. [Google Scholar] [CrossRef]
  10. Walkshäusl, C. Predicting Stock Returns from the Pricing and Mispricing of Accounting Fundamentals. Q. Rev. Econ. Financ. 2021, 81, 253–260. [Google Scholar] [CrossRef]
  11. Wu, D.; Wang, X.; Su, J.; Tang, B.; Wu, S. A Labeling Method for Financial Time Series Prediction Based on Trends. Entropy 2020, 22, 1162. [Google Scholar] [CrossRef]
  12. Yadav, K.; Yadav, M.; Saini, S. Stock values predictions using deep learning based hybrid models. CAAI Trans. Intell. Technol. 2021, 25, 1600214. [Google Scholar] [CrossRef]
  13. Yun, K.K.; Yoon, S.W.; Won, D. Prediction of stock price direction using a hybrid GA-XGBoost algorithm with a three-stage feature engineering process. Expert Syst. Appl. 2021, 186, 115716. [Google Scholar] [CrossRef]
  14. Zahara, S.; Sugianto. Multivariate Time Series Forecasting Based Cloud Computing for Consumer Price Index Using Deep Learning Algorithms. In Proceedings of the 2020 3rd International Seminar on Research of Information Technology and Intelligent Systems (ISRITI), Yogyakarta, Indonesia, 10–11 December 2020; pp. 338–343. [Google Scholar] [CrossRef]
  15. Lin, Y.; Liu, S.; Yang, H.; Wu, H.; Jiang, B. Improving stock trading decisions based on pattern recognition using machine learning technology. PLoS ONE 2021, 16, e0255558. [Google Scholar] [CrossRef]
  16. Lu, R.; Lu, M. Stock Trend Prediction Algorithm Based on Deep Recurrent Neural Network. Wirel. Commun. Mob. Comput. 2021, 2021, 5694975. [Google Scholar] [CrossRef]
  17. Lyócsa, Š.; Stašek, D. Improving stock market volatility forecasts with complete subset linear and quantile HAR models. Expert Syst. Appl. 2021, 183, 115416. [Google Scholar] [CrossRef]
  18. Mo, D.; Chen, Y. Projecting Financial Technical Indicators into Networks as a Tool to Build a Portfolio. IEEE Access 2021, 9, 39973–39984. [Google Scholar] [CrossRef]
  19. Nabipour, M.; Nayyeri, P.; Jabani, H.; Mosavi, A.; Salwana, E.; Shahab, S. Deep Learning for Stock Market Prediction. Entropy 2020, 22, 840. [Google Scholar] [CrossRef]
  20. Nabipour, M.; Nayyeri, P.; Jabani, H.; Shahab, S.; Mosavi, A. Predicting Stock Market Trends Using Machine Learning and Deep Learning Algorithms Via Continuous and Binary Data; a Comparative Analysis. IEEE Access 2020, 8, 150199–150212. [Google Scholar] [CrossRef]
  21. Nayak, S.C.; Misra, B.B. Estimating stock closing indices using a GA-weighted condensed polynomial neural network. Financial Innov. 2018, 4, 21. [Google Scholar] [CrossRef]
  22. Nti, I.K.; Adekoya, A.F.; Weyori, B.A. A comprehensive evaluation of ensemble learning for stock-market prediction. J. Big Data 2020, 7, 20. [Google Scholar] [CrossRef]
  23. Zhao, H. Futures price prediction of agricultural products based on machine learning. Neural Comput. Appl. 2020, 33, 837–850. [Google Scholar] [CrossRef]
  24. Chopra, R.; Sharma, G.D. Application of Artificial Intelligence in Stock Market Forecasting: A Critique, Review, and Research Agenda. J. Risk Financial Manag. 2021, 14, 526. [Google Scholar] [CrossRef]
  25. Shah, D.; Isah, H.; Zulkernine, F. Stock Market Analysis: A Review and Taxonomy of Prediction Techniques. Int. J. Financ. Stud. 2019, 7, 26. [Google Scholar] [CrossRef] [Green Version]
  26. Priya, S.; Revadi, R.; Terence, S.; Immaculate, J. A Novel Framework to Detect Effective Prediction Using Machine Learning. In Security Issues and Privacy Concerns in Industry 4.0 Applications; Wiley Online Library: Bridgewater, NJ, USA, 2021; pp. 179–194. [Google Scholar] [CrossRef]
  27. Saleh, A.; Baiwei, L. Dengue Prediction Using Deep Learning with Long Short-Term Memory. In Proceedings of the 2021 1st International Conference on Emerging Smart Technologies and Applications (eSmarTA), Sana’a, Yemen, 10–12 August 2021; pp. 1–5. [Google Scholar]
  28. Shaila, S.; Monish, L.; Rajlaxmi, P. Real-Time Problems to Be Solved by the Combination of IoT, Big Data, and Cloud Technologies. In Challenges and Opportunities for the Convergence of IoT, Big Data, and Cloud Computing; Sathiyamoorthi, V., Ed.; IGI Global: Hershey, PA, USA, 2021; pp. 265–276. [Google Scholar] [CrossRef]
  29. Alotaibi, S.S. Ensemble Technique with Optimal Feature Selection for Saudi Stock Market Prediction: A Novel Hybrid Red Deer-Grey Algorithm. IEEE Access 2021, 9, 64929–64944. [Google Scholar] [CrossRef]
  30. Arosemena, J.; Pérez, N.; Benítez, D.; Riofrío, D.; Flores-Moyano, R. Stock Price Analysis with Deep-Learning Models. In Proceedings of the 2021 IEEE Colombian Conference on Applications of Computational Intelligence (ColCACI), Cali, Colombia, 26–28 May 2021; pp. 1–6. [Google Scholar]
  31. Jaggi, M.; Mandal, P.; Narang, S.; Naseem, U.; Khushi, M. Text Mining of Stocktwits Data for Predicting Stock Prices. Appl. Syst. Innov. 2021, 4, 13. [Google Scholar] [CrossRef]
  32. Arjun, R.; Suprabha, K. Forecasting banking sectors in Indian stock markets using machine intelligence. Int. J. Hybrid Intell. Syst. 2019, 15, 129–142. [Google Scholar] [CrossRef]
  33. Assous, H.F.; Al-Rousan, N.; Al-Najjar, D.; Al-Najjar, H. Can International Market Indices Estimate TASI’s Movements? The ARIMA Model. J. Open Innov. Technol. Mark. Complex. 2020, 6, 27. [Google Scholar] [CrossRef] [Green Version]
  34. Chen, Y.-S.; Sangaiah, A.K.; Chen, S.-F.; Huang, H.-C. Applied Identification of Industry Data Science Using an Advanced Multi-Componential Discretization Model. Symmetry 2020, 12, 1620. [Google Scholar] [CrossRef]
  35. Jiang, M.; Liu, J.; Zhang, L.; Liu, C. An improved Stacking framework for stock index prediction by leveraging tree-based ensemble models and deep learning algorithms. Phys. A Stat. Mech. Its Appl. 2019, 541, 122272. [Google Scholar] [CrossRef]
  36. Kim, S.; Ku, S.; Chang, W.; Song, J.W. Predicting the Direction of US Stock Prices Using Effective Transfer Entropy and Machine Learning Techniques. IEEE Access 2020, 8, 111660–111682. [Google Scholar] [CrossRef]
  37. Lahmiri, S. A predictive system integrating intrinsic mode functions, artificial neural networks, and genetic algorithms for forecasting S&P500 intra-day data. Intell. Syst. 2020, 27, 55–65. [Google Scholar] [CrossRef]
  38. Nazari, E.; Biviji, R.; Farzin, A.H.; Asgari, P.; Tabesh, H. Advantages and Challenges of Information Fusion Technique for Big Data Analysis: Proposed Framework. Biostat. Epidemiol. 2021, 7, 189–216. [Google Scholar] [CrossRef]
  39. Zhang, X.; Li, Y.; Wang, S.; Fang, B.; Yu, P.S. Enhancing stock market prediction with extended coupled hidden Markov model over multi-sourced data. Knowl. Inf. Syst. 2018, 61, 1071–1090. [Google Scholar] [CrossRef] [Green Version]
  40. Zhang, X.; Qu, S.; Huang, J.; Fang, B.; Yu, P. Stock Market Prediction via Multi-Source Multiple Instance Learning. IEEE Access 2018, 6, 50720–50728. [Google Scholar] [CrossRef]
  41. Hiransha, M.; Gopalakrishnan, E.A.; Vijay, K.M.; Soman, K.P. NSE Stock Market Prediction Using Deep-Learning Models. Procedia Comput. Sci. 2018, 132, 1351–1362. [Google Scholar] [CrossRef]
  42. Nasir, A.; Shaukat, K.; Khan, K.I.; Hameed, I.A.; Alam, T.M.; Luo, S. Trends and Directions of Financial Technology (Fintech) in Society and Environment: A Bibliometric Study. Appl. Sci. 2021, 11, 10353. [Google Scholar] [CrossRef]
  43. Polamuri, S.R.; Srinivas, K.; Mohan, A.K. Multi model-Based Hybrid Prediction Algorithm (MM-HPA) for Stock Market Prices Prediction Framework (SMPPF). Arab. J. Sci. Eng. 2020, 45, 10493–10509. [Google Scholar] [CrossRef]
  44. Shobana, G.; Umamaheswari, K. Forecasting by Machine Learning Techniques and Econometrics: A Review. In Proceedings of the 2021 6th International Conference on Inventive Computation Technologies (ICICT), Coimbatore, India, 20–22 January 2021. [Google Scholar]
  45. Srivastava, P.; Zhang, Z.; Eachempati, P. Deep Neural Network and Time Series Approach for Finance Systems: Predicting the Movement of the Indian Stock Market. J. Organ. End User Comput. 2021, 33, 204–226. [Google Scholar] [CrossRef]
  46. Gao, Y.; Wang, R.; Zhou, E. Stock Prediction Based on Optimized LSTM and GRU Models. Sci. Program. 2021, 2021, 4055281. [Google Scholar] [CrossRef]
  47. Xie, M.; Li, H.; Zhao, Y. Blockchain financial investment based on deep learning network algorithm. J. Comput. Appl. Math. 2020, 372, 112723. [Google Scholar] [CrossRef]
  48. Xu, G.; Meng, Y.; Qiu, X.; Yu, Z.; Wu, X. Sentiment Analysis of Comment Texts Based on BiLSTM. IEEE Access 2019, 7, 51522–51532. [Google Scholar] [CrossRef]
  49. Peach, R.L.; Greenbury, S.F.; Johnston, I.G.; Yaliraki, S.N.; Lefevre, D.J.; Barahona, M. Understanding learner behaviour in online courses with Bayesian modelling and time series characterisation. Sci. Rep. 2021, 11, 2823. [Google Scholar] [CrossRef] [PubMed]
  50. Bergmeir, C.; Benítez, J.M. On the use of cross-validation for time series predictor evaluation. Inf. Sci. 2012, 191, 192–213. [Google Scholar] [CrossRef]
  51. Eachempati, P.; Srivastava, P.R.; Kumar, A.; Tan, K.H.; Gupta, S. Validating the impact of accounting disclosures on stock market: A deep neural network approach. Technol. Forecast. Soc. Chang. 2021, 170, 120903. [Google Scholar] [CrossRef]
  52. Ghosh, I.; Sanyal, M.K. Introspecting predictability of market fear in Indian context during COVID-19 pandemic: An integrated approach of applied predictive modelling and explainable AI. Int. J. Inf. Manag. Data Insights 2021, 1, 100039. [Google Scholar] [CrossRef]
Figure 1. A hybrid CNN-BiLSTM model with multi-feature and sentiment fusion for stock trend prediction.
Electronics 11 00250 g001
Figure 2. BiLSTM-based news sentiment analysis model.
Electronics 11 00250 g002
Figure 3. Sample period of the stock prediction model.
Electronics 11 00250 g003
Figure 4. Stock trend prediction for ETISALAT from 1 August to 1 December 2021.
Electronics 11 00250 g004
Figure 5. Stock trend prediction for ALDAR from 1 August to 1 December 2021.
Electronics 11 00250 g005
Figure 6. Ranking of features according to their importance for the final GDBT model (ETISALAT stock).
Electronics 11 00250 g006
Figure 7. Ranking of features according to their importance for the final GDBT model (ALDAR stocks).
Electronics 11 00250 g007
Figure 8. The effect of threshold value on stock trend prediction model (ETISALAT).
Electronics 11 00250 g008
Figure 9. The effect of threshold value on stock trend prediction model (ALDAR).
Electronics 11 00250 g009
Table 1. Quantitative financial stock features.
X 1 X 2 X j X p
T 1 x ¯ ij x ¯ ij x ¯ ij x ¯ ij
T i x ¯ ij x ¯ ij x ¯ ij x ¯ ij
T n x ¯ ij x ¯ ij x ¯ ij x ¯ ij
Table 2. Subcategories of news event types.
Event CategoryEvent Description Terms
TransactionsSuspension, resumption, inflow of funds, outflow of funds, block trade, share price, inversion, record, high
EquityListing, holding, acquisitions, mergers, asset reorganization, asset freeze, stock transfer
Investment & FinancingInvestment, construction, issuance of offerings, issuance of bonds, convertible bonds, capital raising, pledge, dividend
Corporate AffairsChange of registered capital, rapid development, strategic cooperation, business expansion, management reduction.
External EventsDubai Financial Market (DFM) listing, stock market penalty, favorable rating, rating downgrade, positive policies.
Table 3. News event features.
N 1 N 2 N j N p
T 1 n ij n ij n ij n ij
T i n ij n ij n ij n ij
T n n ij n ij n ij n ij
Table 4. Settings of the parameters for the prediction model.
ParameterCNNBiLSTM
Word vector dimensionality300300
Number of convolution kernels96Null
Convolution kernel size3, 4, 5Null
Dropout0.50.5
Batch size128128
Number of iterations1020
Header interception lengthNull15
Number of single-layer LSTM neuronsNull[256, 256]
Table 5. Comparison of accuracy rate of news event classification.
ModelDataset
Training SetTest Set
SVM90.8%85.2%
Maxent72.0%69.4%
CNN93.0%87.7%
Table 6. Evaluation of classification performance for each news event class (partial categories).
Categories of News Events with Relatively High Classification PerformanceCategories of News Events with Weak Classification Performance
Sample of News Event CategoriesSample of News Event Categories
News Events CategoryPrecisionRecallF1News Events CategoryPrecisionRecallF1
Listed on DFM1.001.001.00Declining performance0.640.580.61
Suspension0.981.000.99Favorable policies0.810.650.72
Business Change1.001.001.00Change of capital1.000.220.36
Winning Bids1.001.001.00Hiring of Executives0.500.400.44
Convertible bonds0.970.970.97Performance growth0.680.730.71
Pledges1.001.001.00Expected decline0.670.610.64
Stock Exchange Inquiries0.941.000.97Spread news0.420.470.44
Delisting1.001.001.00Favorable News0.460.650.54
Table 7. Comparison of news sentiment classification accuracy.
ModelDataset
Training SetTest Set
SVM85.5%80.2%
Maxent81.7%75.1%
BiLSTM94.1%91.1%
Table 8. Accuracy of prediction of stock trend for different layers of feature fusion.
Layers of Feature FusionALDAR StockETISALAT Stock
LSTM with only financial stock features 0.6990.646
LSTM with financial features and news events0.7540.785
LSTM with financial features, news events and sentiment fusion0.7810.812
GBDT with financial features, news events and sentiment fusion0.6250.654
Publisher’s Note: MDPI stays neutral with regard to jurisdictional claims in published maps and institutional affiliations.

