Article

A Hybrid Imputation Method for Multi-Pattern Missing Data: A Case Study on Type II Diabetes Diagnosis

by
Mohammad H. Nadimi-Shahraki
1,2,*,
Saeed Mohammadi
1,2,
Hoda Zamani
1,2,
Mostafa Gandomi
3 and
Amir H. Gandomi
4,*
1
Faculty of Computer Engineering, Najafabad Branch, Islamic Azad University, Najafabad 8514143131, Iran
2
Big Data Research Center, Najafabad Branch, Islamic Azad University, Najafabad 8514143131, Iran
3
School of Civil Engineering, College of Engineering, University of Tehran, Tehran 1417614411, Iran
4
Faculty of Engineering & Information Technology, University of Technology Sydney, Ultimo 2007, Australia
*
Authors to whom correspondence should be addressed.
Electronics 2021, 10(24), 3167; https://doi.org/10.3390/electronics10243167
Submission received: 12 November 2021 / Revised: 14 December 2021 / Accepted: 16 December 2021 / Published: 19 December 2021
(This article belongs to the Special Issue Big Data Analytics Using Artificial Intelligence)

Abstract

:
Real medical datasets usually consist of missing data with different patterns which decrease the performance of classifiers used in intelligent healthcare and disease diagnosis systems. Many methods have been proposed to impute missing data, however, they do not fulfill the need for data quality especially in real datasets with different missing data patterns. In this paper, a four-layer model is introduced, and then a hybrid imputation (HIMP) method using this model is proposed to impute multi-pattern missing data including non-random, random, and completely random patterns. In HIMP, first, non-random missing data patterns are imputed, and then the obtained dataset is decomposed into two datasets containing random and completely random missing data patterns. Then, concerning the missing data patterns in each dataset, different single or multiple imputation methods are used. Finally, the best-imputed datasets gained from random and completely random patterns are merged to form the final dataset. The experimental evaluation was conducted by a real dataset named IRDia including all three missing data patterns. The proposed method and comparative methods were compared using different classifiers in terms of accuracy, precision, recall, and F1-score. The classifiers’ performances show that the HIMP can impute multi-pattern missing values more effectively than other comparative methods.

1. Introduction

Along with the reduced physical activity and the spread of sedentary life as well as consumption of unhealthy foods, not only the diabetes affliction age has been reduced, but also its incidence rate has been increased [1,2,3]. According to the international diabetes federation reports, the number of diabetic patients in 2015 amounted to 415 million people, 46.5% of which, equivalent to 192.8 million people, were not aware of their disease [4]. It has been estimated that by 2040, the number of patients with diabetes all around the world will reach nearly 642 million individuals, which is more than twice the population with diabetes in 2008. Moreover, diabetes is a leading cause of mortality and an expensive medical problem [5,6]. Early and accurate diabetes diagnosis is very critical to timely treatment which can suspend the disease progression, decrease the mortality rate and control the economic burden [7,8,9,10]. Diabetes can cause serious complications on the body’s organs and tissues such as cardiovascular, nephropathy, neuropathy, retinopathy, heart attacks, amputation, cancer and lead to death [11,12,13,14]. The related studies have been performed on diabetes complications as a potential negative predictor factor on other oncological diseases [15] and functional conditions such as erectile dysfunction [16]. The most common type of diabetes is are type II in which body cells can’t properly use the produced insulin [17,18].
Unfortunately, the high prevalence of diabetic patients and the lack of effective and intelligent methods, which cause delay and inaccuracy in diagnosis [19,20,21]. Medical data mining is recognized as a powerful method that can extract hidden patterns from a huge amount of data [22,23,24,25] and provide early and accurate medical decisions [26,27]. Accordingly, many intelligent and data mining methods are developed to improve the early and accurate diagnosis from diabetes datasets [28,29,30,31]. However, the direct analysis of diabetes datasets without preprocessing results in inaccurate learning models, and erroneous medical decisions [32,33,34]. The diabetes data quality affects the performance of intelligent medical methods especially by their irrelevant features [35,36] and missing data which is a common problem faced with real-world diabetes datasets [37]. Efficient metaheuristic-based algorithms are introduced to select relevant and effective features and they are getting better and better with the advent of recent metaheuristic algorithms [38,39,40,41]. Missing data handling is an essential step of the medical data mining process [42,43,44,45] which is the main concern of this study.
The personal mistakes in the data collection process, nature of the features, and biological effects of features of the blood test on each other lead to the occurrence of different missing data patterns in a dataset. Recognizing the pattern of missing values is an important process in missing data imputation [46]. Little et al. [47] defined three categories of missing data, missing completely at random (MCAR), missing at random (MAR), and missing not at random (MNAR). The problem of missing value can be solved by using simple methods as well as value imputation methods [48,49,50]. Complete case analysis (CCA) or listwise deletion, pairwise deletion, manual filling of missing values, and use of constant global label value are among the simple methods. Imputation is a powerful method for dealing with missing data problems [51,52,53,54] which are including single imputation (SI) and multiple imputations (MI). The SI and MI methods provide desirable results on MCAR and MAR patterns, respectively; besides, the constant global label is suitable for the MNAR missing data pattern [37,55,56,57,58]. Accordingly, imputation of missing values via these methods might be introduced extra noises, biases, and poor data quality that provide less accuracy for the data model [59,60,61,62,63,64]. The presence of multi-pattern missing values can critically influence the performance of classifiers. Identifying the type of missing pattern and selecting/proposing the proper imputation method are two related issues concerning the imputation problem. Recently, a new generation of imputation methods are proposed that utilized the advantages of SI and MI methods using the hybridization schema.
In this paper, a four-layer model is introduced to hybridize imputation methods for different missing data patterns. The introduced model consists of analyzing, decomposing, imputing, and merging layers. Based on the introduced model, a hybrid imputation method named HIMP is proposed. Accordingly, first, the proposed method analyses the features and categorizes them accurately according to a variety of missing data patterns by finding the correlation between features with missing values and also specified definitions. The proposed HIMP imputes missing data with MNAR patterns and stores the results, and then it decomposes the results into two datasets DMCAR and DMAR including missing data with MCAR and MAR patterns, respectively. Next, DMCAR is imputed using single imputation methods K-nearest neighbor (KNN) [65] and hot-deck [66] while DMAR is imputed using three multiple imputation methods Markov chain Monte Carlo (MCMC) [67,68,69], multivariate imputation by chained equations (MICE) [70,71] and expectation maximization (Em) [72]. In this step, the imputed values estimated by each method are assessed using different classifiers to determine winner imputed methods and their DMCAR and DMAR datasets. Finally, HIMP merges the winner datasets to form the imputed dataset. The proposed HIMP was evaluated and compared with some other imputation methods using different classifiers in terms of accuracy, precision, recall, and F1-score. The HIMP and comparative methods competed to impute missing values of a real-world dataset named IRDia including different patterns MAR, MNAR, and MCAR. The classifiers’ performances show that the HIMP is more effective than other comparative methods. The main contributions of this study can be summarized as follows:
-
Introducing a four-layer model to develop hybrid imputation methods for multi-pattern missing data;
-
Proposing a hybrid imputation method (HIMP) using the introduced model;
-
Collecting a real dataset named Iran diabetes (IRDia) from private medical clinics, and identifying and categorizing its missing data patterns including MCAR, MAR, and MNAR patterns;
-
Evaluating the proposed HIMP by comparing its results with other imputation methods for imputing all missing data patterns of the IRDia dataset.
The rest of this paper is organized as follows: In Section 2, the background and related works are presented. In Section 3 the proposed HIMP is introduced. The experimental evaluations are provided in Section 4. Finally, Section 5 discusses and concludes the obtained finding of this study.

2. Background and Related Works

In this section, first, the missing patterns concepts are described, and then related works are briefly reviewed.
The missing pattern analysis provides descriptive measures of the relationship and connection between missing values and present values [56,73,74]. Knowing the missing patterns is useful as an exploratory step before imputation for selecting the proper data imputation methods [75,76,77,78,79,80,81,82]. The missing patterns can be classified into three categories missing completely at random (MCAR), missing at random (MAR), and missing not at random (MNAR). The real-world datasets may consist of all patterns MCAR, MAR, and MAR which are categorized in multi-pattern missing values.
Missing completely at random (MCAR) pattern: The MCAR pattern occurs completely randomly throughout the dataset. In this type of missingness, a random subset of the missing observations has distributions similar to the observed values [37,56]. If feature Y has missing values, the MCAR pattern will occur when the missing values on feature Y are independent of all the observed features and values of Y. The missing and observed distributions of Y are the same, which can be expressed as Equation (1) [83]. The MCAR pattern can be corrected using methods such as complete case analysis (CCA), pairwise deletion, initialization with a central tendency global constant, and single imputation [37,55,57,83].
P (Y | y missing) = P (Y | y observed)
Missing at random (MAR) pattern: The MAR pattern occurs randomly throughout the dataset. In MAR, the probability that a record with missing values belongs to a feature does not depend on the value of the missing value but can be dependent on the observed data [37]. In this case, the observed and missing distributions on feature Y are equal depending on some of the X observed values. In fact, according to Equation (2), the probability of missingness of observations on feature Y depends on other observations of feature X, but not on values of Y. Furthermore, the observed values are not necessarily a random sample of the assumed complete dataset [83].
P (Y | y missing, y observed, X) = P (Y | y observed, X)
The correction method of this type of missing data pattern is multiple imputations [33,37,55,56,83]. In the MAR pattern, all the simple techniques for managing the missing values, including CCA, pairwise deletion, and use of mean representative for missing values, can lead to reduced statistical power, increased standard error, and bias of the results [37,55,84]. If the missing data pattern is of MAR type, pairwise deletion can seriously cause bias in the obtained results [83]; however, if the data do not have MAR pattern, implementing the multiple imputations can lead to errors as well biased results [56,85]. Since in the single imputation methods the overall correlation between the features is less taken into account, applying these methods in the MAR pattern might lead to inaccurate estimations [37].
Missing not at random (MNAR) pattern: This missing data pattern occurs non-randomly and due to entirely intentional reasons throughout the dataset. In one of the cases of the MNAR pattern, the feature with missingness can be logically initialized, but there is no other feature in the dataset that is conceptually associated with it. Moreover, there is another case, in which the feature cannot be initialized logically and conceptually. Furthermore, the cause of missingness can be specified using one or multiple features found in the dataset [37,49,56]. Under such conditions, the constant global label value is used to fill the blanks of the missing values [37,55,86]. According to Equation (3), in the MNAR pattern, the missing and observed values of feature Y are not equal under any condition [83]. The missing values can be corrected by using simple and imputation methods.
P (Y | y missing) ≠ P (Y | y observed)
Real-world problems are mostly faced with different types of missing patterns which are affected in the performance of the classifier and predictor models by achieving erroneous results. Selecting the proper missing data handling is essential in preprocessing step. Many imputation methods have been developed over the years for different datasets such as real datasets of the national health and nutrition examination survey (NHANES) [87,88,89]. The complete-case analysis (CCA) and imputation methods are common approaches to handle missing data and achieve completeness. The CCA [48] is a simple method to handle missing data values. The CCA method is often performed when the class label is missed. In this method, all the samples containing missing values are deleted from the investigated dataset [48,50]. In pairwise deletion, those records are removed from the dataset, in which the variable or feature with missingness is used in calculations [50]. The use of a constant global label such as “unknown” value instead of the missing value in each feature can be considered as another simple missingness correction method. Another sophisticated approach to handling missing data is the imputation method that is substituting the estimated values for the missing values. The estimated values are obtained through internal and central relations of features of the dataset [55]. Missing data imputation methods are commonly divided into two groups single imputation (SI) and multiple imputations (MI).
Single imputation (SI) method: In the SI method, a value is considered instead of any missing value and, in the final analysis [37]. Among the single imputation methods, a central tendency unit such as the average or mean of records of a class is known as the concept most common (Cmc) method can be mentioned [4,48,50]. Regression imputation, mean substitution, hot-deck imputation [66], K-nearest neighbor (KNN) imputation [65], and maximum likelihood method are well-known single imputation methods [50,90,91].
Multiple imputations (MI) method: To consider the uncertainty of the value obtained for imputation relative to the unmeasured real data this method collects multiple values for each missingness in the imputation value production process [92]. To perform the multiple imputations, the missing data pattern should be of MAR type [33,37,56,83,85,86]. Some of the multiple imputation methods include Markov chain Monte Carlo (MCMC), multivariate imputation by chained equations (MICE) [70,71], and expectation-maximization (Em) [72]. The MCMC method specifies a multivariate distribution for the missing values and flows the imputation from conditional distributions by Markov chain Monte Carlo techniques. The MICE method has emerged as a systematic method for handling the missing values in the statistical literature [71,85]. The Em method performs an effective repetitive procedure to calculate the maximum likelihood estimation in the presence of the missing value [84]. The above-mentioned missing values imputation methods have no sensitivity to discreteness or continuousness of the data [92].
Many imputation methods have been developed to complete the missing data and overcome the shortcomings that occurred during the data preprocessing step. In the following, the related works proposed for imputing missing values are reviewed and discussed in three groups SI, MI, and hybrid imputation.
The CCA omits the missing values from the analysis which may lose a significant amount of useful information from the analysis [93,94]. To cover the CCA weaknesses, SI methods are developed which require less computational cost to generate a proposer value for a missing value in a dataset. Giardina et al. [95], applied the single imputation methods of K-nearest neighbors imputation, mean, and the multiple imputation method of Em in Ulster Diabetes datasets. This data has 49% maximum missingness. Randomly simulated missingness from 5% to 35% was created in the features of the Ulster dataset, but the type of the missing data pattern was not mentioned. In addition, they reported KNN and Mean as the best methods. Purwar [61] implemented single imputation and CCA methods on three datasets of Pima, WDBC, and Hepatitis with 699, 768, and 155 records, respectively, and WDBC dataset with artificially induced missing values for the correction of the missing values. The missingness rate of 25–75% was reported in the features, but the missing data pattern was not mentioned. In this study, 11 data missingness correction methods, including CCA, Cmc, and KNN, were used. Then, through clustering by the K-means algorithm and evaluating the clusters, the Cmc method was selected as the best method. Afterward, evaluation of the efficiency of the final model was obtained by the MLP classifier with the highest accuracy rate of 99.82%, 99.08%, and 99.39% for datasets of Hepatitis, Pima, and WDBC, respectively. Aljuaid [96] applied the Em, KNN, mean, and hot-deck imputation methods on five different datasets from the UCI repository with varying rates of missingness (maximum of 25%), which were used artificially and randomly. These imputation methods were applied separately on different datasets, and the result obtained by the c5.0 decision tree classifier was compared with the datasets without missing values. In this study, no exact recognition of the missing data patterns created in the dataset was expressed. According to the obtained results, the Em method yielded better results on numerical datasets; furthermore, the hot-deck method had better results in larger datasets. Moreover, the KNN method had a longer execution time in more massive datasets.
The MI methods are developed to alleviate the shortcomings of the single imputation method in handling missing values [56]. Lin [83] investigated the efficiency of the Em multiple imputation algorithm and MCMC method. In this study, these two imputation methods had no significant difference in terms of the final accuracy. The NHIS dataset with 13,017 records, 26 features, and a maximum missingness rate of 25% was used for the quality-of-life criteria, including physical, mental, and social health. The records with the missingness above 20% were deleted from the dataset. The missingness in this dataset was created artificially, and the missing data pattern was not mentioned. Mirkes [97] analyzed the TARN physical injury dataset in terms of missing values. A system of Markov non-stationary models was developed; next, these models were evaluated on 15,437 records with more than 200 features. In this study, it was noted that five repetitions could be appropriate for multiple imputations. In this study, the missingness percentage was not mentioned, and the Markov model-based multiple imputations demonstrated excellent results. Eisemann [33] used MICE multiple imputation method and regression on the breast cancer dataset of SH Research Center in Germany with 21,500 records and 13 features. Nearly 20% of the records had missingness, which was deleted from the dataset. Then, artificial missingness was created on the rest of the data. The assumed missing data pattern in this study was MAR, and the MICE method yielded desirable results. Sovilj et al. [98] developed a new method based on the gaussian mixture model and Extreme Learning Machine. The missing values are handled using the Gaussian Mixture Model and then extreme learning machine is applied for final estimation. Faisal et al. [99] proposed multiple imputations methods using the weighted nearest neighbor approach to impute missing data in which the distances are computed using the correlation among the target and candidate predictors. Blazek et al. [100] introduced a practical guide to effective multiple imputations of missing data in the context of nephrology research nephrology. Moreover, the efficient multiple imputation methods, GAMIN [101], MIRDDs [102], and MI-MOTE [103] are recently proposed.
Hybrid imputation methods for estimation of the missing values used the advantages of both single imputation and multiple imputations methods. Many algorithms are developed to combine these methods effectively. Aydilek et al. [59] presented a fuzzy c-means clustering hybrid imputation approach that utilizes the support vector regression and a genetic algorithm for estimation the missing values. Tian et al. [63] proposed a hybrid missing data completion method called multiple imputation using gray-system-theory and entropy-based on clustering (MIGEC). The MIGEC divided the non-missing data patterns into several clusters and applied the information entropy for incomplete instances in terms of the similarity metric based on gray system theory (GST) to estimate the imputed values. Gautam et al. [104] proposed hybrid imputation methods including PSO–ECM and (PSO–ECM) + MAAELM that involve particle swarm optimization (PSO), evolving clustering method (ECM), and auto-associative extreme learning machine (AAELM) for data imputation. Vazifehdan et al. [64] proposed a hybrid imputation method using a bayesian network and tensor factorization for imputing the discrete and numerical missing values, respectively, to boost the performance of the breast cancer recurrence predictor. Aleryani et al. [105] proposed the multiple imputation ensembles (MIE) for dealing with the data incompleteness. Rani et al. [62] proposed a hybrid imputation method to combine multivariate imputation by chained equations (MICE), K-nearest neighbor (KNN), mean and mode imputation methods for predicting missing values in medical datasets. Li et al. [60] proposed hybrid missing value imputation algorithms JFCM-VQNNI and JFCM-FVQNNI that are utilized the combination of the fuzzy c-means and the vaguely quantified nearest neighbor.
Xu et al. [106] proposed the MIAEC algorithm which is a missing value imputation algorithm based on the evidence chain. The MIAEC algorithm mines all relevant evidence of missing data in the dataset and then combines this evidence to produce the evidence chain for estimating the missing values. Tsai et al. [107] designed a class center-based missing value imputation (CCMVI) approach for producing effective imputation. The CCMVI is based on two modules. In the first module, the imputation threshold is determined based on the distances between the class centers and their corresponding data samples. In the second module, the threshold for missing value imputation is identified. González-Vidal et al. [108] proposed a missing data imputation framework with Bayesian maximum entropy (BME) to estimate the missing data from the internet of things applications. Mostafa et al. [109] introduced two algorithms the cumulative bayesian ridge with less NaN (CBRL) and cumulative bayesian ridge with high correlation (CBRC) for improving the accuracy of missing value imputation.
Li et al. [110] proposed a novel hybrid method coupling empirical mode decomposition and a long short-term memory deep learning network to predict missing measured signal data of structural health monitoring (SHM) systems. The generative adversarial network is the next frontier of machine learning [111] which is applied in the machine learning data imputation approach and has the potential to handle missing data accurately and efficiently. Zhang et al. [112] proposed a model of end-to-end generative adversarial network with real-data forcing to impute the missing values in a multivariate time series. The proposed model consists of an encoder network, a generator network, and a discriminator network. Faisal et.al [113] proposed a weighted imputation method for high-dimensional mixed-type datasets by nearest neighbors which use the information on similarities among samples and association among covariates. Wan et al. [114] proposed a novel collaborative clustering-based imputation method (COLI), which uses imputation quality as a key metric for the exchange of information between different clustering results.
Shahjaman et al. [115] introduced the rMisbeta algorithm as a robust iterative approach that uses robust estimators based on the minimum beta divergence method to simultaneously impute missing values and outliers. Hu et al. [116] proposed an information granule-based classifier for incomplete data and a way of representing missing entities and information granules in a unified framework. The information granule-based classifier abstracts and refines the prototypes in multi-class subspaces to capture the key structural relationship of the classes. The relocated prototypes and classification information are exploited to represent the missing values as interval information granules. Then, the incomplete data are classified and imputed as hybrid numeric and granular data. Nugroho et al. [117] proposed a class center-based firefly algorithm for retrieving missing data by considering the attribute correlation in the imputation process.

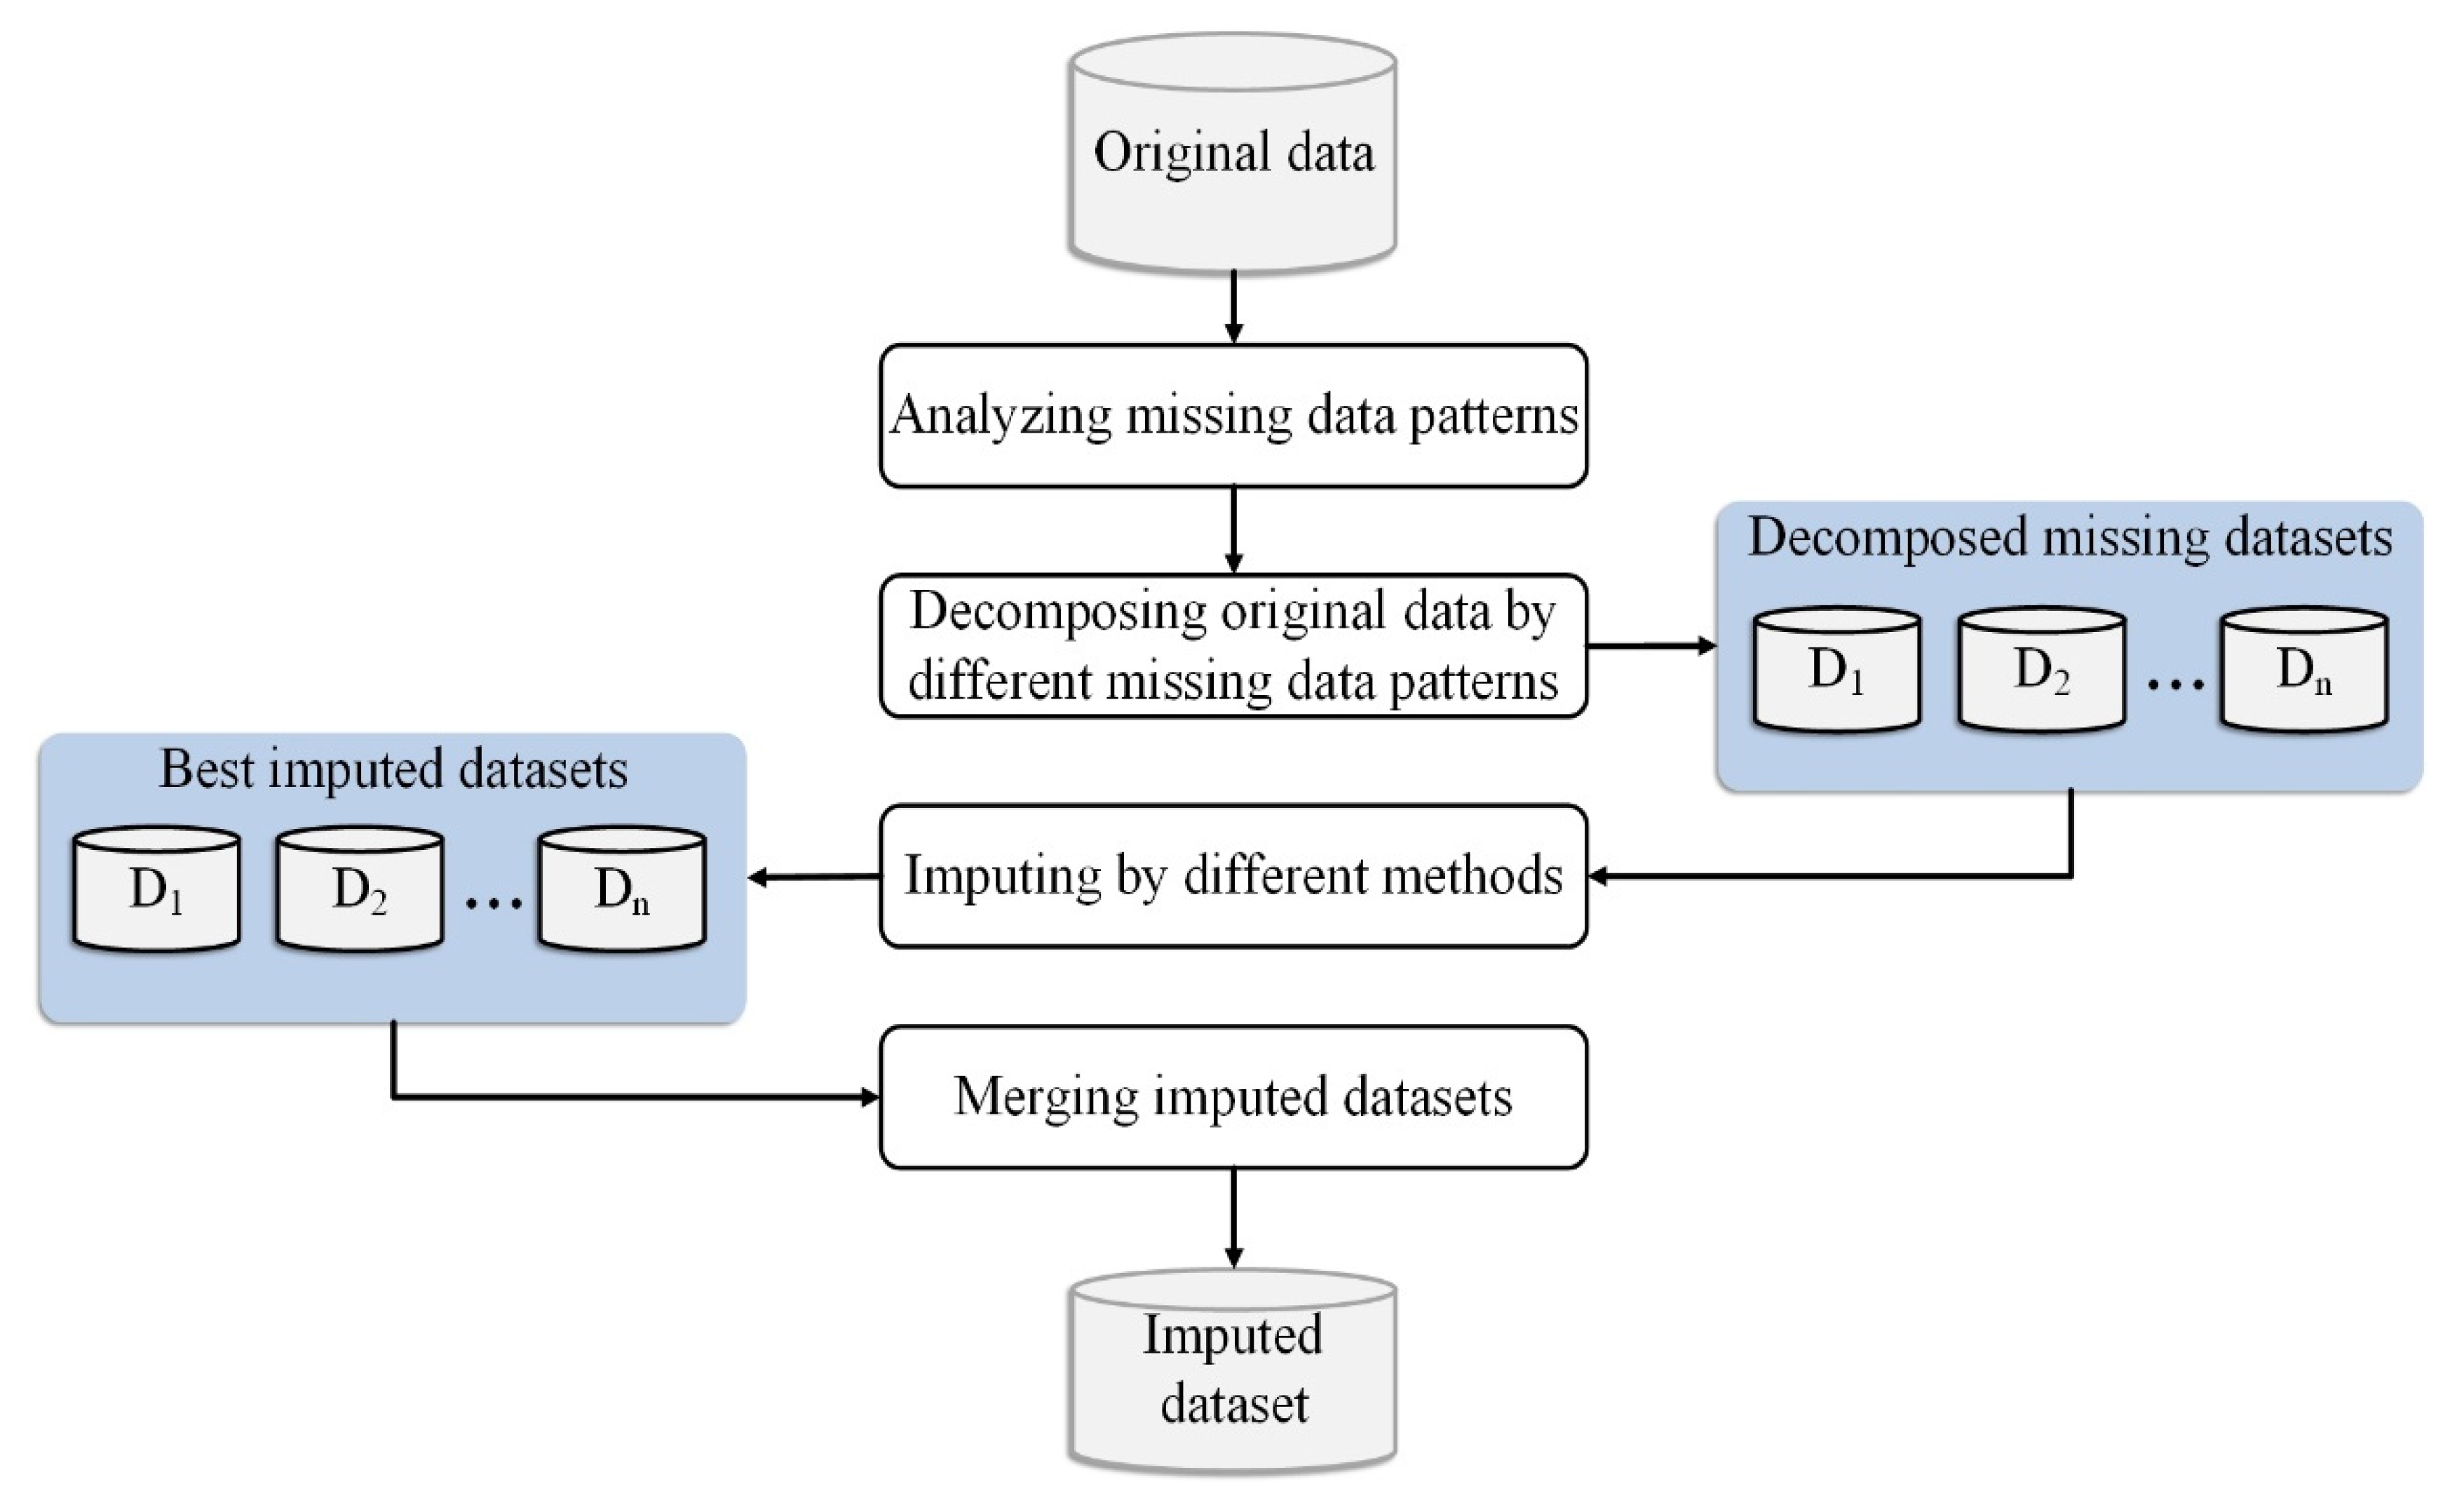
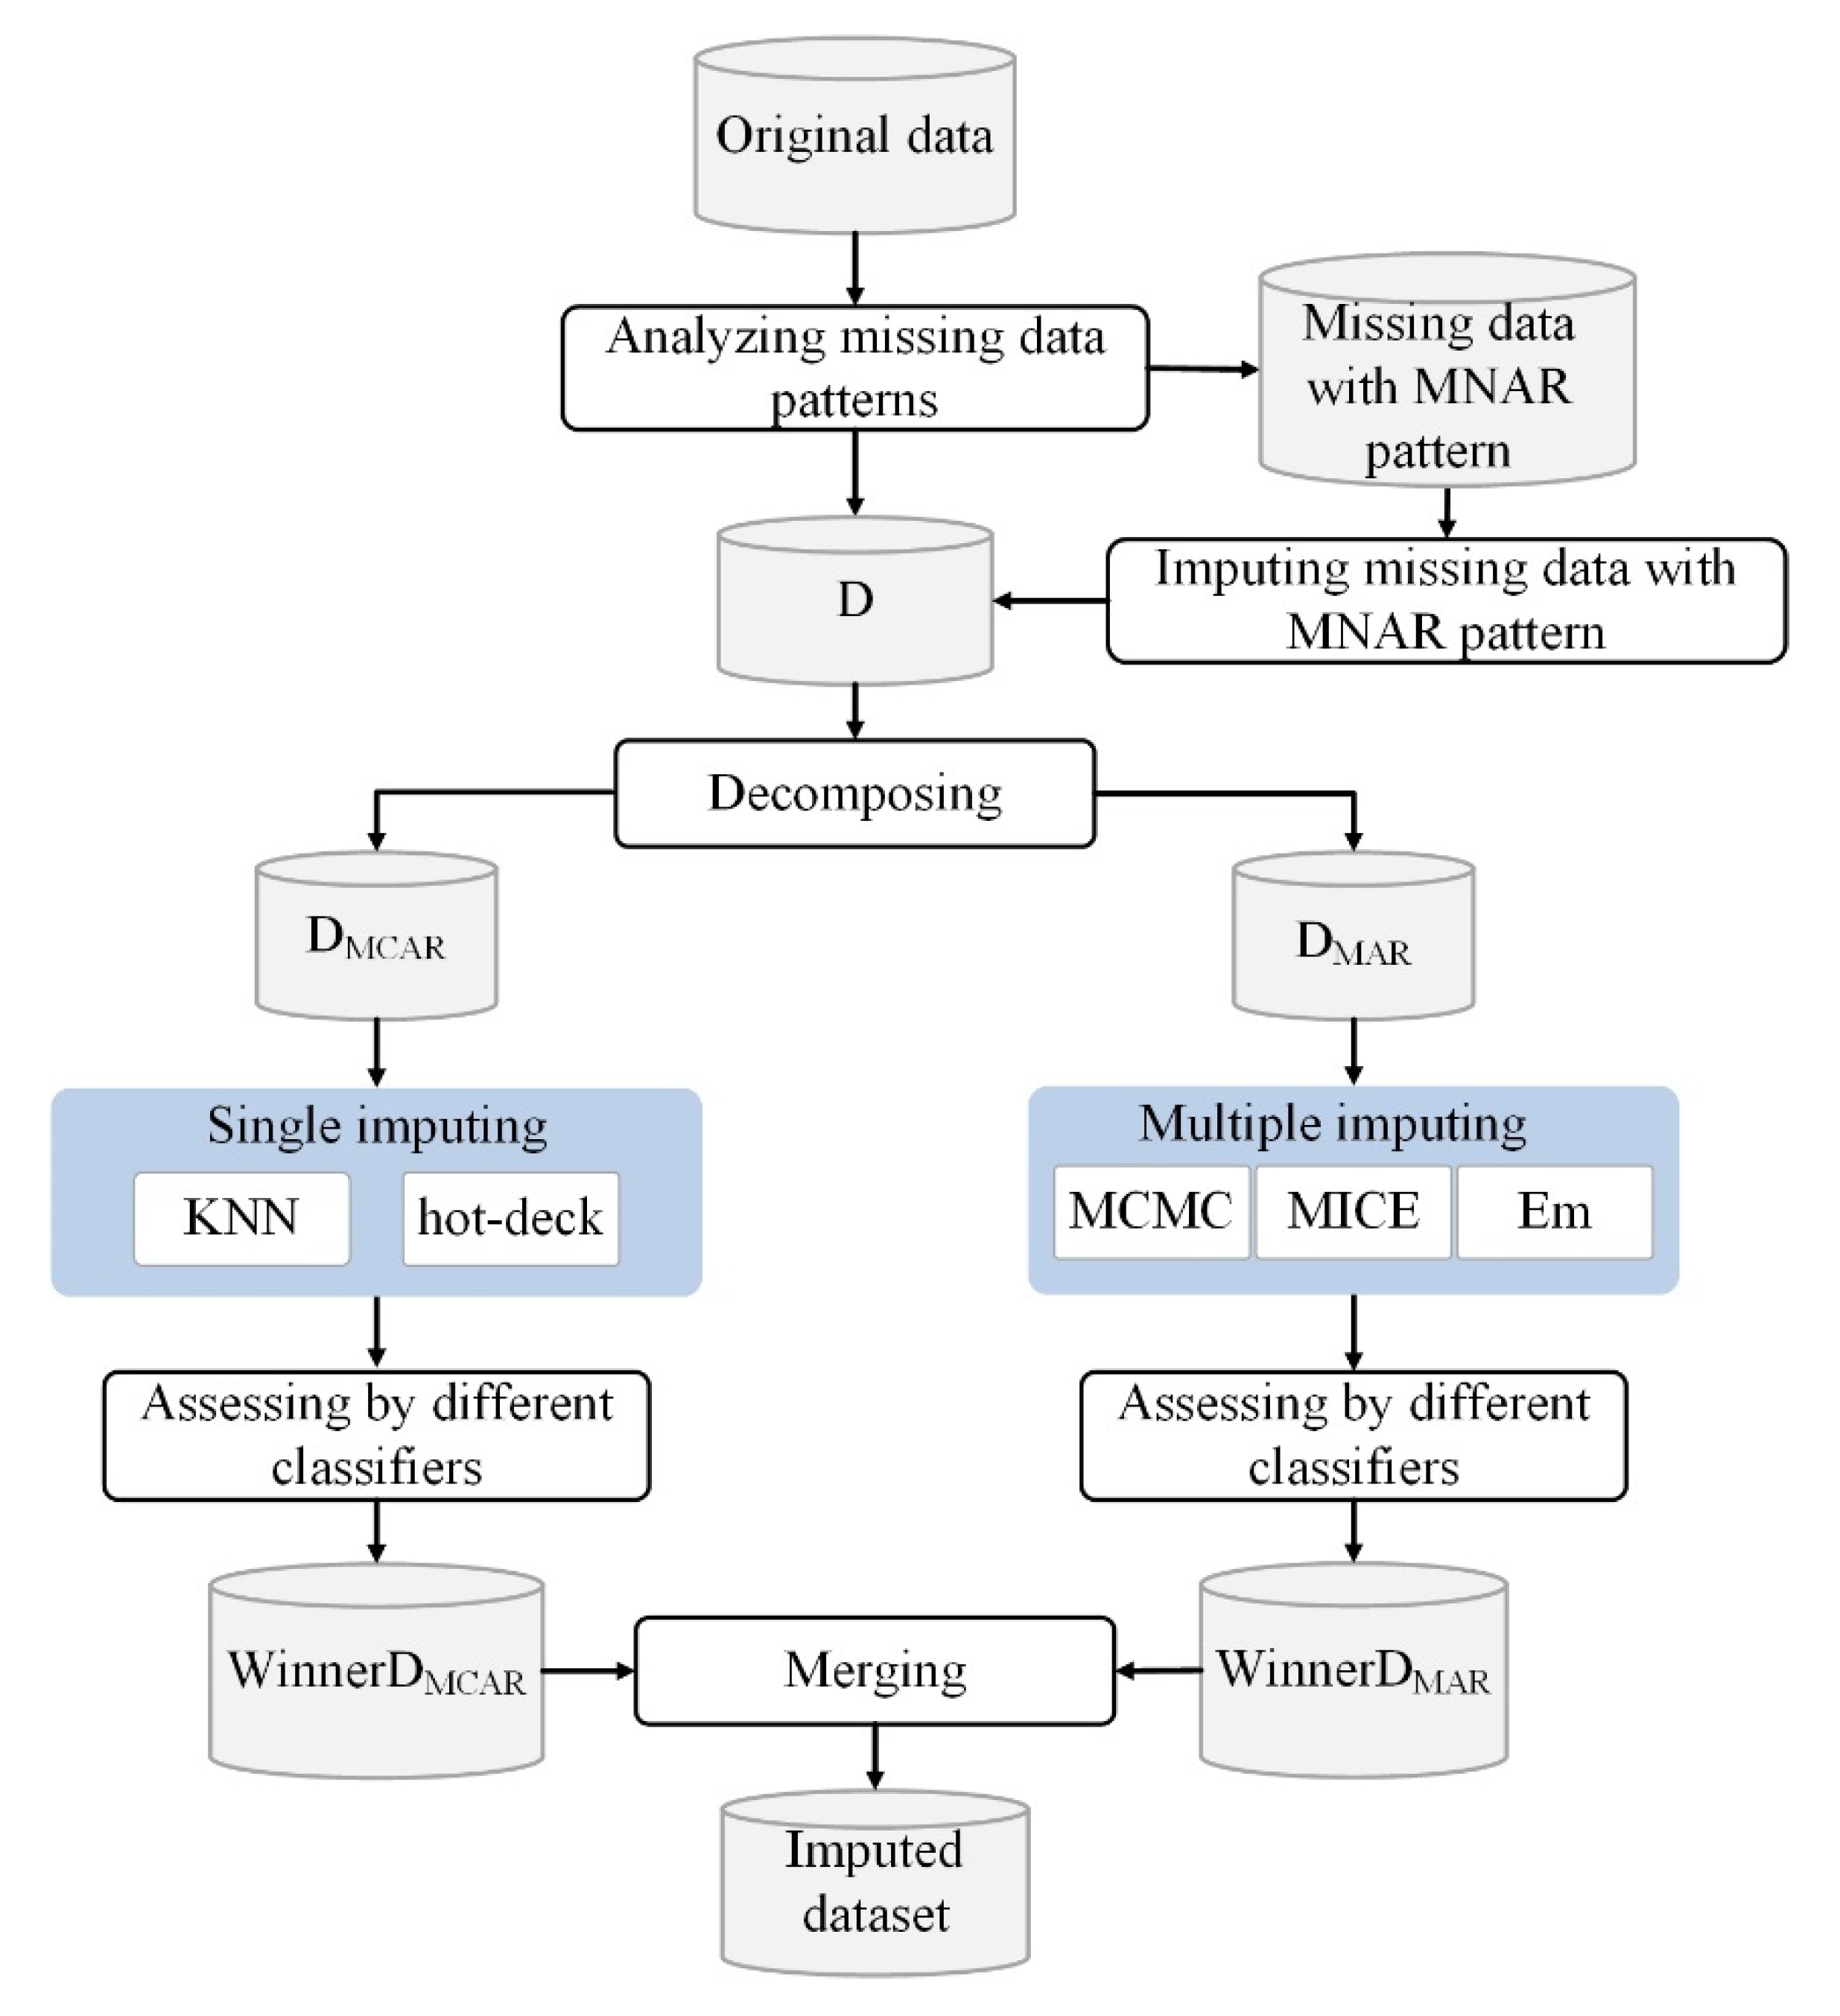
3. Proposed Hybrid Imputation (HIMP) Method for the Multi-Pattern Missing Data

In this paper, a four-layer model is introduced to develop efficient methods for imputing different missing data patterns by hybridizing some suitable imputation techniques. AS shown in Figure 1, the introduced model consists of analyzing, decomposing, imputing, and merging layers. The first layer is to analyze the original dataset and determine its different missing data patterns, and it decomposes the original dataset into different datasets in the second layer. Then, in the third layer, each decomposed dataset can be imputed using a combination of different relevant techniques to find the best possible estimation for their missing values. Finally, in the fourth layer, the best estimations gained from the third layer are merged to form the imputed dataset.
Based on the introduced model, a hybrid imputation method named HIMP is proposed. The pseudocode of the HIMP method is presented in Algorithm 1.
Algorithm 1. The proposed hybrid imputation (HIMP) method
Input: The original dataset (IRDia) includes different missing data patterns.
Output: Imputed dataset.
1.Begin
2.Analyzing missing data patterns.
3.Imputing missing data with MNAR pattern using the appropriate constant global label.
4.D ← Original dataset with imputed MNAR pattern.
5.Decomposing D to two databases DMCAR and DMAR including MCAR and MAR patterns.
6.Single imputing DMCAR using candidate single imputation methods.
7.Assessing the results gained by candidate single imputation methods and selecting the winner.
8.WinnerDMCAR ← The imputed DMCAR gained from the winner single imputation method.
9.Multiple imputing DMAR using candidate multiple imputation methods
10.Assessing the results gained by candidate multiple methods and selecting the winner.
11.WinnerDMAR ← The imputed DMAR gained from the winner multiple imputation method.
12.Imputed dataset ←Merging WinnerDMCAR and WinnerDMAR.
13.End
As shown in Figure 2, the proposed HIMP method consists of the following six steps.
Step 1. Analyzing missing data patterns: In this step, the original dataset with high missing data is analyzed and the missing patterns are detected.
Step 2. Imputing missing data with MNAR pattern: The features with the MNAR pattern were identified, then their missing values were imputed with appropriate constant global label values.
Step 3. Decomposing: The imputed dataset obtained from Step 2 is decomposed into two datasets DMCAR and DMAR with MCAR and MAR patterns by identifying the internal relationships of the variables, cause of missingness, and concerning definitions of the missing pattern and consulting with an endocrinologist.
Step 4. Single imputing: Single imputation methods including K-nearest neighbor (KNN) and hot-desk impute the MCAR patterns in the DMCAR dataset. Then, the results obtained by each imputation method are assessed using different classifiers and the best results are selected as the WinnerDMCAR.
Step 5. Multiple imputing: The multiple imputation methods including Markov chain Monte Carlo (MCMC), multivariate imputation by chained equations (MICE), and expectation-maximization (Em) were applied to the DMAR datasets with the MAR pattern. Each multiple imputation method in this study generated five separate datasets. The datasets imputed by each multiple imputation method were assessed by comparing the performance of different classifiers. Then, the best results are determined as the WinnerDMAR.
Step 6. Hybrid imputation: In the final step, the WinnerDMCAR and WinnerDMAR datasets selected from steps 4 and 5 are merged, the repetitive features are deleted, and the final dataset is formed.

4. Experimental Evaluation

In this section, first, the experimental environment and setting are described. Then, the process of clinical data collecting, features of Iran’s diabetes (IRDia) dataset collected in our case study, and identifying the missing data patterns of the IRDia dataset are described. Finally, the proposed imputation method and other comparative methods are applied for imputing IRDia dataset, and then their results are assessed in terms of accuracy, precision, recall, and F1-Score gained by different classifiers.

4.1. Experimental Environment and Setting

The proposed method was implemented using MATLAB version R 2016b and R-studio version 3.4.1 programming languages. All experiments were run using the same configuration on a personal computer, including an Intel (®) Core (™) i7 CPU with 3.4 GHz and 8 GB memory on Windows 10 operating system. The performance of the proposed method was evaluated using three classifiers multi-layer perceptron (MLP), classification and regression trees (CART), and K-nearest neighbors (KNN). In addition, k-fold cross-validation with k = 5 was considered to alleviate the bias caused by the random selection of the dataset.

4.2. Clinical Data Collecting and Description of IRDia Dataset

In our case study, the Iran diabetes (IRDia) dataset was collected in a 10-month process in private medical clinics. The IRDia dataset is partially considered including 2074 cases with 56 features in which 42.8% of the participants were male, and 57.2% were female. Furthermore, 26.6% of people were labeled as patients with diabetes, and 73.4% of them were labeled as patients without diabetes by the endocrinologist. The description of IRDia’s features and their missing data patterns are reported in Table 1, where MP, LI, CARR, LCTV, CRM, and CMC are, respectively, standing for missing by purpose, logically imputable, logically can take a value, cause, and reason relationship, completely random missing and cause of missingness is manifest. The last column shows the type of missing data pattern for each feature by investigating relationships between the biological characteristics of the features and their conditions.

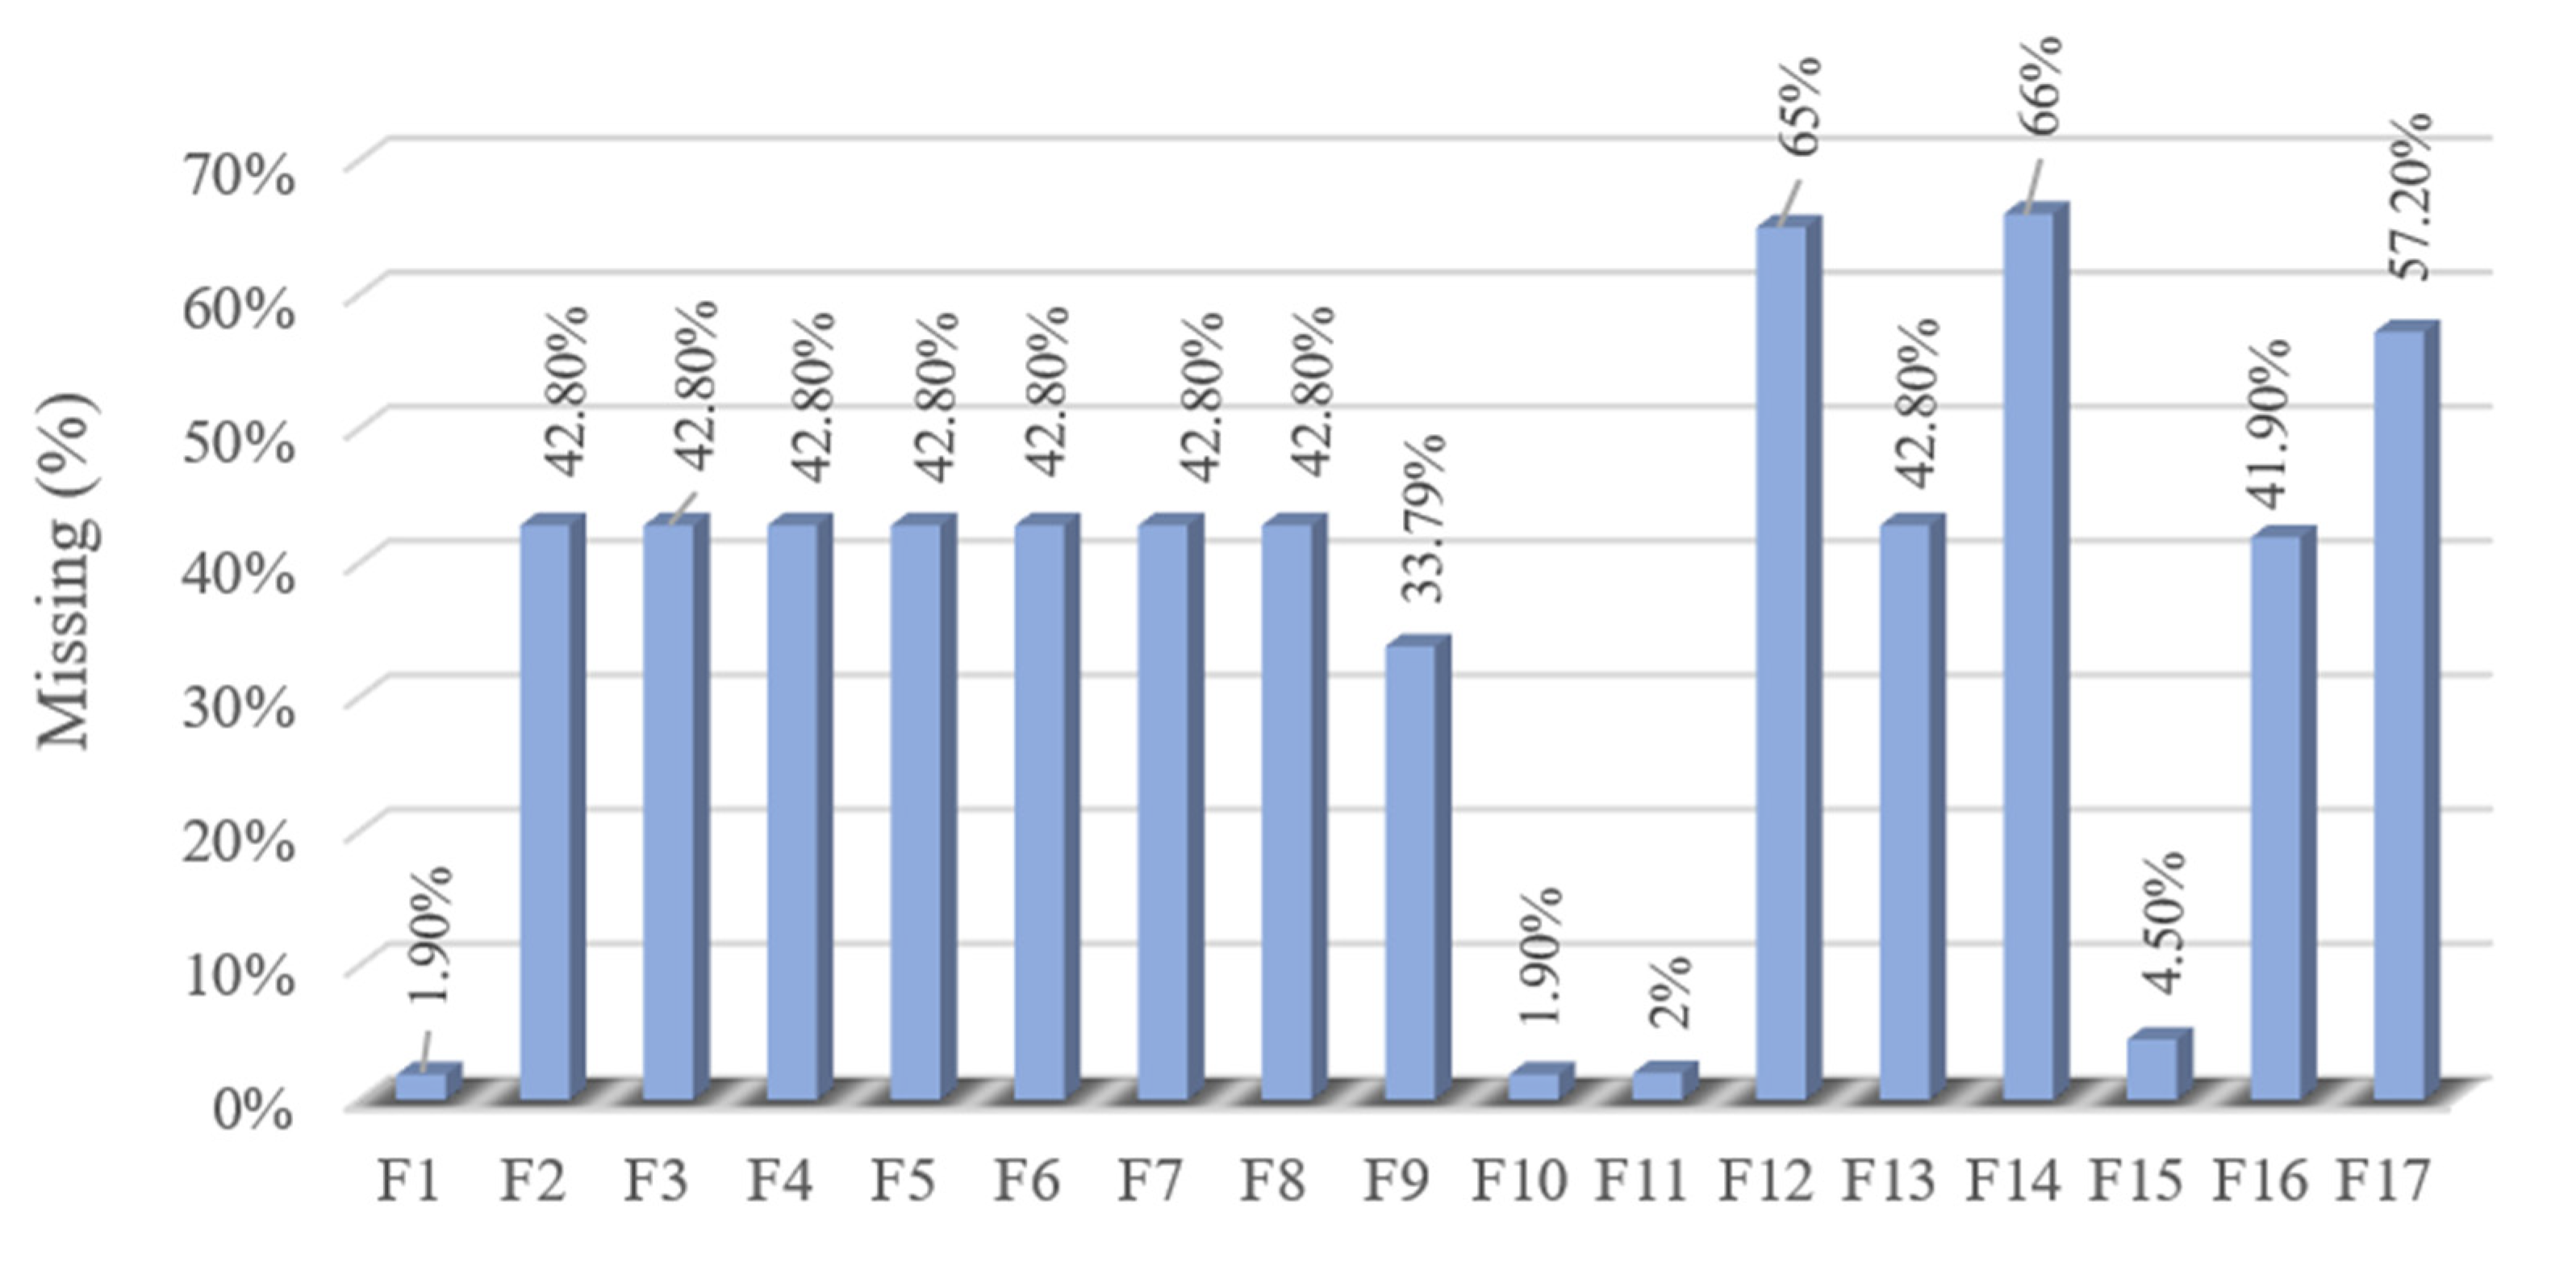
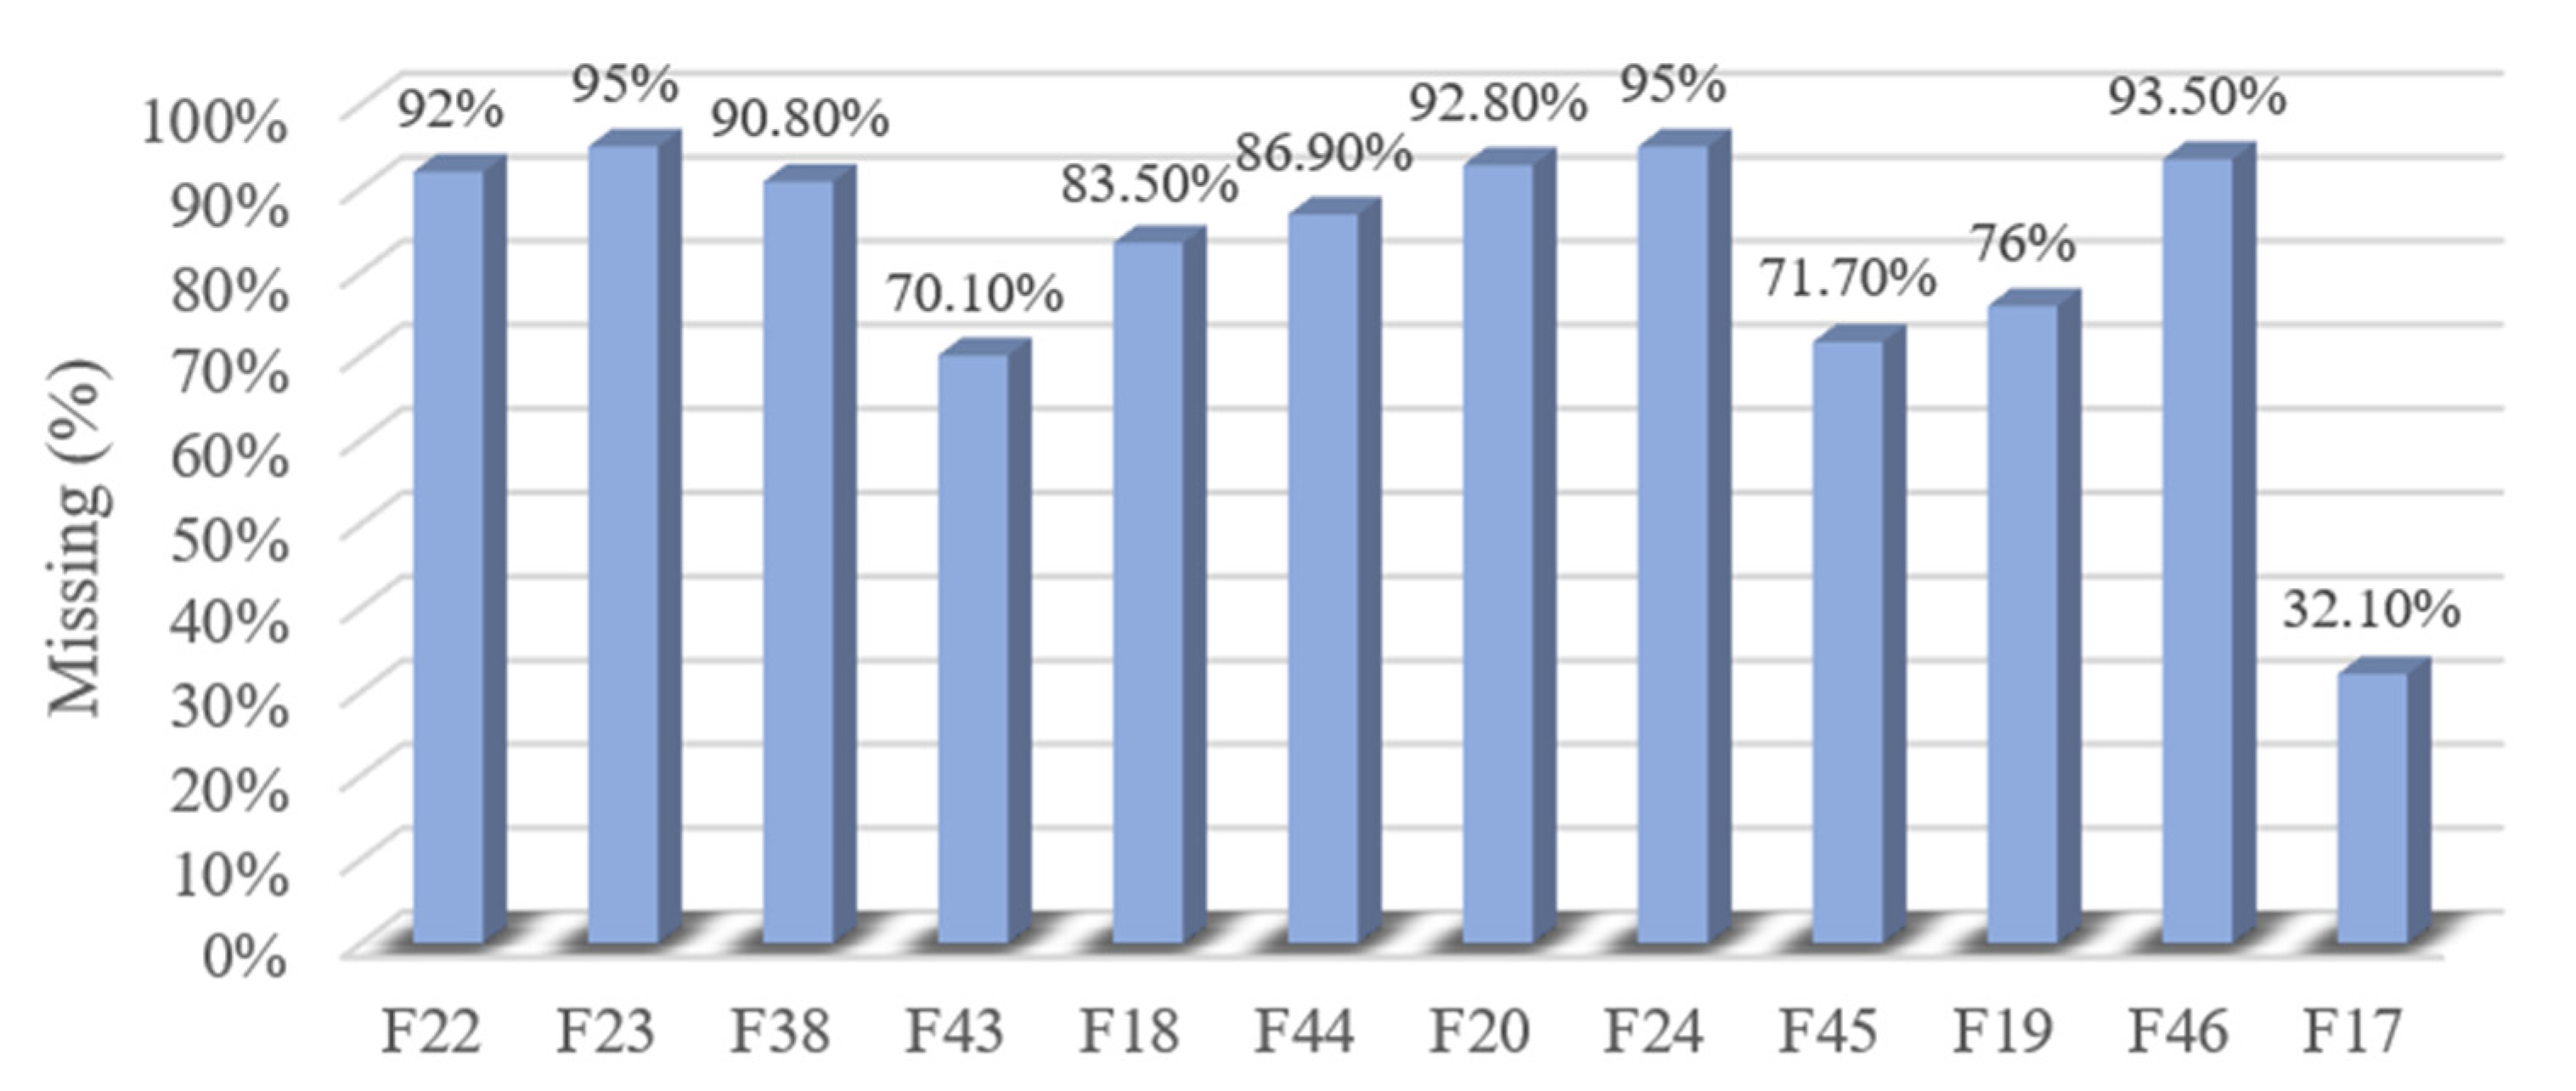
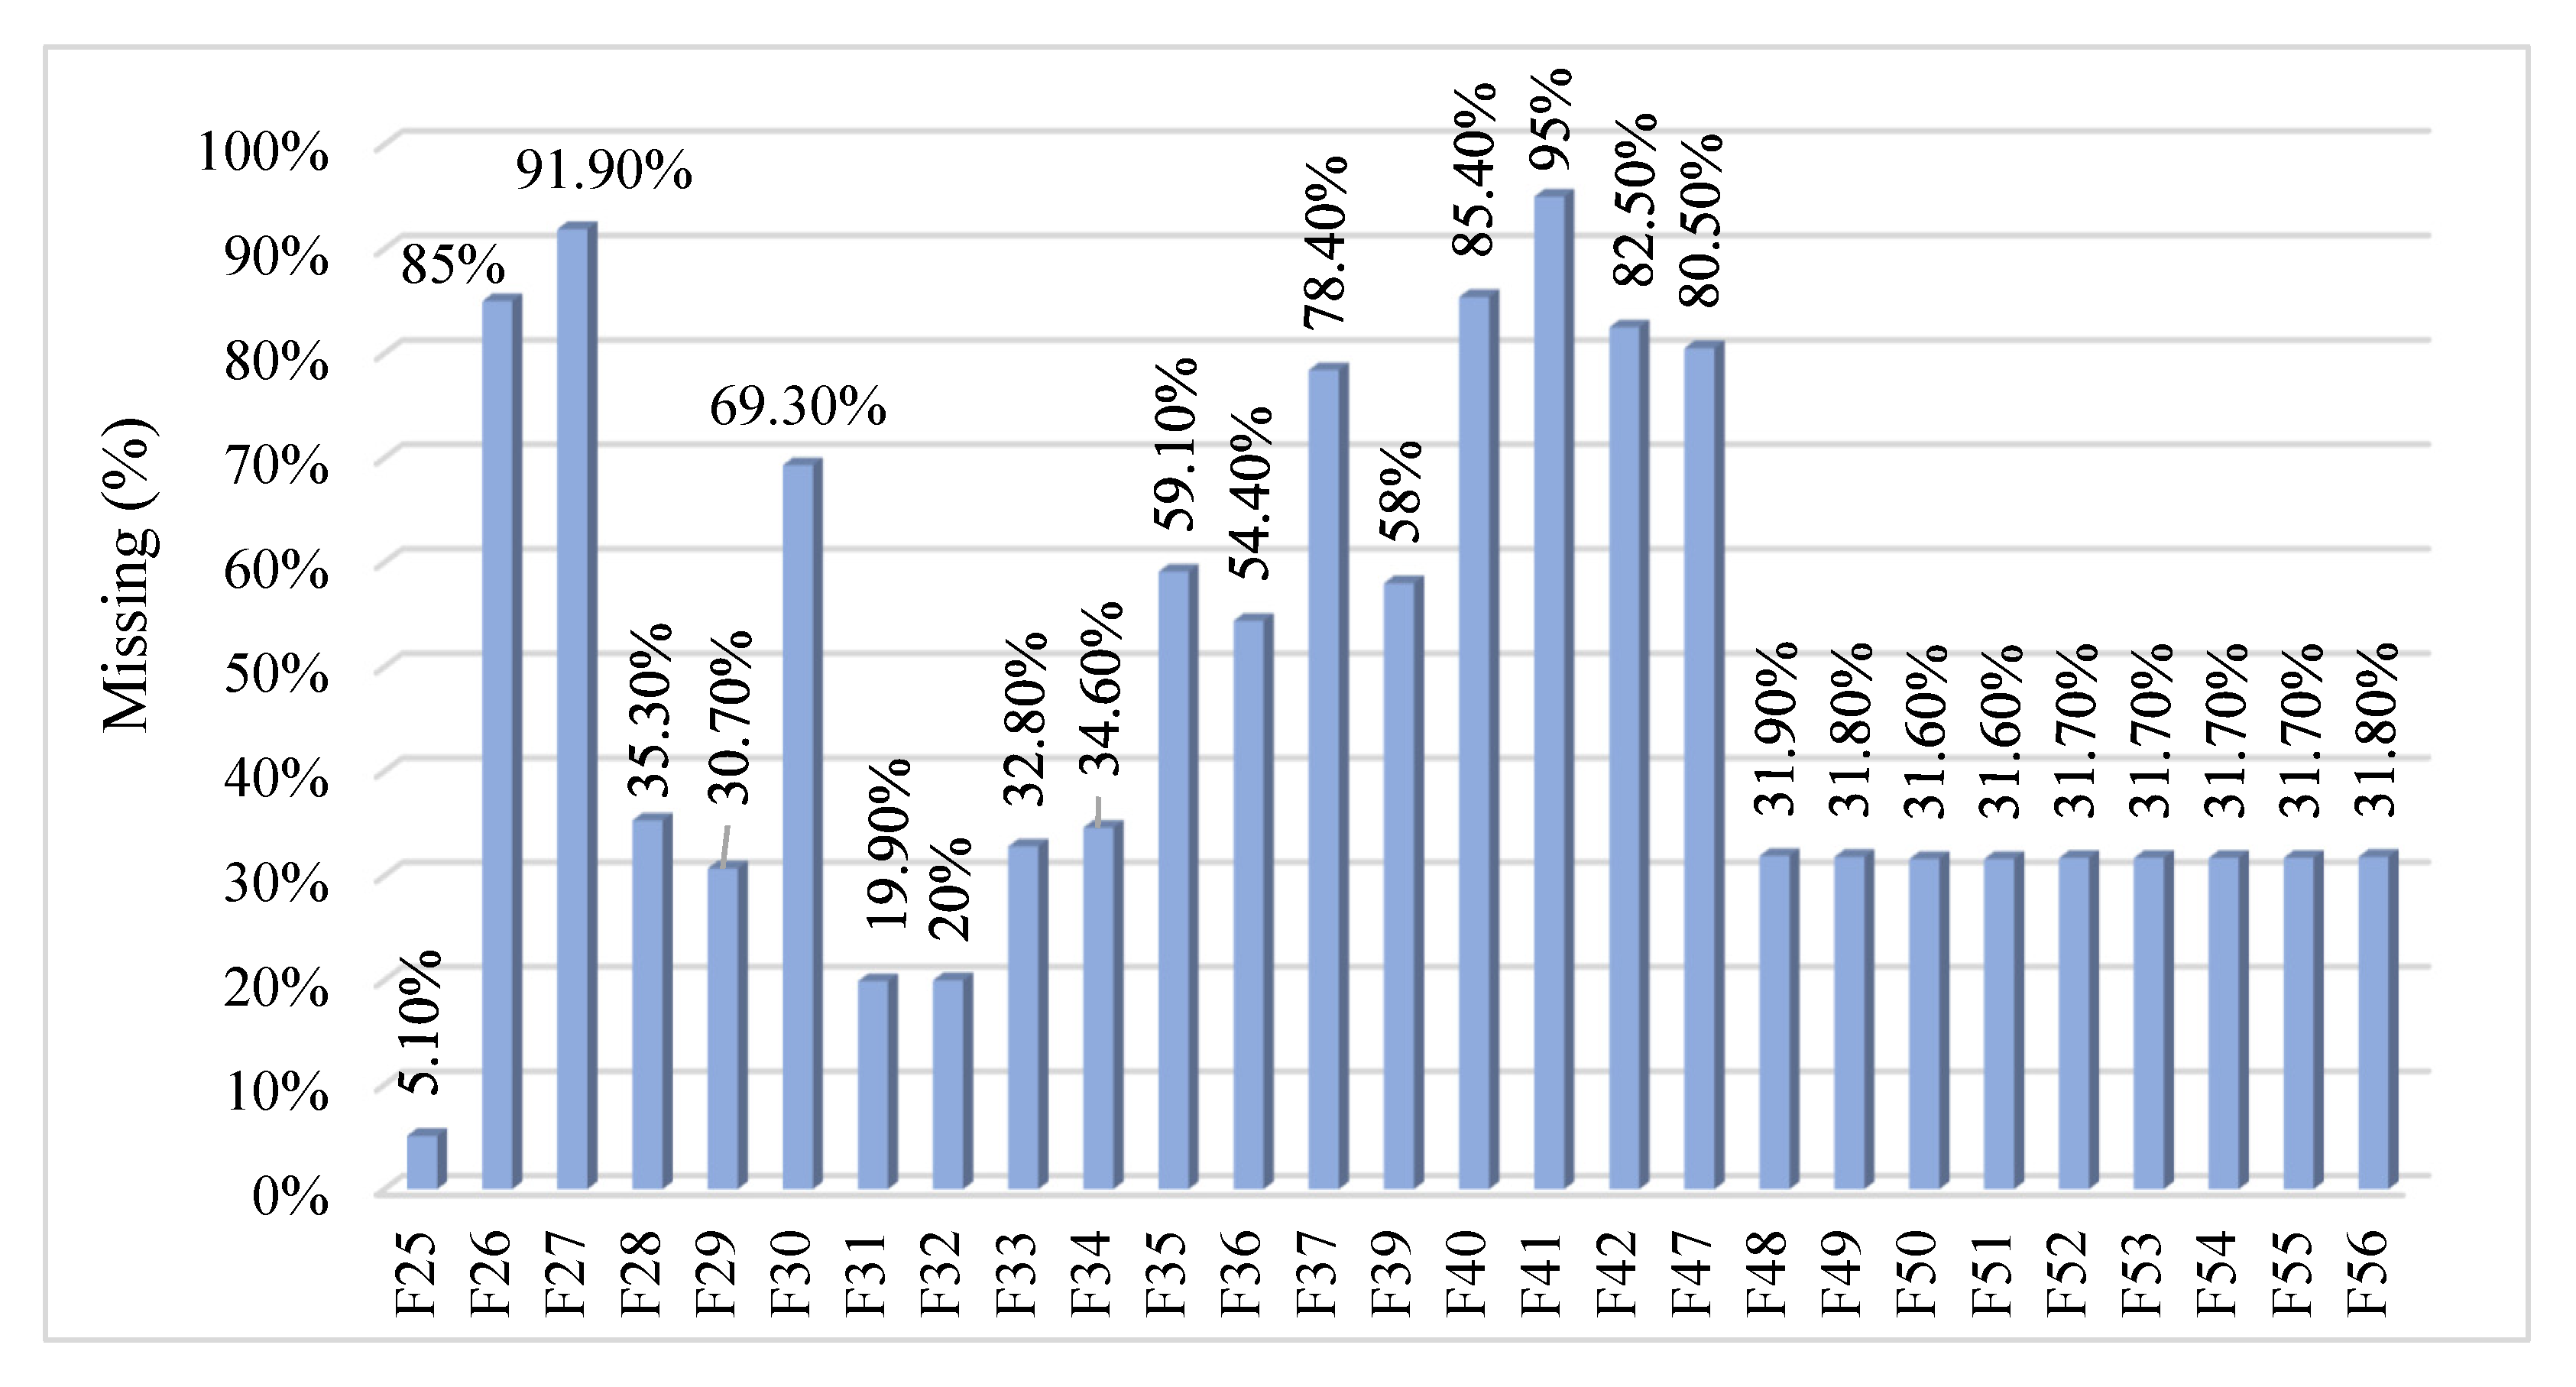
4.3. Missing Data Pattern Analysis

The IRDia dataset consists of three different missing data patterns MNAR, MCAR, and MAR which their descriptive analyses are as follows.
-MNAR pattern analysis: In the IRDia dataset, 17 features follow the MNAR pattern, among which the four features of body fat, basal metabolic rate (BMR), visceral fat, and muscle had, respectively, 1.9%, 4.5%, 2%, and 1.9% incorrect numerical values that were deleted. In this case, not only the cause of missingness was completely clear, but the missing values can also be logically initiated, and the missingness cannot be documented from other features in the dataset because these values were obtained by the signal sent and received within the individual’s body. The blood group feature had 41.9% missingness. This feature can be logically measured, but missingness in this feature cannot be documented from other features. The cause of this missingness was completely clear, which was due to the participant’s unawareness or non-registration of the values in the blood test. This feature was never influenced by clinical and biological factors; thus, it did not seem reasonable to impute it. These missing values were placed with a “non-determined” constant global label value.
Eight other features are related to the pregnancy features, all of which had missingness of 42.8% for male participants. Logically, there was no possible appropriate value for imputation in these values numerically. This missingness was not random, and the cause of missingness was completely clear. Furthermore, the prostate-specific antigen (PSA) feature, which was related to the prostatic enzyme measurement in men, had 57.2% missingness for females. The missingness in these nine features was initiated with the “non-determined” global constant. The MNAR pattern analysis of the IRDia is shown in Figure 3.
-MCAR pattern analysis: There are 13 laboratory features with missing values and there is no intermediate relationship associated with any of them on the condition of another, according to the physician. Therefore, the reasons for missingness occurrence in these features are not related to other data observations. The missingness in these features can result from completely random reasons such as operator’s mistake in importing the data, lack of the patient’s request for the test factor, unnecessary measurement of that factor for the participant in physician’s viewpoint, or measurement of that value in near past. Therefore, the missing values in these features are categorized in the MCAR pattern. These features contributed to the diagnosis of diabetes and, thus, the imputation of the missingness in these values was necessary. The other missing values of the PSA feature were considered in this missing data pattern after initializing by the MNAR hypothesis. Figure 4 presents the percentage of the MCAR pattern of the related features in the IRDia dataset.
-MAR pattern analysis: Figure 5 shows the percentage of the MAR pattern for 27 features categorized by the endocrinologist consultation. These features can interchangeably affect each other in terms of value and lack of value. These features are interrelated and can be initiated biologically for all participants. The missingness in these features can be estimated through other features and is related to the observed values. Once missingness occurs in these features, the cause of missingness is not completely random because the missingness can be affected by the numerical range or the absence of value in another feature. The occurrence of missingness in features depends on their cause-effect relationships with each other. According to the definition of random missingness, these features include this type of missing data pattern.

4.4. Experiments and Results

In this section, the performance of the proposed HIMP method in the IRDia dataset is evaluated by the following three experiment sets. In all experiment sets, the results of the HIMP and other comparative methods are assessed using different classifiers in terms of the accuracy, precision, recall, and F1-score using Equations (4)–(7), respectively. The true classifications are denoted by the number of true positives (TP) and the number of true negatives (TN), while misclassifications are denoted by the number of false positives (FP) and the number of false negatives (FN). In the following three experiment sets, first, the single imputation methods are performed to create the WinnerDMCAR dataset. Then, the multiple imputations methods are conducted to determine the WinnerDMAR dataset. Finally, the winner datasets selected from the single and multiple imputation methods are merged to evaluate the HIMP.
A c c u r a c y   ( % ) = T N + T P T N + T P + F N + F P
P r e c i s i o n   ( % ) = T P T P + F P
R e c a l l   ( % ) = T P T P + F N
F 1 s c o r e   ( % ) = T P T P + 1 2 ( F P + F N )
-
Single imputation experiment
In this experiment set, the single imputation methods KNN and hot-deck compete for imputing missing values with MCAR patterns to determine the WinnerDMCAR dataset. The results reported in Table 2 show that the KNN imputation method has better performance. One of the causes of low accuracy of classification in multiple imputations could be the lack of important biological factors in the diagnosis of diabetes, such as fasting blood sugar as well as the high percentage of missingness in the imputed dataset.
-
Multiple imputation experiment
In this experiment, the Em, MICE, and MCMC multiple imputation methods are considered to impute missing values with MAR patterns in the IRDia dataset and determine the WinnerDMAR dataset by comparing the performance of different classifiers. The multiple imputation method compensates for the imputed uncertainty relative to the unmeasured data, which results in the occurrence of missingness, by generating several datasets. The classification accuracy rate of all the imputed datasets is measured by the CART decision tree classifier. Then, the dataset with the maximum accuracy rate is selected. The selected dataset is the best-imputed dataset and contains imputed data with minimum uncertainty relative to the unmeasured data. The obtained results from this experimental evaluation are reported in Table 3. The MICE method exhibited better performance than the two other methods in the IRDia dataset.
-
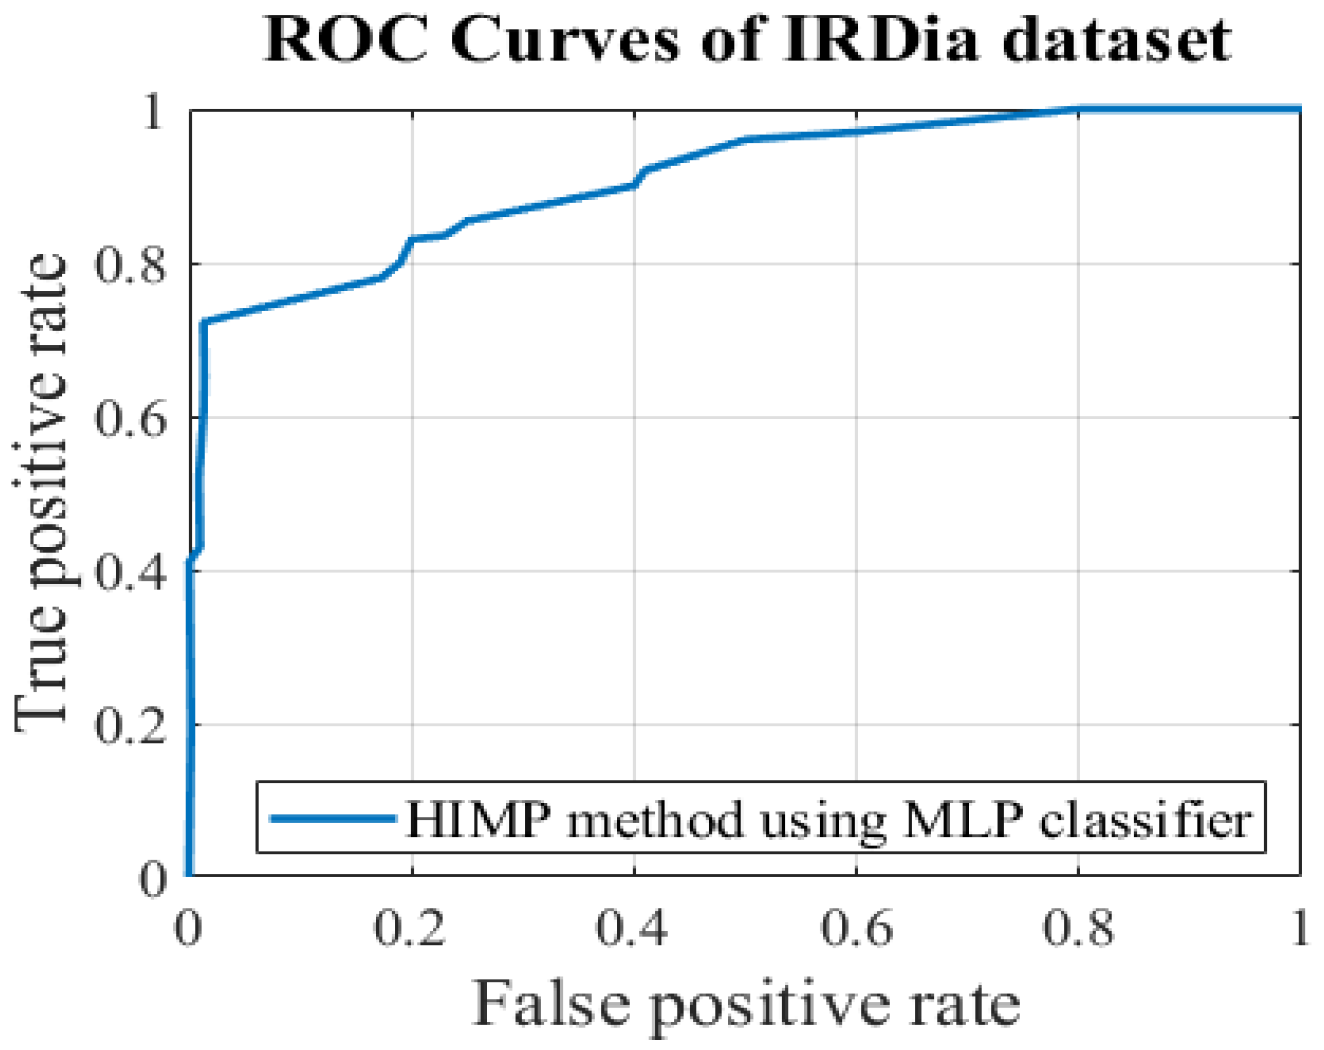
Evaluation of the HIMP imputation method
Once the best single and multiple imputation methods were obtained, imputed datasets WinnerDMCAR and WinnerDMAR with the best results were used to merge the final dataset. Then, the KNN and MICE methods, which yielded the best results, were implemented separately on the entire dataset with missing values. In this experimental evaluation, the hybrid imputation method is compared with MICE [71], KNN [65], fuzzy c-means SvrGa imputation (SvrFcmGa) [59], and without the applying of imputation (along with the missing values) on the IRDia dataset. The obtained results are reported in Table 4. The experimental results demonstrated that the proposed HIMP method yields more sufficient than other imputation methods.
Moreover, the receiver operating characteristic (ROC) curve of the best performance of the proposed HIMP method gained by using the MLP classifier is shown in Figure 6.

5. Conclusions

In real-world medical datasets, the missing data usually occur with different patterns. Failure in identifying the type of missing data pattern and applying imputation methods regardless of the missingness type can reduce the performance of classifiers. Many imputation methods are developed to impute the missing data, however, most of them still do not fulfill different missing data patterns. Therefore, in this paper, first, a four-layer model consisting of analyzing, decomposing, imputing, and merging layers is presented. Then, based on the introduced model a hybrid imputation method (HIMP) is developed to cope with different missing data patterns in the real IRDia dataset collected in our case study. The HIMP consists of six steps: analyzing missing data patterns, imputing missing data with MNAR patterns, decomposing, single imputing, multiple imputing, and hybrid imputation. Since HIMP decomposes dataset imputed by its second steps into two datasets DMCAR and DMAR, it can provide the best estimations by different single and multiple imputations for random and completely random missing data patterns. In fact, the HIMP personalizes the imputation of each type of missing data pattern to find the best estimations and in the end merge them to form the final imputed dataset.
In the experimental evaluation, HIMP and comparative methods were compared using different classifiers in terms of accuracy, precision, recall, and F1-score. The single and multiple imputation experiments were tabulated in Table 2 and Table 3. The obtained results of comparing the HIMP method with imputation methods reported in Table 4 demonstrated that the proposed method yields more sufficient than other imputation methods. The experimental results showed that the HIMP method can make use of the similarity between the same missing data patterns when the original dataset consisted of different missing data patterns such as the real IRDia. The classifiers’ performance over IRDia dataset imputed by the HIMP method proved that the introduced model can be effectively applied to develop hybrid imputation methods for multi-pattern missing data.
In further studies, the introduced model can be applied to develop more effective hybrid imputation methods using a variety of techniques. The HIMP method can also be adapted for other complex datasets with multi-pattern missing data such as microarray gene expression data. Moreover, the HIMP can be improved using other single and multiple imputation methods.

Author Contributions

Conceptualization, M.H.N.-S. and S.M.; methodology, M.H.N.-S., S.M. and H.Z.; software, M.H.N.-S., S.M. and H.Z.; validation, M.H.N.-S., S.M. and H.Z.; formal analysis, M.H.N.-S., S.M. and H.Z.; investigation, M.H.N.-S., S.M. and H.Z.; resources, M.H.N.-S., S.M., M.G. and A.H.G.; data curation, M.H.N.-S., S.M. and H.Z.; writing, M.H.N.-S., S.M. and H.Z.; original draft preparation, M.H.N.-S., S.M. and H.Z.; writing—review and editing, M.H.N.-S., S.M., H.Z., M.G. and A.H.G.; visualization, M.H.N.-S., S.M. and A.H.G.; supervision, M.H.N.-S. and A.H.G.; project administration, M.H.N.-S. and A.H.G. All authors have read and agreed to the published version of the manuscript.

Funding

This research received no external funding.

Institutional Review Board Statement

Not applicable.

Informed Consent Statement

Not applicable.

Data Availability Statement

The data and code used in the research can be obtained from the corresponding author upon request.

Conflicts of Interest

The authors declare no conflict of interest.

References

  1. Fana, S.E.; Esmaeili, F.; Esmaeili, S.; Bandaryan, F.; Esfahani, E.N.; Amoli, M.M.; Razi, F. Knowledge discovery in genetics of diabetes in Iran, a roadmap for future researches. J. Diabetes Metab. Disord. 2021, 20, 1785–1791. [Google Scholar] [CrossRef] [PubMed]
  2. Nejat, N.; Hezave, A.K.M.; Pour, S.M.A.; Rezaei, K.; Moslemi, A.; Mehrabi, F. Self-care and related factors in patients with type II diabetes in Iran. J. Diabetes Metab. Disord. 2021, 20, 635–639. [Google Scholar] [CrossRef] [PubMed]
  3. Tigga, N.P.; Garg, S. Prediction of type 2 diabetes using machine learning classification methods. Procedia Comput. Sci. 2020, 167, 706–716. [Google Scholar] [CrossRef]
  4. Ogurtsova, K.; da Rocha Fernandes, J.; Huang, Y.; Linnenkamp, U.; Guariguata, L.; Cho, N.; Cavan, D.; Shaw, J.; Makaroff, L. IDF Diabetes Atlas: Global estimates for the prevalence of diabetes for 2015 and 2040. Diabetes Res. Clin. Pract. 2017, 128, 40–50. [Google Scholar] [CrossRef] [PubMed] [Green Version]
  5. Farshchi, A.; Esteghamati, A.; Sari, A.A.; Kebriaeezadeh, A.; Abdollahi, M.; Dorkoosh, F.A.; Khamseh, M.E.; Aghili, R.; Keshtkar, A.; Ebadi, M. The cost of diabetes chronic complications among Iranian people with type 2 diabetes mellitus. J. Diabetes Metab. Disord. 2014, 13, 4. [Google Scholar] [CrossRef] [Green Version]
  6. Noshad, S.; Afarideh, M.; Heidari, B.; Mechanick, J.I.; Esteghamati, A. Diabetes care in Iran: Where we stand and where we are headed. Ann. Glob. Health 2015, 81, 839–850. [Google Scholar] [CrossRef] [PubMed] [Green Version]
  7. Swapna, G.; Vinayakumar, R.; Soman, K. Diabetes detection using deep learning algorithms. ICT express 2018, 4, 243–246. [Google Scholar]
  8. Alirezaei, M.; Niaki, S.T.A.; Niaki, S.A.A. A bi-objective hybrid optimization algorithm to reduce noise and data dimension in diabetes diagnosis using support vector machines. Expert Syst. Appl. 2019, 127, 47–57. [Google Scholar] [CrossRef]
  9. Kamel, S.R.; Yaghoubzadeh, R. Feature selection using grasshopper optimization algorithm in diagnosis of diabetes disease. Inform. Med. Unlocked 2021, 26, 100707. [Google Scholar] [CrossRef]
  10. Qiao, L.; Zhu, Y.; Zhou, H. Diabetic retinopathy detection using prognosis of microaneurysm and early diagnosis system for non-proliferative diabetic retinopathy based on deep learning algorithms. IEEE Access 2020, 8, 104292–104302. [Google Scholar] [CrossRef]
  11. Harding, J.L.; Pavkov, M.E.; Magliano, D.J.; Shaw, J.E.; Gregg, E.W. Global trends in diabetes complications: A review of current evidence. Diabetologia 2019, 62, 3–16. [Google Scholar] [CrossRef] [Green Version]
  12. Taheri, H.; Rafaiee, R.; Rafaiee, R. Prevalence of Complications of Diabetes and Risk Factors Among Patients with Diabetes in the Diabetes Clinic in Southeast of Iran. Iran. J. Diabetes Obes. 2021, 13, 10–18. [Google Scholar] [CrossRef]
  13. Schlienger, J.-L. Type 2 diabetes complications. Presse Med. 2013, 42, 839–848. [Google Scholar] [CrossRef] [PubMed]
  14. Vigneri, P.; Frasca, F.; Sciacca, L.; Pandini, G.; Vigneri, R. Diabetes and cancer. Endocr.-Relat. Cancer 2009, 16, 1103–1123. [Google Scholar] [CrossRef] [Green Version]
  15. Ferro, M.; Katalin, M.O.; Buonerba, C.; Marian, R.; Cantiello, F.; Musi, G.; Di Stasi, S.; Hurle, R.; Guazzoni, G.; Busetto, G.M. Type 2 diabetes mellitus predicts worse outcomes in patients with high-grade T1 bladder cancer receiving bacillus Calmette-Guérin after transurethral resection of the bladder tumor. Urol. Oncol. Semin. Orig. Investig. 2020, 38, 459–464. [Google Scholar] [CrossRef] [PubMed]
  16. Giovannone, R.; Busetto, G.M.; Antonini, G.; De Cobelli, O.; Ferro, M.; Tricarico, S.; Del Giudice, F.; Ragonesi, G.; Conti, S.L.; Lucarelli, G. Hyperhomocysteinemia as an early predictor of erectile dysfunction: International Index of Erectile Function (IIEF) and penile Doppler ultrasound correlation with plasma levels of homocysteine. Medicine 2015, 94, e1556. [Google Scholar] [CrossRef]
  17. Mellitus, D. Diagnosis and classification of diabetes mellitus. Diabetes care 2006, 29, S43. [Google Scholar]
  18. Deshpande, A.D.; Harris-Hayes, M.; Schootman, M. Epidemiology of diabetes and diabetes-related complications. Phys. Ther. 2008, 88, 1254–1264. [Google Scholar] [CrossRef] [PubMed] [Green Version]
  19. Rahaman, S. Diabetes diagnosis decision support system based on symptoms, signs and risk factor using special computational algorithm by rule base. In Proceedings of the 2012 15th International Conference on Computer and Information Technology (ICCIT), Chittagong, Bangladesh, 22–24 December 2012; pp. 65–71. [Google Scholar]
  20. Omisore, O.M.; Ojokoh, B.A.; Babalola, A.E.; Igbe, T.; Folajimi, Y.; Nie, Z.; Wang, L. An affective learning-based system for diagnosis and personalized management of diabetes mellitus. Future Gener. Comput. Syst. 2021, 117, 273–290. [Google Scholar] [CrossRef]
  21. Qurat-Ul-Ain, F.A.; Ejaz, M.Y. A comparative analysis on diagnosis of diabetes mellitus using different approaches–A survey. Inform. Med. Unlocked 2020, 21, 100482. [Google Scholar]
  22. Golestan Hashemi, F.S.; Razi Ismail, M.; Rafii Yusop, M.; Golestan Hashemi, M.S.; Nadimi Shahraki, M.H.; Rastegari, H.; Miah, G.; Aslani, F. Intelligent mining of large-scale bio-data: Bioinformatics applications. Biotechnol. Biotechnol. Equip. 2018, 32, 10–29. [Google Scholar] [CrossRef] [Green Version]
  23. Esfandiari, N.; Babavalian, M.R.; Moghadam, A.-M.E.; Tabar, V.K. Knowledge discovery in medicine: Current issue and future trend. Expert Syst. Appl. 2014, 41, 4434–4463. [Google Scholar] [CrossRef]
  24. Fasihi, M.; Nadimi-Shahraki, M.H. Multi-class cardiovascular diseases diagnosis from electrocardiogram signals using 1-D convolution neural network. In Proceedings of the 2020 IEEE 21st International Conference on Information Reuse and Integration for Data Science (IRI), Las Vegas, NV, USA, 11–13 August 2020; pp. 372–378. [Google Scholar]
  25. Bai, B.M.; Nalini, B.; Majumdar, J. Analysis and detection of diabetes using data mining techniques—a big data application in health care. In Emerging Research in Computing, Information, Communication and Applications; Springer: Berlin/Heidelberg, Germany, 2019; pp. 443–455. [Google Scholar]
  26. Zamani, H.; Nadimi-Shahraki, M.-H. Swarm intelligence approach for breast cancer diagnosis. Int. J. Comput. Appl. 2016, 151, 40–44. [Google Scholar] [CrossRef]
  27. Fasihi, M.; Nadimi-Shahraki, M.H.; Jannesari, A. A Shallow 1-D Convolution Neural Network for Fetal State Assessment Based on Cardiotocogram. SN Comput. Sci. 2021, 2, 287. [Google Scholar] [CrossRef]
  28. Dagliati, A.; Marini, S.; Sacchi, L.; Cogni, G.; Teliti, M.; Tibollo, V.; De Cata, P.; Chiovato, L.; Bellazzi, R. Machine learning methods to predict diabetes complications. J. Diabetes Sci. Technol. 2018, 12, 295–302. [Google Scholar] [CrossRef]
  29. Hasan, M.K.; Alam, M.A.; Das, D.; Hossain, E.; Hasan, M. Diabetes prediction using ensembling of different machine learning classifiers. IEEE Access 2020, 8, 76516–76531. [Google Scholar] [CrossRef]
  30. Kavakiotis, I.; Tsave, O.; Salifoglou, A.; Maglaveras, N.; Vlahavas, I.; Chouvarda, I. Machine learning and data mining methods in diabetes research. Comput. Struct. Biotechnol. J. 2017, 15, 104–116. [Google Scholar] [CrossRef]
  31. Zheng, T.; Xie, W.; Xu, L.; He, X.; Zhang, Y.; You, M.; Yang, G.; Chen, Y. A machine learning-based framework to identify type 2 diabetes through electronic health records. Int. J. Med. Inform. 2017, 97, 120–127. [Google Scholar] [CrossRef] [Green Version]
  32. Nadimi-Shaharaki, M.H.; Ghahramani, M. Efficient data preparation techniques for diabetes detection. In Proceedings of the IEEE EUROCON 2015-International Conference on Computer as a Tool (EUROCON), Salamanca, Spain, 8–11 September 2015; pp. 1–6. [Google Scholar]
  33. Eisemann, N.; Waldmann, A.; Katalinic, A. Imputation of missing values of tumour stage in population-based cancer registration. BMC Med. Res. Methodol. 2011, 11, 129. [Google Scholar] [CrossRef] [PubMed] [Green Version]
  34. Yoo, I.; Alafaireet, P.; Marinov, M.; Pena-Hernandez, K.; Gopidi, R.; Chang, J.-F.; Hua, L. Data mining in healthcare and biomedicine: A survey of the literature. J. Med. Syst. 2012, 36, 2431–2448. [Google Scholar] [CrossRef]
  35. Nadimi-Shahraki, M.H.; Banaie-Dezfouli, M.; Zamani, H.; Taghian, S.; Mirjalili, S. B-MFO: A Binary Moth-Flame Optimization for Feature Selection from Medical Datasets. Computers 2021, 10, 136. [Google Scholar] [CrossRef]
  36. Zamani, H.; Nadimi-Shahraki, M.H. Feature selection based on whale optimization algorithm for diseases diagnosis. Int. J. Comput. Sci. Inf. Secur. 2016, 14, 1243. [Google Scholar]
  37. Ramli, M.N.; Yahaya, A.; Ramli, N.; Yusof, N.; Abdullah, M. Roles of imputation methods for filling the missing values: A review. Adv. Environ. Biol. 2013, 7, 3861–3870. [Google Scholar]
  38. Nadimi-Shahraki, M.H.; Taghian, S.; Mirjalili, S. An improved grey wolf optimizer for solving engineering problems. Expert Syst. Appl. 2021, 166, 113917. [Google Scholar] [CrossRef]
  39. Zamani, H.; Nadimi-Shahraki, M.H.; Gandomi, A.H. QANA: Quantum-based avian navigation optimizer algorithm. Eng. Appl. Artif. Intell. 2021, 104, 104314. [Google Scholar] [CrossRef]
  40. Nadimi-Shahraki, M.H.; Fatahi, A.; Zamani, H.; Mirjalili, S.; Abualigah, L. An Improved Moth-Flame Optimization Algorithm with Adaptation Mechanism to Solve Numerical and Mechanical Engineering Problems. Entropy 2021, 23, 1637. [Google Scholar] [CrossRef]
  41. Zamani, H.; Nadimi-Shahraki, M.H.; Gandomi, A.H. CCSA: Conscious neighborhood-based crow search algorithm for solving global optimization problems. Appl. Soft Comput. 2019, 85, 105583. [Google Scholar] [CrossRef]
  42. Enders, C.K. Applied Missing Data Analysis; Guilford Press: New York, NY, USA, 2010. [Google Scholar]
  43. Fazakis, N.; Kostopoulos, G.; Kotsiantis, S.; Mporas, I. Iterative robust semi-supervised missing data imputation. IEEE Access 2020, 8, 90555–90569. [Google Scholar] [CrossRef]
  44. McKnight, P.E.; McKnight, K.M.; Sidani, S.; Figueredo, A.J. Missing Data: A Gentle Introduction; Guilford Press: New York, NY, USA, 2007. [Google Scholar]
  45. Lin, W.-C.; Tsai, C.-F. Missing value imputation: A review and analysis of the literature (2006–2017). Artif. Intell. Rev. 2020, 53, 1487–1509. [Google Scholar] [CrossRef]
  46. Cismondi, F.; Fialho, A.S.; Vieira, S.M.; Reti, S.R.; Sousa, J.M.; Finkelstein, S.N. Missing data in medical databases: Impute, delete or classify? Artif. Intell. Med. 2013, 58, 63–72. [Google Scholar] [CrossRef]
  47. Little, R.J.; Rubin, D.B. Statistical Analysis with Missing Data; John Wiley & Sons: Hoboken, NJ, USA, 2019; Volume 793. [Google Scholar]
  48. Han, J.; Kamber, M.; Pei, J. Data preprocessing. In Data Mining Concepts and Techniques; Morgan Kaufmann: San Francisco, CA, USA, 2006; pp. 47–97. [Google Scholar]
  49. Graham, J.W. Missing data analysis: Making it work in the real world. Ann. Rev. Psychol. 2009, 60, 549–576. [Google Scholar] [CrossRef] [Green Version]
  50. Marwala, T. Computational Intelligence for Missing Data Imputation, Estimation, and Management: Knowledge Optimization Techniques; IGI Global: Hershey, PA, USA, 2009. [Google Scholar]
  51. Thomas, R.M.; Bruin, W.; Zhutovsky, P.; van Wingen, G. Dealing with missing data, small sample sizes, and heterogeneity in machine learning studies of brain disorders. In Machine Learning; Elsevier: Amsterdam, The Netherlands, 2020; pp. 249–266. [Google Scholar]
  52. Carpenter, J.; Kenward, M. Multiple Imputation and Its Application; John Wiley & Sons: Hoboken, NJ, USA, 2012. [Google Scholar]
  53. Van der Heijden, G.J.; Donders, A.R.T.; Stijnen, T.; Moons, K.G. Imputation of missing values is superior to complete case analysis and the missing-indicator method in multivariable diagnostic research: A clinical example. J. Clin. Epidemiol. 2006, 59, 1102–1109. [Google Scholar] [CrossRef] [PubMed]
  54. Raghunathan, K.; Soundarapandian, R.K.; Gandomi, A.H.; Ramachandran, M.; Patan, R.; Madda, R.B. Duo-stage decision: A framework for filling missing values, consistency check, and repair of decision matrices in multicriteria group decision making. IEEE Trans. Eng. Manag. 2019, 68, 1773–1785. [Google Scholar] [CrossRef]
  55. Masconi, K.L.; Matsha, T.E.; Echouffo-Tcheugui, J.B.; Erasmus, R.T.; Kengne, A.P. Reporting and handling of missing data in predictive research for prevalent undiagnosed type 2 diabetes mellitus: A systematic review. EPMA J. 2015, 6, 7. [Google Scholar] [CrossRef] [Green Version]
  56. Rezvan, P.H.; Lee, K.J.; Simpson, J.A. The rise of multiple imputation: A review of the reporting and implementation of the method in medical research. BMC Med. Res. Methodol. 2015, 15, 30. [Google Scholar]
  57. Gómez-Carracedo, M.; Andrade, J.; López-Mahía, P.; Muniategui, S.; Prada, D. A practical comparison of single and multiple imputation methods to handle complex missing data in air quality datasets. Chemom. Intell. Lab. Syst. 2014, 134, 23–33. [Google Scholar] [CrossRef]
  58. Rubin, D.B.; Schenker, N. Multiple imputation in health-are databases: An overview and some applications. Stat. Med. 1991, 10, 585–598. [Google Scholar] [CrossRef]
  59. Aydilek, I.B.; Arslan, A. A hybrid method for imputation of missing values using optimized fuzzy c-means with support vector regression and a genetic algorithm. Inf. Sci. 2013, 233, 25–35. [Google Scholar] [CrossRef]
  60. Li, D.; Zhang, H.; Li, T.; Bouras, A.; Yu, X.; Wang, T. Hybrid Missing Value Imputation Algorithms Using Fuzzy C-Means and Vaguely Quantified Rough Set. IEEE Trans. Fuzzy Syst. 2021. accepted. [Google Scholar] [CrossRef]
  61. Purwar, A.; Singh, S.K. Hybrid prediction model with missing value imputation for medical data. Expert Syst. Appl. 2015, 42, 5621–5631. [Google Scholar] [CrossRef]
  62. Rani, P.; Kumar, R.; Jain, A. HIOC: A hybrid imputation method to predict missing values in medical datasets. Int. J. Intell. Comput. Cybern. 2021, 14, 598–661. [Google Scholar] [CrossRef]
  63. Tian, J.; Yu, B.; Yu, D.; Ma, S. Missing data analyses: A hybrid multiple imputation algorithm using gray system theory and entropy based on clustering. Appl. Intell. 2014, 40, 376–388. [Google Scholar] [CrossRef]
  64. Vazifehdan, M.; Moattar, M.H.; Jalali, M. A hybrid Bayesian network and tensor factorization approach for missing value imputation to improve breast cancer recurrence prediction. J. King Saud Univ. Comput. Inf. Sci. 2019, 31, 175–184. [Google Scholar] [CrossRef]
  65. Malarvizhi, R.; Thanamani, A.S. K-nearest neighbor in missing data imputation. Int. J. Eng. Res. Dev. 2012, 5, 5–7. [Google Scholar]
  66. Ford, B.L. An overview of hot-deck procedures. In Incomplete Data in Sample Surveys; Academic Press: New York, NY, USA, 1983; Volume 2, pp. 185–207. [Google Scholar]
  67. Neal, R.M. Probabilistic Inference Using Markov Chain Monte Carlo Methods; Department of Computer Science, University of Toronto: Toronto, ON, Canada, 1993. [Google Scholar]
  68. Roth, P.L.; Switzer, F.S., III. A Monte Carlo analysis of missing data techniques in a HRM setting. J. Manag. 1995, 21, 1003–1023. [Google Scholar] [CrossRef]
  69. Roth, P.L.; Switzer, F.S., III; Switzer, D.M. Missing data in multiple item scales: A Monte Carlo analysis of missing data techniques. Organ. Res. Methods 1999, 2, 211–232. [Google Scholar] [CrossRef]
  70. Raghunathan, T.E.; Lepkowski, J.M.; Van Hoewyk, J.; Solenberger, P. A multivariate technique for multiply imputing missing values using a sequence of regression models. Surv. Methodol. 2001, 27, 85–96. [Google Scholar]
  71. Van Buuren, S.; Groothuis-Oudshoorn, K. mice: Multivariate imputation by chained equations in R. J. Stat. Softw. 2011, 45, 1–67. [Google Scholar] [CrossRef] [Green Version]
  72. Dempster, A.P.; Laird, N.M.; Rubin, D.B. Maximum likelihood from incomplete data via the EM algorithm. J. R. Stat. Soc. Ser. B Methodol. 1977, 39, 1–22. [Google Scholar]
  73. Dixon, J.K. Pattern recognition with partly missing data. IEEE Trans. Syst. Man Cybern. 1979, 9, 617–621. [Google Scholar] [CrossRef]
  74. García-Laencina, P.J.; Sancho-Gómez, J.-L.; Figueiras-Vidal, A.R. Pattern classification with missing data: A review. Neural Comput. Appl. 2010, 19, 263–282. [Google Scholar] [CrossRef]
  75. Norazian, M.N.; Shukri, A.; Yahaya, P.; Azam, N.; Ramli, P.; Fitri, N.F.; Yusof, M.; Mohd Mustafa Al Bakri, A. Roles of imputation methods for filling the missing values: A review. Adv. Environ. Biol. 2013, 7, 3861–3869. [Google Scholar]
  76. Chowdhury, M.H.; Islam, M.K.; Khan, S.I. Imputation of missing healthcare data. In Proceedings of the 2017 20th International Conference of Computer and Information Technology (ICCIT), Dhaka, Bangladesh, 22–24 December 2017; pp. 1–6. [Google Scholar]
  77. Feng, R.; Grana, D.; Balling, N. Imputation of missing well log data by random forest and its uncertainty analysis. Comput. Geosci. 2021, 152, 104763. [Google Scholar] [CrossRef]
  78. Hegde, H.; Shimpi, N.; Panny, A.; Glurich, I.; Christie, P.; Acharya, A. MICE vs. PPCA: Missing data imputation in healthcare. Inform. Med. Unlocked 2019, 17, 100275. [Google Scholar] [CrossRef]
  79. Jerez, J.M.; Molina, I.; García-Laencina, P.J.; Alba, E.; Ribelles, N.; Martín, M.; Franco, L. Missing data imputation using statistical and machine learning methods in a real breast cancer problem. Artif. Intell. Med. 2010, 50, 105–115. [Google Scholar] [CrossRef]
  80. Liu, Z.-g.; Pan, Q.; Dezert, J.; Martin, A. Adaptive imputation of missing values for incomplete pattern classification. Pattern Recognit. 2016, 52, 85–95. [Google Scholar] [CrossRef] [Green Version]
  81. Zhong, C.; Pedrycz, W.; Wang, D.; Li, L.; Li, Z. Granular data imputation: A framework of granular computing. Appl. Soft Comput. 2016, 46, 307–316. [Google Scholar] [CrossRef]
  82. Jeong, D.; Park, C.; Ko, Y.M. Missing data imputation using mixture factor analysis for building electric load data. Appl. Energy 2021, 304, 117655. [Google Scholar] [CrossRef]
  83. Lin, T.H. A comparison of multiple imputation with EM algorithm and MCMC method for quality of life missing data. Qual. Quant. 2010, 44, 277–287. [Google Scholar] [CrossRef]
  84. Poolsawad, N.; Moore, L.; Kambhampati, C.; Cleland, J.G. Handling missing values in data mining—A case study of heart failure dataset. In Proceedings of the 2012 9th International Conference on Fuzzy Systems and Knowledge Discovery (FSKD), Chongqing, China, 29–31 May 2012; pp. 2934–2938. [Google Scholar]
  85. Azur, M.J.; Stuart, E.A.; Frangakis, C.; Leaf, P.J. Multiple imputation by chained equations: What is it and how does it work? Int. J. Methods Psychiatr. Res. 2011, 20, 40–49. [Google Scholar] [CrossRef]
  86. Rahman, S.A.; Huang, Y.; Claassen, J.; Heintzman, N.; Kleinberg, S. Combining Fourier and lagged k-nearest neighbor imputation for biomedical time series data. J. Biomed. Inform. 2015, 58, 198–207. [Google Scholar] [CrossRef] [PubMed] [Green Version]
  87. Del Giudice, F.; Glover, F.; Belladelli, F.; De Berardinis, E.; Sciarra, A.; Salciccia, S.; Kasman, A.M.; Chen, T.; Eisenberg, M.L. Association of daily step count and serum testosterone among men in the United States. Endocrine 2021, 72, 874–881. [Google Scholar] [CrossRef] [PubMed]
  88. Liu, B.; Yu, M.; Graubard, B.I.; Troiano, R.P.; Schenker, N. Multiple imputation of completely missing repeated measures data within person from a complex sample: Application to accelerometer data in the National Health and Nutrition Examination Survey. Stat. Med. 2016, 35, 5170–5188. [Google Scholar] [CrossRef] [PubMed]
  89. Saint-Maurice, P.F.; Troiano, R.P.; Bassett, D.R.; Graubard, B.I.; Carlson, S.A.; Shiroma, E.J.; Fulton, J.E.; Matthews, C.E. Association of daily step count and step intensity with mortality among US adults. Jama 2020, 323, 1151–1160. [Google Scholar] [CrossRef] [PubMed]
  90. Zhang, S. Nearest neighbor selection for iteratively kNN imputation. J. Syst. Softw. 2012, 85, 2541–2552. [Google Scholar] [CrossRef]
  91. Lakshminarayan, K.; Harp, S.A.; Samad, T. Imputation of missing data in industrial databases. Appl. Intell. 1999, 11, 259–275. [Google Scholar] [CrossRef]
  92. Rubin, D.B. Multiple Imputation for Nonresponse in Surveys; John Wiley & Sons: Hoboken, NJ, USA, 2004; Volume 81. [Google Scholar]
  93. Zhang, Z. Missing data imputation: Focusing on single imputation. Ann. Transl. Med. 2016, 4, 9. [Google Scholar]
  94. Khan, S.I.; Hoque, A.S.M.L. SICE: An improved missing data imputation technique. J. Big Data 2020, 7, 1–21. [Google Scholar] [CrossRef]
  95. Giardina, M.; Huo, Y.; Azuaje, F.; McCullagh, P.; Harper, R. A missing data estimation analysis in type II diabetes databases. In Proceedings of the 2005 18th IEEE Symposium on Computer-Based Medical Systems, Dublin, Ireland, 23–24 June 2005; pp. 347–352. [Google Scholar]
  96. Aljuaid, T.; Sasi, S. Proper imputation techniques for missing values in data sets. In Proceedings of the 2016 International Conference on Data Science and Engineering (ICDSE), Cochin, India, 23–25 August 2016; pp. 1–5. [Google Scholar]
  97. Mirkes, E.M.; Coats, T.J.; Levesley, J.; Gorban, A.N. Handling missing data in large healthcare dataset: A case study of unknown trauma outcomes. Comput. Biol. Med. 2016, 75, 203–216. [Google Scholar] [CrossRef] [Green Version]
  98. Sovilj, D.; Eirola, E.; Miche, Y.; Björk, K.-M.; Nian, R.; Akusok, A.; Lendasse, A. Extreme learning machine for missing data using multiple imputations. Neurocomputing 2016, 174, 220–231. [Google Scholar] [CrossRef]
  99. Faisal, S.; Tutz, G. Multiple imputation using nearest neighbor methods. Inf. Sci. 2021, 570, 500–516. [Google Scholar] [CrossRef]
  100. Blazek, K.; van Zwieten, A.; Saglimbene, V.; Teixeira-Pinto, A. A practical guide to multiple imputation of missing data in nephrology. Kidney Int. 2021, 99, 68–74. [Google Scholar] [CrossRef] [PubMed]
  101. Yoon, S.; Sull, S. GAMIN: Generative adversarial multiple imputation network for highly missing data. In Proceedings of the IEEE/CVF Conference on Computer Vision and Pattern Recognition, Seattle, WA, USA, 13–19 June 2020; pp. 8456–8464. [Google Scholar]
  102. Takahashi, M. Multiple imputation regression discontinuity designs: Alternative to regression discontinuity designs to estimate the local average treatment effect at the cutoff. Commun. Stat. Simul. Comput. 2021, 50, 1–20. [Google Scholar] [CrossRef]
  103. Shin, K.; Han, J.; Kang, S. MI-MOTE: Multiple imputation-based minority oversampling technique for imbalanced and incomplete data classification. Inf. Sci. 2021, 575, 80–89. [Google Scholar] [CrossRef]
  104. Gautam, C.; Ravi, V. Data imputation via evolutionary computation, clustering and a neural network. Neurocomputing 2015, 156, 134–142. [Google Scholar] [CrossRef]
  105. Aleryani, A.; Wang, W.; De La Iglesia, B. Multiple Imputation Ensembles (MIE) for dealing with missing data. SN Comput. Sci. 2020, 1, 134. [Google Scholar] [CrossRef] [Green Version]
  106. Xu, X.; Chong, W.; Li, S.; Arabo, A.; Xiao, J. MIAEC: Missing data imputation based on the evidence chain. IEEE Access 2018, 6, 12983–12992. [Google Scholar] [CrossRef]
  107. Tsai, C.-F.; Li, M.-L.; Lin, W.-C. A class center based approach for missing value imputation. Knowl.-Based Syst. 2018, 151, 124–135. [Google Scholar] [CrossRef]
  108. González-Vidal, A.; Rathore, P.; Rao, A.S.; Mendoza-Bernal, J.; Palaniswami, M.; Skarmeta-Gómez, A.F. Missing data imputation with bayesian maximum entropy for internet of things applications. IEEE Internet Things J. 2020, 8, 16108–16120. [Google Scholar] [CrossRef]
  109. Mostafa, S.M.; Eladimy, A.S.; Hamad, S.; Amano, H. CBRL and CBRC: Novel Algorithms for Improving Missing Value Imputation Accuracy Based on Bayesian Ridge Regression. Symmetry 2020, 12, 1594. [Google Scholar] [CrossRef]
  110. Li, L.; Zhou, H.; Liu, H.; Zhang, C.; Liu, J. A hybrid method coupling empirical mode decomposition and a long short-term memory network to predict missing measured signal data of SHM systems. Struct. Health Monit. 2020, 20, 1778–1793. [Google Scholar] [CrossRef]
  111. Park, S.-W.; Ko, J.-S.; Huh, J.-H.; Kim, J.-C. Review on Generative Adversarial Networks: Focusing on Computer Vision and Its Applications. Electronics 2021, 10, 1216. [Google Scholar] [CrossRef]
  112. Zhang, Y.; Zhou, B.; Cai, X.; Guo, W.; Ding, X.; Yuan, X. Missing value imputation in multivariate time series with end-to-end generative adversarial networks. Inf. Sci. 2021, 551, 67–82. [Google Scholar] [CrossRef]
  113. Faisal, S.; Tutz, G. Imputation Methods for High-Dimensional Mixed-Type Datasets by Nearest Neighbors. Comput. Biol. Med. 2021, 135, 104577. [Google Scholar] [CrossRef]
  114. Wan, D.; Razavi-Far, R.; Saif, M.; Mozafari, N. COLI: Collaborative Clustering Missing Data Imputation. Pattern Recognit. Lett. 2021, 152, 420–427. [Google Scholar] [CrossRef]
  115. Shahjaman, M.; Rahman, M.R.; Islam, T.; Auwul, M.R.; Moni, M.A.; Mollah, M.N.H. rMisbeta: A robust missing value imputation approach in transcriptomics and metabolomics data. Comput. Biol. Med. 2021, 138, 104911. [Google Scholar] [CrossRef] [PubMed]
  116. Hu, X.; Pedrycz, W.; Wu, K.; Shen, Y. Information granule-based classifier: A development of granular imputation of missing data. Knowl.-Based Syst. 2021, 214, 106737. [Google Scholar] [CrossRef]
  117. Nugroho, H.; Utama, N.P.; Surendro, K. Class center-based firefly algorithm for handling missing data. J. Big Data 2021, 8, 37. [Google Scholar] [CrossRef]
Figure 1. The introduced model for imputing multi-pattern missing data.
Electronics 10 03167 g001
Figure 2. The proposed HIMP method.
Electronics 10 03167 g002
Figure 3. The MNAR pattern analysis of the IRDia dataset.
Electronics 10 03167 g003
Figure 4. The MCAR pattern analysis of the IRDia dataset.
Electronics 10 03167 g004
Figure 5. The MAR pattern analysis of the IRDia dataset.
Electronics 10 03167 g005
Figure 6. ROC curve of the best performance of the HIMP method.
Electronics 10 03167 g006
Table 1. Description of the IRDia’s features and their missing data patterns (MDPs).
No.Feature NameMPLICARRLCTVCRMCMCMDPs
F1Body fat--MNAR
F2Pregnancy---MNAR
F3The total number of pregnancies---MNAR
F4Pregnancy diabetes---MNAR
F5Background of miscarriage---MNAR
F6Background of birthing dead baby---MNAR
F7Background of a premature baby---MNAR
F8Macrosomia (babies weighing > 4kg)---MNAR
F9Forearm measurement--MNAR
F10Muscle--MNAR
F11Visceral fat level--MNAR
F12Mid upper arm circumference (MUAC) --MNAR
F13Polycystic ovary syndrome (PCOS)---MNAR
F14Leg width measurement--MNAR
F15Basal metabolic rate (BMR)--MNAR
F16Blood types--MNAR
F17Prostate-specific antigen (PSA)---MNAR-MCAR
F18Calcium (Ca)---MCAR
F19Vitamin d 25-hydroxy test---MCAR
F20Iron---MCAR
F21Phosphorus (PO4)---MCAR
F22Sodium (NA)---MCAR
F23Folic acid---MCAR
F24Total iron-binding capacity (TIBC) ---MCAR
F25Fasting blood sugar (FBS)-MAR
F262-h post-prandial blood glucose (2hPG) test-MAR
F27Glucose 5pm (G 5pm)-MAR
F28Blood urea nitrogen (BUN)-MAR
F29Creatinine blood test (Cr)-MAR
F30Uric acid blood test-MAR
F31Triglycerides blood test-MAR
F32Cholesterol-MAR
F33High-density lipoprotein (HDL) cholesterol-MAR
F34Low-density lipoprotein (LDL) cholesterol-MAR
F35Serum glutamic oxaloacetic transaminase (SGOT)-MAR
F36Serum glutamic pyruvic transaminase (SGPT)-MAR
F37Hemoglobin A1c (HbA1c)-MAR
F38Potassium blood test---MCAR
F39Thyroid stimulating hormone (TSH)-MAR
F40Triiodothyronine (T3)-MAR
F41T3 uptake (T3RU)-MAR
F42Total thyroxine (T4) test-MAR
F43Erythrocyte sedimentation rate (ESR 1hr)---MCAR
F44C-reactive protein (CRP)---MCAR
F45Alkaline phosphatase (ALP)---MCAR
F46Ferritin---MCAR
F47Urine culture-MAR
F48Urine color-MAR
F49Urine appearance-MAR
F50Urine specific gravity-MAR
F51Urine pH test-MAR
F52Urine nitrate test (NT)-MAR
F53Urine glucose test-MAR
F54Urine ketones test-MAR
F55Urine protein test-MAR
F56Hemoglobin in the urine (hemoglobinuria)-MAR
Table 2. Single imputation comparison on the MCAR dataset.
Assessing Metrics (%)ClassifiersHot-DeckKNN
Imputation MethodImputation Method
AccuracyMLP75.01%78.56%
KNN70.40%74.05%
CART71.26%79.05%
PrecisionMLP76.21%77.01%
KNN69.34%70.91%
CART68.71%71.55%
RecallMLP75.28%77.21%
KNN67.63%69.18%
CART70.92%72.45%
F1-scoreMLP75.74%77.11%
KNN68.47%70.03%
CART69.80%71.80%
Table 3. Multiple imputation comparison on the MAR dataset.
Assessing Metrics (%)ClassifiersEm ImputationMCMC ImputationMICE Imputation
Accuracy MLP86.34%85.01%91.04%
KNN82.66%79.61%83.23%
CART83.77%82.95%84.67%
Precision MLP82.47%87.16%90.50%
KNN81.42%78.80%82.23%
CART80.66%79.57%83.26%
Recall MLP81.09%80.65%86.97%
KNN79.65%71.27%85.53%
CART80.79%79.15%81.23%
F1-score MLP81.77%83.78%88.70%
KNN80.53%74.85%83.85%
CART80.73%79.36%82.23%
Table 4. Comparing the HIMP method with other imputation methods.
Assessing MetricsClassifiersWithout-ImputationMICE ImputationKNN ImputationSvrFcmGa ImputationHIMP Method
Accuracy MLP75.43%91.56%78.56%90.21%94.23%
KNN72.31%83.20%74.95%83.91%85.91%
CART74.82%84.67%79.52%82.49%86.38%
Precision MLP73.45%90.50%77.01%89.54%91.68%
KNN71.59%82.23%70.91%80.25%86.47%
CART72.87%83.26%71.55%81.12%85.27%
Recall MLP71.95%86.97%77.21%88.94%96.36%
KNN69.53%85.53%69.18%79.48%83.94%
CART68.28%81.23%72.45%80.67%84.57%
F1-scoreMLP72.69%88.70%77.11%89.24%93.97%
KNN70.55%83.85%70.03%79.86%85.19%
CART70.50%82.23%71.80%80.89%84.92%
Publisher’s Note: MDPI stays neutral with regard to jurisdictional claims in published maps and institutional affiliations.

