Article

ANN and SSO Algorithms for a Newly Developed Flexible Grid Trading Model

1
Department of Industrial Engineering and Engineering Management, National Tsing Hua University, Hsinchu 300044, Taiwan
2
Institute of Systems Neuroscience, National Tsing Hua University, Hsinchu 300044, Taiwan
3
Department of International Logistics and Transportation Management, Kainan University, Taoyuan 33857, Taiwan
*
Author to whom correspondence should be addressed.
Electronics 2022, 11(19), 3259; https://doi.org/10.3390/electronics11193259
Submission received: 9 September 2022 / Revised: 5 October 2022 / Accepted: 8 October 2022 / Published: 10 October 2022
(This article belongs to the Special Issue Feature Papers in "Networks" Section)

Abstract

:
In the modern era, the trading methods and strategies used in the financial market have gradually changed from traditional on-site trading to electronic remote trading, and even online automatic trading performed by pre-programmed computer programs. This is due to the conduct of trading automatically and self-adjustment in financial markets becoming a competitive development trend in the entire financial market, with the continuous development of network and computer computing technology. Quantitative trading aims to automatically form a fixed and quantifiable operational logic from people’s investment decisions and apply it to the financial market, which has attracted the attention of the financial market. The development of self-adjustment programming algorithms for automatically trading in financial markets has transformed to being a top priority for academic research and financial practice. Thus, a new flexible grid trading model incorporating the Simplified Swarm Optimization (SSO) algorithm for optimizing parameters for various market situations as input values and the Fully Connected Neural Network (FNN) and Long Short-Term Memory (LSTM) model for training a quantitative trading model for automatically calculating and adjusting the optimal trading parameters for trading after inputting the existing market situation are developed and studied in this work. The proposed model provides a self-adjust model to reduce investors’ effort in the trading market, obtains outperformed Return of Investment (ROI) and model robustness, and can properly control the balance between risk and return.

1. Introduction

The formulation of financial market trading methods and strategies has changed with the continuous development of network and computer computing technology from the late 20th century to the present. Increasingly more financial institutions and major market trading are gradually changing from traditional on-site trading to electronic remote trading, and even automated trading can be performed in a pre-programmed computer program (algorithmic trading). According to statistics, the US stock market, with the most developed financial market, currently has as many as 60 to 70 percent of its trading automated by programmed programs. In this wave of application of computer computing technology and financial markets, the combination of quantitative trading and computer algorithm is particularly prosperous [1].
The main function of the financial market is to provide the current market price of traded commodities so that market participants can benefit from it. Quantitative trading emerged in the stock market in the late 20th century. In recent years, it has been widely applied in automated trading systems in the stock, currency, and futures markets. In order to receive excess returns, statistics and mathematical models are used to obtain the high probability of the market happening in the future and formulate a corresponding set of modeled trading logic for market trading by observing a large amount of historical data in the past.
The biggest feature of quantitative trading is the use of a fixed set of logic for trading, which is most often used in the stock and futures trading market, in order to obtain a stable and continuous excess return above the average return. In addition, the aspects considered by quantitative trading are becoming increasingly more diverse including market composition, developmental evaluation of investment targets, and market sentiment, which can be used for further analysis and reference. With the development of the information age, more relevant information has been completely collected and retained, which can provide quantitative trading models for reference and analysis, make up for the inability of the human brain to quickly digest large amounts of data, and can make decisions more objectively and not be affected by market sentiment.
Nowadays, with the changes of the times, international trade and the internet have promoted the active free trade market, which reduces trading costs and expands the scale and scope of trading, and the relationship between the financial industry and technology is also deepening as well as becoming more mature and popular [2,3]. How to use the increasingly developed computer computing as an auxiliary tool for financial market trading and even becoming the key to the success of traders’ profits has become the focus of research in the financial community in recent years.
In the early e-commerce applications, more attention was paid to how to transform the physical trading form into an electronic trading form including inputting and storing trading information by the form of electronic files, which is convenient for future searching and analysis. Such simple trading is changed from manual services to electronic services, which greatly reduces labor costs.
After the preliminary results of electronic finance in recent years, financial industry players hope that in addition to using computers to complete simple trading procedures, they can further use mature computer programs to help people complete more complex trading decisions. Especially in recent years, artificial intelligence has become increasingly prosperous, and there have been many breakthrough developments [4,5,6,7]. How to use computer programs to imitate human thinking logic, assist trading, and even think faster, wider, and deeper than humans has become the direction of development and research in the financial field in recent years.
Trading-related programming algorithms have emerged since the late 1980s. In the early days, more human or statistical tools were used for analysis and decision making, and then computer programs were used for trading. However, in the past 10 to 20 years, more quantitative trading has modeled the decision-making process and designed it into the trading algorithm with the trading logic resulting to make the algorithm more intelligent and automatic. Additionally, it has become a highly practical and popular research, which has attracted the attention and practice of many governments and financial institutions [8].
Today, there are many rich and diverse research results in the field of trading algorithm research, such as the use of mean regression to adjust the allocation of stock investment weights [9], the use of LSTM combined with the grid trading method (GTM) to predict market trends for currency trading [10], using box theory combined with Support Vector Machine (SVM) to assist stock trading decisions [11], using Ichimoku Kinkohyo to analyze foreign exchange trading [12], and the use of market trends instead of fixed time series to make trading decisions for the trading strategy of the execution unit [13]. It is not difficult to see that the use of computer programs to assist trading and even directly making trading decisions and executing trading have become an unstoppable trend in financial development.
The most basic definition of the grid trading method is an average pending order within a specific price range to carry out a trading strategy of buying low and selling high [14]. The principle of grid trading is simple but it can effectively earn spread profits when prices fluctuate. In recent years, this strategy has been often applied to arbitrage in many financial markets [15,16].
SSO was proposed by Yeh [17] in 2009 to improve the problem of Particle Swarm Optimization (PSO) in solving discrete problems with the core concept of simplicity. SSO simplifies the algorithm and improves the efficiency of the solution, and has been widely used in solving problems in many different fields [18,19,20,21,22,23,24,25,26,27,28,29]. Finding the best parameter combination is one of the SSO applications. Multiple parameters can be considered and adjusted at the same time to find the best parameter combination, which has been used to adjust the hyperparameter combination of convolutional neural network [30], optimize the parameters of solar models [31,32,33], and adjust the parameters in Artificial Neural Network (ANN) [34].
Recently, the application of Deep Learning (DL) and ANN in financial activities has become more diverse, of which the most widely used include the prediction of the stock market, exchange rate, and financial index [35]. At present, there are still many studies trying to use various neural network models to assist people in financial forecasting and decision making [36,37,38] for making more rational and accurate judgments.
In sum, this study proposes a new grid trading model, adopts SSO algorithm to find parameters suitable for various market situations as input values and labels, trains the FNN and LSTM model, and finally, a quantitative trading model can automatically calculate and adjust the optimal trading parameters for trading after inputting the existing market situation.
Following the rise of e-commerce and quantitative trading mentioned above, the relationship between people’s economic activities and technology has become increasingly more inseparable, and many trading relies on programs to complete. In future trends, programs will not only help people record trading and complete transfers but even help people make trading decisions automatically, including determining the timing and price of trading. Against the foregoing background, the purpose of this study is to:
  • Provide a new set of grid trading algorithms to improve the shortcomings of premature entry and exit of existing grid trading models in the market.
  • Enable the trading algorithm to adapt to change in the external environment as time and market conditions change, and self-adjust the model to reduce investors’ effort in the trading market.
  • Reduce the irrational decisions brought about by investors’ subjective trading decisions, through a set of training models with logical rules.
  • Balance the relationship between risk and profit, and obtain an excellent reward under a certain reasonable risk.
The structures of the remaining sections of the article are organized as follows. An overview of grid trading, SSO, and DL are described in Section 2. Section 3 introduces the proposed approach, including operation mechanism of grid trading, concept, and architecture of flexible grid, SSO for optimal parameters, and training ANN to automatically adjust flexible grid parameters. The experimental results are analyzed in Section 4. Finally, the conclusions are discussed in Section 5.

2. Overview of Grid Trading, SSO, and DL
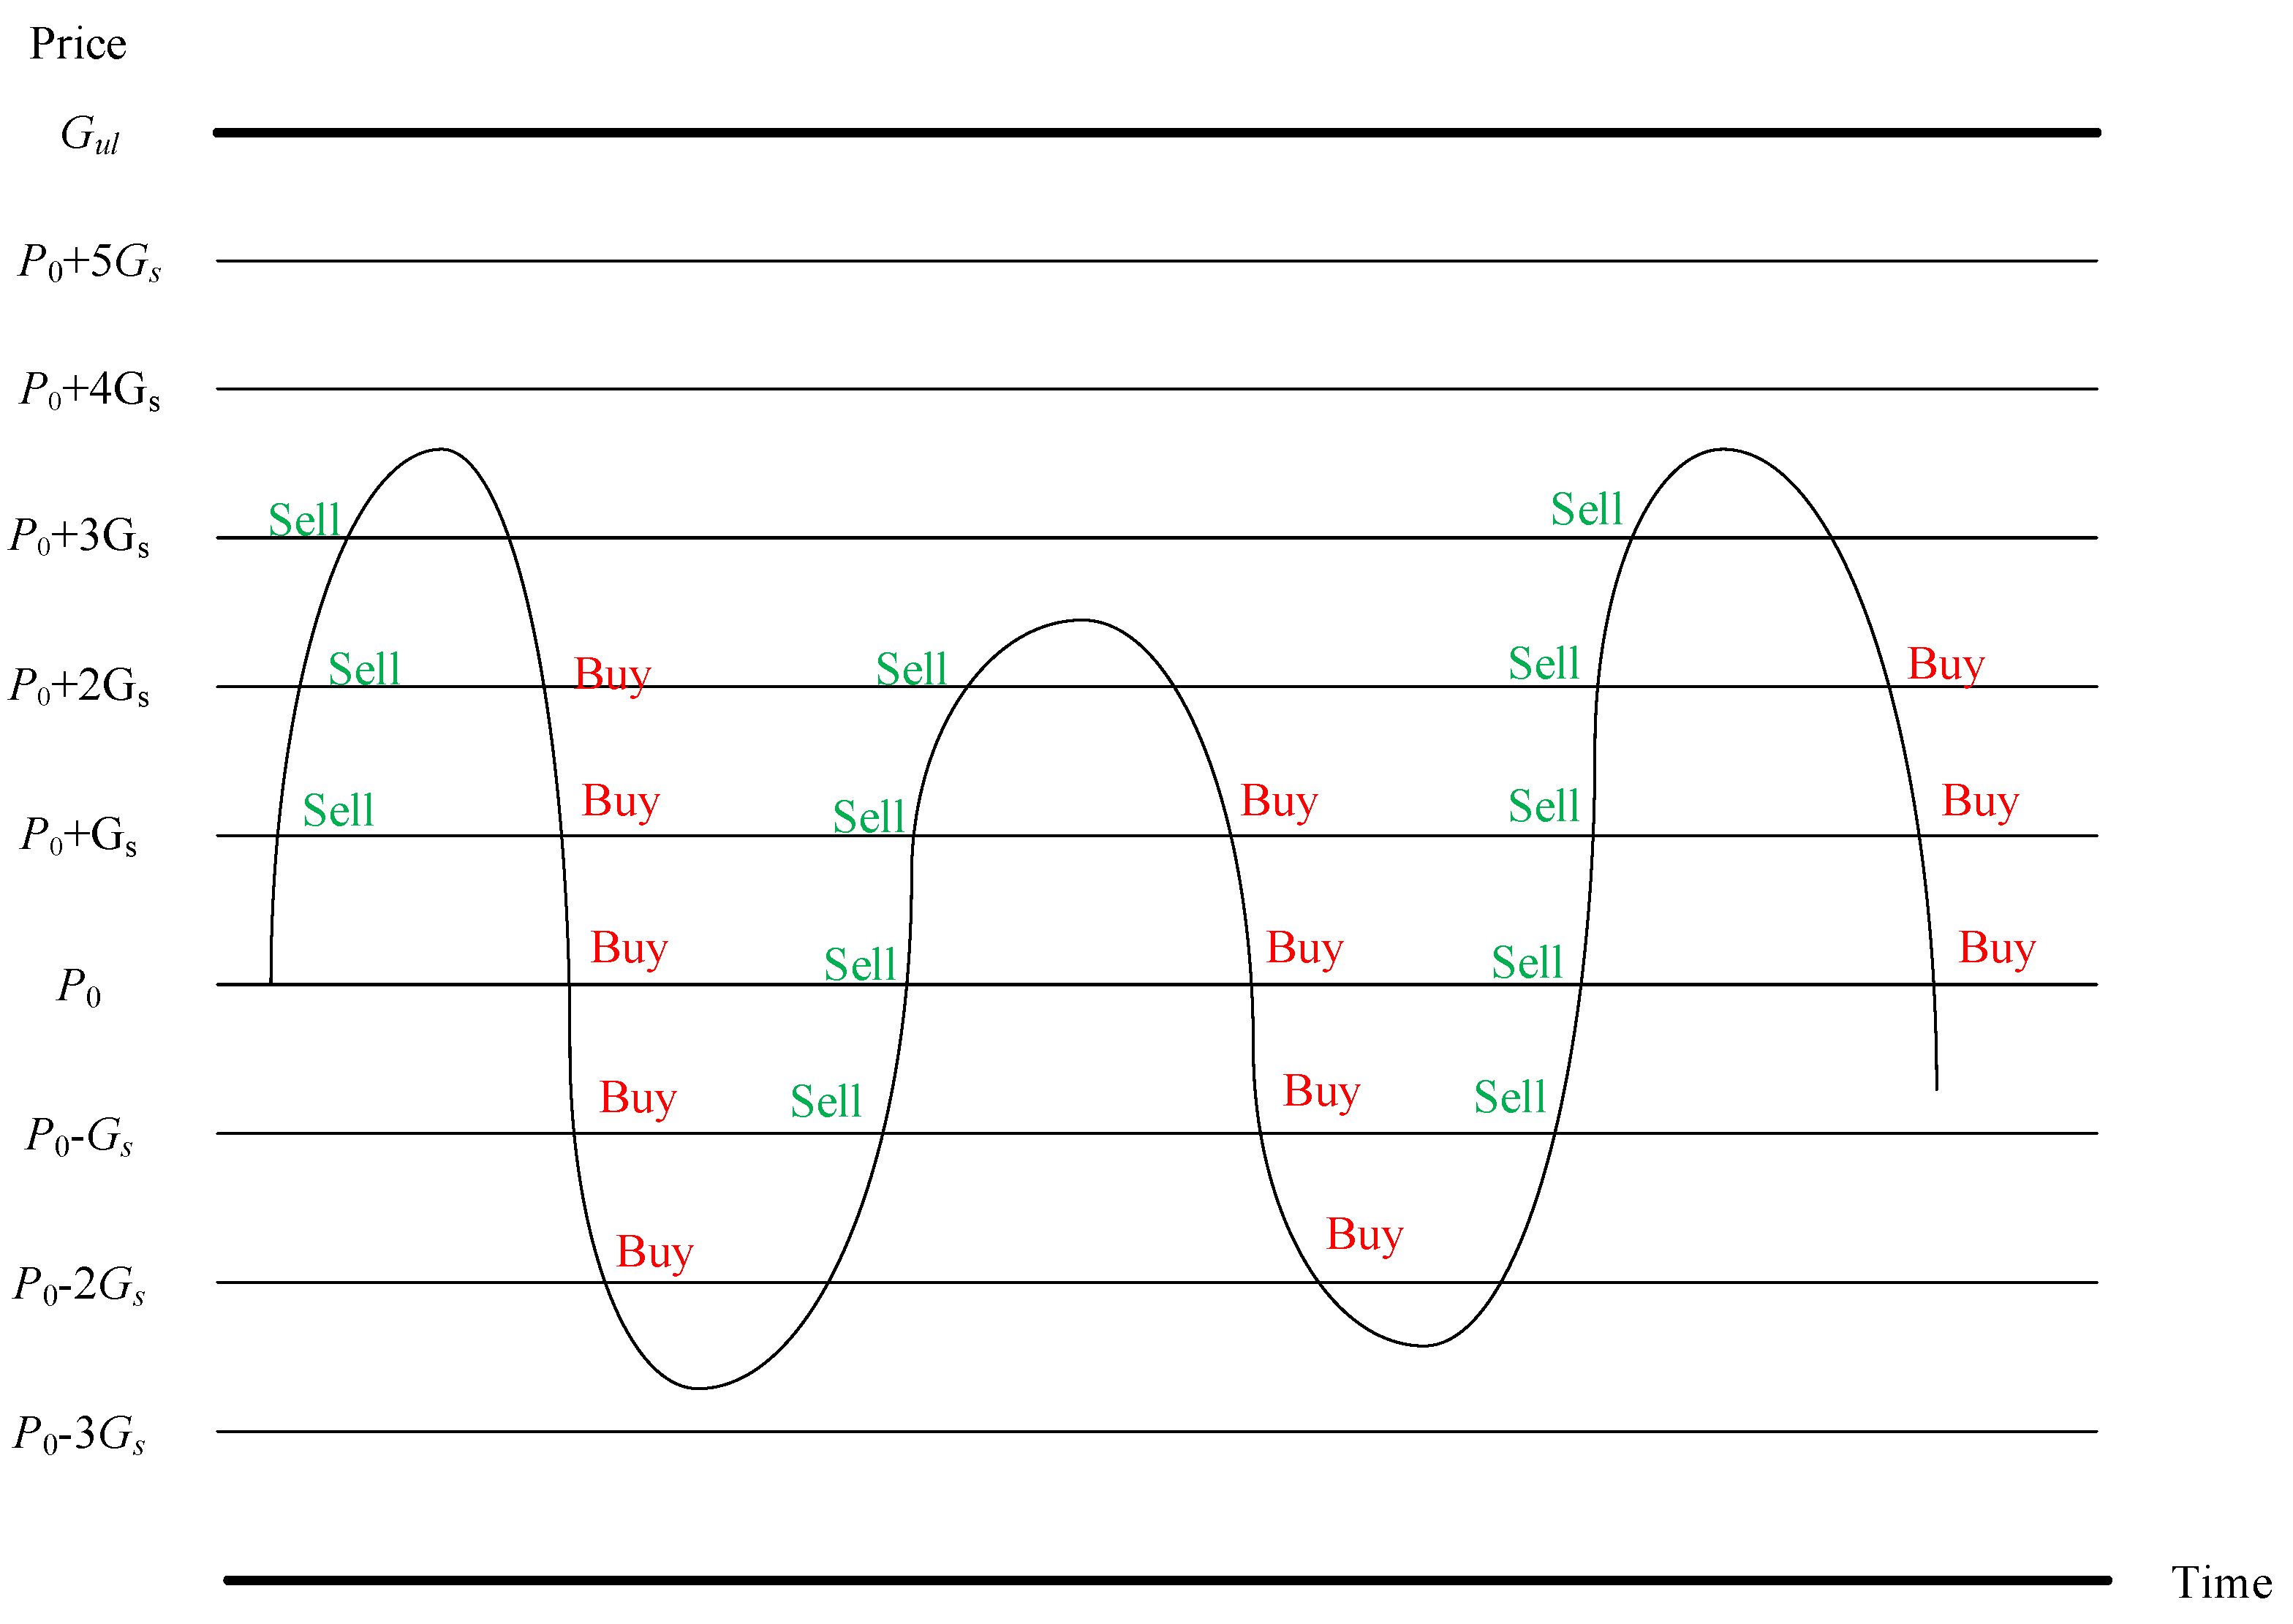
2.1. Grid Trading

The most basic definition of grid trading method is an average pending order within a specific price range to carry out a trading strategy of buying low and selling high [14]. There are two key factors in grid trading that determine the effectiveness of this strategy. The first is price volatility including both ups and downs. If the price goes up all the way, those who hold the spot make more profit than grid trading. If the price goes down all the way, spot traders basically cannot have many profit opportunities but short futures buyers are more able to make profits. If the market goes up and down, the grid trading strategy has the greatest profitability. The more frequent the fluctuations, the greater the profit rate increases. In most markets, prices are highly fluctuating and often have a price mean reversion [39,40,41] so that grid trading strategies are now being used by more and more market players.
The other key aspect that determines the profit size of grid trading is its parameter setting, including grid average, upper bound of the grid, lower bound of the grid, number of grids, initial price, stop loss point, and stop profit point. The setting of the above parameters should be based on product price fluctuations, trading costs, risk tolerance, and the amount of principal as the setting considerations, which directly affect the final performance of grid trading.
Grid trading is mainly divided into two types: equal-distance grid and equal-ratio grid. At present, the grid that many people use in practice is the equal-distance grid.
The setting of the equal-distance grid is based on the initial price P0, and the setting of upper bound of the grid Gul, the lower bound of the grid Gll, the total number of grids n, and the calculation of the grid spacing Gs by Equation (1).
G s = G u l G l l n
After the setting of the grid model, the trading is based on this grid to buy and sell financial products with the rise and fall of prices. An example of the equal-distance grid is shown in Figure 1.
The grid spacing Gs of equal-ratio grid is a fixed ratio and the equal-ratio grid is calculated at this ratio. An example of the equal-ratio grid is shown in Figure 2.

2.2. SSO

SSO was proposed by Yeh [17] in 2009 based on the concepts of personal best (pbest) and global best (gbest) and adds random numbers resulting in the solution owning the opportunity to escape from the local optimal solution and improve the diversity of the solution.
The major difference between SSO and other heuristic algorithms is its special update mechanism. There are three particularly important parameter settings: Cg, Cp, and Cw, where Cg > Cp > Cw. The update mechanism is shown in Equation (2). According to the correspondence between the random number ρ and Cg, Cp, and Cw, the next generation solution x i , j t is determined, which may be gbest, pbest, the current solution or a random number, respectively.
x i , j t + 1 = g j , i f   ρ [ 0 , C g ) p i , j , i f   ρ [ C g , C p ) x i , j t , i f   ρ [ C p , C w ) x , i f   ρ [ C w , 1 )  
where, let x i , j t = x i , 1 t , x i , 2 t , , x i , j t be the ith solution with j variables in the tth generation; ρ is a random number subject to uniform distribution between [0, 1].
The update method is that when ρ is between [0, Cg), the variable x i , j t + 1 is replaced by the global best solution gj that is the best performing solution among all the solutions at present; when ρ is between [Cg, Cp), it is replaced by the best solution in the region pi,j that is the optimal solution in the past generations of the variable; when it is between [Cp, Cw), it maintains the solution of the previous generation x i , j t ; when it is between [Cw, 1), it is replaced by x that is a random number generated in the upper and lower bounds of the variable. The purpose is to reduce the chance of becoming trapped in local optimal solutions, while also increasing the diversity of solutions.

2.3. DL

This section provides an overview of the ANN, back-propagating method, and LSTM adopted in this study.

2.3.1. ANN

In recent years, DL has been widely used in medicine, industry, transportation, and other fields, which can help the completion of speech recognition and machine vision. It is a Machine Learning (ML) algorithm based on ANN, which learns through data features.
The computing architecture of ANN was first proposed by McCulloch and Pitts [42], and subsequently, it has been continuously improved by many outstanding scholars [43,44], and it has become a famous ML model in Artificial Intelligence (AI).
The basic structure of ANN is divided into three parts including input layer, hidden layer, and output layer. Each node of the input layer corresponds to the input predictor variable, each node of the output layer corresponds to the objective variable, and the hidden layer is sandwiched between input layer and output layer.
Except for the nodes in the input layer, each node in the ANN is connected to several nodes in front of it and each node has a corresponding weight that is called FNN.

2.3.2. Back-Propagating Method

In DL, the back-propagating method [45] is an extremely important key to make the model complete and is often used to train and optimize ANN. Using the back-propagation, the gradient of the loss function to the weight can be efficiently found, and then the gradient descent method [46] is used to solve each weight. The “loss” in the loss function refers to the error of the actual value and the predicted value. The main concept of back-propagation is to return the error resulting that the weight can use the error size to perform the gradient descent method to obtain and update the more suitable weight, further reduce the error, and optimize the weight.

2.3.3. LSTM

LSTM is a model generated to improve the short-term memory of Recurrent Neural Network (RNN). It is mainly composed of four units including memory cell, input gate, output gate and forget gate.
The input gate controls whether it is input into the memory unit this time, the memory unit is responsible for storing the calculated value, the forget gate controls to clear the memory, and the output gate controls whether to output the operation result.

3. Proposed Approach

The approach proposed in this study is presented in sequence. The initial setting and operation mechanism of grid trading is introduced in Section 3.1. Section 3.2 presents the concept and setting method of flexible grid. The use of SSO to obtain the optimal flexible grid parameters in different situations is shown in Section 3.3. As the training basis for DL, a neural network is finally trained that can automatically output the suitable grid parameters for trading by inputting recent market information to obtain excess returns from market fluctuations is represented in Section 3.4.

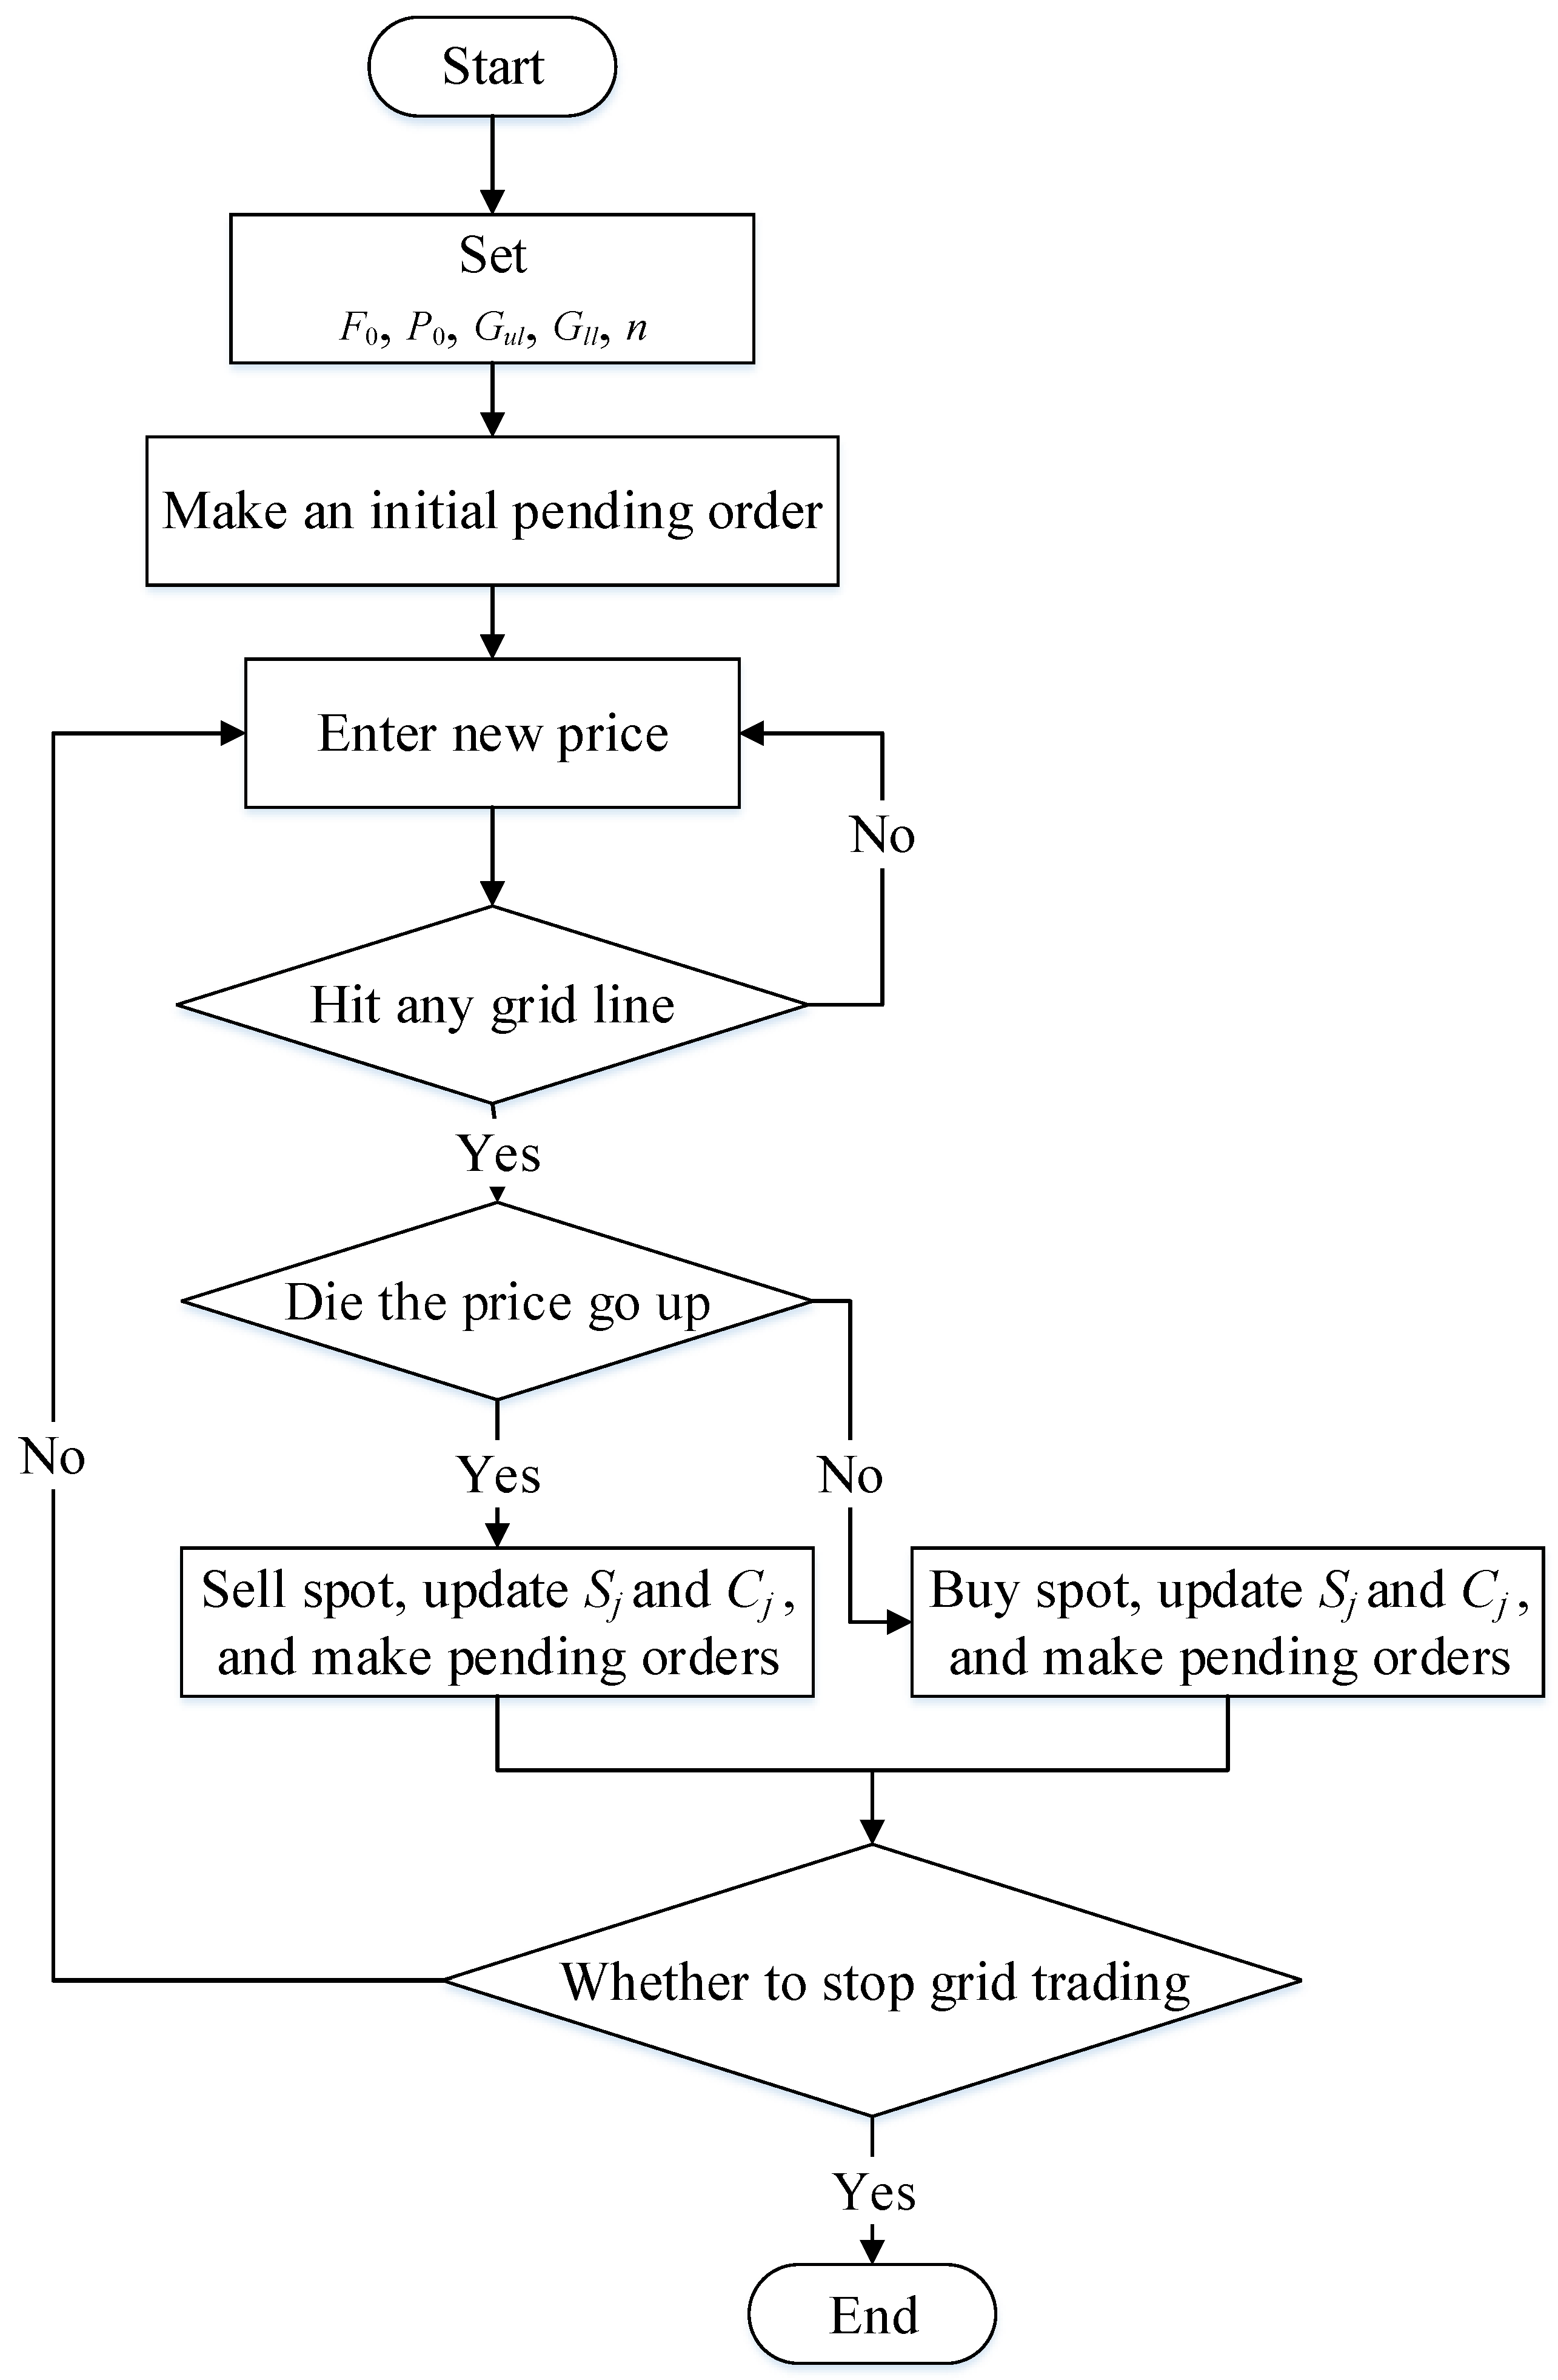
3.1. Operation Mechanism of Grid Trading

This section presents the grid trading practices in this study, including initial parameter setting and calculation, and subsequent operation mechanisms and processes, in detail.

3.1.1. Initial Parameter Setting of Grid Trading

A total of five basic parameters need to be set, namely the total investment capital F0, the initial price P0, the upper bound of the grid Gul, the lower bound of the grid Gll, and the total number of grids n, before operating a grid trading model. The total investment capital and initial price are set as control variables in this study, i.e., when comparing the results, the total investment capital and initial price used in any method will be set to the same fixed value, and compared on the same standard.
Before the grid trading model runs, the unit price difference Gs, which is the grid spacing, needs to be calculated using Equation (1) in Section 2 if the grid is an equal-distance grid. Gs is a certain value in equal-distance grid. However, it is a fixed ratio in equal-ratio grid, for example, the value of the next grid is P 0 · G s 1 = 110 and the next grid is P 0 · G s 2 = 121 when P0 = 100 and Gs = 1.1, and this ratio can be calculated from Equation (3) below.
G s = G u l G l l G l l + 1 n
In addition, it is also necessary to calculate how much funds should be used to purchase the spot before grid trading, i.e., the initial purchase of spot S0, so as to sell for profit when the price rises, and how many funds must be kept on hand to buy spots when the price falls; here, C0 means to start holding cash. Hence, the total investment funds are divided into two parts that is represented by the following Equation (4). The spot and funds held in each subsequent period are represented by Sj and Cj, where j represents the jth period.
F0 = S0 + C0
In order to calculate the initial purchase of spot S0 and the initial holding of cash C0, it is necessary to first calculate the number of upper grids nu and the number of lower grids nl, the sum of which is equivalent to the total number of grids n such as shown in Equation (5). The values of nu and nl can be obtained by Equations (6) and (7), respectively. Here, the equal-distance grid is used as an example.
n = nu + nl
nu = (GulP0)/Gs
nl = (P0Gll)/Gs
After calculating the number of upper grids nu and the number of lower grids nl, and then further use Equations (8) and (9) to calculate the initial purchase of spot S0 and the initial holding of cash C0. At this time, the single-cell trading volume Gv is still an unknown value.
S0 = Gv · nu · P0
C0 = Gv · [(P0Gs) + Gll]/2 · nl
Finally, substitute Equations (8) and (9) into Equation (4) to obtain the single-cell trading volume Gv, which can be calculated by Equation (10).
Gv = F0/{[(P0Gs) + Gll]/2 · nl + nu · P0}
Finally, calculate the price of each grid cell gi, i from 1 to n using Equation (11) (equal-distance grid) or Equation (12) (equal-ratio grid).
gi = Gll + Gs · (i − 1)
g i = G l l   ·   G s ( i 1 )

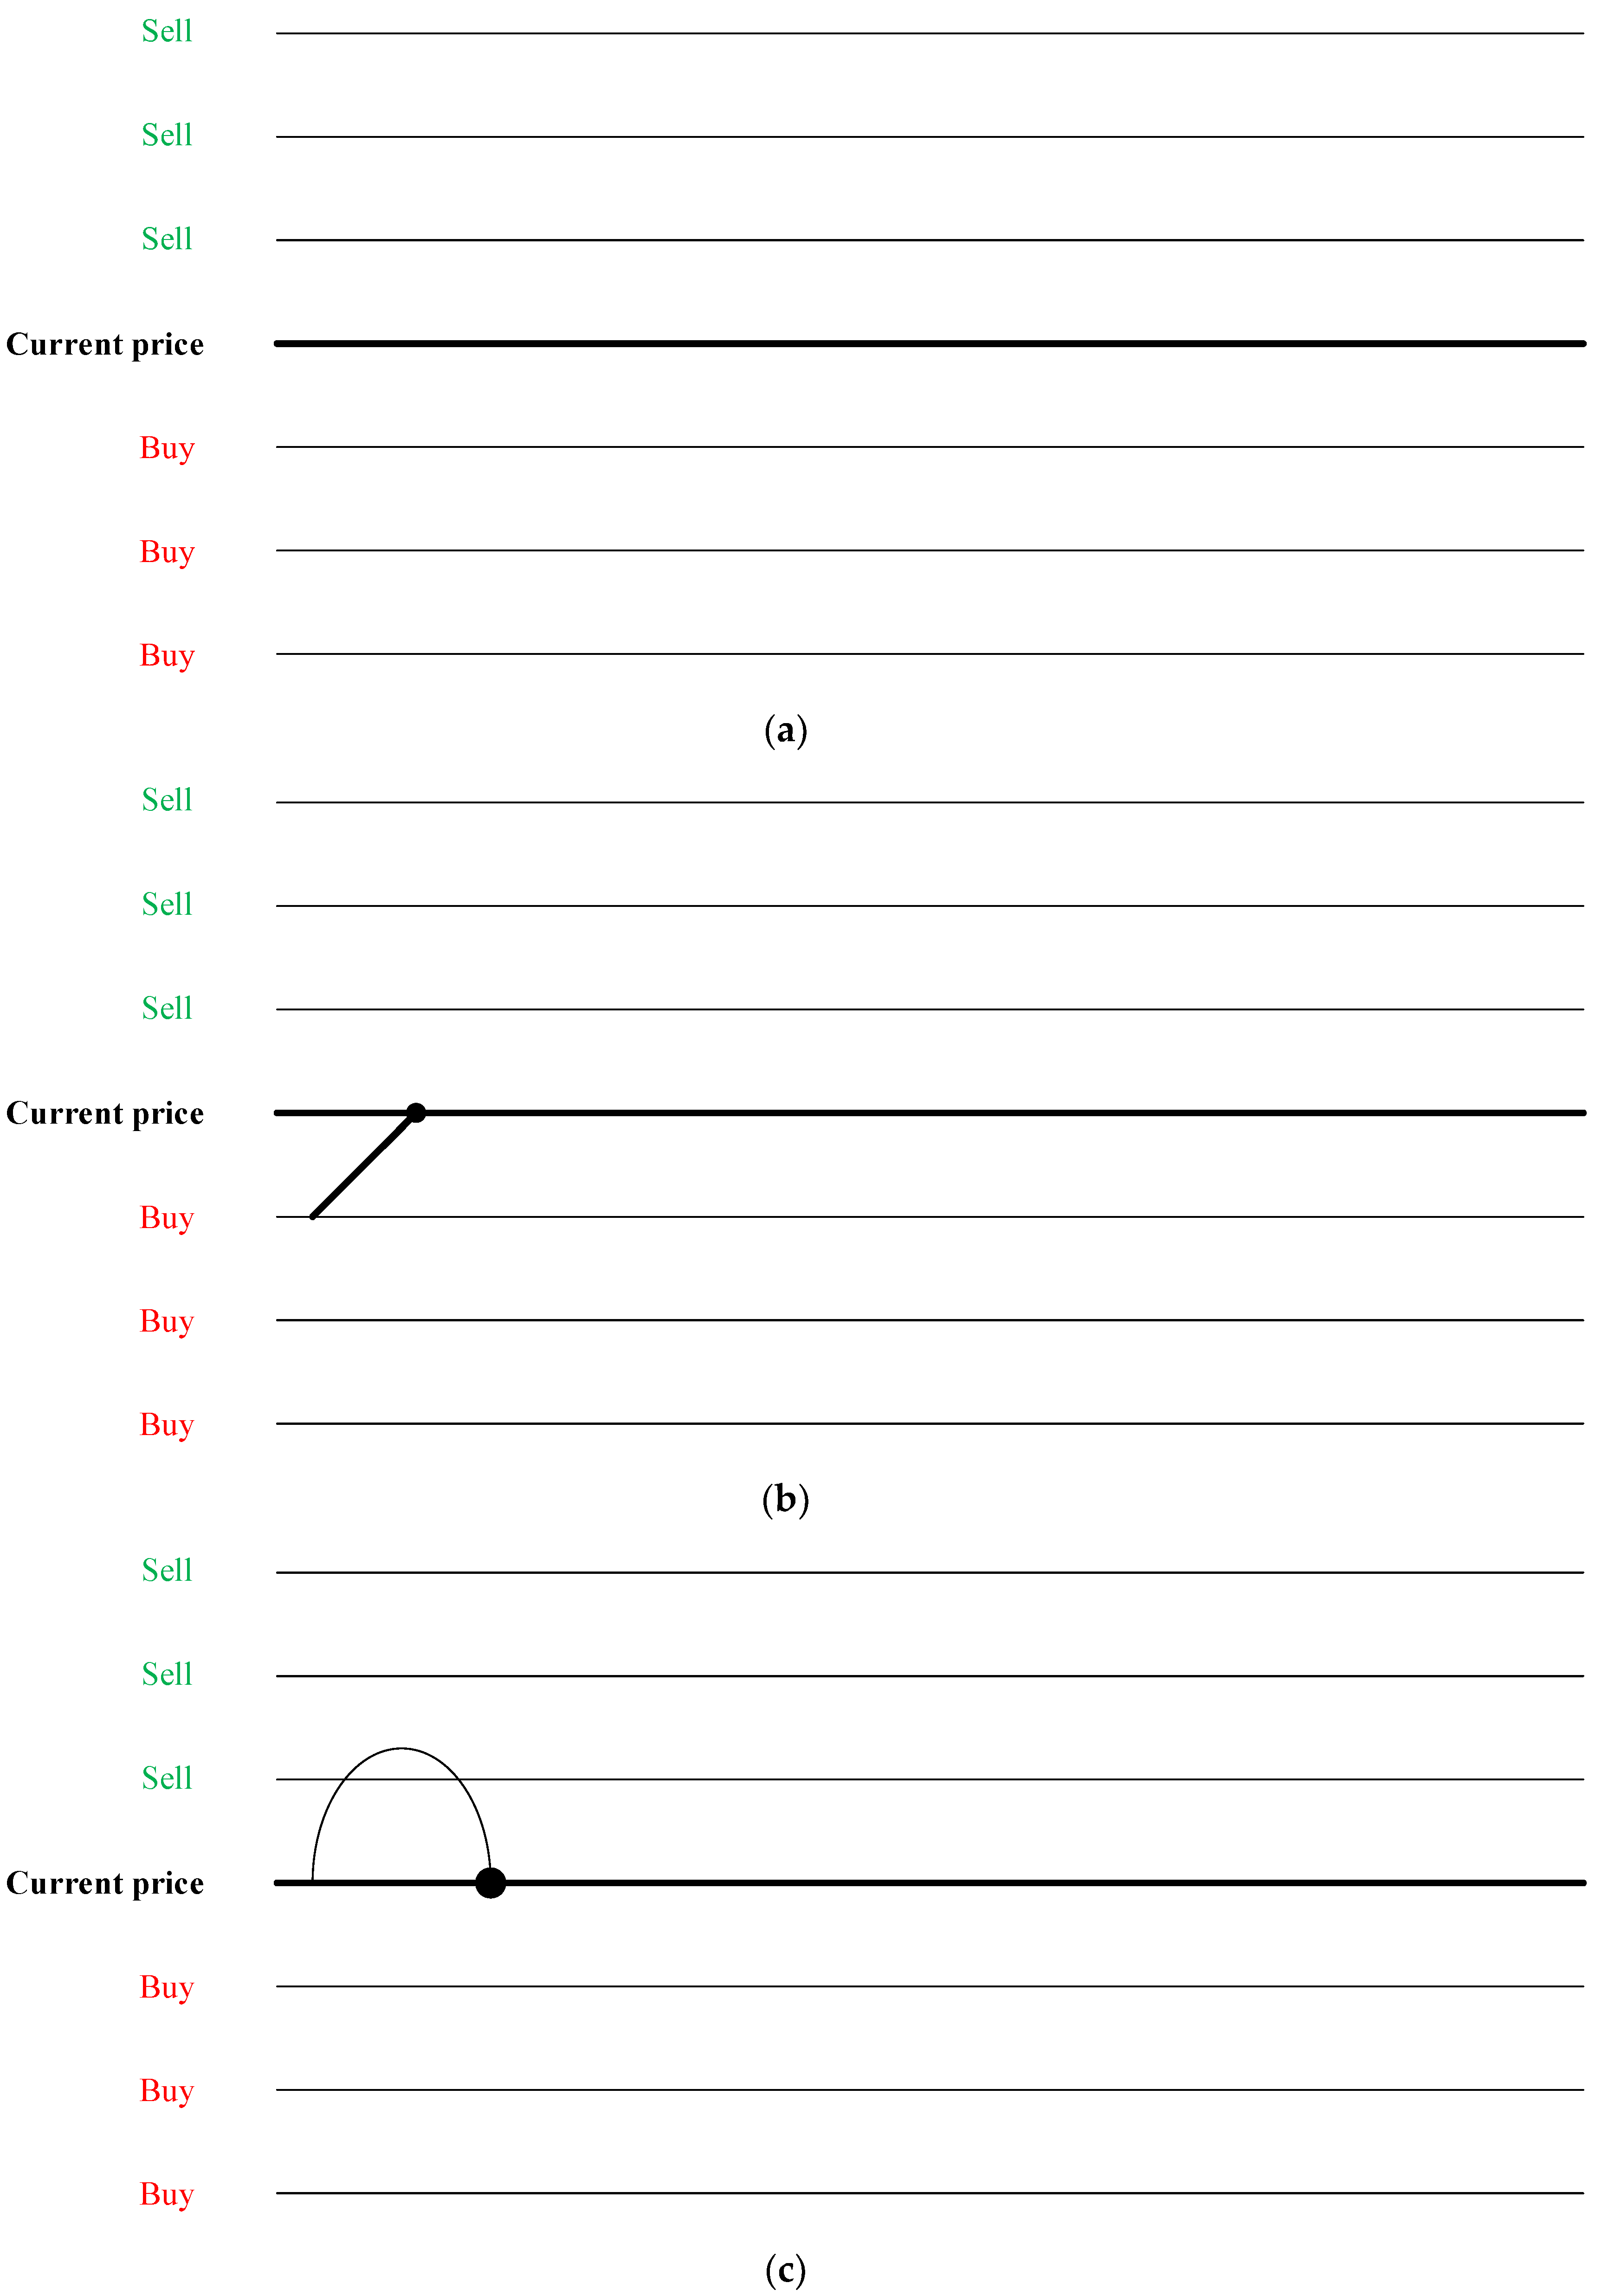
3.1.2. Operation Mechanism of grid Trading

The following Figure 3a–e illustrate in detail how the grid trading model updates and adjusts with the market price after the initial parameters are set, and how to settle at the end.
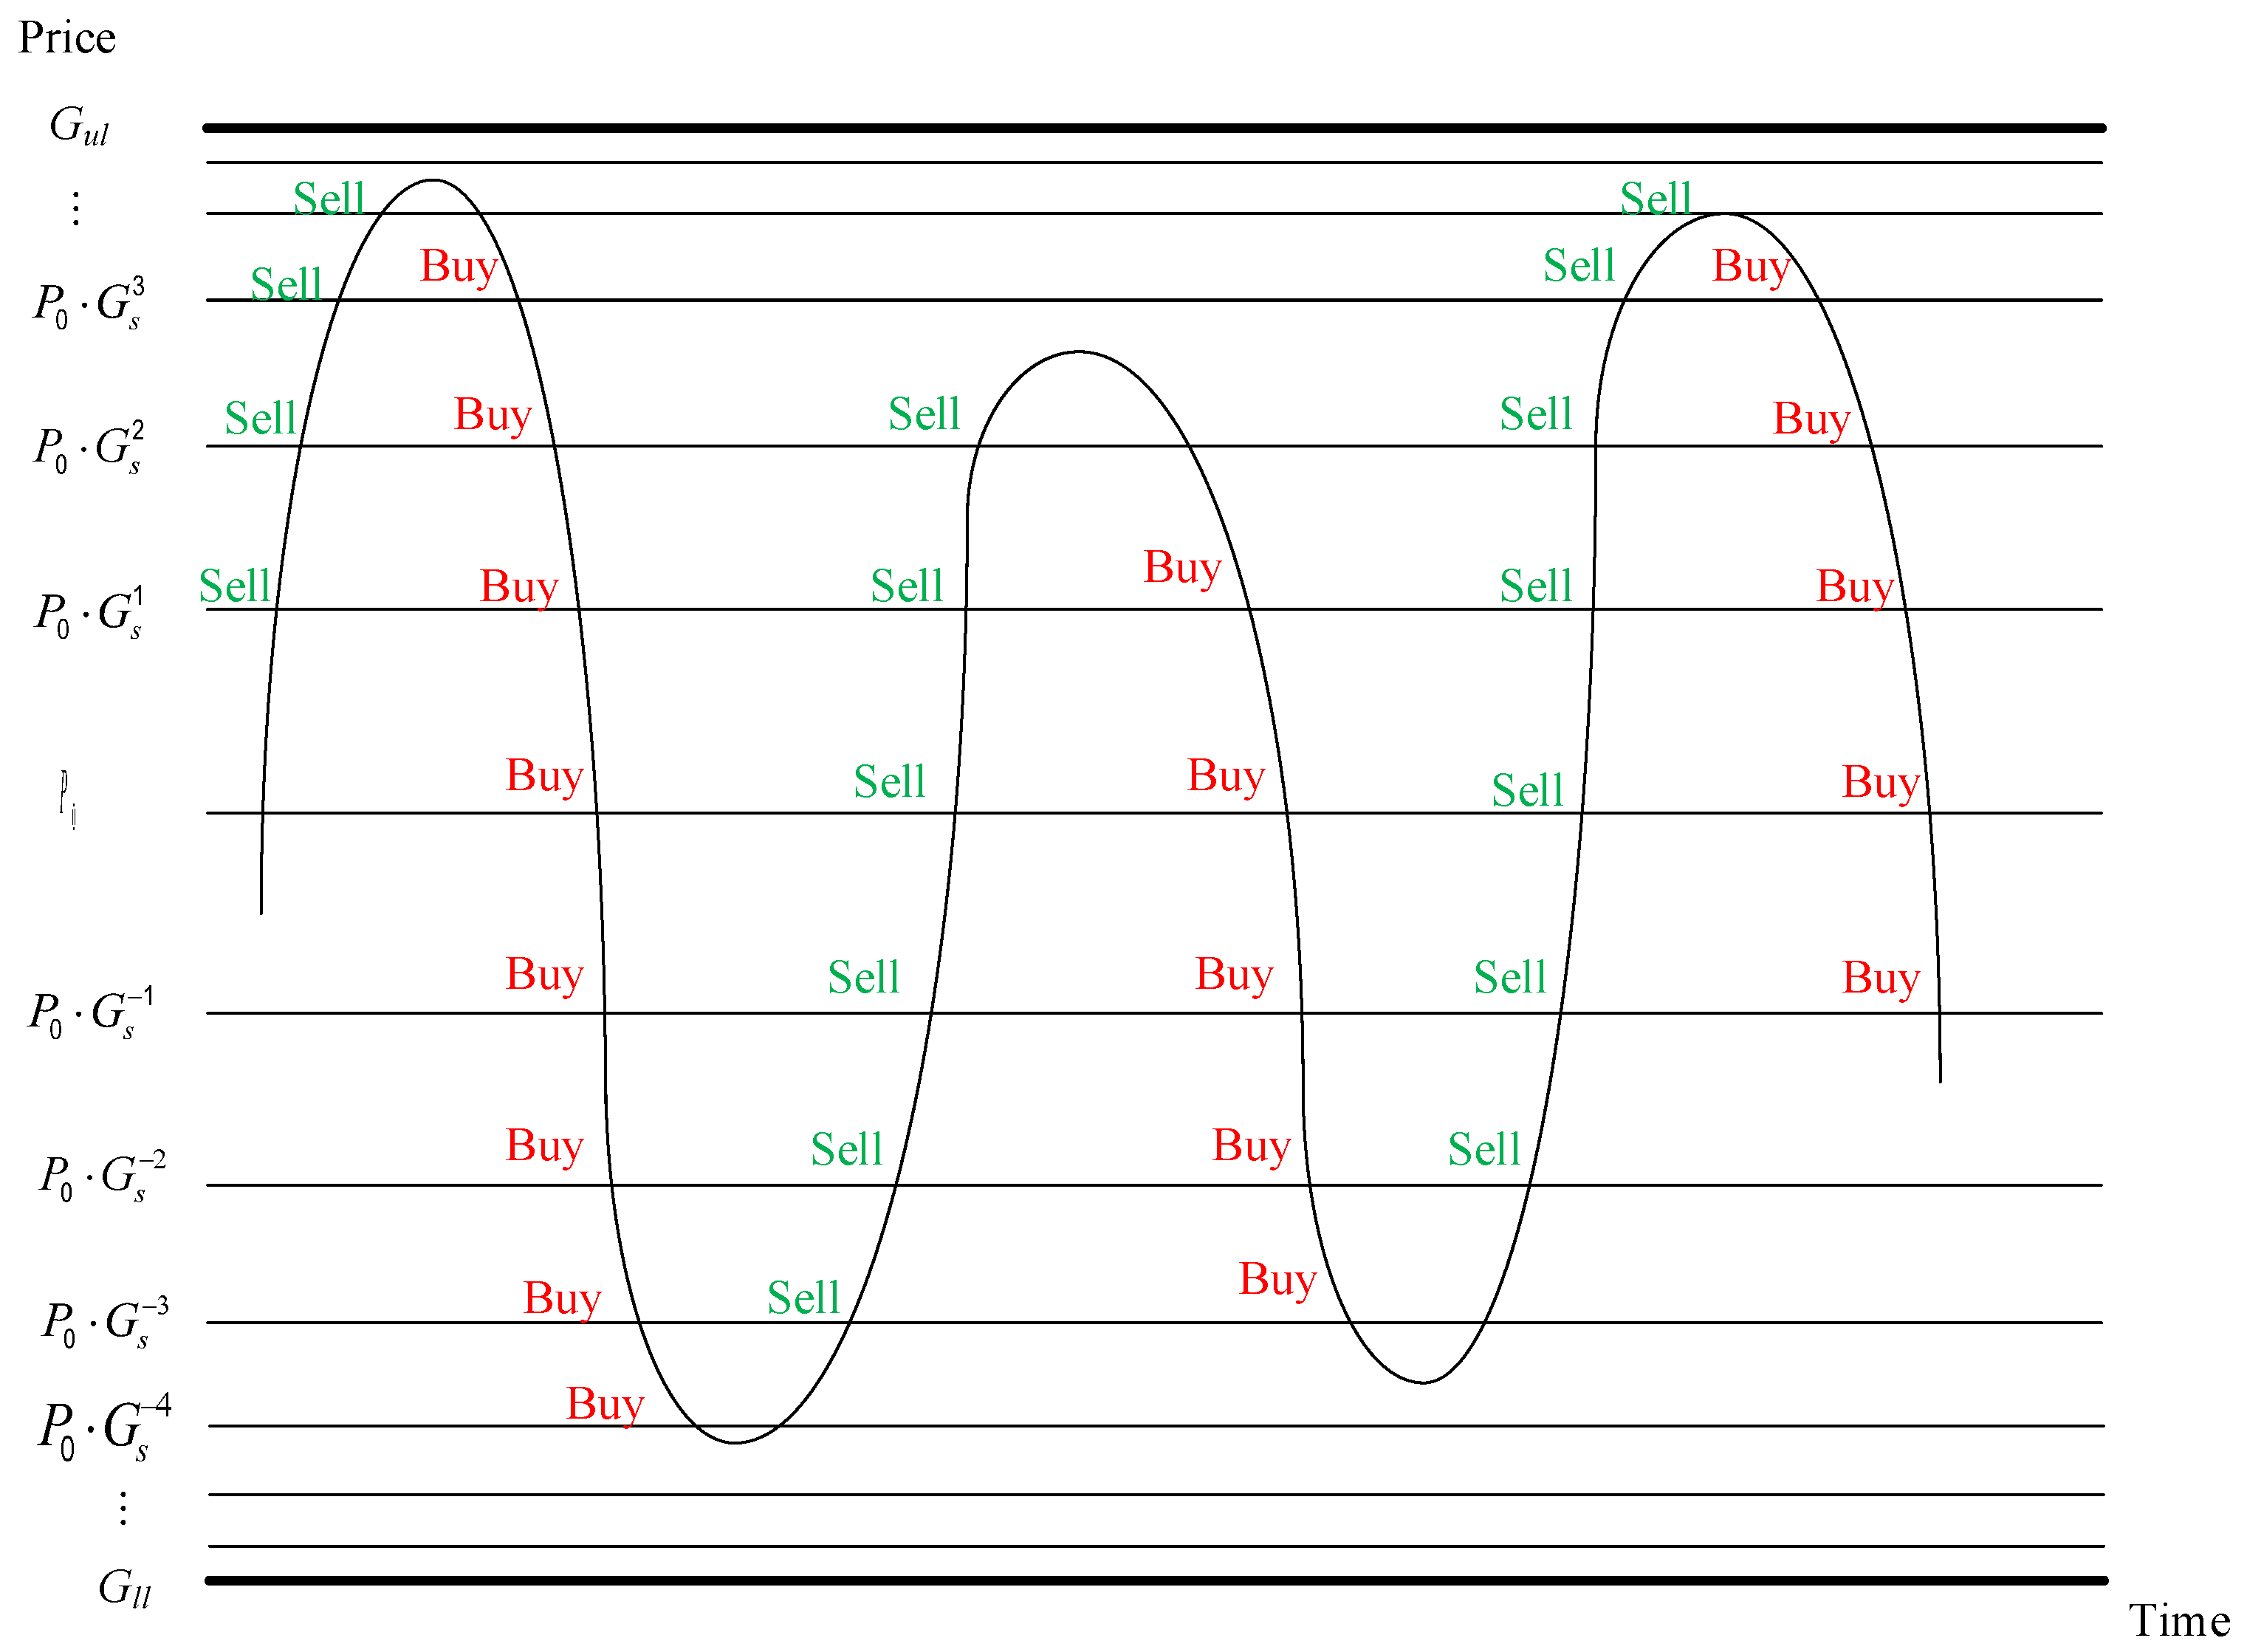
  • When the grid is initially running, the current price is used as the benchmark, and the above grid price is placed on a sell order, and the following grid price is placed on a buy order as shown in Figure 3a.
  • If the price rises until it hits the first grid line, make a sell action, update the spot volume and funds held, and place a buy order at the original grid position as shown in Figure 3b.
  • If the price falls back to the initial grid line, make a buy action, update the spot volume and funds held, and place a sell order at the original grid position as shown in Figure 3c.
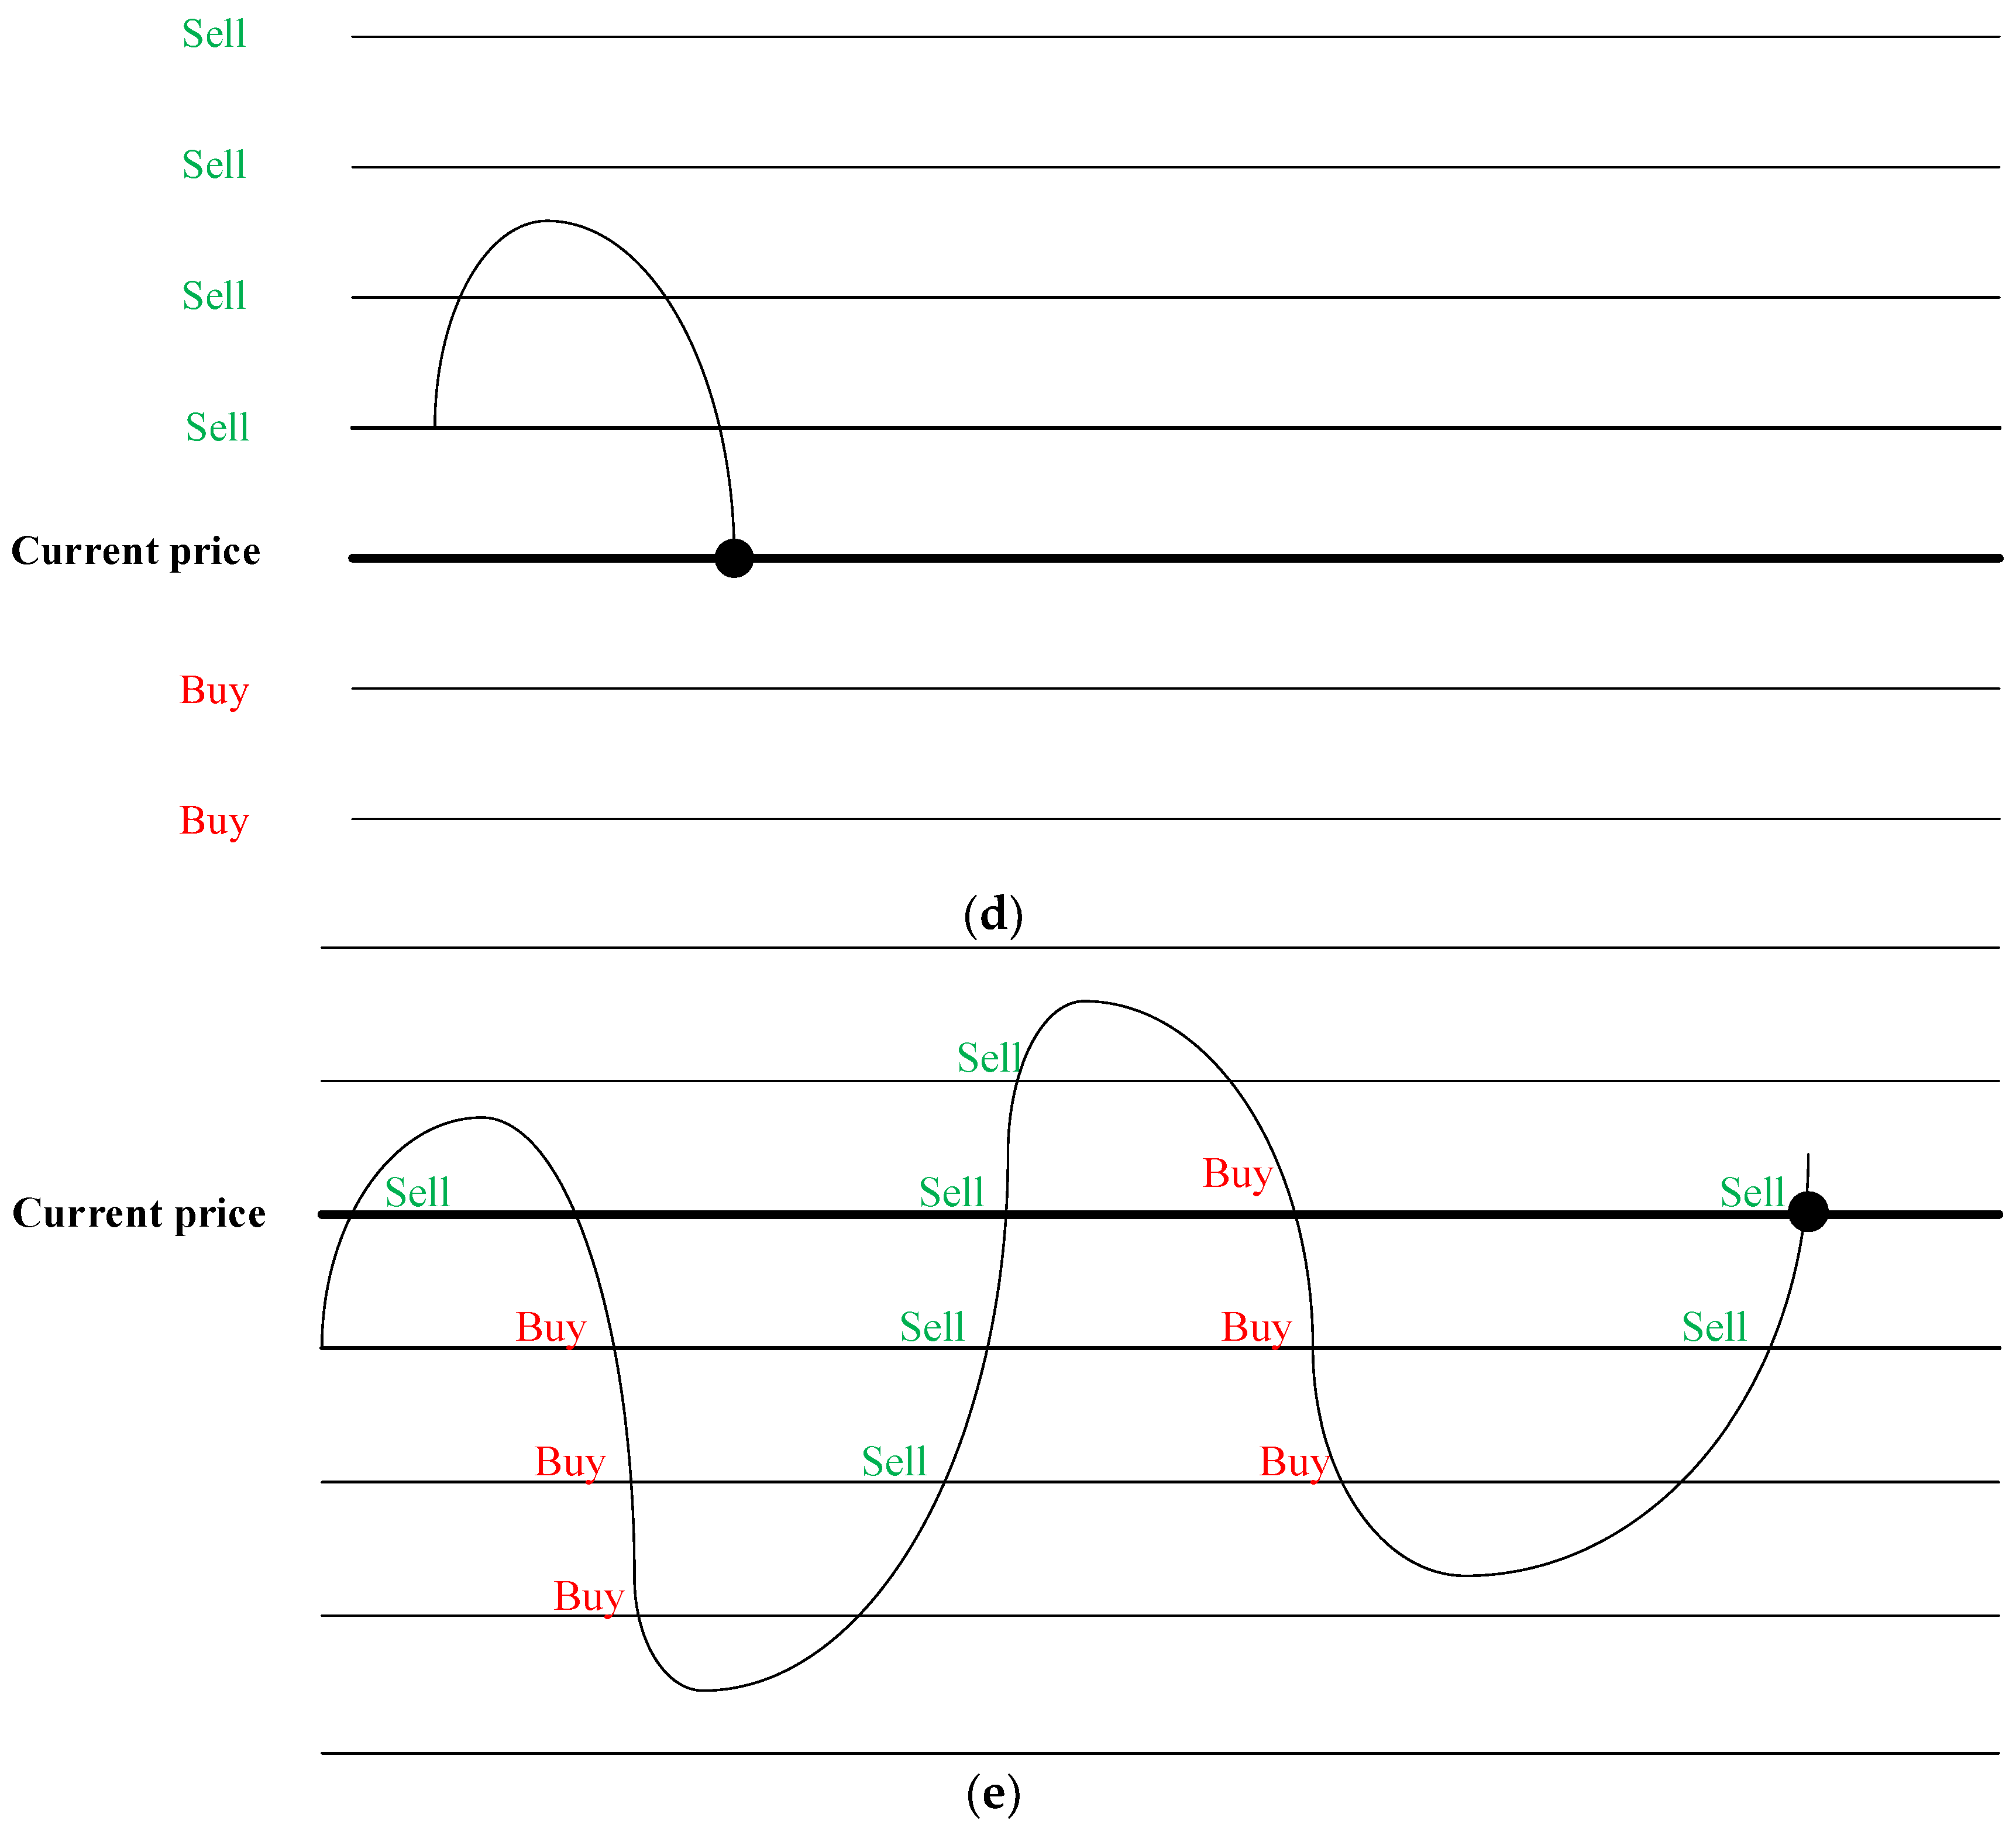
  • If the price continues to drop to a grid line, make a buy action, update the spot volume and funds held, and place a sell order at the original grid position as shown in Figure 3d.
  • Continue to trade with the above mechanism. Although the price has returned to the original point of grid trading, it has successfully arbitraged seven times, which is equivalent to seven grids of grid spread profits as shown in Figure 3e.
  • When the grid trading model is to be closed, there are two ways to end it. One is to directly keep the current spot and funds held, and the other is to sell the spot at the current price and convert it into cash. The former is recommended to be used when the market price is low, and the latter is not recommended. In this study, the grid is closed and settled in the second method.
The overall process of the grid trading operation is shown by the grid trading operation flow chart in Figure 4.

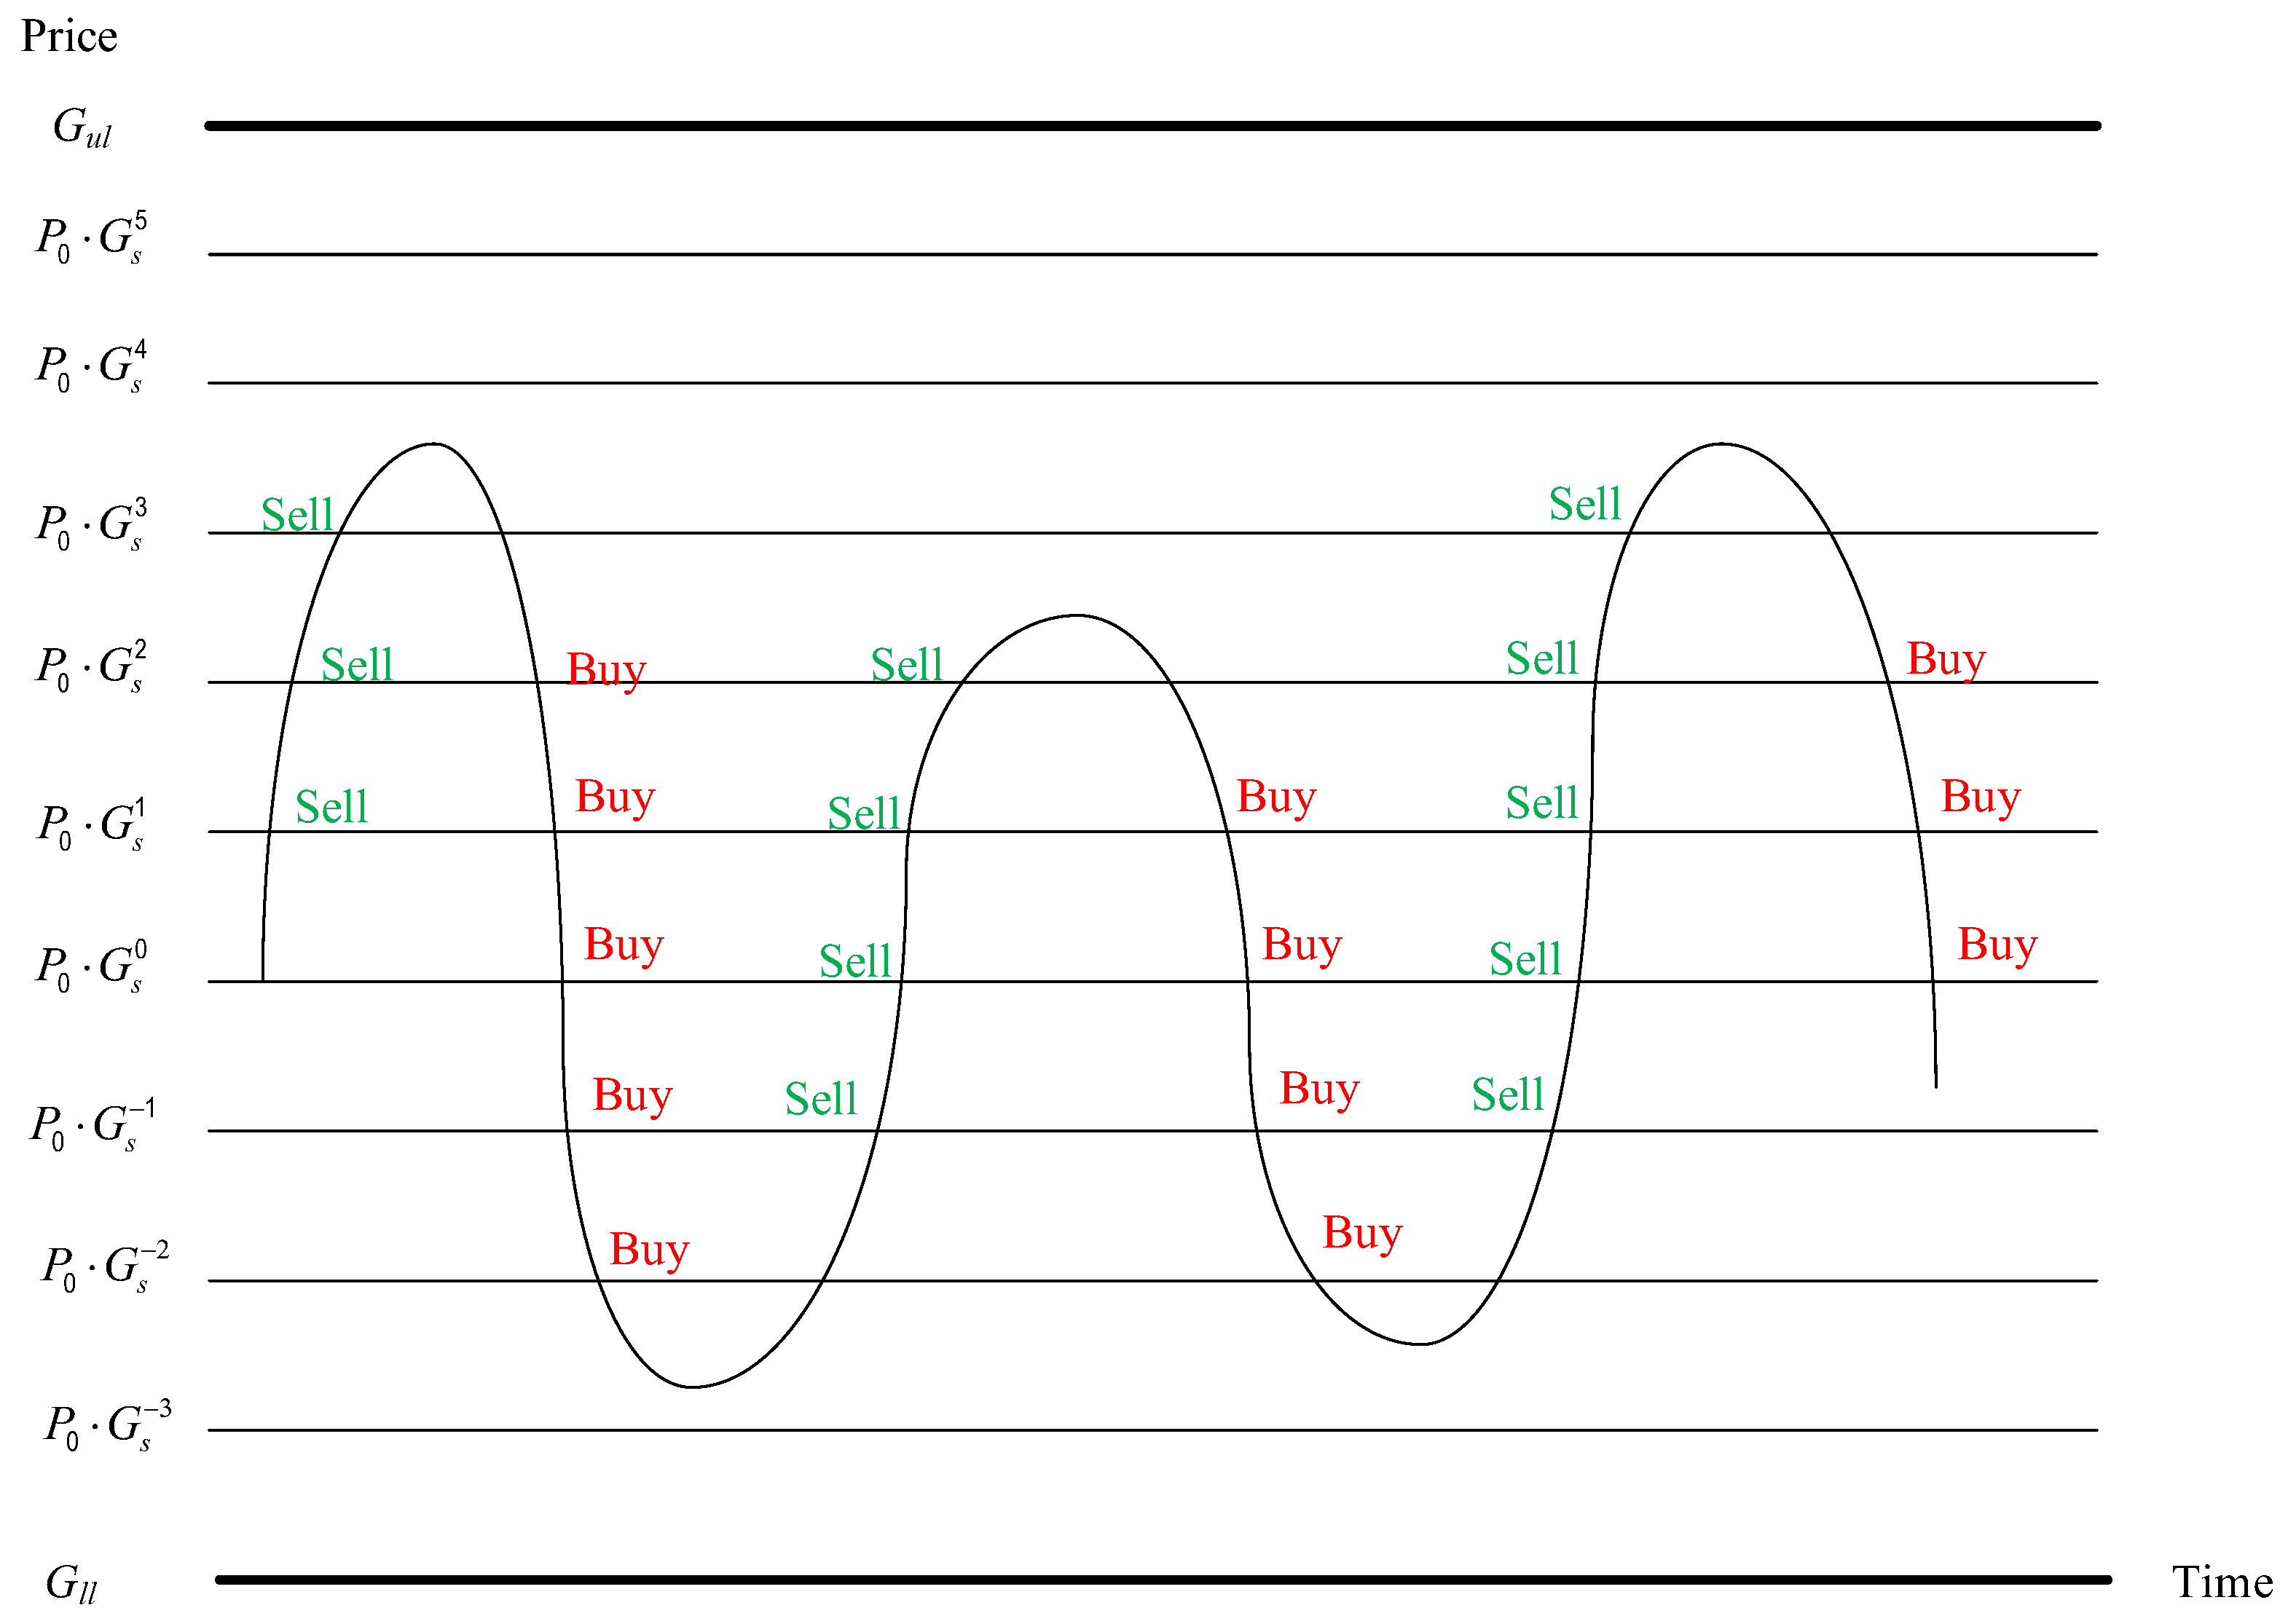
3.2. Concept and Architecture of Flexible Grid

Based on the equal-distance and equal-ratio grid trading models used in the financial market today, this study proposes a new and adaptive grid trading model: flexible grid. Through a more flexible grid structure combined with the SSO algorithm and DL, a grid trading model that can adjust parameters according to market changes and adapt to various external conditions is constructed.
Under the framework of the equal-distance grid trading model, it can exert its maximum model benefits when the market fluctuates. Even if the price returns to the original point, it is still possible to arbitrage from the volatile market situation based on the adoption of the mean reversion strategy in quantitative trading [47]. On the other hand, equal-ratio grid trading can obtain better returns in the volatile rise based on the combination of the two strategies of mean reversion and trend following [48].
The flexible grid proposed in this study captures the advantages of the equal-distance grid and the equal-ratio grid at the same time. It can outperform the traditional grid trading structure of the past whether the market is sideways, rising, or even falling.
When the flexible grid is initially set, it also needs to set its total investment capital F0, the initial price P0, the upper bound of the grid Gul, the lower bound of the grid Gll, the number of upper grids nu, and the number of lower grids nl. There are two main differences compared with other models in the initial setting:
  • The number of upper grids nu and the number of lower grids nl in Equation (5) are no longer calculated with Equations (6) and (7) but can be initially set.
  • The grid is divided into upper and lower parts with the initial price P0 as the boundary. The upper part and the lower part can set the number of the grids and have their own grid spacing ratio. The ratio of the upper grid spacing is Gsu and the lower grid spacing is Gsl. It should be noted here that Gsu must be a number greater than 0 and less than 1, and Gsl must be a number greater than 1. The feature of this is that the upper grid spacing becomes smaller and smaller as the price is higher, i.e., the trading frequency becomes more and more frequent. Similarly, the lower grid spacing becomes smaller and denser when the price is lower.
The specific calculation method of the grid value is shown in Equations (13) and (14) and the over structure is shown in Figure 5.
G s u = 1 G u l P 0 P 0 + 1 n u
G s l = P 0 G l l G l l + 1 n l
The core concept in the design process of the flexible grid is to perform more frequent sell actions when the price is high, and buy the cheaper spot more frequently when the price is lower. The flexible grid has a similar structure to the equal-distance grid in the middle section of the model, while the lower half of the model is more similar to the equal-ratio grid, and the upper half of the model is different from the current common equal-distance grid and equal-ratio grid trading model with higher mesh density at higher prices. The main purpose of this model is to capture the advantages of the equal-distance grid and equal-ratio grid, and can have better performance than the current existing model whether the market trend is volatile, or a continuous rise or fall.
However, in order to truly take advantage of the flexible grid model architecture, the optimal parameter setting and self-adjustment in line with the market situation are crucial determinants for the success or failure of the model. Therefore, this study uses an SSO algorithm to determine the appropriate parameters of the flexible grid in different situations that is described in Section 3.3, and inputs the calculated parameter combination and the corresponding market situation into the artificial neural network (ANN) for model training that is presented in Section 3.4. Finally, this study produces a trained DL model, which can automatically adjust to the grid parameters most suitable for the current market situation by simply inputting the current market situation.

3.3. SSO for Optimal Parameters

In this subsection, the SSO algorithm is adopted to adjust the optimal solution of the flexible grid under different market conditions based on the flexible grid constructed in the previous subsection. The market situation and the optimal parameters are input into the ANN as the training set for model training in Section 3.4.

3.3.1. Objective and Constraint

The main objective pursued by this study is to maximize the investment return. Therefore, the market investment commodity price is set by the SSO algorithm after the j period of update. The objective model is shown in Equation (15).
Max Sj × Pj × Cj
where Sj, Pj, and Cj represent the spot quantity, the commodity market price, and the funds held in the last period after the initial purchase of spot S0 and initial holding of funds C0 are inputted through the price of a total j-periods.
In addition, in the flexible grid model, it is necessary to ensure that the profit of each trading is greater than the trading cost h% (usually the trading fee rate) so that the following constraint Equation (16) is set, where i is from 0 to n.
s.t. gi+1gi > h% × gi+1
The calculation of gi can refer to Equations (11) and (12). After substitution, it can be found that this constraint is actually a constraint on the grid parameters Gul, Gll, nu, and nl.
On the other hand, additional constraints are placed on the grid upper and lower bounds Gul, Gll, nu, and nl for experiment 1 and experiment 2 as shown in Equations (17)–(19), where x is from 0 to j.
According to the upper and lower bound conditions, each data set is divided into two groups for experiments in Section 4. The first group uses 1.3 times the initial price as the upper bound of the grid, and 0.7 times the initial price as the lower bound of the grid; while the second group uses 1.5 times the initial price as the upper bound of the grid, and 0.5 times the initial price as the lower bound of the grid. Namely, (Gul, Gll) = (P0 × 1.3, P0 × 0.7) and (Gul, Gll) = (P0 × 1.5, P0 × 0.5).
s.t. (experiment 1) P0 × 105% < Gul < P0 × 130%
P0 × 70% < Gll < P0 × 95%
s.t. (experiment 2) P0 × 105% < Gul < P0 × 150%
P0 × 50% < Gll < P0 × 95%
10 < nl < [P0 × 100/(maximum Px × 1.3)] − 10
The above four constraints are to keep the error space and avoid the overfitting of subsequent ANN training, which cause the price to easily exceed the upper and lower limits of the grid resulting in losing arbitrage opportunities, and control the parameters within a reasonable range.

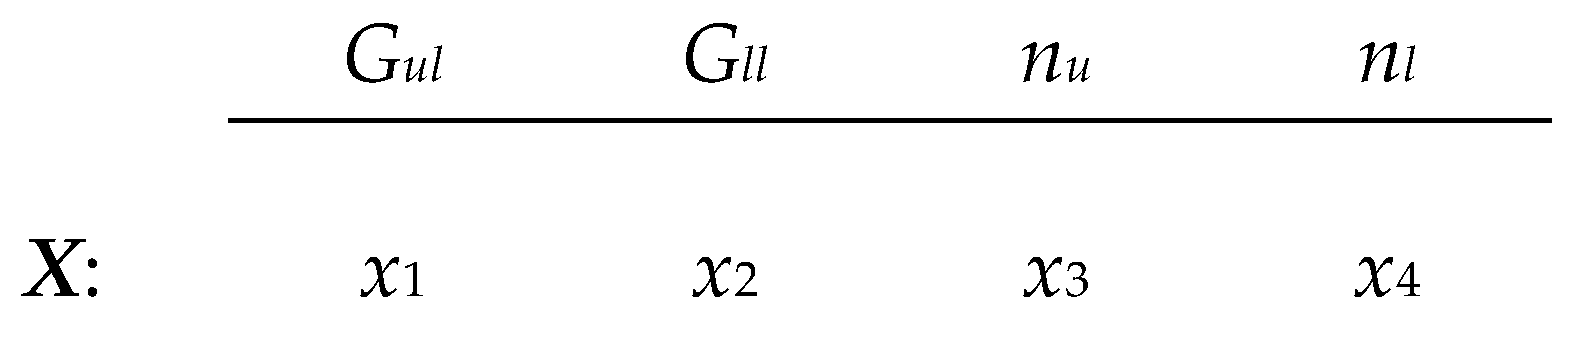
3.3.2. Solution Encoding

According to Section 3.3.1, the construction of a grid trading model must be set by the total investment F0, initial price P0, grid upper bound Gul, grid lower bound Gll and total number of grids n. In this study, F0 and P0 are control variables, hence, the parameters to be solved by SSO are Gul, Gll and n. In flexible grid, the total number of grids n can be divided into the number of upper grids nu and the number of lower grids nl.
The solution range is shown in Table 1.
The solution encoding in this study is shown in Figure 6, for which x1, x2, x3, and x4 are set as the grid upper bound Gul, the grid lower bound Gll, the number of upper grids nu, and the number of lower grids nl, respectively.
For example, when X = (150, 100, 10, 30), it means the grid upper bound is 150, the grid lower bound is 100, the number of upper grids is 10, the number of lower grids is 30, and the total number of grids is 40.

3.3.3. Parameter Setting and Scope of Update Mechanism

This study adopts SSO algorithm to solve the studied problem, where ρ is a random number subjects to uniform distribution between [0, 1], and the solution of the problem is updated according to this random number: when ρ is between [0, Cg), the variable x i , j t + 1 is replaced by the global best solution gj that is the best performing solution among all the solutions at present; when ρ is between [Cg, Cp), it is replaced by the best solution in the region pi,j that is the optimal solution in the past generations of the variable; when is between [Cp, Cw), it maintains the solution of the previous generation x i , j t ; when is between [Cw, 1), it is replaced by x that is a random number generated in the upper and lower bounds of the variable. The update mechanism can refer to Equation (2).
The symbols and definitions used in the SSO operation are shown in Table 2.

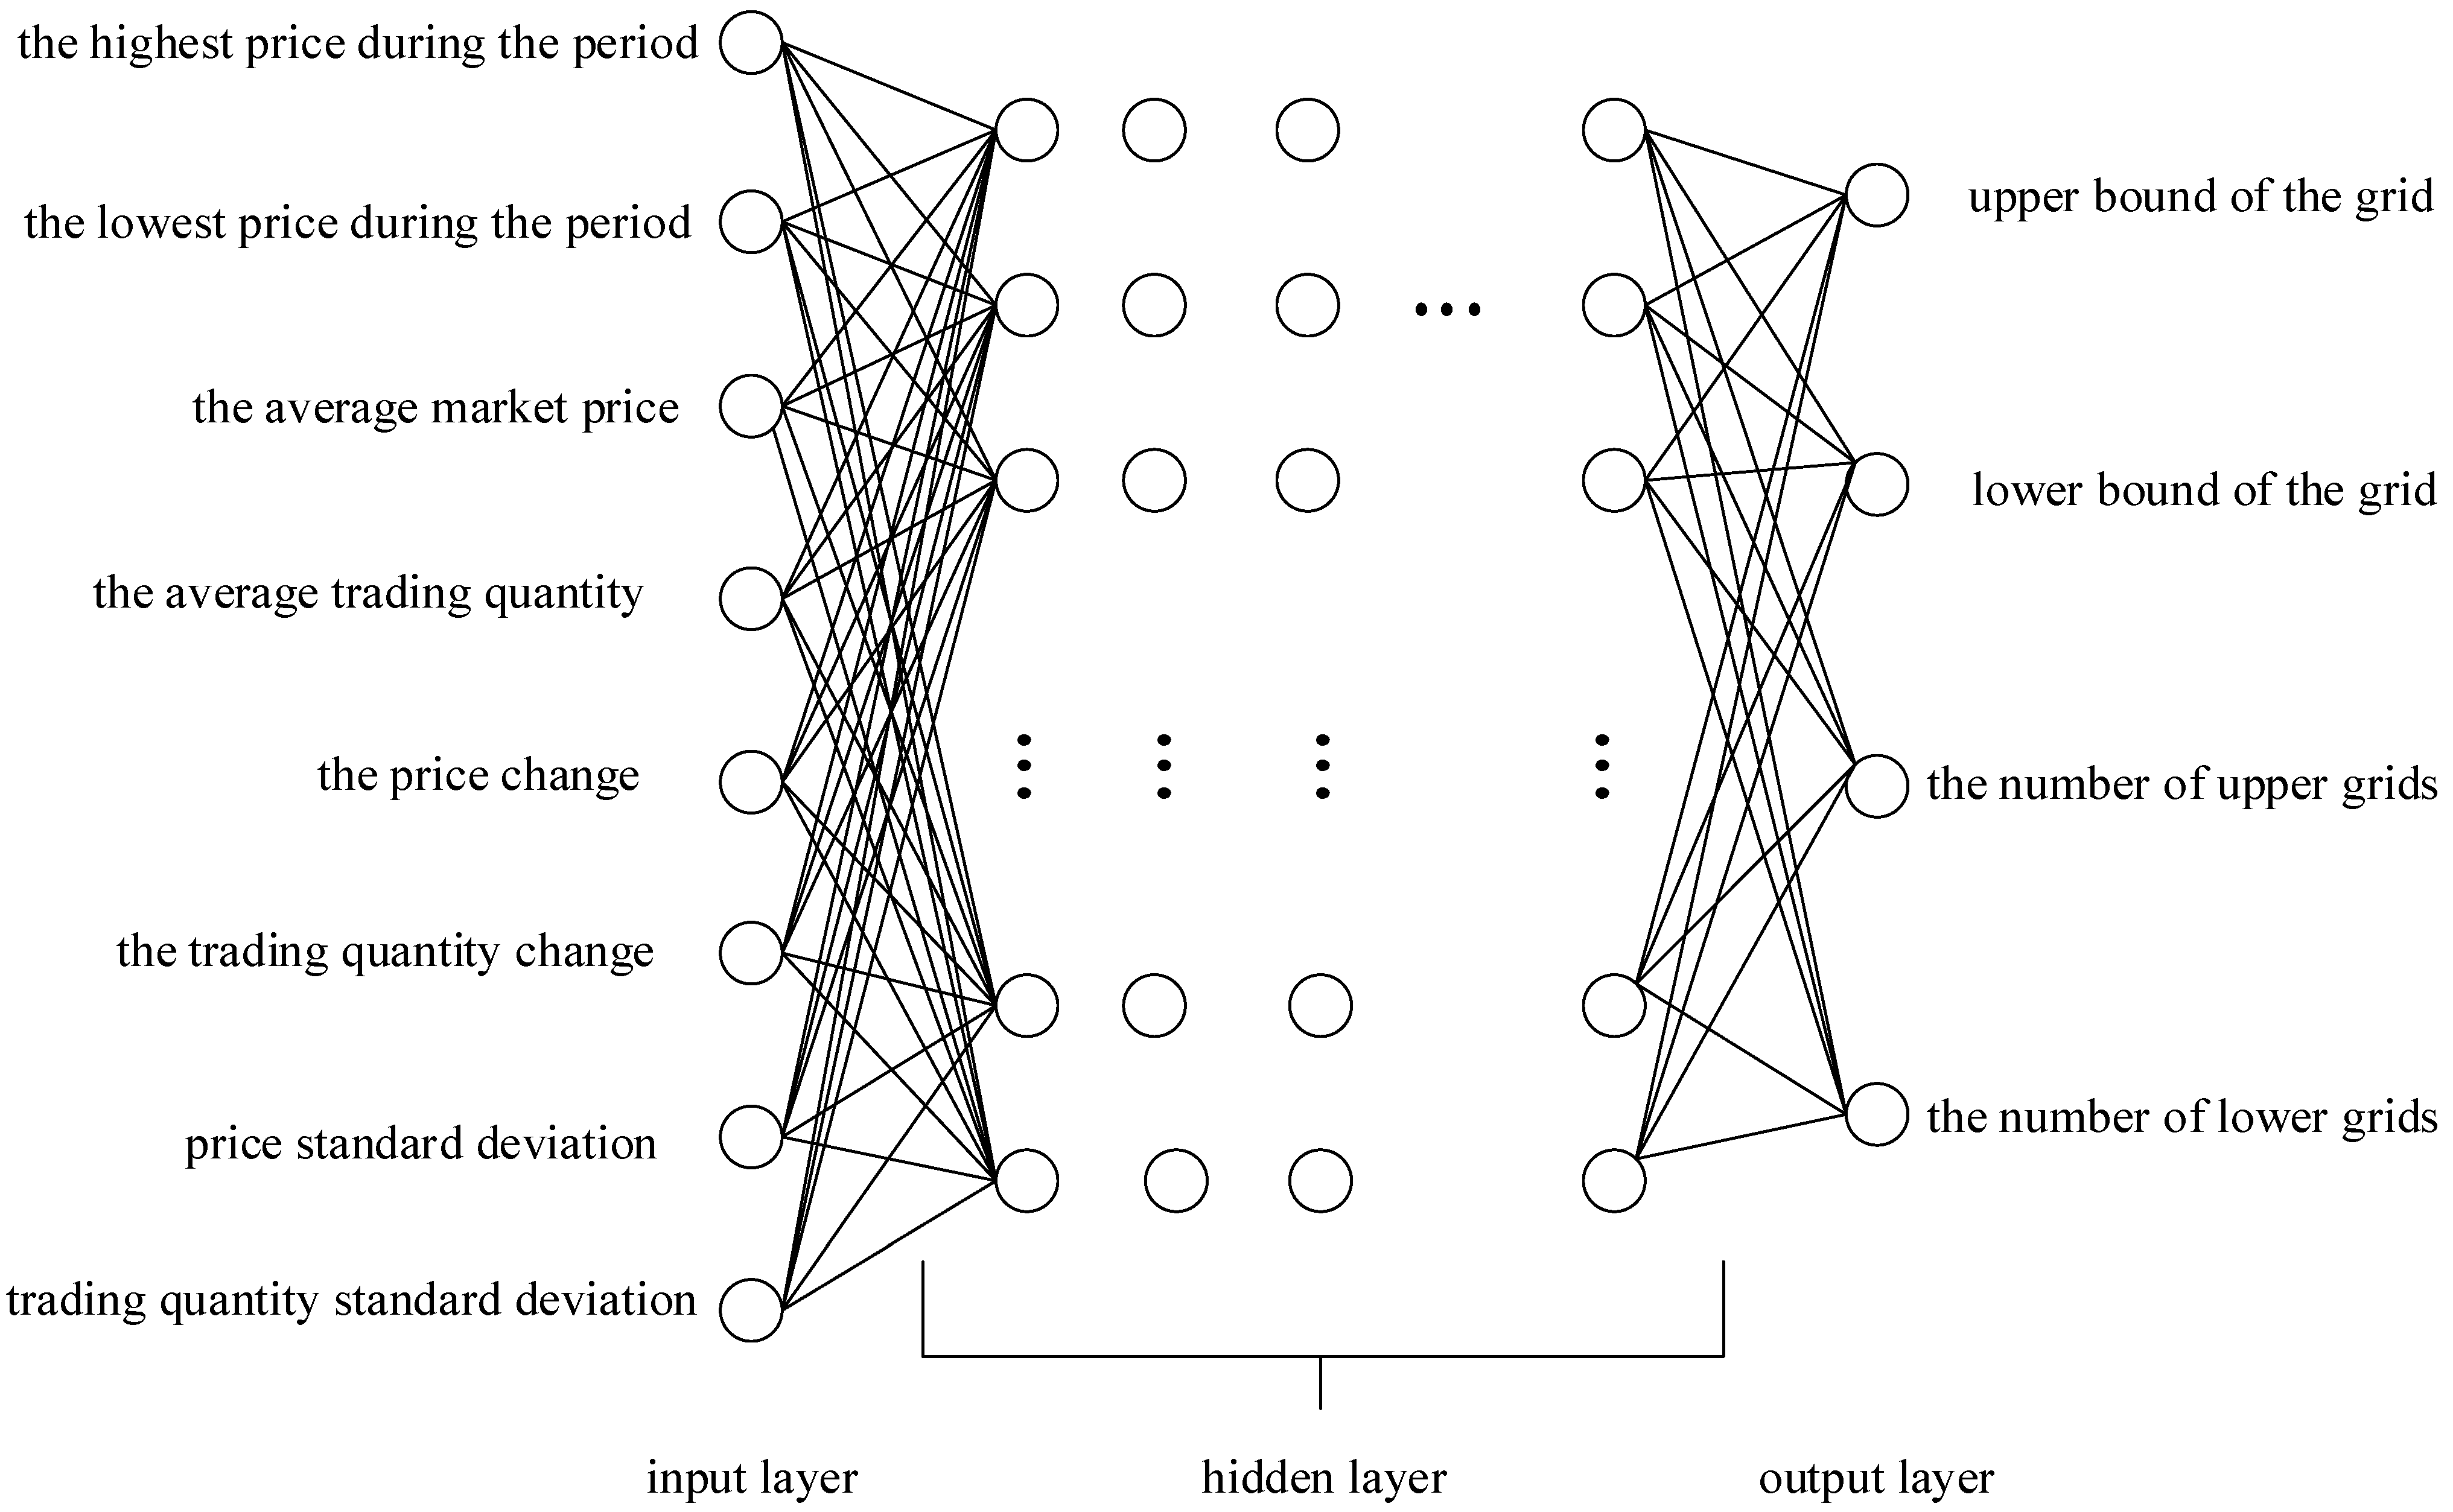
3.4. Training ANN to Automatically Adjust Flexible Grid Parameters

After using SSO to obtain the optimal grid configuration under various market conditions, the market conditions and the calculated grid parameters are used as the questions and answers for training ANN training. The market situation is interpreted in terms of the following values and is inputted into the input layer of ANN including the highest price during the period, the lowest price during the period, the average market price, the average trading quantity, the price change (initial price minus final price), the trading quantity change (initial quantity minus final quantity), price standard deviation, and trading quantity standard deviation as shown in Figure 7.
The output layer of the ANN outputs the relevant parameters required to construct a grid trading model including upper bound of the grid, lower bound of the grid, the number of upper grids, and the number of lower grids. The specific ANN architecture is shown in Figure 7.
In the neural network training process, the weights in the ANN nodes continuously adjust themselves through the error value calculated by the loss function until the training is completed when it converges to a state with the smallest error. Afterwards, through this trained neural network, the optimal parameters of the grid trading model can be generated by inputting the recent market state and trend, and a flexible grid model can be automatically constructed for market trading activities.
In this study, two kinds of neural networks are used for training, namely, the FNN and LSTM neural network, which is often used for time series prediction in recent years, to observe and compare which neural networks perform better in learning grid parameters.

4. Experimental Results

The data sets used for validation and comparison in this study are Standard & Poor’s 500 (S&P 500), NASDAQ Composite, Dow Jones Industrial Average (DJIA), Eu-ro Stoxx 50, and Shanghai Composite, a total of five large-cap indices from 2011 to 2022.

4.1. Verification of Flexible Grid Performance with Fixed Parameters

First, the performance of flexible grid is compared with equal-distance grid and equal-ratio grid based on the same grid number and upper and lower bounds. The results that the best results are marked in bold can be found in Table 3, Table 4 and Table 5. The number of grids is calculated by Equation (20) to be close to the real investment situation and to ensure the adequacy of the use of funds. According to the upper and lower bound conditions, each data set is divided into two groups for experiments. The first group uses 1.3 times the initial price as the upper bound of the grid, and 0.7 times the initial price as the lower bound of grid; while the second group uses 1.5 times the initial price as the upper bound of the grid, and 0.5 times the initial price as the lower bound of grid.
From the results in Table 3, Table 4 and Table 5, it can be verified that the flexible grid obviously obtains the best ROI, accumulated wealth, and Sharpe ratio through trading with the same grid parameters under 10-year fluctuations of five different composite indices. Overall, flexible grid appropriately delays the entry and exit timing due to its trading structure, and obtains a relatively high ROI and Sharpe ratio.

4.2. SSO Parameter Setting

Part of the dataset is then used to select appropriate SSO parameters for all subsequent experiments.
In the first set of experiments, Cg, Cp, Cw are configured as shown in Table 6, which the best results are marked in bold. The meaning is to divide the range of random number ρ into four parts according to 7:1:1:1, and the part with this ratio is assigned to gbest, pbest, x i , j t + 1 and a proposed solution in turn in the experiment to detect what kind of the solution has more critical influence on producing better quality solutions.
From Table 6, a better quality solution can be found when gbest is the largest and robust at the same time. Therefore, the probability of gbest is set to the maximum in the final parameter configuration.
After it is determined that gbest is set as the maximum probability, the range of random number ρ is then divided into four parts according to 5:3:1:1. Among them, the probability of taking gbest as the solution is set to the maximum 0.5 because gbest has been determined in the previous step as the key factor to generate a good quality solution, and the probability of 0.3 is assigned to pbest, x i , j t + 1 and a new solution in turn. According to the experimental results, the solution that is the second key factor in producing a better solution, is shown in Table 7, which the best results are marked in bold.
Table 7 shows that it can produce a better quality solution when the new random solution is larger, and it is robust at the same time. Therefore, the probability of the new random solution is set to the next largest in the final parameter configuration.
After it is determined that the new random solution is set as the next largest probability, the range of random number ρ is then divided into four parts according to 3:3:3:1. The subsequent steps are analogous to the first two steps, and Table 8 that the best results are marked in bold is obtained as follows. It can be found that x i , j t + 1 and pbest have little difference in the quality of the solution, thus, both probabilities are set to the minimum.

4.3. Verification of Flexible Grid Performance with Parameters Selected by SSO

After setting the SSO parameters, the flexible grid, the equal-distance grid, and the equal-ratio grid are connected to the parameters selected by SSO, respectively. Additionally, solutions with 10 runs, 20 generations per run, and 100 sets of solutions per generation are found. Two sets of experiments, which is same as the previous verification of flexible grid architecture, are also conducted with the upper and lower bounds of different risk levels. The results that the best results are marked in bold are shown in Table 9, Table 10 and Table 11.
From the results in Table 9, Table 10 and Table 11, it can be verified that in the application of SSO to solve the grid trading parameters, the flexible grid is still the best model in terms of ROI, accumulated wealth, and Sharpe ratio compared with the equal-distance grid and equal-ratio grid. In addition, comparing the grid trading results connected with the SSO parameters and the fixed parameter version, it can be found that the ROI has increased significantly. The overall ROI results reveal that the flexible grid is the best, the equal-distance grid is the second, and the equal-ratio grid is the worst.

4.4. Training ANN to Automatically Adjust Flexible Grid Parameters

After confirming the excellent performance of the flexible grid using SSO to search for trading parameters, the flexible grid and SSO are adopted to record the best trading parameters of each index in 10 years, and obtain a set of trading parameters every 30 days. In order to expand the follow-up training and data, the moving pace of the model is set to 5. In each index, about 500 pieces of parameter data are obtained for the training and verification of ANN, in which the data of the first nine years is used as the training set and the data of the last year is used as the validation set.
Because the data of the training set in this study have temporal continuity, the data are re-randomly ordered before training in the FNN in order to avoid affecting the training results of the model. In the LSTM neural network, the input training data must be sequential because the model design, and thus the training data, do not need to be re-ordered randomly.
The architecture of the FNN and the LSTM neural network has undergone many experiments, and the final architecture and hyper-parameter settings are shown in Table 12 and Table 13.
The input parameters are eight variables which describe a market situation: the highest price during the period, the lowest price during the period, the average market price, the average trading quantity, the price change, the trading quantity change, price standard deviation, and trading quantity standard deviation. In addition, the output variables are set to upper bound of the grid, lower bound of the grid, the number of upper grids, and the number of lower grids for grid trading.
The number of hidden layers is set to three. The optimizer is set to adam, which has been common in recent years, with a fast convergence speed and excellent performance in searching solution. The excitation function uses sigmoid and relu, and the loss function adopts a mean squared error, which is commonly used in regression problems.
After the neural network training set above, the training and comparison results are presented in Table 14 and Table 15, which the best results are marked in bold. Results of the mean square error of values for the output layer including upper bound of the grid Gul, lower bound of the grid Gll, number of upper grids nu, and number of lower grids nl (shown in Equation (20)) are shown in Table 14. With the exception of the upper and lower bound of the grid in the Nasdaq 100 index, LSTM has a smaller mean square error. All four output variables in the other indices have a smaller mean square error; the mean square errors of the four output variables in other indices are all FNN, which perform better.
M S E = 1 N i = 1 N ( y i y ^ i ) 2
The coefficient of determination (R square) of the two models, which is an index to measure the fitness of the regression model and can also be interpreted as the degree of interpretation of the model, as shown in Table 15 is calculated based on Equation (21). For example, the meaning of 90.490% in the second row of Table 15 means the coefficient of determination (R square) of the upper bound of the grid Gul for S&P 500 obtained by LSTM equals 90.490%, i.e., the fitness of the regression model of upper bound of the grid Gul for S&P 500 obtained by LSTM equals 90.490% and can also be interpreted as the degree of interpretation of upper bound of the grid Gul for S&P 500 obtained by LSTM equals 90.490%. And the best results are marked in bold in Table 15.
R 2 = 1 S S r e s S S t o t = i = 1 ( y i f i ) 2 i = 1 ( y i y ¯ ) 2
In Table 15, it can be found that except for the Nasdaq 100 index, most of the time, FNN has a better fit for the four output variables.
Furthermore, the four values of ROI, Maximum Drawdown (MDD), volatility, and Sharpe ratio are used to examine the performance of the model in this study. In terms of methods include first Buy and last Sell (Buy and Sell, B&S), first Sell and last Buy (Sell and Buy, S&B), Grid Trading System Robot (GTSbot) [10], Ichimoku Equilibrium Figure (IK) [12], Flexible Grid trained with FNN (FG-FNN), Flexible Grid trained with LSTM (FG-LSTM), equal-distance grid, equal-ratio grid, and flexible grid; a total of nine methods for comparison.
First, the formula of ROI can refer to Equation (22), which is the most common indicator of quantitative investment performance in investment sciences. The calculation of the ratio of investment income to cost usually presents as an annualized return to total return. The trading costs, including handling fees, are included in the calculation results. The results that the best results are marked in bold are shown in Table 16.
ROI = (net profit − investment costs) × 100%
In terms of ROI, the FNN flexible grid achieves the top three returns in each index. In particular, the FNN flexible grid has the most ability to control the overall loss in the downward trend of prices.
Second, the comparison is the maximum drawdown, i.e., the amount of income that has fallen sharply in all periods, which is one of the indicators for evaluating investment risk. Results that the best results are marked in bold are shown in Table 17.
In terms of the maximum drawdown, it can be found that the method with a larger return on investment has a relatively higher maximum drawdown, which verifies the theory of high risk and high return in investment science. There are two reasons for the performance of the FNN flexible grid on the MDD. The risk is relatively high in the case of a relatively high return on investment. In addition, the parameters of each period are calculated by the neural network. If the parameters predicted on one period are particularly poor, it is likely to cause a large drop in a single period. Whether this MDD condition can be regarded as a single condition of outliers is yet to be verified by volatility.
In quantitative trading, risk and model stability are assessed through its volatility. The calculation method refers to Equation (23) and the results that the best results are marked in bold are shown in Table 18.
Vol = σ[return]
It can be found from Table 18 that the performance of the FNN flexible grid on volatility is the top three in each index, i.e., the performance of FNN flexible grid is very stable compared with other methods. It can also be speculated that the poor performance on the MDD may be a single event, and it can be regarded as a robust investment model in most cases. The LSTM flexible grid is the best among all models in the S&P and Nasdaq data sets and is a less risky and more robust investment model.
Finally, in terms of the Sharpe ratio, which is a model performance indicator that calculates the ratio between investment return and risk, it can also be interpreted as the reward that can be exchanged for each unit of risk. The calculation method refers to Equation (24) and the results that the best results are marked in bold are shown in Table 19.
Sharpe = return/σ[return]
From Table 19, it can be found that the Sharpe ratio of FNN flexible grid is the best among all methods on the four indices. In the falling market situation, in addition to short selling, its Sharpe ratio is also the largest. From this, it can be found that the FNN flexible grid can obtain the highest reward for each unit of risk.

5. Conclusions

In addition to proposing a new grid trading architecture, this study effectively improves the ROI of the original model, improves the drawbacks of premature entry and exit, and utilizes SSO algorithm and ANN to assist grid trading for parameter selection and providing the model the ability to adapt to the market.
In terms of model performance, five major market indices are used as verification data, which cover the United States, Europe, and China. The FNN flexible grid performs very well in Sharpe ratio. It has excellent investment return rate and model robustness, and can properly control the balance between risk and return.
This study proves that the technology combined with AI can bring breakthroughs to the original grid trading model in quantitative trading, and can adapt to various rapidly changing market situations. In the future, more related extended research is needed so that the grid trading model can more accurately be closer to human decision making or even better than human judgment when adjusting parameters to eliminate human impulses and market emotions, and make rational market trading decisions to obtain better investment benefits.

Author Contributions

Conceptualization, W.-C.Y., Y.-H.H., K.-Y.H. and C.-L.H.; methodology, W.-C.Y., Y.-H.H. and K.-Y.H.; software, W.-C.Y., Y.-H.H. and K.-Y.H.; validation, W.-C.Y., Y.-H.H., K.-Y.H. and C.-L.H.; formal analysis, W.-C.Y., Y.-H.H. and K.-Y.H.; investigation, W.-C.Y., Y.-H.H., K.-Y.H. and C.-L.H.; resources, W.-C.Y., Y.-H.H., K.-Y.H. and C.-L.H.; data curation, W.-C.Y. and Y.-H.H.; writing—original draft preparation, W.-C.Y., Y.-H.H., K.-Y.H. and C.-L.H.; writing—review and editing, W.-C.Y., Y.-H.H., K.-Y.H. and C.-L.H.; visualization, W.-C.Y. and Y.-H.H.; supervision, W.-C.Y.; project administration, W.-C.Y.; funding acquisition, W.-C.Y. All authors have read and agreed to the published version of the manuscript.

Funding

This research was supported in part by the National Science and Technology Council, R.O.C (MOST 107-2221-E-007-072-MY3, MOST 110-2221-E-007-107-MY3, MOST 109-2221-E-424-002, and MOST 110-2511-H-130-002).

Data Availability Statement

The data sets used for validation and comparison in this study are Standard & Poor’s 500 (S&P 500), NASDAQ Composite, Dow Jones Industrial Average (DJIA), Euro Stoxx 50, and Shanghai Composite, a total of five large-cap indices from 2011 to 2022.

Acknowledgments

We wish to thank the referees for their constructive comments and recommendations, which significantly improved this paper. This article was once submitted to arXiv as a temporary submission that was just for reference and did not provide the copyright.

Conflicts of Interest

The authors declare no conflict of interest.

References

  1. Regulatory Issues Raised by the Impact of Technological Changes on Market Integrity and Efficiency. Consult. Rep, Technical Committee of the International Organization of Securities Commissions. 2011. Available online: https://www.iosco.org/library/pubdocs/pdf/IOSCOPD354.pdf (accessed on 7 October 2022).
  2. Allen, F.; McAndrews, J.; Strahan, P. E-finance: An introduction. J. Financ. Serv. Res. 2002, 22, 5–27. [Google Scholar] [CrossRef]
  3. Shahrokhi, M. E-finance: Status, innovations, resources and future challenges. Manag. Financ. 2008, 34, 365–398. [Google Scholar] [CrossRef]
  4. Turing, A.M. Computing machinery and intelligence. In Parsing the Turing Test; Springer: Dordrecht, The Netherlands, 2009; pp. 23–65. [Google Scholar]
  5. Hutson, M. How researchers are teaching AI to learn like a child. Science 2018, 10. [Google Scholar] [CrossRef]
  6. Minsky, M.; Papert, S.A. Perceptrons, Reissue of the 1988 Expanded Edition with a New Foreword by Léon Bottou: An Introduction to Computational Geometry; MIT Press: Cambridge, MA, USA, 2017. [Google Scholar]
  7. Silver, D.; Huang, A.; Maddison, C.J.; Guez, A.; Sifre, L.; van den Driessche, G.; Schrittwieser, J.; Antonoglou, I.; Panneershelvam, V.; Lanctot, M.; et al. Mastering the game of Go with deep neural networks and tree search. Nature 2016, 529, 484–489. [Google Scholar] [CrossRef] [PubMed]
  8. Aldridge, I. High-Frequency Trading: A Practical Guide to Algorithmic Strategies and Trading Systems; John Wiley & Sons: New York, NY, USA, 2013; Volume 604. [Google Scholar]
  9. Lai, Z.-R.; Yang, P.-Y.; Fang, L.; Wu, X. Reweighted price relative tracking system for automatic portfolio optimization. IEEE Trans. Syst. Man Cybern. Syst. 2018, 50, 4349–4361. [Google Scholar] [CrossRef]
  10. Rundo, F.; Trenta, F.; di Stallo, A.L.; Battiato, S. Grid trading system robot (gtsbot): A novel mathematical algorithm for trading fx market. Appl. Sci. 2019, 9, 1796. [Google Scholar] [CrossRef] [Green Version]
  11. Wen, Q.; Yang, Z.; Song, Y.; Jia, P. Automatic stock decision support system based on box theory and SVM algorithm. Expert Syst. Appl. 2010, 37, 1015–1022. [Google Scholar] [CrossRef]
  12. Deng, S.; Sakurai, A. Short-term foreign exchange rate trading based on the support/resistance level of Ichimoku Kinkohyo. In Proceedings of the IEEE International Conference on Information Science, Electronics and Electrical Engineering, Sapporo, Japan, 26–28 April 2014; pp. 337–340. [Google Scholar]
  13. Ye, A.; Chinthalapati, V.L.R.; Serguieva, A.; Tsang, E. Developing sustainable trading strategies using directional changes with high frequency data. In Proceedings of the IEEE International Conference on Big Data (Big Data), Boston, MA, USA, 11–14 December 2017; pp. 4265–4271. [Google Scholar]
  14. DuPoly, A. The Expert4x, No stop, Hedged, Grid Trading System and The Hedged, Multi-Currency, Forex Trading System. 2008. Available online: https://c.mql5.com/forextsd/forum/54/grid1.pdf (accessed on 7 October 2022).
  15. Yeh, W.-C.; Wei, S.-C. Economic-based resource allocation for reliable Grid-computing service based on Grid Bank. Future Gener. Comput. Syst. 2012, 28, 989–1002. [Google Scholar] [CrossRef]
  16. Wei, S.-C.; Yeh, W.-C. Resource allocation decision model for dependable and cost-effective grid applications based on Grid Bank. Future Gener. Comput. Syst. 2017, 77, 12–28. [Google Scholar] [CrossRef]
  17. Yeh, W.-C. A two-stage discrete particle swarm optimization for the problem of multiple multi-level redundancy allocation in series systems. Expert Syst. Appl. 2009, 36, 9192–9200. [Google Scholar] [CrossRef]
  18. Yeh, W.-C. Novel swarm optimization for mining classification rules on thyroid gland data. Inf. Sci. 2012, 197, 65–76. [Google Scholar] [CrossRef]
  19. Yeh, W.-C.; Chang, W.-W.; Chung, Y.Y. A new hybrid approach for mining breast cancer pattern using discrete particle swarm optimization and statistical method. Expert Syst. Appl. 2009, 36, 8204–8211. [Google Scholar] [CrossRef]
  20. Yeh, W.-C.; Liu, Z.; Yang, Y.-C.; Tan, S.-Y. Solving dual-channel supply chain pricing strategy problem with multi-level programming based on improved simplified swarm optimization. Technologies 2022, 10, 73. [Google Scholar] [CrossRef]
  21. Lin, H.C.-S.; Huang, C.-L.; Yeh, W.-C. A novel constraints model of credibility-fuzzy for reliability redundancy allocation problem by simplified swarm optimization. Appl. Sci. 2021, 11, 10765. [Google Scholar] [CrossRef]
  22. Yeh, W.-C.; Lai, P.-J.; Lee, W.-C.; Chuang, M.-C. Parallel-machine scheduling to minimize makespan with fuzzy processing times and learning effects. Inf. Sci. 2014, 269, 142–158. [Google Scholar] [CrossRef]
  23. Yeh, W.-C.; Zhu, W.; Tan, S.-Y.; Wang, G.-G.; Yeh, Y.-H. Novel general active reliability redundancy allocation problems and algorithm. Reliab. Eng. Syst. Saf. 2021, 218, 108167. [Google Scholar] [CrossRef]
  24. Yeh, W.-C.; Tan, S.-Y. Simplified Swarm Optimization for the Heterogeneous Fleet Vehicle Routing Problem with Time-Varying Continuous Speed Function. Electronics 2021, 10, 1775. [Google Scholar] [CrossRef]
  25. Bae, C.; Yeh, W.C.; Wahid, N.; Chung, Y.Y.; Liu, Y. A new simplified swarm optimization (SSO) using exchange local search scheme. Int. J. Innov. Comput. Inf. Control 2012, 8, 4391–4406. [Google Scholar]
  26. Yeh, W.-C.; Su, Y.-Z.; Gao, X.-Z.; Hu, C.-F.; Wang, J.; Huang, C.-L. Simplified swarm optimization for bi-objection active reliability redundancy allocation problems. Appl. Soft Comput. 2021, 106, 107321. [Google Scholar] [CrossRef]
  27. Wang, M.; Yeh, W.-C.; Chu, T.-C.; Zhang, X.; Huang, C.-L.; Yang, J. Solving Multi-Objective Fuzzy Optimization in Wireless Smart Sensor Networks under Uncertainty Using a Hybrid of IFR and SSO Algorithm. Energies 2018, 11, 2385. [Google Scholar] [CrossRef] [Green Version]
  28. Yeh, W.-C. Simplified swarm optimization in disassembly sequencing problems with learning effects. Comput. Oper. Res. 2012, 39, 2168–2177. [Google Scholar] [CrossRef]
  29. Yeh, W.-C. A novel boundary swarm optimization method for reliability redundancy allocation problems. Reliab. Eng. Syst. Saf. 2019, 192, 106060. [Google Scholar] [CrossRef]
  30. Yeh, W.-C. Orthogonal simplified swarm optimization for the series–parallel redundancy allocation problem with a mix of components. Knowl. Based Syst. 2014, 64, 1–12. [Google Scholar] [CrossRef]
  31. Zhu, W.; Yeh, W.C.; Cao, L.; Zhu, Z.; Chen, D.; Chen, J.; Li, A.; Lin, Y. Faster evolutionary convolutional neural networks based on iSSO for lesion recognition in medical images. Basic Clin. Pharmacol. Toxicol. 2019, 124, 329. [Google Scholar]
  32. Yeh, W.; Lin, P.; Huang, C. Simplified swarm optimisation for the solar cell models parameter estimation problem. IET Renew. Power Gener. 2017, 11, 1166–1173. [Google Scholar] [CrossRef]
  33. Lin, P.; Cheng, S.; Yeh, W.; Chen, Z.; Wu, L. Parameters extraction of solar cell models using a modified simplified swarm optimization algorithm. Sol. Energy 2017, 144, 594–603. [Google Scholar] [CrossRef]
  34. Yeh, W.-C. New Parameter-Free Simplified Swarm Optimization for Artificial Neural Network Training and its Application in the Prediction of Time Series. IEEE Trans. Neural Netw. Learn. Syst. 2013, 24, 661–665. [Google Scholar] [CrossRef] [PubMed]
  35. Huang, W.; Lai, K.K.; Nakamori, Y.; Wang, S.; Yu, L. Neural networks in finance and economics forecasting. Int. J. Inf. Technol. Decis. Mak. 2007, 6, 113–140. [Google Scholar] [CrossRef]
  36. Qi, S.; Jin, K.; Li, B.; Qian, Y. The exploration of internet finance by using neural network. J. Comput. Appl. Math. 2020, 369, 112630. [Google Scholar] [CrossRef]
  37. Siami-Namini, S.; Namin, A.S. Forecasting economics and financial time series: ARIMA vs. LST. arXiv 2018, arXiv:1803.06386. [Google Scholar]
  38. Cao, J.; Li, Z.; Li, J. Financial time series forecasting model based on CEEMDAN and LST. Phys. A Stat. Mech. Its Appl. 2019, 519, 127–139. [Google Scholar] [CrossRef]
  39. Jegadeesh, N. Evidence of predictable behavior of security returns. J. Financ. 1990, 45, 881–898. [Google Scholar] [CrossRef]
  40. Jegadeesh, N. Seasonality in stock price mean reversion: Evidence from the US and the UK. J. Financ. 1991, 46, 1427–1444. [Google Scholar] [CrossRef]
  41. Li, B.; Zhao, P.; Hoi, S.C.H.; Gopalkrishnan, V. PAMR: Passive aggressive mean reversion strategy for portfolio selection. Mach. Learn. 2012, 87, 221–258. [Google Scholar] [CrossRef]
  42. Mcculloch, W.S.; Pitts, W.H. A logical calculus of the ideas immanent in nervous activity. Bull. Math. Biophys. 1943, 5, 115–133. [Google Scholar] [CrossRef]
  43. Rosenblatt, F. The perceptron: A probabilistic model for information storage and organization in the brain. Psychol. Rev. 1958, 65, 386–408. [Google Scholar] [CrossRef] [PubMed] [Green Version]
  44. Werbos, P. Beyond Regression: New Tools for Prediction and Analysis in the Behavioral Sciences. Ph.D. Thesis, Harvard University, Cambridge, MA, USA, 1974. [Google Scholar]
  45. Rumelhart, D.E.; Hinton, G.E.; Williams, R.J. Learning representations by back-propagating errors. Nature 1986, 323, 533–536. [Google Scholar] [CrossRef]
  46. Ruder, S. An overview of gradient descent optimization algorithms. arXiv 2016, arXiv:1609.04747. [Google Scholar]
  47. Poterba, J.M.; Summers, L.H. Mean reversion in stock prices: Evidence and Implications. J. Financ. Econ. 1988, 22, 27–59. [Google Scholar] [CrossRef]
  48. Hurst, B.; Ooi, Y.H.; Pedersen, L.H. A century of evidence on trend-following investing. J. Portf. Manag. 2017, 44, 15–29. [Google Scholar] [CrossRef]
Figure 1. Schematic diagram of equal-distance grid trading.
Electronics 11 03259 g001
Figure 2. Schematic diagram of equal-ratio grid trading.
Electronics 11 03259 g002
Figure 3. Grid trading operation chart (ae).
Electronics 11 03259 g003aElectronics 11 03259 g003b
Figure 4. Grid trading operation flow chart.
Electronics 11 03259 g004
Figure 5. Schematic diagram of flexible grid trading.
Electronics 11 03259 g005
Figure 6. Structure of solution encoding.
Electronics 11 03259 g006
Figure 7. ANN architecture.
Electronics 11 03259 g007
Table 1. Upper and lower bounds of grid trading parameters.
Scope of UseParametersVariable Upper BoundVariable Lower Bound
Experiment 1Grid upper bound GulP0 × 130% P0 × 105%
Grid lower bound GllP0 × 95% P0 × 70%
Experiment 2Grid upper bound Gul,P0 × 150% P0 × 105%
Grid lower bound GllP0 × 95% P0 × 50%
In common useNumber of upper grids nu [P0 × 100/(maximum Px × 1.3)] − 10 10
Number of lower grids nl[P0 × 100/(maximum Px × 1.3)] − 10 10
Table 2. Symbols and definitions of SSO.
SymbolsDefinitions
NvarThe number of variables: the grid upper bound Gul, grid lower bound Gll and total number of grids n in this study.
NsolTotal number of solutions.
x i t x i t = ( G u l i t , G l l i t , n i t ) represents the ith solution in the tth generation, where t = 1, 2,…, Ngen, i = 1, 2, …, Nsol.
G u l p ^ , G u l g ^ , G l l p ^ , G l l g ^ , n p ^ , n g ^ pbest and gbest of each variable during the update process.
Cg, Cp, CwThe three key parameters used to determine the update value in SSO Can be adjusted according to different situations.
UBUB = ( u b 1 ,   u b 2 ,   ,   u b N v a r )   is   the   upper   bound   of   each   variable ,   i . e . ,   x u b j .
LBLB = ( l b 1 ,   l b 2 ,   ,   l b N v a r )   is   the   lower   bound   of   each   variable ,   i . e . ,   x l b j .
Table 3. ROI obtained by flexible grid, equal-distance grid, and equal-ratio grid.
Grid TypeFlexible GridEqual-DistanceEqual-Ratio
S&P 500
(Gul,Gll) = (P0 × 1.3,P0 × 0.7)
(Gul,Gll) = (P0 × 1.5,P0 × 0.5)

31.692%
43.727%

27.934%
39.556%

22.234%
30.174%
Nasdaq 100
(Gul,Gll) = (P0 × 1.3,P0 × 0.7)
(Gul,Gll) = (P0 × 1.5,P0 × 0.5)

53.795%
71.888%

49.261%
66.024%

40.369%
51.180%
Dow Jones Industrial Average
(Gul,Gll) = (P0 × 1.3,P0 × 0.7)
(Gul,Gll) = (P0 × 1.5,P0 × 0.5)

21.935%
33.541%

18.332%
29.741%

13.629%
21.648%
Euro Stoxx 50
(Gul,Gll) = (P0 × 1.3,P0 × 0.7)
(Gul,Gll) = (P0 × 1.5,P0 × 0.5)

0.601%
17.499%

−4.122%
12.520%

−7.284%
7.087%
Shanghai Composite
((Gul,Gll) = (P0 × 1.3,P0 × 0.7)
(Gul,Gll) = (P0 × 1.5,P0 × 0.5)

−33.904%
−12.955%

−38.944%
−19.936%

−38.534%
−18.290%
Table 4. Accumulated wealth obtained by flexible grid, equal-distance grid, and equal-ratio grid.
Grid TypeFlexible GridEqual-DistanceEqual-Ratio
S&P 500
(Gul,Gll) = (P0 × 1.3,P0 × 0.7)
(Gul,Gll) = (P0 × 1.5,P0 × 0.5)

13,169
14,373

12,793
13,956

12,223
13,017
Nasdaq 100
(Gul,Gll) = (P0 × 1.3,P0 × 0.7)
(Gul,Gll) = (P0 × 1.5,P0 × 0.5)

15,380
17,189

14,926
16,602

14,037
15,118
Dow Jones Industrial Average
(Gul,Gll) = (P0 × 1.3,P0 × 0.7)
(Gul,Gll) = (P0 × 1.5,P0 × 0.5)

12,194
13,354

11,833
12,974

11,363
12,165
Euro Stoxx 50
(Gul,Gll) = (P0 × 1.3,P0 × 0.7)
(Gul,Gll) = (P0 × 1.5,P0 × 0.5)

10,060
11,750

9588
11,252

9272
10,709
Shanghai Composite
(Gul,Gll) = (P0 × 1.3,P0 × 0.7)
(Gul,Gll) = (P0 × 1.5,P0 × 0.5)

6610
8705

6106
8006

6147
8171
Table 5. Sharpe ratio obtained by flexible grid, equal-distance grid, and equal-ratio grid.
Grid TypeFlexible GridEqual-DistanceEqual-Ratio
S&P 500
(Gul,Gll) = (P0 × 1.3,P0 × 0.7)
(Gul,Gll) = (P0 × 1.5,P0 × 0.5)

0.118
0.160

0.103
0.145

0.092
0.137
Nasdaq 100
(Gul,Gll) = (P0 × 1.3,P0 × 0.7)
(Gul,Gll) = (P0 × 1.5,P0 × 0.5)

0.187
0.234

0.172
0.219

0.161
0.215
Dow Jones Industrial Average
(Gul,Gll) = (P0 × 1.3,P0 × 0.7)
(Gul,Gll) = (P0 × 1.5,P0 × 0.5)

0.079
0.119

0.065
0.105

0.054
0.095
Euro Stoxx 50
(Gul,Gll) = (P0 × 1.3,P0 × 0.7)
(Gul,Gll) = (P0 × 1.5,P0 × 0.5)

0.002
0.046

−0.011
0.033

−0.021
0.023
Shanghai Composite
(Gul,Gll) = (P0 × 1.3,P0 × 0.7)
(Gul,Gll) = (P0 × 1.5,P0 × 0.5)

−0.082
−0.030

−0.095
−0.047

−0.106
−0.053
Table 6. Best and worst solutions under different parameter combinations (Experiment 1).
(Cg,Cp,Cw)Maximum Scale SolutionROI (Max) ROI (Min)
(0.7,0.8,0.9) gbest 69.74%66.83%
(0.1,0.8,0.9) pbest69.62% 67.18%
(0.1,0.2,0.9) x i , j t + 1 69.69% 66.01%
(0.1,0.2,0.3)proposed solution69.41% 66.69%
Table 7. Best and worst solutions under different parameter combinations (Experiment 2).
(Cg,Cp,Cw)Maximum Scale SolutionROI (Max) ROI (Min)
(0.5,0.8,0.9)pbest69.77%66.22%
(0.5,0.6,0.9) x i , j t + 1 69.77%66.91%
(0.5,0.6,0.7)proposed solution69.86%67.83%
Table 8. Best and worst solutions under different parameter combinations (Experiment 3).
(Cg,Cp,Cw)Maximum Scale SolutionROI (Max) ROI (Min)
(0.3,0.6,0.7)pbest69.85%67.99%
(0.3,0.4,0.7) x i , j t + 1 69.90%67.81%
Table 9. ROI obtained by flexible grid, equal-distance grid, and equal-ratio grid with SSO parameters.
Grid TypeFlexible GridEqual-DistanceEqual-Ratio
S&P 500
(Gul,Gll) = (P0 × 1.3,P0 × 0.7)
(Gul,Gll) = (P0 × 1.5,P0 × 0.5)

82.859%
90.269%

66.384%
77.198%

58.394%
60.774%
Nasdaq 100
(Gul,Gll) = (P0 × 1.3,P0 × 0.7)
(Gul,Gll) = (P0 × 1.5,P0 × 0.5)

111.649%
127.268%

66.384%
110.179%

82.662%
86.208%
Dow Jones Industrial Average
(Gul,Gll) = (P0 × 1.3,P0 × 0.7)
(Gul,Gll) = (P0 × 1.5,P0 × 0.5)

74.509%
80.559%

60.591%
70.063%

51.893%
54.760%
Euro Stoxx 50
(Gul,Gll) = (P0 × 1.3,P0 × 0.7)
(Gul,Gll) = (P0 × 1.5,P0 × 0.5)

77.220%
88.844%

56.650%
72.293%

48.365%
55.856%
Shanghai Composite
(Gul,Gll) = (P0 × 1.3,P0 × 0.7)
(Gul,Gll) = (P0 × 1.5,P0 × 0.5)

58.389%
80.954%

39.178%
58.934%

33.363%
43.639%
Table 10. Accumulated wealth obtained by flexible grid, equal-distance grid, and equal-ratio grid with SSO parameters.
Grid TypeFlexible GridEqual-DistanceEqual-Ratio
S&P 500
(Gul,Gll) = (P0 × 1.3,P0 × 0.7)
(Gul,Gll) = (P0 × 1.5,P0 × 0.5)

18,286
19,027

16,638
17,720

15,839
16,077
Nasdaq 100
(Gul,Gll) = (P0 × 1.3,P0 × 0.7)
(Gul,Gll) = (P0 × 1.5,P0 × 0.5)

21,165
22,727

16,638
21,018

18,266
18,621
Dow Jones Industrial Average
(Gul,Gll) = (P0 × 1.3,P0 × 0.7)
(Gul,Gll) = (P0 × 1.5,P0 × 0.5)

17,451
18,056

16,059
17,006

15,189
15,476
Euro Stoxx 50
(Gul,Gll) = (P0 × 1.3,P0 × 0.7)
(Gul,Gll) = (P0 × 1.5,P0 × 0.5)

17,722
18,884

15,665
17,229

14,837
15,586
Shanghai Composite
(Gul,Gll) = (P0 × 1.3,P0 × 0.7)
(Gul,Gll) = (P0 × 1.5,P0 × 0.5)

15,839
18,095

13,918
15,893

13,336
14,364
Table 11. Sharpe ratio obtained by flexible grid, equal-distance grid, and equal-ratio grid with SSO parameters.
Grid TypeFlexible GridEqual-DistanceEQUAL-RATIO
S&P 500
(Gul,Gll) = (P0 × 1.3,P0 × 0.7)
(Gul,Gll) = (P0 × 1.5,P0 × 0.5)

0.439
0.442

0.350
0.391

0.351
0.388
Nasdaq 100
(Gul,Gll) = (P0 × 1.3,P0 × 0.7)
(Gul,Gll) = (P0 × 1.5,P0 × 0.5)

0.498
0.524

0.350
0.464

0.437
0.462
Dow Jones Industrial Average
(Gul,Gll) = (P0 × 1.3,P0 × 0.7)
(Gul,Gll) = (P0 × 1.5,P0 × 0.5)

0.377
0.412

0.310
0.344

0.301
0.341
Euro Stoxx 50
(Gul,Gll) = (P0 × 1.3,P0 × 0.7)
(Gul,Gll) = (P0 × 1.5,P0 × 0.5)

0.300
0.331

0.219
0.265

0.211
0.257
Shanghai Composite
(Gul,Gll) = (P0 × 1.3,P0 × 0.7)
(Gul,Gll) = (P0 × 1.5,P0 × 0.5)

0.189
0.220

0.134
0.179

0.131
0.172
Table 12. FNN hyper-parameters and architecture-related settings.
ItemValue Set
Number of input variables8
Number of hidden layers3
Number of output variables4
Number of hidden layer nodes500
Optimizeradam
Excitation functionsigmoid
Loss functionmean squared error
Number of generations300
Batch size40
Table 13. LSTM neural network hyper-parameters and architecture-related settings.
ItemValue Set
Number of input variables8
Number of hidden layers3
Number of output variables4
Number of hidden layer nodes256, 128, 64
Optimizeradam
Excitation functionrelu
Loss functionmean squared error
Number of generations300
Batch size32
Table 14. Mean square error of values for output layer including upper bound of the grid Gul, lower bound of the grid Gll, number of upper grids nu, and number of lower grids nl comparison between FNN and LSTM models.
Neural Network TypeFNNLSTM
S&P 500
Upper bound of the grid Gul
Lower bound of the grid Gll
Number of upper grids nu
Number of lower grids nl

129,510
59,787
207
308

186,366
108,622
252
442
Nasdaq 100
Upper bound of the grid Gul
Lower bound of the grid Gll
Number of upper grids nu
Number of lower grids nl

4,725,772
1,681,699
133
246

518,181
1,162,381
296
568
Dow Jones Industrial Average
Upper bound of the grid Gul
Lower bound of the grid Gll
Number of upper grids nu
Number of lower grids nl

6,016,533
2,011,354
164
319

24,446,812
19,594,848
237
402
Euro Stoxx 50
Upper bound of the grid Gul
Lower bound of the grid Gll
Number of upper grids nu
Number of lower grids nl

105,024
33,988
132
199

334,456
106,422
202
290
Shanghai Composite
Upper bound of the grid Gul
Lower bound of the grid Gll
Number of upper grids nu
Number of lower grids nl

65,199
33,604
85
214

92,869
26,189
280
459
Table 15. Comparison of coefficient of determination between FNN and LSTM models.
Neural Network TypeFNNLSTM
S&P 500
Upper bound of the grid Gul
Uower bound of the grid Gll
Number of upper grids nu
Number of lower grids nl

97.410%
99.586%
94.972%
99.392%
90.490%
90.490%
97.240%
99.469%
94.892%
Nasdaq 100
Upper bound of the grid Gul
Lower bound of the grid Gll
Number of upper grids nu
Number of lower grids nl

96.415%
97.088%
94.942%
94.737%

98.075%
99.915%
99.635%
98.019%
Dow Jones Industrial Average
Upper bound of the grid Gul
Lower bound of the grid Gll
Number of upper grids nu
Number of lower grids nl

97.704%
99.771%
99.855%
99.559%

95.970%
93.429%
93.685%
91.285%
Euro Stoxx 50
Upper bound of the grid Gul
Lower bound of the grid Gll
Number of upper grids nu
Number of lower grids nl

96.183%
99.324%
99.297%
98.405%

94.392%
98.063%
96.858%
99.760%
Shanghai Composite
Upper bound of the grid Gul
Lower bound of the grid Gll
Number of upper grids nu
Number of lower grids nl

97.157%
96.749%
93.165%
99.661%

96.577%
95.545%
93.881%
99.003%
Table 16. Comparison of ROI.
S&PNasdaqDJIEuro StoxxShanghai
B&S14.392%1.519%9.880%28.340%−15.581%
S&B−14.392%−1.519%−9.880%−28.340%15.581%
GTSbot6.408%4.680%6.594%1.191%−0.466%
IWOC24.111%23.171%7.143%32.087%−18.758%
FG-FNN11.520%11.733%8.849%12.977%−3.125%
FG-LSTM4.639%1.823%2.940%7.734%−9.283%
Equal-distance5.194%−2.972%3.480%10.748%−4.495%
Equal-ratio4.536%−3.625%3.276%10.764%−4.892%
Flexible5.589%−1.895%4.270%11.477%−4.309%
Table 17. Comparison of MDD.
S&PNasdaqDJIEuro StoxxShanghai
B&S7.960%12.570%7.290%4.029%8.529%
S&B7.491%10.370%6.580%7.313%3.103%
GTSbot0.524%5.335%1.000%0.510%1.126%
IWOC10.345%12.421%8.606%5.467%7.640%
FG-FNN6.455%5.596%7.491%2.034%4.105%
FG-LSTM1.580%49.031%4.809%2.966%3.551%
Equal-distance5.252%8.594%4.078%1.513%4.074%
Equal-ratio5.243%10.096%4.057%1.529%4.059%
Flexible4.737%8.780%4.163%4.144%4.208%
Table 18. Comparison of volatility.
S&PNasdaqDJIEuro StoxxShanghai
B&S0.061260.076710.035680.062210.01840
S&B0.061260.076710.035680.062210.01840
GTSbot0.017100.035890.017950.002670.00190
IWOC0.076890.083980.045640.073370.03568
FG-FNN0.016870.020760.021490.017300.01414
FG-LSTM0.016720.016370.022030.016790.02030
Equal-distance0.024500.035790.021290.017860.01590
Equal-ratio0.024730.036290.021550.018280.01629
Flexible0.025030.036650.021620.018620.01624
Table 19. Comparison of Sharpe ratio.
S&PNasdaqDJIEuro Stoxx Shanghai
B&S2.3490.1982.7694.556−8.466
S&B−2.349−0.198−2.769−4.5568.466
GTSbot3.7481.3043.6734.466−2.446
IWOC3.1362.7591.5654.373−5.258
FG-FNN6.8285.6514.1197.499−2.210
FG-LSTM2.7741.1141.3354.606−4.573
Equal-distance2.120−0.8301.6346.017−2.827
Equal-ratio1.834−0.9991.5205.887−3.004
Flexible2.233−0.5171.9756.165−2.653
Publisher’s Note: MDPI stays neutral with regard to jurisdictional claims in published maps and institutional affiliations.

