
Breast Cancer Histopathological Image Recognition Based on Pyramid Gray Level Co-Occurrence Matrix and Incremental Broad Learning


Abstract
:1. Introduction
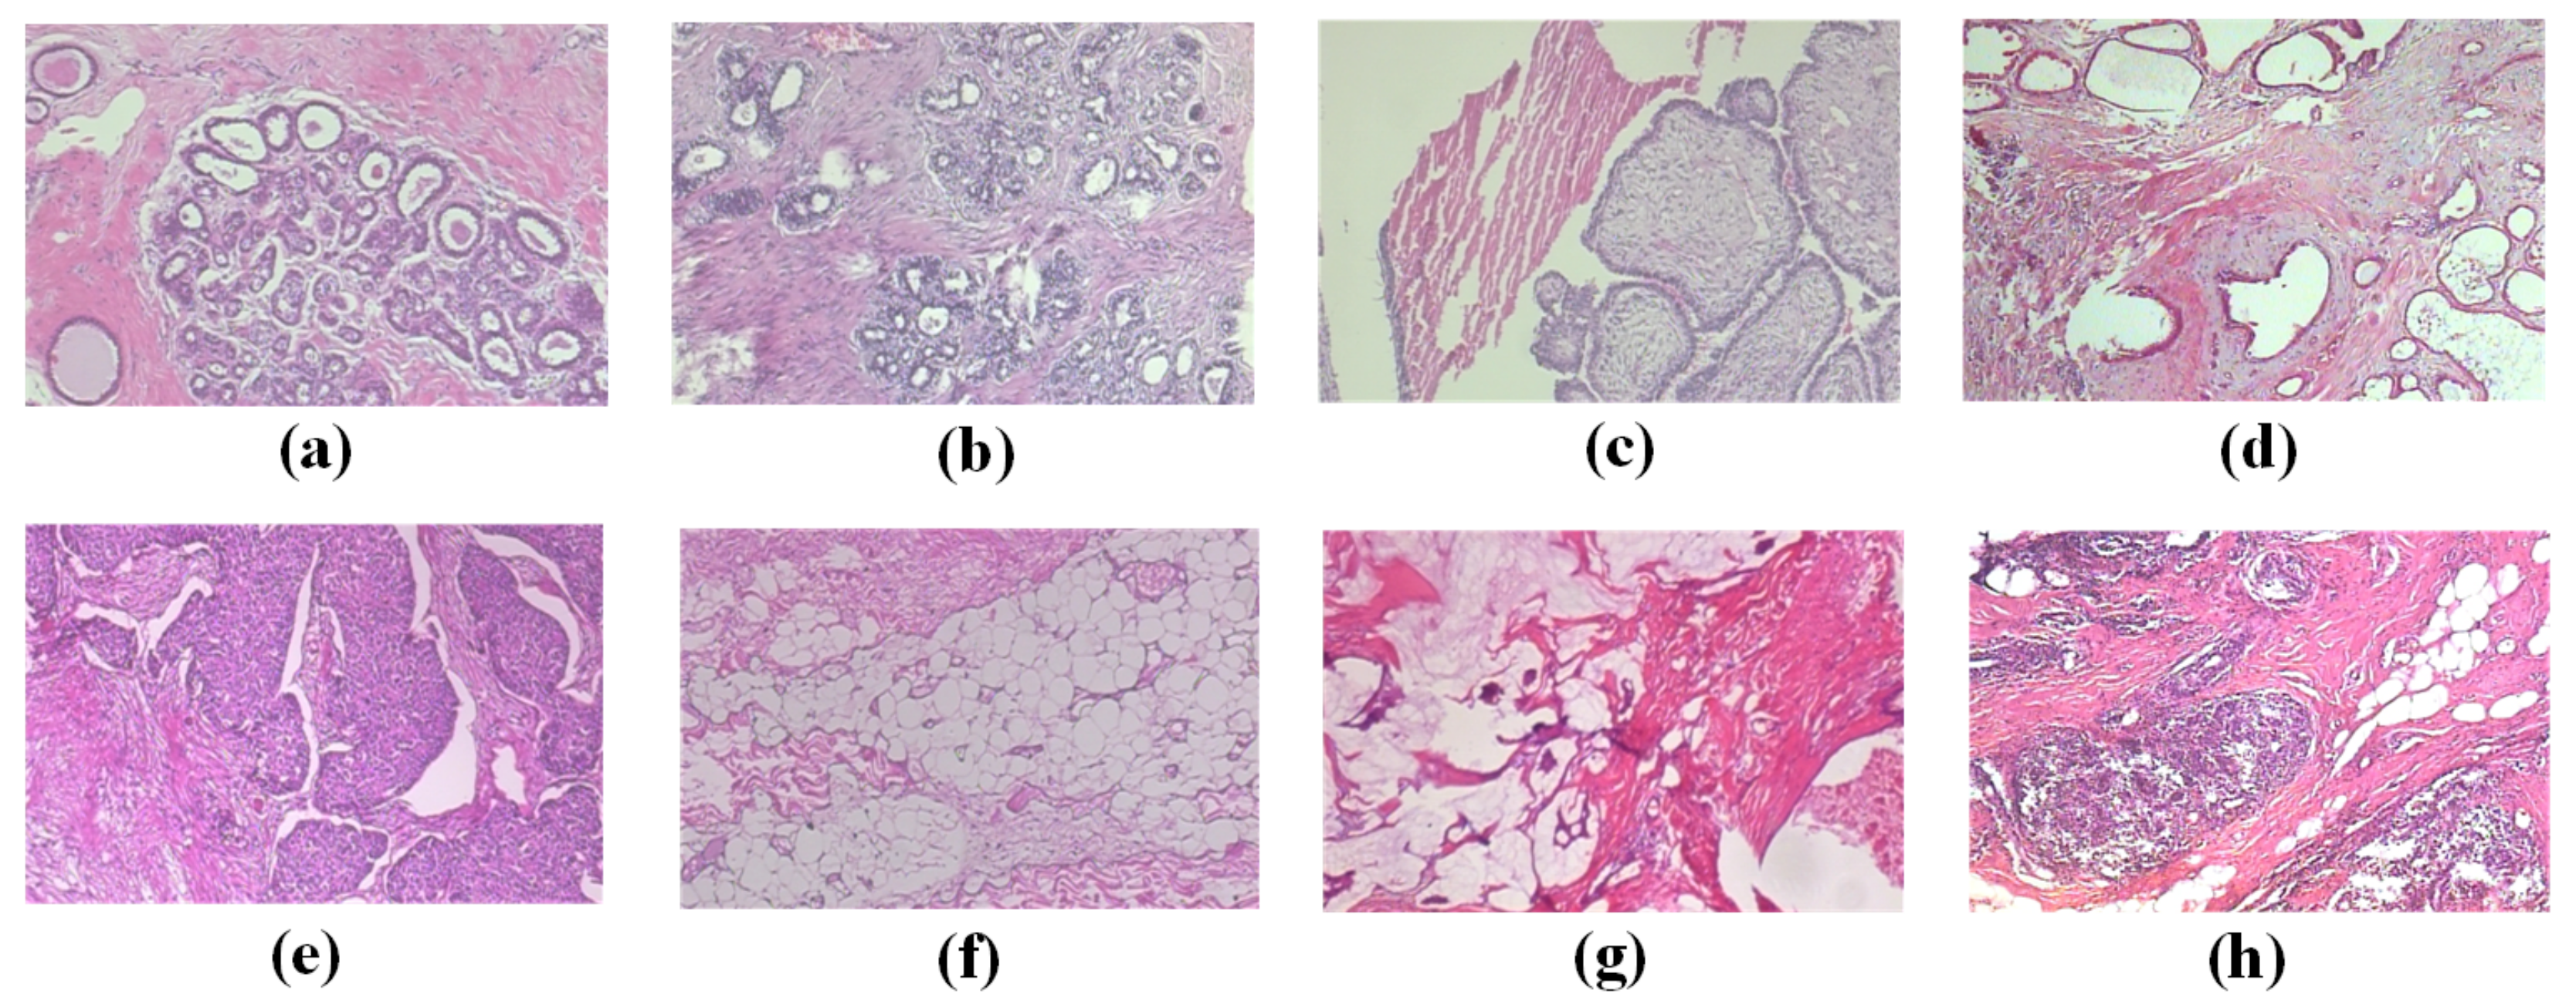
2. Database
3. Proposed Methodology
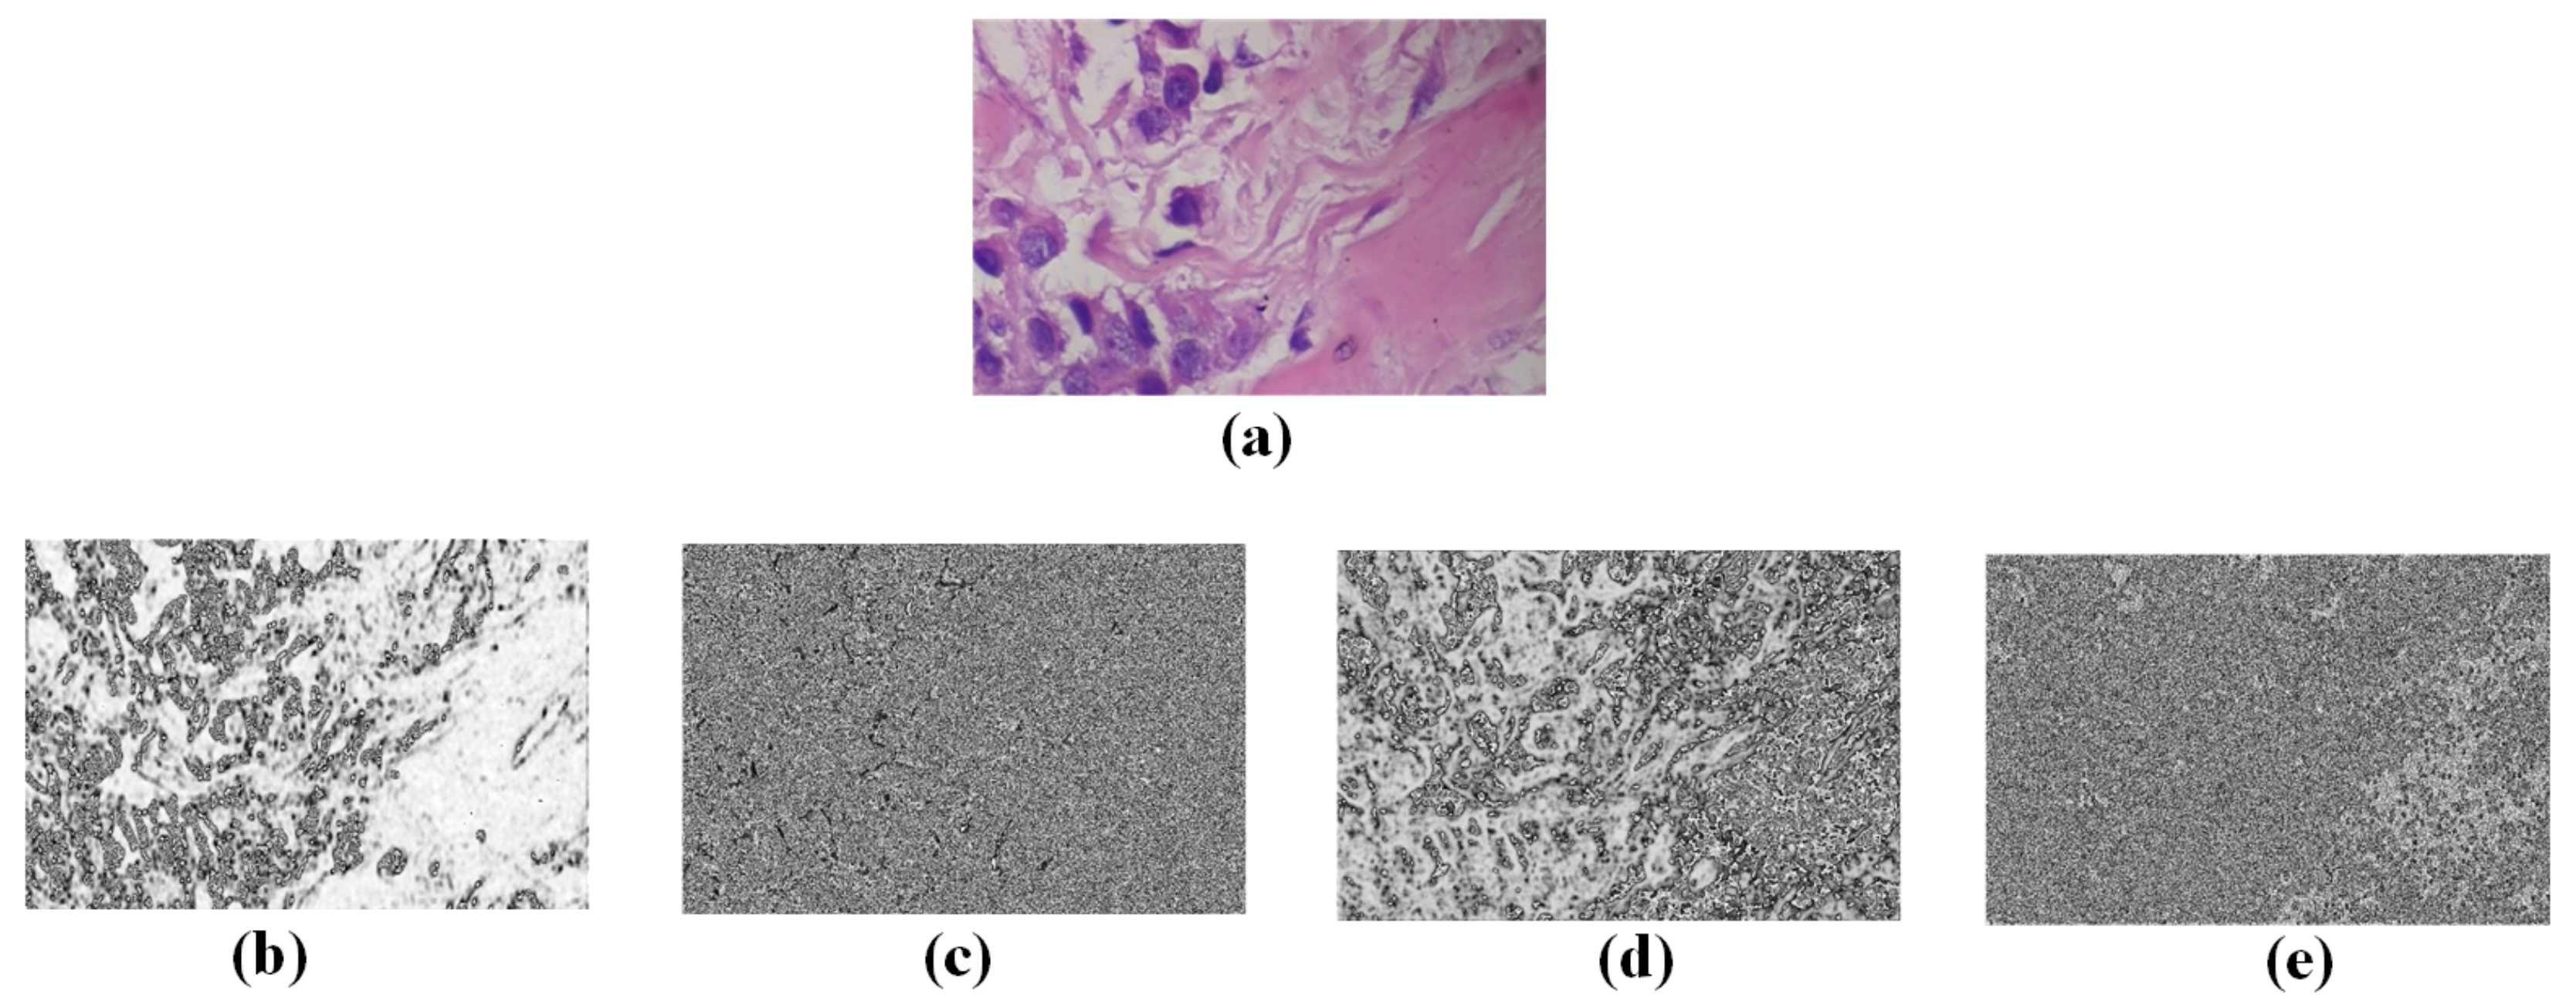
3.1. Data Preprocessing
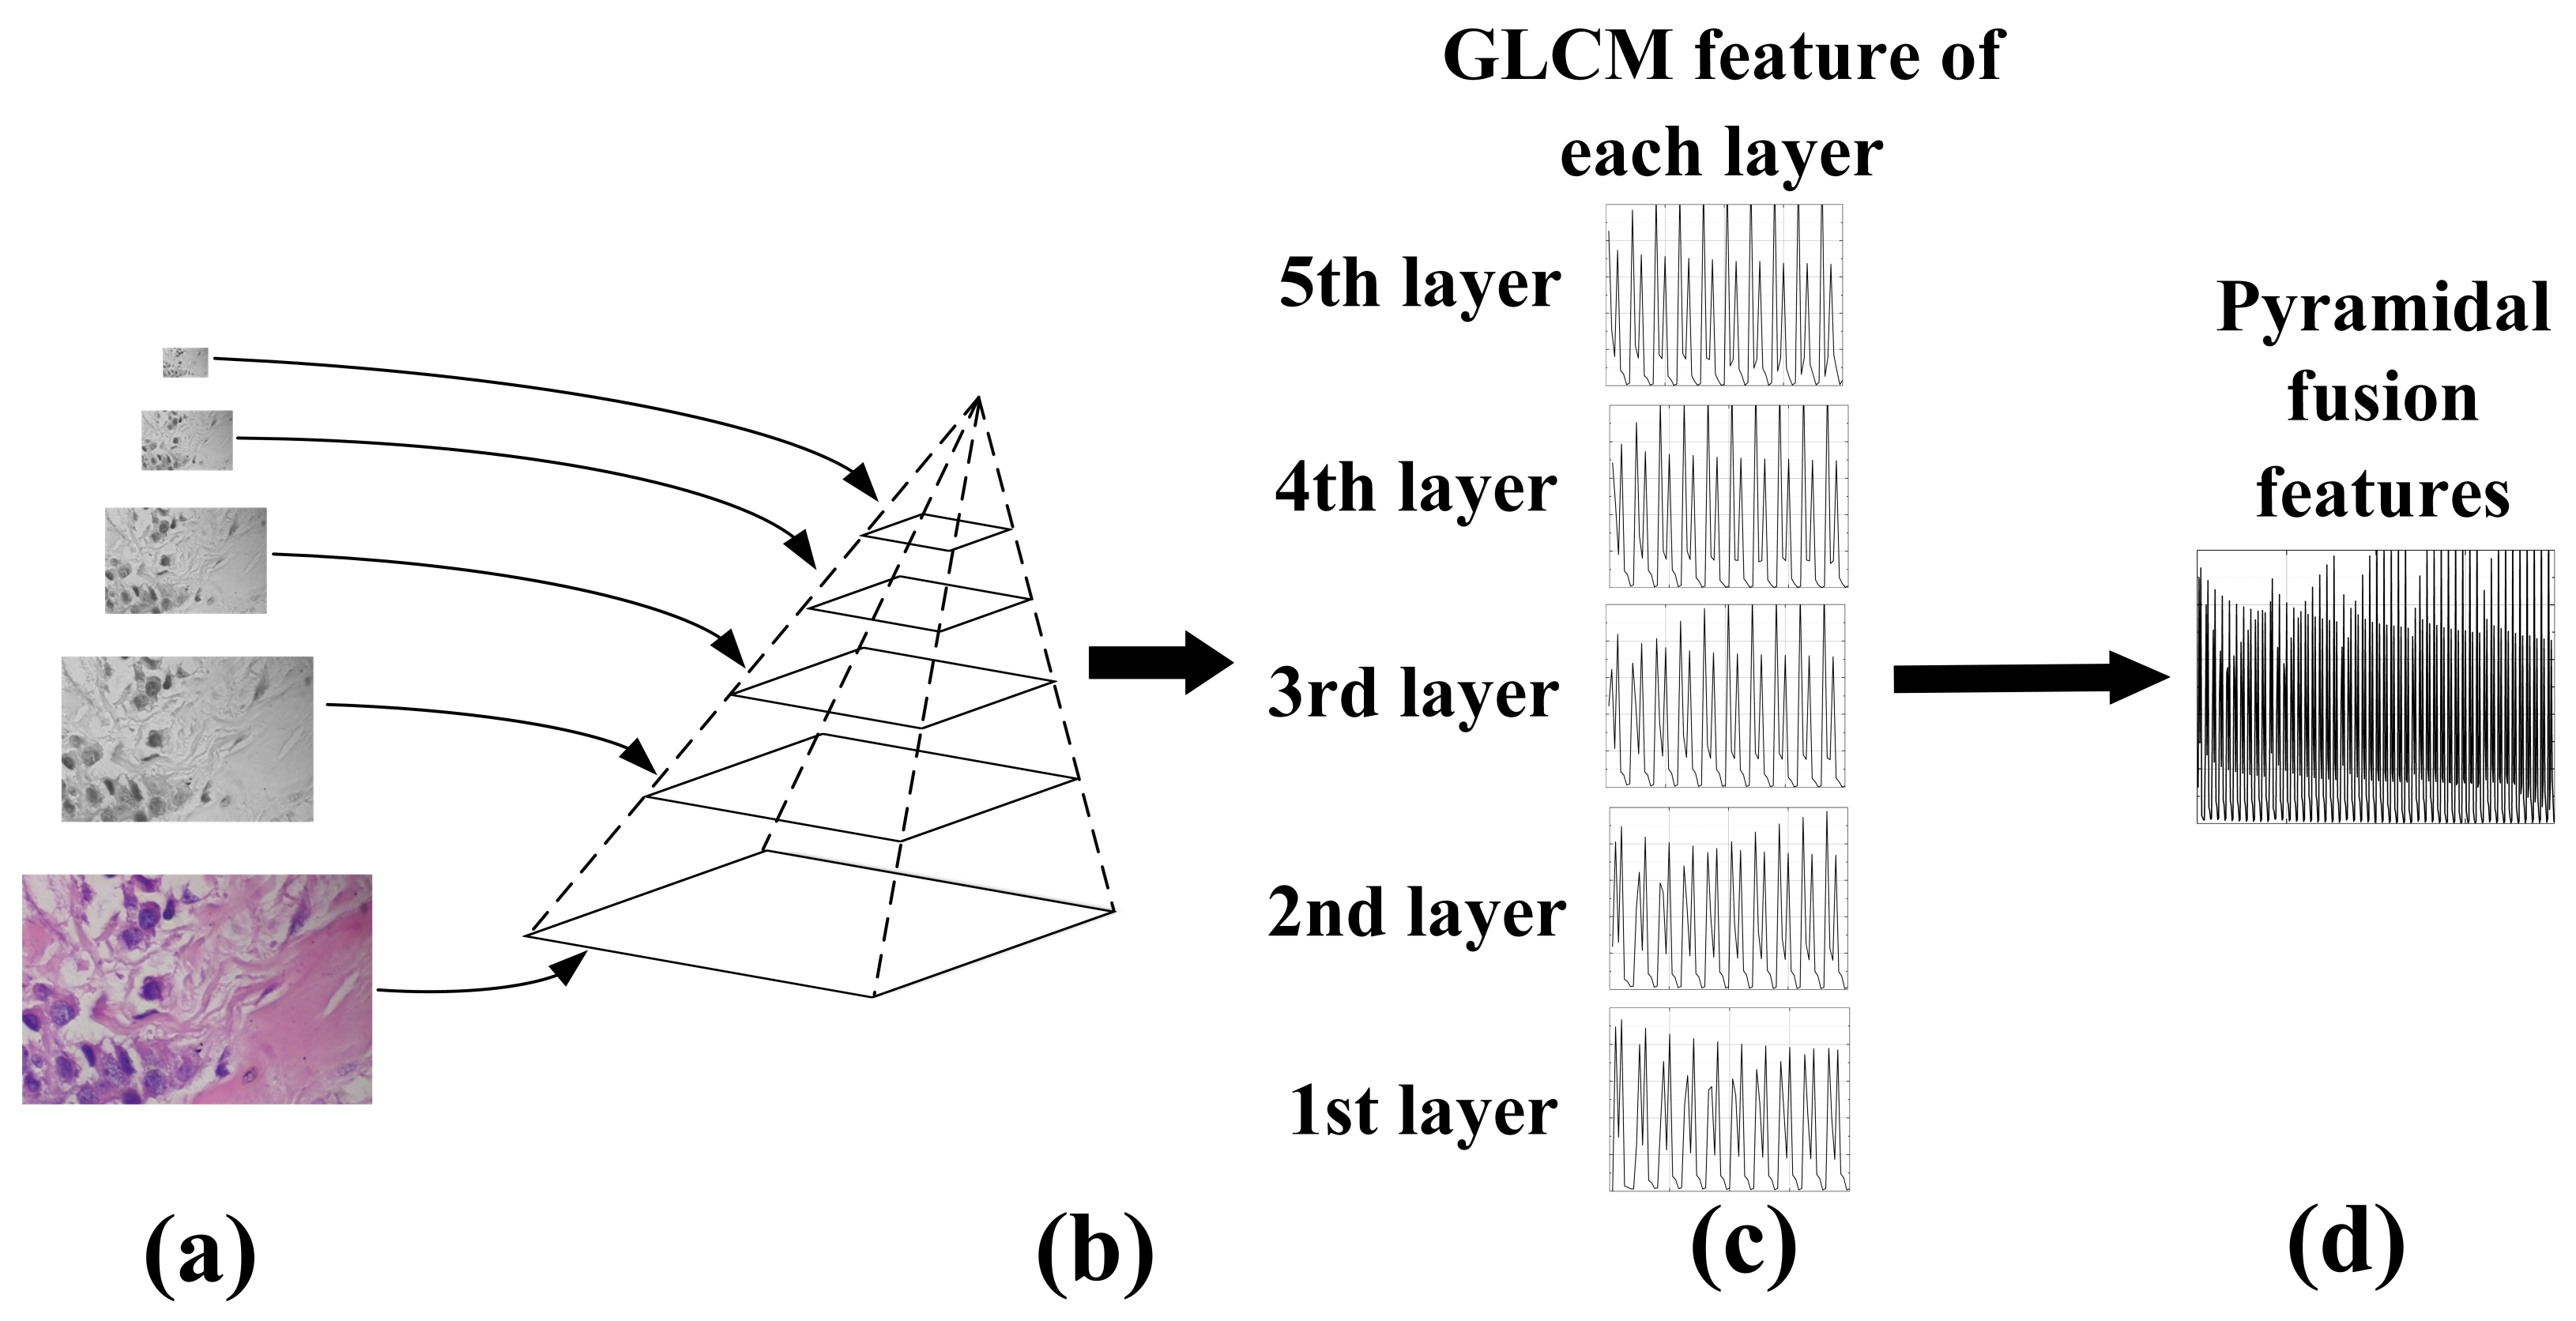
3.2. Feature Extraction
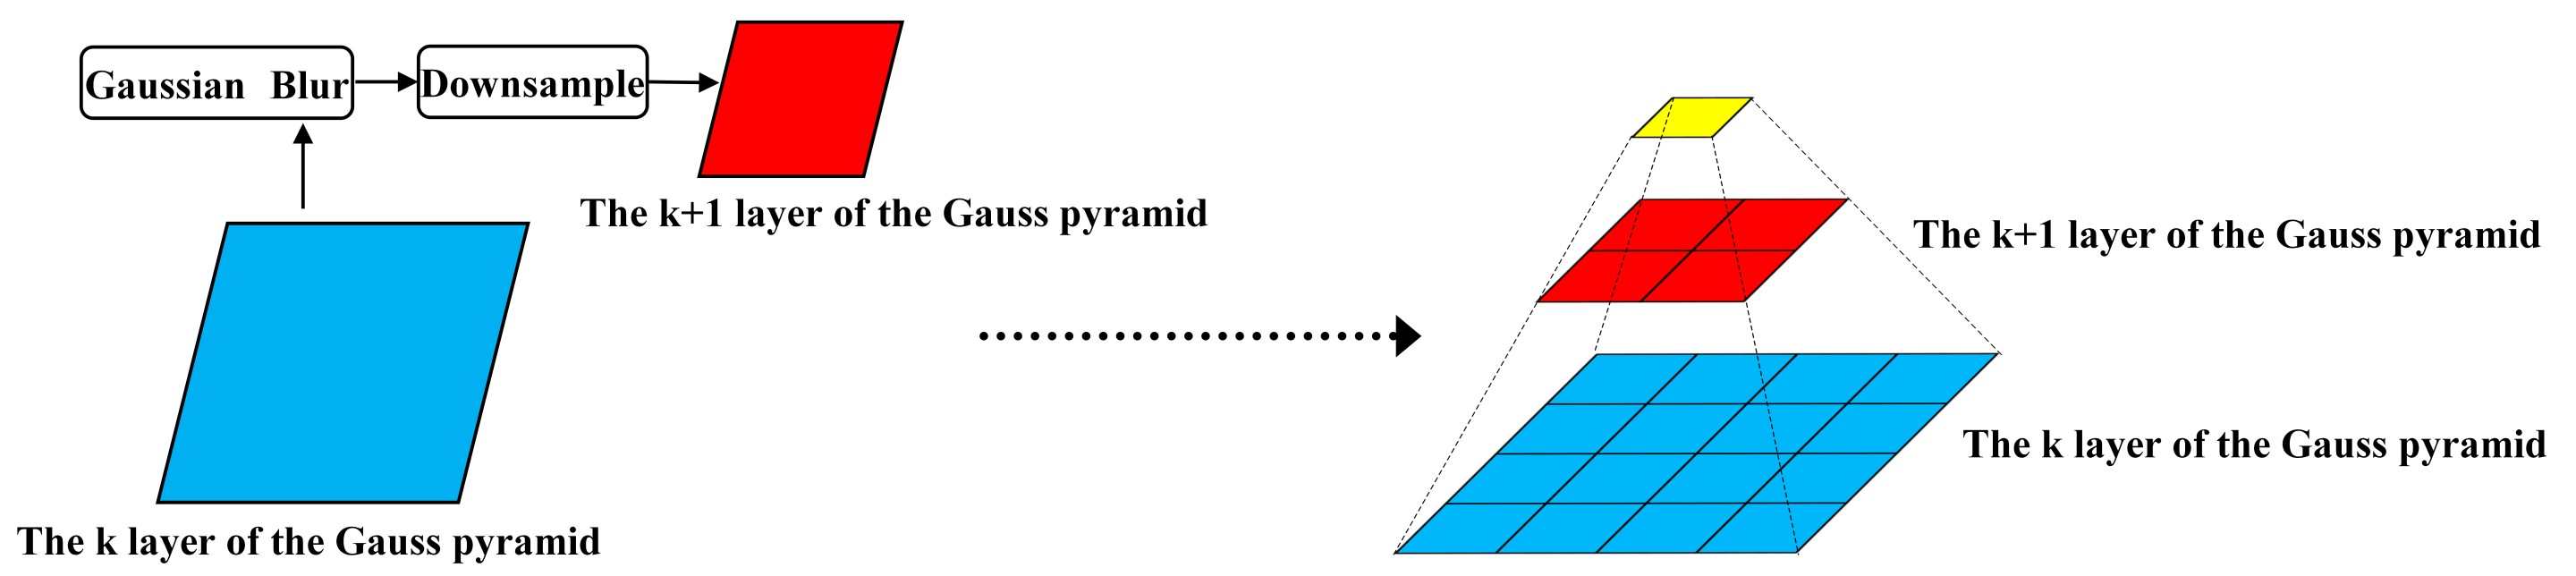
3.2.1. Gaussian Pyramid
3.2.2. Gray Level Co-Occurrence Matrix and Its Common Features
3.3. Classifier
4. Experiments
4.1. Experiments Based on PGLCM-IBL
4.2. Ablation Study
4.3. Comparative Experiment
5. Discussion
6. Conclusions
Author Contributions
Funding
Institutional Review Board Statement
Informed Consent Statement
Data Availability Statement
Conflicts of Interest
References
- Sung, H.; Ferlay, J.; Siegel, R.L.; Laversanne, M.; Soerjomataram, I.; Jemal, A.; Bray, F. Global cancer statistics 2020: GLOBOCAN estimates of incidence and mortality worldwide for 36 cancers in 185 countries. CA Cancer J. Clin. 2021, 71, 209–249. [Google Scholar] [CrossRef] [PubMed]
- Spanhol, F.A.; Oliveira, L.S.; Petitjean, C.; Heutte, L. A dataset for breast cancer histopathological image classification. IEEE Trans. Biomed. Eng. 2015, 63, 1455–1462. [Google Scholar] [CrossRef] [PubMed]
- Bayramoglu, N.; Kannala, J.; Heikkilä, J. Deep learning for magnification independent breast cancer histopathology image classification. In Proceedings of the 2016 23rd International conference on pattern recognition (ICPR), Cancún, Mexico, 4–8 December 2016; pp. 2440–2445. [Google Scholar]
- Xiaojun, B.; Tiewen, P. Memetic Algorithm Based on Content-Based lmage Retrieval. Microcomput. Inf. 2010, 26, 25–27. [Google Scholar]
- Zhang, Y.; Zhang, B.; Lu, W. Breast cancer histological image classification with multiple features and random subspace classifier ensemble. In Knowledge-Based Systems in Biomedicine and Computational Life Science; Springer: Berlin/Heidelberg, Germany, 2013; pp. 27–42. [Google Scholar]
- Reis, S.; Gazinska, P.; Hipwell, J.H.; Mertzanidou, T.; Naidoo, K.; Williams, N.; Pinder, S.; Hawkes, D.J. Automated classification of breast cancer stroma maturity from histological images. IEEE Trans. Biomed. Eng. 2017, 64, 2344–2352. [Google Scholar] [CrossRef] [PubMed]
- Aksebzeci, B.H.; Kayaalti, Ö. Computer-aided classification of breast cancer histopathological images. In Proceedings of the 2017 Medical Technologies National Congress (TIPTEKNO), Trabzon, Turkey, 12–14 October 2017; pp. 1–4. [Google Scholar]
- Yurong, H.; Lan, D.; Jiuzhen, L. Fusion of Gaussian Image Pyramid Feature for Low-resolution Face Recognition. J. Chin. Comput. Syst. 2021, 42, 2107–2115. [Google Scholar]
- Spanhol, F.A.; Oliveira, L.S.; Petitjean, C.; Heutte, L. Breast cancer histopathological image classification using convolutional neural networks. In Proceedings of the 2016 International Joint Conference on Neural Networks (IJCNN), Vancouver, BC, Canada, 24–29 July 2016; pp. 2560–2567. [Google Scholar]
- Akbar, S.; Peikari, M.; Salama, S.; Nofech-Mozes, S.; Martel, A. Transitioning between convolutional and fully connected layers in neural networks. In Deep Learning in Medical Image Analysis and Multimodal Learning for Clinical Decision Support; Springer: Berlin/Heidelberg, Germany, 2017; pp. 143–150. [Google Scholar]
- Agarwal, R.; Diaz, O.; Lladó, X.; Yap, M.H.; Martí, R. Automatic mass detection in mammograms using deep convolutional neural networks. J. Med. Imaging 2019, 6, 031409. [Google Scholar] [CrossRef] [PubMed]
- Tsochatzidis, L.; Costaridou, L.; Pratikakis, I. Deep learning for breast cancer diagnosis from mammograms—A comparative study. J. Imaging 2019, 5, 37. [Google Scholar] [CrossRef] [PubMed] [Green Version]
- Dhungel, N.; Carneiro, G.; Bradley, A.P. Fully automated classification of mammograms using deep residual neural networks. In Proceedings of the 2017 IEEE 14th International Symposium on Biomedical Imaging (ISBI 2017), Melbourne, Australia, 18–21 April 2017; pp. 310–314. [Google Scholar]
- Kassani, S.H.; Kassani, P.H.; Wesolowski, M.J.; Schneider, K.A.; Deters, R. Classification of histopathological biopsy images using ensemble of deep learning networks. arXiv 2019, arXiv:1909.11870. [Google Scholar]
- Fuquan, S.; Chenglong, C.; Kun, Z.; Chaoran, K.; Yushan, J.; Yunhui, D. Benign and Malignant Diagnosis of Breast Cancer Histopathological lmage Based on Multimodel Neural Network. J. Chin. Comput. Syst. 2020, 41, 732–735. [Google Scholar]
- Han, Z.; Wei, B.; Zheng, Y.; Yin, Y.; Li, K.; Li, S. Breast cancer multi-classification from histopathological images with structured deep learning model. Sci. Rep. 2017, 7, 4172. [Google Scholar] [CrossRef] [PubMed]
- Akogo, D.A.; Palmer, X.L. End-to-end learning via a convolutional neural network for cancer cell line classification. J. -Ind.-Univ. Collab. 2019, 1, 17–23. [Google Scholar] [CrossRef] [Green Version]
- Xiaoling, Y.; Zhenqi, W.; Jia, L. Research Cancer Cell Recognition System Based on Deep Neural Network. Softw. Guide 2020, 19, 65–68. [Google Scholar]
- Chen, C.P.; Liu, Z. Broad learning system: An effective and efficient incremental learning system without the need for deep architecture. IEEE Trans. Neural Netw. Learn. Syst. 2017, 29, 10–24. [Google Scholar] [CrossRef] [PubMed]
- Li, J.; Zhang, Y.; Gao, L.; Li, X. Arrhythmia Classification Using Biased Dropout and Morphology-Rhythm Feature With Incremental Broad Learning. IEEE Access 2021, 9, 66132–66140. [Google Scholar] [CrossRef]
- Wang Lei, S.Y. Fast bilateral filtering using exponential functions. Electron. Lett. 2017, 53, 237–239. [Google Scholar] [CrossRef]
- Haralick, R.M.; Shanmugam, K.; Dinstein, I.H. Textural features for image classification. IEEE Trans. Syst. Man. Cybern. 1973, SMC-3, 610–621. [Google Scholar] [CrossRef] [Green Version]
- Ulaby, F.T.; Kouyate, F.; Brisco, B.; Williams, T.L. Textural infornation in SAR images. IEEE Trans. Geosci. Remote Sens. 1986, GE-24, 235–245. [Google Scholar] [CrossRef]
- Jingwen, L.; Lican, H. Pathological Image Recognition of Breast Cancer Based on Inception-ResNet-V2. Softw. Guide 2020, 19, 225–229. [Google Scholar]
- Bardou, D.; Zhang, K.; Ahmad, S.M. Classification of breast cancer based on histology images using convolutional neural networks. IEEE Access 2018, 6, 24680–24693. [Google Scholar] [CrossRef]
- Yu, L.; Ziqiang, S. Recognition algorithm of breast pathological images based on convolutional neural network. J. Jiangsu Univ. Sci. Ed. 2019, 40, 573–578. [Google Scholar]
- Spanhol, F.A.; Oliveira, L.S.; Cavalin, P.R.; Petitjean, C.; Heutte, L. Deep features for breast cancer histopathological image classification. In Proceedings of the 2017 IEEE International Conference on Systems, Man, and Cybernetics (SMC), Banff, AB, Canada, 5–8 October 2017; pp. 1868–1873. [Google Scholar]


| Magnification | Benign | Malignant | Total | ||||||
|---|---|---|---|---|---|---|---|---|---|
| A | F | PT | TA | DC | LC | MC | PC | ||
| 40X | 114 | 253 | 109 | 149 | 864 | 156 | 205 | 145 | 1995 |
| 100X | 113 | 260 | 121 | 150 | 903 | 170 | 222 | 142 | 2081 |
| 200X | 111 | 264 | 108 | 140 | 896 | 163 | 196 | 135 | 2013 |
| 400X | 106 | 237 | 115 | 130 | 788 | 137 | 169 | 138 | 1820 |
| Total | 444 | 1014 | 453 | 569 | 3451 | 626 | 792 | 560 | 7909 |
| Patients | 4 | 10 | 3 | 7 | 38 | 5 | 9 | 6 | 82 |
| Tumor Type | A | F | PT | TA | DC | LC | MC | PC | Total | |
|---|---|---|---|---|---|---|---|---|---|---|
| Magnification | ||||||||||
| 40X | 912 | 856 | 872 | 894 | 864 | 884 | 905 | 870 | 7057 | |
| 100X | 904 | 891 | 968 | 900 | 903 | 956 | 981 | 851 | 7354 | |
| 200X | 888 | 913 | 864 | 840 | 896 | 918 | 864 | 810 | 6993 | |
| 400X | 848 | 821 | 920 | 780 | 788 | 772 | 746 | 828 | 6503 | |
| Total | 3552 | 3481 | 3624 | 3414 | 3451 | 3530 | 3496 | 3359 | 27,907 | |
| Class | Sen | Spe | Ppr | Npr |
|---|---|---|---|---|
| A | 95.03% | 97.46% | 84.49% | 99.26% |
| F | 81.15% | 97.01% | 79.48% | 97.30% |
| PT | 95.31% | 97.90% | 87.14% | 99.29% |
| TA | 92.20% | 98.61% | 90.26% | 98.91% |
| DC | 46.72% | 96.92% | 68.17% | 92.80% |
| LC | 82.44% | 97.46% | 82.44% | 97.46% |
| MC | 81.12% | 97.28% | 81.05% | 97.30% |
| PC | 92.96% | 98.41% | 88.90% | 99.03% |
| Category | Model | Magnification | |||
|---|---|---|---|---|---|
| 40X | 100X | 200X | 400X | ||
| Eight-class Classification | GoogLeNet [24] | 68.7 | 65.9 | 69.1 | 62.8 |
| ResNet50 [24] | 82.5 | 78.8 | 84.3 | 81 | |
| Inception-ResNet-V2 [24] | 86.7 | 80.3 | 83.5 | 68.5 | |
| CNN [25] | 88.2 | 84.6 | 83.3 | 84 | |
| PFTAS + QDA [26] | 82.70 | 82.15 | 83.37 | 82.40 | |
| PFTAS + SVM [26] | 81.65 | 79.70 | 85.30 | 82.30 | |
| PFTAS + RF [26] | 81.70 | 82.60 | 84.40 | 81.20 | |
| Single-Task CNN [26] | 83.08 | 84.15 | 85.67 | 83.10 | |
| Proposed method | 89.49 | 85.52 | 85.85 | 88.54 | |
| Binary Classification | CNN [9] | 89.6 | 85 | 84 | 80.8 |
| DeCAF features using CNN [27] | 84.6 | 84.8 | 84.2 | 81.6 | |
| Single Task CNN [3] | 83 | 83.1 | 84.6 | 82.1 | |
| Proposed method | 91.45 | 90.17 | 90.90 | 90.73 | |
Publisher’s Note: MDPI stays neutral with regard to jurisdictional claims in published maps and institutional affiliations. |
© 2022 by the authors. Licensee MDPI, Basel, Switzerland. This article is an open access article distributed under the terms and conditions of the Creative Commons Attribution (CC BY) license (https://creativecommons.org/licenses/by/4.0/).
Share and Cite
Li, J.; Shi, J.; Su, H.; Gao, L. Breast Cancer Histopathological Image Recognition Based on Pyramid Gray Level Co-Occurrence Matrix and Incremental Broad Learning. Electronics 2022, 11, 2322. https://doi.org/10.3390/electronics11152322
Li J, Shi J, Su H, Gao L. Breast Cancer Histopathological Image Recognition Based on Pyramid Gray Level Co-Occurrence Matrix and Incremental Broad Learning. Electronics. 2022; 11(15):2322. https://doi.org/10.3390/electronics11152322
Chicago/Turabian StyleLi, Jia, Jingwen Shi, Hexing Su, and Le Gao. 2022. "Breast Cancer Histopathological Image Recognition Based on Pyramid Gray Level Co-Occurrence Matrix and Incremental Broad Learning" Electronics 11, no. 15: 2322. https://doi.org/10.3390/electronics11152322