1. Introduction
In a two-dimensional image, the amount of information expressed is generally extremely limited [
1,
2,
3,
4,
5,
6]. For example, infrared photography cannot show the real image well. The multi-focus image is vague, but for the area in the focal plane. The visible image details are obvious, while the contrast is weak. Thus, image fusion technology is used to obtain complementary information between images, which can make the image information a lot more aplenty all-around and make its content more accurate.
Image fusion [
7] is the process of concentrating the imporTt information of two or more images into one image. The fused image is more complete and accurate than the source image. From a more intuitive point of view, the fused image will have a larger display range or higher definition than the source image. This kind of method makes it possible to preserve different information in multiple images of the same scene, such as hyperspectral images, infrared images, CT images, and ordinary images, which are complementary to each other, and the information combined together can reflect the information that could not be obtained originally [
8,
9], especially in the fields of medicine, astronomy, and meteorology [
8,
9,
10,
11]. In early April 2018, the Google “cell” journal published papers that use multi-frame optical microscope images for machine learning and can predict the characteristic areas that are clearly imaged under the fluorescence microscope. This paper shows that the information fusion theory of images has a high application value.
Image fusion is divided into pixel level, feature level, and decision level [
12,
13]. Pixel-level image fusion is the basis of the latter two, and its details such as edge, boundary, and texture can be more accurately retained so that the fused image has more information [
3,
14]. However, its disadvantage is just like its name. It is very expensive to calculate at pixel level 640 × 480. The surface fitting of points will cause the simulation software to die. Pixel level methods are commonly used in image fusion based on region segmentation, image fusion based on pyramid transform, image fusion based on Discrete Wavelet Transformation (DWT) transform, and fusion method based on the non-subsampled wave adaptive image fusion, etc. The theory of wavelet transform is widely used.
There are three categories of the existing pixel-level image fusion methods, namely, methods based on sparse representation, methods based on multiscale decomposition, and methods of directly fusing image pixels or other transform domains.
Multiscale transform is a popular image algorithm that has many applications in image fusion and other image processing [
15,
16,
17]. Firstly, the multiscale representation of the input image is obtained by multiscale transformation, in which the image features are represented in the frequency domain. Then, according to the specific fusion rules, the fused multiscale representation is obtained, which considers the coefficients’ activity level and the correlation between adjacent pixels and different scale coefficients. Finally, by performing an inverse multiscale transformation of the fusion representation, the fusion image is obtained. There are two basic problems involved in the framework, namely, the fusion strategy for multiscale representation fusion and the selection of the multiscale decomposition method.
By simulating the sparse coding mechanism of the human visual system, sparse representation [
18] is a novel image representation theory. It has been successfully applied to settle many image processing problems, such as denoising, interpolation, and recognition. Sparse representation can describe an image (or image block) by a atoms’ sparse linear combination, which is selected from a super complete dictionary. The obtained weighting coefficients are sparse, meaning that the significant information of the original image can effectively be represented by only a few non-zero elements in the sparse coefficients. The sparse representation theory can be applied to image fusion by using the characteristics of sparse coefficients. To be specific, for the cause of capturing local salient features and maintaining shift invariance, input images from multiple sources are first segmented into many overlapping blocks. Then, in order to obtain the corresponding sparse coefficients, we decompose these blocks into the same hyper-complete dictionary. Finally, the fusion coefficient and dictionary are used to reconstruct the image. There are two key problems in the model, which are the calculation or learning algorithm of sparse dictionaries and the optimization algorithm of the coefficient fitting.
Among them, the selection of a sparse dictionary is the most basic problem. Generally, it should be selected according to the characteristics of the target signal itself. Traditional signal transformation methods, such as the Conventional Fourier transformation method [
19], DWT transformation method [
20], Curvelet transformation method [
21], and NSCT transformation method [
14], belong to the pyramid transform class. This kind of method transforms the target signal through the specified basis function. Because of the orthogonality of the basis function, the construction is simple, and the computational complexity is low. It is a kind of method based on an analytic dictionary. However, in some cases, these pre-specified basis functions cannot fit the structural features of the target signal, such as the texture characteristics of the image and light and dark features. The second method combines the machine learning method, which has been popular in artificial intelligence for more than ten years. The training set is assigned for learning in advance, and then the sparse dictionary [
22] suitable for the training set is obtained. Such a sparse dictionary can extract the inherent characteristics of the target signal more accurately, and its common algorithms are K-SVD dictionary learning [
23], structure-based dictionary learning [
24], and online dictionary learning [
25].
In addition to sparse representation or fusion methods based on multiscale decomposition, transformations that are based on dimensionality reduction and color space have also been successfully used in image fusion, such as intensity hue saturation (IHS) transform [
26,
27]. These methods have been widely applied to the low-resolution multi-spectral and high-resolution panchromatic image fusion.
Although various image fusion methods that are based on color space and dimensionality reduction have been put forward, these methods are usually used for the fusion of color and gray images. Therefore, they are confined to some specific applications, such as the smoothing problem mentioned above. For the sake of combining the advantages of different transformations, a variety of fusion methods of different transformation combi-nations are combined by researchers to obtain a better fusion effect. Liu et al. [
28] proposed a general image fusion framework that is based on multiscale transformation as well as sparse representation. Xu J. et al. [
29] did not use the traditional multiscale transformation and proposed a fusion method that is based on morphological component analysis as well as sparse representation, in which researchers decompose the source images by using morphological component analysis and then fuse them by using the method based on sparse representation. Wang et al. [
30] proposed a fusion method that is based on non-subsampled contourlet transform as well as sparse representation.
However, the existing image fusion technology has some problems. The image fusion method based on multiscale transformation can extract spatial structure information in multiscale space, but it ignores the sparse representation of low-frequency components, and the main energy of the image is concentrated in low-frequency components, so multiscale transformation has limitations on image feature representation, and also puts forward higher requirements for image registration and fusion rules. The fusion method based on sparse representation realizes the matching of sparse matrix and features through dictionary learning and obtains a more meaningful representation of the source image. However, the finite atoms in the dictionary cannot completely represent the small-scale details, and the algorithm has high computational complexity. When the image resolution is high, or the number of images is large, the training time will be greatly increased, so the calculation speed of the algorithm will be greatly affected. If we use the idea of parallel computing and improve the image fusion method based on sparse decomposition, the algorithm speed may be improved. Among them, discrete wavelet transform (DWT) is the most common method.
However, DWT has some fundamental defects, such as shift variance, aliasing, and lack of directivity. DWT is a widely used multi-resolution fusion technology because it can provide better spatial and spectral resolution than other traditional multi-resolution methods. In the DWT-based fusion method, the “maximum absolute” rule is used to select the fusion coefficient from the source image. However, this method is sensitive to noise and artifacts. In the transform-based fusion algorithm, a simple “average rule” is used to fuse the low-frequency coefficients. Because the low-frequency component contains detailed information of the source image, in order to gain better visual clarity, it is necessary to use the sharpness measure of selecting the focus pixel from the source image. Inspired by the above key problems, this paper proposes a new multi-focus image fusion method to fuse DWT coefficients.
In this paper, defocusing methods of defocused images, especially multi-focus image fusion methods, are studied. Firstly, the reason for image blurring in the microscopic scene is analyzed, which mainly lies in the shallow depth of field of the microscope. Aiming at this characteristic, complete and clear information is obtained by collecting a series of defocused images. Among them, transform-based image fusion algorithms, SR image fusion algorithms, and improved fusion algorithms are mainly used. The improved SR image fusion algorithm achieves the effect of parallel operation to a certain extent through the process of sparse representation of image blocks and image fusion and has a good effect on reducing the operation time. Secondly, the improved algorithm only uses the SR algorithm to fuse high-frequency coefficients, which can retain more focus areas and reduce artifacts. In general, by comparing several fusion algorithms, the effectiveness of the improved algorithm in this paper is verified.
2. Materials and Methods
In the past five years, in the field of signal and image processing, more and more researchers have been interested in heap sparse representation theory. This kind of method obtains, represents, and compresses high-dimensional signals so that the signal can be represented as complete as possible in the form of minimum data.
Generally, we express the sparse model as follows:
For signal y, we look forward to finding a dictionary
, so that x has the least representation of non-zero points.
For the sparse representation of the image, it needs to be partitioned first. Suppose the image Y is divided into blocks, and the blocks are arranged in dictionary order, where
. The dictionary
also contains several atoms corresponding to the source image as its column vector. When p < m, it is called an over complete dictionary. After the dictionary is determined, an over-complete dictionary D can be used for any image, and the linear combination of atoms in D can be used for sparse approximation:
where ε is the allowable approximation error.
The dictionary learning process in sparse presentation also has problems in computational complexity, the same as other machine learning algorithms. With a high image resolution or a great number of images, the training time may be much greater than the sum of the other steps of image fusion, which can even reach dozens of times. This affects the algorithm’s calculation speed. We propose an improved image fusion method based on sparse decomposition by thinking of parallel computing to improve this problem. Discrete wavelet transform (DWT) is the most common multiscale fusion algorithm based on the transform in all of these methods.
The selection of fusion rules is the crux of this method. For different decomposition levels, we should select different fusion rules. For the reason of ensuring high visual clarity, the simplest average rule is often applied to low-frequency signals [
3,
11]. Inspired by this, the source image is decomposed into high-frequency and low-frequency signals by using the DWT algorithm. The high-frequency component indicates the images’ structural information. Here, the sparse representation (SR) fusion rule is applied to obtain the high-frequency fusion coefficient. At the same time, the low-frequency component is divided into fixed-size blocks, which are used to calculate the clarity index. Then, we select and fuse the block that has the largest sharpness index into the low-frequency coefficient. In the end, by using the method of inverse discrete wavelet transform (IDWT), we obtain the fused image. By using the same multithreading mechanism computer, the high-frequency signal is decomposed with a large amount of information at multiscale, and the sparse representation is fused with less information according to each scale by this method. As a result, the training dictionary time and image fusion time are reduced.
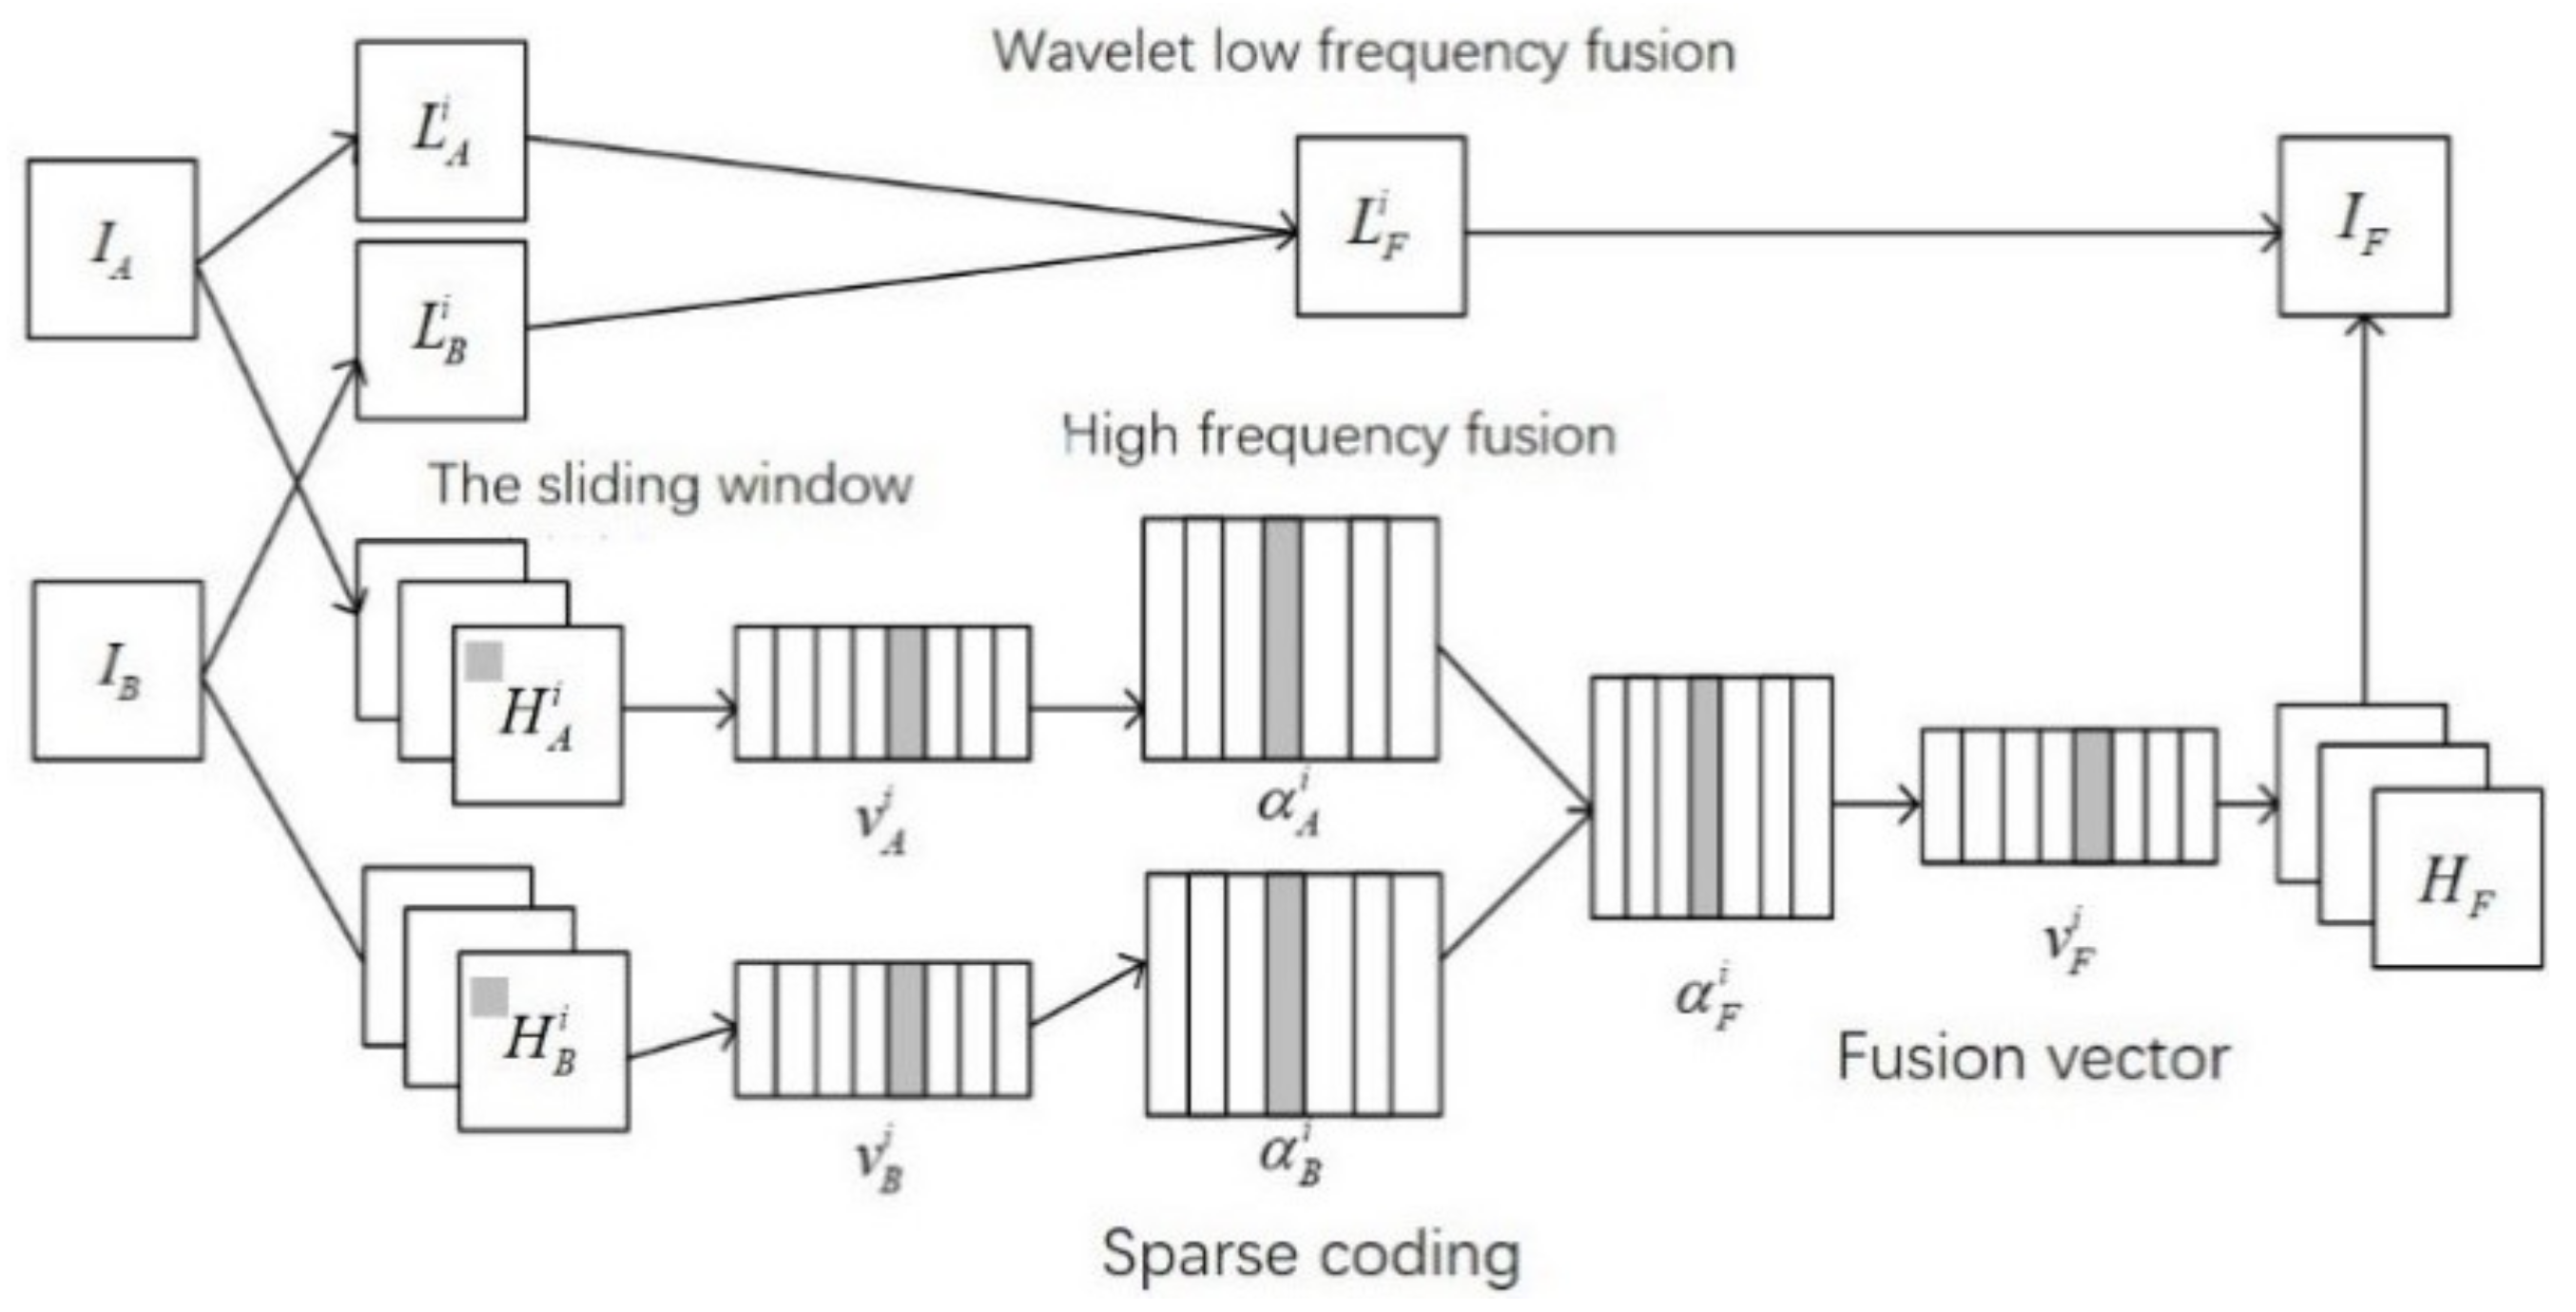
The fusion process of the improved method is shown in
Figure 1.
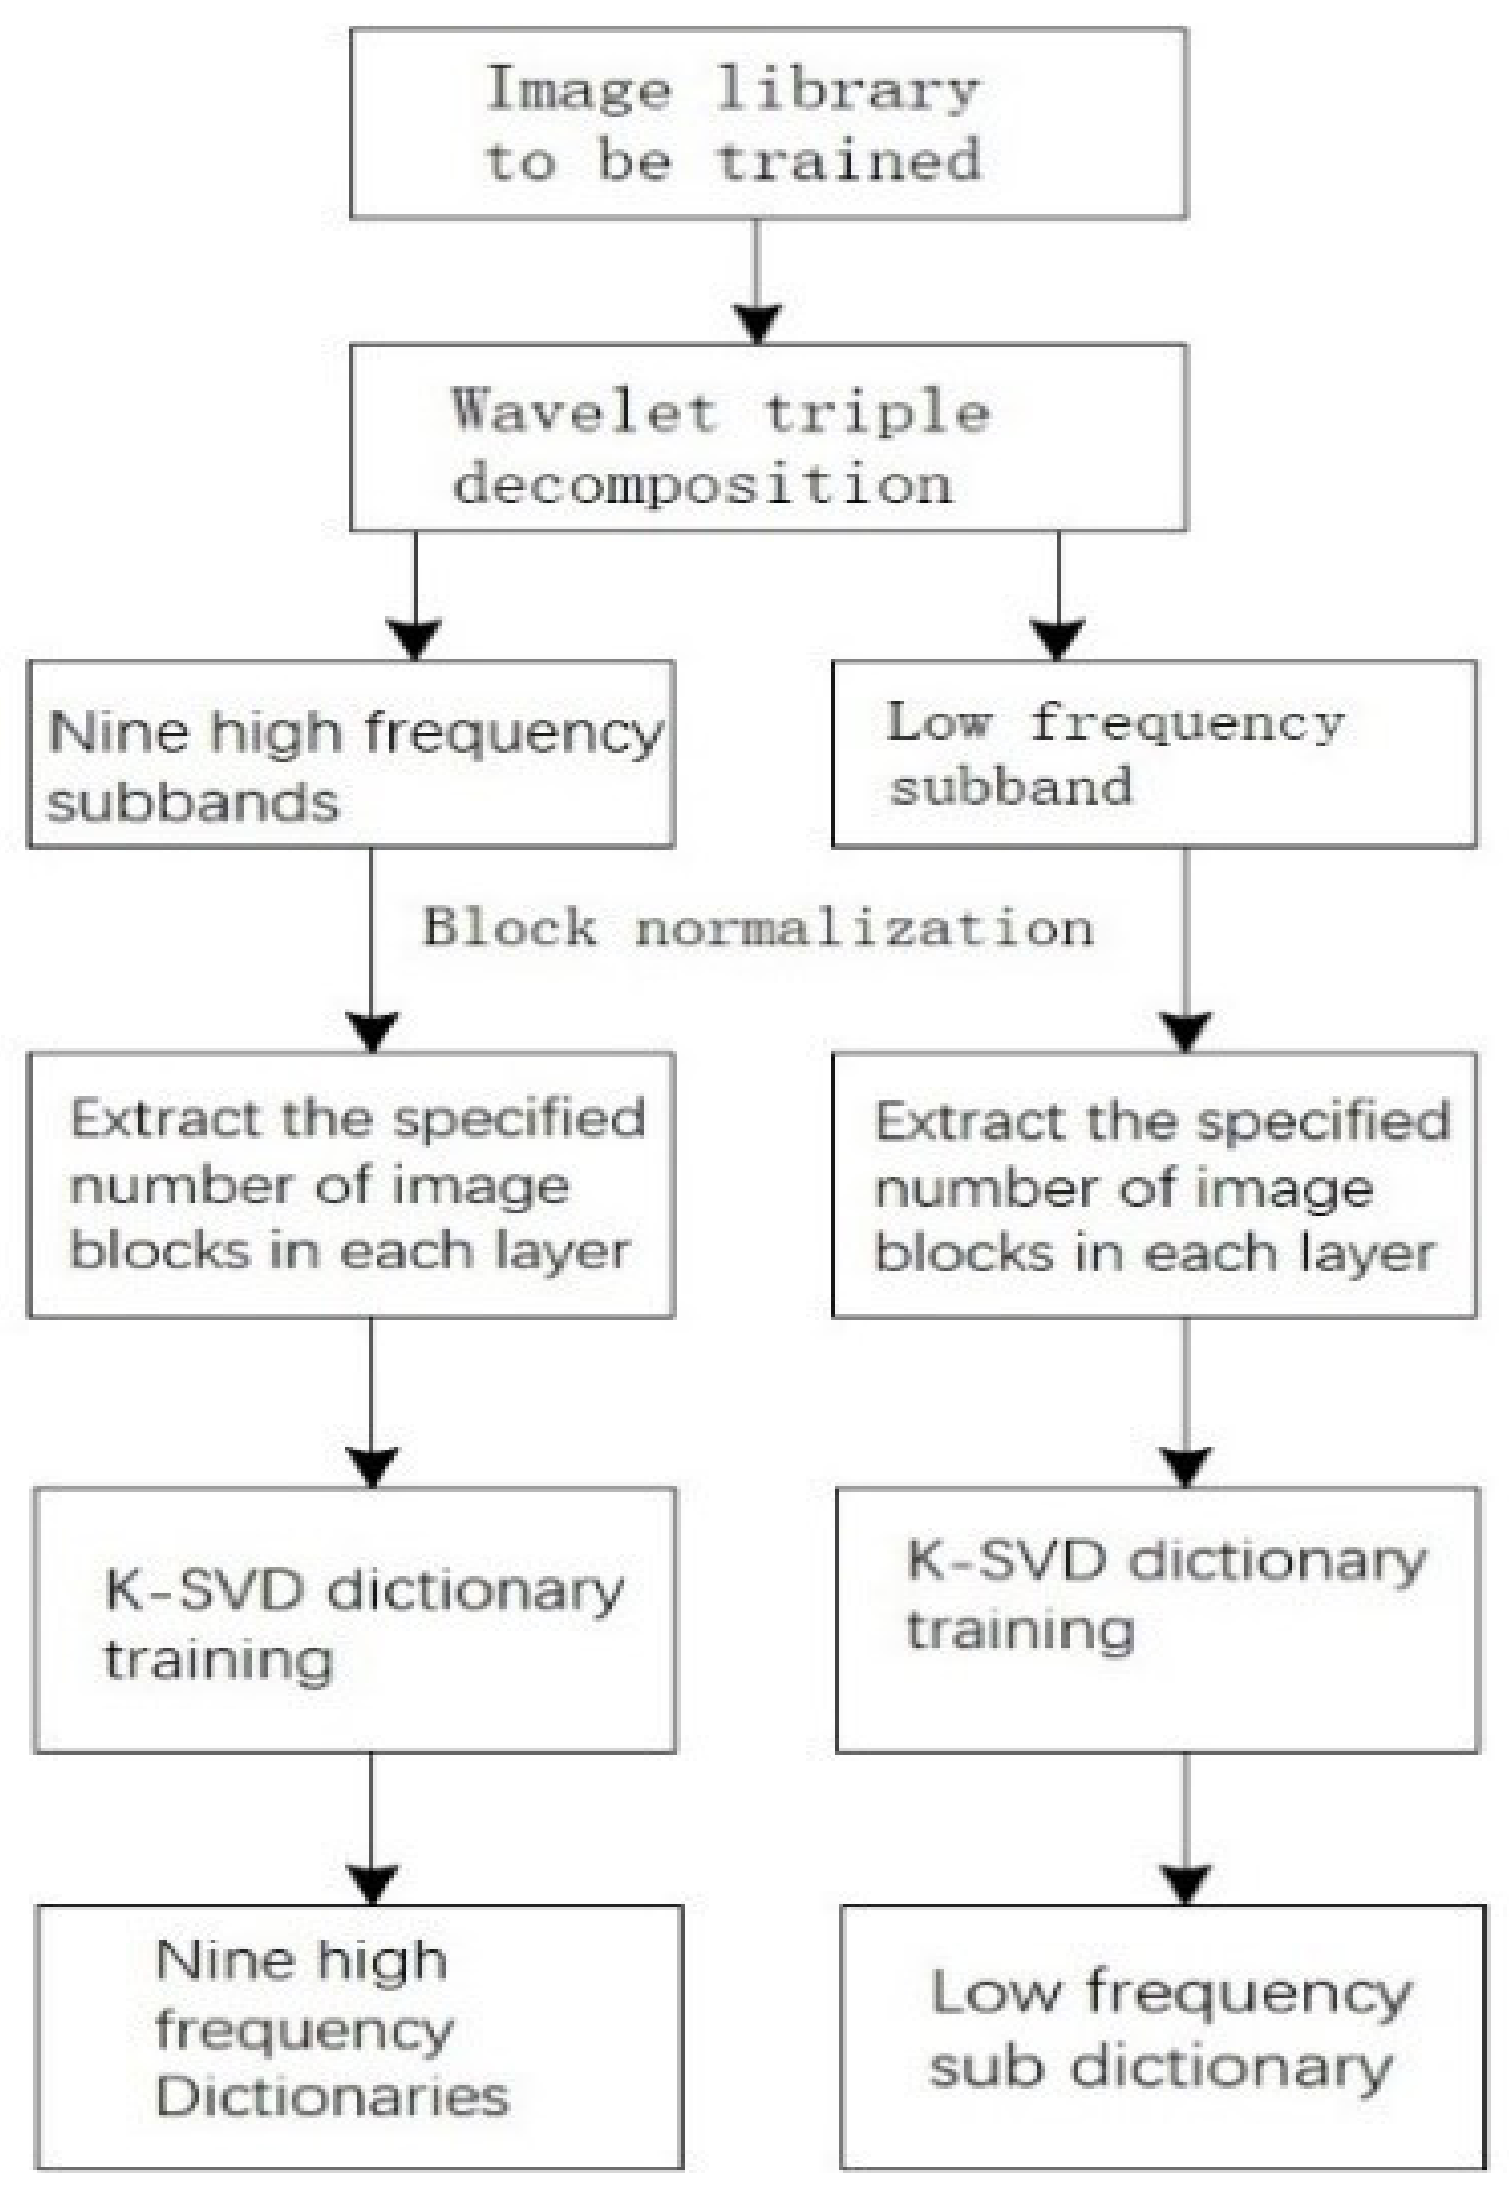
In the process of image block processing, if the sliding window method is used, the sub-block itself has less information, but the adjacent sub-blocks have more overlapping information, which can cause overfitting in the training process, which is needed to avoid by machine learning algorithms. The method of the block is different from the common sparse representation area. Based on that, we used the non-overlapping block method. The image is divided into blocks according to the size of 4 × 4. Similarly, the K-SVD dictionary combined with DWT is used to train the corresponding sub dictionary for each scale sub-block. The purpose of decomposing the signal for parallel operation is achieved by segmenting the learning dictionary.
The schematic diagram of the improved sparse representation image fusion algorithm described in this section is shown in
Figure 2. DWT transform is used to decompose two-dimensional images into high and low-frequency domain signals. The number of decomposition layers is set to three, and ten correlation components
,
are generated, respectively.
The fusion rules of low-frequency coefficients are as follows:
For LA and LB, the low-frequency bands are divided into 8 × 8 sub-blocks in order. Suppose the T block is divided, is the i-th sub-block in figure A, is the i-th sub-block in figure B.
Calculate the variance of LA and LB, and .
According to Equation (2), the focus block in the subband is selected based on the image variance as the definition evaluation index, and then the fusion coefficient is determined.
The low-frequency coefficients are calculated, and an inverse DWT transform is performed.
The fusion rules of high-frequency coefficients are as follows:
The high-frequency bands HA and HB are divided into 8 × 8 image blocks from the top left to the bottom right by the sliding window method, and the step size is one pixel. Assuming that it is divided into T subblock, HA and HB in the i-th subblock are denoted as and , respectively;
Rearrange image subblocks into column vectors ;
The sparse coefficient vector
corresponding to
is calculated by the OMP algorithm, and the calculation method is as follows:
where D is the corresponding dictionary.
According to Equation (3), sparse vectors are selected by using the maximum absolute value criterion:
was used to calculate the fusion coefficient.
The high-frequency coefficients are transformed by inverse DWT [
31].
Finally, the column vectors obtained by the inverse DWT transform of high and low-frequency coefficients are combined according to the corresponding positions, and the matrix is the image fused by this method.
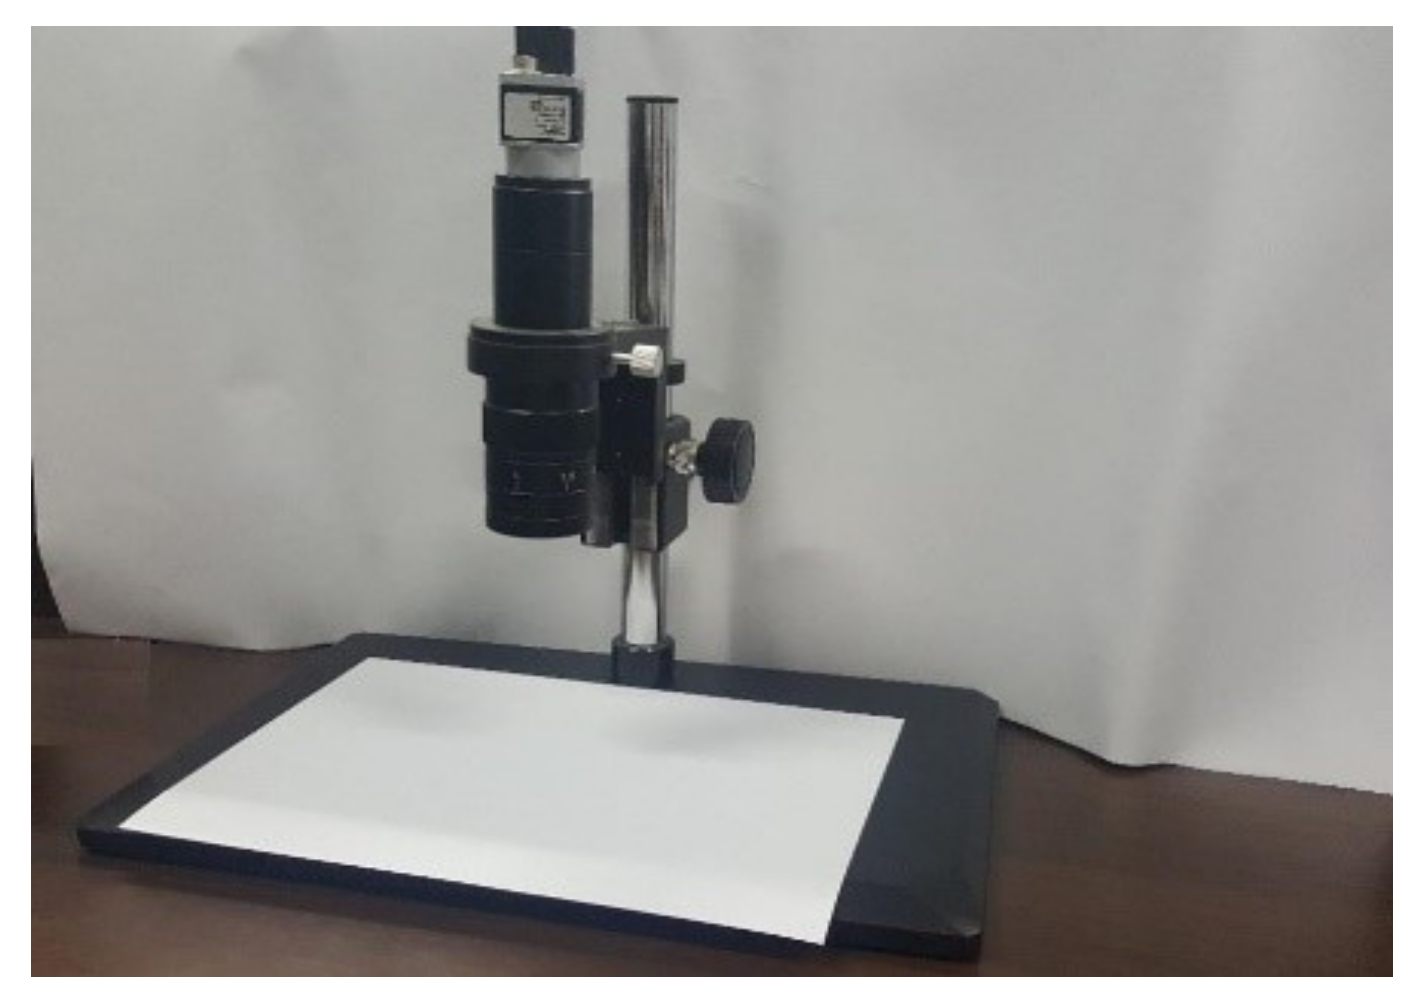
The experimental environment involved in this paper is summarized as follows:
One PC with I5-6500CPU/GTX1060ti/16G/256GSSD;
A ByslorPylon industrial camera, model: acA640-120uc;
A monocular microscope with its magnification of 0.5 × (0.7~4.5), lens radius of 35 mm as well an F-number of 4;
One USB 3.0 data bus;
The software involved in the experimental environment: all the experiments in this paper are completed under the windows 10 operating system. The PylonViewer of Bysler company is used to collect the image under the microscope, MATLAB 2016a is used for simulation, and a few of the preprocessing steps are completed using Microsoft Visual Studio 2013 and OpenCV;
The appearance of the experimental environment is shown in
Figure 3.
3. Results
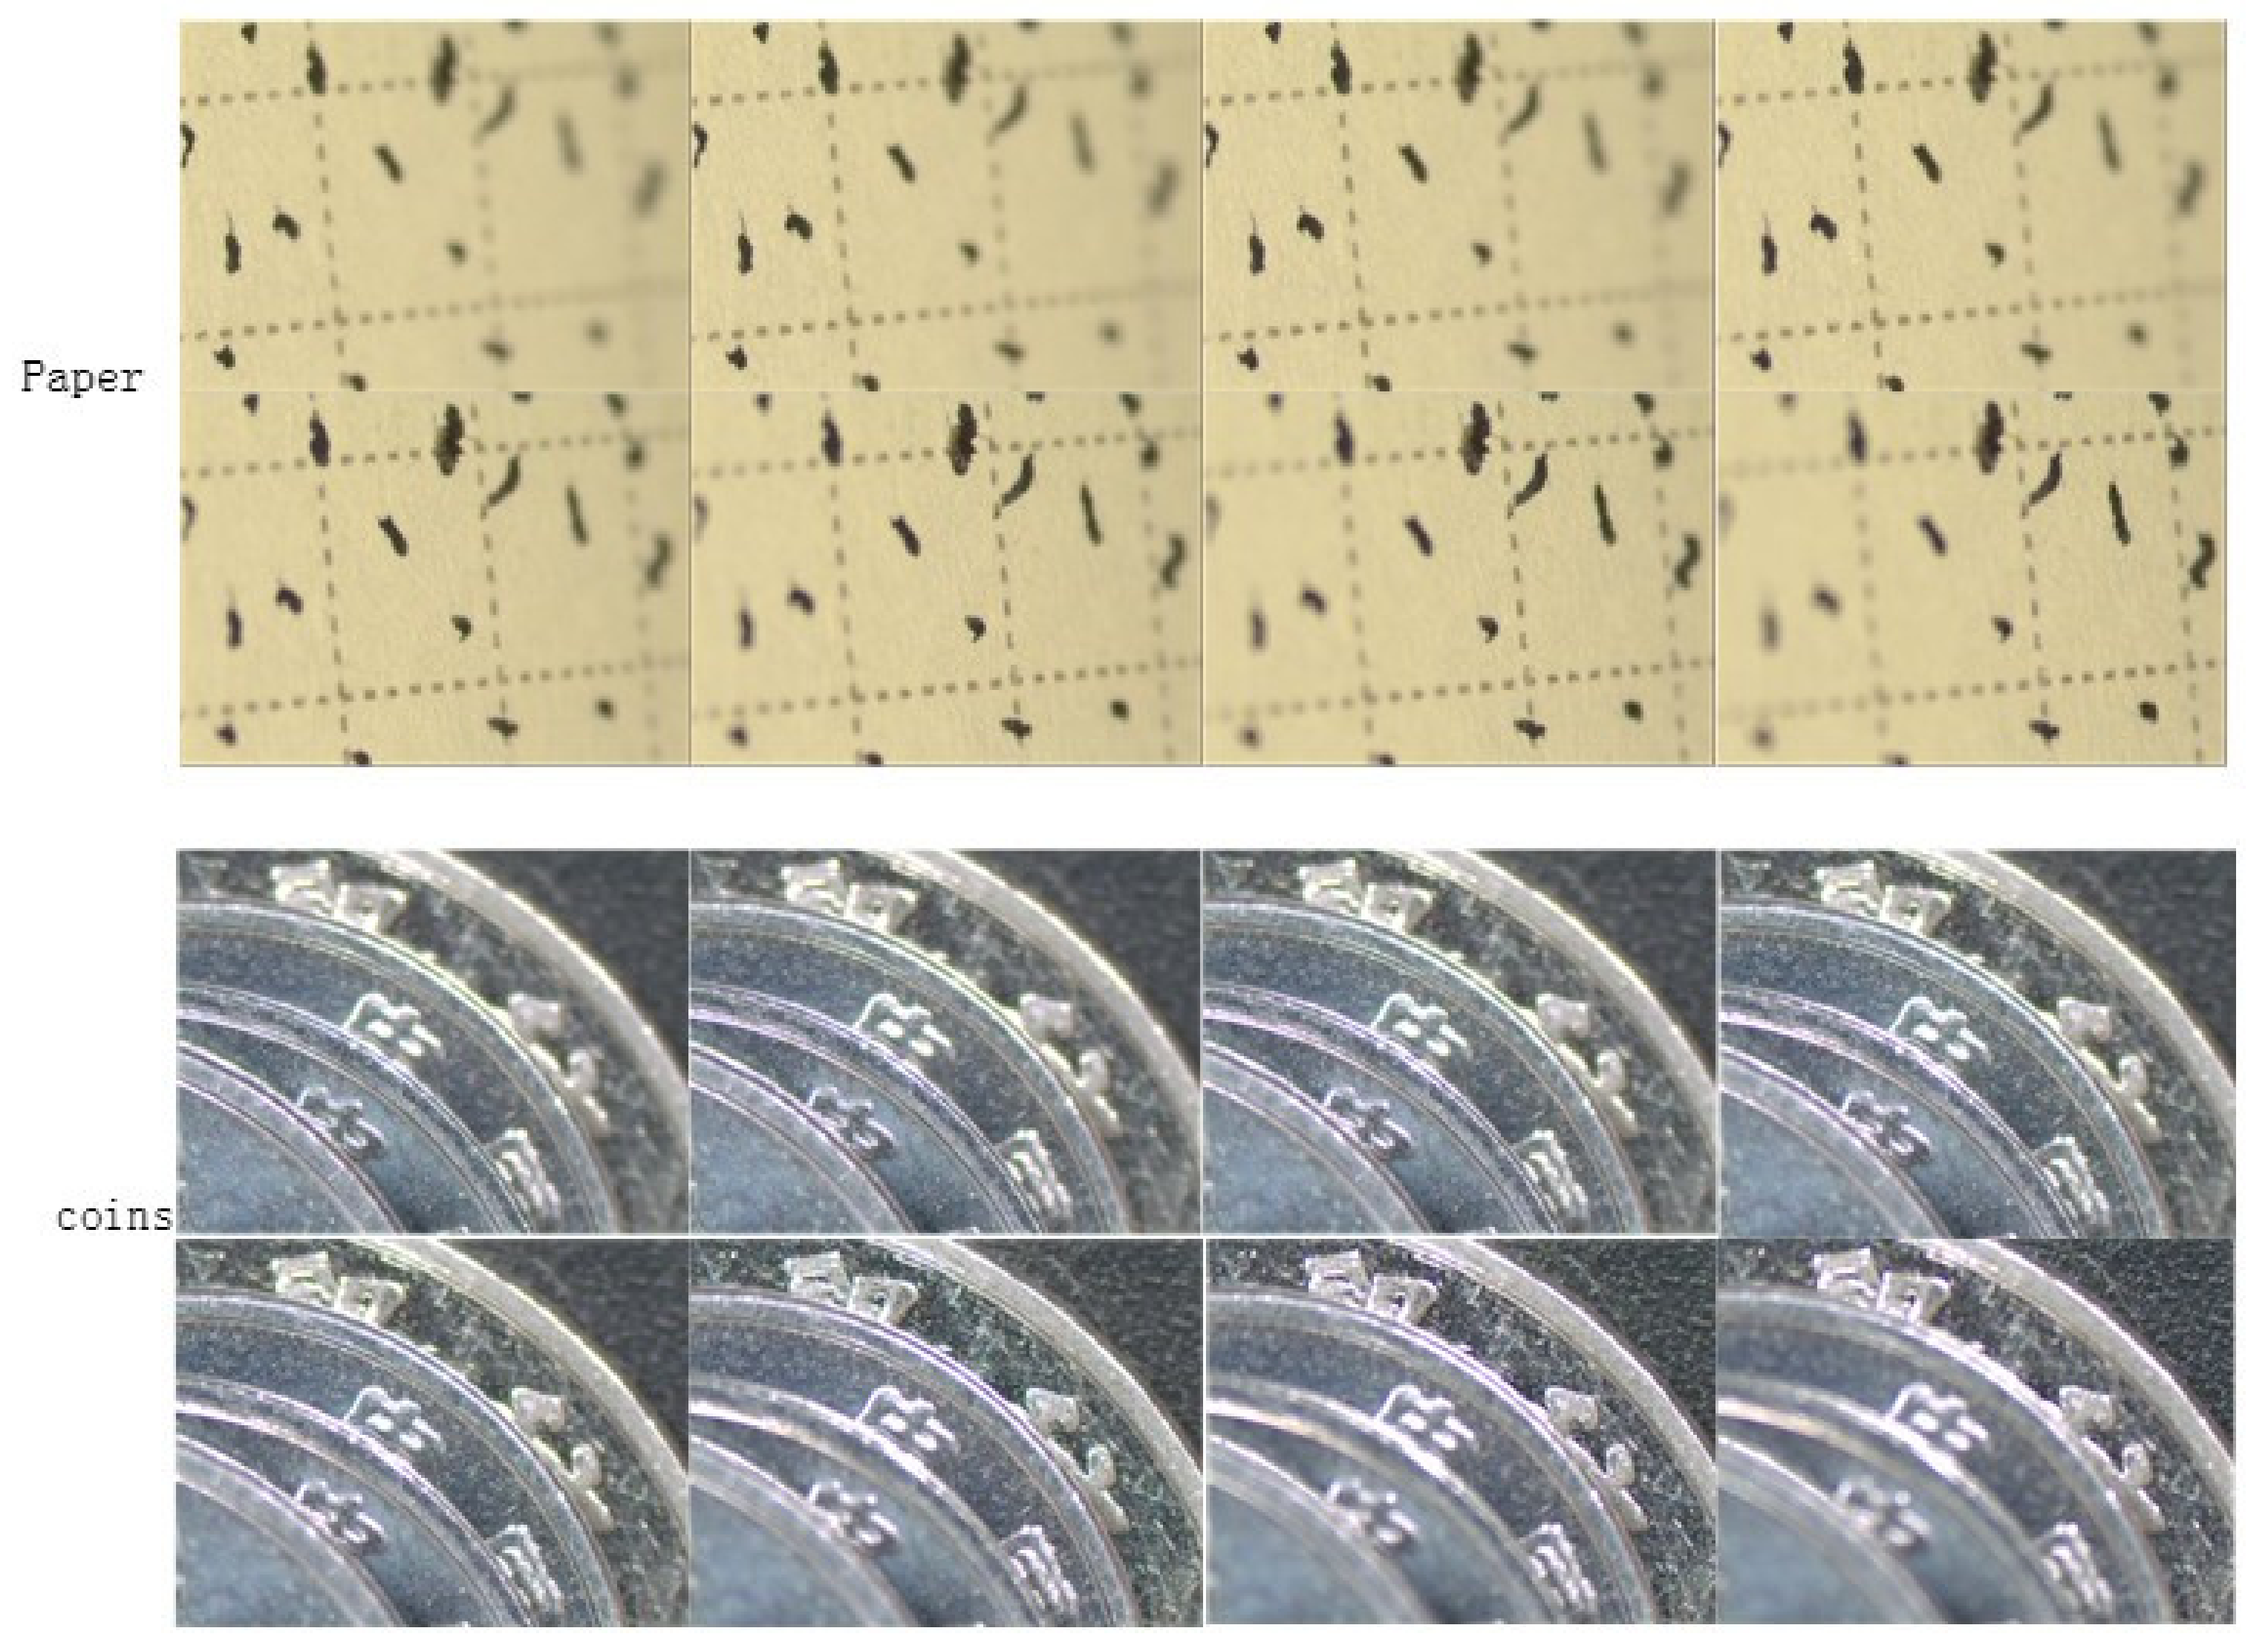
We first took two sets of multi-focus images using a microscope and Basler industrial camera acA640, as shown in
Figure 4.
In the improved algorithm, the sparse representation process and sparse dictionary training are not only carried out in the frequency domain but also decomposed into nine frequency bands, and the parallel operation of computer GTX1060Ti is used to speed up the operation. In
Figure 4, the paper sequence image is taken with the grid paper tilted at a 30° angle, and its ladder characteristic is conducive to the depth estimation affect detection. The coins’ sequence is an image of four coins with the original size of 640 × 480 through image registration and downsampling for image compression. After preprocessing, the DWT-SR depth estimation time evaluation with parallel operation and the DWT-SR time evaluation without parallel operation were carried out for the two groups of images in MATLAB 2016, respectively, and
Table 1 was obtained.
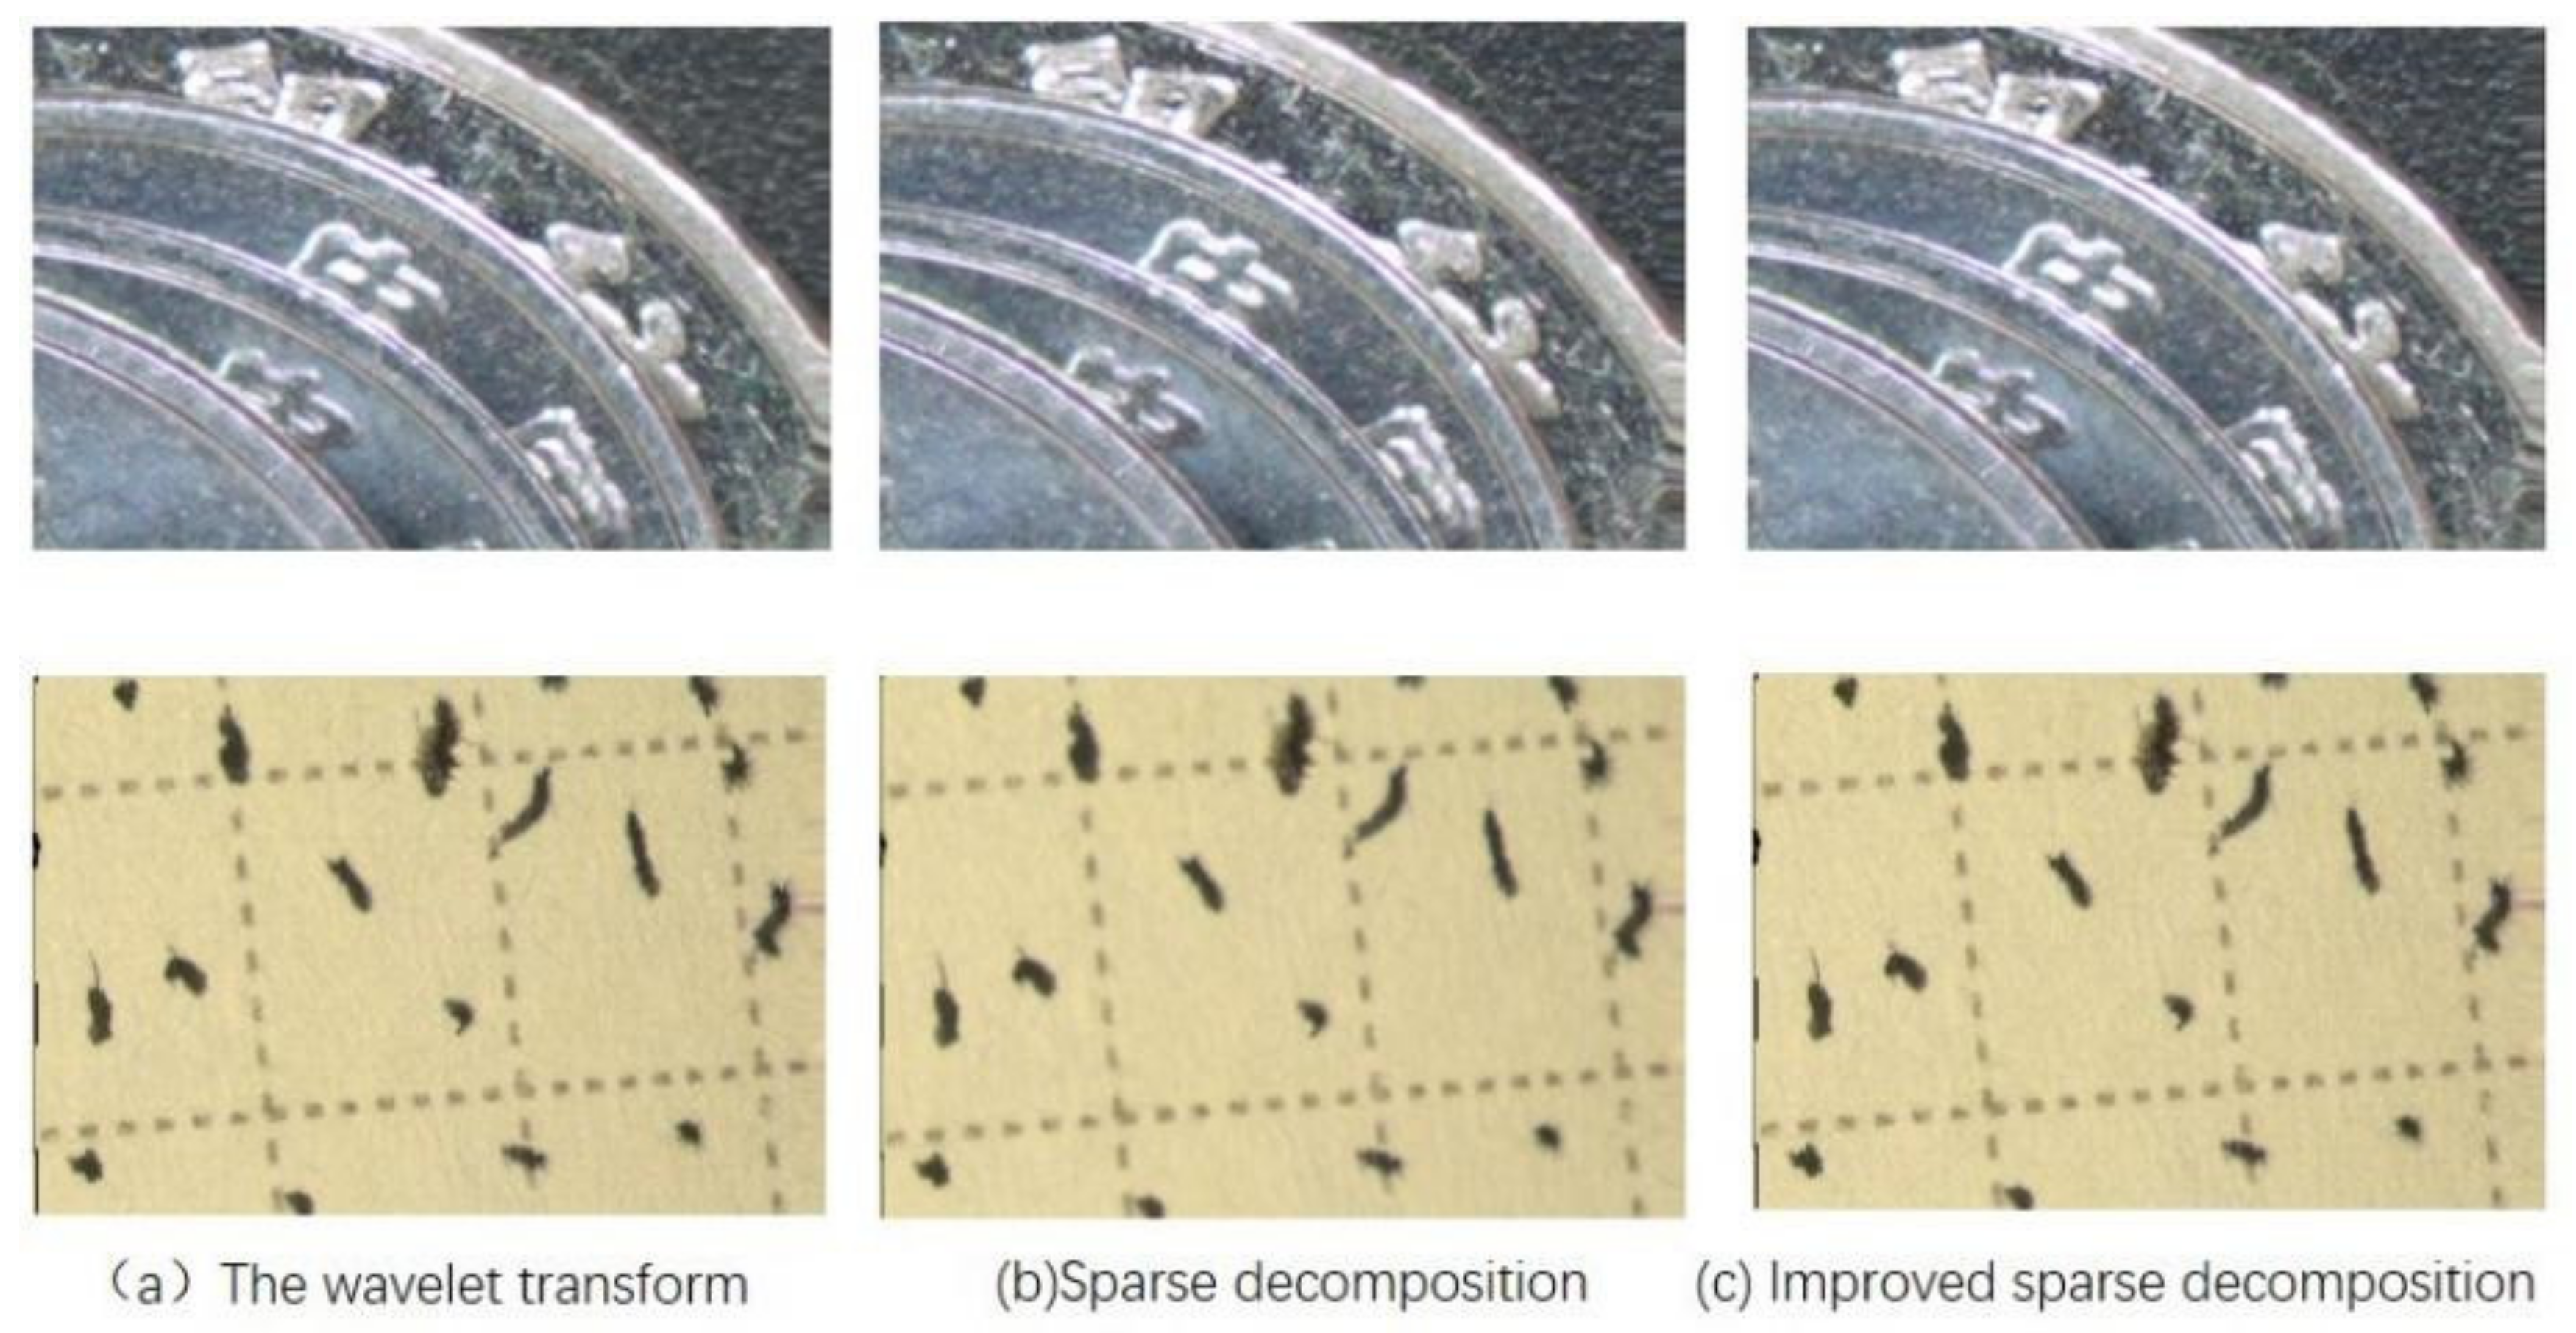
At the same time, the DWT-based image fusion, sparse representation image fusion, and improved sparse representation fusion algorithm are compared. Among them, the wavelet transform method uses the rule that the low-frequency part takes the average, and the high-frequency part takes the large absolute value for fusion. The algorithm is based on sparse representation, and its improved algorithm uses the K-SVD training dictionary, sparse approximation completes the coefficient fitting process using OMP algorithm. The fusion results are shown in
Figure 5.
Fusion quality assessment is very important for analyzing fusion results. The subjective evaluation method, which relies on the judgment of the human eyes and human brain to make a conclusion, is one of its evaluation methods. The subjective evaluation method is to rely on the human eye to make a subjective judgment on the effect of the fused image. For example, find some testers, let them recognize the specific target in the fused image obtained by different fusion algorithms, measure the recognition time, and count the recognition accuracy so as to judge the performance of the image fusion algorithm. The other is the objective evaluation method, and its fused image evaluation relies on some objective parameters from the fused image. We usually use standard deviation, spatial frequency, and entropy to evaluate the quality of the fused image.
Entropy (H) is regarded as one of the significant image quality indexes for evaluating the fused images’ information. It is defined as:
where
represents the probability of the intensity value i1 in image F. The higher the entropy value, the better the information content of the fused image is.
Standard deviation δ is regarded as one of the best indicators for the contrast value measurement of fused images. If the standard deviation is high, the image contrast will be better. It is defined as:
where the mean µ is gray level F.
The spatial frequency (SF) reflects the edge information which is stored in the fused image. It is defined as:
where RF and CF represent the line frequency and column frequency of the fused image F; F(i,j) is the gray value at the pixel (i,j); M and N are the width and height of the image, respectively.
is gradient-based fusion performance, and the higher this value is, the higher the image quality is, and the more information about the original image will be retained.
Q
AF (n,m), Q
BF (n,m) is the edge strength of A,B, respectively; w
A (n,m), w
B (n,m) is the corresponding weight.
Q_w is a weighted quality evaluation index. Because the importance of each image block is different, the proportion of image block quality in quality evaluation is set according to the importance:
w is an area in the image;
is the standardization coefficient;
is the importance of the image block in the whole image.
In the experiment of the image fusion algorithm in this paper, researchers respectively tested and verified two groups of defocused image sequences coins and paper. H, SF, and QAB/F performance indexes were used to evaluate the algorithm’s fusion effect, and DWT, SR, and DW-SR algorithms were compared. The objective evaluation index results in
Table 2 were obtained.


 ,
, 


