
Technological Acceptance of Industry 4.0 by Students from Rural Areas

 ,
,  ,
,
Abstract
:1. Introduction
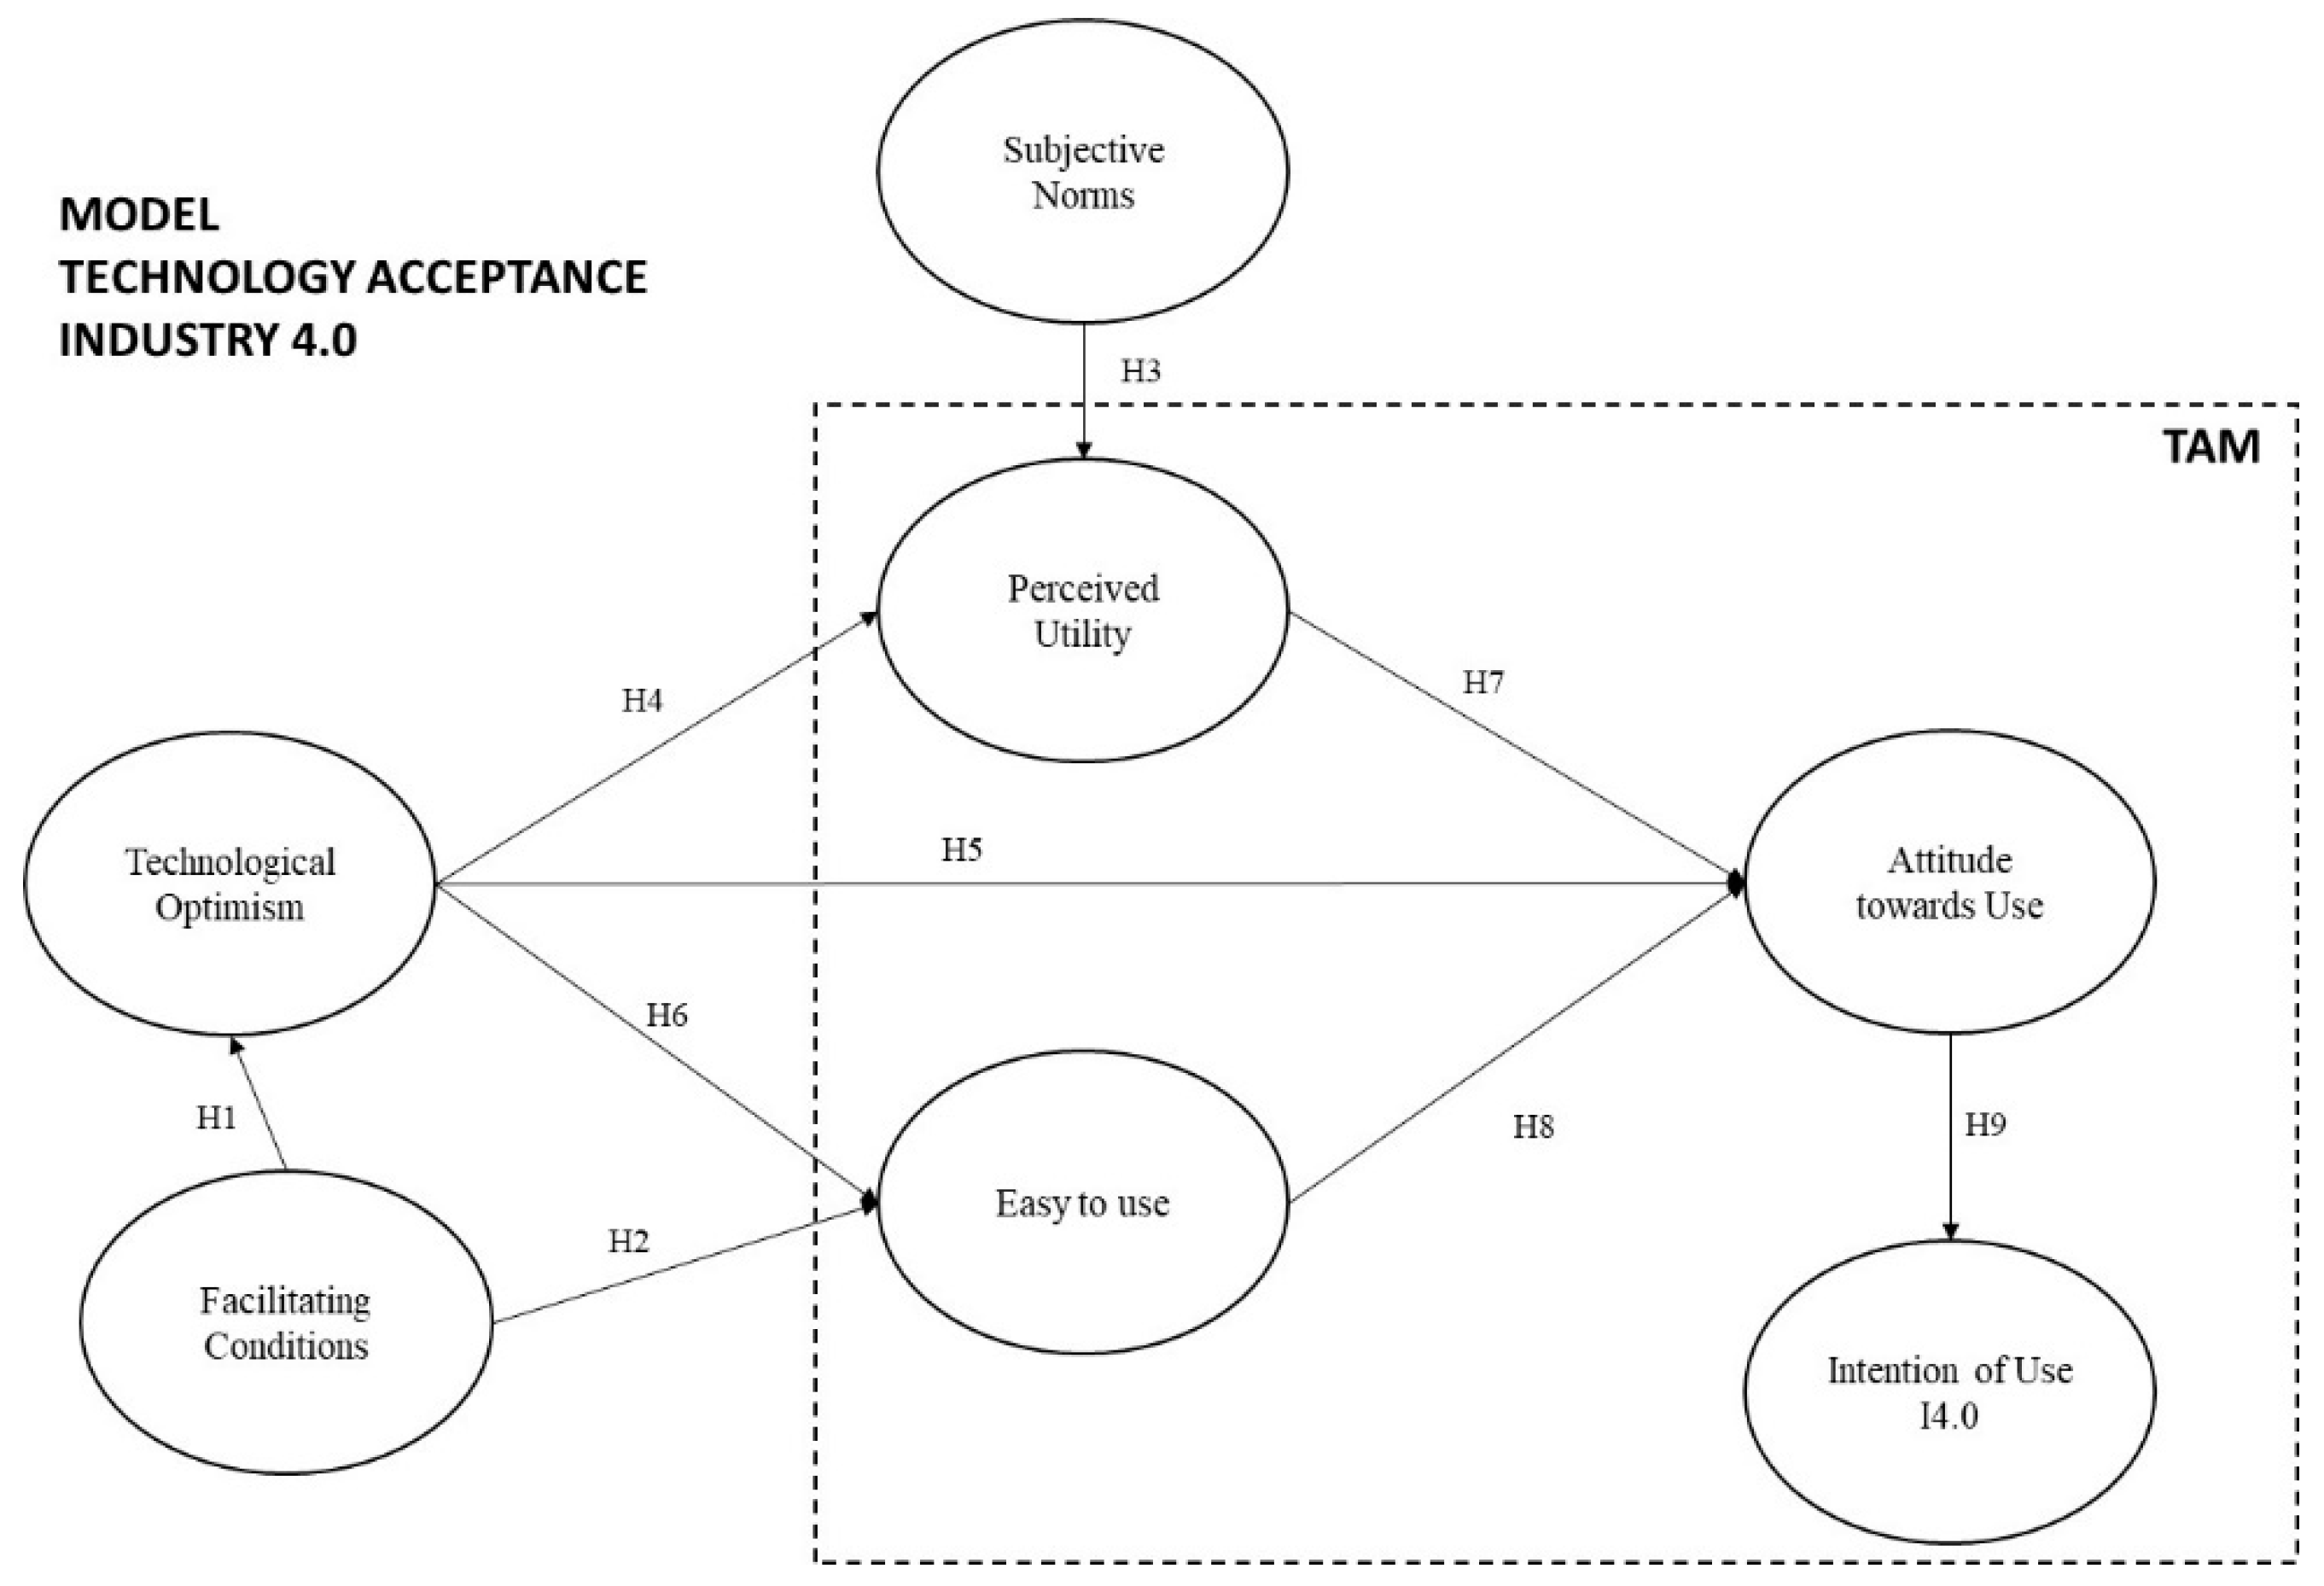
2. Theoretical Background and Hypotheses
- Facilitating Conditions
- Subjective Norms
- Technological Optimism
- Technology Acceptance Model
3. Methodology
- Empirical Context and Data Sources
- Measures
- Data Analysis
4. Results
5. Discussion
6. Conclusions
Author Contributions
Funding
Informed Consent Statement
Data Availability Statement
Acknowledgments
Conflicts of Interest
References
- De Luca, C.; Tondelli, S.; Åberg, H.E. The Covid-19 pandemic effects in rural areas. TeMA J. Land Use Mobil. Environ. 2020, 119–132. [Google Scholar] [CrossRef]
- Luo, R.-F.; Liu, C.-F.; Gao, J.-J.; Wang, T.-Y.; Zhi, H.-Y.; Shi, P.-F.; Huang, J.-K. Impacts of the COVID-19 pandemic on rural poverty and policy responses in China. J. Integr. Agric. 2020, 19, 2946–2964. [Google Scholar] [CrossRef]
- Mastronardi, L.; Cavallo, A.; Romagnoli, L. Diversified farms facing the COVID-19 pandemic: First signals from Italian case studies. Sustainability 2020, 12, 5709. [Google Scholar] [CrossRef]
- Rose, D.C.; Wheeler, R.; Winter, M.; Lobley, M.; Chivers, C.A. Agriculture 4.0: Making it work for people, production, and the planet. Land Use Policy 2021, 100, 104933. [Google Scholar] [CrossRef]
- Klerkx, L.; Rose, D. Dealing with the game-changing technologies of Agriculture 4.0: How do we manage diversity and responsibility in food system transition pathways? Glob. Food Sec. 2020, 24, 100347. [Google Scholar] [CrossRef]
- Zhai, Z.; Martínez, J.F.; Beltran, V.; Martínez, N.L. Decision support systems for agriculture 4.0: Survey and challenges. Comput. Electron. Agric. 2020, 170, 105256. [Google Scholar] [CrossRef]
- Maja, P.W.; Meyer, J.; Von Solms, S. Development of smart rural village indicators in line with industry 4.0. IEEE Access 2020, 8, 152017–152033. [Google Scholar] [CrossRef]
- Lima, G.C.; Figueiredo, F.L.; Barbieri, A.E.; Seki, J. Agro 4.0: Habilitando a transformação digital da agricultura por meio da IoT. Rev. Ciência Agronômica 2021, 51, 119–132. [Google Scholar] [CrossRef]
- Caggiani, M.E. Heterogeneidad en la condición juvenil rural. In Proceedings of the VI Congreso de la Asociación Latinoamericana de Sociología Rural, Porto Alegre, Brazil, 25–29 November 2002. [Google Scholar]
- Dirven, M. Nueva Definición de lo Rural en América Latina y el Caribe; FAO: Santiago, Chile, 2019. [Google Scholar]
- Cangas, G.Y. Juventud rural: Trayectorias teóricas y dilemas identitarios. Nueva Antropol. 2003, 19, 153–175. [Google Scholar]
- Dirven, M. Expectativas de la juventud y el desarrollo rural. Rev. CEPAL 1995, 55, 123–137. [Google Scholar] [CrossRef]
- Sili, M.; Fachelli, S.; Meiller, A. Juventud rural: Factores que influyen en el desarrollo de la actividad agropecuaria. Reflexiones sobre el caso argentino. Rev. Econ. Sociol. Rural 2016, 54, 635–652. [Google Scholar] [CrossRef] [Green Version]
- Durston, J. Juventud rural y desarrollo en América Latina. J. Adolesc. Juv. 2001, 99, 1–7. [Google Scholar]
- Orozco, M.; Jewers, M. IFAD Research Series 56 The Impact of Migrants’ Remittances and Investment on Rural Youth; IFAD Research Series 56; IFAD: Rome, Italy, 2019; SSRN 3532468. [Google Scholar]
- Durston, J. Juventud y desarrollo rural: Marco conceptual y contextual. Ser. Políticas Soc. 1998, 1, 1–41. [Google Scholar]
- Fondo Internacional de Desarrollo Agrícola (FIDA). Crear Oportunidades Para Los Jóvenes del Medio Rural. 2019, pp. 1–44. Available online: https://www.ifad.org/ruraldevelopmentreport/es/download/ (accessed on 20 May 2022).
- Arslan, A.; Tschirley, D.E.; Egger, E.-M. Rural Youth Welfare along the rural-urban gradient: An empirical Analysis across the Developing World. J. Dev. Stud. 2021, 57, 544–570. [Google Scholar] [CrossRef]
- Sumberg, J.; Chamberlin, J.; Flynn, J.; Glover, D.; Johnson, V. IFAD Research Series 47 Landscapes of Rural Youth Opportunity. Papers of the 2019 Rural Development Report. 2019. Available online: https://papers.ssrn.com/sol3/papers.cfm?abstract_id=3521380 (accessed on 20 May 2022).
- White, B. Agriculture and the Generation Problem; Fernwood Publishing: New Scotland, NY, USA, 2020; ISBN 1773631675. [Google Scholar]
- Sony, M. Industry 4.0 and lean management: A proposed integration model and research propositions. Prod. Manuf. Res. 2018, 6, 416–432. [Google Scholar] [CrossRef] [Green Version]
- Xu, L.D.; Xu, E.L.; Li, L. Industry 4.0: State of the art and future trends. Int. J. Prod. Res. 2018, 56, 2941–2962. [Google Scholar] [CrossRef] [Green Version]
- Reischauer, G. Industry 4.0 as policy-driven discourse to institutionalize innovation systems in manufacturing. Technol. Forecast. Soc. Chang. 2018, 132, 26–33. [Google Scholar] [CrossRef]
- Brar, P.S.; Shah, B.; Singh, J.; Ali, F.; Kwak, D. Using modified technology acceptance model to evaluate the adoption of a proposed IoT-based indoor disaster management software tool by rescue workers. Sensors 2022, 22, 1866. [Google Scholar] [CrossRef]
- Zhong, R.Y.; Xu, X.; Klotz, E.; Newman, S.T. Intelligent manufacturing in the context of industry 4.0: A review. Engineering 2017, 3, 616–630. [Google Scholar] [CrossRef]
- Liao, Y.; Deschamps, F.; Loures, E.F.R.; Ramos, L.F.P. Past, present and future of Industry 4.0—A systematic literature review and research agenda proposal. Int. J. Prod. Res. 2017, 55, 3609–3629. [Google Scholar] [CrossRef]
- Frank, A.G.; Dalenogare, L.; Ayala, N. Industry 4.0 technologies: Implementation patterns in manufacturing companies. Int. J. Prod. Econ. 2019, 210, 15–26. [Google Scholar] [CrossRef]
- Lu, Y. Industry 4.0: A survey on technologies, applications and open research issues. J. Ind. Inf. Integr. 2017, 6, 1–10. [Google Scholar] [CrossRef]
- Hizam-Hanafiah, M.; Soomro, M.A.; Abdullah, N.L. Industry 4.0 readiness models: A systematic literature review of model dimensions. Information 2020, 11, 364. [Google Scholar] [CrossRef]
- Mittal, S.; Khan, M.A.; Romero, D.; Wuest, T. A critical review of smart manufacturing & industry 4.0 maturity models: Implications for small and medium-sized enterprises (SMEs). J. Manuf. Syst. 2018, 49, 194–214. [Google Scholar] [CrossRef]
- Masood, T.; Sonntag, P. Industry 4.0: Adoption challenges and benefits for SMEs. Comput. Ind. 2020, 121, 103261. [Google Scholar] [CrossRef]
- Rodríguez-Espíndola, O.; Chowdhury, S.; Dey, P.K.; Albores, P.; Emrouznejad, A. Analysis of the adoption of emergent technologies for risk management in the era of digital manufacturing. Technol. Forecast. Soc. Chang. 2022, 178, 121562. [Google Scholar] [CrossRef]
- Kang, Y.; Choi, N.; Kim, S. Searching for new model of digital informatics for human-computer interaction: Testing the Institution-Based Technology Acceptance Model (ITAM). Int. J. Environ. Res. Public Health 2021, 18, 5593. [Google Scholar] [CrossRef]
- Granić, A.; Marangunić, N. Technology acceptance model in educational context: A systematic literature review. Br. J. Educ. Technol. 2019, 50, 2572–2593. [Google Scholar] [CrossRef]
- Rafique, H.; Omran, A.; Shamim, A.; Anwar, F. Investigating the acceptance of mobile library applications with an extended technology acceptance model (TAM). Comput. Educ. 2020, 145, 103732. [Google Scholar] [CrossRef]
- Na, S.; Heo, S.; Han, S.; Shin, Y.; Roh, Y. Acceptance model of artificial intelligence (AI)-based technologies in construction firms: Applying the Technology Acceptance Model (TAM) in combination with the Technology–Organisation–Environment (TOE) framework. Buildings 2022, 12, 90. [Google Scholar] [CrossRef]
- Chatterjee, S.; Rana, N.P.; Dwivedi, Y.K.; Baabdullah, A.M. Understanding AI adoption in manufacturing and production firms using an integrated TAM-TOE model. Technol. Forecast. Soc. Chang. 2021, 170, 120880. [Google Scholar] [CrossRef]
- Khin, S.; Kee, D.M.H. Factors influencing industry 4.0 adoption. J. Manuf. Technol. Manag. 2022, 33, 448–467. [Google Scholar] [CrossRef]
- Molino, M.; Cortese, C.G.; Ghislieri, C. The promotion of technology acceptance and work engagement in industry 4.0: From personal resources to information and training. Int. J. Environ. Res. Public Health 2020, 17, 2438. [Google Scholar] [CrossRef] [PubMed] [Green Version]
- Al-Emran, M.; Mezhuyev, V.; Kamaludin, A. Technology acceptance model in m-learning context: A systematic review. Comput. Educ. 2018, 125, 389–412. [Google Scholar] [CrossRef]
- Al-Qaysi, N.; Mohamad-Nordin, N.; Al-Emran, M. Employing the technology acceptance model in social media: A systematic review. Educ. Inf. Technol. 2020, 25, 4961–5002. [Google Scholar] [CrossRef]
- Davis, F.D. Perceived usefulness, perceived ease of use, and user acceptance of information technology. MIS Q. 1989, 319–340. [Google Scholar] [CrossRef] [Green Version]
- Fishbein, M.; Ajzen, I. Belief, attitude, intention, and behavior: An introduction to theory and research. Philos. Rhetor. 1977, 10, 177–188. [Google Scholar]
- Venkatesh, V.; Davis, F. A Theoretical extension of the technology acceptance model: Four longitudinal field studies. Manag. Sci. 2000, 46, 186–204. [Google Scholar] [CrossRef] [Green Version]
- Venkatesh, V.; Bala, H. Technology acceptance model 3 and a research agenda on interventions. Decis. Sci. 2008, 39, 273–315. [Google Scholar] [CrossRef] [Green Version]
- Davis, F.D.; Bagozzi, R.P.; Warshaw, P.R. User acceptance of computer technology: A comparison of two theoretical models. Manag. Sci. 1989, 35, 982–1003. [Google Scholar] [CrossRef] [Green Version]
- Parasuraman, A. Technology Readiness Index (TRI) a multiple-item scale to measure readiness to embrace new technologies. J. Serv. Res. 2000, 2, 307–320. [Google Scholar] [CrossRef]
- Berger, S.C. Self-service technology for sales purposes in branch banking: The impact of personality and relationship on customer adoption. Int. J. Bank Mark. 2009, 27, 488–505. [Google Scholar] [CrossRef]
- Venkatesh, V.; Morris, M.G.; Davis, G.B.; Davis, F.D. User acceptance of information technology: Toward a unified view. MIS Q. 2003, 27, 425–478. [Google Scholar] [CrossRef] [Green Version]
- Venkatesh, V.; Thong, J.; Xu, X. Consumer acceptance and use of information technology: Extending the unified theory of acceptance and use of technology. MIS Q. 2012, 36, 157–178. [Google Scholar] [CrossRef] [Green Version]
- Lin, C.-H.; Shih, H.-Y.; Sher, P.J. Integrating technology readiness into technology acceptance: The TRAM model. Psychol. Mark. 2007, 24, 641–657. [Google Scholar] [CrossRef]
- Yalcin, E.M.; Kutlu, B. Examination of students’ acceptance of and intention to use learning management systems using extended TAM. Br. J. Educ. Technol. 2019, 50, 2414–2432. [Google Scholar] [CrossRef]
- Cabero-Almenara, J.; Fernández-Batanero, J.M.; Barroso-Osuna, J. Adoption of augmented reality technology by university students. Heliyon 2019, 5, e01597. [Google Scholar] [CrossRef] [Green Version]
- Esteban-Millat, I.; Martínez-López, F.J.; Pujol-Jover, M.; Gázquez-Abad, J.C.; Alegret, A. An extension of the technology acceptance model for online learning environments. Interact. Learn. Environ. 2018, 26, 895–910. [Google Scholar] [CrossRef]
- Al-Emran, M.; Al-Maroof, R.; Al-Sharafi, M.A.; Arpaci, I. What impacts learning with wearables? An integrated theoretical model. Interact. Learn. Environ. 2020, 1–21. [Google Scholar] [CrossRef]
- Al-Maroof, R.S.; Alfaisal, A.M.; Salloum, S.A. Google glass adoption in the educational environment: A case study in the Gulf area. Educ. Inf. Technol. 2020, 26, 2477–2500. [Google Scholar] [CrossRef]
- Álvarez-Marín, A.; Velázquez-Iturbide, J.Á.; Castillo-Vergara, M. Technology acceptance of an interactive augmented reality app on resistive circuits for engineering students. Electronics 2021, 10, 1286. [Google Scholar] [CrossRef]
- Song, Y.; Yang, Y.; Cheng, P. The investigation of adoption of voice-user interface (VUI) in smart home systems among chinese older adults. Sensors 2022, 22, 1614. [Google Scholar] [CrossRef] [PubMed]
- Moumtzidis, I.; Kamariotou, M. Digital transformation strategies enabled by internet of things and big data analytics: The use-case of telecommunication companies in Greece. Information 2022, 13, 196. [Google Scholar] [CrossRef]
- Nyesiga, C.; Mayoka, K.G.; Musa, B.M.; Grace, A. Effort expectancy, performance expectancy, social influence and facilitating conditions as predictors of behavioural intentions to use ATMS with fingerprint authentication in Ugandan banks. Glob. J. Comput. Sci. Technol. Netw. Web Secur. 2017, 17, 5–23. [Google Scholar]
- Park, I.; Kim, D.; Moon, J.; Kim, S.; Kang, Y.; Bae, S. Searching for New Technology acceptance model under social context: Analyzing the determinants of acceptance of intelligent information technology in digital transformation and implications for the requisites of digital sustainability. Sustainability 2022, 14, 579. [Google Scholar] [CrossRef]
- Thompson, R.L.; Higgins, C.A.; Howell, J.M. Personal computing: Toward a conceptual model of utilization. MIS Q. Manag. Inf. Syst. 1991, 15, 125–142. [Google Scholar] [CrossRef]
- Bervell, B.; Arkorful, V. LMS-enabled blended learning utilization in distance tertiary education: Establishing the relationships among facilitating conditions, voluntariness of use and use behaviour. Int. J. Educ. Technol. High. Educ. 2020, 17, 6. [Google Scholar] [CrossRef] [Green Version]
- Teo, T. Examining the influence of subjective norm and facilitating conditions on the intention to use technology among pre-service teachers: A structural equation modeling of an extended technology acceptance model. Asia Pac. Educ. Rev. 2010, 11, 253–262. [Google Scholar] [CrossRef]
- Wang, C.-S.; Jeng, Y.-L.; Huang, Y.-M. What influences teachers to continue using cloud services? Electron. Libr. 2017, 35, 520–533. [Google Scholar] [CrossRef]
- Othman, A.K.; Hamzah, M.I. Modeling the contingent role of technological optimism on customer satisfaction with self-service technologies. A case of cash-recycling ATMs. J. Enterp. Inf. Manag. 2020. [Google Scholar] [CrossRef]
- Taneja, A.; Wang, A.; Raja, M.K. Assessing the impact of concern for privacy and innovation characteristics in the adoption of biometric technologies. In Proceedings of the 37th Annual Conference of Decision Sciences Institute, Bricktown, OKC, USA, 2006. [Google Scholar]
- Santini, F.; Ladeira, W.J.; Sampaio, C.H.; Perin, M.G.; Dolci, P.C. Propensity for technological adoption: An analysis of effects size in the banking sector. Behav. Inf. Technol. 2020, 39, 1341–1355. [Google Scholar] [CrossRef]
- Fraga-Lamas, P.; Fernández-Caramés, T.M.; Blanco-Novoa, O.; Vilar-Montesinos, M.A. A review on industrial augmented reality systems for the industry 4.0 shipyard. IEEE Access 2018, 6, 13358–13375. [Google Scholar] [CrossRef]
- Jung, T.H.; Lee, H.; Chung, N.; Dieck, T.M.C. Cross-cultural differences in adopting mobile augmented reality at cultural heritage tourism sites. Int. J. Contemp. Hosp. Manag. 2018, 30, 1621–1645. [Google Scholar] [CrossRef]
- Lee, I.-J.; Chen, C.-H.; Su, C.-Y. App based souvenirs and entry tickets: A new means of enhancing post visit memories: A case study from Taiwan. Tour. Manag. Perspect. 2017, 24, 177–185. [Google Scholar] [CrossRef]
- Rese, A.; Baier, D.; Geyer-Schulz, A.; Schreiber, S. How augmented reality apps are accepted by consumers: A comparative analysis using scales and opinions. Technol. Forecast. Soc. Chang. 2017, 124, 306–319. [Google Scholar] [CrossRef]
- Chao, C.M.; Yu, T.K. The moderating effect of technology optimism: How it affects students’ weblog learning. Online Inf. Rev. 2019, 43, 161–180. [Google Scholar] [CrossRef]
- Saxena, N.; Gera, N.; Taneja, M. An empirical study on facilitators and inhibitors of adoption of mobile banking in India. Electron. Commer. Res. 2022. [Google Scholar] [CrossRef]
- Hung, S.; Cheng, M. Computers & Education Are you ready for knowledge sharing ? An empirical study of virtual communities. Comput. Educ. 2013, 62, 8–17. [Google Scholar] [CrossRef]
- Lewis, J.R.; Mayes, D.K. Development and psychometric evaluation of the emotional metric outcomes (EMO) questionnaire. Int. J. Hum. Comput. Interact. 2014, 30, 685–702. [Google Scholar] [CrossRef]
- Koenigstorfer, J.; Groeppel-Klein, A. Consumer acceptance of the mobile Internet. Mark. Lett. 2012, 23, 917–928. [Google Scholar] [CrossRef]
- Alharbi, A.; Sohaib, O. Technology readiness and cryptocurrency adoption: PLS-SEM and deep learning neural network analysis. IEEE Access 2021, 9, 21388–21394. [Google Scholar] [CrossRef]
- De Melo Pereira, F.A.; Ramos, A.S.M.; Aparecida, M.; da Costa, M.F. Computers in human behavior satisfaction and continuous use intention of e-learning service in brazilian public organizations. Comput. Hum. Behav. 2015, 46, 139–148. [Google Scholar] [CrossRef]
- Álvarez-Marín, A.; Velázquez-Iturbide, J.Á.; Castillo-Vergara, M. The acceptance of augmented reality in engineering education: The role of technology optimism and technology innovativeness the role of technology optimism and technology innovativeness. Interact. Learn. Environ. 2021, 1–13. [Google Scholar] [CrossRef]
- Imtiaz, A.; Maarop, N. A Review of technology acceptance studies in the field of education. J. Technol. Sci. Eng. 2014, 69, 27–32. [Google Scholar] [CrossRef] [Green Version]
- Marangunić, N.; Granić, A. Technology acceptance model: A literature review from 1986 to 2013. Univers. Access Inf. Soc. 2015, 14, 81–95. [Google Scholar] [CrossRef]
- Henseler, J. Bridging Design and behavioral research with variance-based structural equation modeling. J. Advert. 2017, 46, 178–192. [Google Scholar] [CrossRef]
- Henseler, J.; Hubona, G.; Ray, P.A. Using PLS path modeling in new technology research: Updated guidelines. Ind. Manag. Data Syst. 2016, 116, 2–20. [Google Scholar] [CrossRef]
- Lamberti, G. Hybrid multigroup partial least squares structural equation modelling: An application to bank employee satisfaction and loyalty. Qual. Quant. 2021. [Google Scholar] [CrossRef]
- Hair, J.F.; Hult, G.T.; Ringle, C.M.; Sarstedt, M.; Castillo-Apraiz, J.; Carrion, C.G.; Roldán, J.L. Manual de Partial Least Squares Structural Equation Modeling (Pls-Sem). OmniaScience Scholar. 2019. Available online: https://tore.tuhh.de/handle/11420/5279 (accessed on 20 May 2022).
- Calder, B.J.; Phillips, L.W.; Tybout, A.M. Designing research for application. J. Consum. Res. 1981, 8, 197. [Google Scholar] [CrossRef]
- Teo, T.; Lee, C.; Chai, C. Understanding pre-service teachers’ computer attitudes: Applying and extending the technology acceptance model. J. Comput. Assist. Learn. 2007, 24, 128–143. [Google Scholar] [CrossRef]
- Chung, N.; Han, H.; Joun, Y. Tourists’ intention to visit a destination: The role of augmented reality (AR) application for a heritage site. Comput. Human Behav. 2015, 50, 588–599. [Google Scholar] [CrossRef]
- Teo, T.; Noyes, J. An assessment of the influence of perceived enjoyment and attitude on the intention to use technology among pre-service teachers: A structural equation modeling approach. Comput. Educ. 2011, 57, 1645–1653. [Google Scholar] [CrossRef]
- Pantano, E.; Rese, A.; Baier, D. Enhancing the online decision-making process by using augmented reality: A two country comparison of youth markets. J. Retail. Consum. Serv. 2017, 38, 81–95. [Google Scholar] [CrossRef]
- Wojciechowski, R.; Cellary, W. Evaluation of learners’ attitude toward learning in ARIES augmented reality environments. Comput. Educ. 2013, 68, 570–585. [Google Scholar] [CrossRef]
- Balog, A.; Pribeanu, C. The role of perceived enjoyment in the students’ acceptance of an augmented reality teaching platform: A structural equation modelling approach. Stud. Inform. Control. 2010, 19, 319–330. [Google Scholar] [CrossRef]
- Ringle, C.M.; Wende, S.; Becker, J.-M. SmartPLS 3. Boenningstedt: SmartPLS GmbH. Available online: http://www.smartpls.com (accessed on 20 May 2022).
- Mustofa, R.H.; Pramudita, D.A.; Atmono, D.; Priyankara, R.; Asmawan, M.C.; Rahmattullah, M.; Mudrikah, S.; Pamungkas, L.N.S. Exploring educational students acceptance of using movies as economics learning media: PLS-SEM analysis. Int. Rev. Econ. Educ. 2022, 39, 100236. [Google Scholar] [CrossRef]
- Hair, F.J., Jr.; Sarstedt, M.; Hopkins, L.; Kuppelwieser, G.V. Partial least squares structural equation modeling (PLS-SEM). Eur. Bus. Rev. 2014, 26, 106–121. [Google Scholar] [CrossRef]
- Henseler, J.; Ringle, C.M.; Sarstedt, M. Testing measurement invariance of composites using partial least squares. Int. Mark. Rev. 2016, 33, 405–431. [Google Scholar] [CrossRef]
- Hair, J.F., Jr.; Sarstedt, M.; Christian, M.; Ringle, S.P.G. Advanced Issues in Partial Least Squares Structural Equation Modeling; SAGE: Thousand Oaks, CA, USA, 2017; ISBN 1483377385, 9781483377384. [Google Scholar]
- Henseler, J.; Dijkstra, T.K.; Sarstedt, M.; Ringle, C.M.; Diamantopoulos, A.; Straub, D.W.; Ketchen, D.J.; Hair, J.F.; Hult, G.T.M.; Calantone, R.J. Common beliefs and reality about PLS: Comments on Ronkko and Evermann (2013). Organ. Res. Methods 2014, 17, 182–209. [Google Scholar] [CrossRef] [Green Version]
- Fornell, C.; Larcker, D.F. Evaluating structural equation models with unobservable variables and measurement error. J. Mark. Res. 1981, 18, 39–50. [Google Scholar] [CrossRef]
- Frank, F.R.; Miller, N.B. A Primer for Soft Modeling; University of Akron Press: Akron, OH, USA, 1992. [Google Scholar]
- Chin, W.W. The partial least squares approach to structural equation modeling. Adv. Hosp. Leis. 1998, 295, 295–336. [Google Scholar]
- OECD Organization for Economic Co-operation and Development. Enhancing Innovation in Rural Region. 2022. Available online: https://www.oecd.org/regional/rural-development/rural-innovation.htm (accessed on 20 May 2022).
- Kim, H.-B.; Kim, T.; Shin, S.W. Modeling roles of subjective norms and eTrust in customers’ acceptance of airline B2C eCommerce websites. Tour. Manag. 2009, 30, 266–277. [Google Scholar] [CrossRef]
- Schepers, J.; Wetzels, M. A meta-analysis of the technology acceptance model: Investigating subjective norm and moderation effects. Inf. Manag. 2007, 44, 90–103. [Google Scholar] [CrossRef]
- Rejón-Guardia, F.; Polo-Peña, A.I.; Maraver-Tarifa, G. The acceptance of a personal learning environment based on Google apps: The role of subjective norms and social image. J. Comput. High. Educ. 2020, 32, 203–233. [Google Scholar] [CrossRef]
- Buabeng-Andoh, C. Predicting students’ intention to adopt mobile learning: A combination of theory of reasoned action and technology acceptance model. J. Res. Innov. Teach. Learn. 2018, 11, 178–191. [Google Scholar] [CrossRef] [Green Version]
- Hu, Z.; Ding, S.; Li, S.; Chen, L.; Yang, S. Adoption intention of fintech services for bank users: An empirical examination with an extended technology acceptance model. Symmetry 2019, 11, 340. [Google Scholar] [CrossRef] [Green Version]
- Kurian, R.M.; Thomas, S. Perceived stress among information technology professionals in India during the COVID-19 pandemic. Theor. Issues Ergon. Sci. 2022, 23, 182–198. [Google Scholar] [CrossRef]
- Aruleba, K.; Jere, N.; Matarirano, O. Technology adoption readiness in disadvantaged universities during COVID-19 pandemic in South Africa. Int. J. High. Educ. 2022, 11, 172–180. [Google Scholar] [CrossRef]
- Ilmi, Z.; Darma, D.C.; Azis, M. Independence in learning, education management, and industry 4.0: Habitat Indonesia during COVID-19. J. Anthropol. Sport Phys. Educ. 2020, 4, 63–66. [Google Scholar]
- Cyfert, S.; Glabiszewski, W.; Zastempowski, M. Impact of management tools supporting industry 4.0 on the importance of csr during covid-19. generation z. Energies 2021, 14, 1642. [Google Scholar] [CrossRef]
- Asimakopoulos, G.; Hernández, V.; Miguel, J.P. Entrepreneurial intention of engineering students: The role of social norms and entrepreneurial self-efficacy. Sustainability 2019, 11, 4314. [Google Scholar] [CrossRef] [Green Version]
- Lee, Y.; Kozar, K.A.; Larsen, K.R.T.; Lee, Y.; Kozar, K.A.; Lee, Y.; Kozar, K.A.; Larsen, K.R.T. The technology acceptance model: Past, present, and future. Commun. Assoc. Inf. Syst. 2003, 12, 752–780. [Google Scholar] [CrossRef]
- Prasetyo, Y.T.; Ong, A.K.S.; Concepcion, G.K.F.; Navata, F.M.B.; Robles, R.A.V.; Tomagos, I.J.T.; Young, M.N.; Diaz, J.F.T.; Nadlifatin, R.; Redi, A.A.N.P. Determining factors affecting acceptance of e-learning platforms during the COVID-19 pandemic: Integrating extended technology acceptance model and DeLone & Mclean is success model. Sustainability 2021, 13, 8365. [Google Scholar]
- Ding, W.; Wang, Q.G.; Zhang, J.X. Analysis and prediction of COVID-19 epidemic in South Africa. ISA Trans. 2021, 124, 182–190. [Google Scholar] [CrossRef]
- Zhang, X.; Chen, Y.Q. Admissibility and robust stabilization of continuous linear singular fractional order systems with the fractional order α: The 0<α<1 case. ISA Trans. 2018, 82, 42–50. [Google Scholar] [CrossRef]


| Construct | Study | Indicator |
|---|---|---|
| Subjective norms | [88] | People whose opinions I value encourage me to use new Industry 4.0 technologies. |
| People who are important to me help me use the new Industry 4.0 technologies. | ||
| Technology optimism | [89] | The products and services that use the newest technologies are much more convenient. |
| I prefer to use the most advanced technology available. | ||
| Technology makes my work more efficient. | ||
| Facilitating conditions | [90] | I can easily access information on how to use Industry 4.0 technology. |
| Industry 4.0 technology is compatible with other technologies I use (tablet, notebook, smartphone). | ||
| I can easily get guidance and instruction if I have difficulties in using Industry 4.0 technologies. | ||
| Perceived ease of use | [91] | The use of Industry 4.0 technologies is easy for me. |
| The use of Industry 4.0 technologies is understandable and clear to me. | ||
| It will not be difficult for me to be proficient in the use of Industry 4.0 technologies. | ||
| Perceived usefulness | [92] | Industry 4.0 technology can help me to be more efficient. |
| Industry 4.0 technology is useful. | ||
| The use of Industry 4.0 technologies benefits me | ||
| Attitude towards using | [91] | The use of Industry 4.0 technologies is a good idea. |
| The use of Industry 4.0 technologies is a wise idea. | ||
| I like to develop my activities using Industry 4.0 technologies. | ||
| Behavioral intention to use | [93] | I intend to use Industry 4.0 technologies in the coming months. |
| I will continuously use Industry 4.0 technologies in my activities. | ||
| In general, I am willing to use Industry 4.0 technologies for the development of my activities. | ||
| I would recommend others to incorporate Industry 4.0 technologies in their activities. |
| Construct/Indicator | Loads | Cronbach’s | Dijkstra–Henseler’s Rho | Composite | Average |
|---|---|---|---|---|---|
| Alpha | Reliabilities | Variance Extracted | |||
| Subjective norm (SN) | 0.8391 | 1.201 | 0.9168 | 0.8468 | |
| SN1 | 0.8657 | ||||
| SN2 | 0.9716 | ||||
| Technology optimism (TO) | 0.9029 | 1.116 | 0.9283 | 0.8126 | |
| TO1 | 0.9619 | ||||
| TO2 | 0.9244 | ||||
| TO3 | 0.8113 | ||||
| Facilitating conditions (FC) | 0.8994 | 1.056 | 0.9324 | 0.8217 | |
| FC1 | 0.9300 | ||||
| FC2 | 0.9352 | ||||
| FC3 | 0.8518 | ||||
| Perceived ease of use (PEOU) | 0.8971 | 0.913 | 0.9353 | 0.8282 | |
| PEOU1 | 0.8958 | ||||
| PEOU2 | 0.9371 | ||||
| PEOU3 | 0.8966 | ||||
| Perceived usefulness (PU) | 0.9321 | 1.558 | 0.9474 | 0.8574 | |
| PU1 | 0.9048 | ||||
| PU2 | 0.9721 | ||||
| PU3 | 0.8992 | ||||
| Attitude towards using (ATU) | 0.9305 | 1.185 | 0.952 | 0.8688 | |
| ATU1 | 0.8948 | ||||
| ATU2 | 0.9758 | ||||
| ATU3 | 0.9239 | ||||
| Behavioral intention to use (BIU) | 0.9177 | 1.034 | 0.9354 | 0.7838 | |
| BIU1 | 0.8976 | ||||
| BIU2 | 0.8124 | ||||
| BIU3 | 0.9017 | ||||
| BIU4 | 0.9255 |
| ATU | BIU | PEOU | PU | SN | FC | TO | |
|---|---|---|---|---|---|---|---|
| ATU | 0.9321 | ||||||
| BIU | 0.8731 | 0.8853 | |||||
| PEOU | 0.8220 | 0.8055 | 0.9100 | ||||
| PU | 0.8501 | 0.8204 | 0.7256 | 0.9260 | |||
| SN | 0.7463 | 0.7364 | 0.7405 | 0.6510 | 0.9202 | ||
| FC | 0.7204 | 0.7427 | 0.7675 | 0.6417 | 0.7036 | 0.9065 | |
| TO | 0.7477 | 0.7449 | 0.7390 | 0,.3910 | 0.6629 | 0.7570 | 0.9015 |
| ATU | BIU | PEOU | PU | SN | FC | TO | |
|---|---|---|---|---|---|---|---|
| ATU | |||||||
| BIU | 0.9223 | ||||||
| PEOU | 0.8961 | 0.9032 | |||||
| PU | 0.8933 | 0.8804 | 0.7947 | ||||
| SN | 0.8231 | 0.8244 | 0.8585 | 0.7261 | |||
| FC | 0.7736 | 0.8041 | 0.8632 | 0.6772 | 0.8039 | ||
| TO | 0.7875 | 0.8072 | 0.7891 | 0.8038 | 0.7377 | 0.7976 |
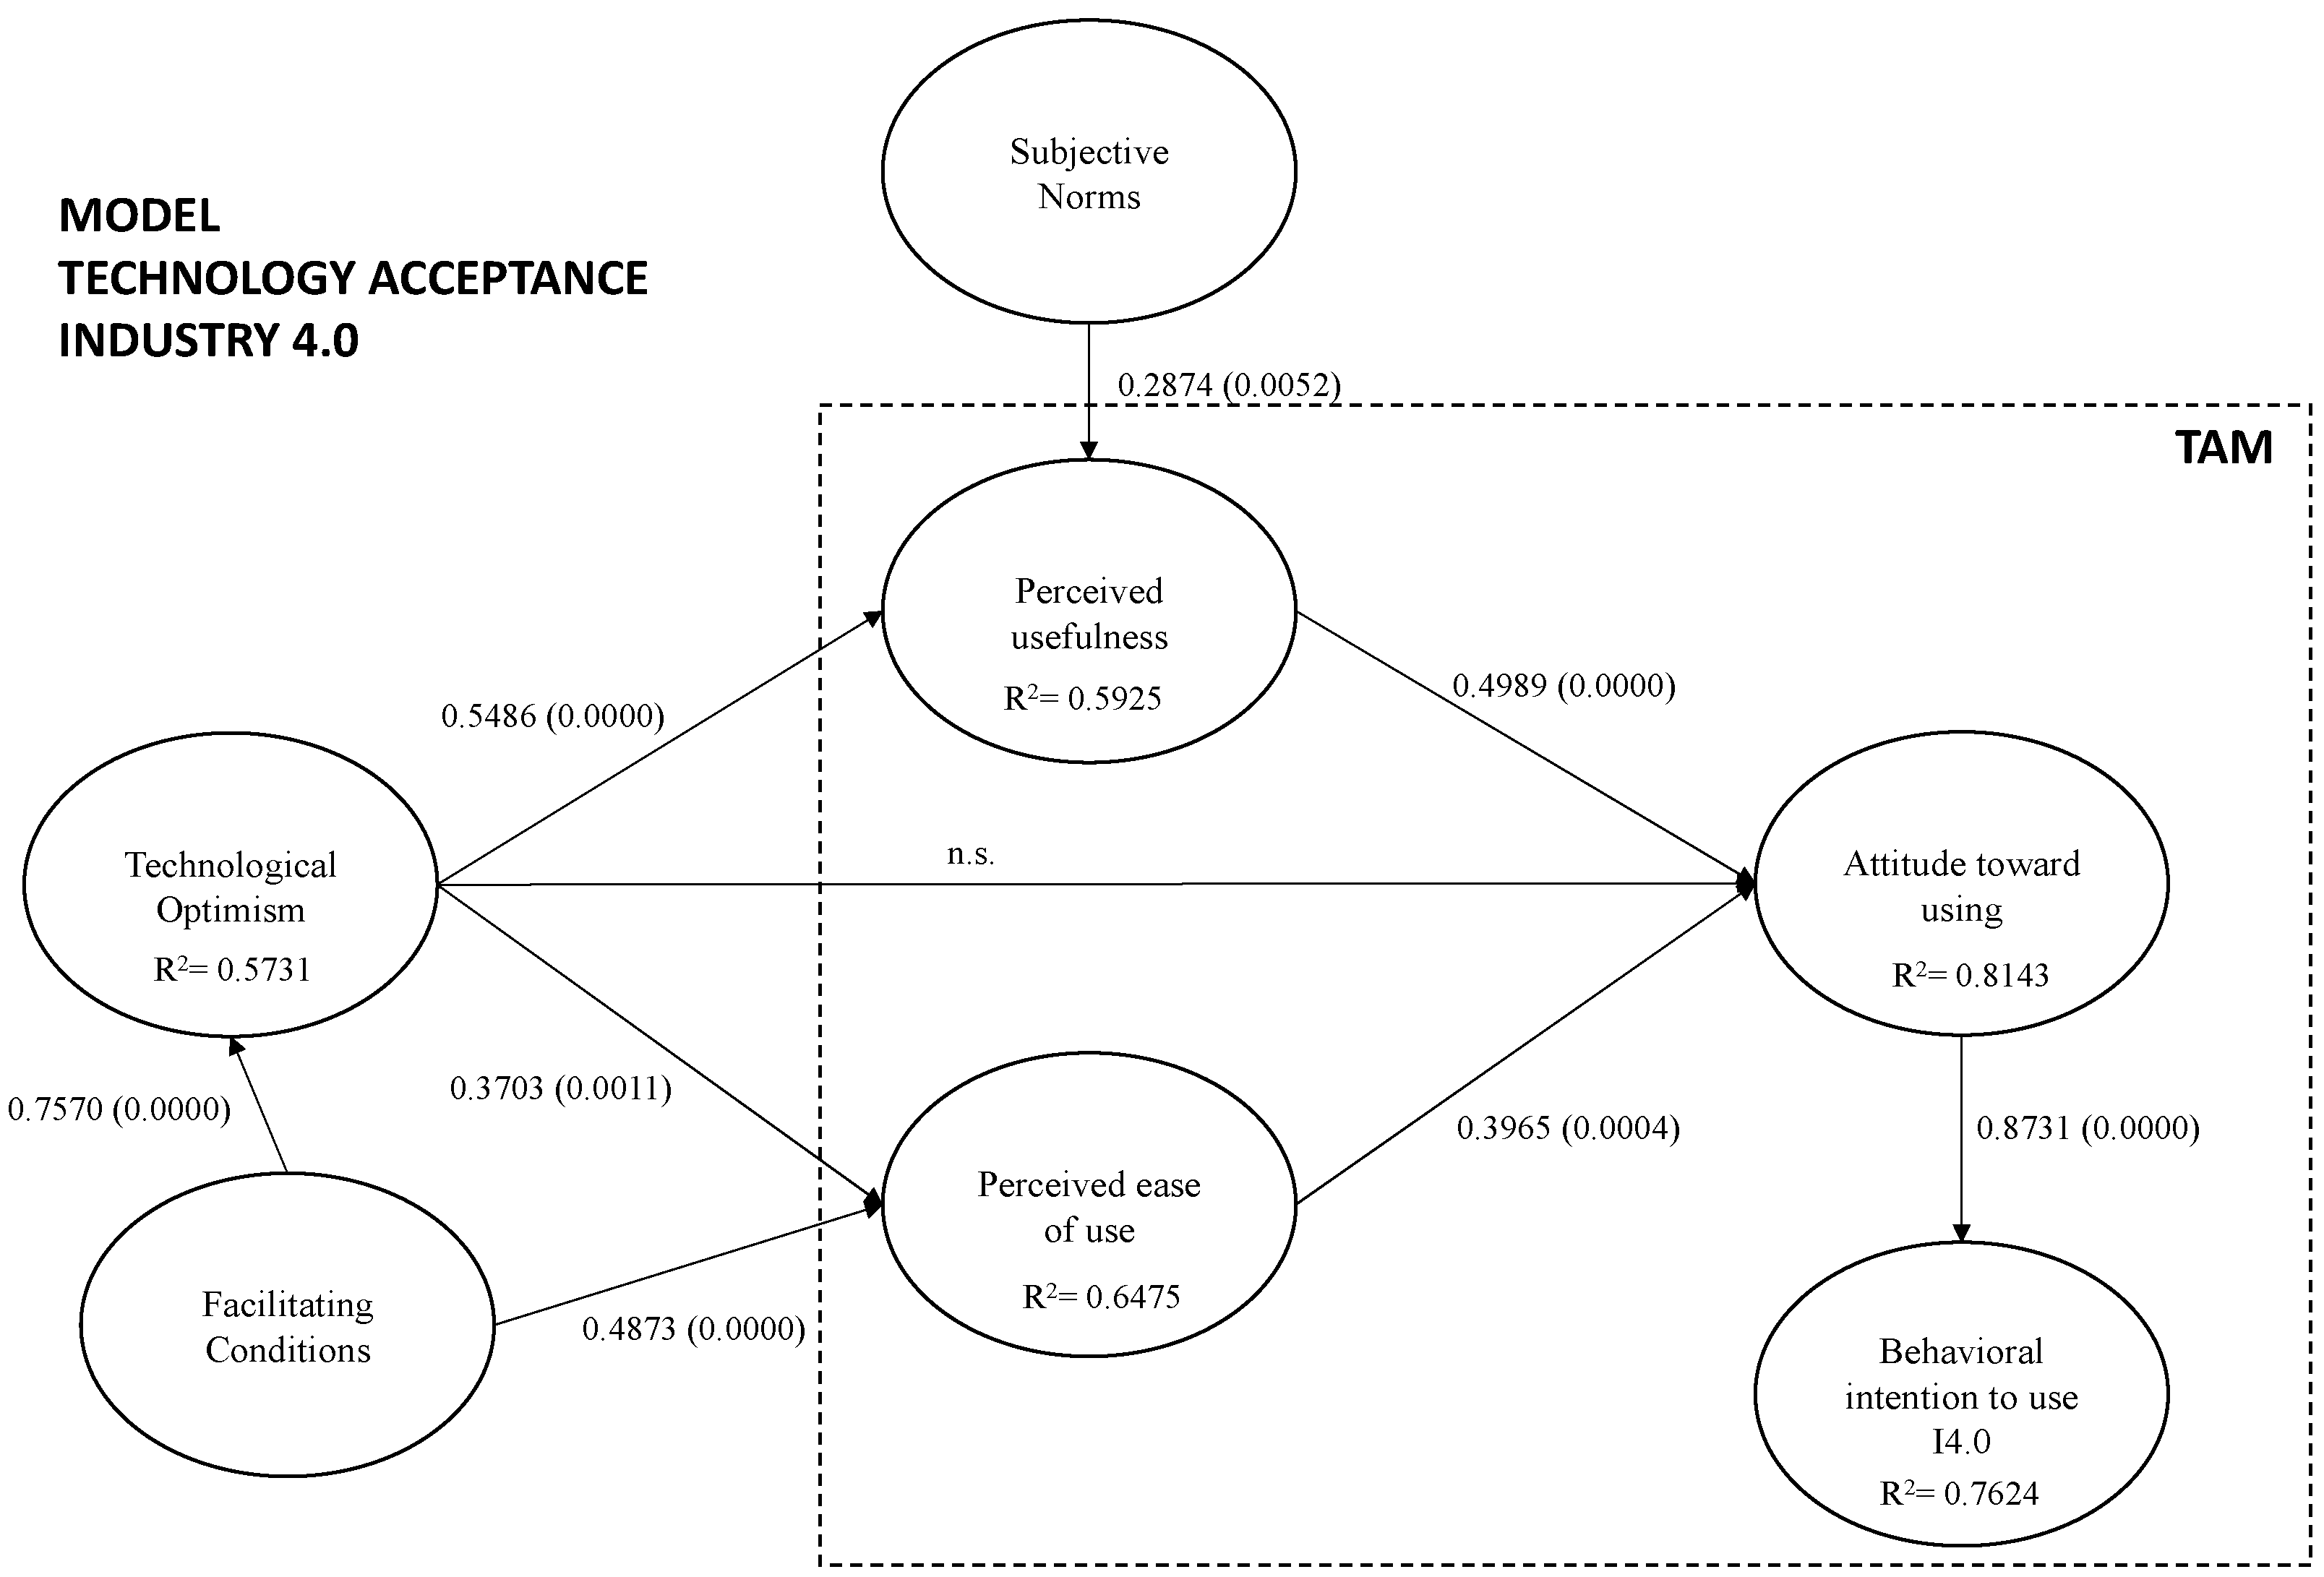
| Hypothesis | Path | t-Value | p-Value | Supported |
|---|---|---|---|---|
| H1: Facilitating Conditions (FC)→Technology optimism (TO) | 0.7570 | 12.519 | 0.0000 | Yes |
| H2: Facilitating Conditions (FC)→Perceived ease of use (PEOU) | 0.4873 | 4.229 | 0.0000 | Yes |
| H3: Subjective norm (SN)→Perceived usefulness (PU) | 0.2874 | 2.563 | 0.0052 | Yes |
| H4: Technology optimism (TO)→Perceived usefulness (PU) | 0.5486 | 4.378 | 0.0000 | Yes |
| H5: Technology optimism (TO)→Attitude towards using (ATU) | 0.0860 | 0.793 | 0.2139 | No |
| H6: Technology optimism (TO)→Perceived ease of use (PEOU) | 0.3703 | 3.071 | 0.0011 | Yes |
| H7: Perceived usefulness (PU)→Attitude towards using (ATU) | 0.4989 | 4.072 | 0.0000 | Yes |
| H8: Perceived ease of use (PEOU)→Attitude towards using (ATU) | 0.3965 | 3.327 | 0.0004 | Yes |
| H9: Attitude towards using (ATU)→Behavioral intention to use (BIU) | 0.8731 | 32.785 | 0.0000 | Yes |
Publisher’s Note: MDPI stays neutral with regard to jurisdictional claims in published maps and institutional affiliations. |
© 2022 by the authors. Licensee MDPI, Basel, Switzerland. This article is an open access article distributed under the terms and conditions of the Creative Commons Attribution (CC BY) license (https://creativecommons.org/licenses/by/4.0/).
Share and Cite
Castillo-Vergara, M.; Álvarez-Marín, A.; Villavicencio Pinto, E.; Valdez-Juárez, L.E. Technological Acceptance of Industry 4.0 by Students from Rural Areas. Electronics 2022, 11, 2109. https://doi.org/10.3390/electronics11142109
Castillo-Vergara M, Álvarez-Marín A, Villavicencio Pinto E, Valdez-Juárez LE. Technological Acceptance of Industry 4.0 by Students from Rural Areas. Electronics. 2022; 11(14):2109. https://doi.org/10.3390/electronics11142109
Chicago/Turabian StyleCastillo-Vergara, Mauricio, Alejandro Álvarez-Marín, Eduardo Villavicencio Pinto, and Luis Enrique Valdez-Juárez. 2022. "Technological Acceptance of Industry 4.0 by Students from Rural Areas" Electronics 11, no. 14: 2109. https://doi.org/10.3390/electronics11142109