Article

Automatic Rice Disease Detection and Assistance Framework Using Deep Learning and a Chatbot

1
Department of Instrumentation and Control Engineering, Dr B R Ambedkar National Institute of Technology Jalandhar, Punjab 144011, India
2
Department of Computer Science and Engineering, Shobhit University, Meerut 250110, India
3
Applied Research Center, Florida International University, Miami, FL 33199, USA
4
Amity School of Engineering & Technology, Amity University Uttar Pradesh, Noida 201301, India
5
School of Computer Science, Kyungil University, Gyeongsan 38428, Korea
*
Authors to whom correspondence should be addressed.
Electronics 2022, 11(14), 2110; https://doi.org/10.3390/electronics11142110
Submission received: 3 June 2022 / Revised: 4 July 2022 / Accepted: 4 July 2022 / Published: 6 July 2022
(This article belongs to the Topic Machine and Deep Learning)

Abstract

:
Agriculture not only supplies food but is also a source of income for a vast population of the world. Paddy plants usually produce a brown-coloured husk on the top and their seed, after de-husking and processing, yields edible rice which is a major cereal food crop and staple food, and therefore, becomes the cornerstone of the food security for half the world’s people. However, with the increase in climate change and global warming, the quality and its production are highly degraded by the common diseases posed in rice plants due to bacteria and fungi (such as sheath rot, leaf blast, leaf smut, brown spot, and bacterial blight). Therefore, to accurately identify these diseases at an early stage, recently, recognition and classification of crop diseases is in burning demand. Hence, the present work proposes an automatic system in the form of a smartphone application (E-crop doctor) to detect diseases from paddy leaves which can also suggest pesticides to farmers. The application also has a chatbot named “docCrop” which provides 24 × 7 support to the farmers. The efficiency of the two most popular object detection algorithms (YOLOv3 tiny and YOLOv4 tiny) for smartphone applications was analysed for the detection of three diseases—brown spot, leaf blast, and hispa. The results reveal that YOLOv4 tiny achieved a mAP of 97.36% which is significantly higher by a margin of 17.59% than YOLOv3 tiny. Hence, YOLOv4 tiny is deployed for the development of the mobile application for use.

1. Introduction

Agriculture is considered one of the most important industries in the world. It not only provides food for humans but also is considered one of the major sources of income for most developing countries, such as India. It contributes to 14% of India’s total Gross Domestic Product (GDP) and, provides employment to approximately 54.6% of the population, directly or indirectly [1]. Amongst agricultural yields, rice has been considered the staple food for more than half of the global population. Rice is obtained as a seed of the grass varieties usually known as Oryza sativa and Oryza glaberrima which are fibrous root plants with a common height of 6 feet. Technically, the seeds covered with a brown-coloured husk on the top of the fibrous root plant in the form of separate stalks is called a paddy plant. The paddy is then harvested, de-husked and processed to yield edible rice. Sometimes, paddy fields are interchangeable with rice fields. In many developing and poor countries, people belong to the poor or very poor class and therefore, to fulfil their daily calorie needs, they directly depend on rice because of its high carbohydrate content and favourable conditions for paddy cultivation [2]. The Food and Agricultural Policy Research Institute (FAPRI) has projected an overall increase in the demand for global milled rice by 26% in the next 25 years, and hence rice is said to be the cornerstone of food security for half the world’s people.
Generally, farmers tend to use pesticides and insecticides to increase their crop yield; however, the addition of excessive pesticides and insecticides affects the biodiversity of the earth which leads to problems such as global warming and climate change [3]. Further, the unpredictable threat of climate change and global warming drastically affects the air temperature, precipitation, evapotranspiration, and water temperature and hence, infects the paddy crop growth. Furthermore, these changes invite many diseases (such as sheath rot, leaf blast, leaf smut, brown spot, and bacterial blight) due to bacterial and fungi attacks, which damage the paddy leaves [4]. According to the International Rice Research Institute (IRRI), the farmers lose 37% of their rice harvest to pests and diseases. Further, depending on the production condition, these losses can range from 24% to 41% [5]. As a result, the rice-growing regions are significantly decreased and ultimately, the number of rice farmers is dwindling. Due to the rapid growth in the global population and the shrinking population of rice farmers, one of the cheapest staple food is at stake. Therefore, it is important to diagnose these diseases by early and accurate identification of the symptoms before the plant becomes damaged and hence, useless.

1.1. Background Study
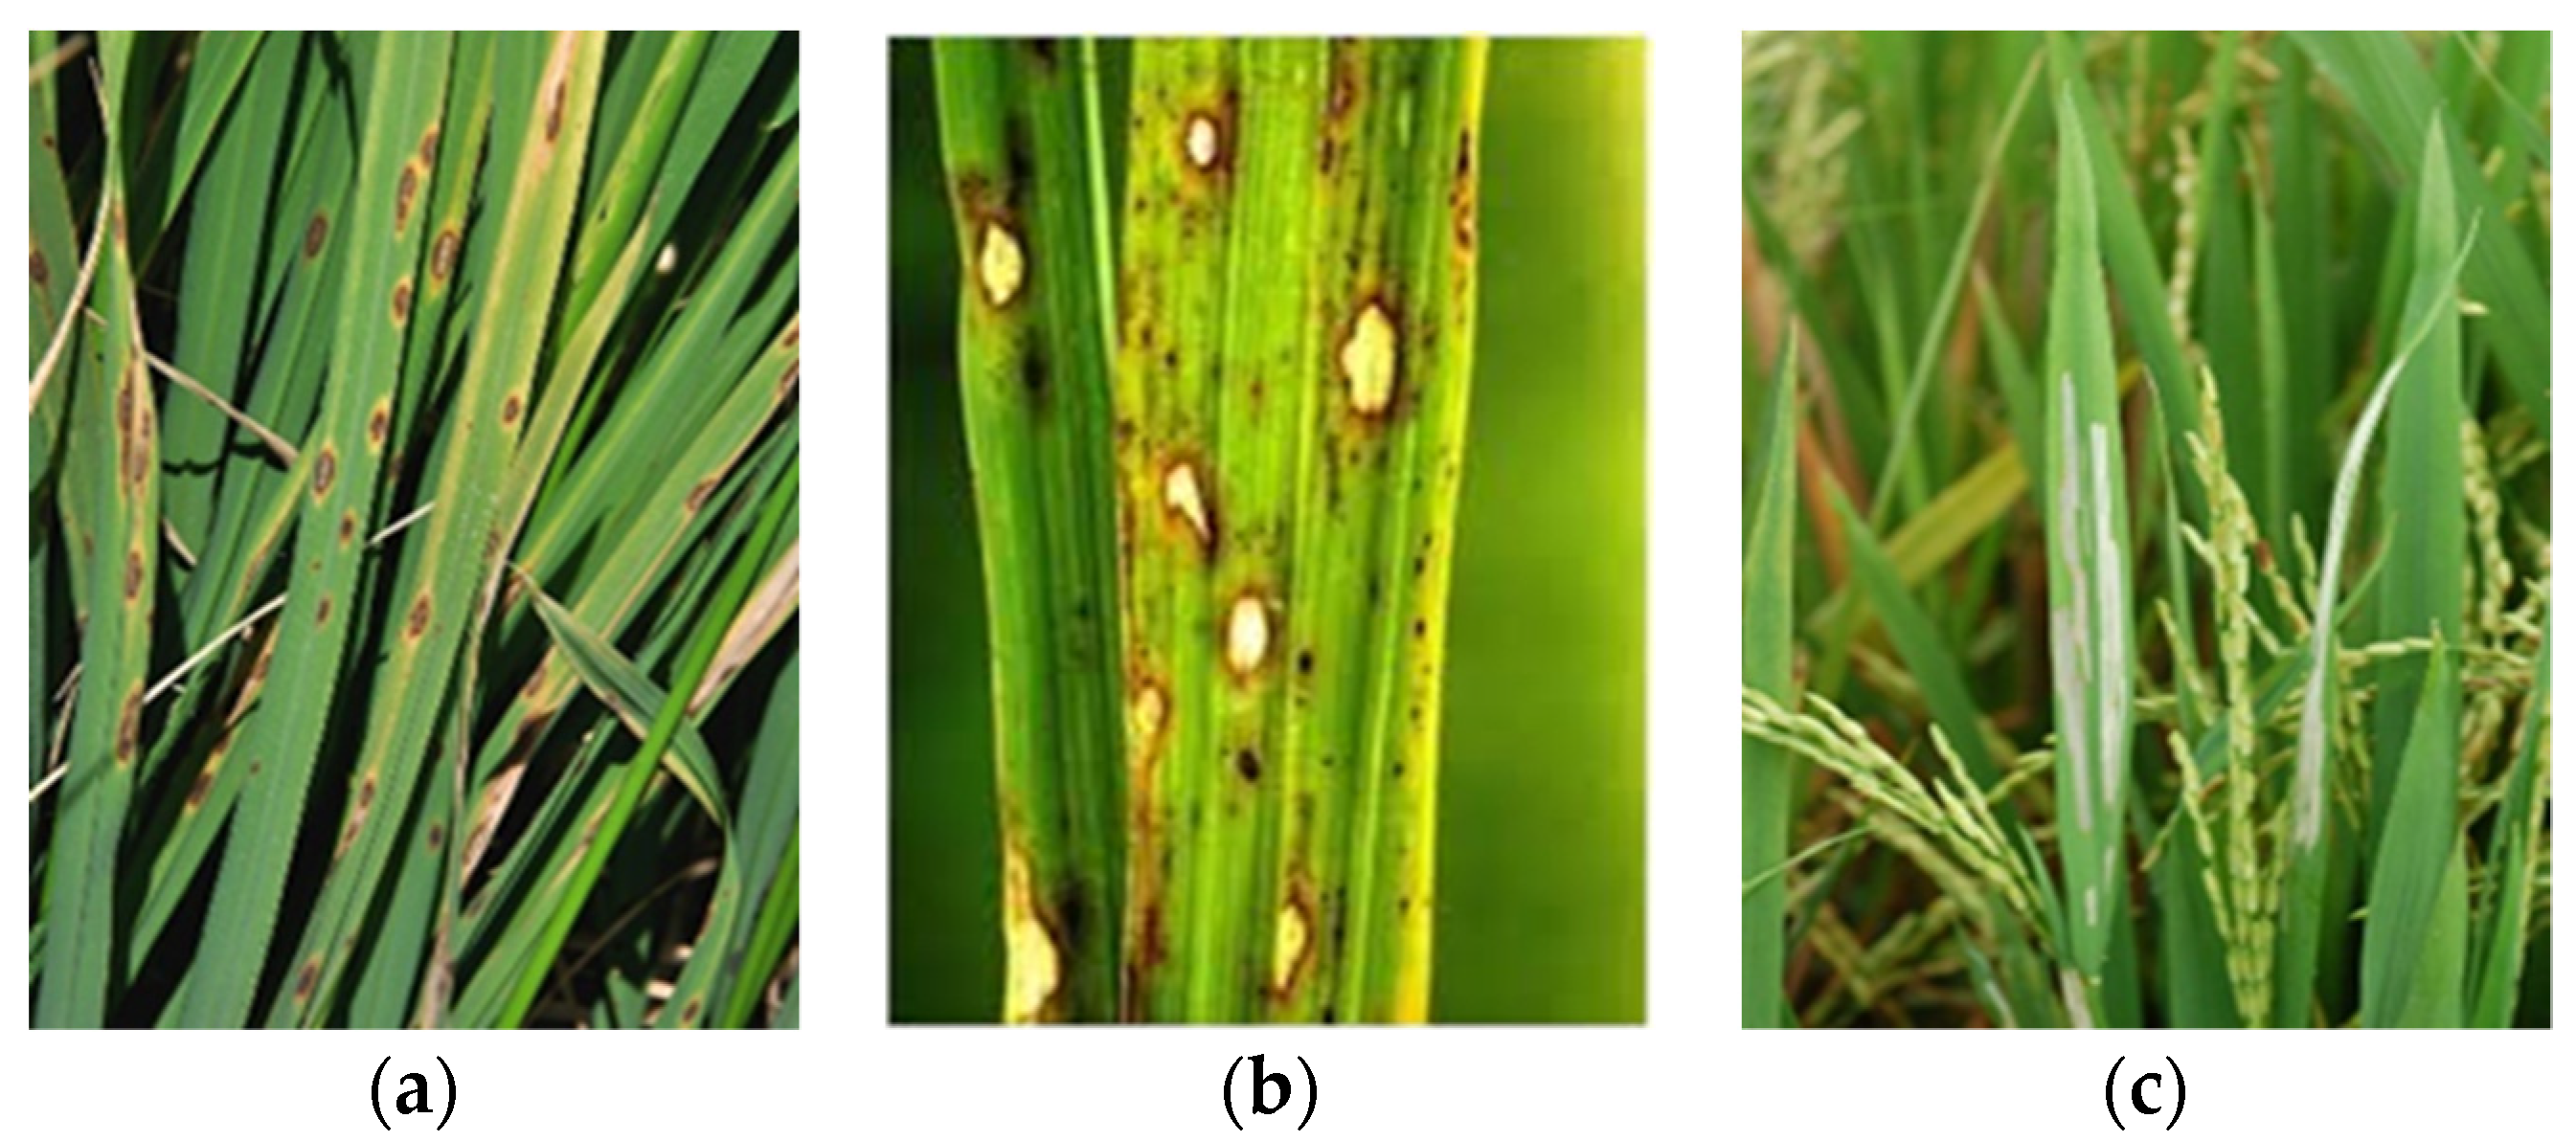
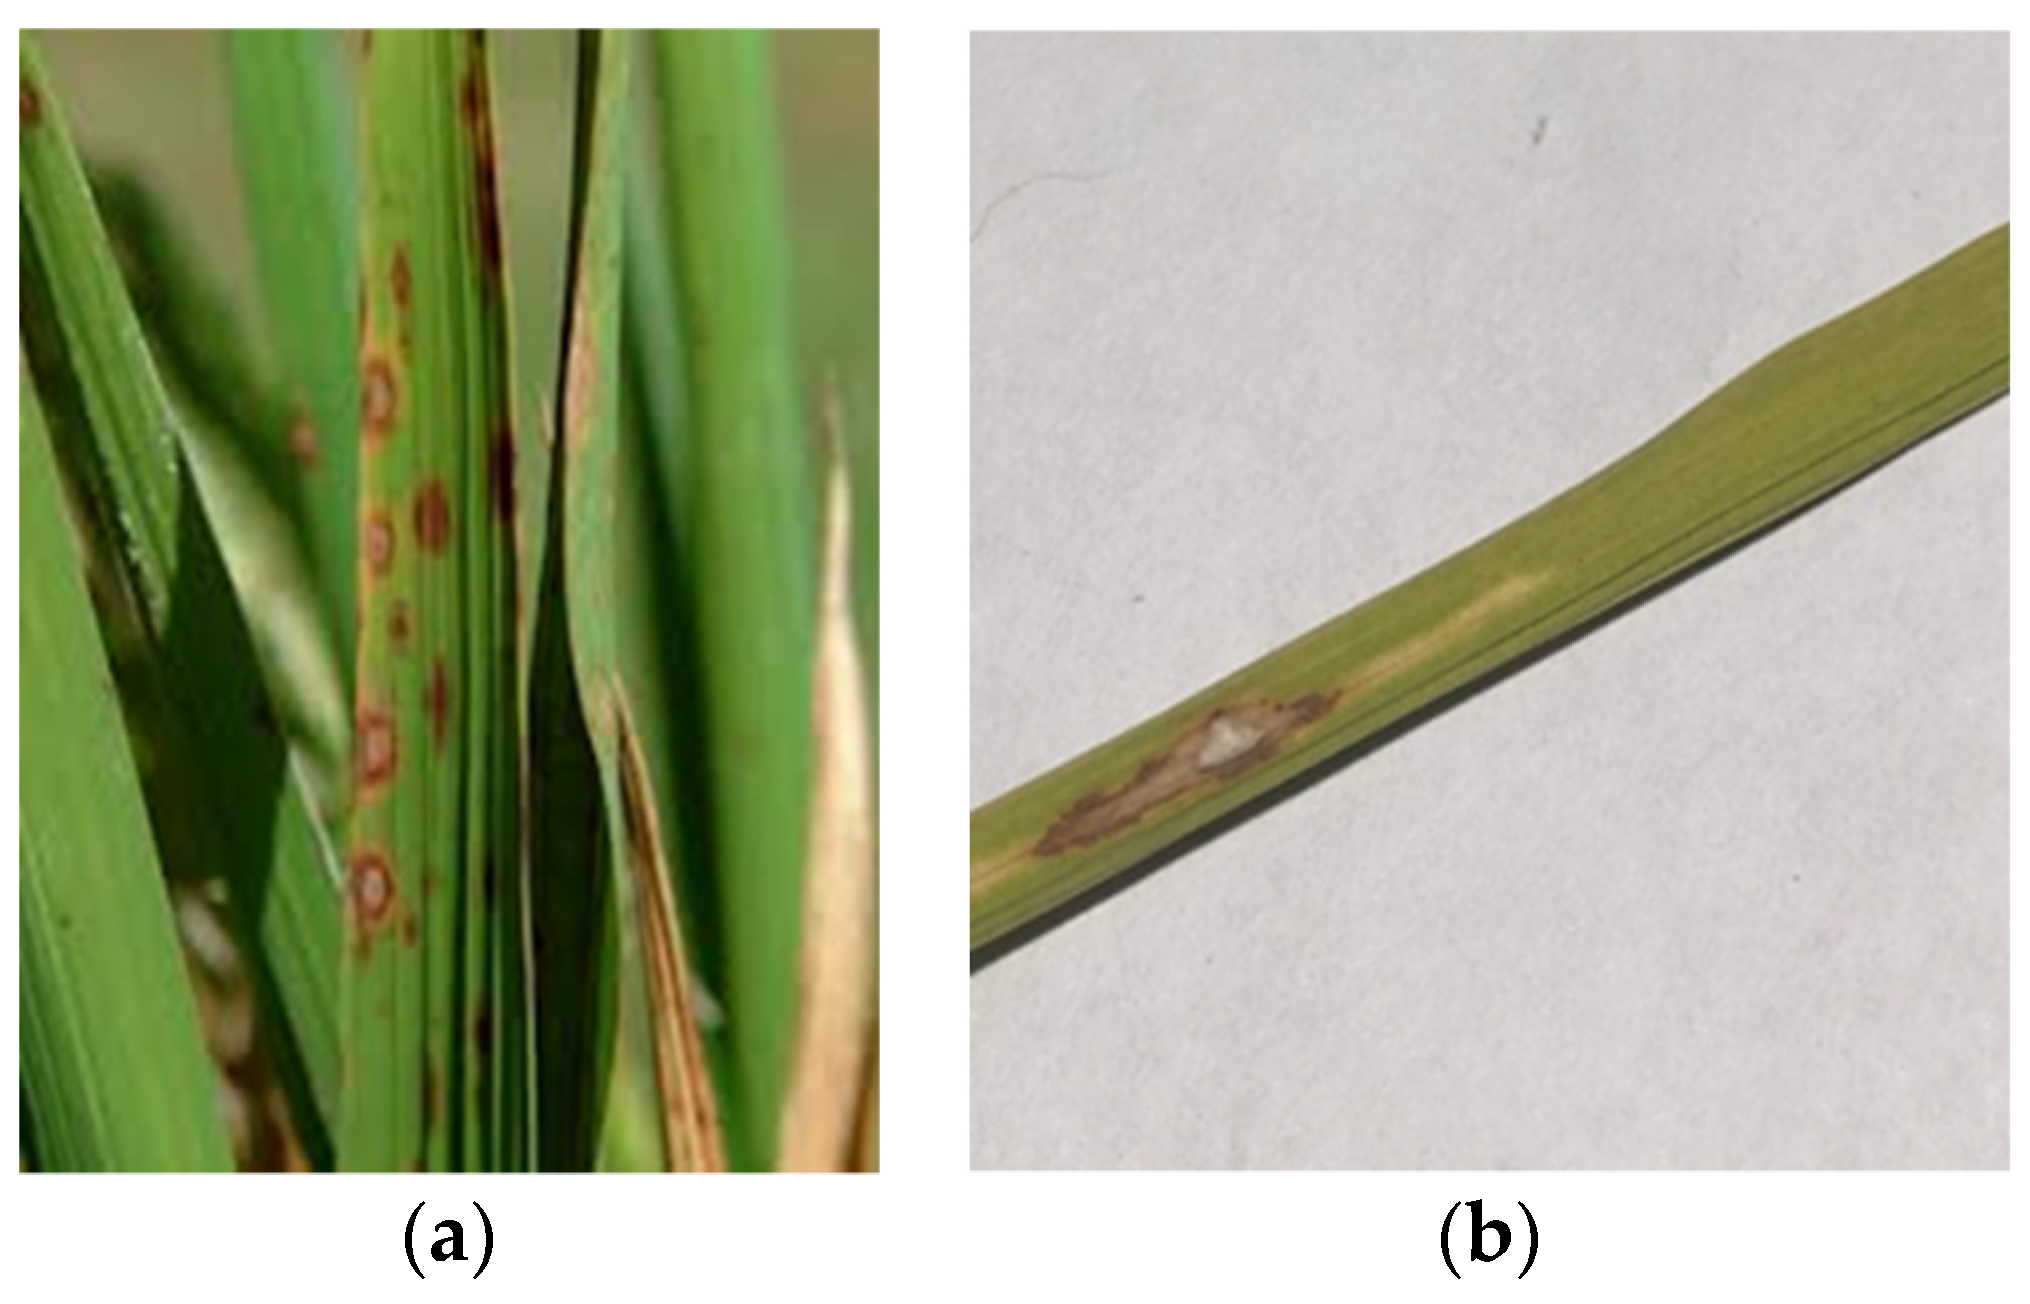
The main diseases generally affecting the paddy crops are brown spot, leaf blast, hispa, sheath rot, rice tungro, and paddy stemborer. Although the proposed work can be employed to detect any of these diseases, for demonstration purposes, the present research work utilises only three diseases (brown spot, leaf blast, and hispa).

1.1.1. Brown Spot

Brown spot, as illustrated in Figure 1a, is a paddy disease caused mainly due to fungi. It infects many parts of plants such as leaves, leaf sheath, glumes, and spikelets. The most easily visible symptom is the presence of big brown spots on the paddy leaves [6]. This disease is common in regions of high humidity and moderate (16 to 36 degrees Celsius) temperatures. Non-flooded and nutrient-deficient soil promotes the growth of this disease. The different identification marks for different stages of this disease are as follows:
  • Seedlings have yellow-brown lesions that may destroy primary and secondary leaves.
  • Lesions can be seen on the leaves, which are originally dark brown or purple-brown in colour, during the tillering stage.

1.1.2. Leaf Blast

Leaf blast, as represented in Figure 1b, is also a fungal disease that can affect all of the parts of rice which are above the ground such as the leaf, collar, node, neck parts, etc. [6]. It is usually seen in areas with low soil moisture, places with long-time rainfall, and comparatively cooler temperatures. The places with high day–night temperature fluctuations cause cooler temperatures and dew formation. Therefore, these places are more prone to leaf blast. The different identification marks for different stages of this disease are as follows:
  • White to grey lesions appears initially, they are accompanied by dark green borders.
  • Lesions on the leaves that are older are oval or spindle-shaped, with grey centres and reddish-brown edges.

1.1.3. Hispa

Hispa, as demonstrated in Figure 1c, is a paddy disease in which the upper epidermis of the leaf is affected, leaving the bottom epidermis unaffected [6]. This disease is prominent in areas with heavy rains and minimum day–night temperature differences for several days. The different identification marks for different stages of this disease are as follows:
  • Presence of irregular white patches. These patches are translucent and are parallel to the leaf veins.
  • Whitish and membranous leaves.
Although all these diseases have visual symptoms, they share similar kinds of visual appearances which makes it extremely difficult to correctly identify the disease by the naked eye, even for an expert. Therefore, it becomes necessary to have an automatic system that can accurately identify and distinguish the diseases by visual inspection. This work can be easily performed by the object detection model developed in the proposed work.

1.2. Related Work

Early and accurate assessment of plant disease has become a pivotal pillar in precision agriculture. It not only helps in reducing the unnecessary wastage of resources but is also capable of providing healthier crop production and mitigating the adverse effects of climate change. However, generally, arboriculturists are not easily and economically available and, even if available the diagnosis depends upon their expertise. On the contrary, the Machine Learning (ML) and Deep Learning (DL) techniques have proven their dominance in complex object detection tasks by identifying the inherited hidden patterns [7]. Therefore, being motivated by this, various existing reported literature utilizes ML and DL techniques for the automatic identification and classification of numerous plant diseases.
Rajmohan et al. [8] have effectively classified the paddy crop disease by employing Convolution Neural Networks (CNN) [9] and Support Vector Machine (SVM) [10] for feature extraction and classification, respectively. The paddy plant diseases as well as the affected region have been successfully identified by incorporating Naïve Bayes [11] and SVM algorithms [12]. Furthermore, SVM has been employed to develop a paddy disease classification framework after background removal and segmentation [13]. Further, the unhealthy leaves have been distinguished and then successfully classified into different classes [14]. Moreover, four object detection models—Faster R-CNN [15], Retina Net [16], YOLOv3 [17], and mask R-CNN [18]—have been compared for the development of LINE BOT to efficiently identify the diseases [19]. In [20], 10-fold cross-validation has been employed to develop CNN based model. Recently, the Jaya Optimization Algorithm (JOA) has been employed to optimize the DL models for this task [21]. Furthermore, the Residual Neural Network (ReNN) and small CNN architecture have been proposed to develop the rice disease classification models [22,23]. A detailed comparison of these models is illustrated in Table 1.
Although the earlier works have achieved promising detection accuracy for the classification of paddy diseases, still there is an adequate chance of false detection which may lead to ill-treatment of the crop. Furthermore, most of them do not have chatbots which may make suggestions to the farmers regarding disease control and those deployed employ remote servers for testing of images. Consequently, they require ample time for the prediction of paddy disease and therefore, are unsuitable for real-time applications.
To effectively handle these issues, researchers across the globe have developed many mobile applications such as Pestoz [24] and Plantix [25] which can be downloaded from Google Play Store. In these applications, the user can take a photo of the diseased plant which is then sent to the diagnosis system. The diagnosing system uses Artificial Intelligence (AI) to process and return the results. The Plantix application supports the identification of pests and plant diseases on over 30 plants. However, these applications do not put emphasis on the current stage of the detected disease and provide general solutions leading to increased recovery time and sometimes, ill-treatment.

1.3. Research Contribution

Under the umbrella of the above-mentioned issues, this work proposes a DL-based mobile application for the detection of paddy diseases. The main reason for making this problem a detection problem is that the leaf may be affected by more than one disease. Therefore, a detection algorithm can give predictions about multiple diseases the plant is suffering from, with the affected area and their type which can enable the farmer to cure their paddy of multiple diseases at a time. The current work employs the two fastest versions of YOLO (YOLOv3 tiny [26] and YOLOv4 tiny [27]) for the development of a DL-based object detection framework. The developed models have been compared against each other to endorse their efficacy and after that, the foremost model has been used for the development of the proposed mobile application.
The proposed mobile application also supports a 24 × 7 chatbot to help farmers with the medicines and pesticides for their diseased crops. The chatbot also helps with the prevention of the disease by assisting farmers on a daily basis. It can answer queries ranging from basic preventive tips to suggesting specific pesticides depending on the infection stage of the detected disease. With this mobile application, farmers living in remote areas having fewer facilities are provided with tools; these tools can increase their production by monitoring and improving the health of their paddy crop.
Conclusively, the objective is to improve the existing accuracies while making sure that the user gets a proper solution according to the stage of infection. To achieve this goal, this research work makes the following key contributions:
  • Developed a mobile application (E-crop doctor) that uses a deep learning-based object detection method to detect diseases in paddy plants and suggests prominent ways to cure them.
  • Developed a user-friendly chatbot (docCrop) to help and assist the farmers 24 × 7.
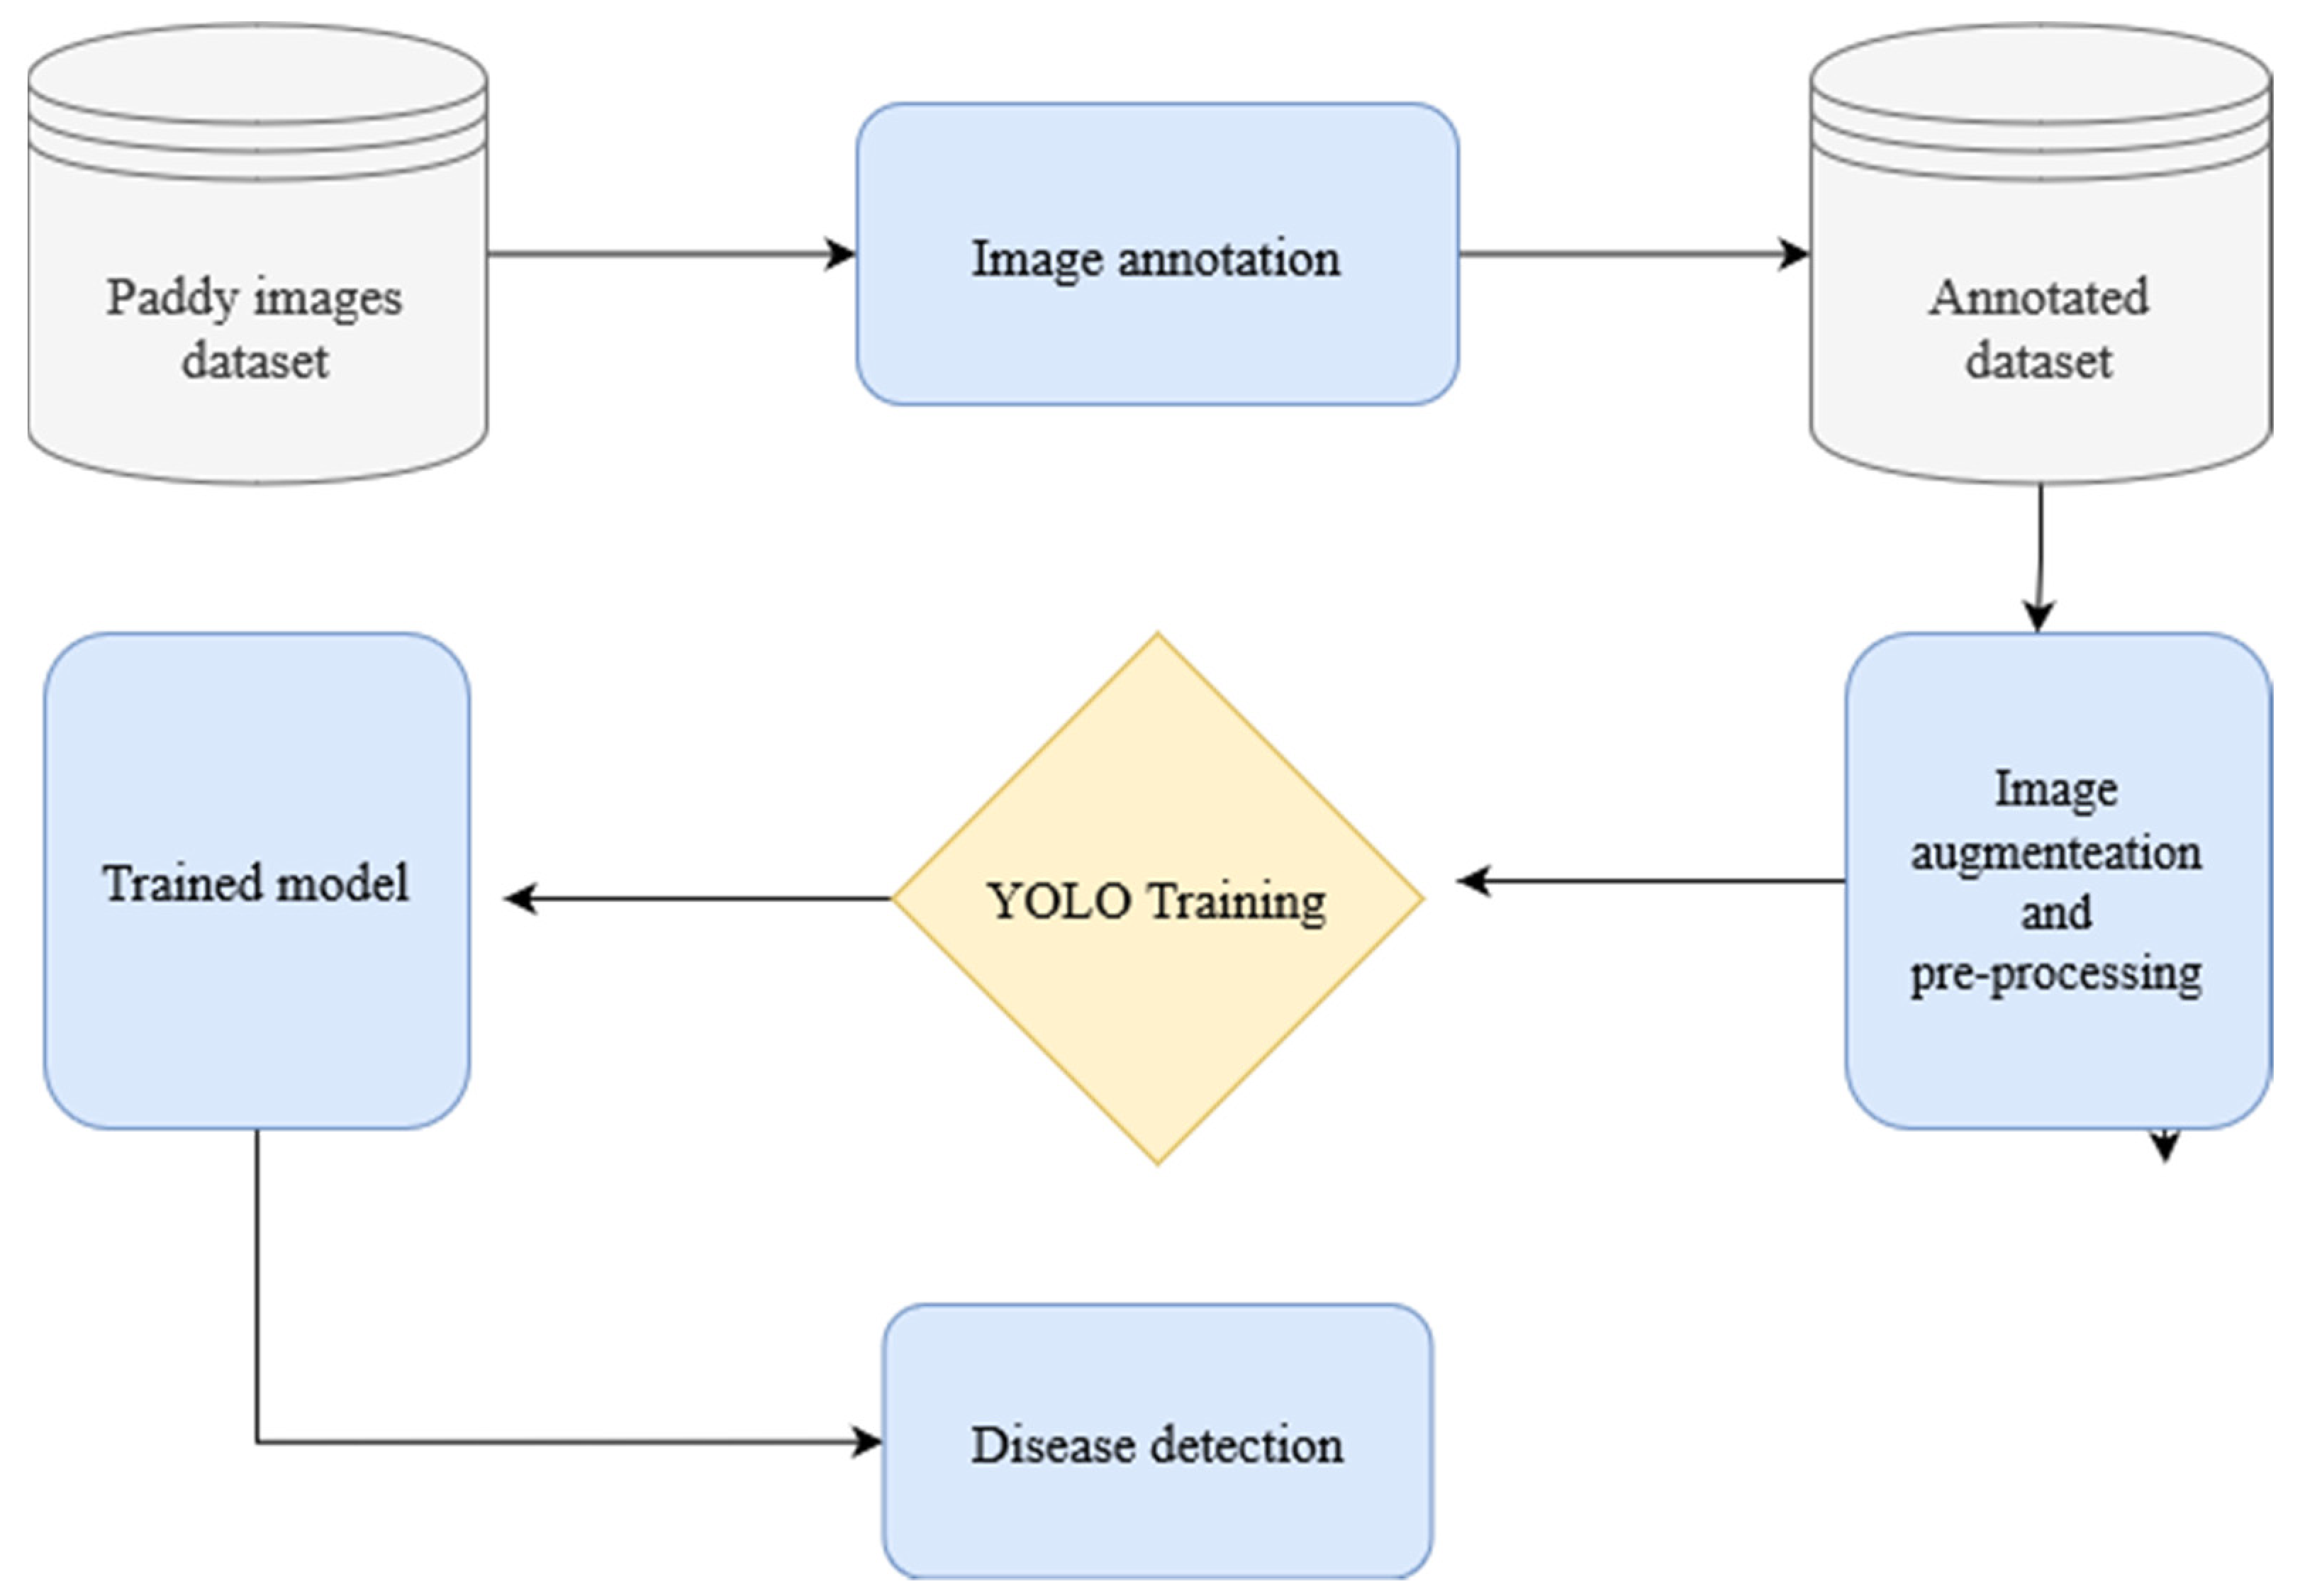
The rest of this work is laid out as follows: Section 2 describes the dataset being developed for this study. Section 3 presents the proposed methodology with the development process of a smartphone application. The experimental results are provided in Section 4. Finally, Section 5 concludes the current work with concluding remarks.

2. Dataset

2.1. Image Acquisition

For the present research work, images (in jpeg format) of diseased paddy crops have been collected by employing web mining techniques using keywords such as life blast, brown spot and hispa. The images that have been collected are of two types and could be categorized as
  • On-field images
  • Laboratory images
The on-field images are directly taken by farmers, botanists or tourists from the farms where these crops are grown whereas, the laboratory images are the images captured in the plants’ unnatural environment, i.e., in labs where the diseases of the plants are being studied. Samples of these images are represented in Figure 2a,b, respectively.

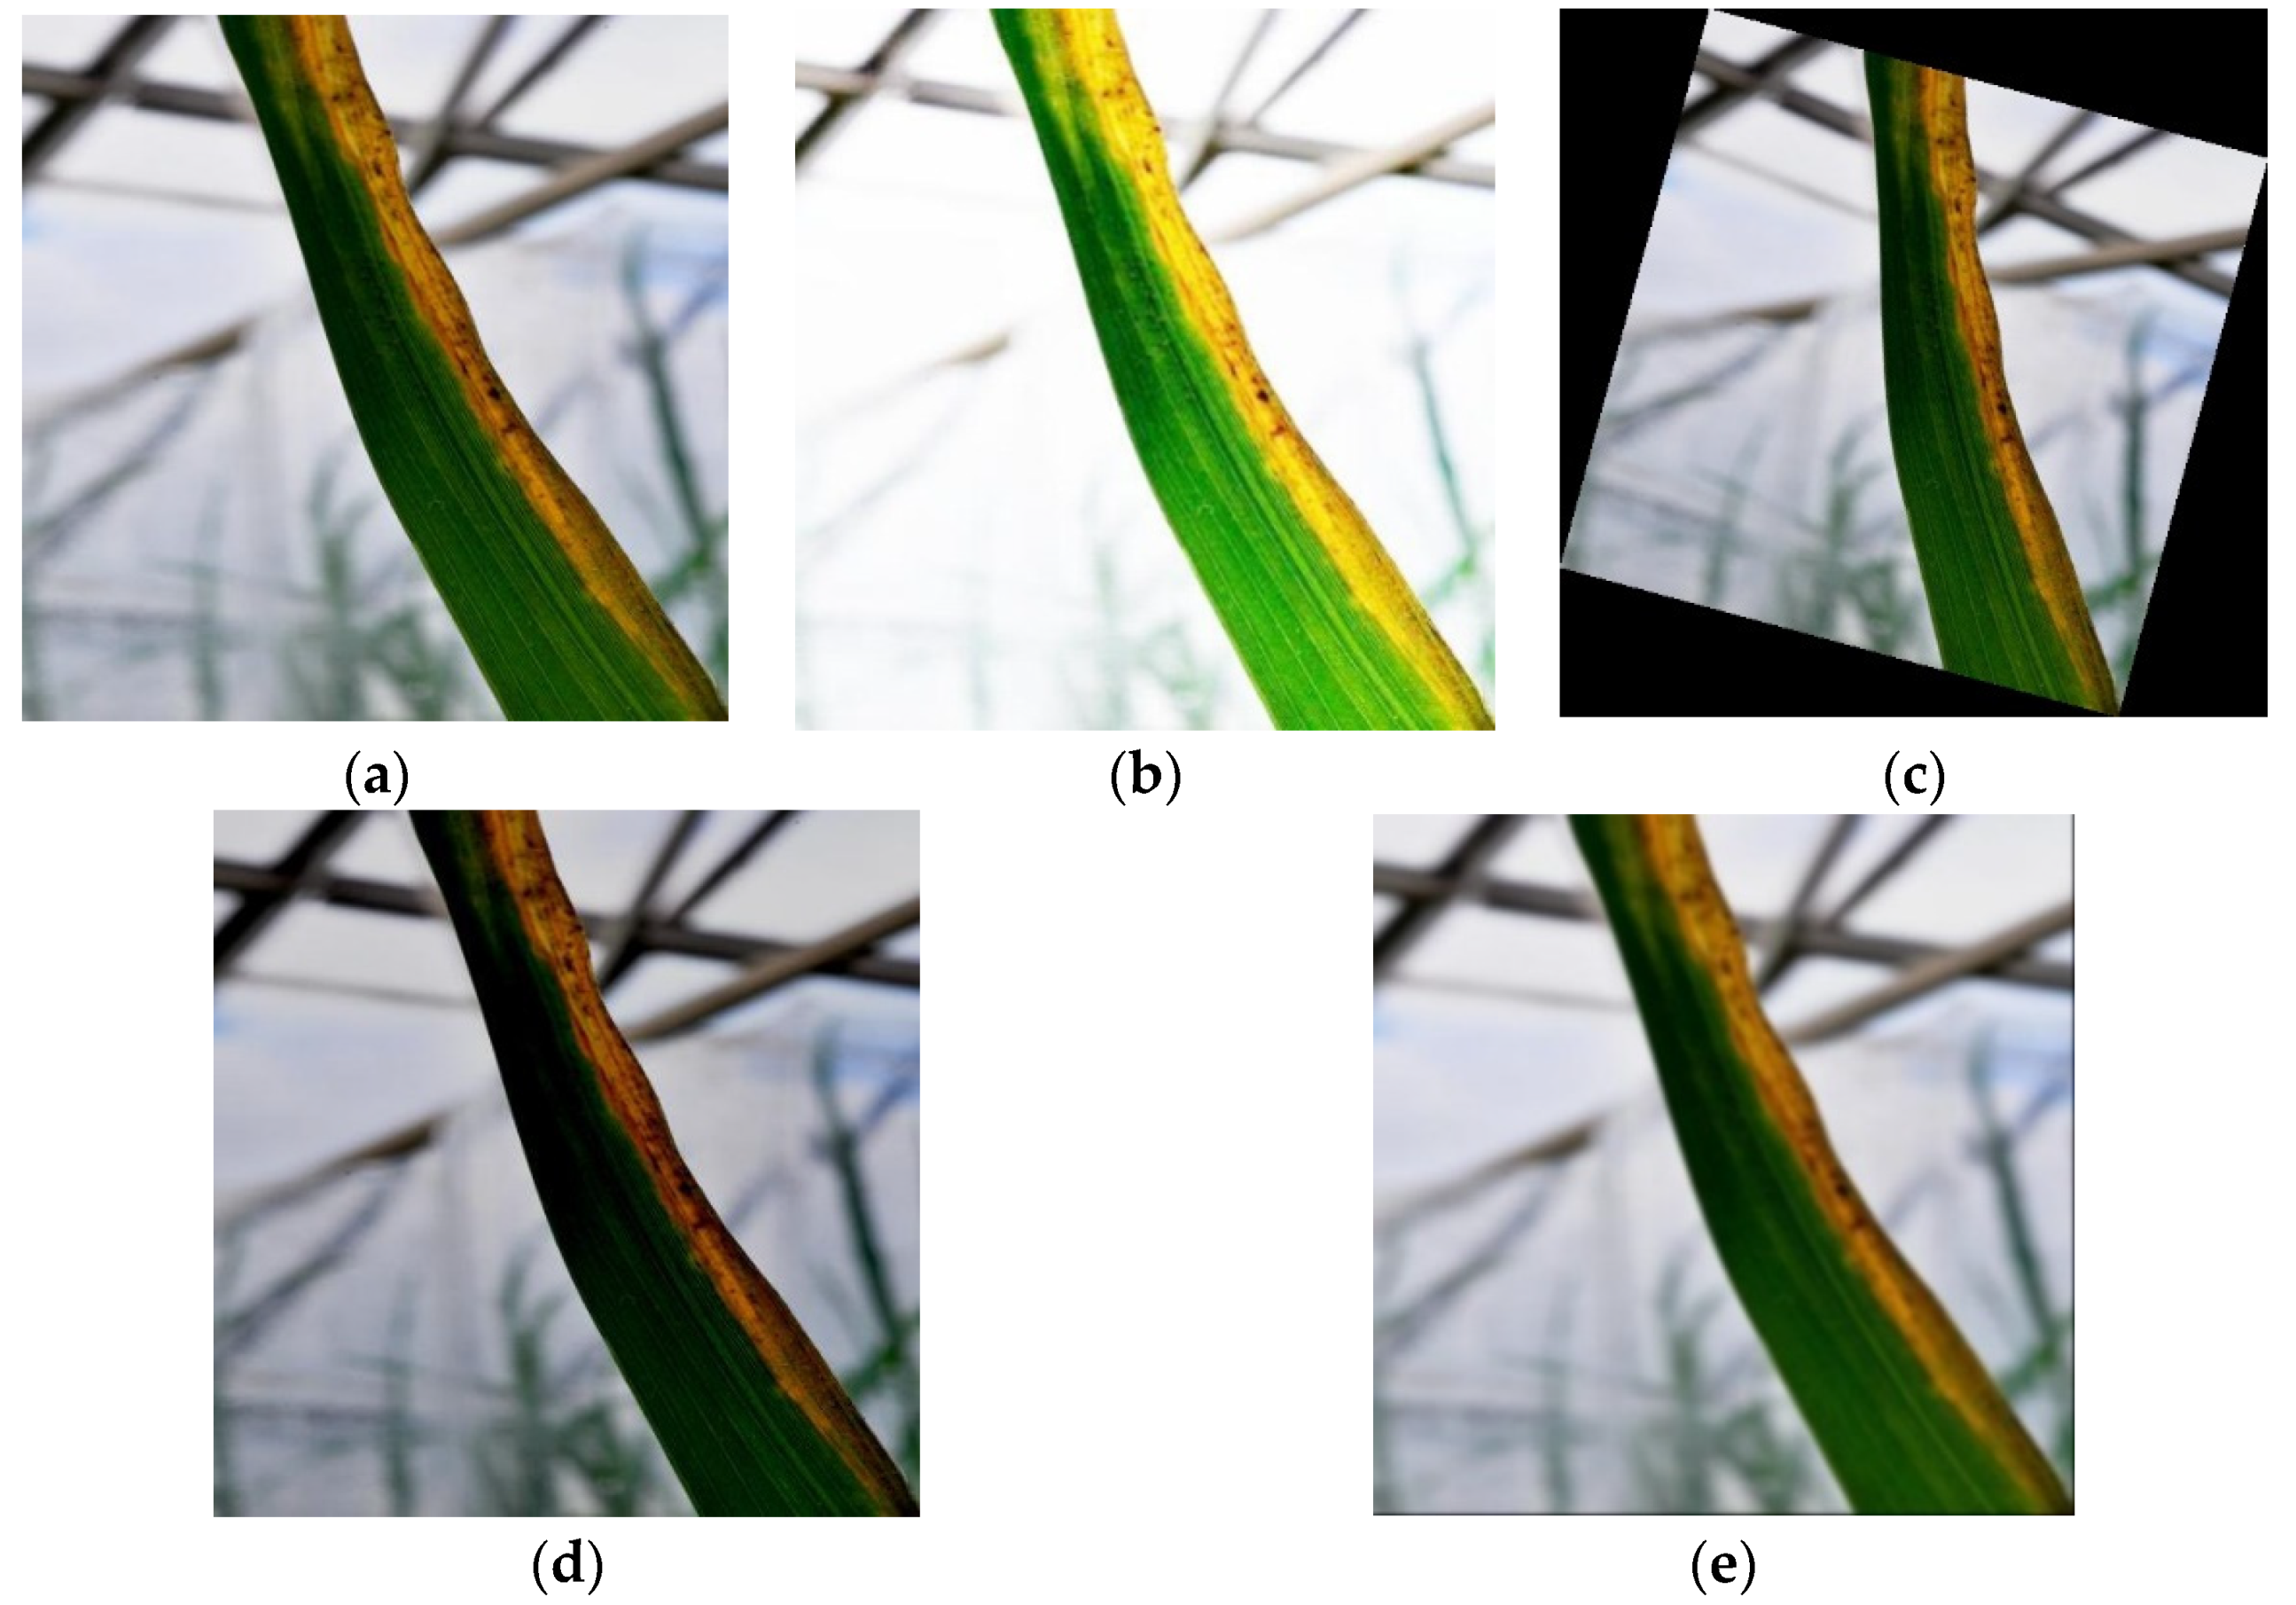
2.2. Data Augmentation and Pre-Processing

The DL algorithms are data-hungry and hence, there is a need of augmenting them. Image data augmentation is a technique for artificially increasing the size of a training dataset by modifying existing images slightly according to specific parameters [28]. More data can be used to improve the results of the models based on neural networks. This improves the model’s ability to generalize well and fit on images they have not seen yet.
Data augmentation is also required because it is not possible to collect every type of image data. For a model to perform well, it needs to have trained data distribution similar to the test data distribution which can be performed using data augmentation. The parameters that were used for data augmentation and pre-processing are listed in Table 2. Further, for more clarity, the sample images after data augmentation and pre-processing are illustrated in Figure 3 after utilizing the mentioned parameters in Table 2.
  • Auto Orientation: This pre-processing step was used to make all the images orient in perfect vertical orientation because YOLOv3 tiny has an orientation adaptation problem [29].
  • Resizing: Resizing is performed to make all images compatible for training YOLO models; this is included in pre-processing steps.
  • Blur: Blurring was used to pixelate the images because in real-life situations the farmers might not have cameras with the capabilities to capture in high definition.
  • Exposure change: Exposure changes were made keeping in mind the real-life conditions where the weather might be sunny, cloudy or the time of capturing the image might be early in the morning or in the late evening hours.
  • Rotation: This was conducted to remove any constraints in maintaining orientation while capturing the image.

2.3. Image Dataset

The primary focus of the current work is on the accurate detection of three diseases—leaf blast, brown spot, and hispa as presented in Section 1.1. Therefore, the image dataset consists of 3 different classes. For labelling these images, LabelImg [30] (running on python version 3.6 on windows 10) was used and the text files compatible with YOLO architecture were generated. These files included the label of the class and the coordinates of the bounding boxes that were marked on the image, i.e., the ground truth values. There are many cases in which a single image consists of multiple instances of a particular disease. Therefore, even if the dataset contains a smaller number of images, there are ample numbers of instances of each class (disease) for the model to learn correctly.
The dataset consists of 762 images and while preparing the dataset, caution was taken to avoid the problems of the unbalanced dataset. The prepared dataset was disease-wise divided into the ratio of 90:5:5 by employing the random split technique. Therefore, the brown spot disease has 248, 13, and 14 images for training, testing, and validation, respectively. The dataset has 206, 11, and 12 images for hispa disease whereas, the leaf blast disease has 232, 13, and 13 images for training, testing, and validation, respectively. For better clarity of the dataset, the number of images along with the number of instances with training, validation, and test images for each class is tabulated in Table 3 whereas, the distribution of the number of images and instances per class is illustrated in Figure 4.

3. Methodology

The proposed solution is divided into two parts, firstly identifying the best models for the detection of the diseases and then deploying it on the mobile application consisting of an easy-to-use interface and chatbot for help.

3.1. Rice Disease Detection Using Deep Learning Models

After collecting the dataset consisting of three classes (brown spot, leaf blast, and hispa), data annotation has been conducted to produce the ground truth values. Then data augmentation and pre-processing techniques have been applied to train the model with 90% (686), 5% (37), and 5% (39) images for training, validation, and testing, respectively. Further, though YOLOv3 and YOLOv4 provide very good detection accuracy, they cannot be deployed on mobiles with low computational power because of their large network size. Therefore, in the present investigation, their tiny versions have been employed for the development of the mobile-based rice disease detection model. The training dataset is fed to both YOLOv3 tiny and YOLOv4 tiny architectures separately. The training was performed for 6000 epochs and the time taken for training each model was about 3 h on Google Colab (Tesla T4). The whole methodology is illustrated in Figure 5.
The parameters of the configuration files for both the models are listed in Table 4 which indicates that the maximum number of batches was set to 6000 whereas steps to 4800 (80% of batches) and 5400 (90% of batches). The configuration file was modified according to the input dataset and therefore, the number of filters has been computed as 24 ({number of classes + 5} × 3). Additionally, pre-trained weights of YOLOv3 tiny (yolov3-tiny.conv.15) and YOLOv4 tiny (yolov4-tiny.conv.29) trained on the COCO dataset were used as the base weights, which were further trained for the development of rice disease detection model.

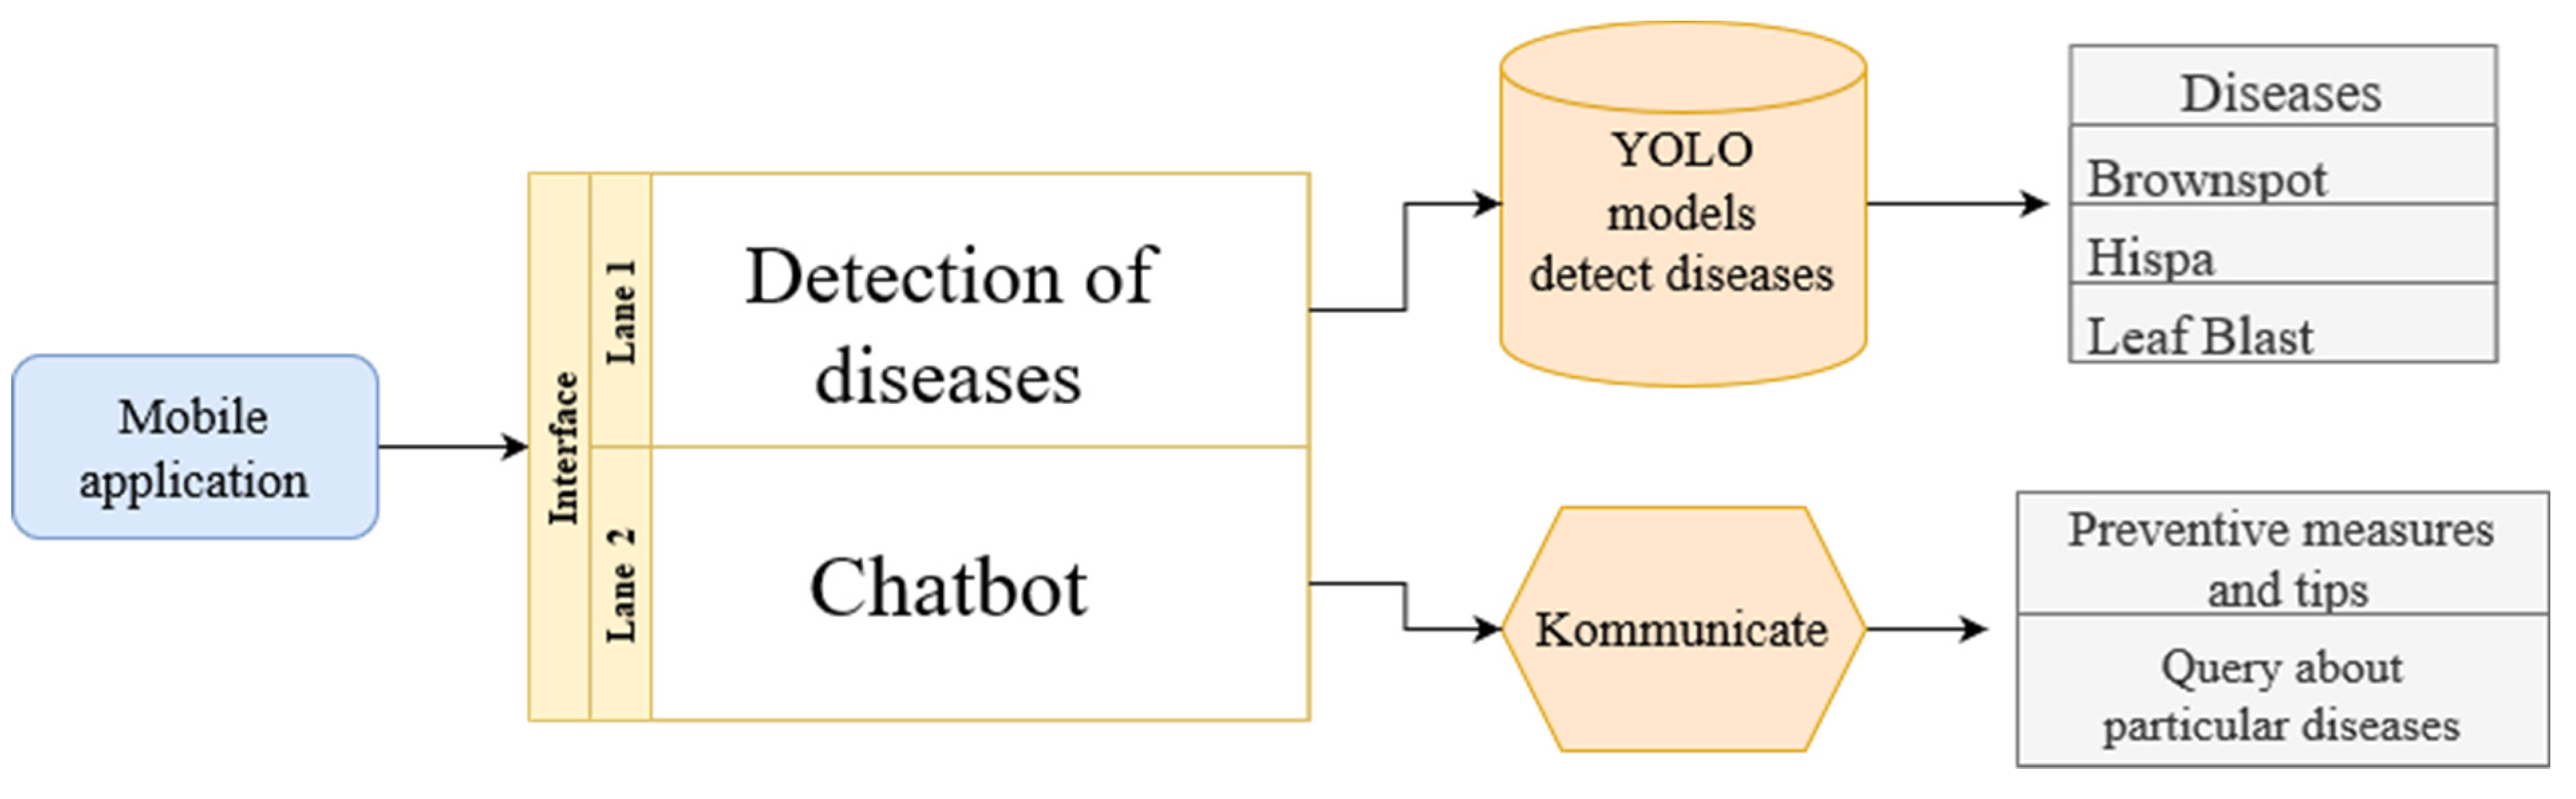
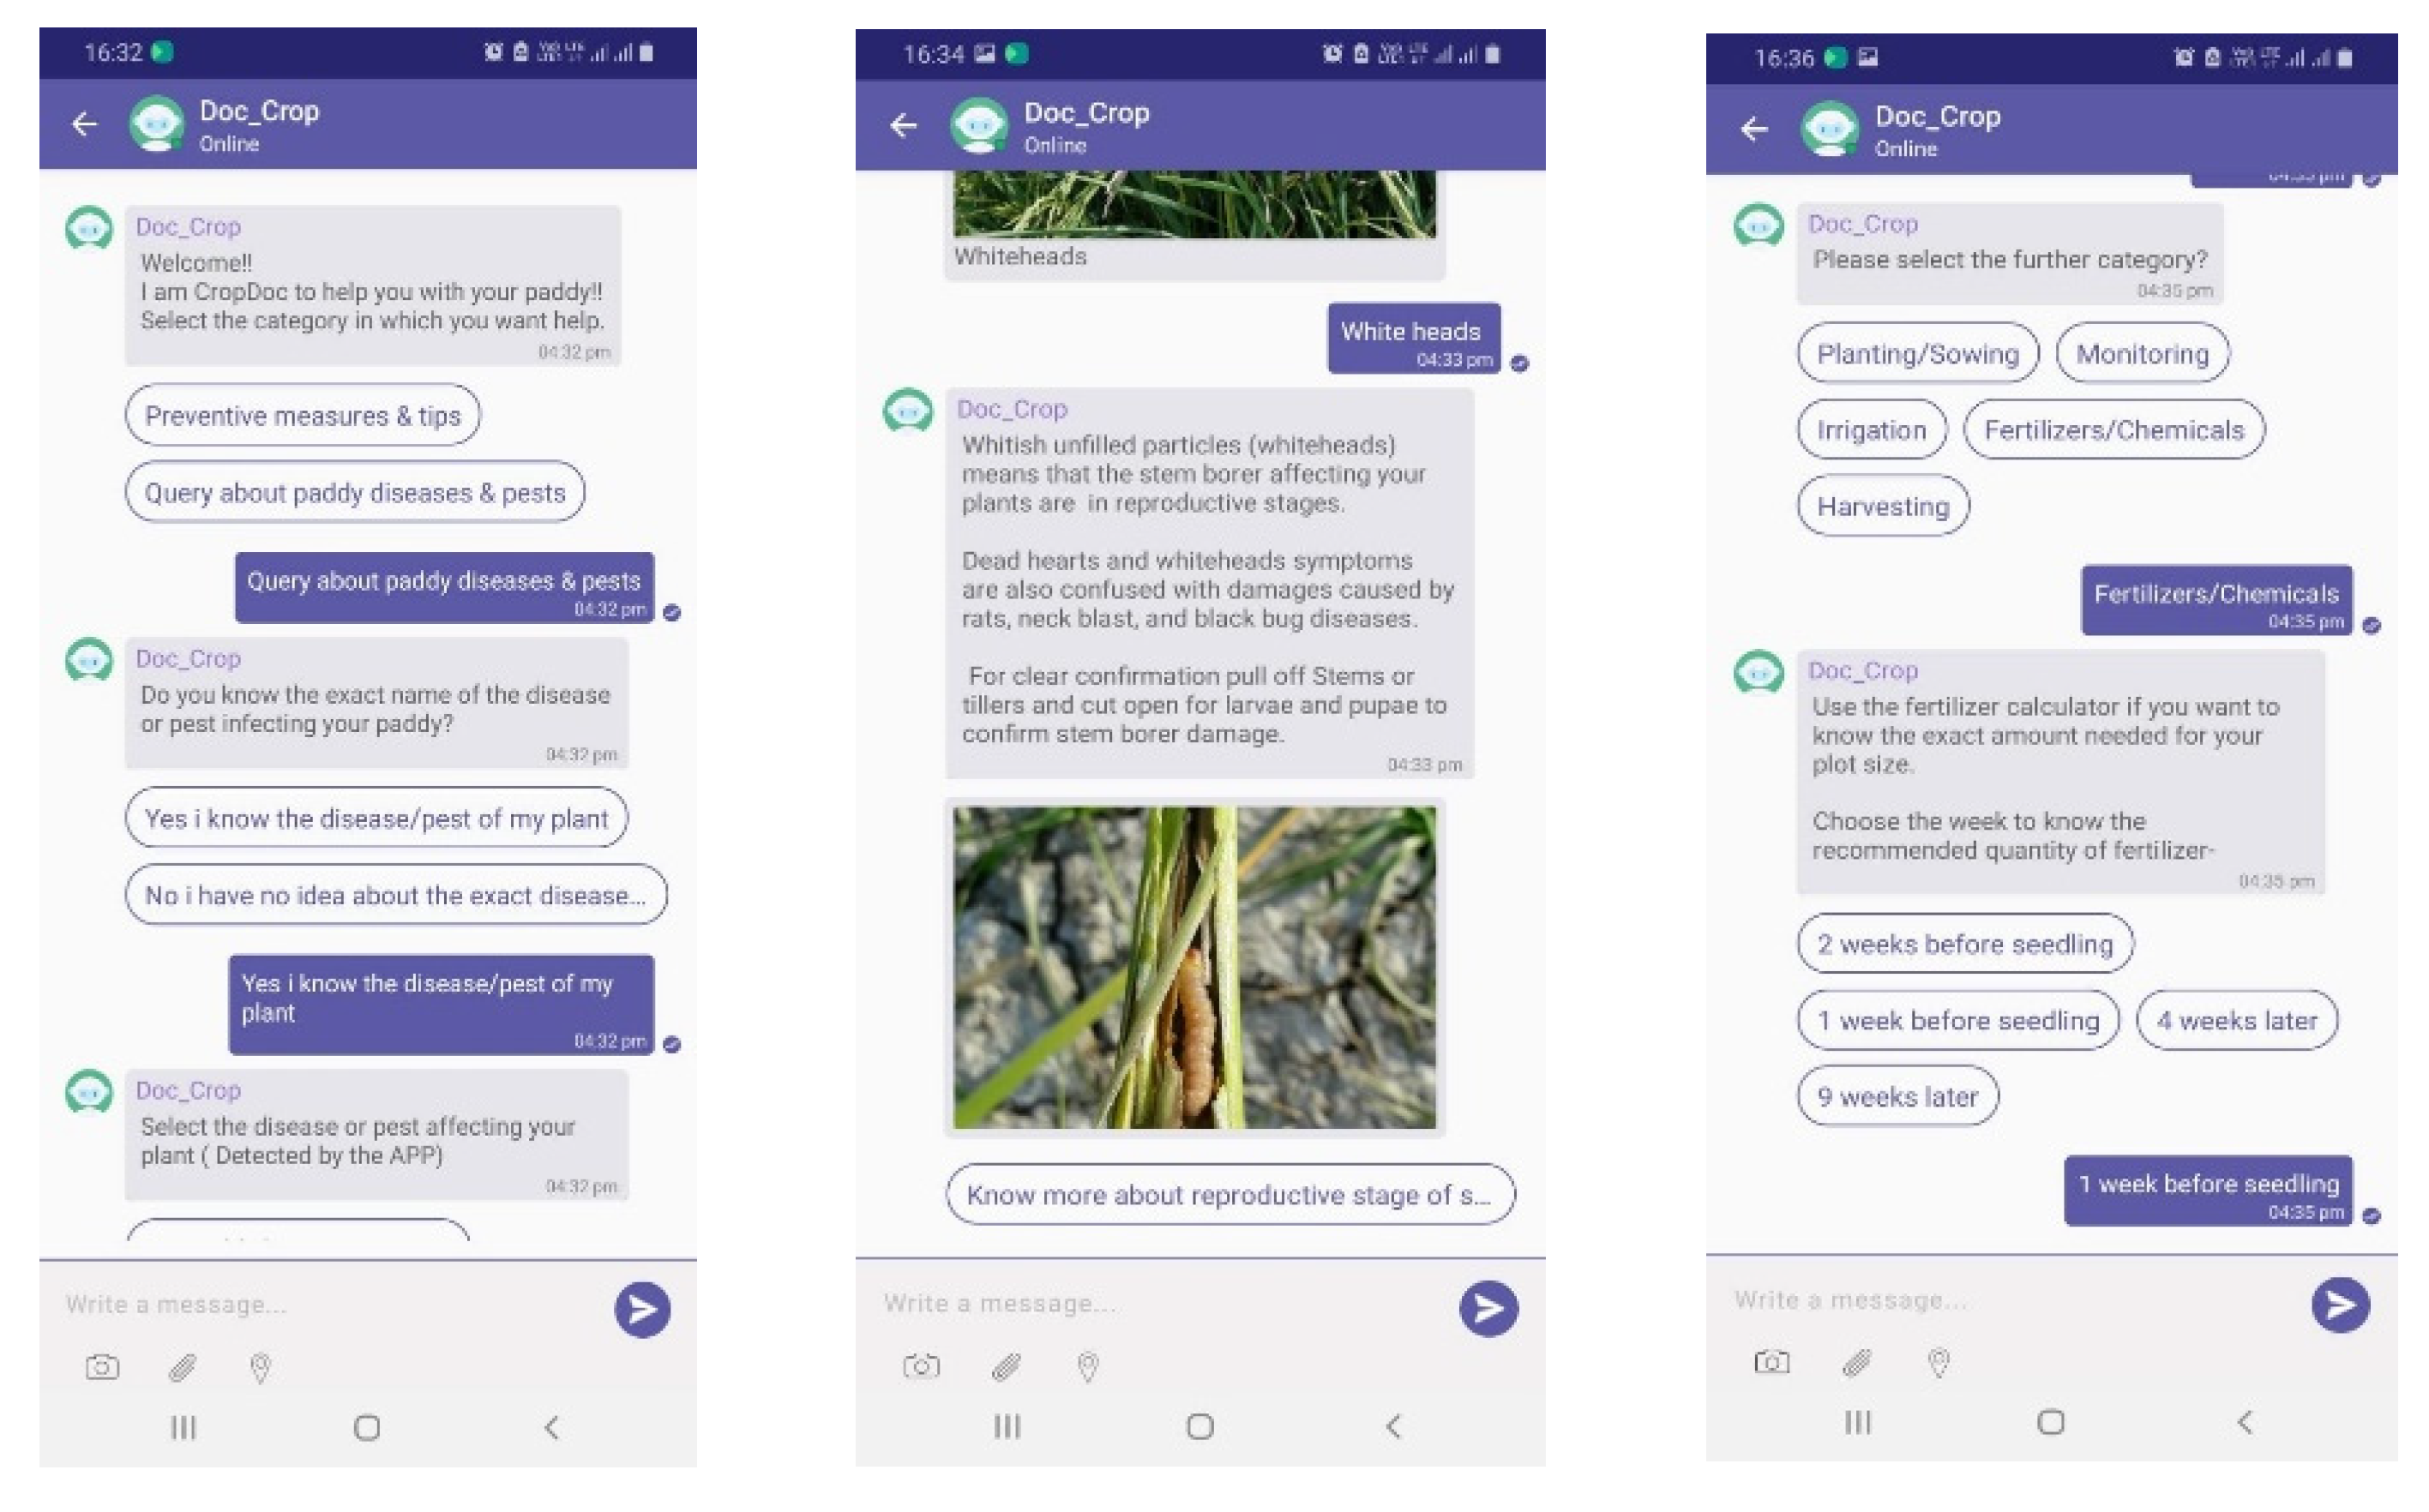
3.2. Development of Mobile Application (E-Crop Doctor) with the Chatbot (docCrop)

The best model from the above step was deployed on a mobile application created using android studio. The model obtained above was first converted to a pb model and then to a TensorFlow lite version of it. TensorFlow lite is a less heavy version of the TensorFlow framework, especially developed to enable an on-device machine learning interface. It has decent performance and less binary file size, hence suitable for mobile applications. Since the model is deployed locally on the device, therefore, there is no need for network coverage while detection which is a common issue in most villages.
The farmers need to install the application on their devices to get started. They can directly point the camera towards the affected area of the leaf to get predictions about the disease the plant may be suffering from. Once in the frame, the algorithm detects the disease in real-time and informs the farmer about it. They can then see the detailed analysis report about the particular disease and check out the ways to cure it. They can clarify doubts regarding the stage of infection of the disease, the treatment procedure, and quantity of the medicine required, etc., through the chatbot 24 × 7. This reduces the visits to the plant doctor and also reduces the treatment cost of the crops for the farmer. The process flow of the mobile application (E-crop doctor) is presented in Figure 6.
The chatbot (docCrop) was built using 3rd party API, Kommunicate [31]. The chatbot was trained to answer a certain set of queries solving most of the common problems as well as problems specific to the rice diseases. Firstly, the chatbot asks the farmer whether they want to know about general preventive tips or ask a query about a particular disease prediction. To make the conversation easier, certain options related to the farmer’s query are suggested by the chatbot at each step to better understand the problem and provide specific solutions. Figure 7 illustrates some examples of how the chatbot responds to queries. The mobile application is developed in such a way that the farmers can use it seamlessly without any difficulty.

3.3. Evaluation Metrics

For comparing the performances of the selected models, various metrics, in particular, precision (P), recall (R), F1 score, AP, mAP, and IoU, are used [32,33,34]. These metrics are mathematically represented by Equations (1)–(6).
P = t p f p + t p
R = t p f n + t p
F 1   s c o r e = 2 P R P + R
A P = 0 1 p ( r ) d r
m A P = 1 N i = 1 N A P i
I o U = A r e a   o f   o v e r l a p A r e a   o f   u n i o n
where, t p = Number of True Positives, i.e., number of objects detected correctly; f p = Number of False Positives, i.e., number of detected items that could not correlate to the ground truth objects; f n = Number of False Negatives, i.e., number of ground truth objects that could not be detected.

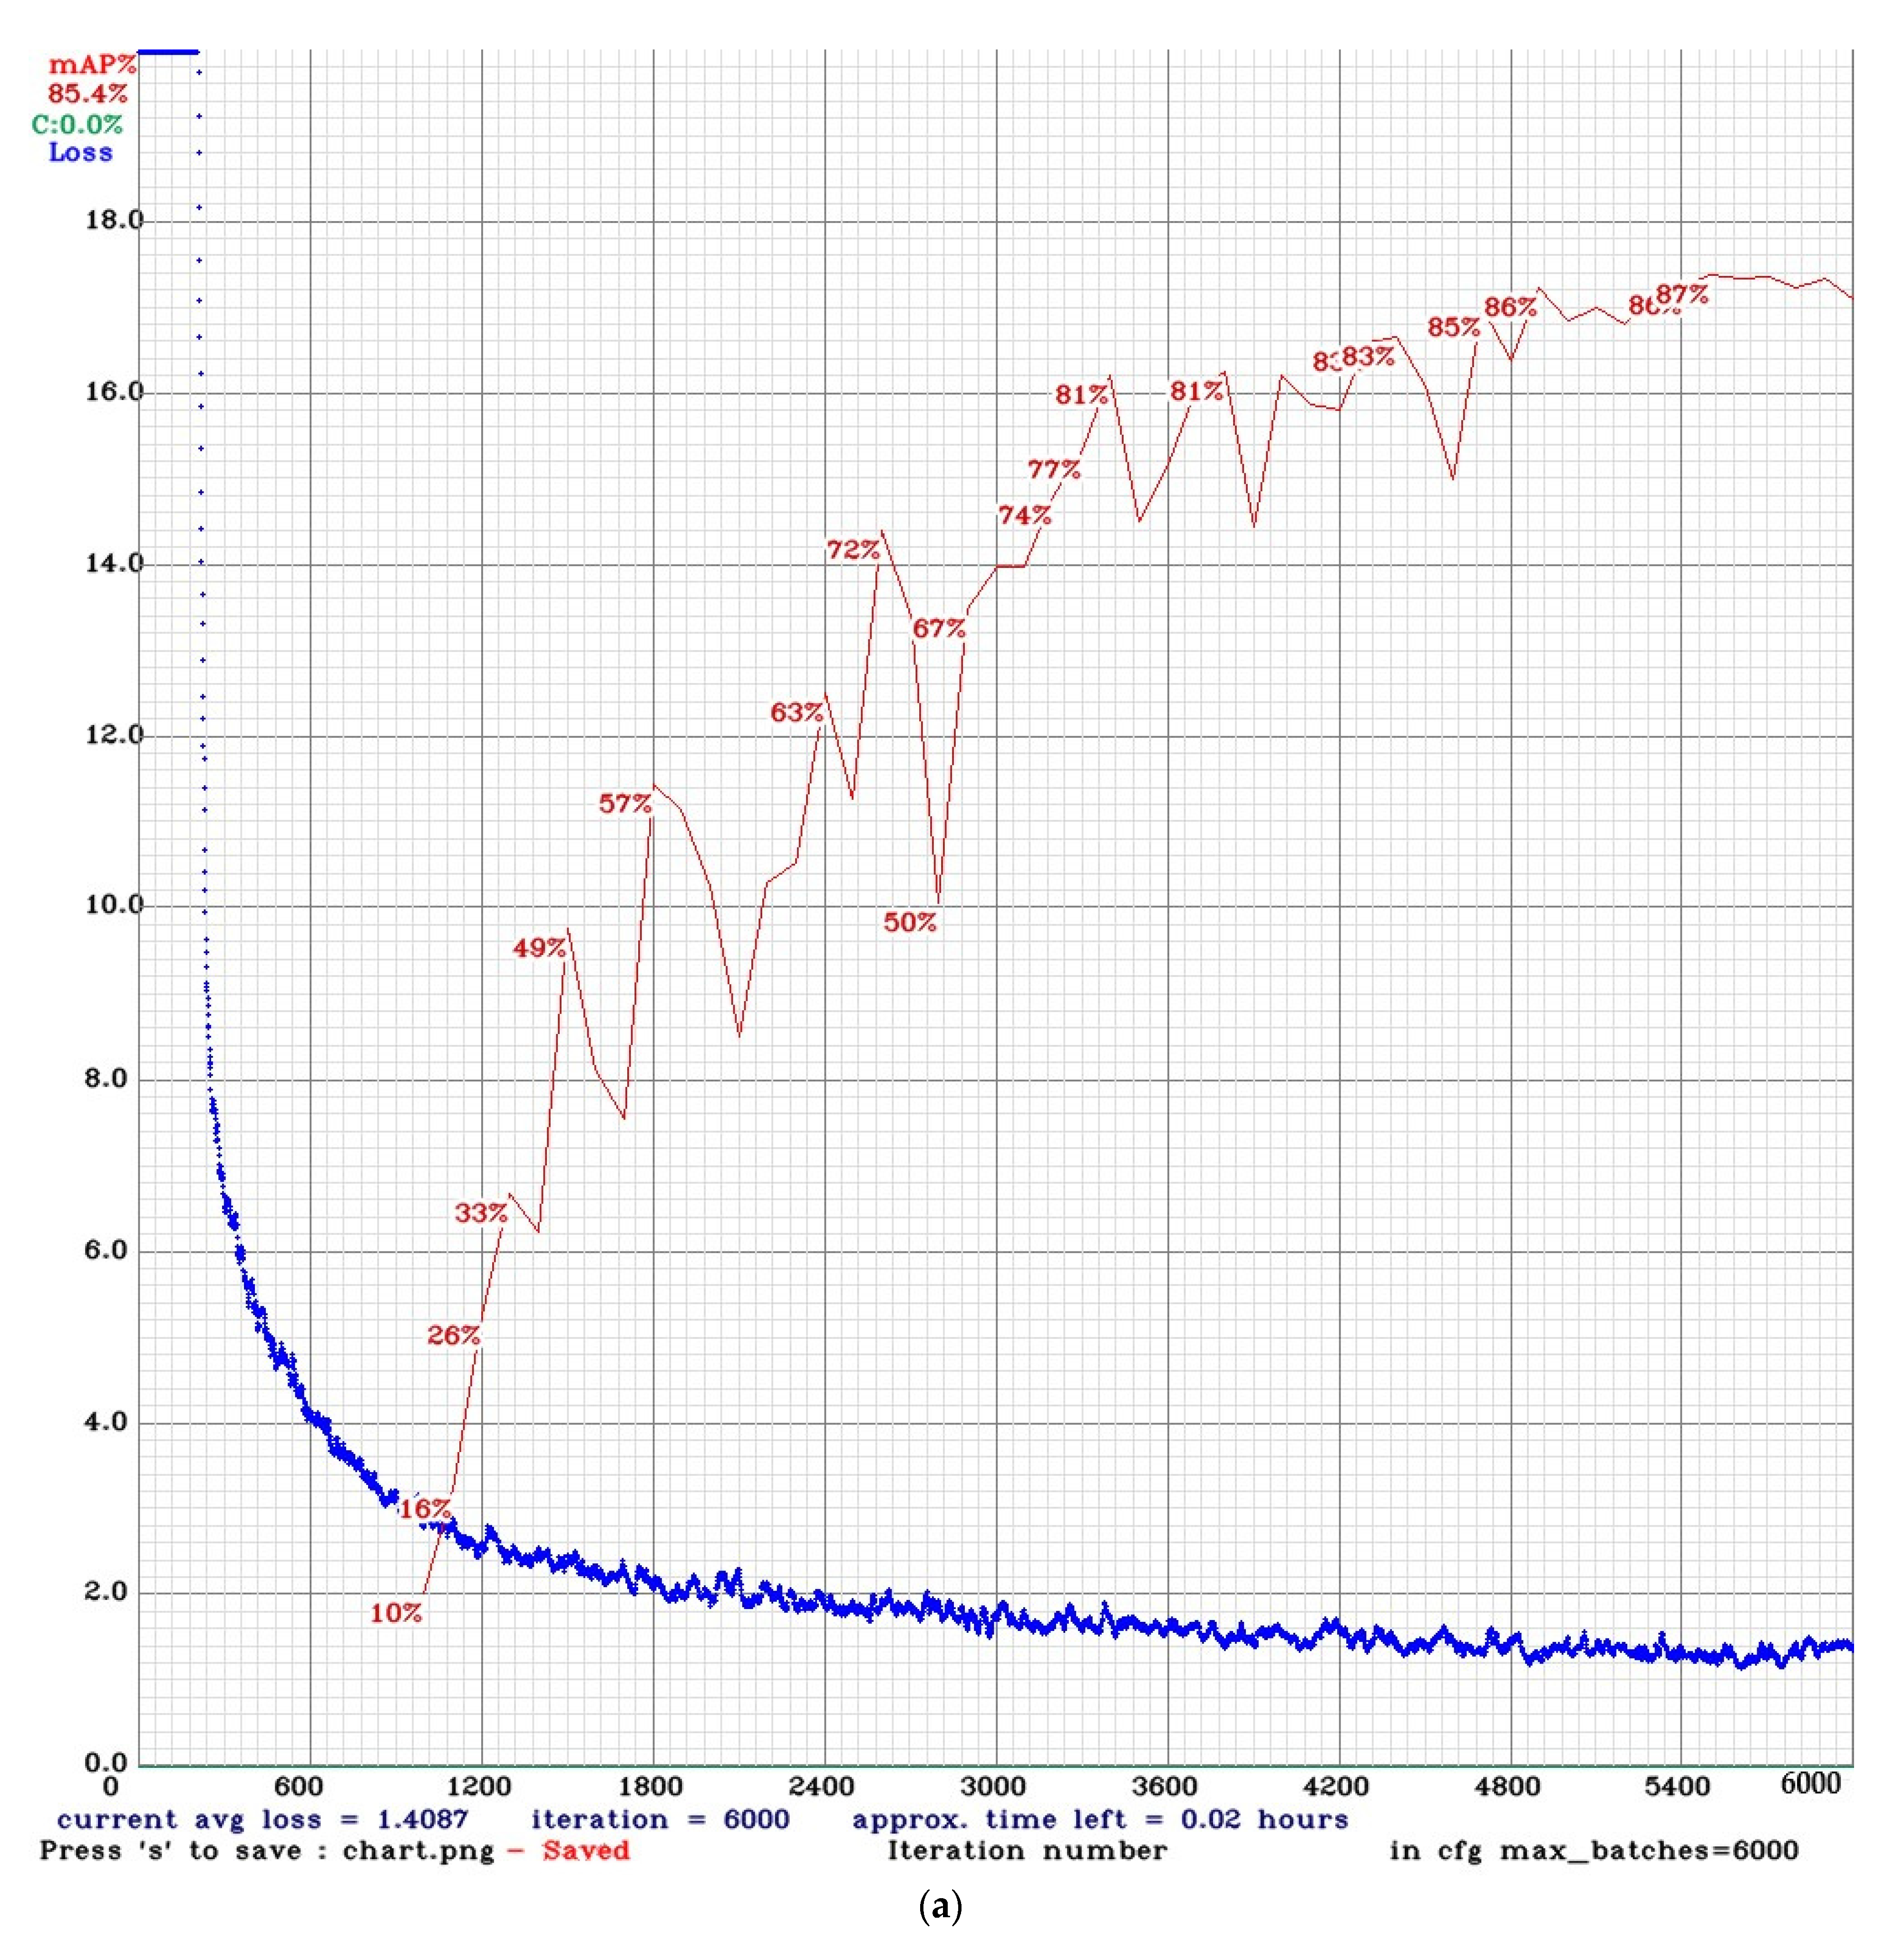
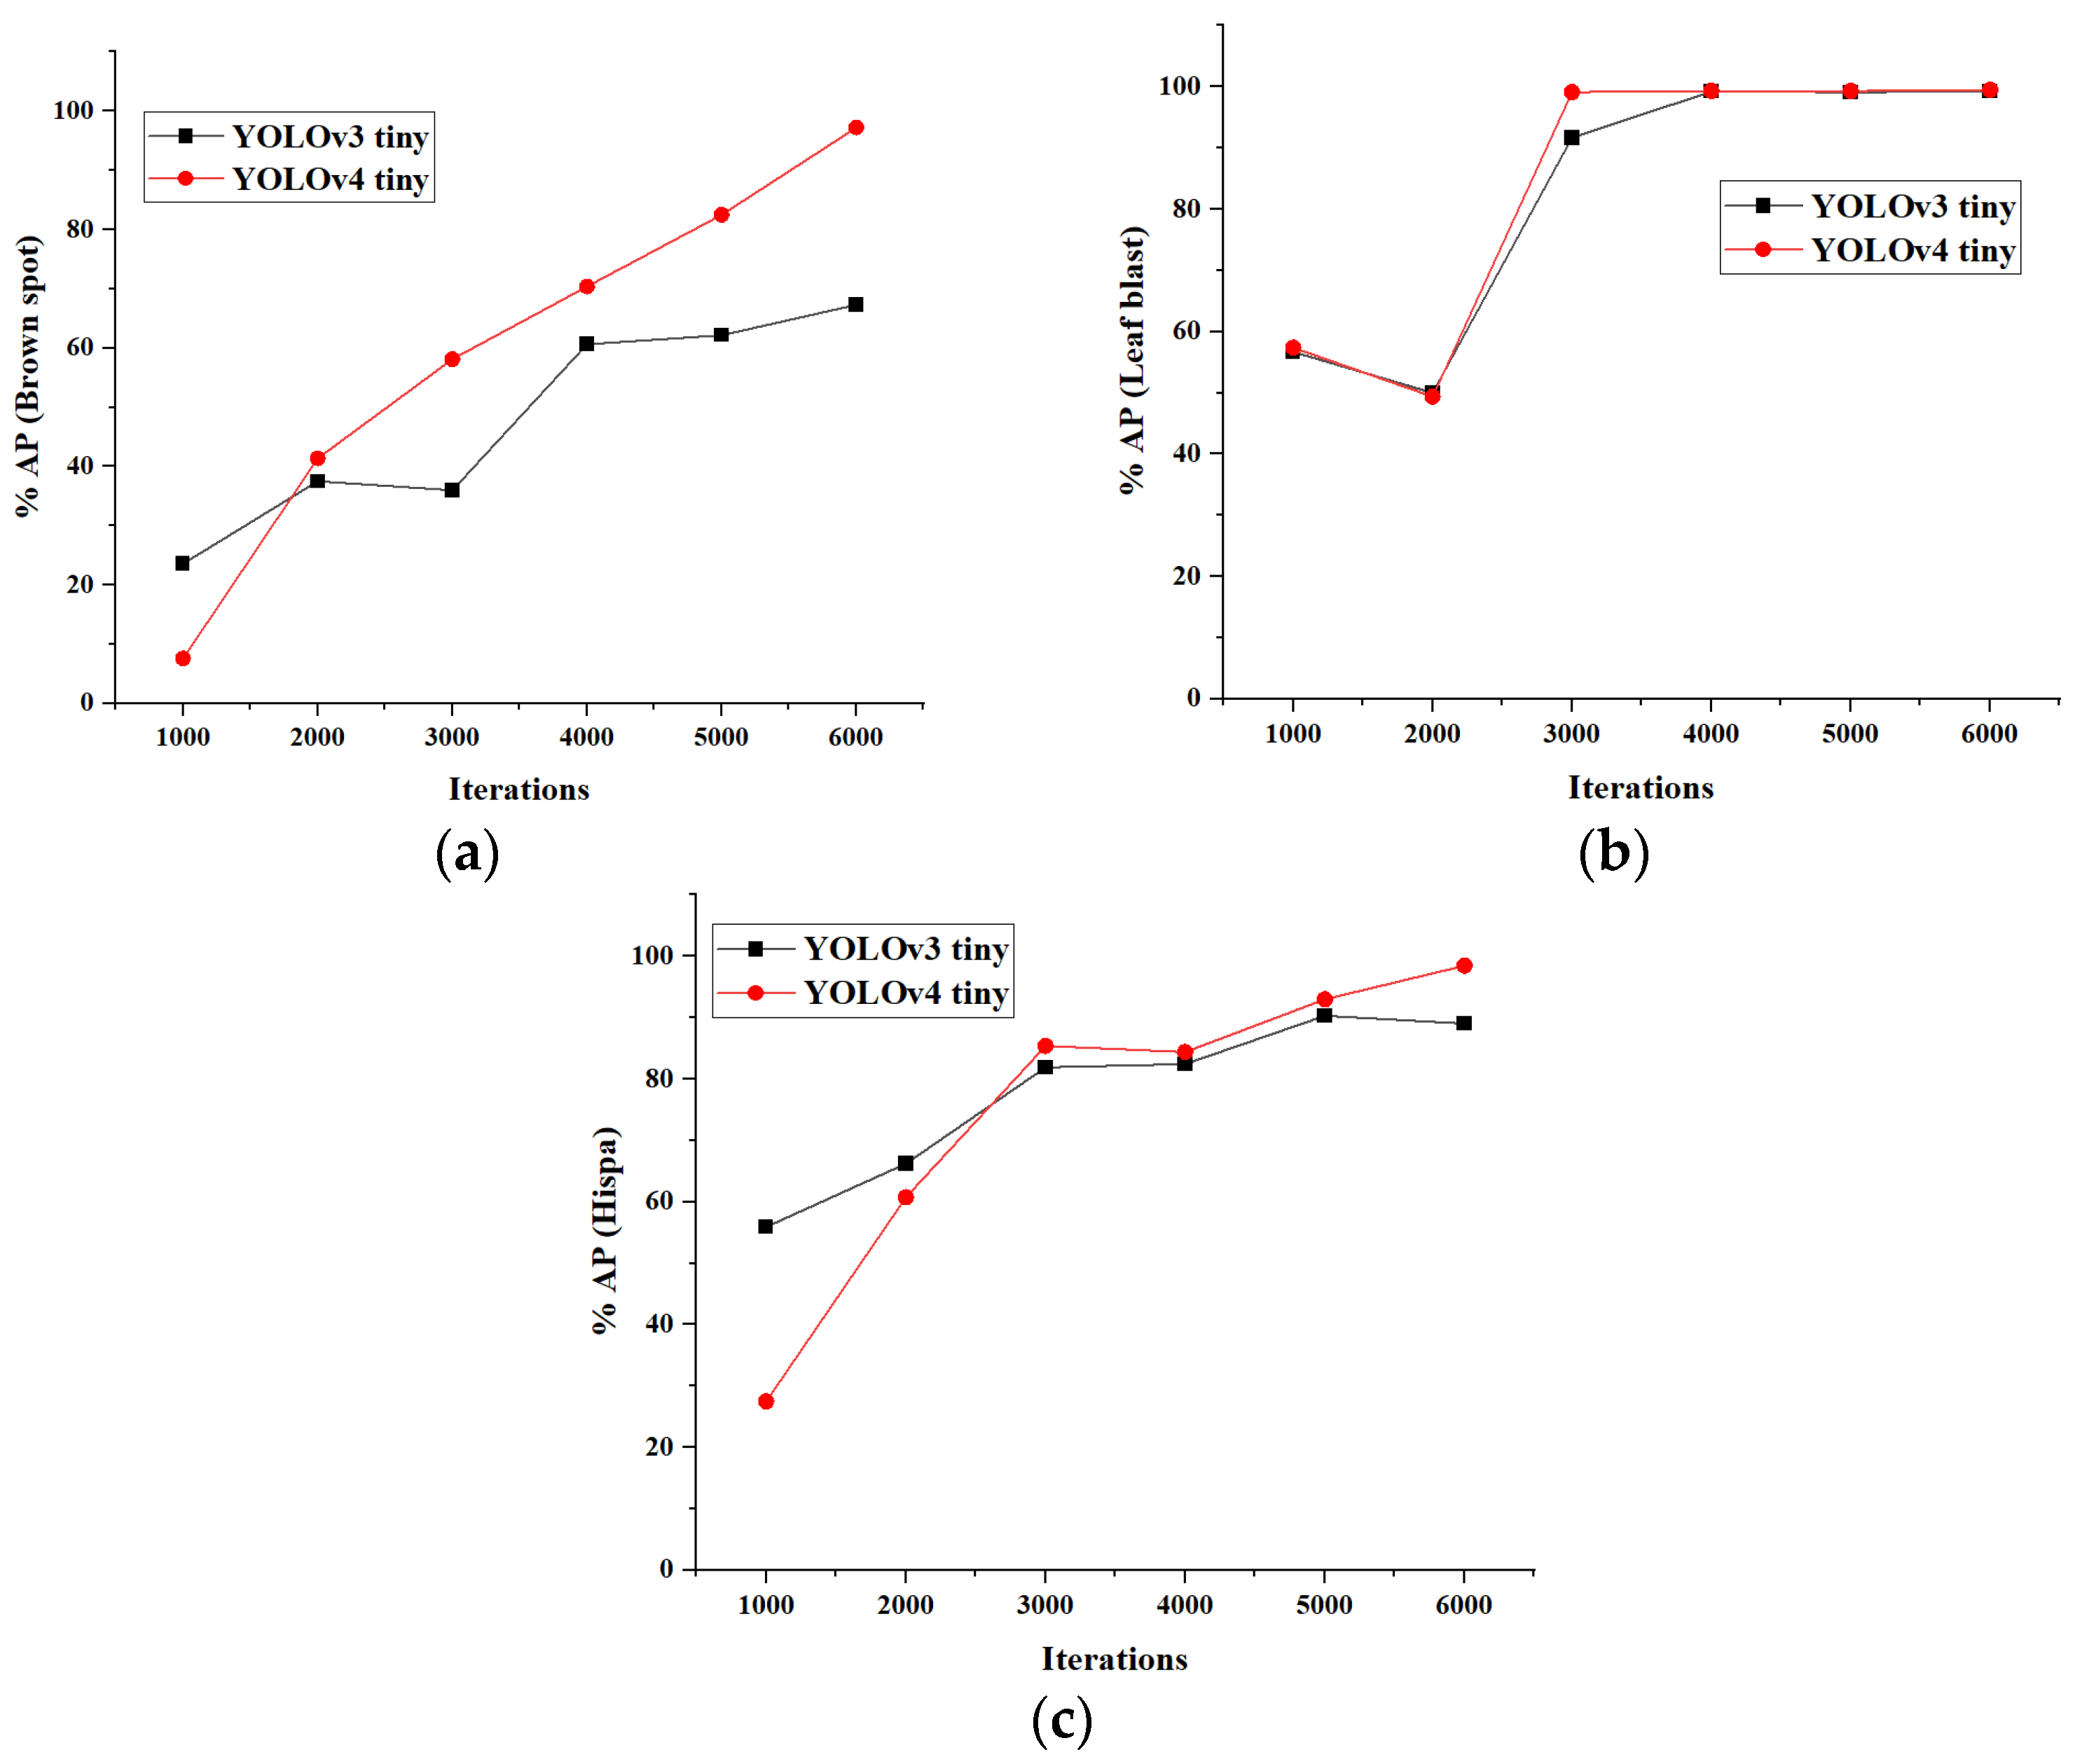
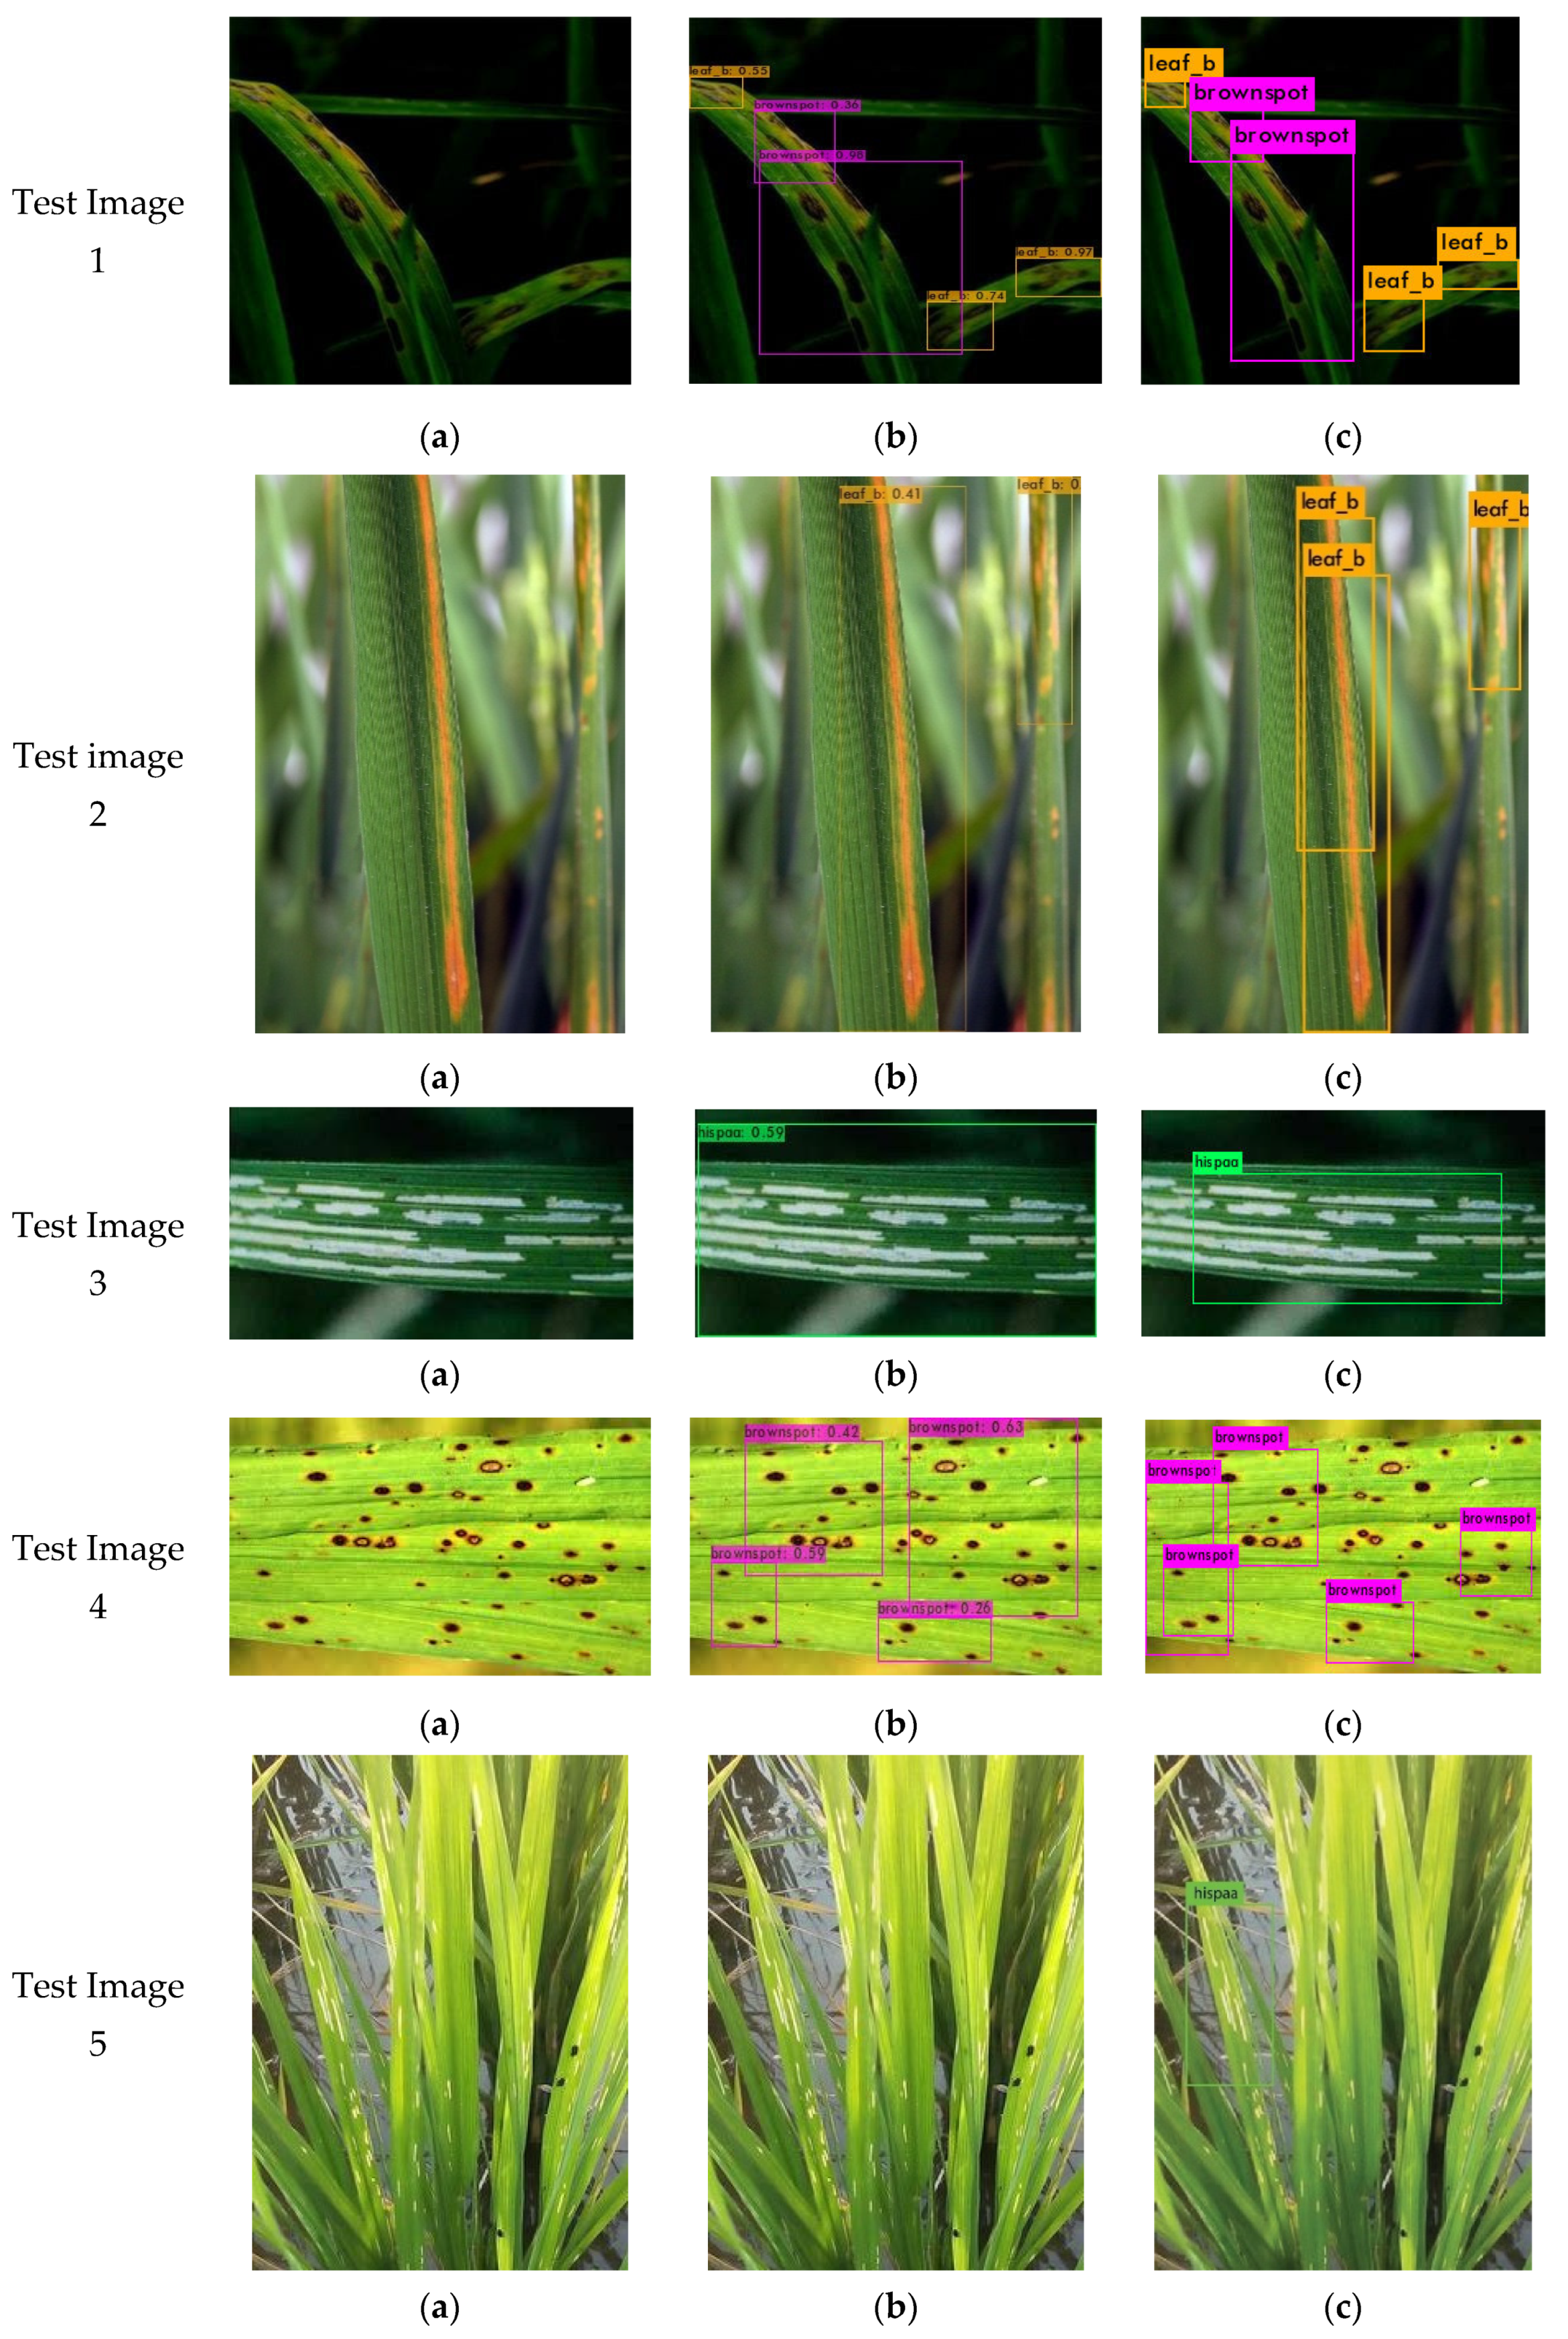
4. Experimental Results

The training was performed for 6000 epochs on the developed dataset as mentioned in Section 3.1. The above-stated metrics (i.e., AP of each class, P, R, etc.) are recorded after every 1000 epochs and the results are illustrated in Table 4. The results are summarized in such a way so as to compare YOLOv3 tiny and YOLOv4 tiny models at each step. It is observed that up to 2000 epochs, the mAP% of YOLOv3 tiny is better than YOLOv4 tiny, but soon after YOLOv4 tiny performs better. This may be because of the smaller network size of YOLOv3 tiny as compared with YOLOv4 tiny which enables YOLOv3 tiny to learn quickly whereas YOLOv4 tiny learns accurately. At last better scores for all the metrics were obtained for the YOLOv4 tiny model as mentioned in Table 5. This reveals that the best mAP percentage of 95.38% was achieved by the YOLOv4 tiny model on the validation set. In contrast, only 85.43% was achieved for YOLOv3 tiny, i.e., a margin of 11.65% is obtained between the two models. The P and R scores for YOLOv4 tiny were evaluated as 0.88 and 0.89, respectively, whereas, for YOLOv3 tiny, the scores are 0.77 and 0.79, respectively. Therefore, YOLOv4 tiny outperforms YOLOv3 tiny by a margin of 14.28% and 12.66% for both P and R, respectively. The F1 score for YOLOv3 tiny and YOLOv4 tiny was computed as 0.74 and 0.89, respectively. Therefore, YOLOv4 tiny outperforms YOLOv3 tiny by a margin of 20.27%. In terms of IoU also, YOLOv4 tiny endorses its dominance over YOLOv3 tiny by a promising margin of 20.29%. Further, the average loss function values for YOLOv3 tiny and YOLOv4 tiny were 1.41 and 0.55, respectively (6000 iterations). The variations in loss values and mAP (%) are presented in Figure 8.
The AP of each class varying with respect to the number of epochs for both the models are shown graphically in Figure 9. At the end of the training, the AP% for brown spot, leaf blast, and hispa were obtained as 97.20%, 99.48%, and 98.45%, respectively, with YOLOv4 tiny, whereas, 67.28%, 99.20%, and 89.02%, respectively, with YOLOv3 tiny.
Further, the performance of developed models was evaluated on unseen test datasets and tabulated in Table 6 which reveals that YOLOv4 tiny outperforms YOLOv3 tiny with a remarkable margin of 17.59%, 19.44%, 25.71%, 17.57%, and 23.48% for mAP, P, R, F1 score, and IoU, respectively. Additionally, the YOLOv4 tiny achieves the class wise AP of 96.20%, 97.78%, and 98.36% for brown spot, hispa, and leaf blast, respectively. These values were computed as 47.14%, 15.98%, and 0.19% higher than YOLOv3 tiny, respectively.
Additionally, the detection capability of the developed models on sample test images is illustrated in Figure 10. As seen YOLOv3 tiny and YOLOv4 tiny were able to predict correct disease detection in almost every test image, however, the areas identified by them vary. YOLOv4 tiny was able to detect all the affected areas correctly but YOLOv3 tiny missed some of the diseases.
The developed models were also compared on the basis of the prediction probability and required prediction time as mentioned in Table 7. It was witnessed that the prediction probability for each bounding box for both models differs by a large margin. Generally, YOLOv4 tiny achieved a very high prediction probability, however, in some cases (first brown spot and first leaf blast in test images 1 and 2, respectively) YOLOv3 tiny dominates. Although YOLOv4 tiny outperforms YOLOv3 tiny in all the evaluation matrices and provides enthusiastic detection accuracies for test images 1–4 (Figure 10), however, it is unable to detect all the infected parts of the paddy leaf as depicted in test image 5 (Figure 10). This may be because of the overcrowded background and very small size of the infected area. Nevertheless, the surety in predictions given by YOLOv4 tiny was far better than YOLOv3 tiny. Furthermore, the time taken for processing each image is higher for YOLOv4 tiny (approximately 5 ms) than YOLOv3 tiny (approximately 3ms) which may be because of the deeper network of YOLOv4 tiny than YOLOv3 tiny. However, in the present work, the primary focus is devoted to giving more accurate results rather than faster results. Hence, YOLOv4 tiny is deployed for the development of the E-crop doctor.
The performance of the developed models was validated against other similar reported works and is presented in Table 8. This analysis reveals that the developed YOLOv3 tiny model underperforms, whereas, YOLOv4 tiny performs outstandingly. The class wise accuracy for this model was computed as 0.49%, 8.31%, and 0.79% higher than [12,21,35] for brown spot, respectively. Similarly compared with the same work, it achieves 2.70%, 0.41%, and 5.99% greater accuracy for leaf blast, respectively. Furthermore, for the hispa class, the proposed model outclasses [35] by a significant margin of 3.58%. The model overshadowed [36] by 1.24% for the classification of leaf blast, whereas, it obtained similar accuracy for brown spot and slightly lesser for hispa. Therefore, the proposed model by YOLOv4 tiny establishes its dominance and attains the overall accuracy of 98.13% which was evaluated as 2.77%, 4.11%, 5.18%, and 3.68% higher than [20,21,23,35], respectively. When also compared with [12], a similar performance (overall accuracy) was obtained. Moreover, the model gained 3.40% higher values of mAP as compared with [37]. Therefore, the developed model was found to be most suitable for crop disease detection and hence, has been deployed for the development of E-crop doctor.

5. Conclusions

After performing a thorough comparative study between the two DL frameworks (YOLOv3 tiny and YOLOv4 tiny) for object detection via smartphone, it was observed that YOLOv4 tiny yields more accurate and effective results. With quite a remarkable accuracy of 98.13%, the model was able to detect the three different diseases precisely. Finally, this model was deployed on the mobile application in TensorFlow lite format. Therefore, an automatic system was developed to help the farmers by detecting paddy disease from their mobile cameras. Further, 24 × 7 support is also being provided to them by the chatbot made using the Kommunicate API. Although the developed model performs satisfactorily, its performance is greatly influenced by the quality of the images being fed to the E-crop doctor. Furthermore, the model’s performance may be affected by various other factors such as illumination variations. However, considering the exponential development in the field of smartphones, this will be resolved in the near future. In future, this system will be extended to detect more paddy diseases and cover other plants so as to develop it as a platform for all crops. Further, a community of farmers will also be made to discuss common issues using this application itself. Additionally, regional languages may be included in the chatbot to make it more user-friendly, in the nearby future.

Author Contributions

Conceptualization, S.J., R.S. and T.K.; methodology, R.S., T.K., H.G. and S.A.; software, O.P.V. and S.A.; validation, T.K., T.B. and H.K.; formal analysis, S.J. and R.S.; investigation, T.K., H.G., O.P.V. and S.A.; resources, T.K.S., O.P.V., T.B. and H.K.; data curation, H.K., S.A., T.K.S. and S.J.; writing—original draft preparation, S.J., R.S. and T.K.; writing—review and editing, T.B. and S.A. and H.G.; visualization, H.G., O.P.V. and T.K.S.; supervision, T.K.S., T.B. and S.A.; project administration, T.K.S., T.B. and H.K.; funding acquisition, H.K. All authors have read and agreed to the published version of the manuscript.

Funding

This work was supported by the Basic Science Research Program through the National Research Foundation of Korea (NRF) funded by the Ministry of Education (NRF-2017R1D1A1B04032598).

Data Availability Statement

The datasets used in this paper are publically available and their links are provided in the reference section.

Conflicts of Interest

The authors declare no conflict of interest.

References

  1. Wagh, R.; Dongre, A.P. Agricultural Sector: Status, Challenges and It’s Role in Indian Economy. J. Commer. Manag. Thought 2016, 7, 209. [Google Scholar] [CrossRef]
  2. Rohman, A.; Helmiyati, S.; Hapsari, M. Rice in health and nutrition. Int. Food Res. J. 2014, 21, 13–24. [Google Scholar]
  3. Tudi, M.; Ruan, H.D.; Wang, L.; Lyu, J.; Sadler, R.; Connell, D.; Chu, C.; Phung, D.T. Agriculture Development, Pesticide Application and Its Impact on the Environment. Int. J. Environ. Res. Public Health 2021, 18, 1112. [Google Scholar] [CrossRef] [PubMed]
  4. Upadhyay, S.K.; Kumar, A. A Novel Approach for Rice Plant Diseases Classification with Deep Convolutional Neural Network. Int. J. Inf. Technol. 2021, 14, 185–199. [Google Scholar] [CrossRef]
  5. Willocquet, L.; Elazegui, F.A.; Castilla, N.; Fernandez, L.; Fischer, K.S.; Peng, S.B.; Teng, P.S.; Srivastava, R.K.; Singh, H.M.; Zhu, D.; et al. Research Priorities for Rice Pest Management in Tropical Asia: A Simulation Analysis of Yield Losses and Management Efficiencies. Phytopathology 2004, 94, 672–682. [Google Scholar] [CrossRef] [PubMed] [Green Version]
  6. Home—IRRI Rice Knowledge Bank. Available online: http://www.knowledgebank.irri.org/ (accessed on 26 June 2022).
  7. Zhao, Z.-Q.; Zheng, P.; Xu, S.; Wu, X. Object Detection with Deep Learning: A Review. IEEE Trans. Neural Netw. Learn. Syst. 2018, 30, 3212–3232. [Google Scholar] [CrossRef] [Green Version]
  8. Rajmohan, R.; Pajany, M.; Rajesh, R.; Raman, D.R.; Prabu, U. Smart paddy crop disease identification and management using deep convolution neural network and SVM classifier. Int. J. Pure Appl. Math. 2018, 118, 255–264. [Google Scholar]
  9. Ratul, M.A.R.; Elahi, M.T.; Mozaffari, M.H.; Lee, W.S. PS8-Net: A Deep Convolutional Neural Network to Predict the Eight-State Protein Secondary Structure. In Proceedings of the 2020 Digital Image Computing: Techniques and Applications (DICTA), Melbourne, Australia, 29 November–2 December 2020. [Google Scholar] [CrossRef]
  10. Schölkopf, B. SVMs—A Practical Consequence of Learning Theory. IEEE Intell. Syst. Their Appl. 1998, 13, 18–21. [Google Scholar] [CrossRef] [Green Version]
  11. Rish, I. An Empirical Study of the Naive Bayes Classifier. In IJCAI 2001 Workshop on Empirical Methods in Artificial Intelligence; 2001; Volume 3, pp. 41–46. Available online: https://www.semanticscholar.org/paper/An-empirical-study-of-the-naive-Bayes-classifier-Watson/2825733f97124013e8841b3f8a0f5bd4ee4af88a (accessed on 1 June 2022).
  12. Gayathri Devi, T.; Neelamegam, P. Image Processing Based Rice Plant Leaves Diseases in Thanjavur, Tamilnadu. Clust. Comput. 2019, 22, 13415–13428. [Google Scholar] [CrossRef]
  13. Prajapati, H.B.; Shah, J.P.; Dabhi, V.K. Detection and Classification of Rice Plant Diseases. Intell. Decis. Technol. 2017, 11, 357–373. [Google Scholar] [CrossRef]
  14. Bhattacharya, S.; Mukherjee, A.; Phadikar, S. A Deep Learning Approach for the Classification of Rice Leaf Diseases. In Advances in Intelligent Systems and Computing; Springer: Berlin/Heidelberg, Germany, 2020; Volume 1109, pp. 61–69. [Google Scholar]
  15. Ren, S.; He, K.; Girshick, R.; Sun, J. Faster R-CNN: Towards Real-Time Object Detection with Region Proposal Networks. IEEE Trans. Pattern Anal. Mach. Intell. 2017, 39, 1137–1149. [Google Scholar] [CrossRef] [PubMed] [Green Version]
  16. Lin, T.Y.; Goyal, P.; Girshick, R.; He, K.; Dollar, P. Focal Loss for Dense Object Detection. IEEE Trans. Pattern Anal. Mach. Intell. 2020, 42, 318–327. [Google Scholar] [CrossRef] [PubMed] [Green Version]
  17. Redmon, J.; Ali, F. Yolov3: An incremental improvement. arXiv 2018, arXiv:1804.02767. [Google Scholar]
  18. He, K.; Gkioxari, G.; Dollar, P.; Girshick, R. Mask R-CNN. In Proceedings of the IEEE International Conference on Computer Vision, Venice, Italy, 22–29 October 2017; Institute of Electrical and Electronics Engineers Inc.: Manhattan, NY, USA, 2017; pp. 2980–2988. [Google Scholar]
  19. Temniranrat, P.; Kiratiratanapruk, K.; Kitvimonrat, A.; Sinthupinyo, W.; Patarapuwadol, S. A System for Automatic Rice Disease Detection from Rice Paddy Images Serviced via a Chatbot. arXiv 2020, arXiv:2011.10823. [Google Scholar] [CrossRef]
  20. Lu, Y.; Yi, S.; Zeng, N.; Liu, Y.; Zhang, Y. Identification of Rice Diseases Using Deep Convolutional Neural Networks. Neurocomputing 2017, 267, 378–384. [Google Scholar] [CrossRef]
  21. Ramesh, S.; Vydeki, D. Recognition and Classification of Paddy Leaf Diseases Using Optimized Deep Neural Network with Jaya Algorithm. Inf. Process. Agric. 2020, 7, 249–260. [Google Scholar] [CrossRef]
  22. Patidar, S.; Pandey, A.; Shirish, B.A.; Sriram, A. Rice Plant Disease Detection and Classification Using Deep Residual Learning. Commun. Comput. Inf. Sci. 2020, 1240, 278–293. [Google Scholar] [CrossRef]
  23. Rahman, C.R.; Arko, P.S.; Ali, M.E.; Iqbal Khan, M.A.; Apon, S.H.; Nowrin, F.; Wasif, A. Identification and Recognition of Rice Diseases and Pests Using Convolutional Neural Networks. Biosyst. Eng. 2020, 194, 112–120. [Google Scholar] [CrossRef] [Green Version]
  24. Sibanda; Blessing, K.; Gloria, E.I.; Attlee, M.G. Mobile apps utilising AI for plant disease identification: A systematic review of user reviews. In Proceedings of the 2021 3rd International Multidisciplinary Information Technology and Engineering Conference (IMITEC), Windhoek, Namibia, 23–25 November 2021; IEEE: Manhattan, NY, USA, 2021. [Google Scholar]
  25. Rupavatharam, S.; Kennepohl, A.; Kummer, B.; Parimi, V. Automated plant disease diagnosis using innovative android App (Plantix) for farmers in Indian state of Andhra Pradesh. Phytopathology 2018, 108. Available online: http://oar.icrisat.org/id/eprint/11014 (accessed on 5 March 2022).
  26. Kumar, S.; Yadav, D.; Gupta, H.; Verma, O.P.; Ansari, I.A.; Ahn, C.W. A Novel YOLOv3 Algorithm-Based Deep Learning Approach for Waste Segregation: Towards Smart Waste Management. Electron 2020, 10, 14. [Google Scholar] [CrossRef]
  27. Kumar, S.; Gupta, H.; Yadav, D.; Ansari, I.A.; Verma, O.P. YOLOv4 Algorithm for the Real-Time Detection of Fire and Personal Protective Equipments at Construction Sites. Multimed. Tools Appl. 2021, 81, 22163–22183. [Google Scholar] [CrossRef]
  28. Shorten, C.; Khoshgoftaar, T.M. A Survey on Image Data Augmentation for Deep Learning. J. Big Data 2019, 6, 60. [Google Scholar] [CrossRef]
  29. Lei, J.; Gao, C.; Hu, J.; Gao, C.; Sang, N. Orientation Adaptive YOLOV3 for Object Detection in Remote Sensing Images. In Proceedings of the Lecture Notes in Computer Science (Including Subseries Lecture Notes in Artificial Intelligence and Lecture Notes in Bioinformatics), November 2019; Springer Science and Business Media Deutschland GmbH: Berlin/Heidelberg, Germany, 2019; Volume 11857, pp. 586–597. [Google Scholar]
  30. Tzutalin/LabelImg: ? LabelImg Is a Graphical Image Annotation Tool and Label Object Bounding Boxes in Images. Available online: https://github.com/tzutalin/labelImg (accessed on 23 November 2021).
  31. AI Chatbot for Customer Service Automation|Kommunicate, (n.d.). Available online: https://www.kommunicate.io/ (accessed on 13 January 2022).
  32. Gupta, H.; Varshney, H.; Sharma, T.K.; Pachauri, N.; Verma, O.P. Comparative Performance Analysis of Quantum Machine Learning with Deep Learning for Diabetes Prediction. Complex Intell. Syst. 2021, 1, 1–15. [Google Scholar] [CrossRef]
  33. Gupta, H.; Verma, O.P. Monitoring and Surveillance of Urban Road Traffic Using Low Altitude Drone Images: A Deep Learning Approach. Multimed. Tools Appl. 2021, 81, 19683–19703. [Google Scholar] [CrossRef]
  34. Shahi, T.B.; Sitaula, C.; Neupane, A.; Guo, W. Fruit Classification Using Attention-Based MobileNetV2 for Industrial Applications. PLoS ONE 2022, 17, e0264586. [Google Scholar] [CrossRef]
  35. Wang, Y.; Wang, H.; Peng, Z. Rice Diseases Detection and Classification Using Attention Based Neural Network and Bayesian Optimization. Expert Syst. Appl. 2021, 178, 114770. [Google Scholar] [CrossRef]
  36. Bari, B.S.; Islam, M.N.; Rashid, M.; Hasan, M.J.; Razman, M.A.M.; Musa, R.M.; Nasir, A.F.A.; Majeed, A.P.P.A. A Real-Time Approach of Diagnosing Rice Leaf Disease Using Deep Learning-Based Faster R-CNN Framework. PeerJ Comput. Sci. 2021, 7, e432. [Google Scholar] [CrossRef]
  37. Kiratiratanapruk, K.; Temniranrat, P.; Sinthupinyo, W.; Marukatat, S.; Patarapuwadol, S. Automatic Detection of Rice Disease in Images of Various Leaf Sizes. arXiv 2022, arXiv:2206.07344. [Google Scholar]
Figure 1. Paddy diseases: (a) brown spot, (b) leaf blast, (c) hispa.
Electronics 11 02110 g001
Figure 2. Collected images: (a) on-field, (b) laboratory.
Electronics 11 02110 g002
Figure 3. Sample images after data augmentation steps: (a) resized, (b) brightness, (c) rotation, (d) exposure change (negative), (e) exposure change (positive).
Electronics 11 02110 g003
Figure 4. Number of images and instances per class.
Electronics 11 02110 g004
Figure 5. Process flow diagram of rice disease detection model.
Electronics 11 02110 g005
Figure 6. Process flow of the E-crop doctor.
Electronics 11 02110 g006
Figure 7. Sample chats.
Electronics 11 02110 g007
Figure 8. Variations in loss function value and mAP percent vs. iteration count for (a) YOLOv3 tiny and (b) YOLOv4 tiny.
Electronics 11 02110 g008aElectronics 11 02110 g008b
Figure 9. AP% of each class vs. number of iterations: (a) brown spot, (b) leaf blast, (c) hispa.
Electronics 11 02110 g009
Figure 10. Experimental results obtained from models after being applied to various test images: (a) original image, (b) YOLOv3 tiny, (c) YOLOv4 tiny.
Electronics 11 02110 g010
Table 1. Comparative study of reported rice disease detection models.
S. No.Author(s)ModelAccuracy (%)
1.Rajmohan et al. [8]CNN + SVM87.50
2.Gayathri Devi et al. [12]SVM98.63
3.Prajapati et al. [13]SVM73.33
4.Bhattacharya et al. [14]CNN78.44
5.Temniranrat et al. [19]YOLOv389.10
6.Lu et al. [20]CNN95.48
7.Ramesh et al. [21]JOA + CNN94.25
8.Patidar et al. [22]ReNN95.38
9.Rahman et al. [23]CNN93.30
Table 2. Data augmentation and pre-processing.
ParameterAmount
Auto OrientationApplied
Resizing416 × 416
BlurUp to 1 px
Exposure changeBetween −15% and 15%
Rotation±15 degree
BrightnessBetween −28% to 28%
Table 3. Dataset distribution.
Name of DiseaseTotal Number of InstancesTotal Number of ImagesTraining ImagesValidation ImagesTest Images
Brown spot9192752481314
Hispa8942292061112
Leaf blast6232582321313
Total24367626863739
Table 4. CFG parameters.
ParameterYOLOv3 TinyYOLOv4 Tiny
Width416416
Height416416
Batch6464
Subdivisions1624
Channels33
Momentum0.90.9
Decay0.00050.0005
Learning rate0.0010.00261
Maximum number of batches60006000
Policystepssteps
Steps4800, 54004800, 5400
Scale0.1, 0.10.1, 0.1
Classes33
Filters(4 + 1 + 3) × 3 = 24(4 + 1 + 3) × 3 = 24
Table 5. Simulation results of training.
Model VersionIterationsClasses AP (%)mAP
(%)
PRF1 ScoreIoU
(%)
Loss
Brown SpotHispaLeaf Blast
YOLOv3 tiny100023.655.9056.6745.730.660.250.3644.752.87
YOLOv4 tiny7.627.4857.3730.820.390.100.1627.131.84
YOLOv3 tiny200037.5266.2050.0051.250.680.410.5145.632.05
YOLOv4 tiny41.3860.7449.3650.500.590.490.5440.341.35
YOLOv3 tiny300035.9981.9091.6769.980.740.470.5758.221.84
YOLOv4 tiny58.1185.3899.1081.600.710.650.6850.091.05
YOLOv3 tiny400060.6382.4199.2081.010.650.740.6945.191.63
YOLOv4 tiny70.3984.3999.3084.930.770.710.7454.740.75
YOLOv3 tiny500062.1690.3099.1084.160.730.790.7652.281.55
YOLOv4 tiny82.4992.9799.3091.820.810.850.8359.860.58
YOLOv3 tiny600067.2889.0299.2085.430.770.720.7455.111.41
YOLOv4 tiny97.2098.4599.4895.380.880.890.8966.290.55
Table 6. Performance evaluation on test set.
Model VersionClasses AP (%)mAP
(%)
PRF1 ScoreIoU
(%)
Brown SpotHispaLeaf Blast
YOLOv3 tiny65.3884.3198.1782.790.720.700.7453.28
YOLOv4 tiny96.2097.7898.3697.360.860.880.8765.79
Table 7. Quantitative comparison of the experimental results on the test set.
Test ImageDisease DetectionsPrediction Probability (in %)Prediction Time (in Milliseconds)
YOLOv3 TinyYOLOv4 TinyYOLOv3 TinyYOLOv4 Tiny
1Brown spot59452.8565.158
Brown spot4285
Brown spot2646
Brown spot6393
Brown spotNA85
2Leaf blast41392.9285.167
Leaf blast6899
Leaf blastNA97
3Hispa59972.9155.166
4Leaf blast55862.8855.216
Brown spot3696
Brown spot9899
Leaf blast7489
Leaf blast9799
5HispaNA572.8945.138
Table 8. Performance comparison with other developed models.
S. No.Author(s)ModelClass Wise Accuracy (%)mAP (%)Overall Accuracy (%)
Brown SpotLeaf BlastHispa
1.Kiratiratanapruk et al. [37]YOLOv4xxx94.16x
2.Gayathri et al. [12]SVM98.3096.70xx98.63
3.Lu et al. [20]CNNxxxx95.48
4.Ramesh et al. [21]JOA + CNN90.5798.90xx94.25
5.Rahman et al. [23]CNNxxxx93.30
6.Wang et al. [35]NN-BO98.0093.7091.11x94.65
7.Bari et al. [36]Faster R-CNN98.8598.0999.17xx
8.Proposed *YOLOv3 tiny76.3485.1993.3882.7985.37
9.Proposed *YOLOv4 tiny98.7899.3194.3797.3698.13
NN-BO: Neural Network with Bayesian optimization and ‘x’ represents the unavailability of the data. * represents proposed work
Publisher’s Note: MDPI stays neutral with regard to jurisdictional claims in published maps and institutional affiliations.

