Article

Real-Time State-of-Charge Estimation Using an Embedded Board for Li-Ion Batteries

1
Energy ICT Convergence Research Department, Energy Efficiency Research Division, Korea Institute of Energy Research, Daejeon 16105, Korea
2
Energy Storage and Conversion Laboratory, Department of Electrical Engineering, Chungnam National University, Daejeon 34134, Korea
*
Authors to whom correspondence should be addressed.
Electronics 2022, 11(13), 2010; https://doi.org/10.3390/electronics11132010
Submission received: 9 May 2022 / Revised: 14 June 2022 / Accepted: 23 June 2022 / Published: 27 June 2022
(This article belongs to the Special Issue Energy Storage Technologies)

Abstract

:
With the use of batteries increases, the complexity of battery management systems (BMSs) also rises. Thus, assessing the functionality of BMSs and performance of the BMS hardware is of utmost importance. Testing with embedded boards at an early stage of BMS development is a pragmatic approach for developing a BMS because it is cost- and time-efficient and considers hardware performance. In this study, we tested and analyzed the real-time state-of-charge (SOC) estimation using a test platform with limited CPU performance as well as memory resources of the embedded board. We collected battery data on a single-cell basis using a first-order RC equivalent circuit and achieved an accuracy of 95% compared to the measured data obtained using actual battery tests. The SOC estimation method applies the extended Kalman filter (EKF) and unscented Kalman filter (UKF). The experiment was performed on the real-time test platform, with 1%, 2%, and 5% noise in the measurement data. The algorithm complexity and hardware implementation were evaluated in terms of the resources used and processing speed. Although the EKF is cost-effective, its error rate increases by 5% with noise interference. The UKF exhibits high accuracy and noise robustness; however, it has a high resource occupancy.

1. Introduction

Lithium-ion batteries (LiB) are widely used in the development of electric vehicles (EVs) due to their several advantages such as superior specific energy and power and prolonged lifespan [1,2]. However, the nonlinear and complex characteristics of LiBs makes their behavior unpredictable. An accurate state-of-charge (SOC) can help drivers make smarter decisions on when to charge their batteries. For this reason, the battery management system (BMS) is tasked with the responsibility of monitoring the critical battery internal variables such as SOC, state-of-health, state-of-energy, etc. [3]. In addition to software, the BMS includes hardware composed of many microcontroller units. The higher the complexity of the software model, the higher its estimation accuracy; however, complex models take up more space due to the increase in computing cost. Hence, a trade-off is needed between the complexity of the software model and the hardware resources [4]. Thus, high-accuracy SOC estimation based on an embedded board is difficult owing to its high computing cost and limited resources [5].
The most widely used SOC estimation method in embedded systems is the current integration method (Ampere hour counting). This method integrates the initial state of charge, battery capacity, and measured current. The implementation of the algorithm is simple; however, it is vulnerable to initial value errors or measurement noise since it is an open-loop system [6]. Data-based methods, such as neural networks (NN) and support vector machines (SVM), are gaining ground owing to recent advancements in computing performance. These methods simplify the parameter identification process and approximation is advantageous for nonlinear systems; however, their application to embedded boards is still challenging because it requires a large amount of training dataset as well as a high computing cost [7,8,9,10].
In contrast, filter-based methods for observing nonlinear systems are widely used for real-time SOC. The typical method is the extended Kalman filter (EKF) [11,12,13], which is an adaptive control technique using first-order Taylor expansion that can diverge under nonlinear system [11]. The unscented Kalman filter (UKF) [14,15] is based on an unscented transform (UT) and it describes the statistical properties of the vector being transformed. This method is a recursive estimating filter, and its properties meet the requirements of suitable strongly nonlinear systems; however, it enhances the precision but at the outlay of more computing time. Cui [13] conducted an experiment in MPC5604B to compare the accuracy and computing cost of the SOC estimation algorithm for the limited resource. They proposed a square-root cubature Kalman filter algorithm to minimize the in-board resource usage as it has a faster convergence and higher accuracy with a low load rate of 68.3%. In addition to the Kalman filter method, Chandra Shekar [16] estimated real-time SOC using the particle swarm optimization method. They constructed an experimental setup based on the Raspberry Pi 4 and verified it with suitably aged battery data. A maximum CPU utilization of 26% and a root-mean-square error (RMSE) of 3.5% were observed in the proposed model initialization.
Arduino and Raspberry Pi are the most commonly used IoT devices because of simple in operation and easy to handle [17,18]. These devices were used as cloud-BMS to avoid large resource consumption in implementing advanced algorithms. However, research on limited resources as onboard rather than IoT devices was rare.
There are difficulties in achieving the requirements of BMS based on embedded boards. The first limitation is the high computational complexity of the algorithm. In the case of an embedded environment with limited resources, it is necessary to avoid a certain level of computing costs for other complex BMS functions. A high-fidelity model increases the computational burden and makes it impractical to deploy on embedded boards. Second, it is not easy to provide a hardware-in-the-loop (HIL) that can provide real-time signals to test BMS functions. Although processor-in-the-loop (PIL) is more accessible than HIL to analyze the trade-off relationship between complexity and accuracy, there may be some problems such as precision. Therefore, in this study, we present a Raspberry Pi-based SOC estimation test bench to verify if it meets the real-time requirements.
The paper is organized as follows. Section 2 describes the battery first-order RC equivalent model setting process and the operation process of the SOC estimation model. Validation of the equivalence model is also presented in this section. Section 3 presents a Raspberry Pi-based real-time test bench. The data acquisition model and SOC estimation model are deployed on each Raspberry Pi 1 and 2, and the hardware requirements and communication for this are described. Section 4 provides real-time experimental results for data with noise. This section includes analyzing the computing cost required to deploy the algorithm on the Raspberry Pi. Finally, Section 5 provides a conclusion.

2. Methodology for SOC Estimation
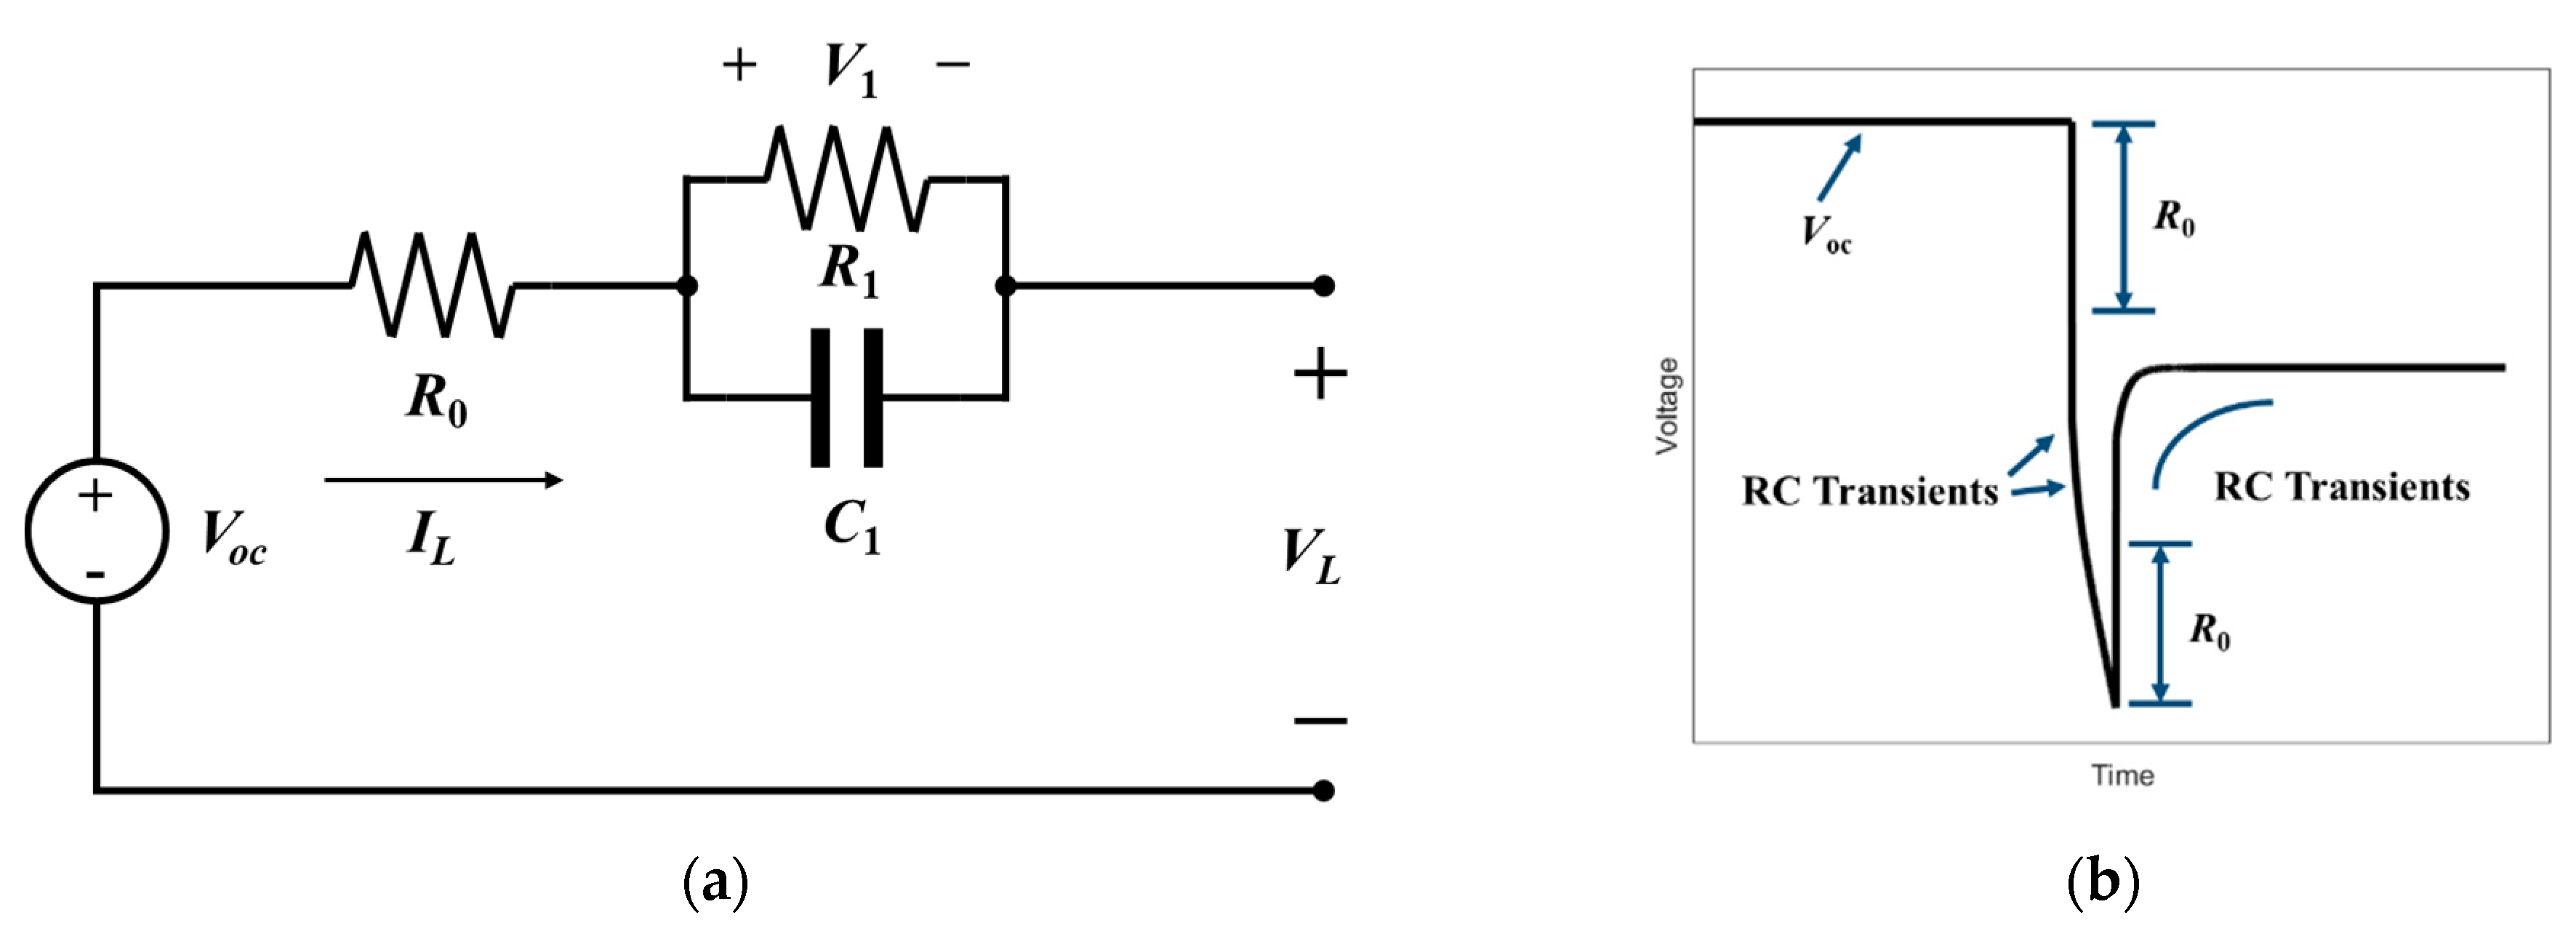
2.1. Battery Model

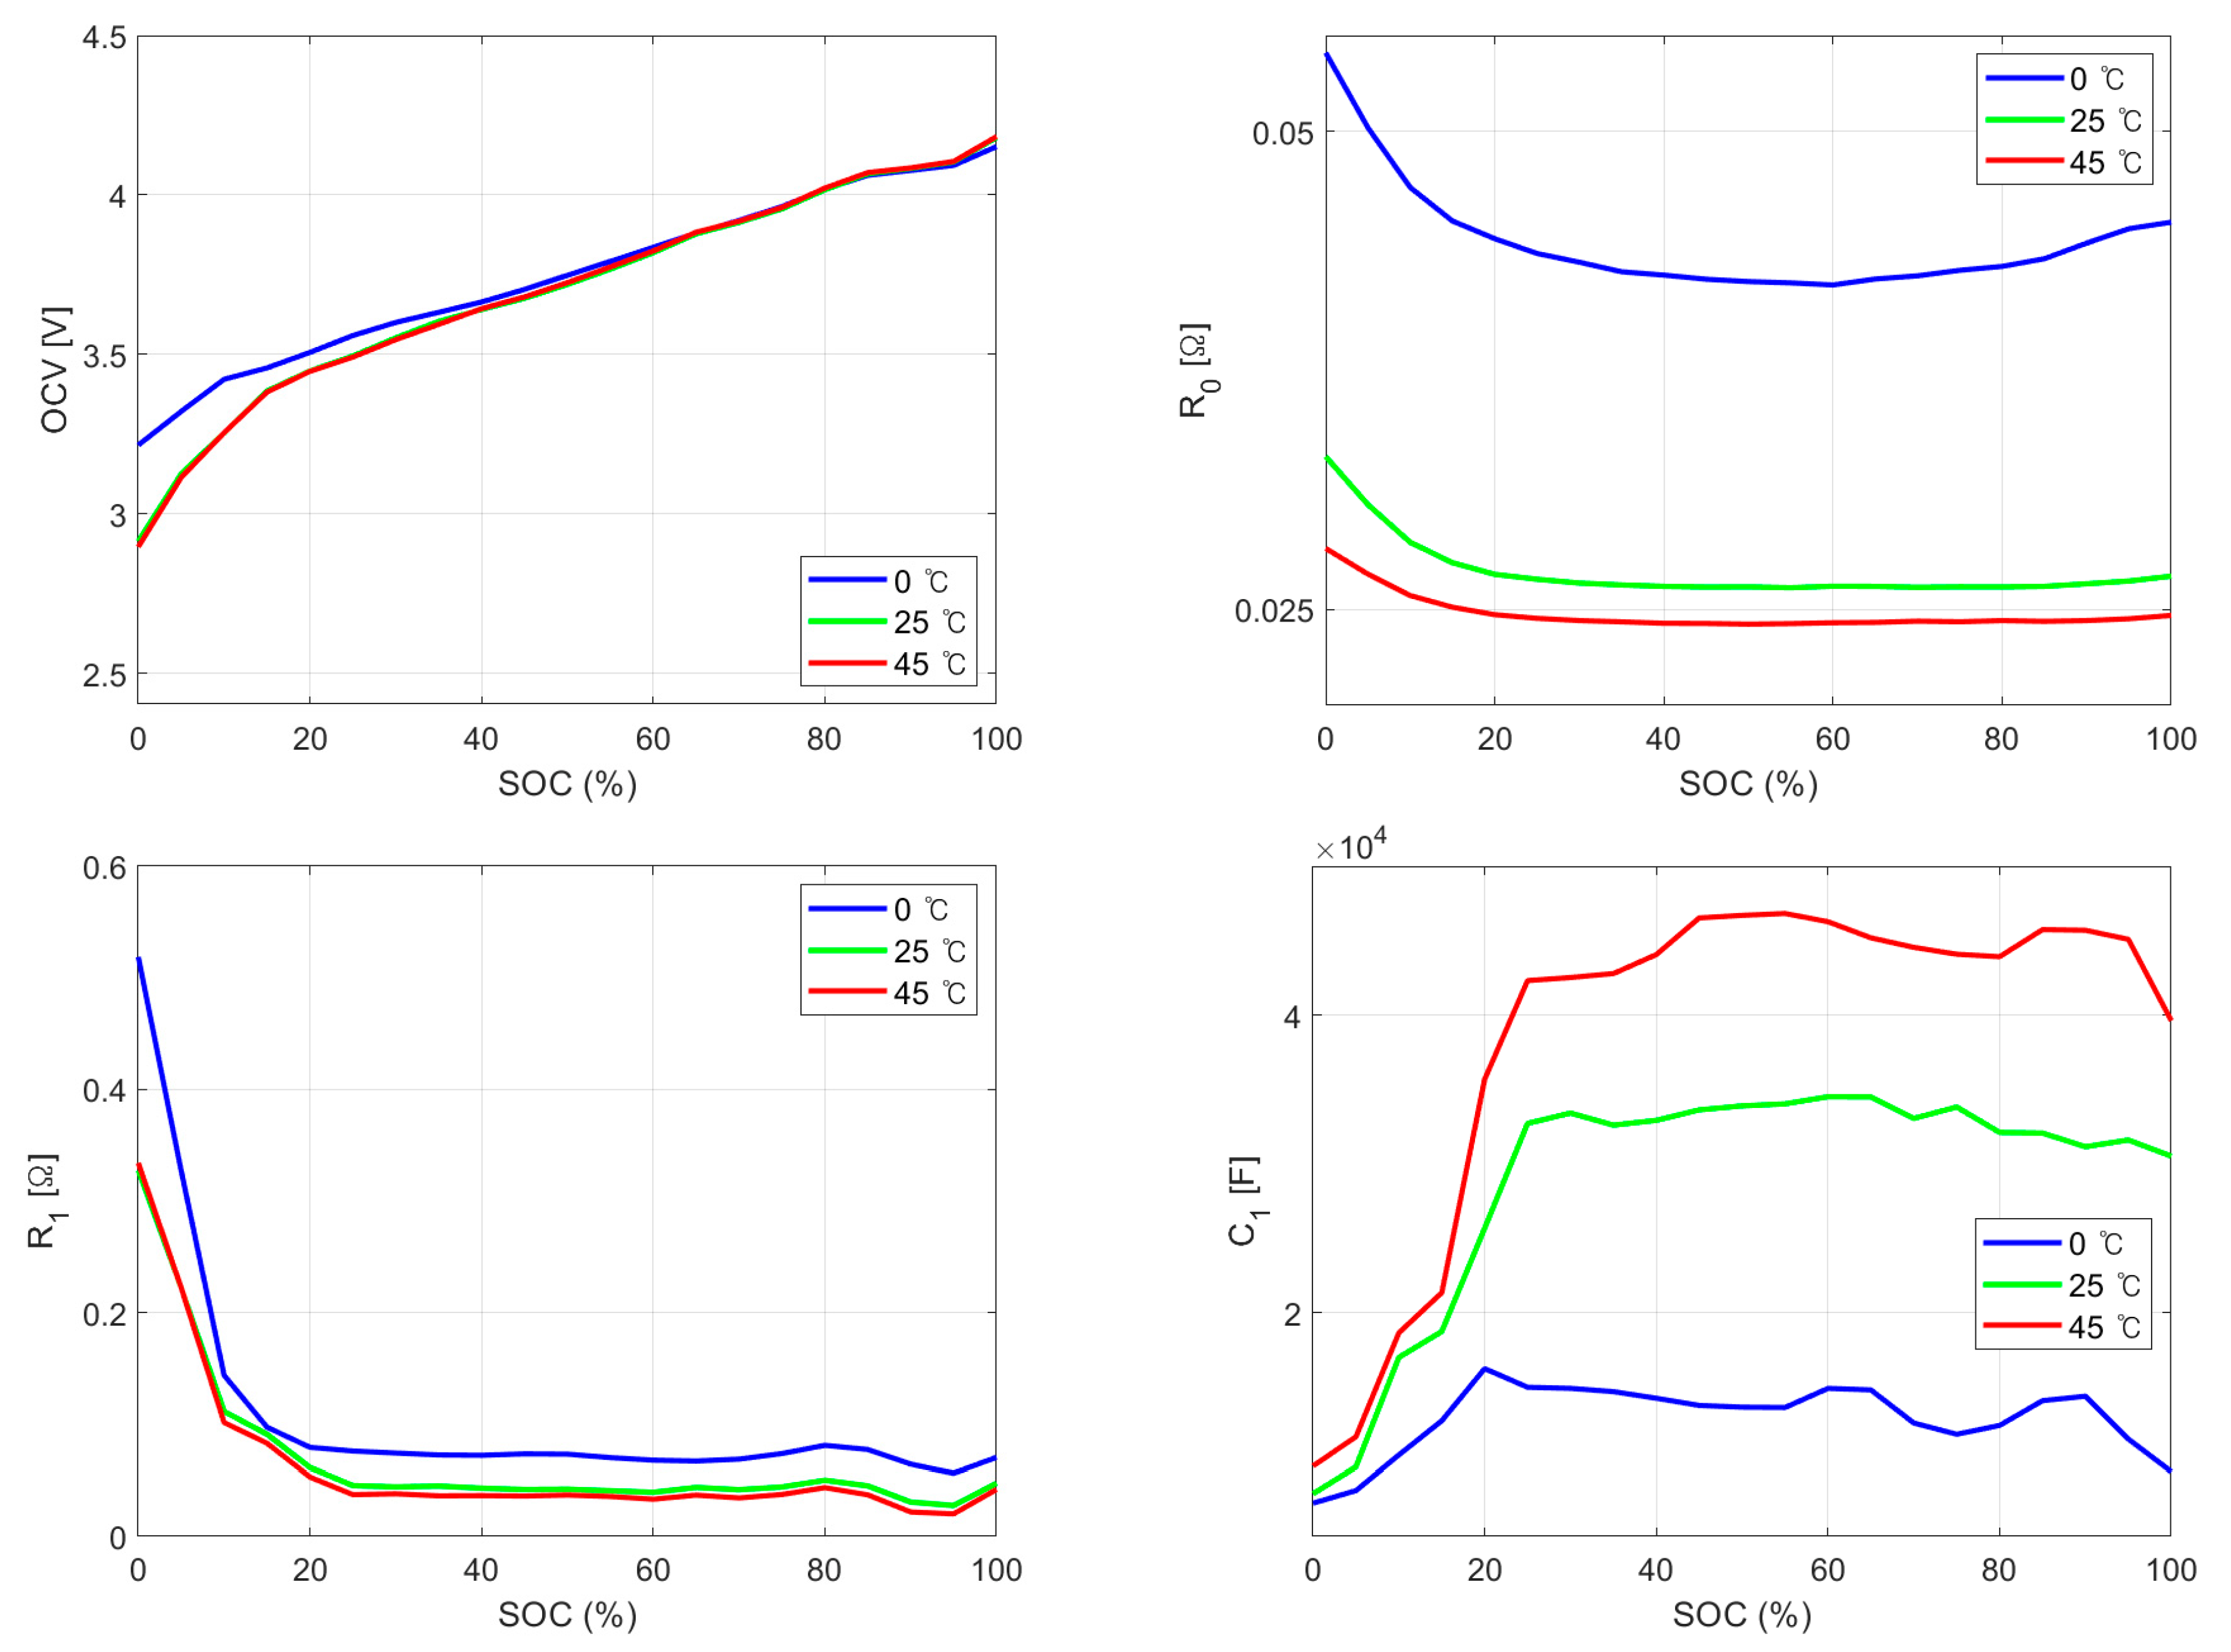
2.1.1. Parameter Identification

The electrical equivalent circuit model (ECM) facilitates the state-estimation by representing the internal electrochemical state of a battery through circuit elements. ECM consists of a voltage source, an internal resistor, and Resistance-Capacitance (RC) networks, which are able to describe the electrical relationship between inputs and terminal voltage [19]. The Rint model, Thevenin model, Partnership for a new generation of vehicle (PNGV), and General Non-Linear model are common ECMs [20]. In [21], they compare five battery models including the first-order RC model. The first-order RC model is more suitable for the modeling of lithium-ion batteries. Considering the trade-off relationship between the accuracy and complexity of the model, we applied the first-order RC model in this study. As shown in Figure 1a, the Thevenin model consisted of a voltage source, a resistor, and an RC ladder network. The open-circuit voltage (OCV) is the terminal voltage of the battery in a steady state, no-load, where no current flows, and it can be expressed as a nonlinear function of the SOC [14]. Internal resistance is the ohmic resistance (R0), which represents a voltage characteristic that responds instantaneously to changes in current, and polarization voltage (R1), which represents resistance to ionization loss due to charging and discharging currents. The voltage drop at R0 was abrupt, but gradual in the RC network. C1 represents the capacitance of the electrical double layer. An RC network is equivalent to the dynamic properties of diffusion. The battery terminal voltage from the equivalent circuit model is expressed as follows:
V L = V o c SOC R 0 I L V 1
where V1 is the polarization voltage. The polarization voltage is expressed as the difference in potential between terminals when current flows and when no current flows and is expressed as follows:
V 1 ˙ = 1 R 1 C 1 V 1 + 1 C 1 I L
The transfer function that outputs the terminal voltage with the battery load-current as the input is as follows:
V L V o c SOC I L = R 0 s + ω z s ω p
ω p = 1 R 1 C 1   ,   ω z = ω p 1 + R 1 R 0
where ωp and ωz represent the zero and pole of each transfer function, respectively, which represent the dynamic battery characteristics. The variation in the terminal voltage of the battery has the characteristic of a minimum phase system, and the amplitude of the terminal voltage proportionally decreases with an increase in the frequency of the unit load current. Figure 1b shows the response voltage when a load current was applied to a constant current profile.

2.1.2. Operating Temperature Effect of Battery Parameters

The operating temperature affected the parameters of the battery model [22]. Pulse discharge tests should be performed at specific temperatures to ensure the accuracy of SOC estimation at these temperatures. In this study, a complete constant-current pulsed discharge test was performed at 0 °C, 25 °C, and 45 °C. Figure 2 shows the optimized battery parameters as functions of operating temperature. The obtained parameters were optimized using MATLAB’s “lsqnonlin” function. R0 was high because the voltage was lowered at the operating temperature, and the maximum increased by 0.054 Ω at an operating temperature of 0 °C. In addition, the internal lithium-ion concentration decreased in the low SOC range, and thus the resistance increased. In R1, the resistance increased because the internal chemical properties of the lithium diffusion rate decreased per the operating temperature and SOC. In contrast, the diffusion rate of R1 increased as the SOC increased, and as the lithium-ion concentration increased, the charge amount increased and decreased continuously. In C1, the double-layer capacitor increased because the amount of charge increased with the fast lithium-ion diffusion rate as the operating temperature and SOC increased. However, C1 decreased sharply in the section with a 20% SOC.

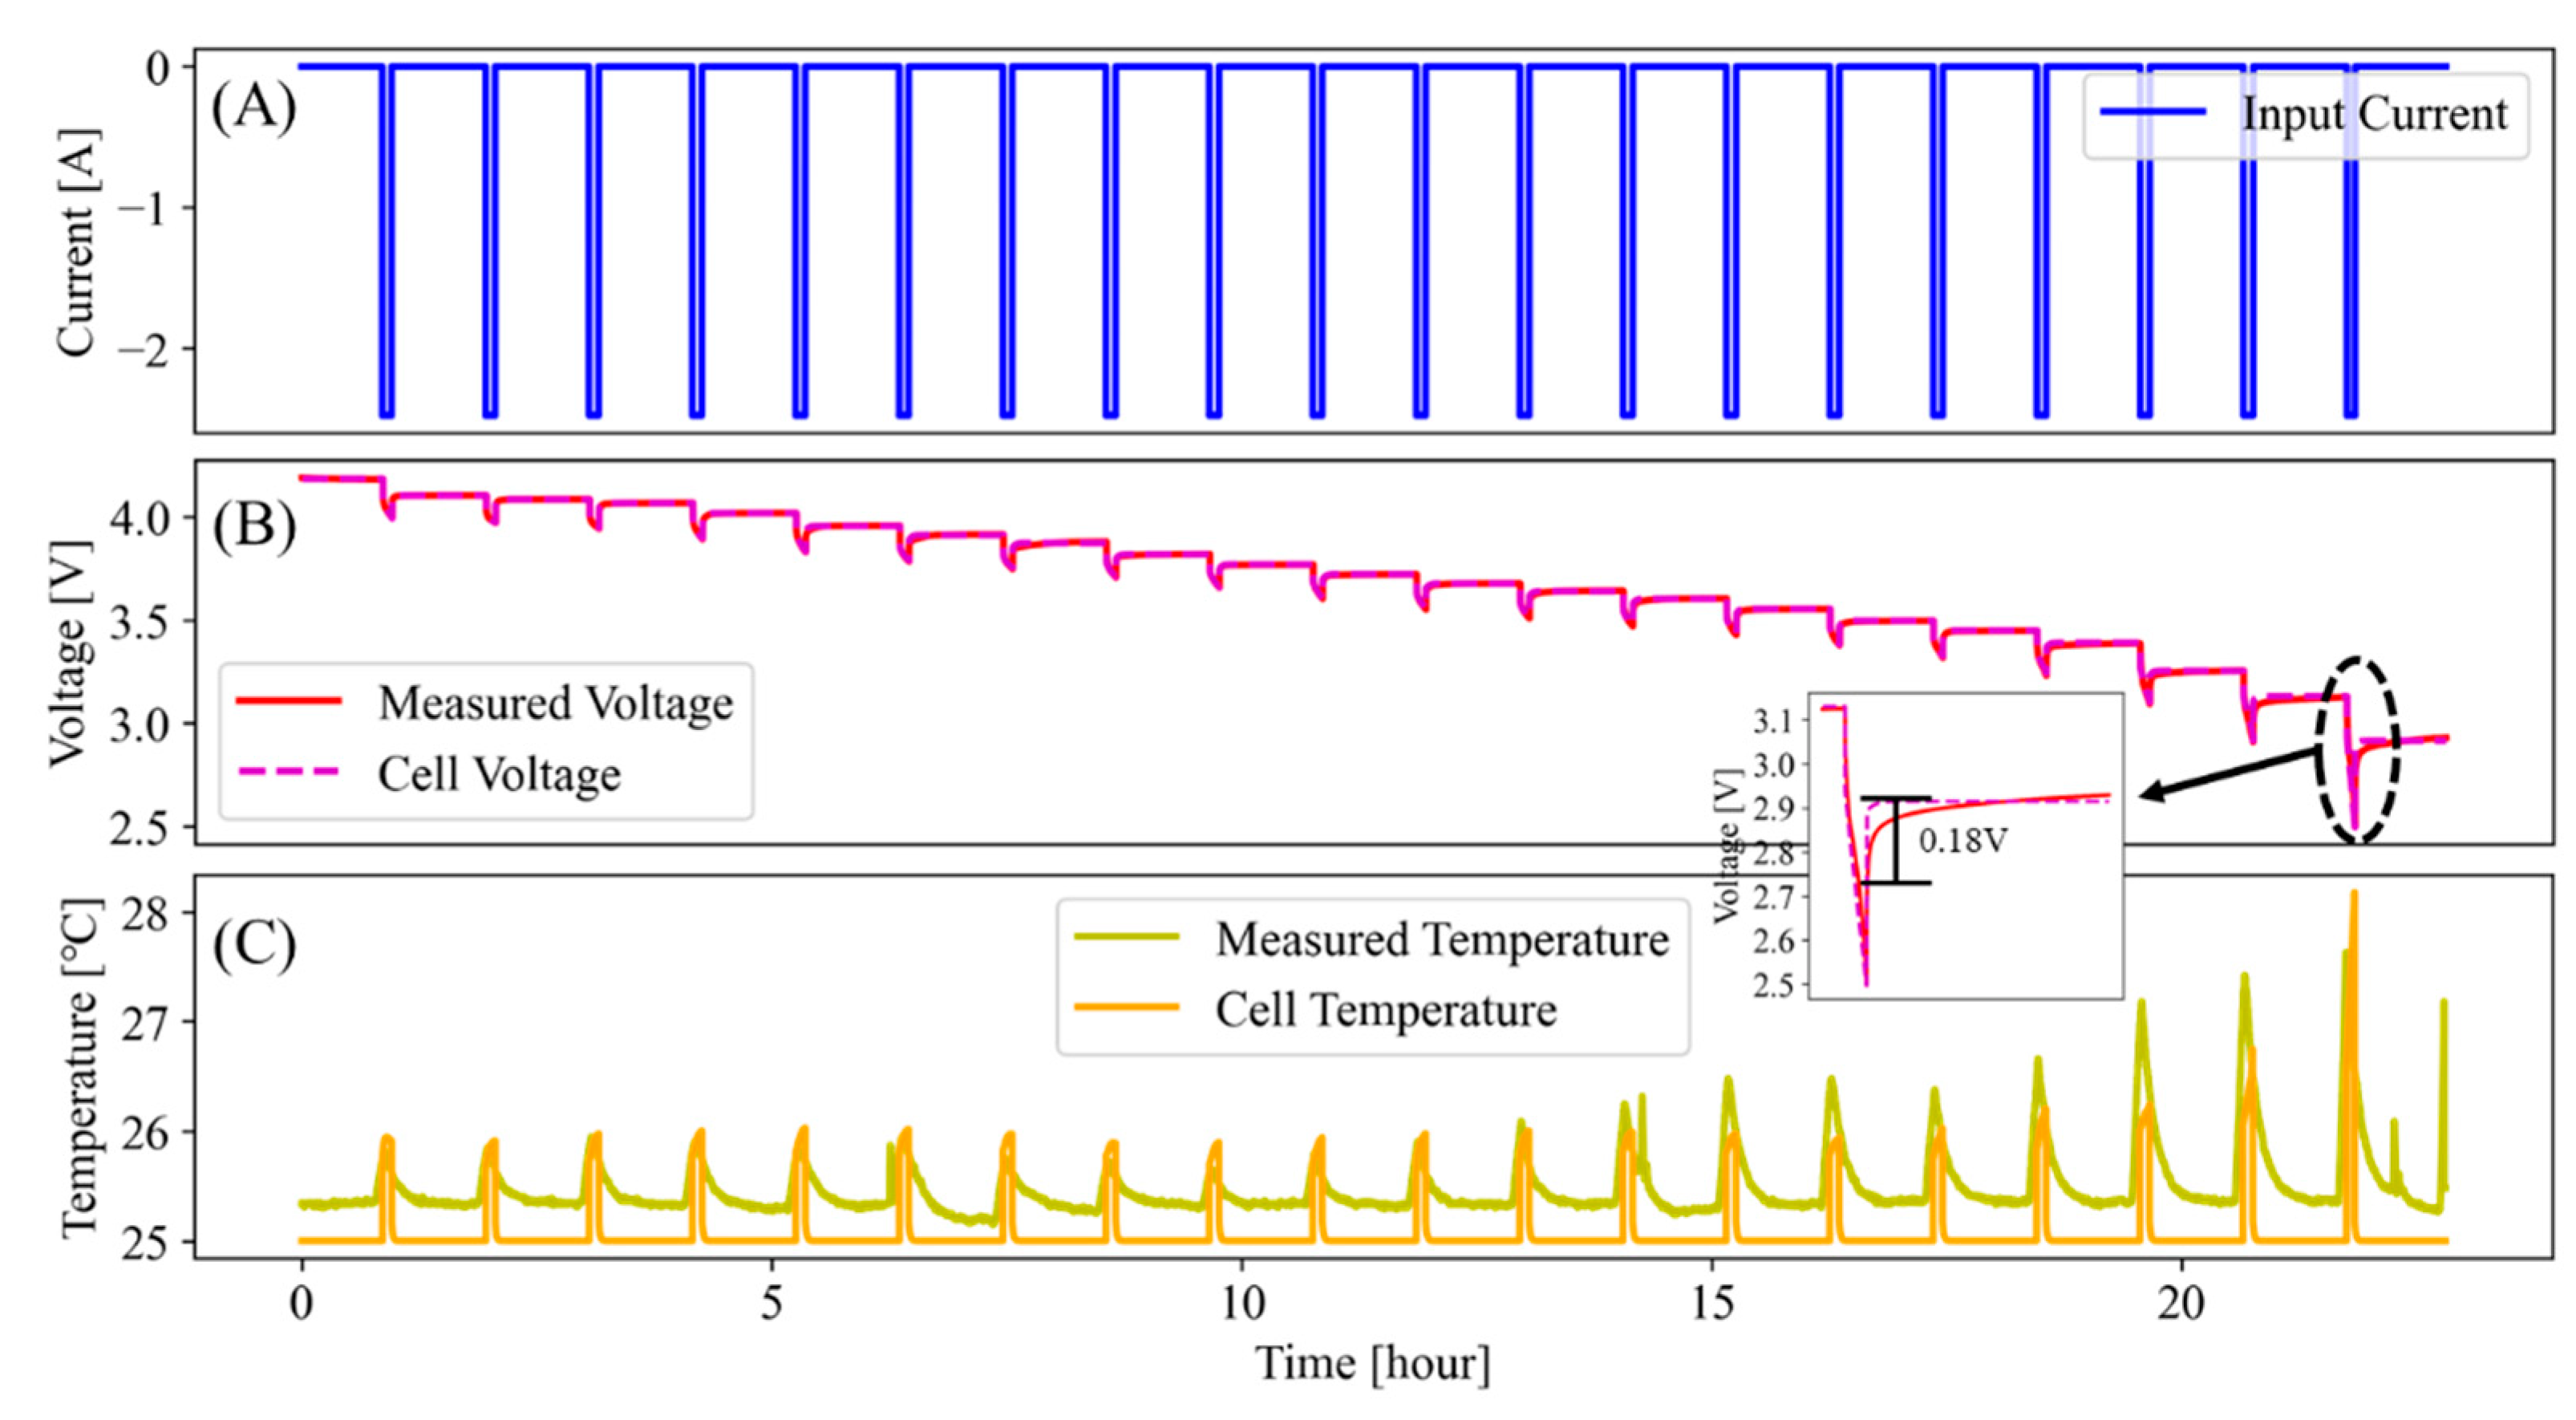
2.1.3. Battery Model Verification in Simulation

The performance of battery model is verified through the voltage response. The internal resistance of the battery is remarkably influenced by aging and operating temperature, and the SOC affects the shape of the response voltage [23]. The battery model is set with the parameters identified in Section 2.1.1. The surface temperature of the battery is calculated by considering the amount of heat generated by convective heat and resistance between cells when current flows. The simulation included a temperature sensor and a source in addition to the battery model. The convective heat represents a heat transfer by convection between two cells by means of fluid motion and calculated as follows:
Q = k · A · T C e l l 1 T c e l l 2
where, Tcell1 and Tcell2 are temperature of two cells. k and A are heat transfer coefficient and surface area, respectively. The setting values of each k and A are 0.01 m2 and 3 W/m2K. In this study, the battery uses a simplified electrical thermal model rather than a chemical thermal model. The cell temperature is determined from a summation of all the ohmic losses.
C T T ˙ = i V   i 2 / R i
where CT is the battery thermal mass. i corresponds to the ith ohmic loss contributor and include series and polarization resistance. The value of CT is 950 J/kgK and initial temperature is 298.45.
Therefore, in this section, the performance of the model was verified by comparing acquired data with actual battery data. Figure 3 shows the difference between the simulated cell voltage and the actual voltage at 25 °C. The maximum error was 0.18 V, which is within 5% (0.21 V) of the real-time voltage. The battery cell temperature ranged from 25 °C to 27 °C, showing similar results to the actual battery experiment. Table 1 illustrates the voltage accuracies for each operating temperature. We compared the performance of the model using two metrics: the mean-absolute error (MAE) and maximum error (MAX). The performance evaluation metric is expressed as follows:
MAE = 1 n 1 t = 1 n 1 e t
MAX = max ( | e t | )
where n denotes the size of datasets, et is a residual of the true SOC and estimated SOC.
The accuracy of the terminal voltage at 25 °C and 45 °C showed similar results; however, at 0 °C, the accuracy was 0.92% lower than that at room temperature. Thus, by achieving an accuracy within 95% at the three operating temperatures, the battery model was set to the conditions provided in Section 2.1.2.

2.2. SOC Estimation Algorithm

2.2.1. Extended Kalman Filter (EKF)

The EKF is a nonlinear version of the Kalman filter that linearizes the estimate of the mean and covariance [11]. In the EKF, the distribution was approximated by a GRV (Gaussian Random Variable), which is then propagated analytically through first-order linearization [24]. In a nonlinear dynamic system, the state space can be described as
x k + 1 = F x k ,   u k + ω k           ω k   ~   N 0 ,   Q k y k = H x k ,   u k + v k               v k ~ N 0 ,   R k
where xk, uk, yk, ωk, and vk are the unobserved state, control vector, observed signal, process noise, and observation noise, respectively.
Transform Equations (1) and (2) to a discrete system:
V 1 ,   k + 1 = exp 1 R 1 C 1 × V 1 ,   k + 1 exp 1 R 1 C 1 × I L ,   k R 1 V L ,   k = V O C ,   k R 0 ,   k I L V 1 ,   k
The state transition matrix and observation matrix of nonlinear systems are obtained using the first-order Taylor formula to get the linearized result:
x k + 1 = A k x k + B k u k + ω k y k = C k x k + D k u k + v k
V1 and SOC are the state variables and VL is the observable variable, the standard state function is as follows:
x k + 1 = V 1 ,   k + 1 SOC k + 1 = 1 Δ t R 1 C 1 0 0 1 V 1 ,   k SOC k + Δ t / C 1 Δ t / Q n I k + ω k y k = V L ,   k = 1     0 V 1 ,   k SOC k R 0 I k + V o c + v k

2.2.2. Unsented Kalman Filter (UKF)

The UKF used a deterministic sampling method to solve the posterior mean and covariance errors that may occur in the process of first-order linearization of a nonlinear system by approximating a Gaussian random variable in the state distribution of the EKF. It uses an unscented transformation to approximate a Gaussian distribution without approximating any nonlinear function [13,25,26]. When the nonlinear equation, y = f(x), has mean (xm) and covariance (Px), the sigma point (xi) represents a point separated by a distance ± ui from the mean and is expressed as follows:
x 0 = x m x i = x m + u i           i = 1 ,   2 ,   ,   n x i = x m u i             i = L + 1 ,   ,   2 n
u i = n + λ P x
where λ is the scaling parameter, and ui is the ith row of the matrix square root. These sigma vectors are propagated through a nonlinear function.
y i = g X i             i = 0 ,   1 ,   ,   2 n
The mean of sigma vectors and covariance are expressed as follows:
y m     i = 0 2 n W i m y i P y i = 0 2 n W i c   y i y m y i y m T
where ym and Py are approximated using the weighted sample mean and covariance of the posterior sigma points.
W 0 m = λ / n + λ W 0 c = λ n + λ + 1 α 2 + β W i m = W i c = 1 2 n + λ                     i = 1 ,   2 ,   . ,   2 n
where α determines the spread of the sigma points around xm and is usually set to a small positive value. k is a secondary scaling parameter that is usually set to 0, and β is used to incorporate previous knowledge of the distribution of x (for Gaussian distributions, β = 2 is optimal).

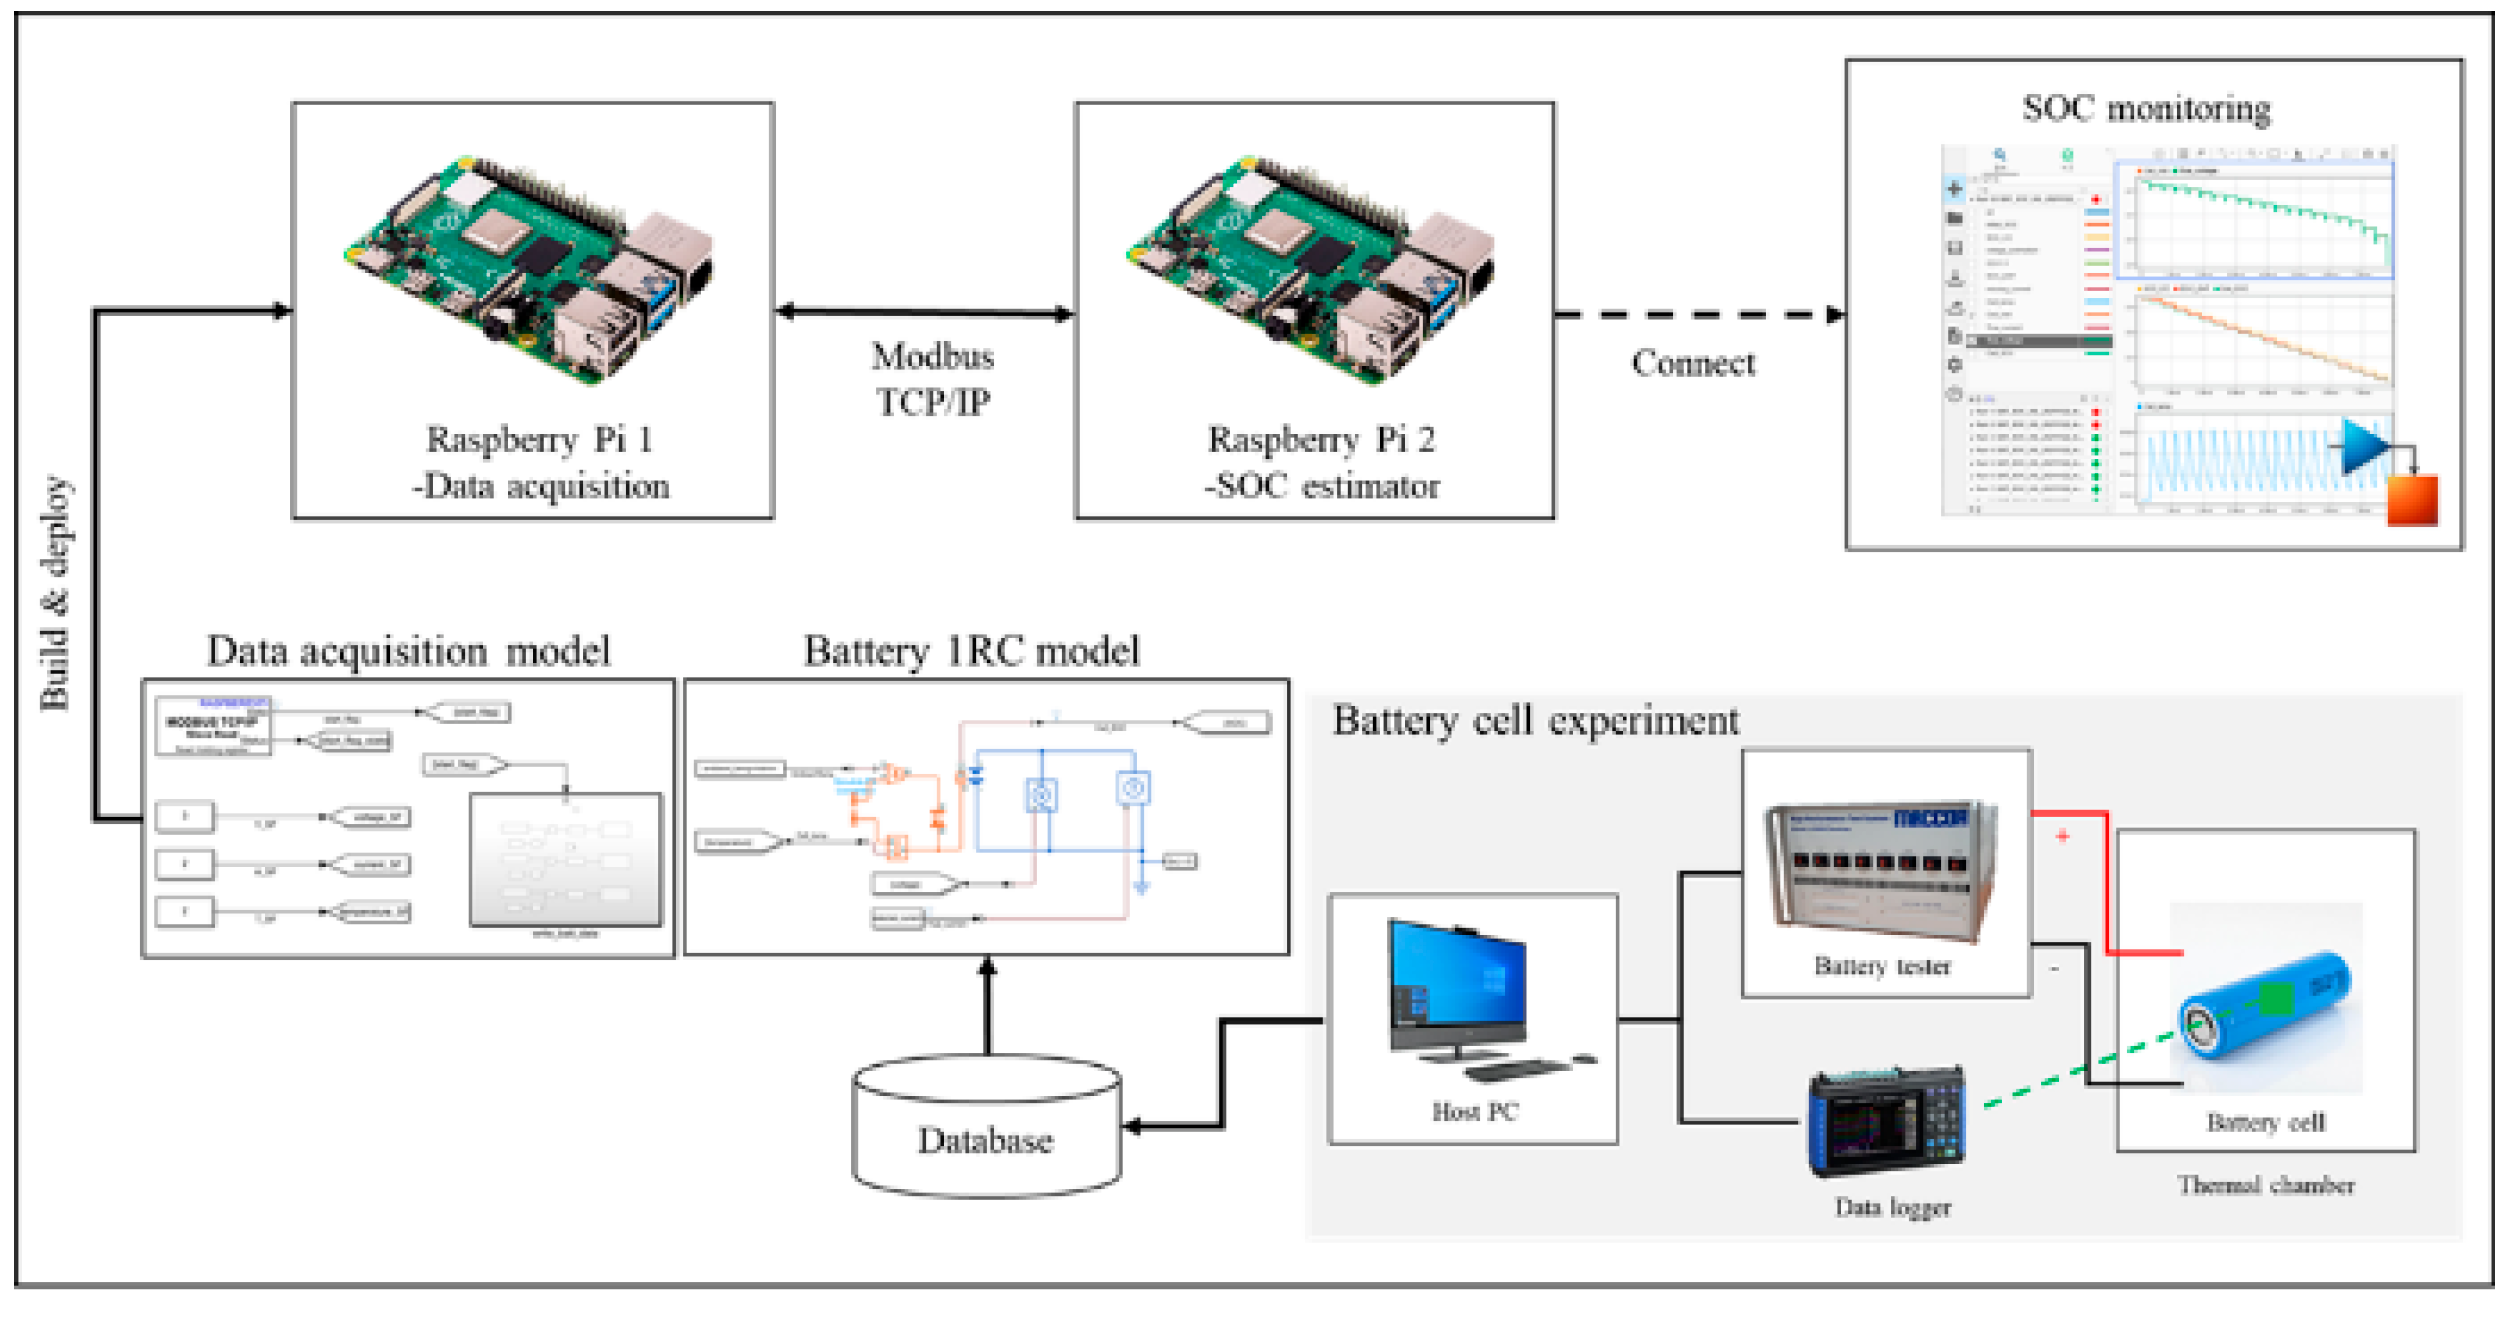
3. Experimental Setup for Real-Time Test
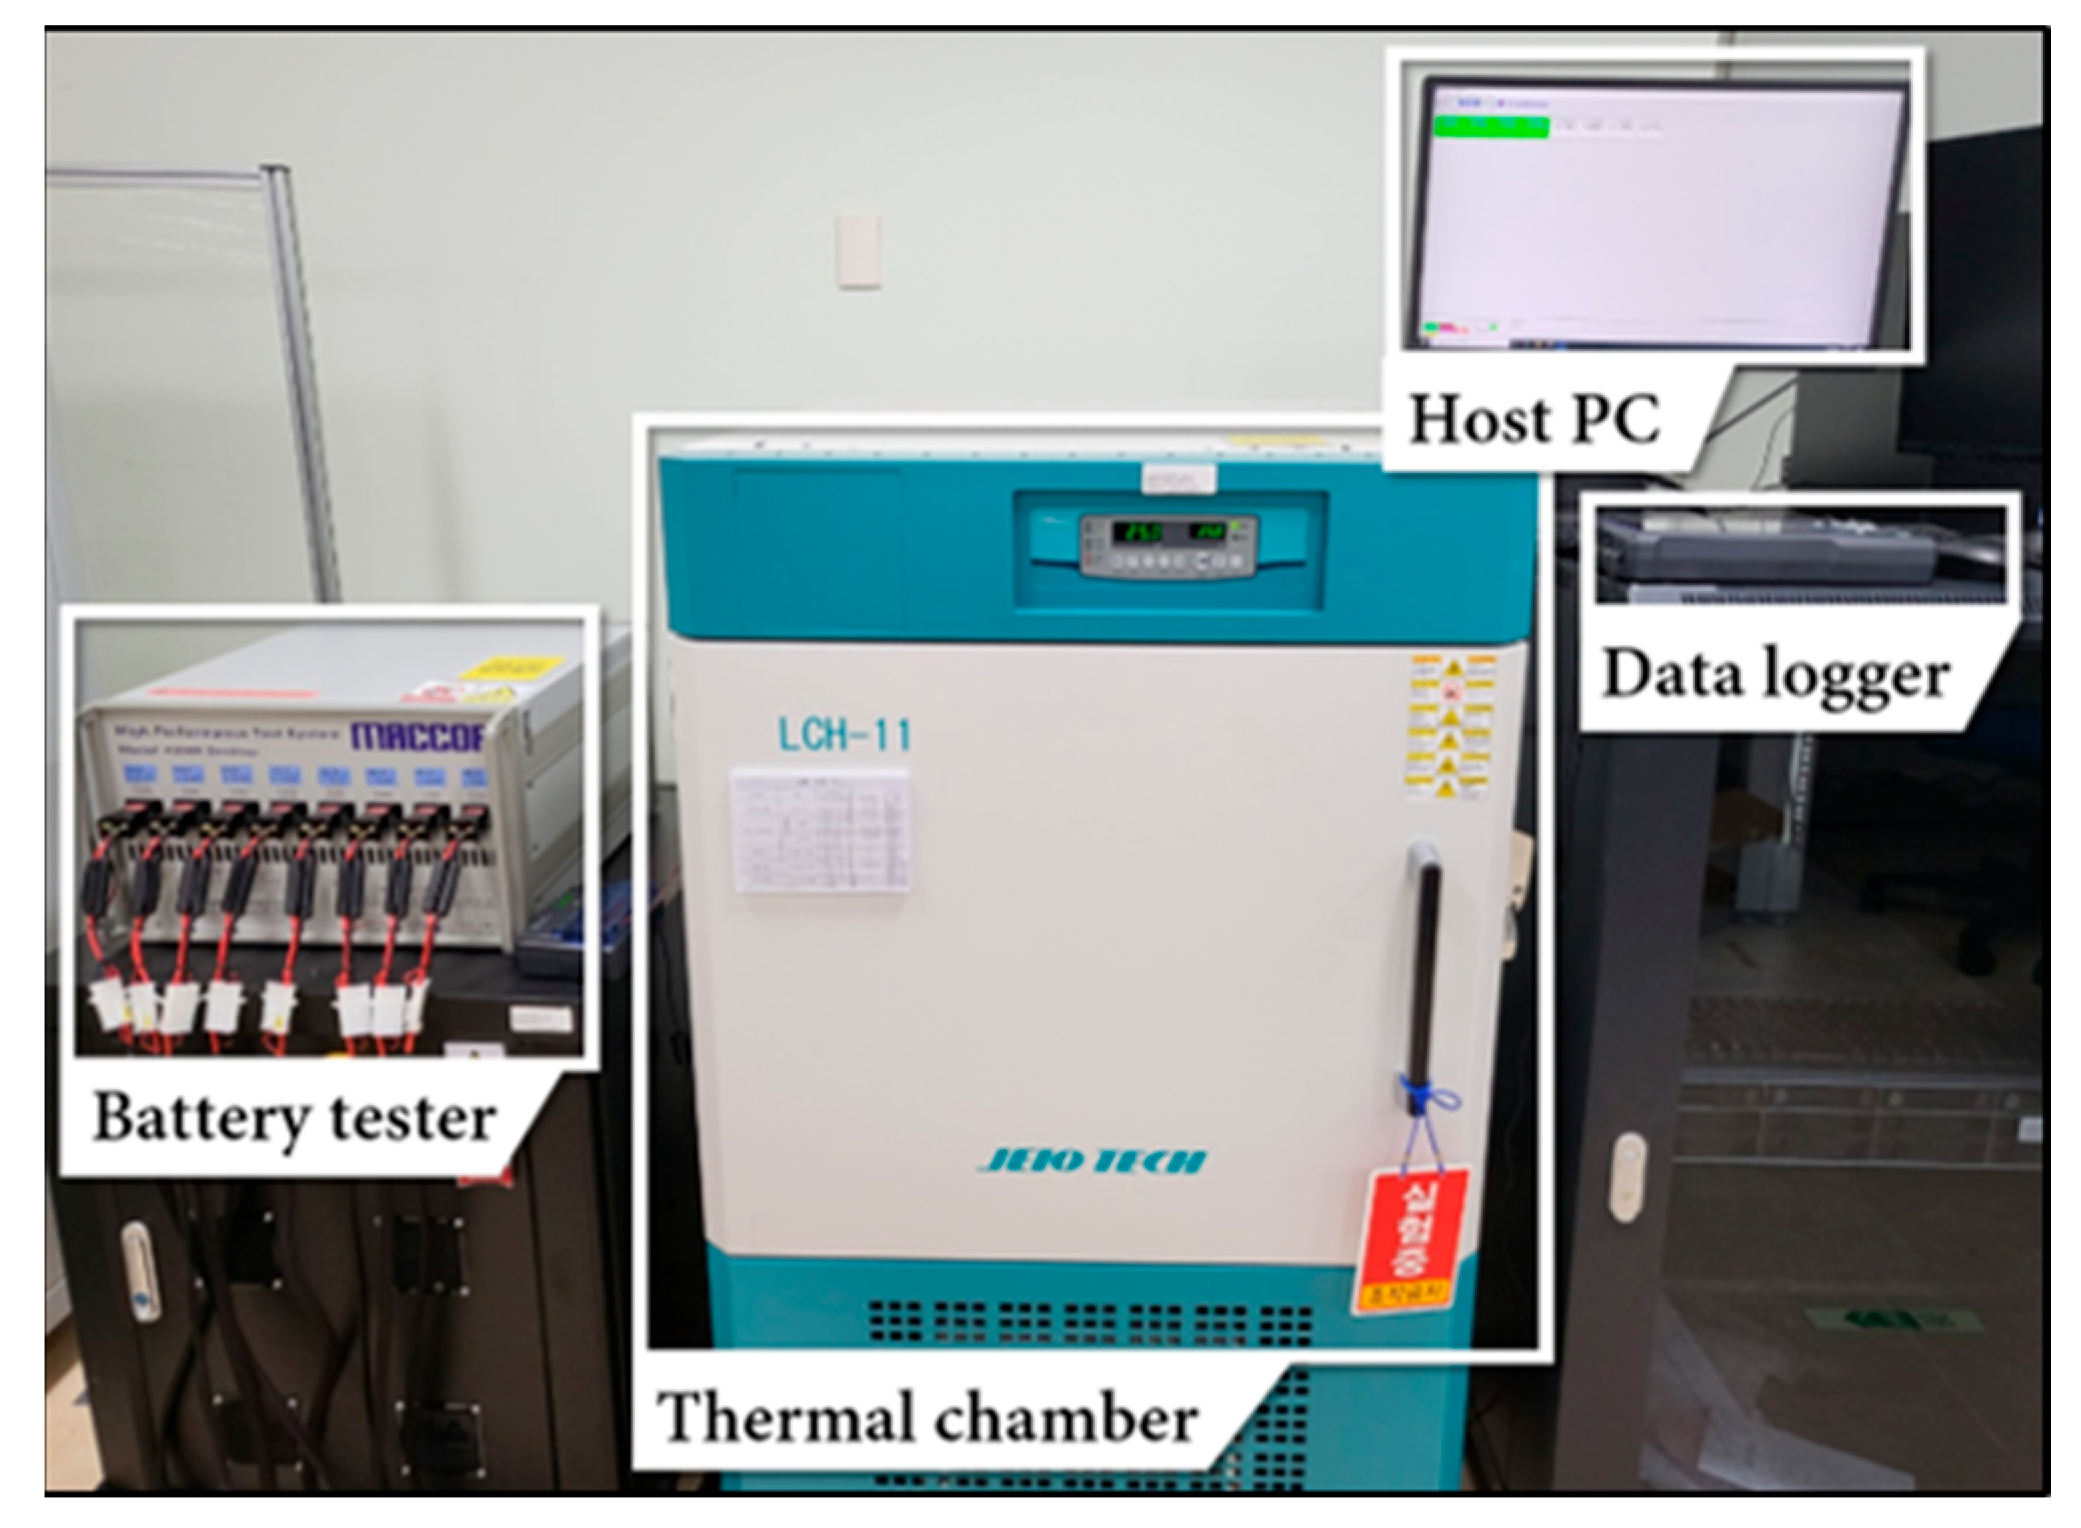
3.1. Test Bench

The test bench based on HIL for real-time SOC estimation consisted of a battery experiment setup and two Raspberry Pis. Raspberry Pi 1 and Pi 2 are the battery plant and SOC estimators, respectively. Figure 4 shows the overall cell-level test bench and it involves three principal steps to achieve this objective. The first step was to perform constant current-pulse discharge tests at 0 °C, 25 °C, and 40 °C to establish the battery equivalent model. The second step was to deploy this model to each Raspberry Pi, where the hardware configuration was set. To test for limited resources, we adjusted the sample time and battery unit and calculated the computational cost. This is discussed in detail in Section 4. The last step is the monitoring step, and the actual SOC is compared with the SOC estimated by the EKF and UKF.

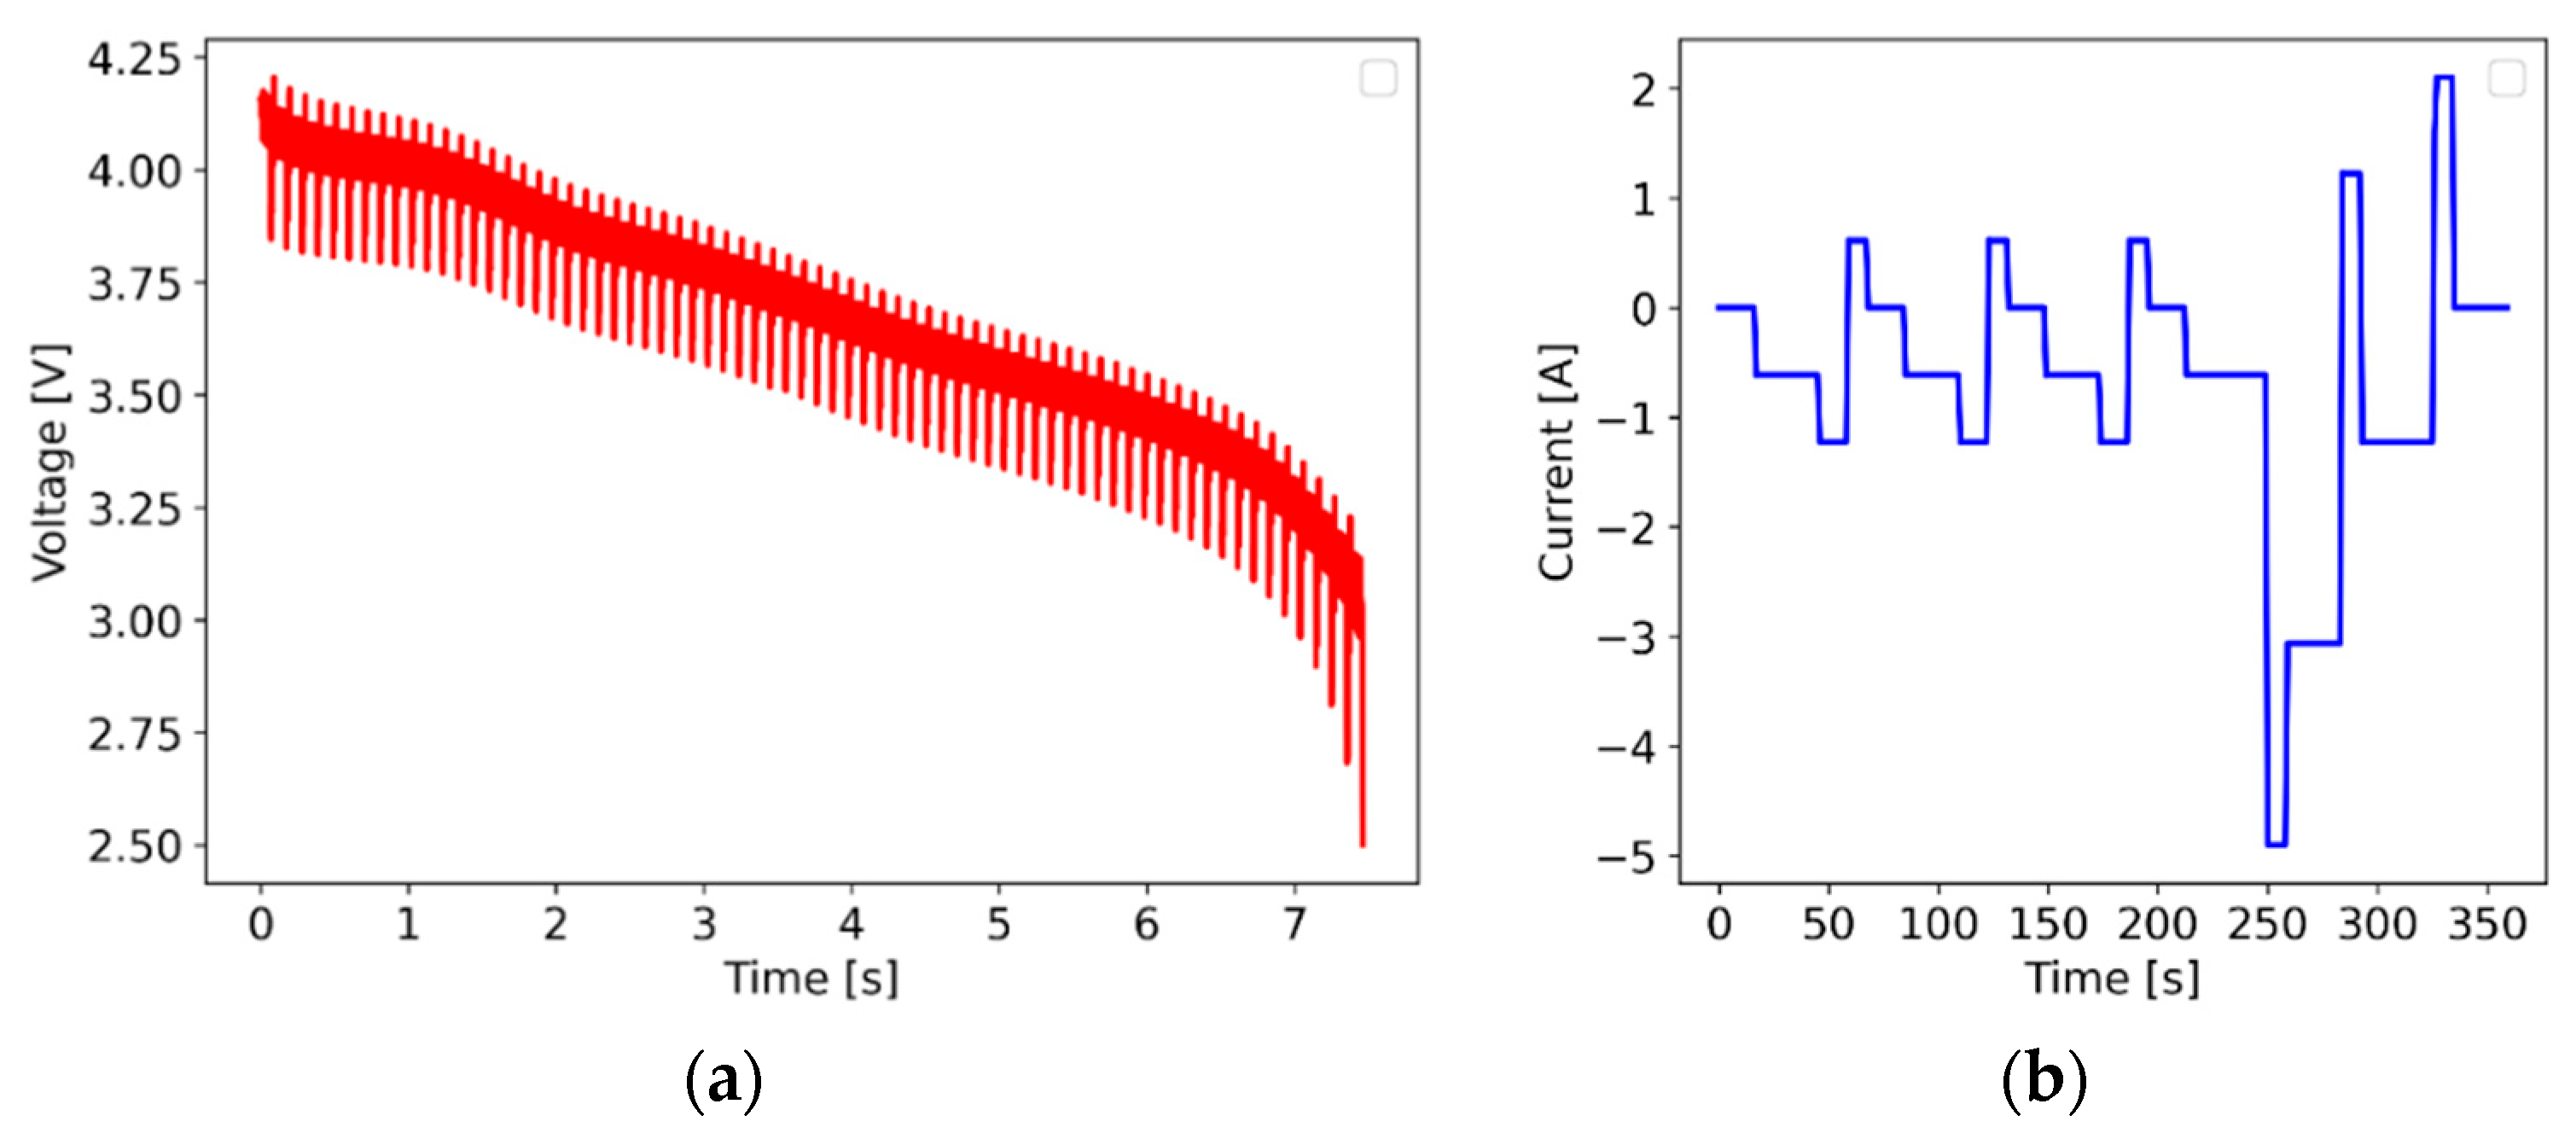
3.1.1. Battery Cell Experiment

The battery experimental platform is shown in Figure 5. It includes a battery testing equipment, a host computer, a thermal chamber, a data logger, and a LiB set consisting of four cells. The test subject was a 21700-50E battery cell with a capacity of 4900 mAh. Table 2 shows the detailed specifications, including the standard capacity and the nominal voltage. The test subjects were exposed to two testing profiles: a constant-current pulsed discharge profile and a dynamic stress test. Dynamic stress test (DST) profiles were designed by the US Advanced Battery Consortium to simulate the discharge mode of an EV battery [27]. The measured voltages and currents are shown in Figure 6. Datasets were constructed by repeating the procedure at chamber temperatures of 0 °C, 25 °C, and 45 °C for the battery samples. Before the full-scale experiment, temperature soaking was performed for 3 h to stabilize the internal chemistry of cells. The constant-current pulsed discharge profile for battery parameter identification consists of two steps. First, the cells were charged with a constant current-constant voltage of 0.5 C (2.45 A) and terminated when the upper limit voltage of 4.2 V was reached. Second, the discharge was repeated at 0.5 C until a cut-off voltage of 2.5 V was reached. The cells were made to rest for stabilization after the process. The DST profile considers regenerative charging and consists of various charge-discharge current cycles of different lengths and amplitudes, with a duration of 360 s. This cycle was repeated until the cut-off voltage was reached.

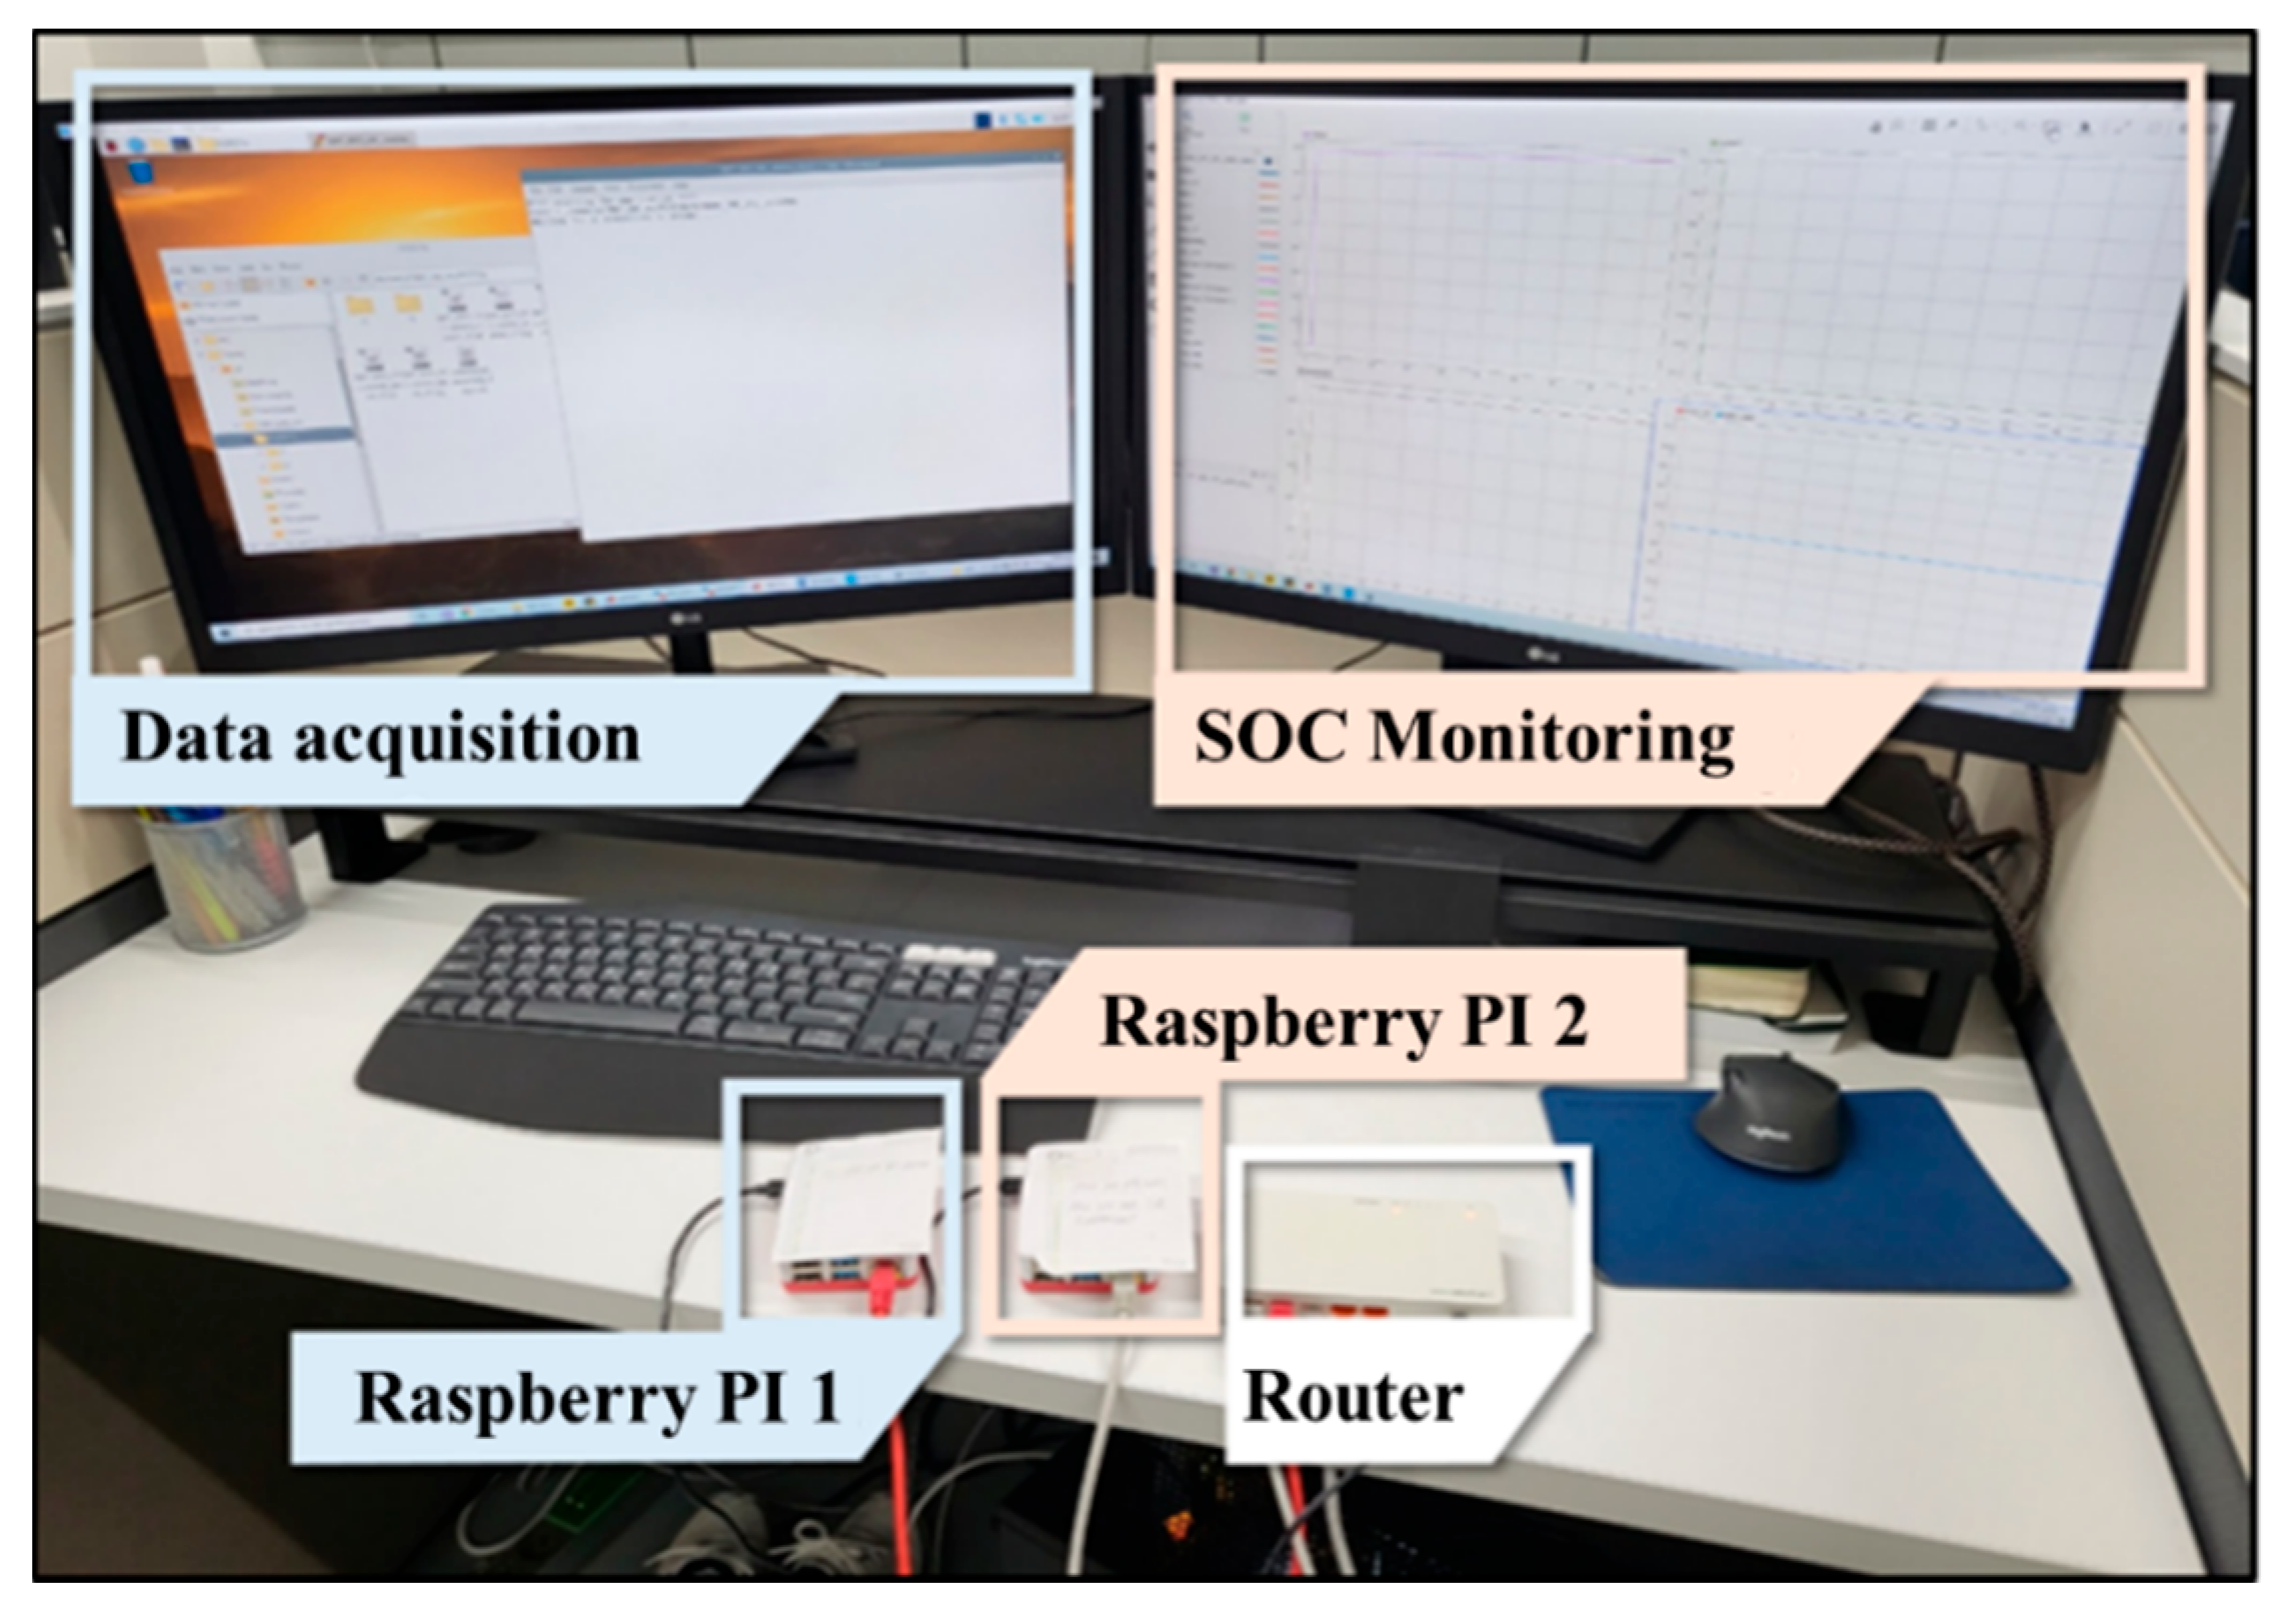
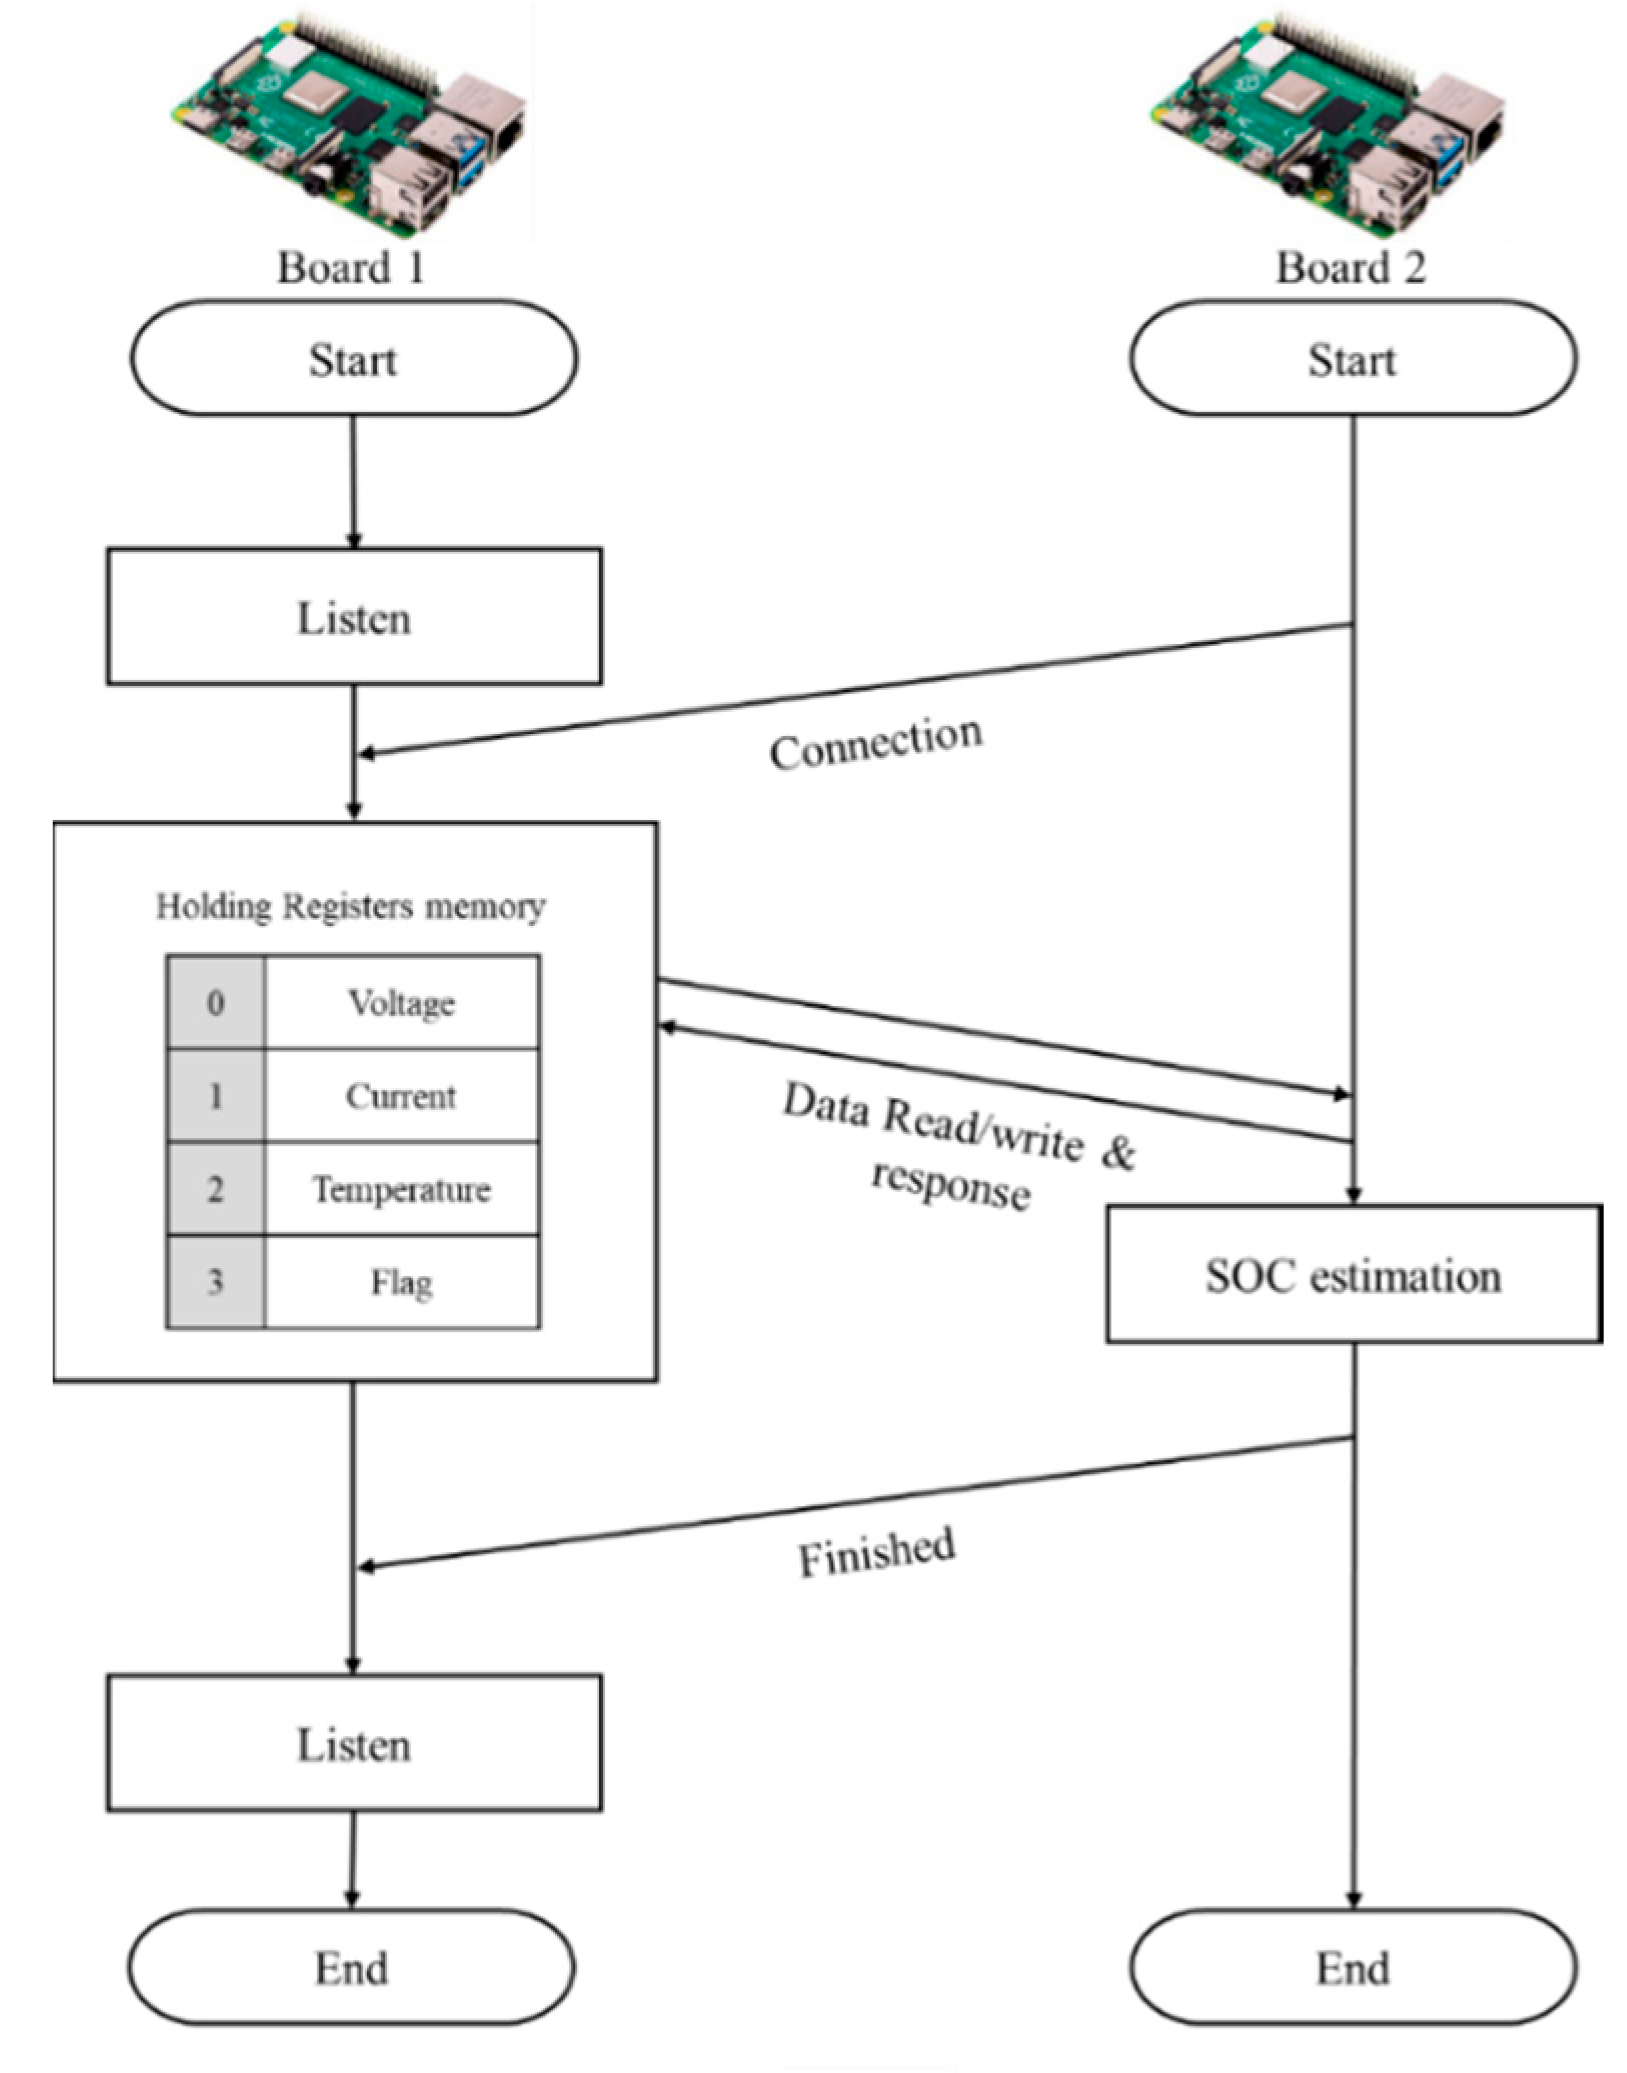
3.1.2. Raspberry Pi Setting

The Raspberry Pi was distributed directly through the MATLAB Raspberry Pi support package that runs as a standalone executable. The Raspberry Pi used as hardware was a Raspberry Pi 4 Model B, as shown in Table 3. The experimental setup of the two Raspberry Pis is shown in Figure 7. The Raspberry Pi 1 (slave) collected battery data and performed data transmission, while Raspberry Pi 2 (master) estimated the SOC using the received data. The communication interface and estimation algorithm period (sample time) were set at 1 s by default. The data type of the measurement signal was 16 bits and a scale factor was applied to ensure a variable range. Modbus TCP/IP was applied for communication between the embedded boards. Figure 8 shows the communication sequence using Modbus. Register addresses 0–2 stored the voltage, current, and temperature measured by the battery model, and address 4 stored a Boolean flag indicating the start of data transmission.

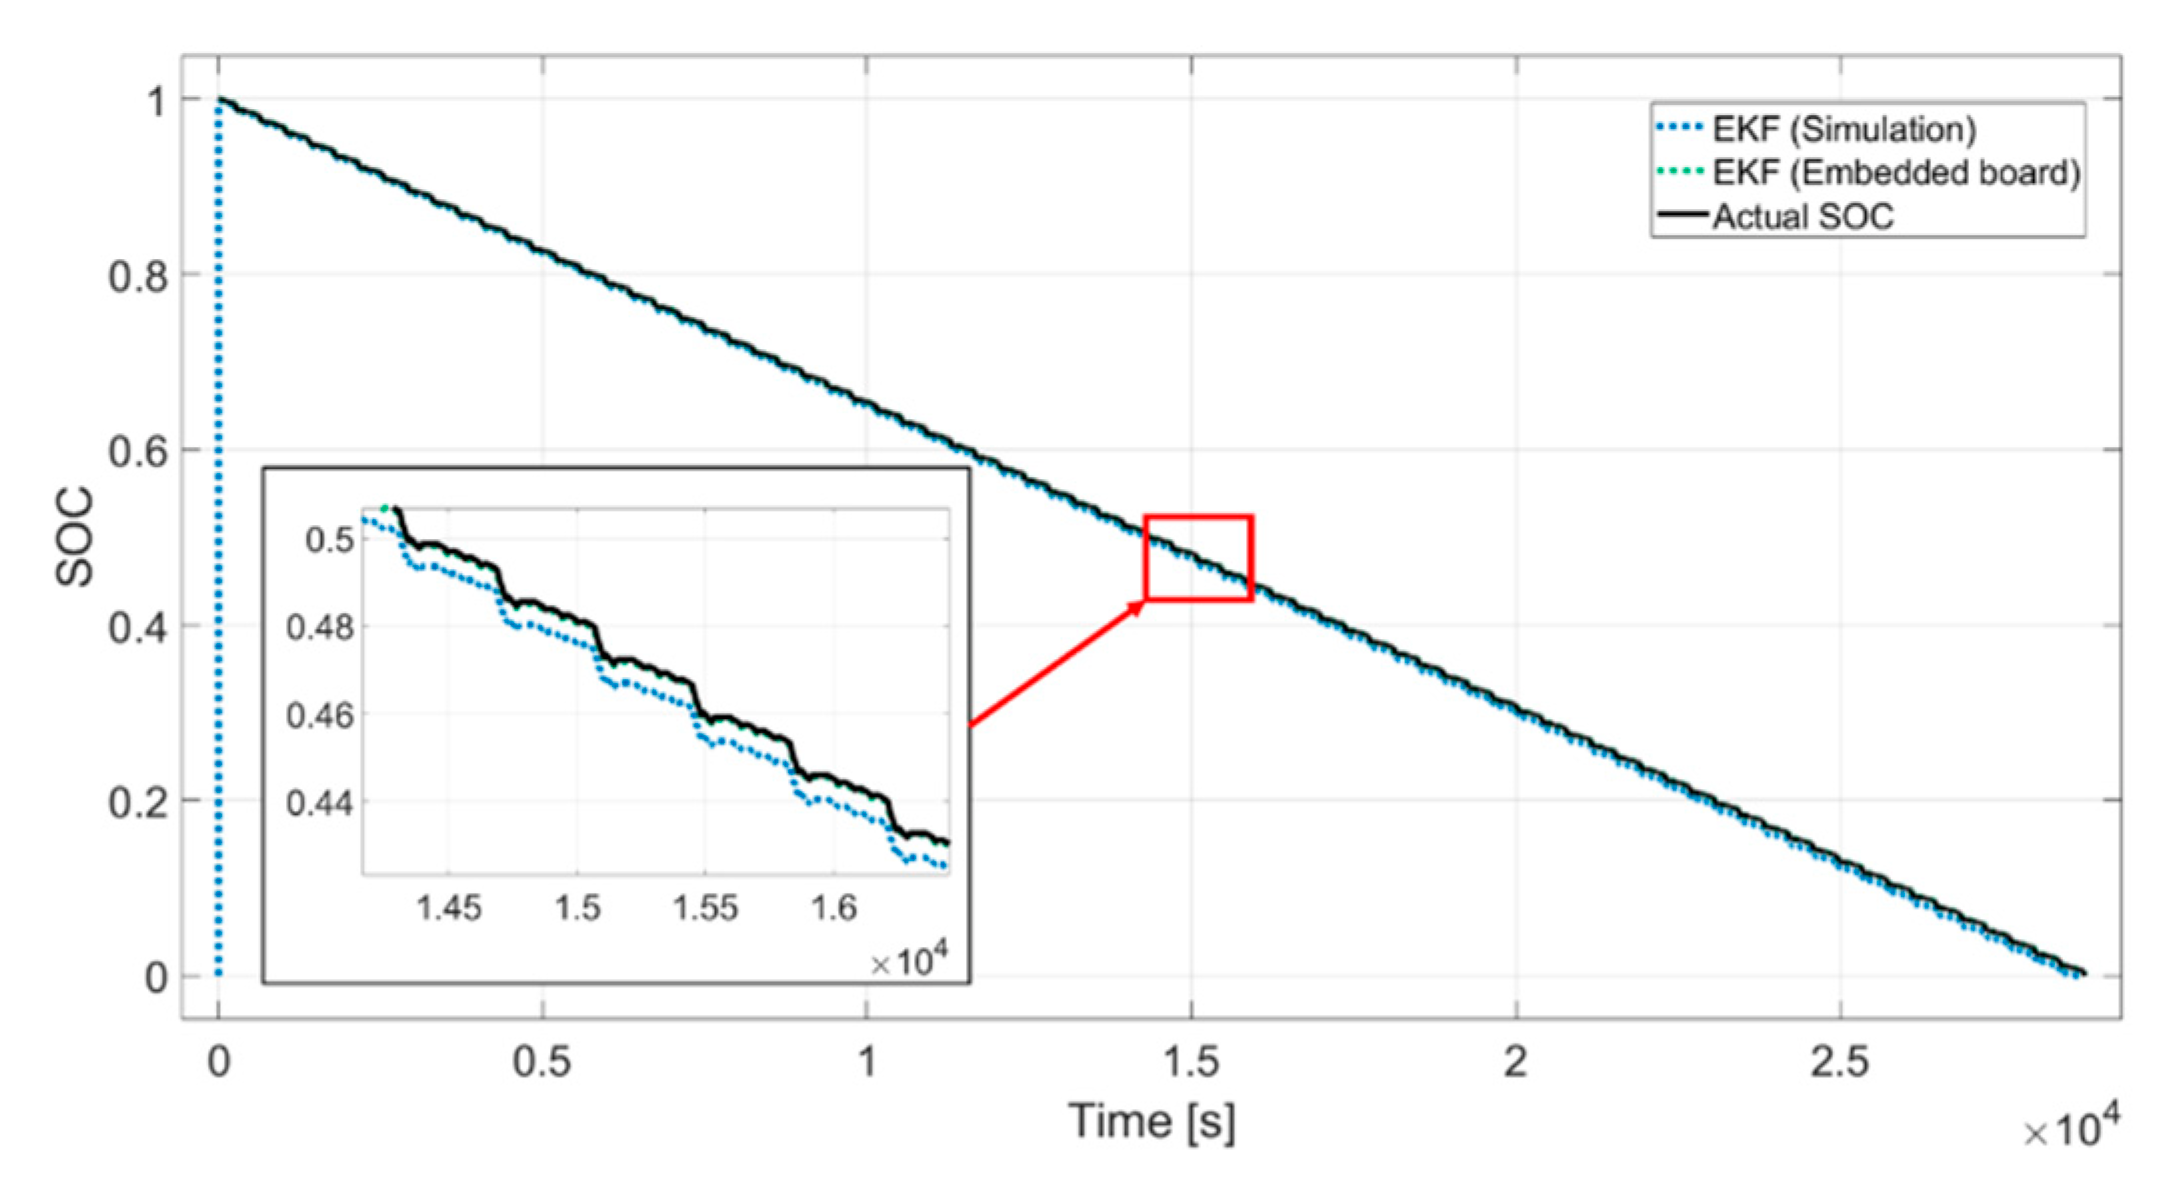
3.2. Residual SOC between Simulation and Embedded Board

Figure 9 shows the SOC estimation results between the embedded board and simulation using the same setup. The simulation result had a value close to that of the actual SOC estimate, but it demonstrated a difference of up to 0.8% from the actual SOC when an embedded board was used, despite having the same model conditions. This is caused by data precision.

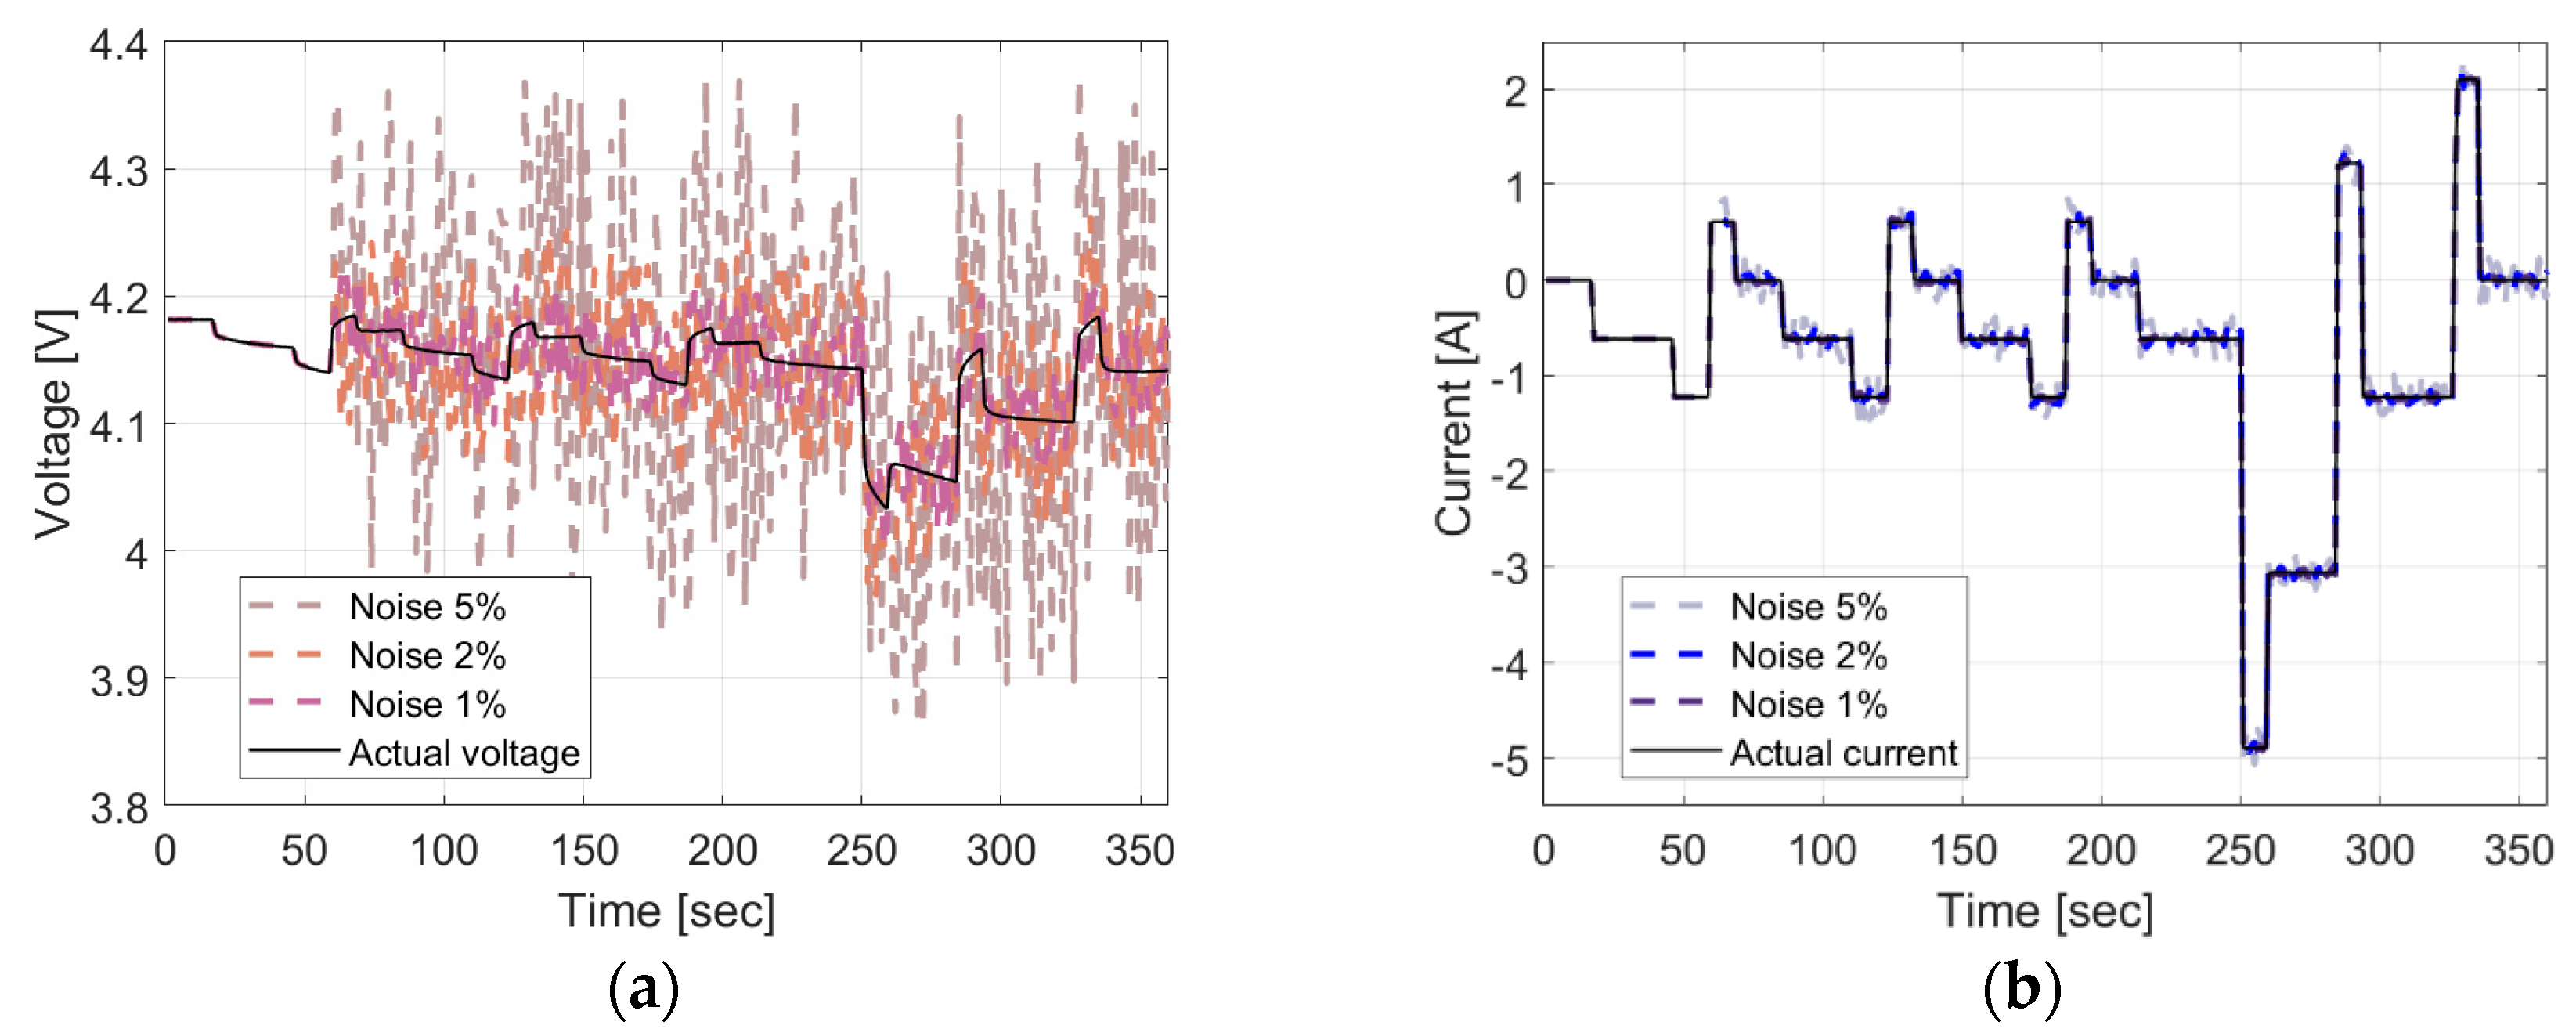
3.3. Sensor Noise Models

The performance of a BMS depends on battery sensor data and state indicators, such as SOC and SOH, and can be estimated based on these. Unreliable battery data are generated by sensor failures or communication errors [28]. According to actual EV tracking results, the maximum measurement error of the current and voltage in an environment with severe jamming is 2% [12]. In this section, we simulated the offset error due to sensor failure and the delay error due to communication errors, which are required for verification. The model for the constant offset error data is defined as:
y o f t = y t + r a n d n
where y(t) represented the normal signal, and t was the sample time. rand(n) was the constant offset value of each signal and is set to 1% and 2%, respectively. Figure 10 shows the voltage and current profiles with offset errors of 1%, 2%, and 5% applied after 360 s.

4. Results of Real-Time SOC Estimation

4.1. Analysis of Computing Cost

To analyze the limited computing power of the hardware, we performed a comparison test between the EKF and UKF. On Raspberry Pi, the execution time of the algorithm per sample time was less than 0.1 s, and no overrun occurred. Table 4 shows the computing cost of deployment when the number of algorithms is distributed as many as the number of cells. The time consumed and Load rate denote the initial execute time and memory usage that algorithms are deployed on Raspberry Pi. In both models, the initial computing cost increased as the number of cells increased. The UKF especially more consumes computing cost than EKF, because time consumed by unit cell increased by 7 s and load rate increased by 12.4%. The UKF needs a higher two-dimensional state space than the EKF, which causes a lot of computational cost. In conclusion, the hardware requirements for single-cell and pack unit battery models can be satisfied using Raspberry Pi.

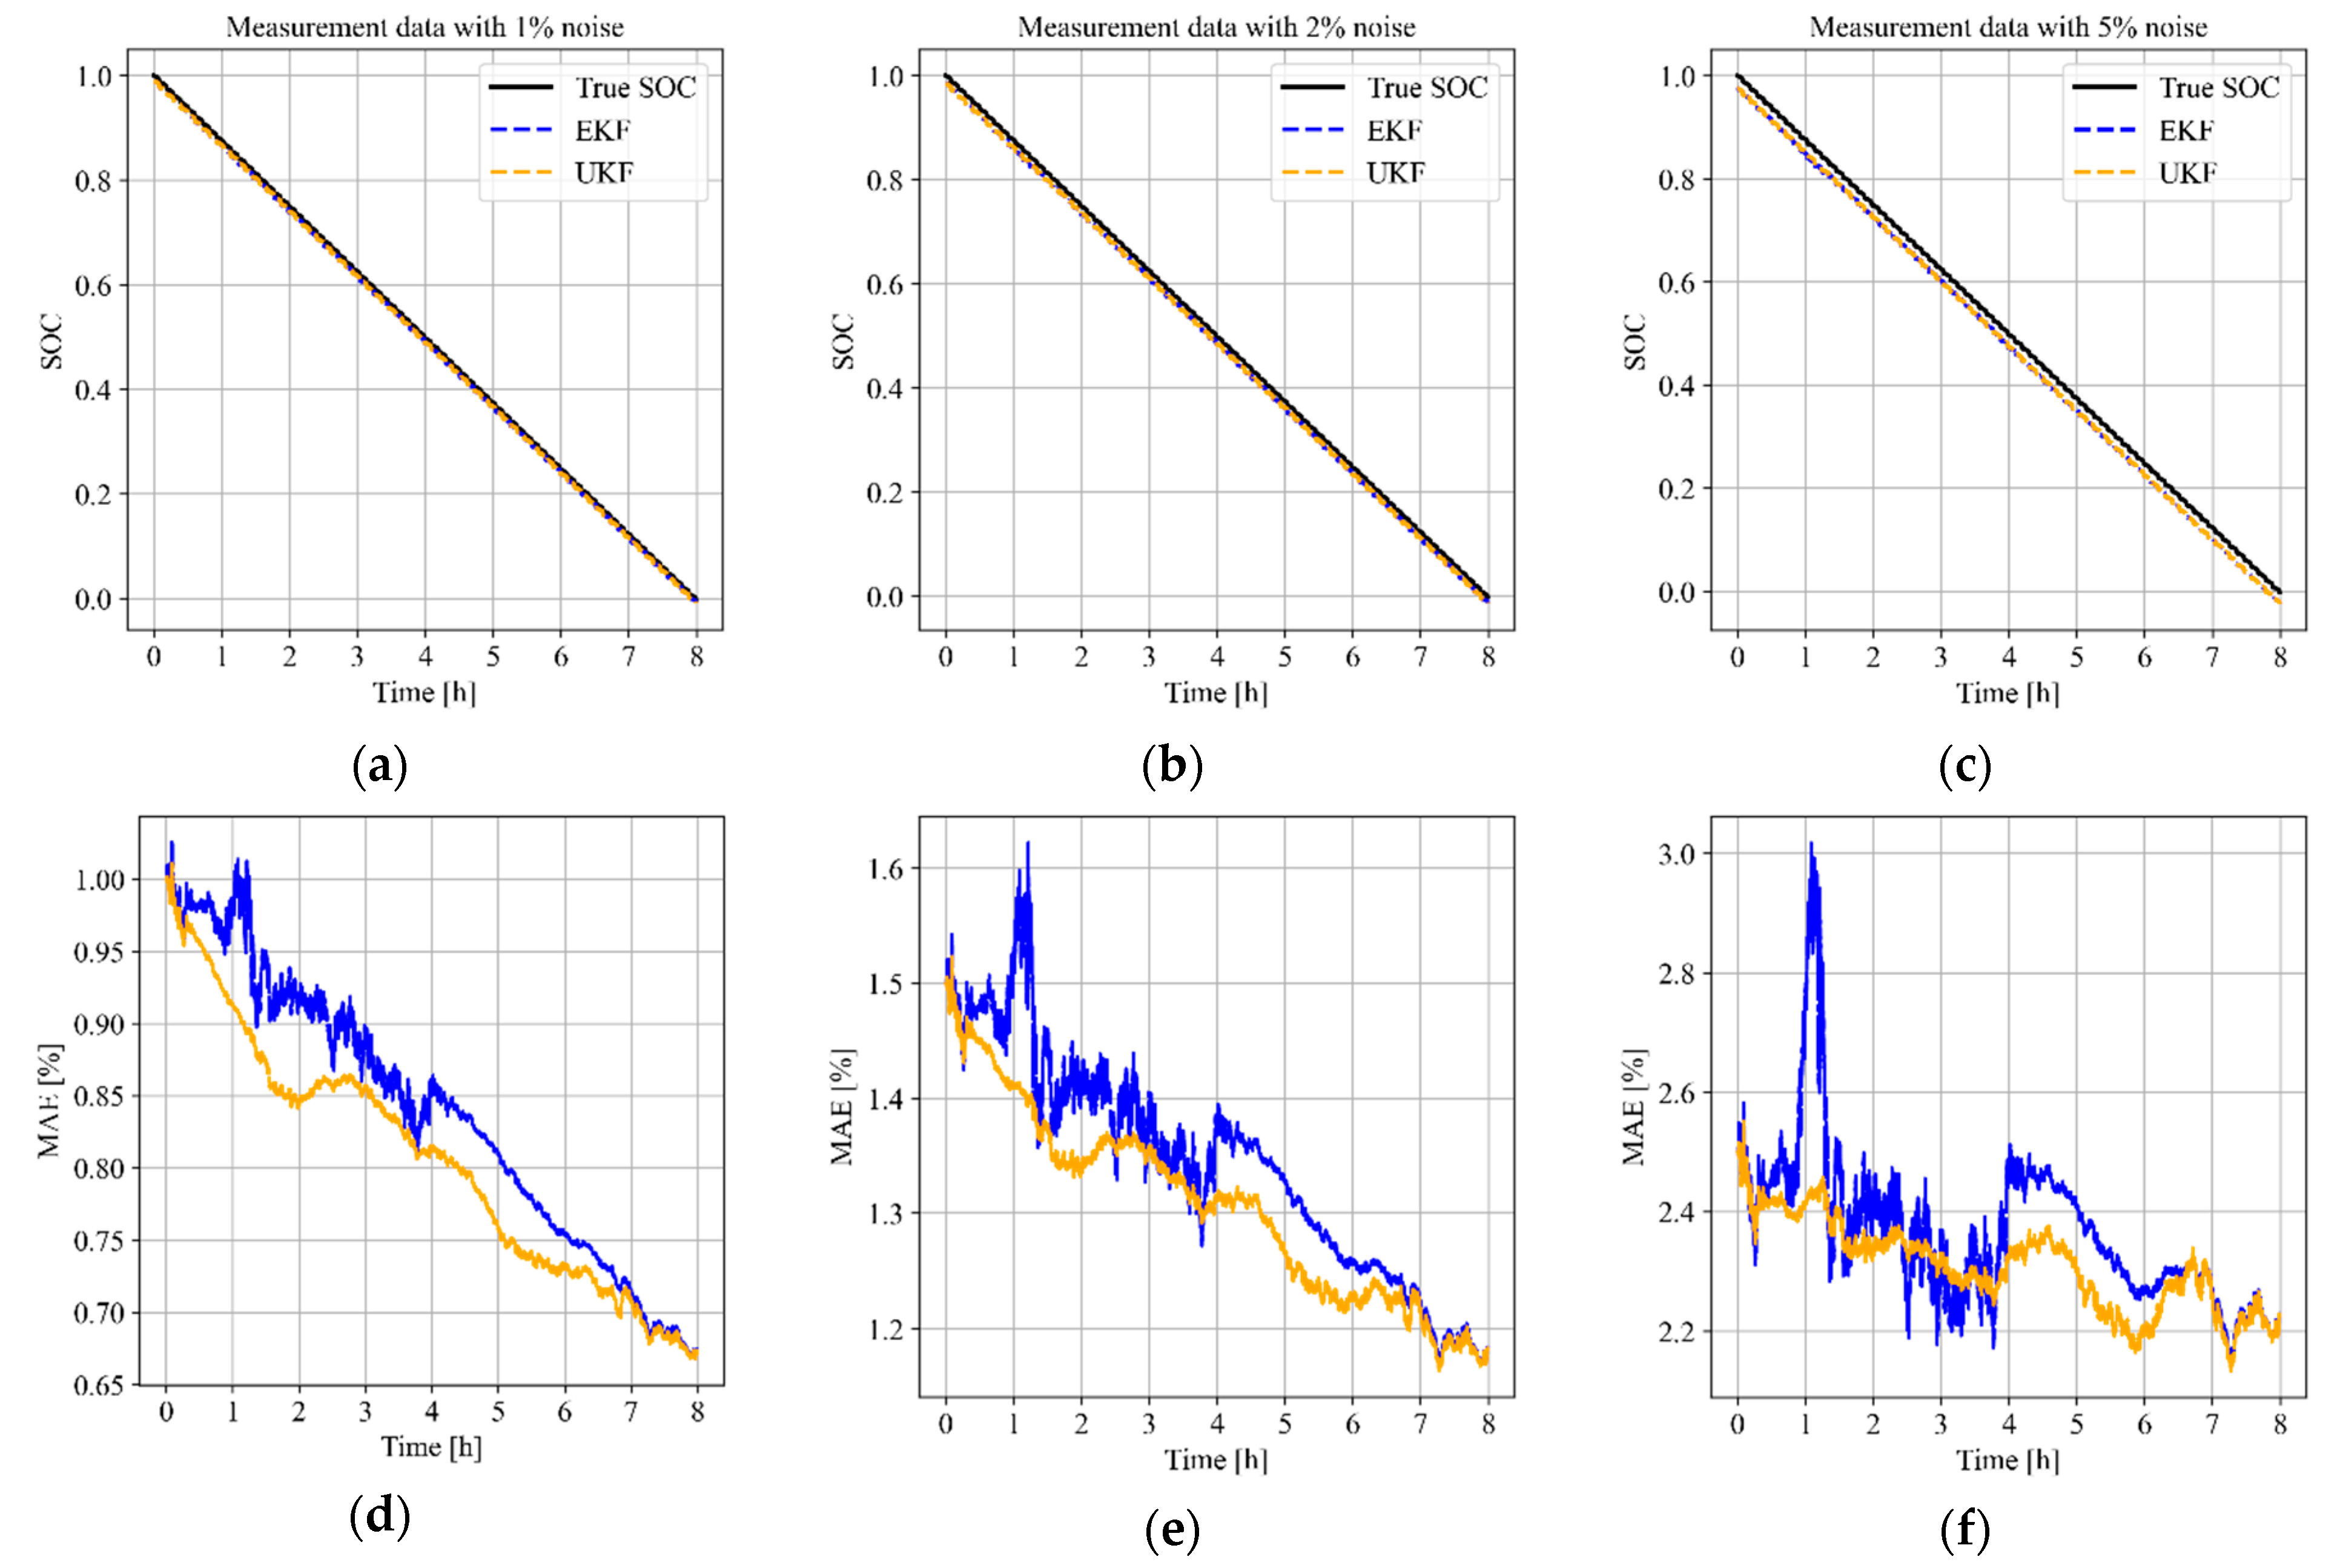
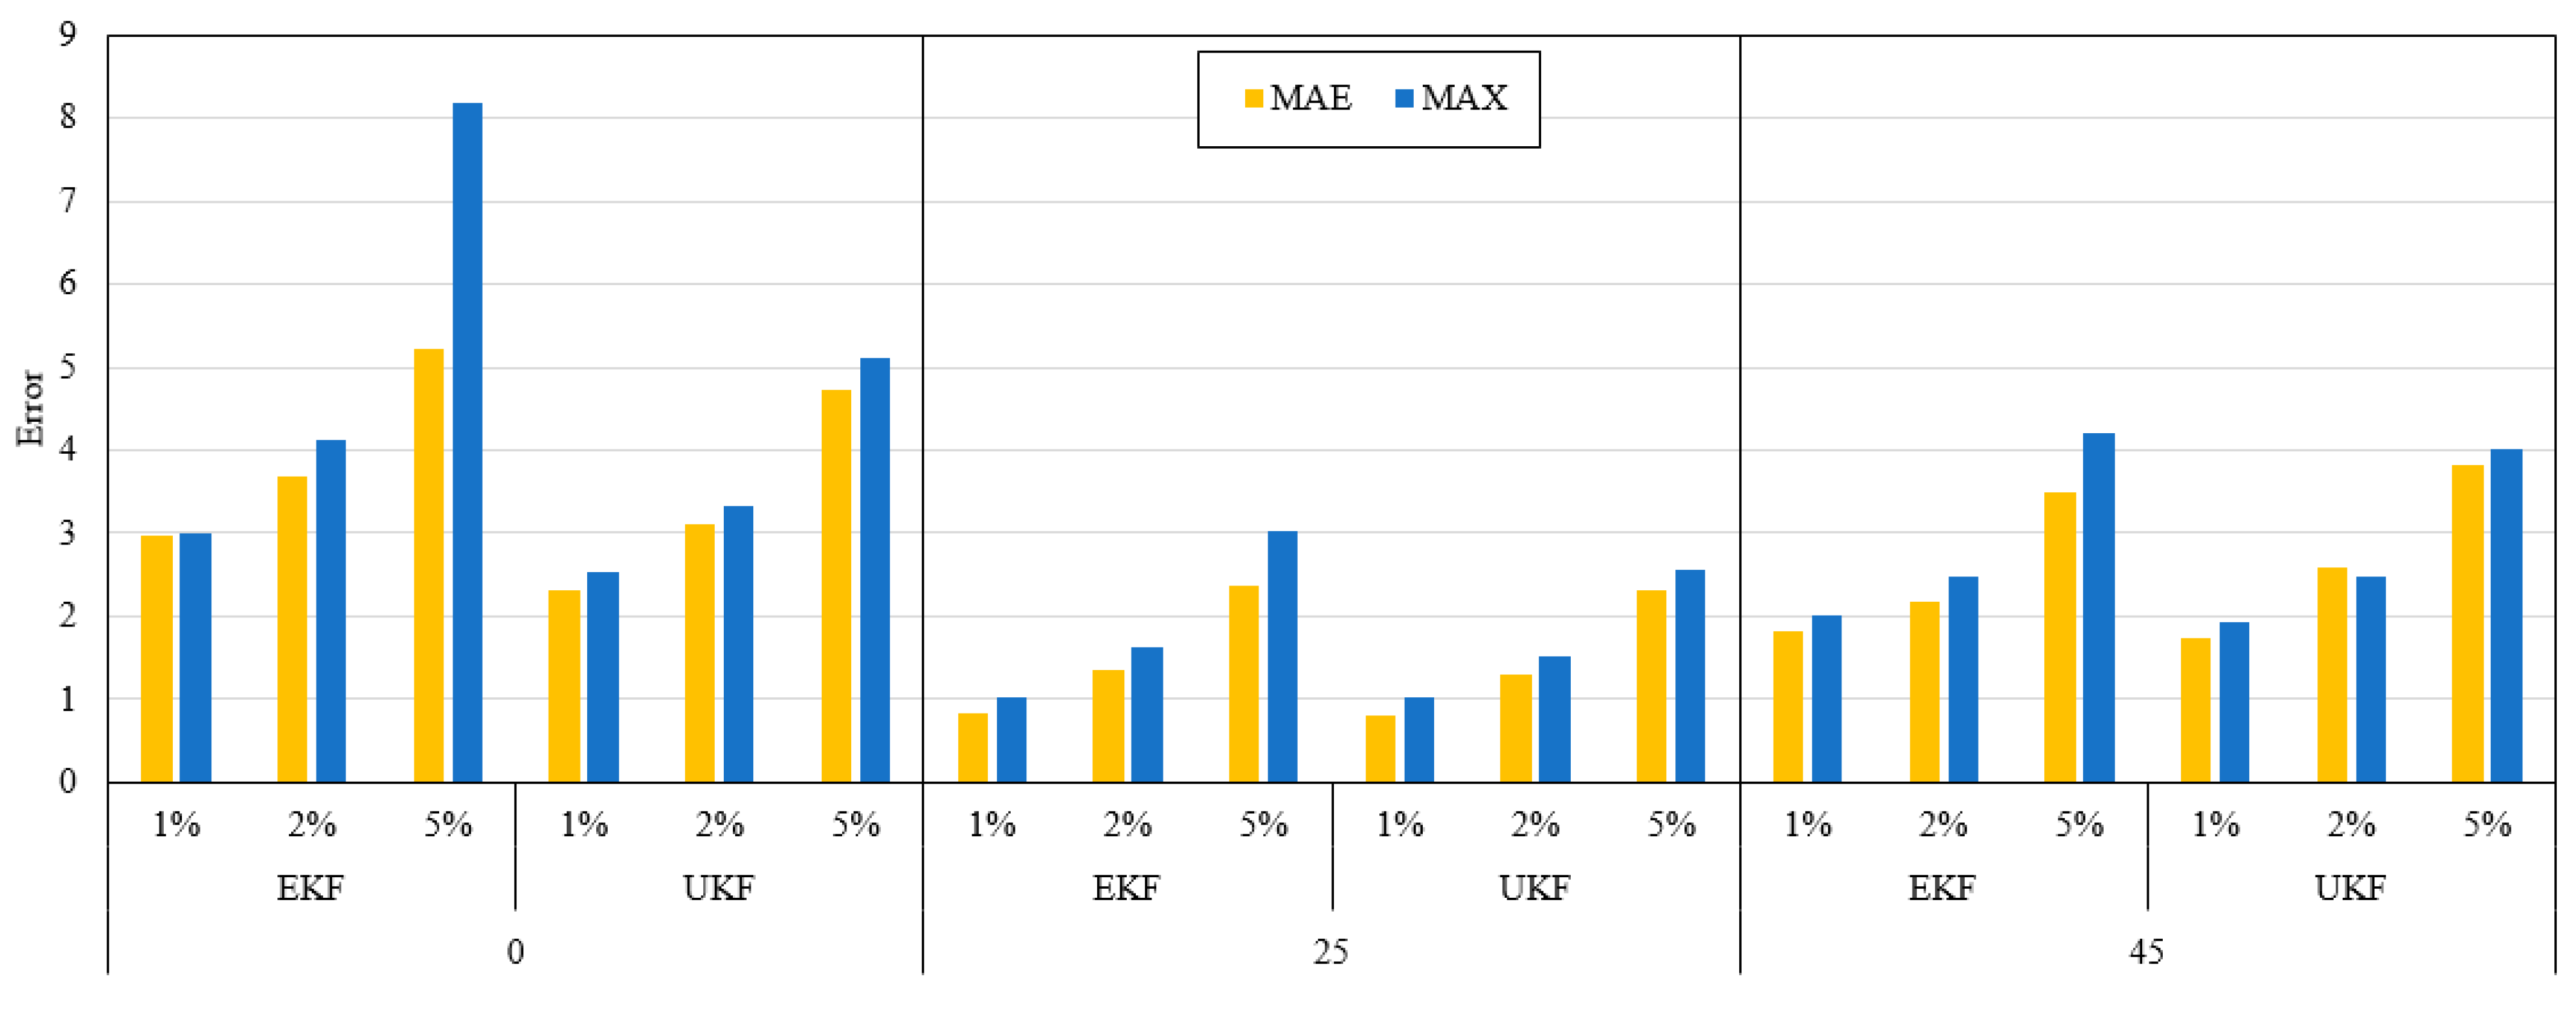
4.2. Results of SOC Estimation in Sensor Noise

In this section, noise was included in the measurement data using the error model described in Section 3.3. At an ambient temperature of 25 °C, the initial SOC was 1, and the DST profile was discharged to SOC 0%. Figure 2 shows the SOC estimation results with the measurement data with noise errors of 1%, 2%, and 5%. Figure 11a–c shows the SOC estimation results when 1%, 2%, and 5% noise was included in current, voltage, and temperature, respectively. Figure 11d–f illustrate the MAE between the SOC and SOC estimation methods without the actual noise. When the noise increased from 1% to 5%, the MAE of the EKF and UKF increased to 2.28% and 1.15%, respectively; thus, the UKF was less affected by noise.
Figure 12 shows the MAE and MAX of the overall SOC estimation method based on the operating temperature including input noise. At an operating temperature of 0 °C, lower accuracies were obtained compared to those obtained at 25 °C and 40 °C. These results are similar to those obtained in the software simulation, and the cause was insufficient parameter capture owing to capacity reduction at low temperatures. In all cases, as the noise ratio increased, the error also increased. When the operating temperature was 0 °C and the noise was 5%, the EKF exhibited the largest error, with an MAE of 2.98% and an MAX of 8.2%. The UKF showed a relatively high performance with an MAE 2.32% and an MAX of 5.12% under the same conditions. Thus, the UKF was more resistant to noise interference than the EKF. Considering the results of Section 4, the UKF had a 12.4% higher computing cost than that of the EKF, and the performance had a difference in MAE of 0.04% and MAX of 0.19%. At a suggested operating temperature, both the EKF and UKF achieved more than a 94% performance.

5. Conclusions

A BMS requires an analysis of limited resources because many functions are performed in an actual hardware system. In this study, we tested the SOC estimation using a test bench with a limited CPU performance as well as the memory resources of an embedded board. For real-time estimation, we distributed the battery data and SOC estimation algorithm through Raspberry Pi and connected them through communication. A first-order RC model was used for the battery model, and the error was within 5% of the measured data at various operating temperatures. We interfered with the noise to verify the EKF and UKF algorithms on the test bench. The UKF had a 12.4% higher computing cost on average than that of EKF and maintained a 95% performance against noise interference. Contrarily, although the EKF had a lower computing cost than that of the UKF, it exhibited an 5.2% error when the noise interference was high. Thus, it is advantageous to apply the UKF when input data exhibit high noise or when many resources of the embedded board are utilized; however, it is better to apply the EKF under contrasting conditions.

Author Contributions

Writing—original draft preparation, S.H.; writing–Review & Editing, M.K.; visualization, H.P.; supervision, J.K.; validation & supervision, J.B. All authors have read and agreed to the published version of the manuscript.

Funding

This research received no external funding.

Acknowledgments

This work was conducted under framework of the research and development program of the Korea Institute of Energy Research (C2-2421).

Conflicts of Interest

The authors declare no conflict of interest.

References

  1. Budde-Meiwes, H.; Drillkens, J.; Lunz, B.; Muennix, J.; Rothgang, S.; Kowal, J.; Sauer, D.U. A Review of Current Automotive Battery Technology and Future Prospects. Proc. Inst. Mech. Eng. Part D J. Automob. Eng. 2013, 227, 761–776. [Google Scholar] [CrossRef]
  2. Singh, K.V.; Bansal, H.O.; Singh, D. Hardware-in-the-Loop Implementation of ANFIS Based Adaptive SoC Estimation of Lithium-Ion Battery for Hybrid Vehicle Applications. J. Energy Storage 2020, 27, 101124. [Google Scholar] [CrossRef]
  3. Allam, A.; Catenaro, E.; Onori, S. Pushing the Envelope in Battery Estimation Algorithms. iScience 2020, 23, 101847. [Google Scholar] [CrossRef] [PubMed]
  4. Cittanti, D.; Ferraris, A.; Airale, A.; Fiorot, S.; Scavuzzo, S.; Carello, M. Modeling Li-Ion Batteries for Automotive Application: A Trade-Off Between Accuracy and Complexity. In Proceedings of the 2017 International Conference of Electrical and Electronic Technologies for Automotive, Torino, Italy, 15–16 June 2017; pp. 1–8. [Google Scholar] [CrossRef]
  5. Barreras, J.V.; Fleischer, C.; Christensen, A.E.; Swierczynski, M.; Schaltz, E.; Andreasen, S.J.; Sauer, D.U. An Advanced HIL Simulation Battery Model for Battery Management System Testing. IEEE Trans. Ind. Applicat. 2016, 52, 5086–5099. [Google Scholar] [CrossRef]
  6. Movassagh, K.; Arif Raihan, S.; Balasingam, B.; Member, S.; Pattipati, K. A Critical Look at Coulomb Counting Towards Improving the Kalman Filter Based State of Charge Tracking Algorithms in Rechargeable Batteries. Energies 2021, 14, 4074. [Google Scholar] [CrossRef]
  7. Hansen, T.; Wang, C.J. Support Vector Based Battery State of Charge Estimator. J. Power Sources 2005, 141, 351–358. [Google Scholar] [CrossRef]
  8. Yang, F.; Li, W.; Li, C.; Miao, Q. State-of-Charge Estimation of Lithium-Ion Batteries Based on Gated Recurrent Neural Network. Energy 2019, 175, 66–75. [Google Scholar] [CrossRef]
  9. Bhattacharjee, A.; Verma, A.; Mishra, S.; Saha, T.K. Estimating State of Charge for xEV Batteries Using 1D Convolutional Neural Networks and Transfer Learning. IEEE Trans. Veh. Technol. 2021, 70, 3123–3135. [Google Scholar] [CrossRef]
  10. Hossain Lipu, M.S.; Hussain, A.; Saad, M.H.M.; Ayob, A.; Hannan, M.A. Improved Recurrent NARX Neural Network Model for State of Charge Estimation of Lithium-Ion Battery Using Pso Algorithm. In Proceedings of the 2018 IEEE Symposium on Computer Applications & Industrial Electronics (ISCAIE), Penang Island, Malaysia, 28–29 April 2018; pp. 354–359. [Google Scholar] [CrossRef]
  11. He, H.; Xiong, R.; Zhang, X.; Sun, F.; Fan, J. State-of-Charge Estimation of the Lithium-Ion Battery Using an Adaptive Extended Kalman Filter Based on an Improved Thevenin Model. IEEE Trans. Veh. Technol. 2011, 60, 1461–1469. [Google Scholar] [CrossRef]
  12. Baccouche, I.; Jemmali, S.; Manai, B.; Omar, N.; Amara, N.E.B. Improved OCV Model of a Li-Ion NMC Battery for Online SOC Estimation Using the Extended Kalman Filter. Energies 2017, 10, 764. [Google Scholar] [CrossRef] [Green Version]
  13. Cui, X.; He, Z.; Li, E.; Cheng, A.; Luo, M.; Guo, Y. State-of-Charge Estimation of Power Lithium-Ion Batteries Based on an Embedded Micro Control Unit Using a Square Root Cubature Kalman Filter at Various Ambient Temperatures. Int. J. Energy Res. 2019, 43, 3561–3577. [Google Scholar] [CrossRef] [Green Version]
  14. He, Z.; Gao, M.; Wang, C.; Wang, L.; Liu, Y. Adaptive State of Charge Estimation for Li-Ion Batteries Based on an Unscented Kalman Filter with an Enhanced Battery Model. Energies 2013, 6, 4134–4151. [Google Scholar] [CrossRef] [Green Version]
  15. He, H.; Xiong, R.; Peng, J. Real-Time Estimation of Battery State-of-Charge with Unscented Kalman Filter and RTOS μCOS-II Platform. Appl. Energy 2016, 162, 1410–1418. [Google Scholar] [CrossRef]
  16. Shekar, A.; Anwar, S. Real-Time State-of-Charge Estimation via Particle Swarm Optimization on a Lithium-Ion Electrochemical Cell Model. Batteries 2019, 5, 4. [Google Scholar] [CrossRef] [Green Version]
  17. Li, W.; Rentemeister, M.; Badeda, J.; Jost, D.; Schulte, D.; Sauer, D.U. Digital twin for battery sustems: Cloud battery management system with online state-of-charge and state-of-health estimation. J. Energy 2020, 30, 2542–6605. [Google Scholar] [CrossRef]
  18. Mudaliar, M.D.; Sivakumar, N. IoT based real time energy monitoring system using Raspberry Pi. Internet Things 2020, 12, 100292. [Google Scholar] [CrossRef]
  19. Meng, J.; Luo, G.; Ricco, M.; Swierczynski, M.; Stroe, D.-I.; Teodorescu, R. Overview of Lithium-Ion Battery Modeling Methods for State-of-Charge Estimation in Electrical Vehicles. Appl. Sci. 2018, 8, 659. [Google Scholar] [CrossRef] [Green Version]
  20. Balasingam, B.; Pattipati, K.R. On the Identification of Electrical Equivalent Circuit Models Based on Noisy Measurements. IEEE Trans. Instrum. Meas. 2021, 70, 1–16. [Google Scholar] [CrossRef]
  21. He, H.; Xiong., R.; Fan., J. Evaluation of Lithium-Ion Battery Equivalent Circuit Models for State of Charge Estimation by an Experimental Approach. Energies 2011, 4, 582–598. [Google Scholar] [CrossRef]
  22. Song, M.; Gao, C.; Yan, H.; Yang, J. Thermal Battery Modeling of Inverter Air Conditioning for Demand Response. IEEE Trans. Smart Grid. 2018, 9, 5522–5534. [Google Scholar] [CrossRef]
  23. Farmann, A.; Sauer, D.U. A study on the dependency of the open-circuit voltage on temperature and actual aging state of lithium-ion batteries. J. Power Source 2017, 347, 1–13. [Google Scholar] [CrossRef]
  24. Zhang, L.; Peng, H.; Ning, Z.; Mu, Z.; Sun, C. Comparative Research on RC Equivalent Circuit Models for Lithium-Ion Batteries of Electric Vehicles. Appl. Sci. 2017, 7, 1002. [Google Scholar] [CrossRef] [Green Version]
  25. Wang, W.; Wang, X.; Xiang, C.; Wei, C.; Zhao, Y. Unscented Kalman Filter-Based Battery SOC Estimation and Peak Power Prediction Method for Power Distribution of Hybrid Electric Vehicles. IEEE Access 2018, 6, 35957–35965. [Google Scholar] [CrossRef]
  26. Wan, E.A.; Van Der Merwe, R. The Unscented Kalman Filter for Nonlinear Estimation. In Proceedings of the IEEE 2000 Adaptive Systems for Signal Processing, Communications, and Control Symposium (AS-SPCC), Lake Louise, AB, Canada, 1–4 October 2000; pp. 153–158. [Google Scholar] [CrossRef]
  27. Hunt, G. USABC Electric Vehicle Battery Test Procedures Manual; United States Department of Energy: Washington, DC, USA, 1996.
  28. Ni, K.; Ramanathan, N.; Chehade, M.N.H.; Balzano, L.; Nair, S.; Zahedi, S.; Kohler, E.; Pottie, G.; Hansen, M.; Srivastava, M. Sensor Network Data Fault Types. ACM Trans. Sens. Netw. 2009, 5, 1–29. [Google Scholar] [CrossRef] [Green Version]
Figure 1. Battery parameter identification: (a) equivalent circuit battery model and (b) parameter extraction from discharge section.
Electronics 11 02010 g001
Figure 2. Battery parameter obtained for first-order RC circuit according to operating temperature.
Electronics 11 02010 g002
Figure 3. Results of battery model: (A) current profile, (B) comparison with simulation voltage and measured voltage, (C) cell temperature.
Electronics 11 02010 g003
Figure 4. System architecture of SOC estimation using embedded boards.
Electronics 11 02010 g004
Figure 5. Battery experimental platform.
Electronics 11 02010 g005
Figure 6. DST operating profile: (a) measured voltage and (b) current in one cycle (360 s).
Electronics 11 02010 g006
Figure 7. Experimental setup of Raspberry Pi.
Electronics 11 02010 g007
Figure 8. Scheme of communication protocol between Raspberry Pi.
Electronics 11 02010 g008
Figure 9. SOC estimation between embedded board and simulation.
Electronics 11 02010 g009
Figure 10. Measured voltage and current profile from a noise model: (a) voltage and (b) current.
Electronics 11 02010 g010
Figure 11. Estimation results in operating temperature 25 °C: true SOC vs. estimation methods according to including noise (a) 1%, (b) 2%, (c) 5%. Difference between the true SOC and the estimated SOC of the estimation methods in noise (d) 1%, (e) 2%, (f) 5%.
Electronics 11 02010 g011
Figure 12. Comparison of overall EKF and UKF performances according to operating temperature including input noise.
Electronics 11 02010 g012
Table 1. Accuracy of terminal voltage based on the battery model.
Operating Temperature (°C)MAE (%)MAX (%)
04.044.82
253.124.51
453.354.55
Table 2. Specification of Samsung SDI INR 21700-50E.
ItemSpecification
Standard CapacityMin 4900 mAh
Cut-off Voltage2.5 V
Nominal Voltage3.6 V
Operation TemperatureCharge: 0 °C to 45 °C
Discharge: −20 °C to 60 °C
ManufacturerSamsung SDI
Table 3. Specification of Raspberry Pi 4 Model B.
ItemSpecification
CPUARM Cortex-A72 1.5 GHz
GPUBroadcom VideoCoreVi 500 MHz
RAM4GB LPDDR4
USBMicro HDMI
Dimensions85.60 mm × 56.50 mm
Table 4. Computing cost for initial deployment according to SOC estimation method.
MethodUnit Cell1 Pack (6 Cells)2 Pack (12 Cells)
EKFTime consumed [s]454852
Load rate [%]25.130.535.8
UKFTime consumed [s]525659
Load rate [%]37.544.546.1
Publisher’s Note: MDPI stays neutral with regard to jurisdictional claims in published maps and institutional affiliations.

