Article

Numerical Simulations of Light Scattering in Soft Anisotropic Fibrous Structures and Validation of a Novel Optical Setup from Fibrous Media Characterization

by
Francesco di Bartolo
1,2,†,
Emanuele Vignali
1,†,
Emanuele Gasparotti
1,2,†,
Antonio Malacarne
3,
Luigi Landini
2 and
Simona Celi
1,*
1
Fondazione Toscana Gabriele Monasterio, BioCardioLab, 54100 Massa, Italy
2
Department of Information Engineering, University of Pisa, 56122 Pisa, Italy
3
Sant’Anna School of Advanced Studies, TeCIP Institute, 56124 Pisa, Italy
*
Author to whom correspondence should be addressed.
These authors contributed equally to this work.
Electronics 2021, 10(5), 579; https://doi.org/10.3390/electronics10050579
Submission received: 16 December 2020 / Revised: 10 February 2021 / Accepted: 24 February 2021 / Published: 2 March 2021
(This article belongs to the Special Issue Digital Twin Technology: New Frontiers for Personalized Healthcare)

Abstract

:
The insight of biological microstructures is at the basis of understanding the mechanical features and the potential pathologies of tissues, like the blood vessels. Different techniques are available for this purpose, like the Small Angle Light Scattering (SALS) approach. The SALS method has the advantage of being fast and non-destructive, however investigation of its physical principles is still required. Within this work, a numerical study for SALS irradiation of soft biological fibrous tissues was carried out through in-silico simulations based on a Monte Carlo approach to evaluate the effect of the thickness of the specimen. Additionally, the numerical results were validated with an optical setup based on SALS technique for the characterization of fibrous samples with dedicated tests on four 3D-printed specimens with different fibers architectures. The simulations revealed two main regions of interest according to the thickness (thk) of the analyzed media: a Fraunhofer region (thk < 0.6 mm) and a Multiple Scattering region (thk > 1 mm). Semi-quantitative information about the tissue anisotropy was successfully gathered by analyzing the scattered light spot. Moreover, the numerical results revealed a remarkable coherence with the experimental data, both in terms of mean orientation and dispersion of fibers.

1. Introduction

Fibrous structure plays an important role in the function and behavior of both healthy and diseased biological tissues. Structural changes in collagen and elastin fibers are linked to biomechanical remodeling of many dense connective tissues which are composed of extracellullar networks of collagen and elastin fibers embedded in a ground matrix [1]. A notable example of these tissues is given by the blood vessels, in which the formation of aneurysmatic bulges is strictly connected to microstructural components degradation and, consequently, mechanical properties modifications [2]. Thus, the quantification of fiber architecture represents an important step in understanding the mechanics and the constitutive relationships of biological tissues in healthy and diseased state.
So far, numerous methods were developed for the investigation of fibrous structure of biological tissues. Among the different approaches, the small angle X-Ray scattering [3,4], the elastic scattering spectroscopy [5,6] and the microscopic elliptical polarimetry [7,8] are reported in the state-of-the-art. With these methods, the orientation of the collagen fiber distribution can be evaluated as the contribution of the overall microstructure. Methods to obtain more accurate and quantitative information on the collagen organization include also Confocal Reflection Laser Scanning Microscopy [9,10], auto-fluorescence and Second Harmonic Generation using multi-photon microscopy [11,12]. The above reported approaches are accurate, however they present the drawback of being characterized by high energies or by an intrinsic destructive nature for the specimen.
In opposition to these features, Small Angle Light Scattering (SALS) offers a relatively simple, fast and non-destructive method to provide semi-quantitative structural information about the localized arrangement of tissue fibers on a macroscopic scale [13,14]. SALS working process consists on an incident light beam which traverses a tissue sample interacting with dielectric inhomogeneities. At each inhomogeneity border, the incident radiation experiences phenomena of transmission, reflection/scattering and, depending on the type of tissue, absorption. From a physical point of view, the incident laser light causes oscillating dipoles (scatterers), which in turn emit light at the same wavelength ( λ ) of the incident beam in all directions. The different emissions produce a constructive interference, transmitting a light radiation to the other side of the specimen. The corresponding light spot can be acquired through a camera system and processed to obtain relevant information about the tissue microstructure.
The low/high grade of anisotropy in a fibrous sample depends on the density and characteristics of the embedded fibers and can be evaluated according to the SALS spot analysis. SALS is capable of detecting structures that have dimensions within the order of the wavelength of the incident light beam (i.e., λ = 633 nm). Typically, the eccentricity and orientation of the scattered light spot gives information on the dispersion and orientation of the embedded fibers [15]. Several research groups used SALS to map the gross fiber orientation of soft tissues [16,17]. In the latest in state-of-the-art, SALS was applied on biological soft tissues in correlation with biaxial mechanical testing [18]. Vignali and co-authors revealed the feasibility to cope the mechanical properties on healthy/diseased tissues simultaneously to the microstructural alteration in a non destructive manner. Nevertheless, a computational data to corroborate the experimental SALS micro-mechanical findings obtained directly on the biological specimens are still lacking.
In the current state-of-the-art, SALS experimental applications involve mainly thin biological specimens and polymeric materials. Additionally, integration with alternative techniques are available [19]. As the specimen becomes thicker, additional optical phenomena occur and require a deeper investigation. Up to date, few works concerning the numerical simulations of SALS light propagation through thick biological media to be integrated with micro-mechanical testing exist. It was established already that the synchronization between SALS and mechanical investigation of tissues is possible [20,21]. The effect of SALS pattern modifications as a consequence of mechanical stimuli was demonstrated in previous works. The definition of a computational tool to support micro-mechanical quantification through SALS would be valuable in this context. With the current study, a numerical approach for the simulation of light transmission in SALS irradiation of biological fibrous media was carried out to evaluate the effect of the thickness of the specimen and the orientation of the inner fibrous structures. The computational results were then validated by dedicated experiments carried out with a custom SALS setup. A set of 3D printed specimens was realized with fibrous structures with different orientations and the corresponding SALS patterns were acquired. By analyzing the corresponding results, the numerical procedures were successfully validated. In this paper, a brief theoretical background of the physical SALS phenomena is presented first, then the numerical and experimental methods are described and the corresponding results are discussed.

2. Theoretical Background

The interaction of light with a medium depends on the optical properties of the medium itself that are a quantification of the physical phenomena occurring when the medium is traversed by a light wave (i.e., absorption, reflection and scattering). For all those phenomena, each medium shows different behaviors depending on both its intrinsic optical properties and the wavelength of the incident radiation. In case of soft biological fibrous tissues, light scatters due to the different refractive properties of the embedded collagen fibers with respect to the surrounding environment [22]. Since the dimensions of collagen fibers (50–150 μm) are much greater than the incident wavelength (typically 500–1300 nm in biomedical applications), Mie scattering occurs [23]. The validity of Mie scattering theory is at the basis of SALS principle. In fact, the SALS required wavelengths are reported to be within at least an order of magnitude of the collagen fibers [24]. Additional changes to collagen structures linked to smaller molecular levels are beyond the detection capabilities of SALS [25]. Beyond the different refractive properties of the fiber components, the scattering is influenced even by the shape of the structures. For the particular case of biological tissue, the microstructure can be approximated by an array of cylinders representing the collagenous structure.
According to SALS theory, given a light beam traversing a biological fibrous tissue sample, the corresponding scattered spot presents a shape and orientation depending on the dispersion and the orientation of the embedded collagen fibers. In particular, the eccentricity of the spot gives a quantification of the isotropic/anisotropic grade of the sample, based on the circular/elliptical shape, respectively. If the specimen thickness is smaller than 0.7 mm, the dominant visible phenomenon occurring within the sample can be approximated to Fraunhofer Scattering (FS) from an array of cylinders [14]. The FS light intensity distribution of a tissue in which the fibers are aligned along a prescribed direction is given by an elliptical pattern with the major axis perpendicular to the fiber direction (Figure 1a). State-of-art SALS is based around the FS phenomenon. If the sample thickness is higher than 0.7 mm, the light scattering changes behavior as multiple layers of fibrous structures are irradiated and the contribution is modified. In these conditions, the typical phenomenon of Multiple Scattering (MS) of light layer by layer occurs. In this latter case, the distribution still holds structural information but, in opposition with the FS phenomenon, the light intensity distribution follows an elliptical pattern with its major axis parallel to the fiber preferential direction (Figure 1b) [26]. Both MS and FS optical phenomena coexist during the SALS irradiation, however their contribution is strongly linked with the specimen thickness. Regardless of the dominant principle, it is always possible to evaluate the microstructural features of the specimen by evaluating the SALS pattern eccentricity and inclination angle.

3. Materials and Methods

In the following section, the in-silico simulations for specimens with different fiber architectures are described first, then the experimental methods for the validation of the numerical approaches are presented.

3.1. In-Silico Model

Regarding the numerical part, simulation sets were carried out to investigate the effect of the light irradiation of fibrous structures. Basically, the simulations are set up by imposing a light source penetrating a three-dimensional block domain constituted by an isotropic extracellular matrix (EM) with embedded fibers (EF) (Figure 2a). The block has a square section with a 4 mm side and a thickness (thk) value defined according to the different simulations. The fibers are organized in one or two families identified by a main orientation angle ( α i ) in the light-incidence plane, a fiber fractional number ( D i ) and a overall fiber fractional density ( ρ ). The D i and ρ values are respectively given by
D i = N i N t o t × 100
and
ρ = V E F V E M × 100
where N i represents the number of fibers belonging to the ith family, N t o t is the fiber total number, V E F and V E M are the EF and EM domain volumes, respectively. The tissue model is defined according to its absorption ( μ a ) and scattering coefficients ( μ s ), causing the light energy decay. The μ a and μ s coefficients are assumed to be equal in the whole domain and their values are set according to the characteristic soft tissue range [27] ( μ a = 0.01 mm−1 and μ s = 0.28 mm−1). The optical differences between the EF and the EM domain were modeled in terms of their scattering anisotropy (g) and their refractive index (n), which are the main responsible for the modification of the light spot. By assuming that the anisotropy of the specimen is completely given by the fibers, the EF are assumed to be characterized by forward scattering ( g = 0.8 ) while the EM domain will produce an isotropic response ( g = 0 ) [28]. Concerning the n parameters, the EM was assumed to contain the majority of water within the tissue ( n E M = n w a t e r = 1.5 ), while the EF were assumed as the dry component ( n E F = 1.3 ) [29]. The domains were discretized by using a dedicated custom algorithm to generate a tetrahedral mesh and customize the fiber D i and α i parameters, as exemplified in Figure 2b,c. The fibers were modeled as cylindrical structures with a diameter of 50 μm. The light stimulus was modeled as a point source with a photon numerosity of 106 particles. For all the simulations, the numerical solution was obtained by adopting a Monte Carlo method for the photon transport and random scattering through a media, by using and customizing a state-of-art method [30].
Different conditions sets were determined according to the model parameters. A first set ( S 1 ) of simulations was imposed to investigate the influence of fiber distribution on the light diffraction of SALS. The α i parameters of the fiber families were varied according to the values summarized in Table 1, while the ρ was kept constant at 26%. For the single family cases, D 1 = 100% and D 2 = 0% were imposed, while for the two families cases D 1 = 50% and D 2 = 50% were set. To identify both the FS and MS phenomena, the different α i combinations were evaluated for both low (1.3 mm) and high thickness (0.2 mm) specimens. For each simulation, the results were post processed in order to obtain the isocurve fluence maps at the specimen side opposite to the light source. The isocurves were fitted according to an elliptical pattern to evaluate the corresponding ellipses eccentricity (E) and orientation angle ( ϕ ). The E parameter was calculated according to:
E = 1 b 2 a 2
where a and b denote the elliptical major and minor pattern axes, respectively. According to this formulation, an isotropic tissue will produce a pattern with an E value close to 0, while anisotropy will manifest an almost unitary value. The simulation conditions of the S 1 set are summarized in Table 1 and exemplified in Figure 2b,c.
A second set ( S 2 ) of simulations was imposed to achieve a deeper insight on the influence of specimen thickness on the light scattering. In particular, the thickness of the specimen was varied from a minimum of 0.2 mm to a maximum of 2 mm with a constant step of 0.1 mm. The value of ρ was kept constant at 26%. A single fiber family was included within the domain with α i = 0°. The E parameter resulting from the fluence pattern analysis was calculated according to the different thickness values.
A third set ( S 3 ) of simulations was imposed to investigate the combined effect of thickness and fiber density modifications on the fluence pattern in the MS conditions for SALS. The thickness range was chosen to guarantee the dominance of the MS phenomena, with a minimum of 1 mm up to a maximum of 2 mm through a constant step of 0.1 mm. The value of ρ was varied between 0.5% up to 26%. A single fiber family was included within the domain with α i = 0°. The E parameter resulting from the fluence pattern analysis was calculated according to the different thickness and density values. Additionally, the values were averaged along the specimen thickness to isolate the effect of the ρ variations.
Lastly, a fourth set ( S 4 ) of simulations was imposed to highlight the influence of different densities of the fiber families within the same specimen always remaining in the MS regime was imposed. To achieve this, the ρ and thickness parameters were kept constant at 26% and 1.3 mm. Two fiber families were included within the domain with α 1 , 2 = 0°/90° and the density parameters D 1 , 2 were varied. In particular, the density balance was modified by starting from the extreme anisotropic case of D 1 = 100% and D 2 = 0% to the isotropic D 1 = 50% and D 2 = 50%, with gradual percentage steps of 7.1%. The simulation conditions of sets S 2 , S 3 and S 4 are all summarized in Table 2.

3.2. Experimental Validation Test

After defining the numerical part, the experimental phase was defined to validate the computational data. A novel setup was adopted in order to obtain an SALS irradiation of synthetic specimens with a fibrous structure (Figure 3a–c). The optics consisted of an HeNe laser ( λ = 633 nm), a mirror directing the light beam perpendicularly on the upper surface of the sample up to a focusing lens (focus length = 150 mm) to obtain a spot size of 100 μm. The sample was held in position through four grippers on a custom biaxial testing machine already developed in previous works [18,31,32].
A set of four specimens was realized in Thermoplastic Polyurethane (TPU) by additive manufacturing technique through a 3D printing machine (Sharebot Q). The infill angle was varied in order to replicate the fibrous structure in four different configurations, as depicted in Figure 3d–g and summarized in Table 3. The expected scattering pattern is granted by the different optical properties of TPU and air interstitia. To permit the comparison with the numerical data, the specimen thickness and density were kept constant at 1.3 mm and 26%, respectively. The resulting SALS light pattern was registered, segmented and post-processed to obtain the corresponding E and ϕ parameters, which were compared to the results from the simulation set S 1 to validate the observed scattering phenomena. The absolute from the experimental–numerical comparison for both eccentricity and inclination angle were calculated.

4. Results

4.1. In-Silico Simulations

The numerical simulations were carried out with success. The fluence maps resulting from the S 1 set are shown in Figure 4. The corresponding E and ϕ values are reported in Table 4.
It is possible to highlight that the specimen exhibiting the lowest eccentricity values are 0.22 and 0.29 from the α 1 , 2 = 0°/90° case, regardless of the thickness. On the other hand, the maximum of E was encountered for specimens with high fiber alignment like the α 1 = 0° and α 1 = 90° (0.79 and 0.8 values, respectively). The specimens with α 1 , 2 = 0°/90° and α 1 , 2 = ±45° resulted in a quasi-circular light pattern (isotropic), consequently the ϕ parameter was considered as meaningless.
Regarding the S 2 set, the scattered spot eccentricity variation as a function of sample thickness was successfully evaluated. The results are presented in Figure 5.
The eccentricity trend reveals a transition region (0.6 mm < thk < 1 mm) between the FS and MS region, in which the light spot shape changes. The results from S 3 set, revealing the eccentricity variation as a function of both specimen thickness and fiber density, are shown in Figure 6. The three-dimensional plot (Figure 6a) reveals that wide ranges of E (from a minimum of 0.22 up to a maximum of 0.95) can be reached by varying the thickness and the fiber density of the specimen.
The case with thk = 1.3 mm was highlighted in Figure 6b. Figure 6c reveals the trend of E averaged along the thickness of the specimen, with the relative standard deviations. Finally, the results from simulation set S 4 are represented in Figure 7. The E trend revealed a descending behavior as the fiber families densities are redistributed up to a symmetric value of 50%/50%.

4.2. Experimental Validation Test

The experimental setup was successfully used for the SALS irradiation of the synthetic specimens. In Figure 8, the validation SALS tests on each 3D-printed sample is shown in comparison with the corresponding isocurve fluence maps from S 1 simulation set.
A quantitative comparison between the experimental and numerical data is reported in Table 5, where the values of E and ϕ are revealed. The reported values show agreement between the reproduced and calculated parameters, with maximum relative errors of about 0.07 and 2° for E and ϕ , respectively. The errors between experimental and numerical data were considered as negligible, also given the semi-quantitative nature of the SALS technique.

5. Discussion

The results from the in-silico simulations in this work revealed the effects of light propagation through fibrous media and the corresponding influence according to different factors like the grade of anisotropy, the specimen thickness and the fiber density. Moreover, the behavior was correctly validated by adopting an experimental setup for SALS irradiation of synthetic fibrous specimens. The methods revealed the coherence between the observed scattered light spot and the corresponding fibrous structure.
Different numerical approaches are currently adopted in the state-of-the-art for studies of light propagation through media. Among these, the statistical Monte Carlo method is one of the most successful techniques to analyze multivariable dynamic systems. In our work, with respect to [
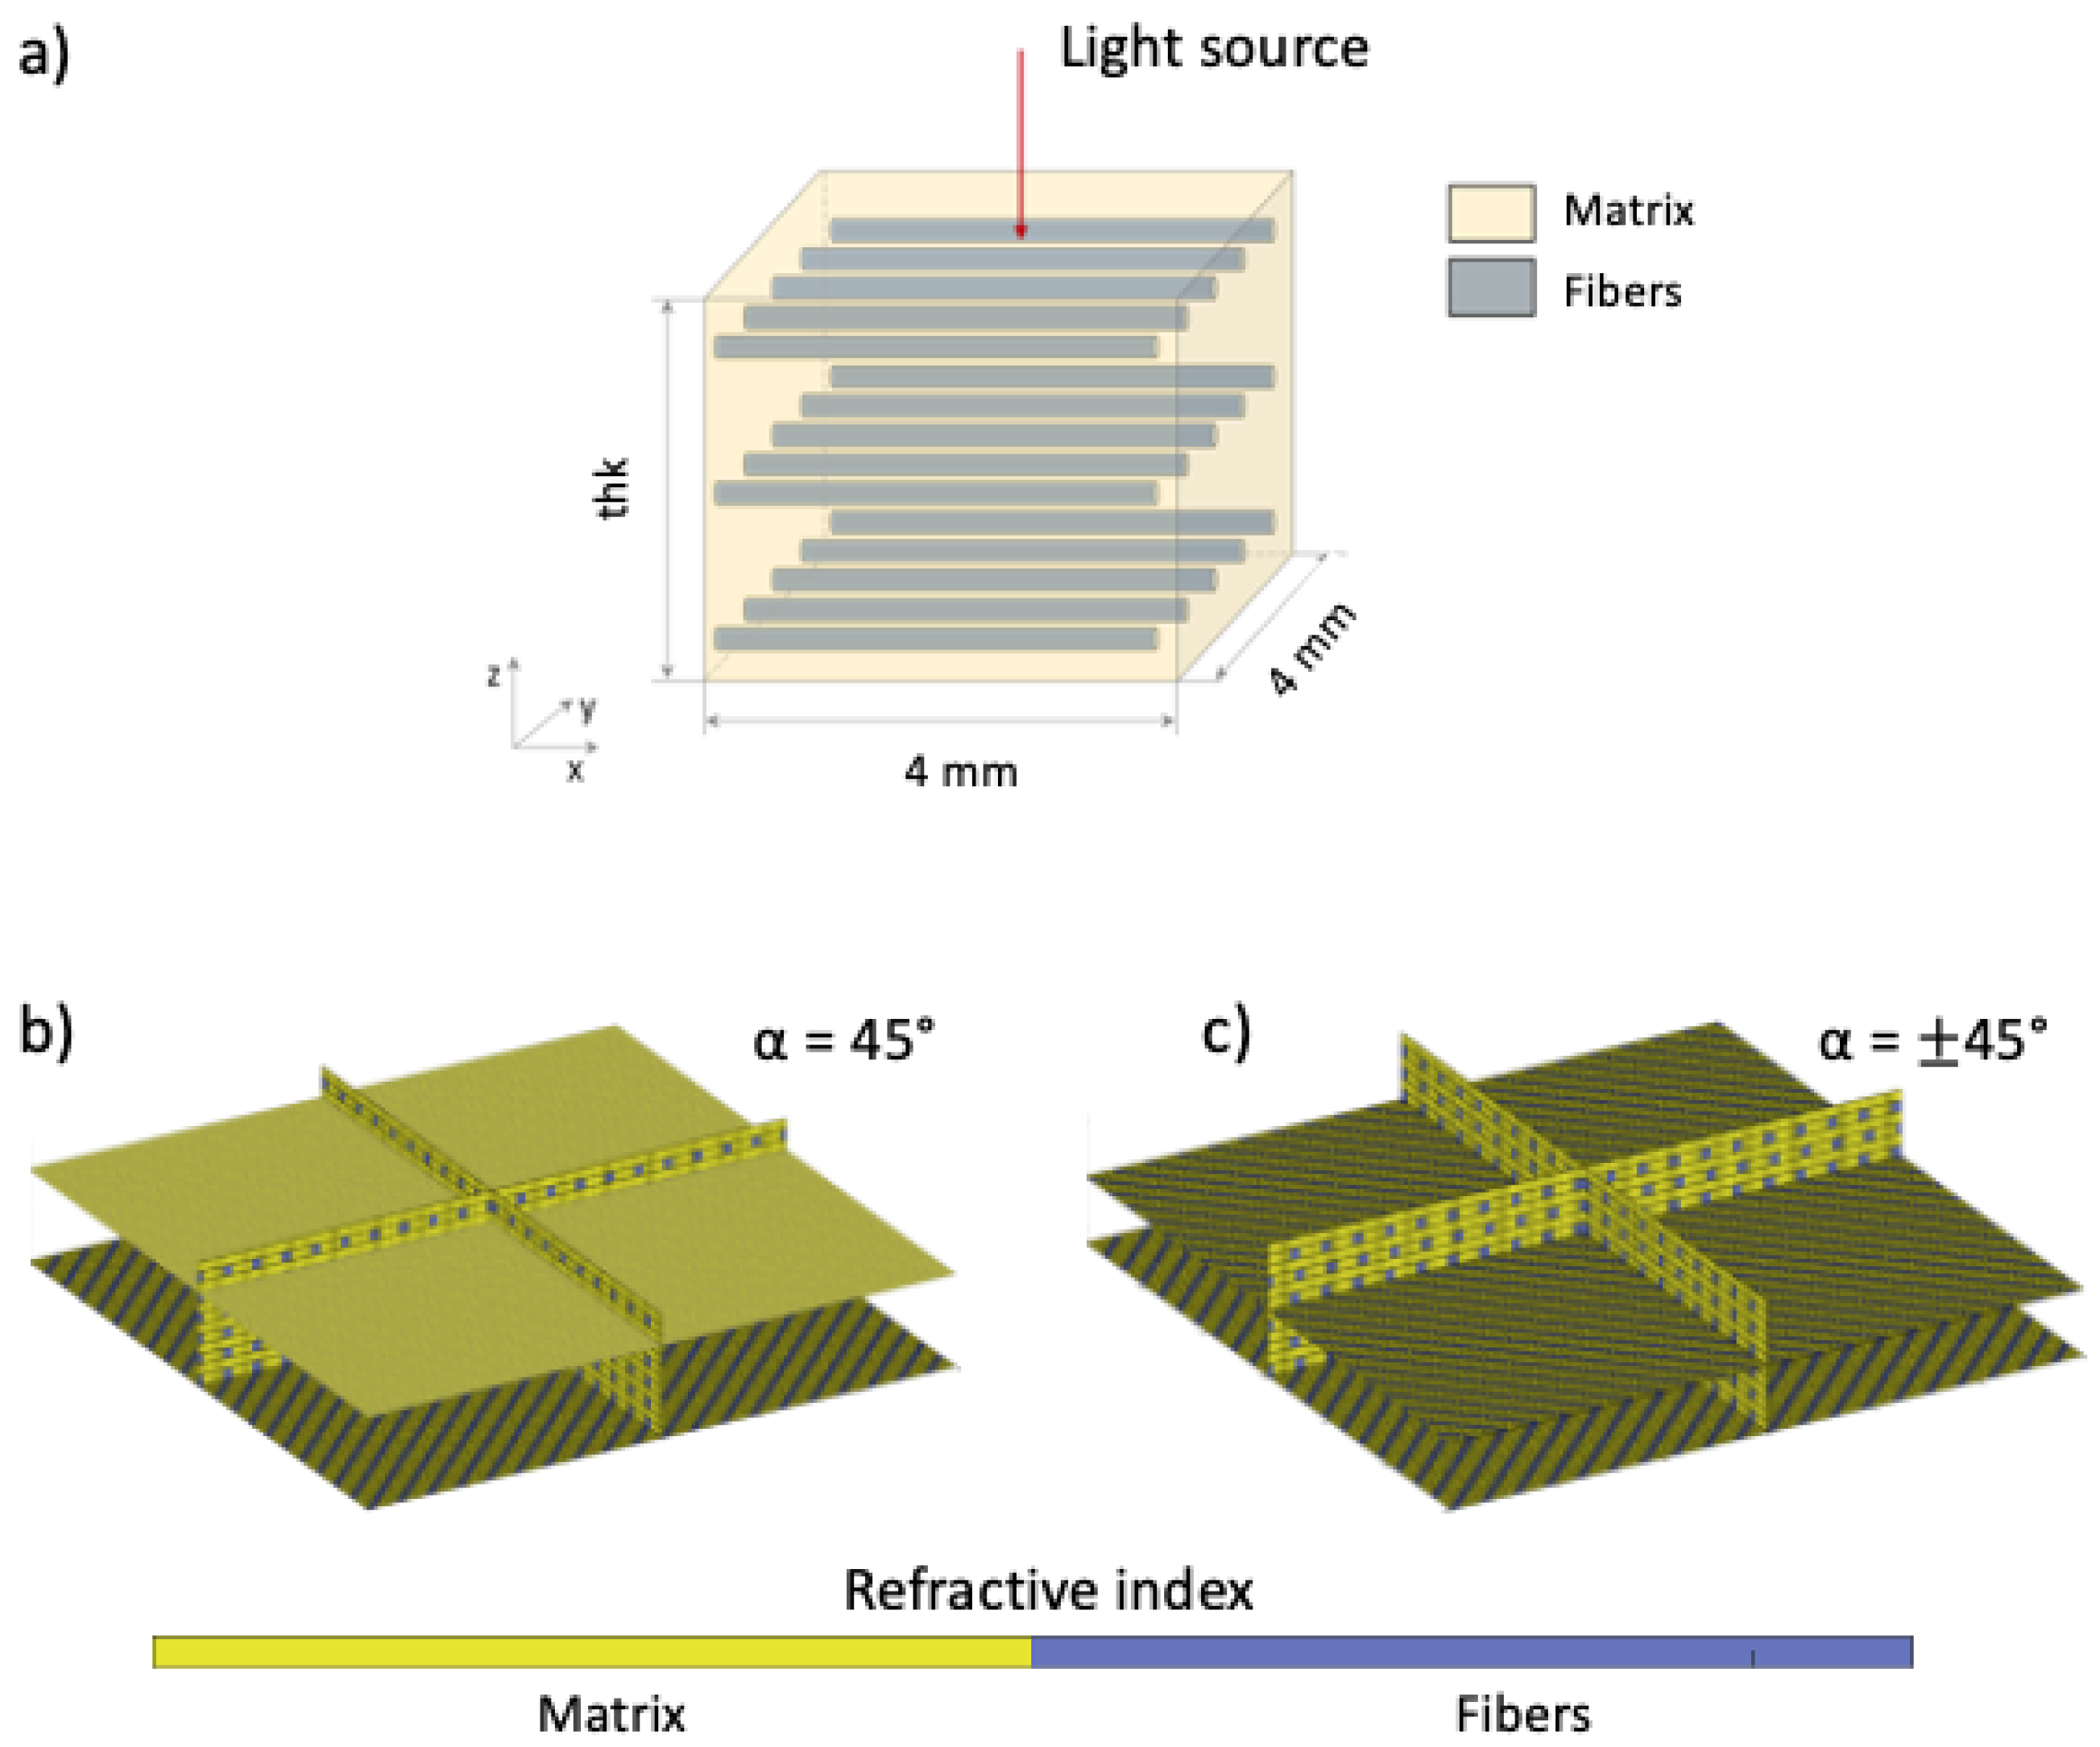
30], we have developed and implemented an anisotropic media structure. Variable physical features such as layer thickness and fiber orientations/densities can be set in order to simulate a wide range of SALS irradiation cases. Our attention was focused on at most two fiber families describing the characteristic biological structure of blood vessels. In terms of thickness, values between 1 and 2 mm, contained within the physiological range of vessel walls, were chosen [32,33,34]. The simulations from the S 1 
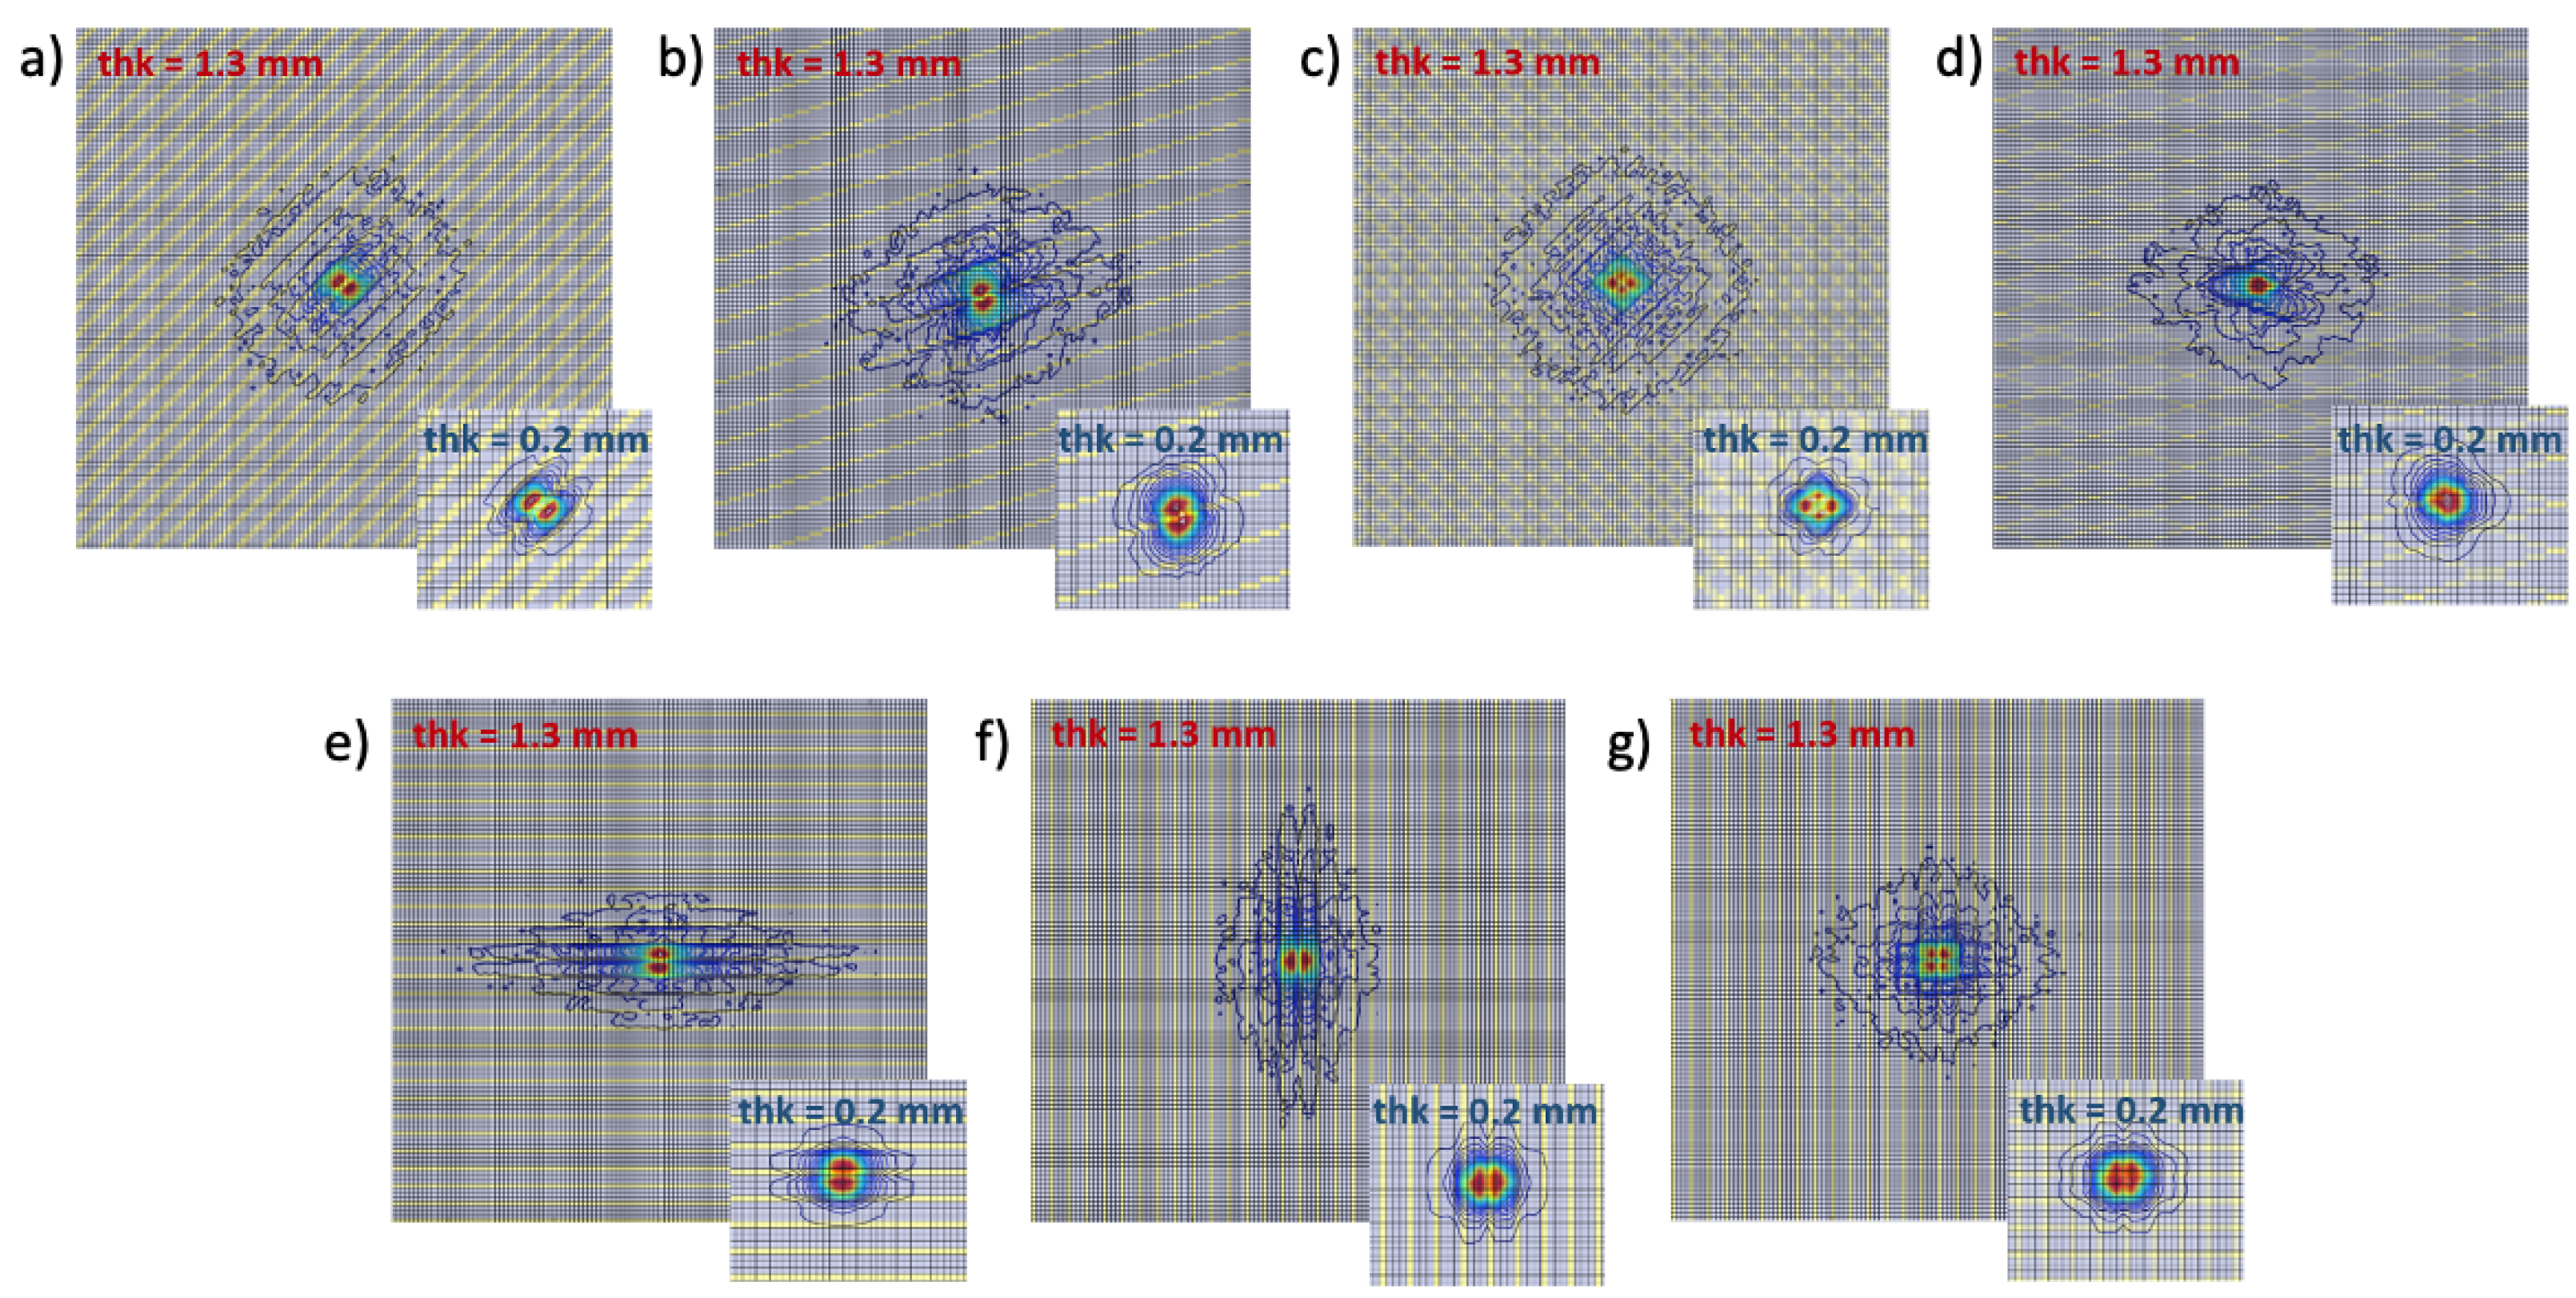
set demonstrated the effect of specimen thickness on the light scattering of specimens with different fiber distributions. It was demonstrated that it was always possible to acquire information concerning the distribution of fibers within the simulated specimen, regardless of the tissue thickness. As already reported in previous studies [
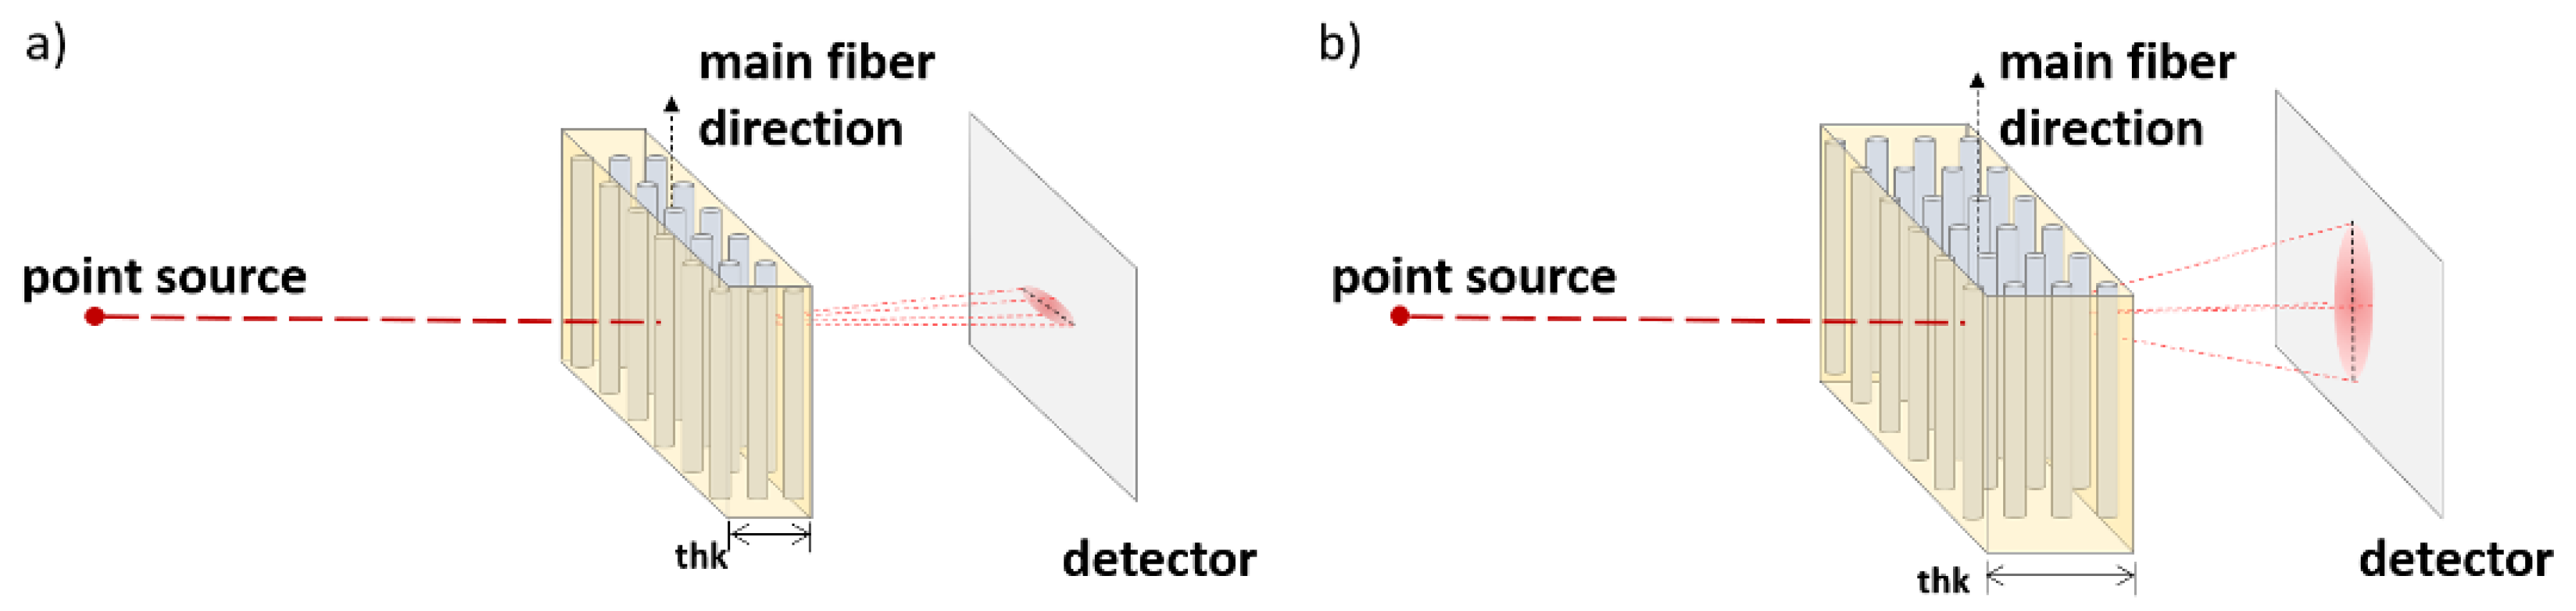
15,35], the light spot obtained from SALS irradiation of specimens at 0.2 mm thickness produces orientation angles perpendicular to the resultant fiber direction and high eccentricity values for the anisotropic cases, according to the FS theory. This phenomenon is for example proved by the 90° specimen with 0.2 mm thickness, revealing E and ϕ equal to 0.80 and 0.3°, respectively (Figure 4 and Table 4). In opposition with this behavior, the ±45° specimen (almost isotropic) with 0.2 mm thickness exhibits an eccentricity of 0.31. Concerning the 1.3 mm thickness specimens, the MS effect is instead predominant for the SALS irradiation. It is interesting to highlight the reported ϕ values, as apparently a relationship with the orientation angles from the FS exists. In fact, as demonstrated from previous works [26,36], the calculated orientation angle values are in line with the MS theory: the ϕ values from the 1.3 mm thickness specimens correspond to the direction parallel to the fiber resultant angle. This trend is confirmed by the shift of about 90° between the ϕ values from the simulations of the 0.2 mm and 1.3 mm thicknesses, as reported in Table 4. The numerical values confirm the existence of both the phenomena of MS and FS and its correct simulation. Moreover, results from simulation set S 2 
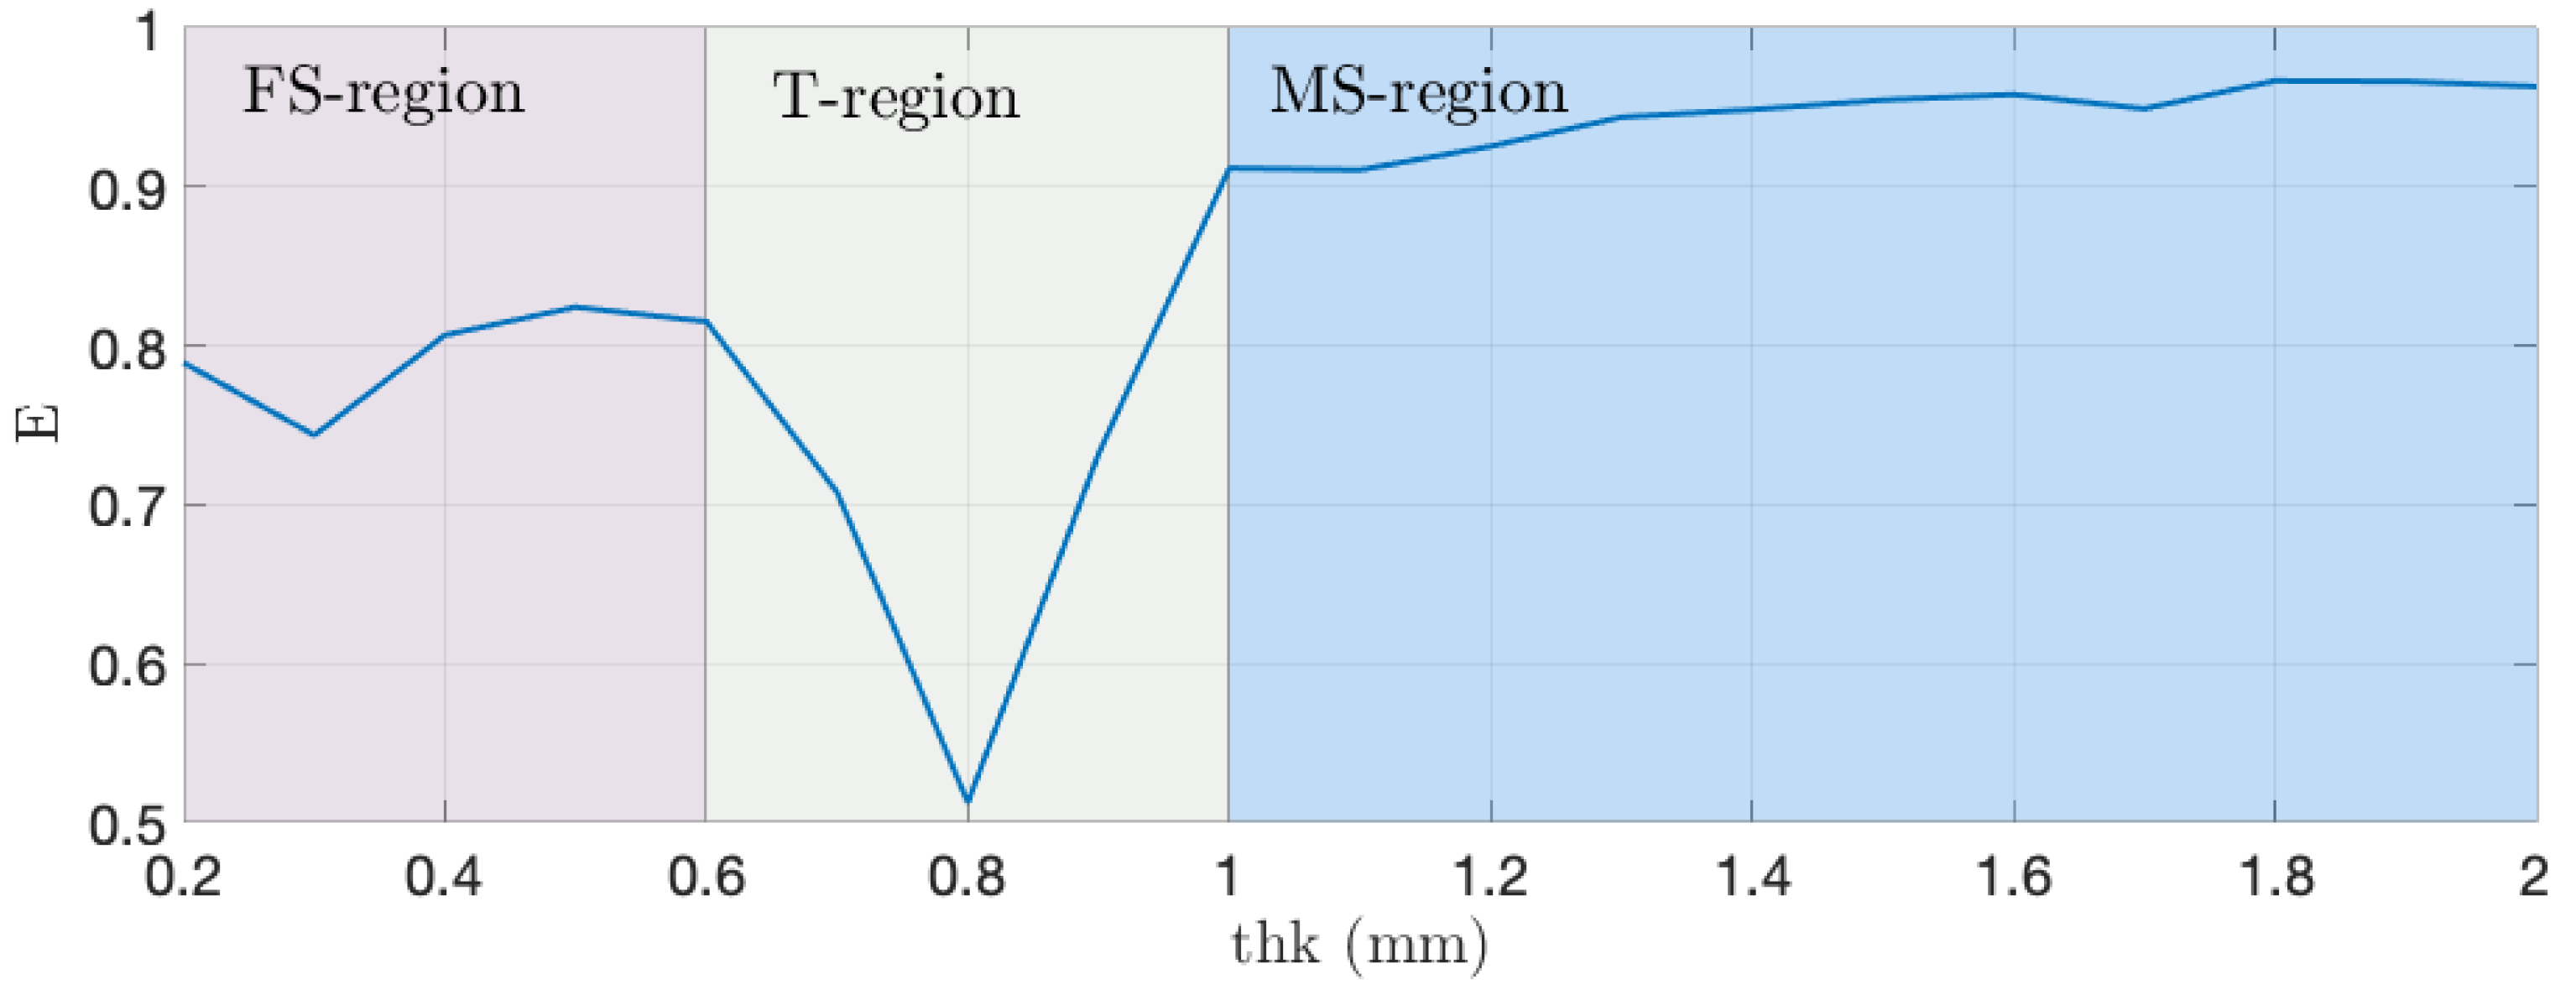
offered a deeper insight of the effect of specimen thickness. The trend from Figure 5 revealed the existence of a different zones, as the eccentricity value encountered modifications with the variation of the thickness. For thk below 0.6 mm, FS diffraction was dominant, and eccentricity values were high and in line with the anisotropy of the simulated specimen. Between 0.6 mm and 1 mm, there is a transition region where both the MS and FS phenomena occur, but the thickness/optical path is still too short to allow the light to diffuse predominantly along the preferential fiber direction. In this transition region, eccentricity values rapidly fall causing a lack of measurement accuracy as it was demonstrated also in some SALS studies from literature [17]. The 
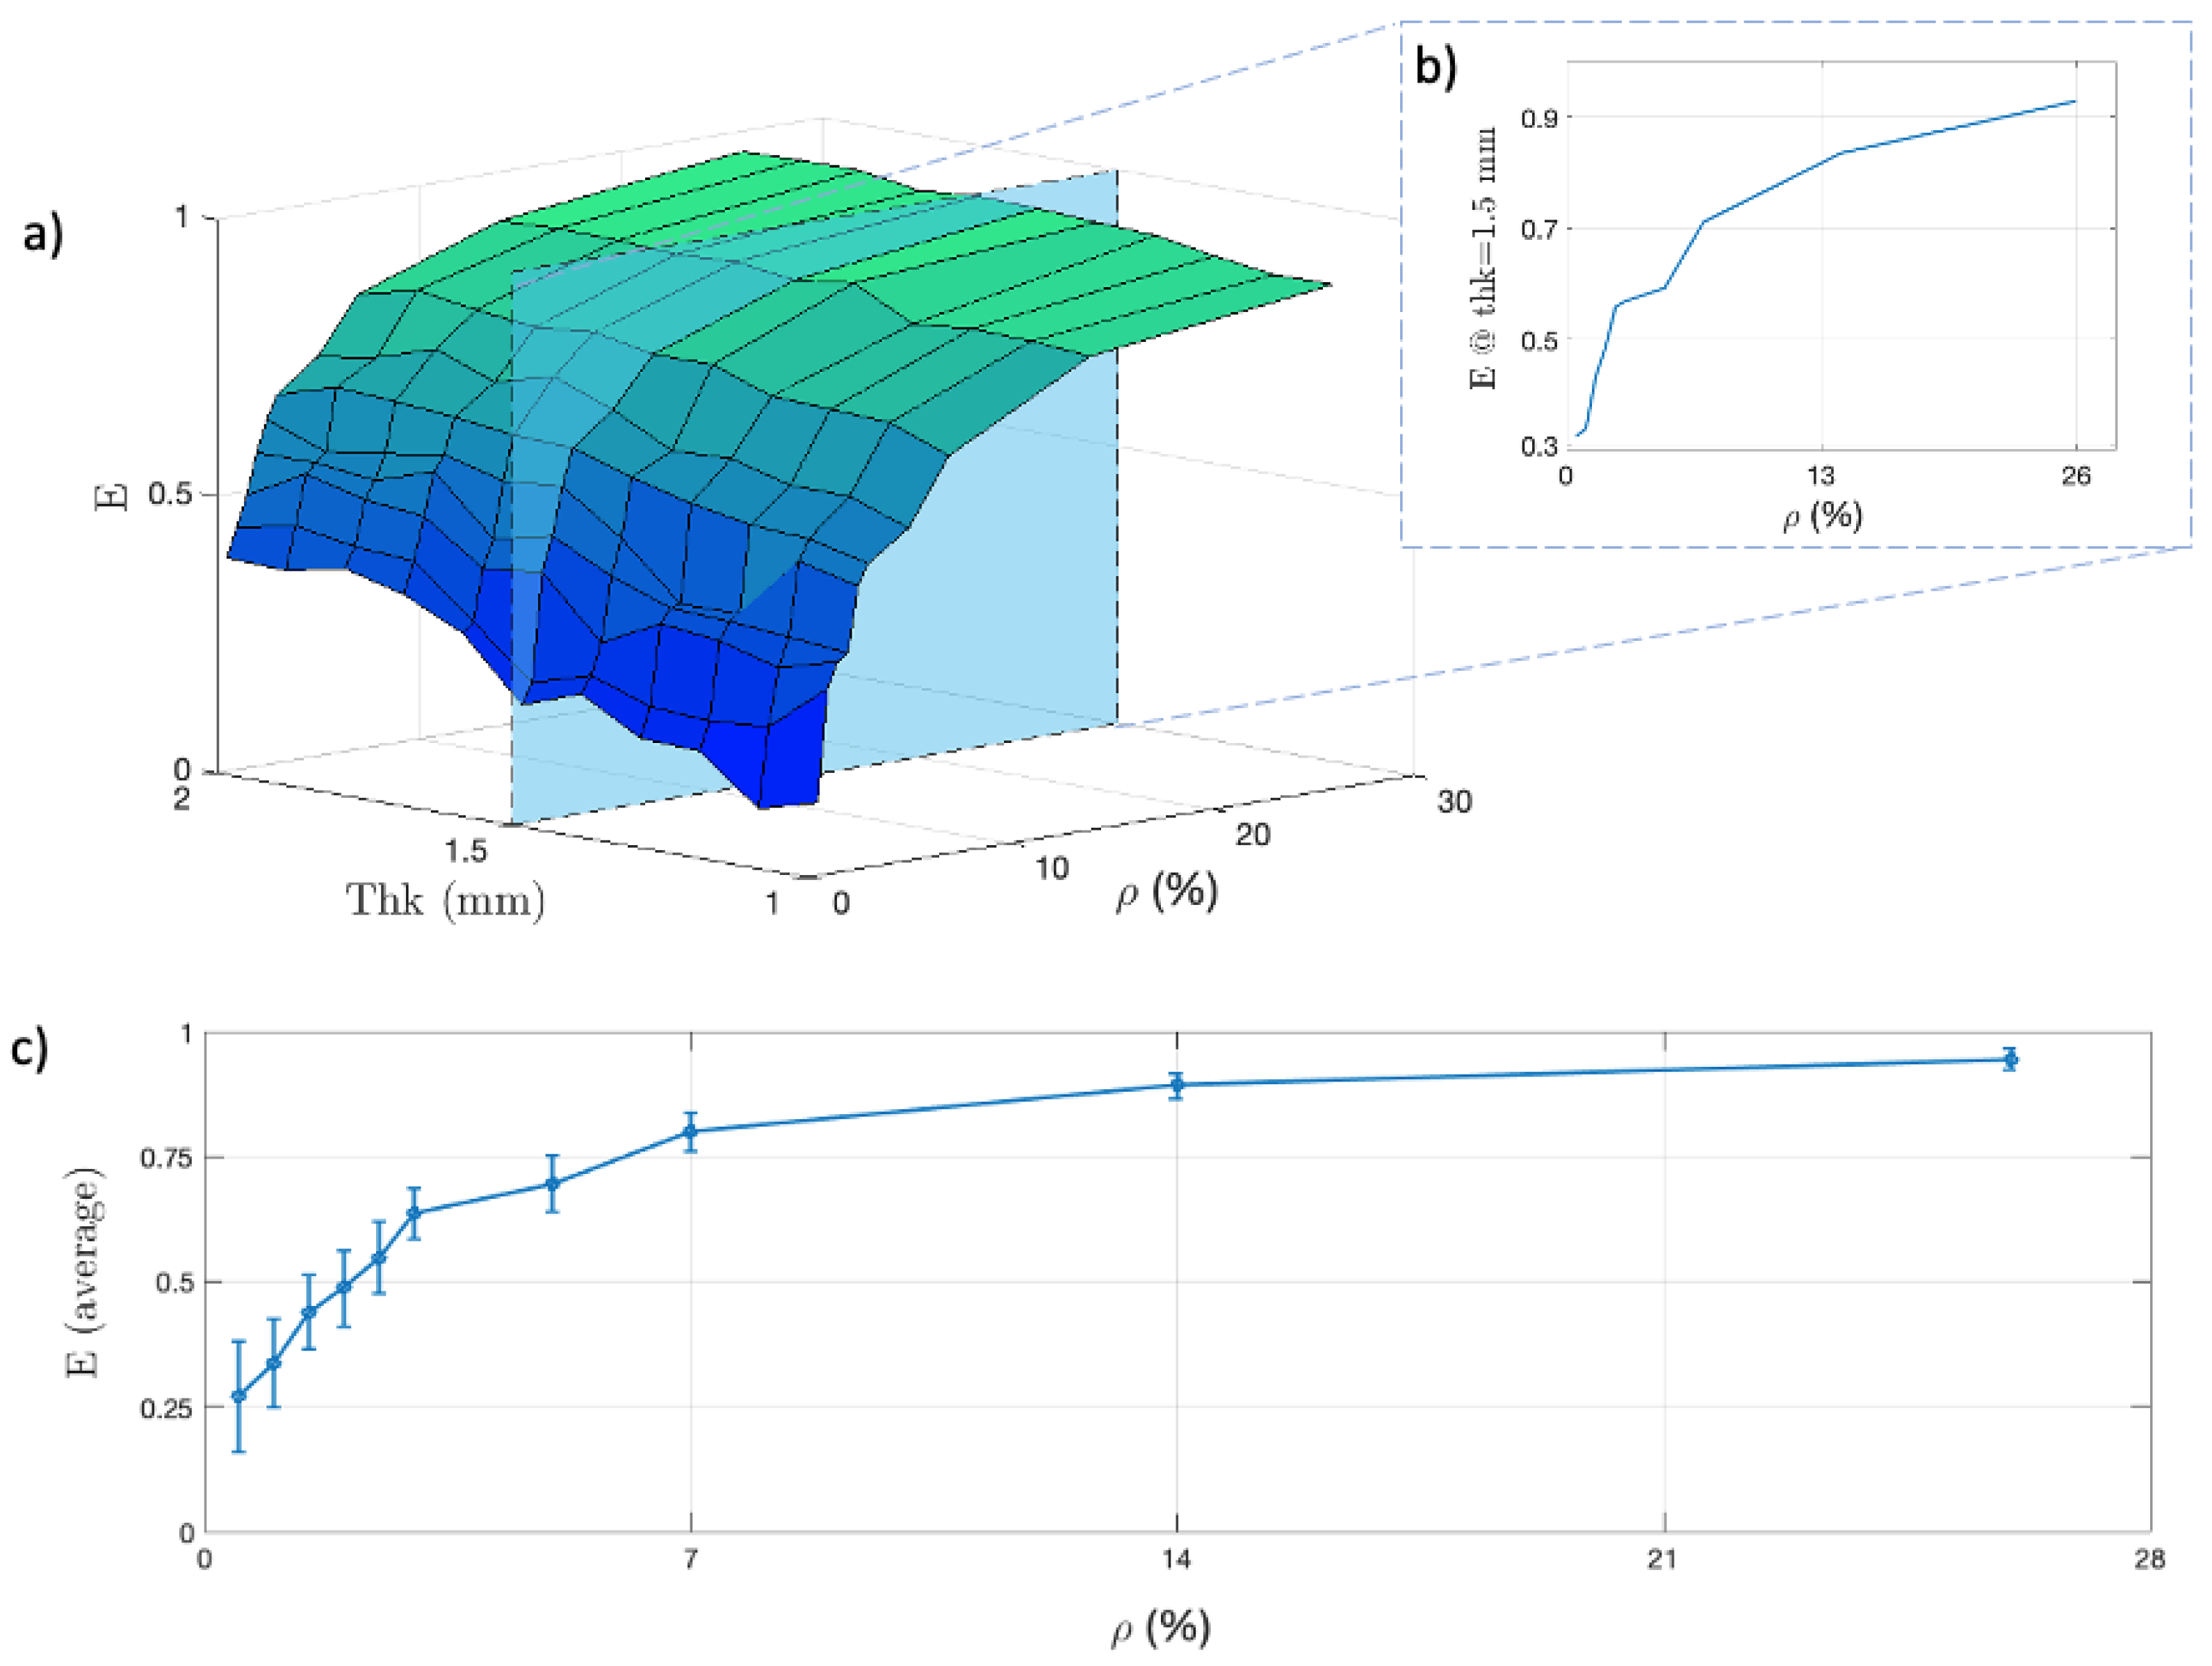
E values demonstrate that the SALS irradiation for specimens with thicknesses falling within this transition range will produce unreliable patterns. Starting from 1 mm, MS effect becomes dominant, and the eccentricity encounters a second rising, allowing again an evaluation of the simulated specimen anisotropy. Additionally, the results from simulation set S 3 demonstrate the effect of fiber density on the SALS spot. From Figure 6, it is possible to compare the influence of the ρ parameter against the specimen thk. The results showed that the scattered spot eccentricity rises by increasing the fiber density, as expected [37], given the increased contribution of the fibers on the light scattering. It is also worth to highlight the saturation effect occurring beyond 20%. It appears clear that, for sparse fiber distributions at low ρ values, the resulting eccentricity value does not permit a clear evaluation of the specimen status. The simulated trend also demonstrates that, beyond density value of about 20%, the thickness minimally influences the SALS spot eccentricity. This observation confirms that, under the assumption of a dense fiber matrix, the distribution can be individuated through SALS irradiation regardless of the thickness and the FS–MS phenomena. An additional confirmation is provided by the results of last simulation set
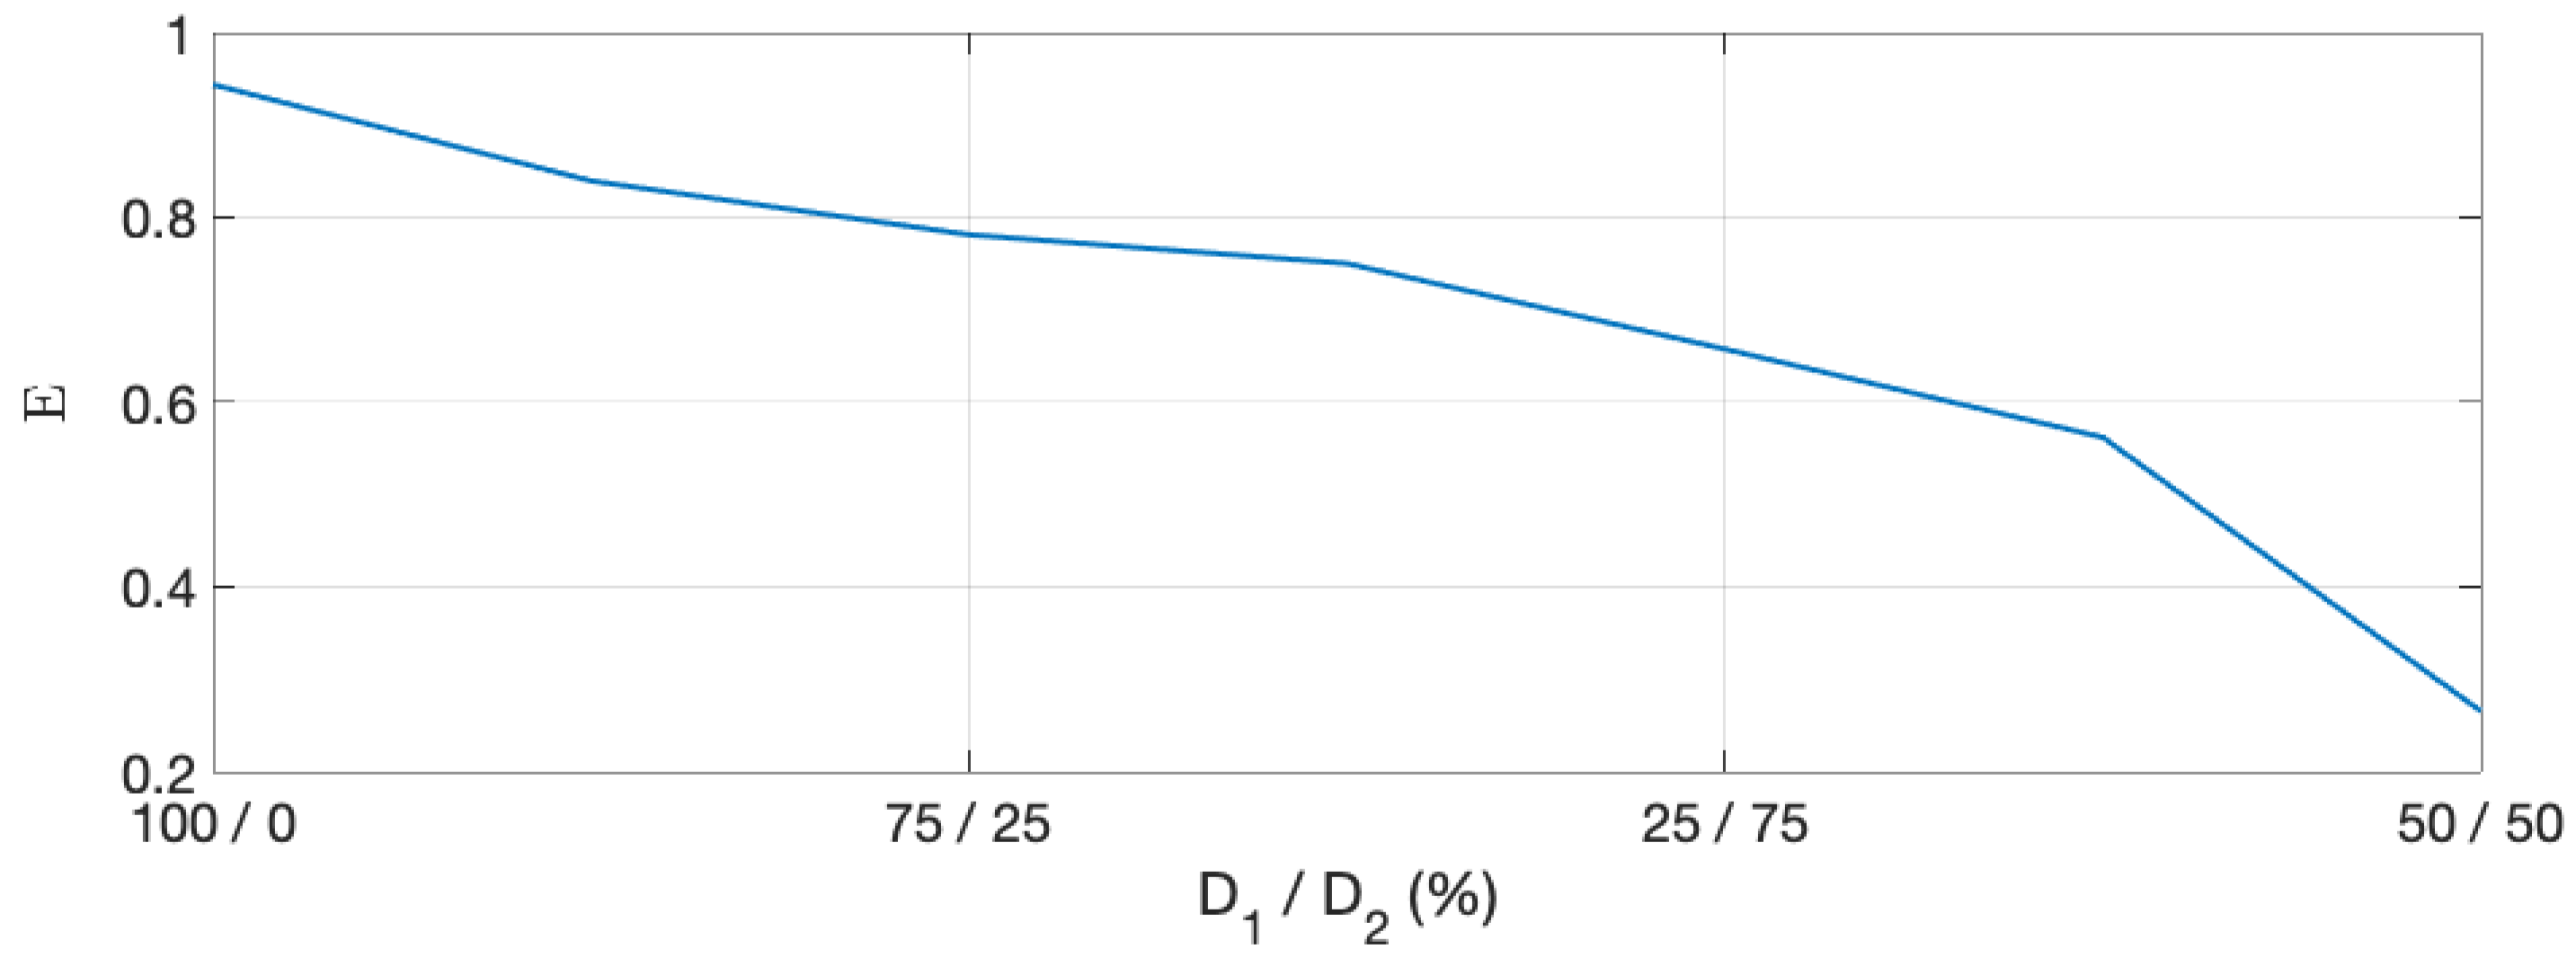
 S 4 . Figure 7 clearly reports the SALS spot behavior as the fibers orientations are redistributed in a thick specimen. The E value falls from a high value (close to 1) to a value of 0.27, corresponding to the correct isotropy assumption given by the 50%/50% symmetric case.
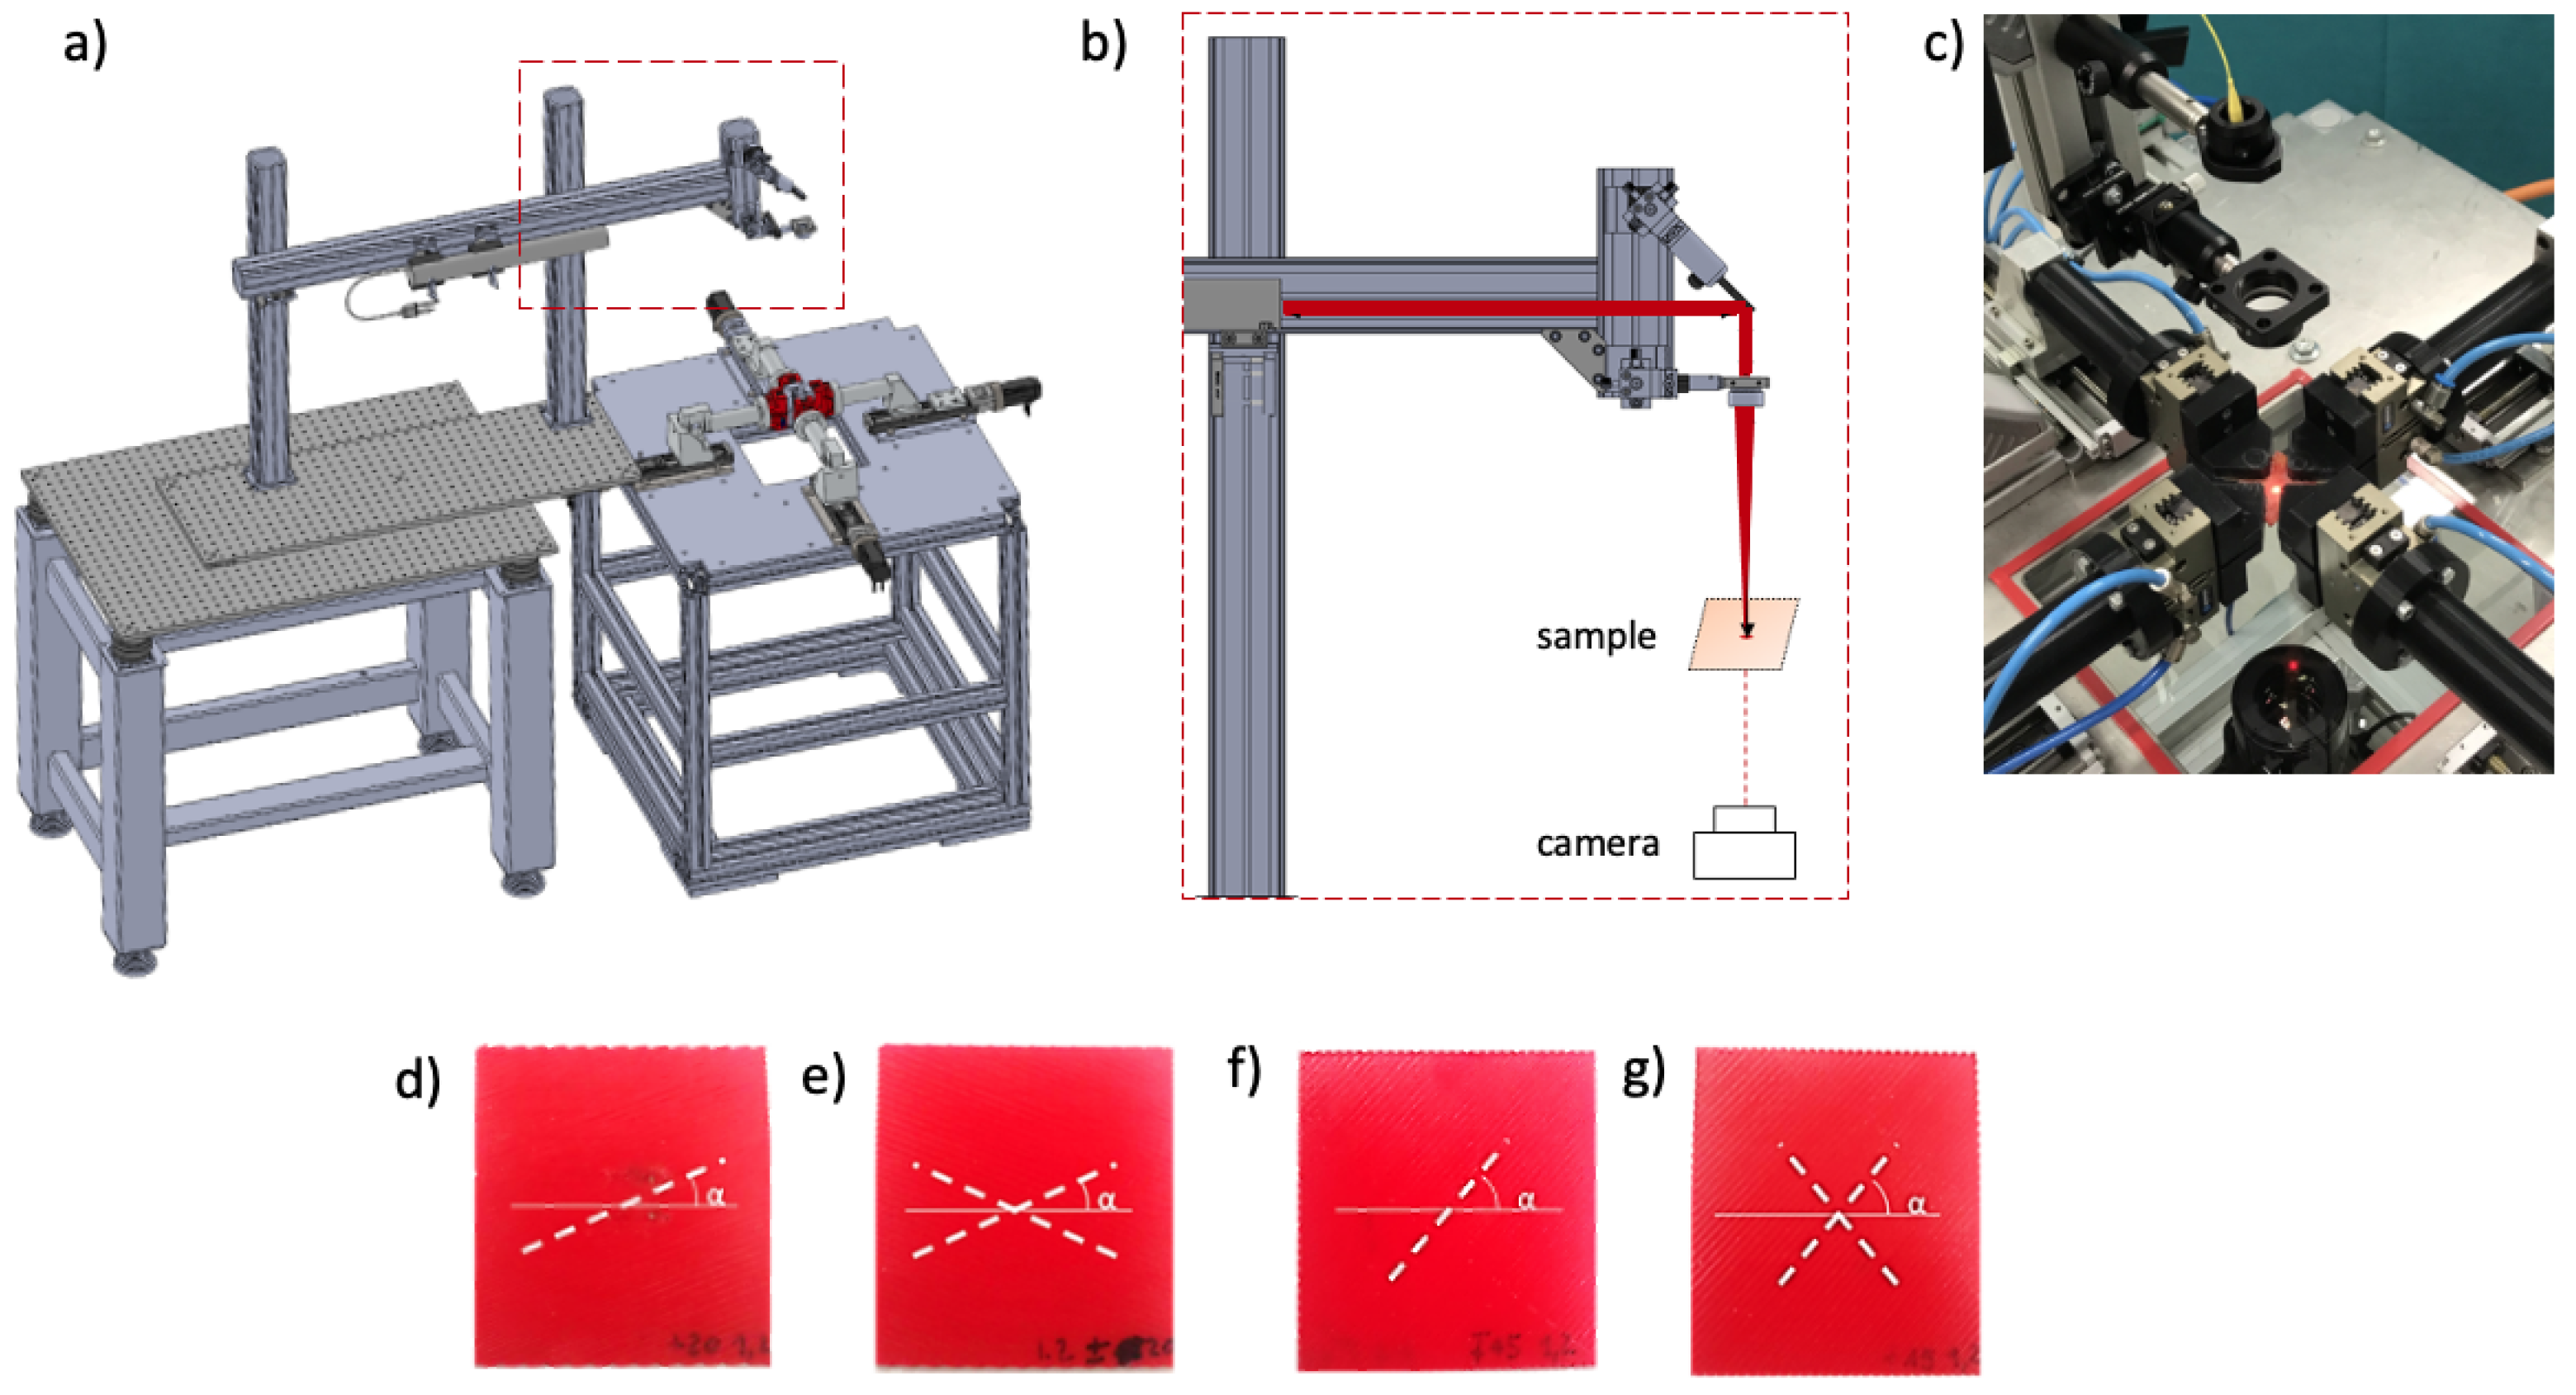
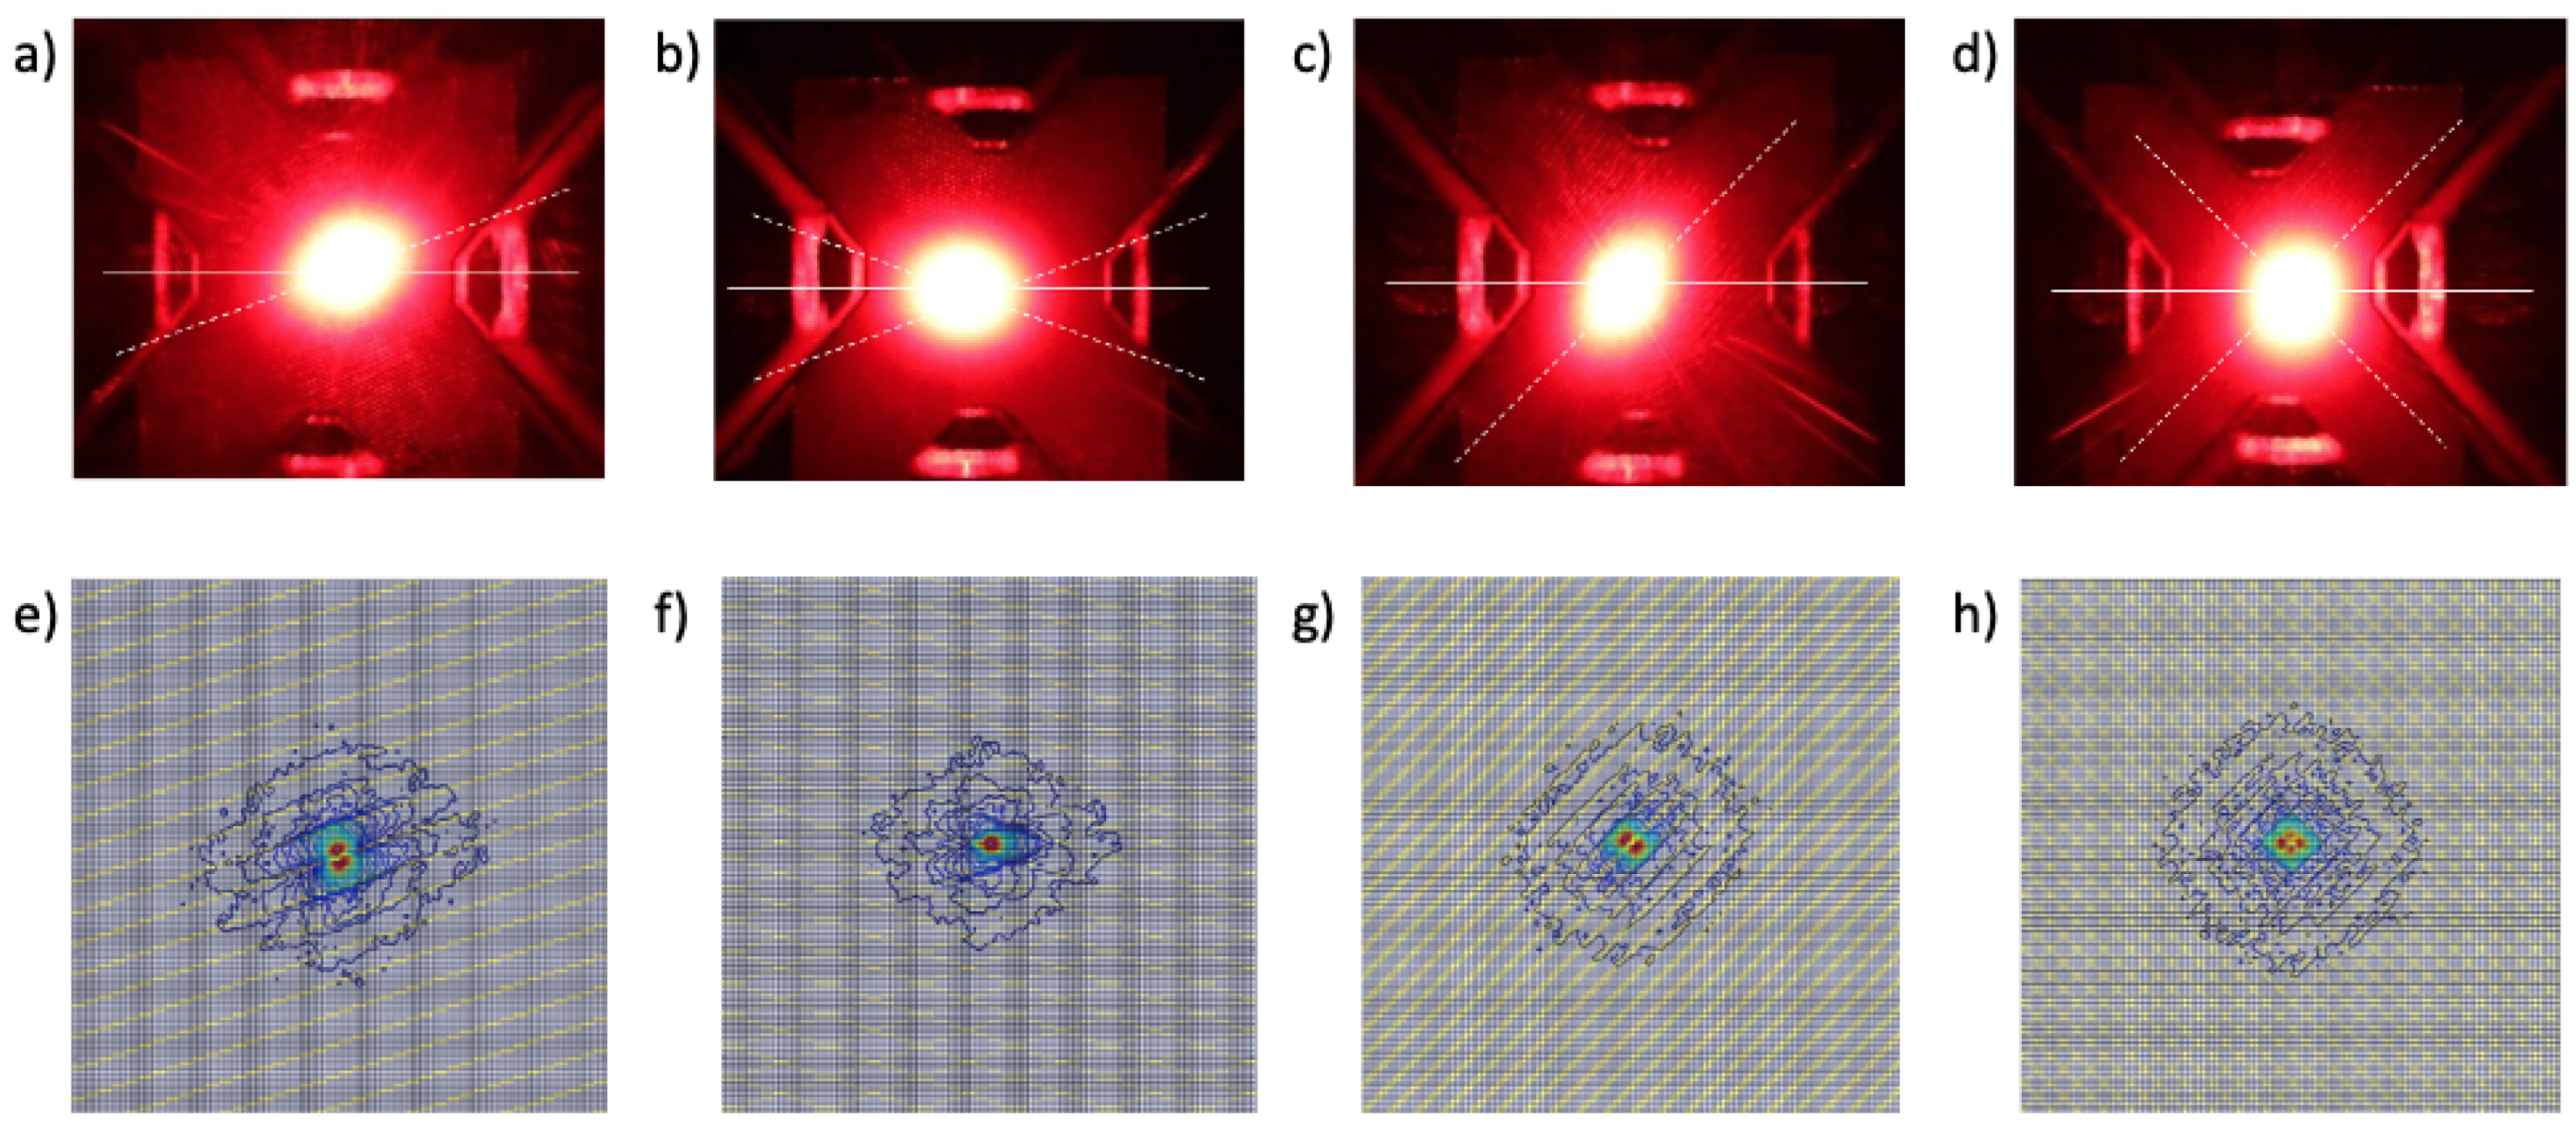
The in-silico results then confirmed the validation tests on the 3D printed specimens. The comparison between the simulated and the experimental results is reported in Figure 8 and Table 5. The SALS patterns observed correspond to the isocurves of the fluence from the S 1 set. The SALS beam traversing the medium produces a spot in accordance with the MS theory. Consequently, the SALS pattern from an isotropic specimen, like the ±45° case, produced an E value of 0.23, corresponding to an almost circular pattern, while the strongly anisotropic case of the 20° case resulted to have a spot aligned with the fiber main direction ( ϕ = 20.5°) with high eccentricity (E = 0.75). By comparing the scattered spot eccentricity and orientation angle from the experimental tests with the simulations results, the error appears to be negligible, with maximum values of 0.07 and 1.8° for the E and ϕ values, respectively. The resulting error between experimental and numerical data ought to be linked to the numerical discretization of the fiber matrix domain, plus the uncertainty linked with 3D printed specimen realization and the SALS spot measurement. The discretization error is expected to be lowered by adopting alternative meshing techniques. Nevertheless, the significant agreement between in-silico and experimental approach was still reported. Additionally, it is worth to note that the results are coherent even if the material optical properties differ between the in-silico and experimental procedures. This aspect confirms that the evaluated parameters exclusively depend on the inner fiber distribution. This experimental evidence confirms the correct implementation of the numerical setup. It is worth to note the potential to successfully predict the fiber distribution also in the MS region, confirmed by both numerical and experimental evidence. The developed numerical tool can be adopted for validation on actual biological tissue analysis to confirm the expected SALS distribution for thick specimens. The presented numerical approach can be adopted as an investigation tool to determine and confirm the SALS distribution of fibrous specimens through the a-priori knowledge of the specimen thickness.
Other in-silico studies are reported for the fiber characterization of thick specimens [38,39], but, to our knowledge, a full investigation of the different microstructural factors on the light pattern was lacking. The SALS technique presents limitations, especially in terms of actual quantitative information retrievable and off-plane accuracy [35]. Fiber families with non planar distributions do not contribute significantly to the SALS spot formation. Nevertheless, it is worth to underline that different biological tissues of great interest, such as blood vessels, present usually up to a maximum of two preferential fiber families orientations [1]. Additional fiber families can be included within the model in arbitrary way in terms of numbers and orientation. It is worth to stress that the increase of family numbers produces isotropic SALS responses, corresponding to more circular patterns. The current numerical approach was demonstrated to be effective even for multiple layers with different orientations.
The methods presented within this paper demonstrated the different effects of fiber distribution and specimen features in SALS signal at numerical level. This work was presented as a potential further step in the context of microstructural/mechanical characterization of biological tissues. The provided method can be inserted within the proposed biaxial-SALS experimental workflow [18,20], as an additional numerical tool for validation of the fiber family redistribution under mechanical tension. The current study aims at being a further step in understanding the different phenomena occurring as a consequence of light irradiation of fibrous specimens, with the support of numerical simulations. The computational results represent a basis for the development of new testing techniques for the characterization biological specimens microstructure and for the improvement of the SALS approach.

6. Conclusions

The knowledge of the microstructure of fibrous tissue remains pivotal in different applications and different optical techniques are presented in the state of art. The success of the SALS approach was widely demonstrated, however, a deep understanding of the underlying principles from a numerical point of view is sometimes lacking, especially when different scattering phenomena occur. In this work, MC simulations were set up for the investigation of the light scattering occurring through fibrous media with different thicknesses and microstructure distributions. The effects of different parameters like the fiber density, the specimen thickness and the orientation variation of the fiber families were analyzed. Remarkably, it was possible to observe that the grade of anisotropy of the medium could be qualitatively assessed even for large thicknesses by inspecting the fluence map. In case of a high spatial anisotropy, the preferential direction of the embedded fibers could be retrieved as well. The possibility to exploit the MS together with the FS phenomenon was demonstrated. The numerical results were successfully validated with experimental evidence. In fact, an SALS setup was adopted to irradiate 3D printed specimens with different fibrous structures. Satisfactory agreement was found between the numerical and the experimental fluence maps of the scattered spots. In conclusion, this work aimed at demonstrating the possibility of reconstructing the microstructure of fibrous materials in different conditions through the SALS technique. The presented insights represent an interesting step in the field of material testing, with possible applications in the characterization of soft biological tissues.

Author Contributions

Conceptualization, S.C.; methodology, S.C., E.V., E.G., F.d.B.; software, E.V. and F.d.B.; validation, E.V., E.G. and F.d.B.; formal analysis, E.V., E.G. and F.d.B.; investigation, S.C. and E.V.; resources, S.C., A.M.; data curation, E.V., E.G. and F.d.B.; writing—original draft preparation, S.C., E.V. and F.d.B.; writing—review and editing, S.C., E.V., E.G., F.d.B. and L.L.; visualization, E.V., E.G. and F.d.B.; supervision, S.C.; project administration, S.C.; funding acquisition, A.M., S.C. All authors have read and agreed to the published version of the manuscript.

Funding

This work was funded by Fondazione Pisa through the project DIVINE (IFOPISA17AM).

Data Availability Statement

The data presented in this study are available on request from the corresponding author.

Conflicts of Interest

The authors declare no conflict of interest.

Abbreviations

The following abbreviations are used in this manuscript:
SALSSmall Angle Light Scattering
FSFraunhofer Scattering
MSMultiple Scattering
EMextracellular matrix
EFembedded fibers

References

  1. Chow, M.J.; Turcotte, R.; Lin, C.; Zhang, Y. Arterial Extracellular Matrix: A Mechanobiological Study of the Contributions and Interactions of Elastin and Collagen. Biophys. J. 2014, 106, 2684–2692. [Google Scholar] [CrossRef] [Green Version]
  2. Wilson, J.S.; Bersi, M.R.; Li, G.; Humphrey, J.D. Correlation of wall microstructure and heterogeneous distributions of strain in evolving murine abdominal aortic aneurysms. Cardiovasc. Eng. Technol. 2017, 8, 193–204. [Google Scholar] [CrossRef] [PubMed]
  3. Aghamohammadzadeh, H.; Newton, R.H.; Meek, K.M. X-ray scattering used to map the preferred collagen orientation in the human cornea and limbus. Structure 2004, 12, 249–256. [Google Scholar] [CrossRef] [PubMed]
  4. Tadimalla, S.; Tourell, M.C.; Knott, R.; Momot, K.I. Assessment of collagen fiber orientation dispersion in articular cartilage by small-angle X-ray scattering and diffusion tensor imaging: Preliminary results. Magn. Reson. Imaging 2018, 48, 115–121. [Google Scholar] [CrossRef] [PubMed] [Green Version]
  5. Kostyuk, O.; Brown, R.A. Novel spectroscopic technique for in situ monitoring of collagen fibril alignment in gels. Biophys. J. 2004, 87, 648–655. [Google Scholar] [CrossRef] [PubMed] [Green Version]
  6. Belghasem, M.E.; A’amar, O.; Roth, D.; Walker, J.; Arinze, N.; Richards, S.M.; Francis, J.M.; Salant, D.J.; Chitalia, V.C.; Bigio, I.J. Towards minimally-invasive, quantitative assessment of chronic kidney disease using optical spectroscopy. Sci. Rep. 2019, 9, 1–11. [Google Scholar] [CrossRef] [PubMed]
  7. Tower, T.T.; Tranquillo, R.T. Alignment maps of tissues: I. Microscopic elliptical polarimetry. Biophys. J. 2001, 81, 2954–2963. [Google Scholar] [CrossRef] [Green Version]
  8. Ávila, F.J.; Del Barco, O.; Bueno, J.M. Quantifying external and internal collagen organization from Stokes-vector-based second harmonic generation imaging polarimetry. J. Opt. 2017, 19, 105301. [Google Scholar] [CrossRef] [Green Version]
  9. Kim, J.; Feng, J.; Jones, C.A.; Mao, X.; Sander, L.M.; Levine, H.; Sun, B. Stress-induced plasticity of dynamic collagen networks. Nat. Commun. 2017, 8, 1–7. [Google Scholar] [CrossRef] [Green Version]
  10. Guilbert, M.; Roig, B.; Terryn, C.; Garnotel, R.; Jeannesson, P.; Sockalingum, G.D.; Manfait, M.; Perraut, F.; Dinten, J.M.; Koenig, A.; et al. Highlighting the impact of aging on type I collagen: Label-free investigation using confocal reflectance microscopy and diffuse reflectance spectroscopy in 3D matrix model. Oncotarget 2016, 7, 8546. [Google Scholar] [CrossRef]
  11. Okoro, C.; Kelkar, V.; Sivaguru, M.; Emmadi, R.; Toussaint, K.C. Second-harmonic patterned polarization-analyzed reflection confocal microscopy of stromal collagen in benign and malignant breast tissues. Sci. Rep. 2018, 8, 1–8. [Google Scholar] [CrossRef] [Green Version]
  12. Hristu, R.; Stanciu, S.G.; Tranca, D.E.; Stanciu, G.A. Improved quantification of collagen anisotropy with polarization-resolved second harmonic generation microscopy. J. Biophotonics 2017, 10, 1171–1179. [Google Scholar] [CrossRef]
  13. Goth, W.; Yang, B.; Lesicko, J.; Allen, A.; Sacks, M.S.; Tunnell, J.W. Polarized spatial frequency domain imaging of heart valve fiber structure. Int. Soc. Opt. Photonics 2016, 9710, 971019. [Google Scholar]
  14. Sacks, M.S.; Smith, D.B.; Hiester, E.D. A small angle light scattering device for planar connective tissue microstructural analysis. Ann. Biomed. Eng. 1997, 25, 678–689. [Google Scholar] [CrossRef]
  15. Robitaille, M.C.; Zareian, R.; DiMarzio, C.A.; Wan, K.T.; Ruberti, J.W. Small-angle light scattering to detect strain-directed collagen degradation in native tissue. Interface Focus 2011, 1, 767–776. [Google Scholar] [CrossRef] [Green Version]
  16. Pant, A.D.; Thomas, V.S.; Black, A.L.; Verba, T.; Lesicko, J.G.; Amini, R. Pressure-induced microstructural changes in porcine tricuspid valve leaflets. Acta Biomater. 2018, 67, 248–258. [Google Scholar] [CrossRef] [PubMed]
  17. Gaul, R.; Nolan, D.; Lally, C. Collagen fibre characterisation in arterial tissue under load using SALS. J. Mech. Behav. Biomed. Mater. 2017, 75, 359–368. [Google Scholar] [CrossRef] [PubMed]
  18. Vignali, E.; di Bartolo, F.; Gasparotti, E.; Malacarne, A.; Concistré, G.; Chiaramonti, F.; Murzi, M.; Positano, V.; Landini, L.; Celi, S. Correlation between micro and macrostructural biaxial behavior of ascending thoracic aneurysm: A novel experimental technique. Med Eng. Phys. 2020, 86, 78–85. [Google Scholar] [CrossRef] [PubMed]
  19. Großkopf, S.; Tiersch, B.; Koetz, J.; Mix, A.; Hellweg, T. Shear-Induced Transformation of Polymer-Rich Lamellar Phases to Micron-Sized Vesicles. Langmuir 2019, 35, 3048–3057. [Google Scholar] [CrossRef]
  20. Vignali, E.; Gasparotti, E.; Landini, L.; Celi, S. Development and Realization of an Experimental Bench Test for Synchronized Small Angle Light Scattering and Biaxial Traction Analysis of Tissues. Electronics 2021, 10, 386. [Google Scholar] [CrossRef]
  21. Gaul, R.; Nolan, D.; Lally, C. The use of small angle light scattering in assessing strain induced collagen degradation in arterial tissue ex vivo. J. Biomech. 2018, 81, 155–160. [Google Scholar] [CrossRef]
  22. Schmitt, J.M.; Kumar, G. Optical scattering properties of soft tissue: A discrete particle model. Appl. Opt. 1998, 37, 2788–2797. [Google Scholar] [CrossRef]
  23. Tuchin, V.V. Laser light scattering in biomedical diagnostics and therapy. J. Laser Appl. 1993, 5, 43–60. [Google Scholar] [CrossRef] [PubMed]
  24. Sacks, M.S. Incorporation of experimentally-derived fiber orientation into a structural constitutive model for planar collagenous tissues. J. Biomech. Eng. 2003, 125, 280–287. [Google Scholar] [CrossRef] [PubMed]
  25. Vyavahare, N.; Ogle, M.; Schoen, F.J.; Zand, R.; Gloeckner, D.C.; Sacks, M.; Levy, R.J. Mechanisms of bioprosthetic heart valve failure: Fatigue causes collagen denaturation and glycosaminoglycan loss. J. Biomed. Mater. Res. Off. J. Soc. Biomater. Jpn. Soc. Biomater. Aust. Soc. Biomater. 1999, 46, 44–50. [Google Scholar] [CrossRef]
  26. Linder, T.; Löfqvist, T.; Wernersson, E.L.; Gren, P. Light scattering in fibrous media with different degrees of in-plane fiber alignment. Opt. Express 2014, 22, 16829–16840. [Google Scholar] [CrossRef]
  27. Jacques, S.L. Optical properties of biological tissues: A review. Phys. Med. Biol. 2013, 58, R37. [Google Scholar] [CrossRef] [PubMed]
  28. Fukutomi, D.; Ishii, K.; Awazu, K. Determination of the scattering coefficient of biological tissue considering the wavelength and absorption dependence of the anisotropy factor. Opt. Rev. 2016, 23, 291–298. [Google Scholar] [CrossRef]
  29. Kienle, A.; Wetzel, C.; Bassi, A.L.; Comelli, D.; Taroni, P.; Pifferi, A. Determination of the optical properties of anisotropic biological media using an isotropic diffusion model. J. Biomed. Opt. 2007, 12, 1–9. [Google Scholar] [CrossRef]
  30. Leino, A.A.; Pulkkinen, A.; Tarvainen, T. ValoMC: A Monte Carlo software and MATLAB toolbox for simulating light transport in biological tissue. OSA Contin. 2019, 2, 957–972. [Google Scholar] [CrossRef]
  31. Gasparotti, E.; Vignali, E.; Losi, P.; Scatto, M.; Fanni, B.; Soldani, G.; Landini, L.; Positano, V.; Celi, S. A 3D printed melt-compounded antibiotic loaded thermoplastic polyurethane heart valve ring design: An integrated framework of experimental material tests and numerical simulations. Int. J. Polym. Mater. Polym. Biomater. 2019, 68, 1–10. [Google Scholar] [CrossRef]
  32. Vignali, E.; Gasparotti, E.; Capellini, K.; Fanni, B.M.; Landini, L.; Positano, V.; Celi, S. Modeling biomechanical interaction between soft tissue and soft robotic instruments: Importance of constitutive anisotropic hyperelastic formulations. Int. J. Robot. Res. 2020. [Google Scholar] [CrossRef]
  33. Di Puccio, F.; Celi, S.; Forte, P. Review of Experimental Investigations on Compressibility of Arteries and Introduction of a New Apparatus. Exp. Mech. 2012, 52, 895–902. [Google Scholar] [CrossRef]
  34. Di Achille, P.; Celi, S.; Di Puccio, F.; Forte, P. Anisotropic AAA: Computational comparison between four and two fiber family material models. J. Biomech. 2011, 44, 2418–2426. [Google Scholar] [CrossRef]
  35. Sacks, M.S.; Gloeckner, D.C. Quantification of the fiber architecture and biaxial mechanical behavior of porcine intestinal submucosa. J. Biomed. Mater. Res. Off. J. Soc. Biomater. Jpn. Soc. Biomater. Aust. Soc. Biomater. 1999, 46, 1–10. [Google Scholar] [CrossRef]
  36. Mishchenko, M.I. Electromagnetic Scattering by Particles and Particle Groups: An Introduction; Cambridge University Press: Cambridge, UK, 2014. [Google Scholar]
  37. Whelan, A.; Williams, E.; Nolan, D.R.; Murphy, B.; Gunning, P.S.; O’Reilly, D.; Lally, C. Bovine Pericardium of High Fibre Dispersion Has High Fatigue Life and Increased Collagen Content; Potentially an Untapped Source of Heart Valve Leaflet Tissue. Ann. Biomed. Eng. 2020. [Google Scholar] [CrossRef]
  38. Yang, B.; Lesicko, J.; Sharma, M.; Hill, M.; Sacks, M.S.; Tunnell, J.W. Polarized light spatial frequency domain imaging for non-destructive quantification of soft tissue fibrous structures. Biomed. Opt. Express 2015, 6, 1520–1533. [Google Scholar] [CrossRef] [Green Version]
  39. Jett, S.V.; Hudson, L.T.; Baumwart, R.; Bohnstedt, B.N.; Mir, A.; Burkhart, H.M.; Holzapfel, G.A.; Wu, Y.; Lee, C.H. Integration of polarized spatial frequency domain imaging (pSFDI) with a biaxial mechanical testing system for quantification of load-dependent collagen architecture in soft collagenous tissues. Acta Biomater. 2020, 102, 149–168. [Google Scholar] [CrossRef] [PubMed]
Figure 1. Schematic of (a) Fraunhofer Scattering (FS) diffraction and (b) Multiple Scattering (MS) physical principles.
Electronics 10 00579 g001
Figure 2. (a) Schematic for the specimen irradiation simulation, with exemplification of cases: single fiber family with (b) α 1 = 45° and (c) α 1 , 2 = ±45°.
Electronics 10 00579 g002
Figure 3. (a,b) CAD models for the experimental Small Angle Light Scattering (SALS) setup with (c) highlight on the laser head. 3D printed specimens with different in fill angles: (d) α 1 = 20°, (e) α 1 , 2 = 20°, (f) α 1 = 45° and (g) α 1 , 2 = ±45°.
Electronics 10 00579 g003
Figure 4. Isocurve fluence maps from simulation set S 1 : (a) α 1 = 45°, (b) α 1 = 20°, (c) α 1 , 2 = ±45°, (d) α 1 , 2 = ±20°, (e) α 1 = 0°, (f) α 1 = 90° and (g) α 1 , 2 = 0°/90°.
Electronics 10 00579 g004
Figure 5. Eccentricity (E) resulting from simulation set S 2 as a function of specimen thickness. The three main zones are depicted: Fraunhofer region (FS-region), Transient region (T-region) and Multiple Scattering region (MS-region).
Electronics 10 00579 g005
Figure 6. Results from simulation set S 3 : (a) 3D plot of fiber eccentricity as a function of both specimen thickness and fiber density (b) with highlights on the thk = 1.5 mm case. (c) Corresponding eccentricity averaged on the thickness as a function of density.
Electronics 10 00579 g006
Figure 7. Results from simulation set S 4 in terms of eccentricity variation as a function of different D 1 / D 2 values.
Electronics 10 00579 g007
Figure 8. (ad) SALS test and (eh) isocurve fluence maps resulting from the numerical simulations for each 3D-printed fibrous sample: (a,e) α 1 = 20°, (b,f) α 1 , 2 = ±20°, (c,g) α 1 , 2 = 45° and (d,h) α 1 , 2 = ±45°.
Electronics 10 00579 g008
Table 1. Table summarizing the geometry parameters for the S 1 simulation set.
Case α 1 α 2
145°-
220°-
345°−45°
420°−20°
5-
690°-
790°
Table 2. Optical properties of the simulated in-silico media.
Set α 1 α 2 D 1 D 2 ρ thk
S 2 -100%-26%0.2–2 mm
S 3 -100%-0.5–26%0.2–2 mm
S 4 90°100–50%0–50%26%1.3 mm
Table 3. Table summarizing the geometry parameters for the experimental validation tests specimens.
Case α 1 α 2 D 1 D 2
120°-100%-
220°−20°50%50%
345°-100%-
445°−45°50%50%
Table 4. Table summarizing the E and the ϕ parameters resulting from the S 1 simulations at different fiber distributions and thickness values.
Casethk 0.2 mmthk 1.3 mm
α 1 , 2 D 1 , 2 E ϕ E ϕ
45°100%0.63134.3°0.6844.2°
20°100%0.68111.2°0.7120.5°
±45°50%/50%0.31isotropic0.31isotropic
±20°50%/50%0.6091.4°0.642.0°
100%0.7989.4°0.920.7°
90°100%0.800.3°0.9188.9°
0°/90°50%/50%0.22isotropic0.29isotropic
Table 5. Table summarizing the E and the ϕ parameters resulting from the S 1 simulations at different fiber distributions and thickness values.
CaseExperimentalNumerical ( S 1 )Error
α 1 , 2 E ϕ E ϕ E ϕ
20°0.7520.5°0.7119.0°0.040.5°
±20°0.622.0°0.643.6°0.021.6°
45°0.6544.2°0.6846.0°0.031.8°
±45°0.24isotropic0.31isotropic0.07-
Publisher’s Note: MDPI stays neutral with regard to jurisdictional claims in published maps and institutional affiliations.

