
Development and Realization of an Experimental Bench Test for Synchronized Small Angle Light Scattering and Biaxial Traction Analysis of Tissues


Abstract
:1. Introduction
2. Mechanical Theory Background
3. Design and Materials
3.1. Technical Specifications
- A hardware setup allowing for soft tissue biaxial tensioning, with a software algorithm to control the tension status of the specimen. The possibility to impose different tension ratios has to be included, with a mechanical force accuracy of at least 0.1 N.
- A contactless system for the deformation recording allowing for biaxial stretches registration, with an accuracy of 0.1%.
- A laser system allowing for SALS irradiation of soft tissues and a corresponding actuation system for local evaluation of fiber distribution along a prescribed pattern.
- An optical system to record the SALS spots and an algorithm to extract significant SALS parameters has to be included.
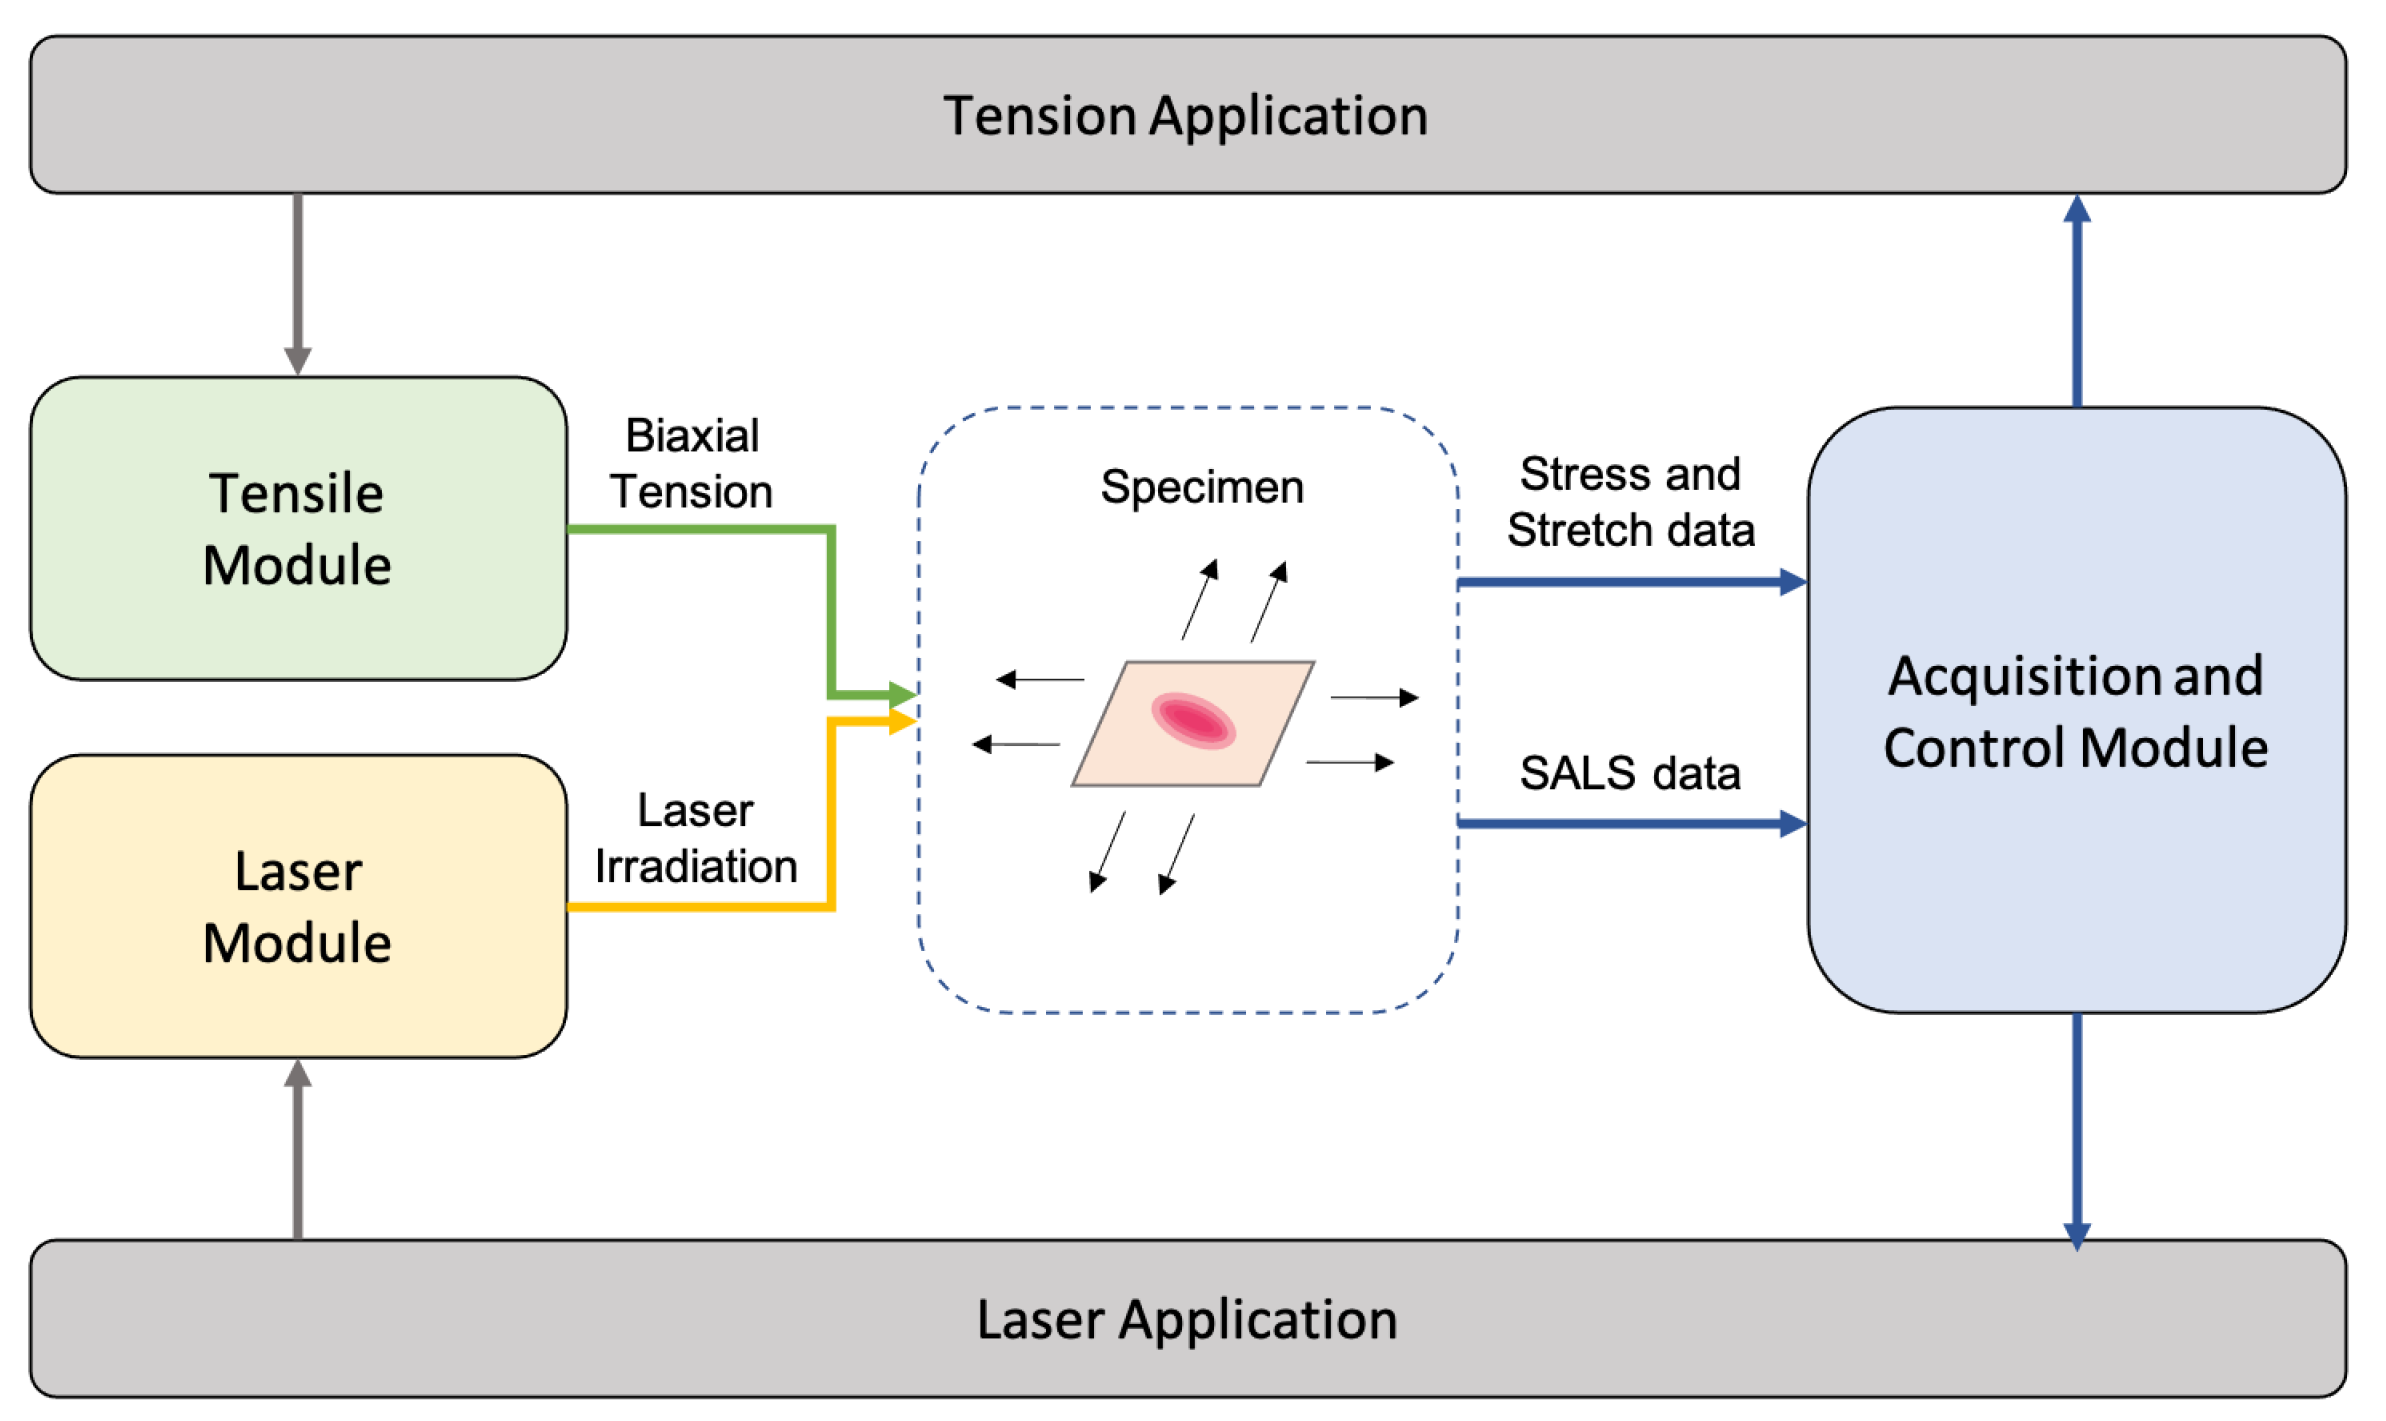
3.2. Modules and Applications
- Tensile module (TM)—for the mechanical actuation and tensioning of the specimen.
- Laser module (LM)—for the irradiation of the specimen during the tensioning.
- Acquisition/control module (ACM)—for signal registration and hardware control during the test procedure.
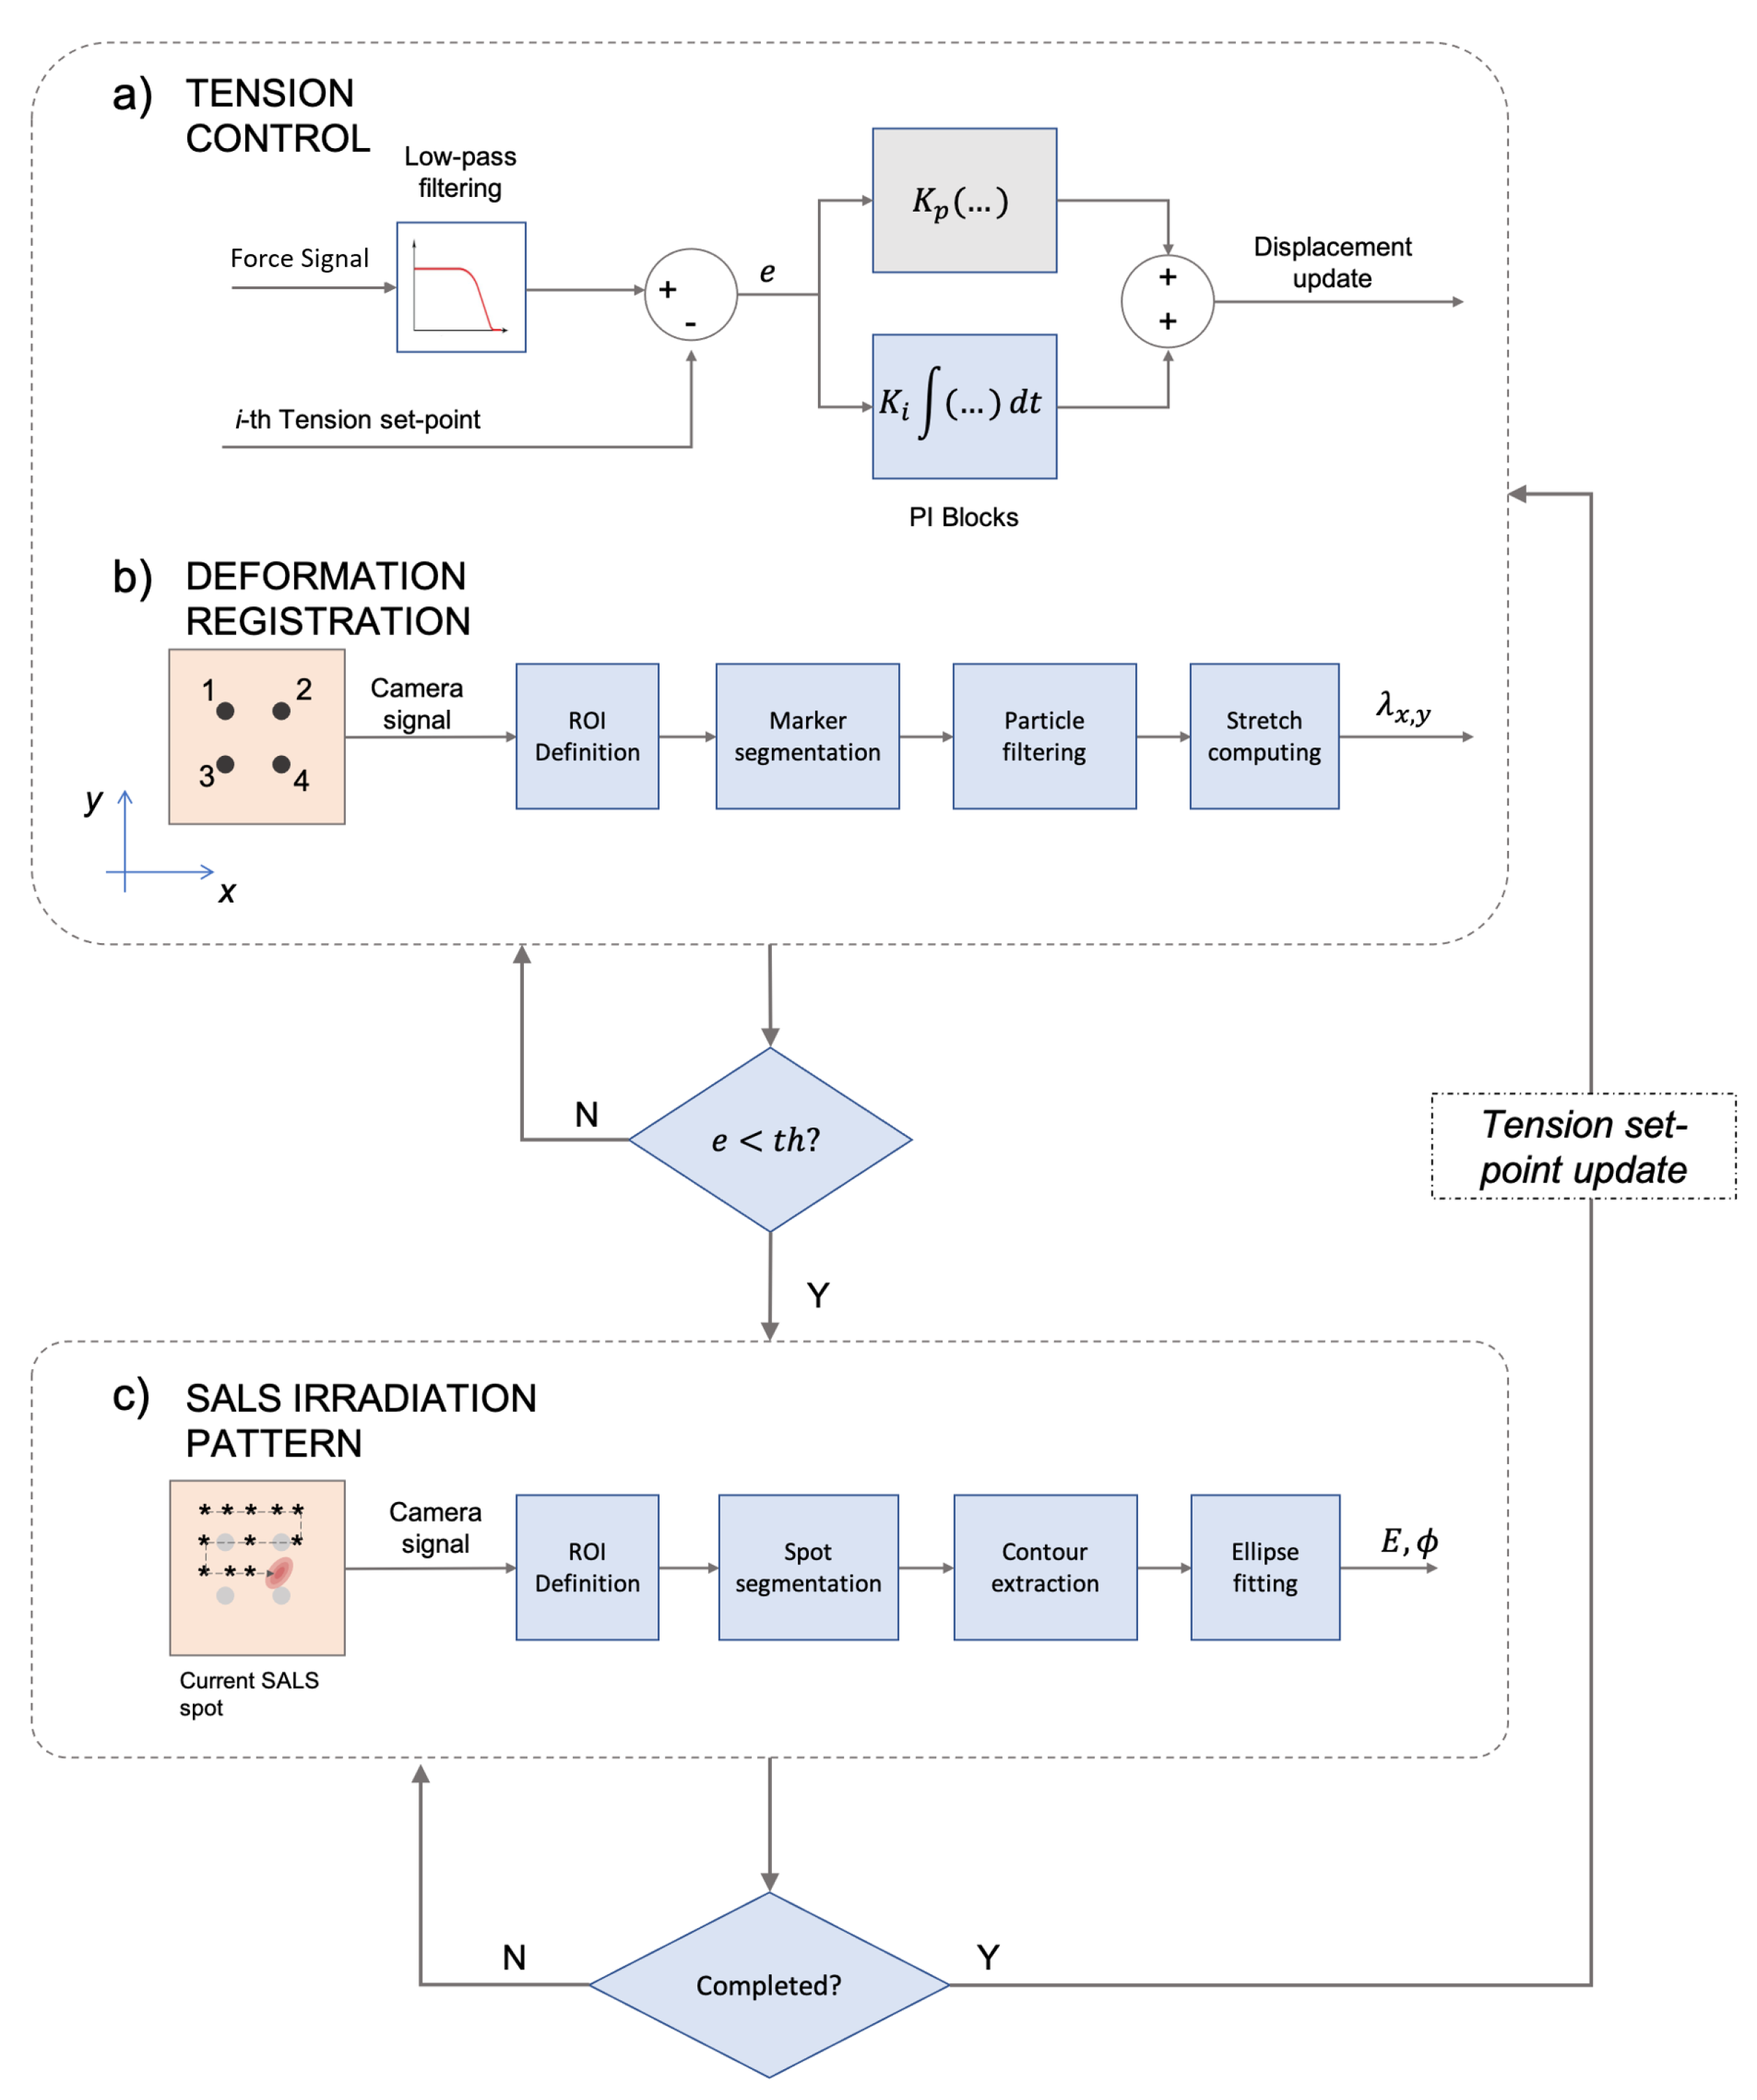
- Tension application (TA)—for the control of TM hardware, tension/deformation signal acquisition and mechanical results’ visualization;
- Laser application (LA)—for the control of LM hardware, laser pattern acquisition/ processing and fiber distribution results visualization.
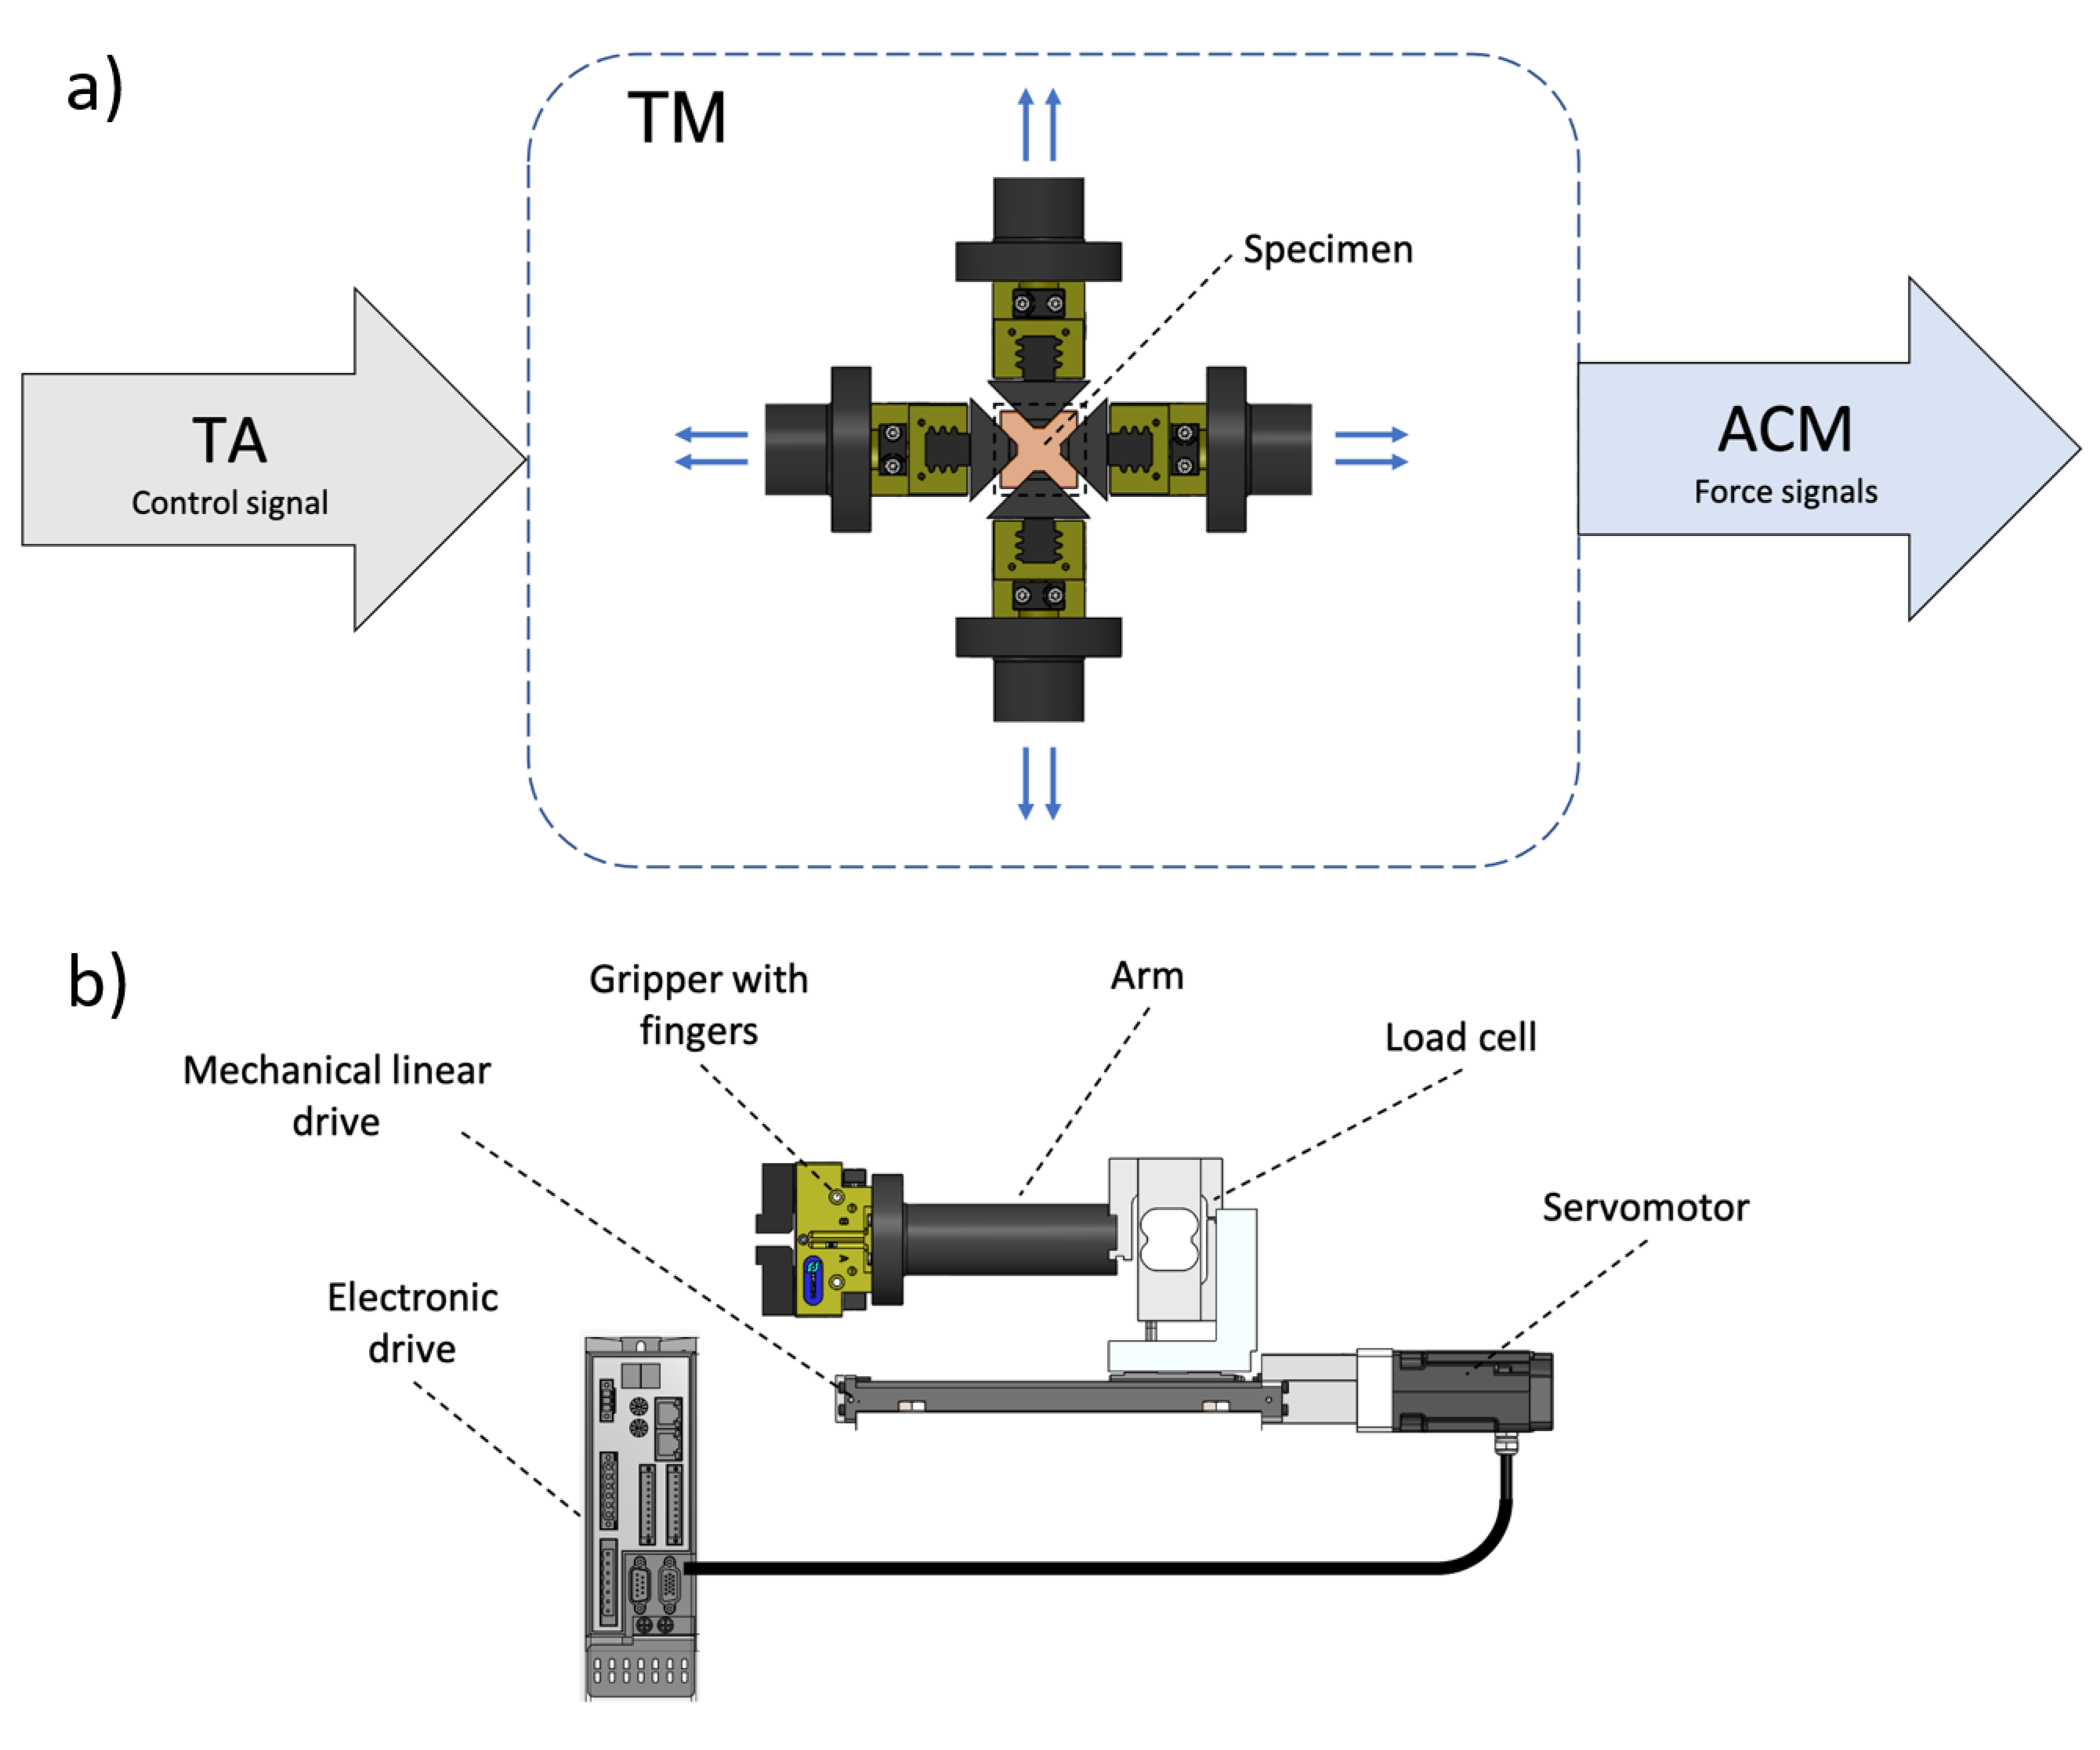
3.3. Tensile Module
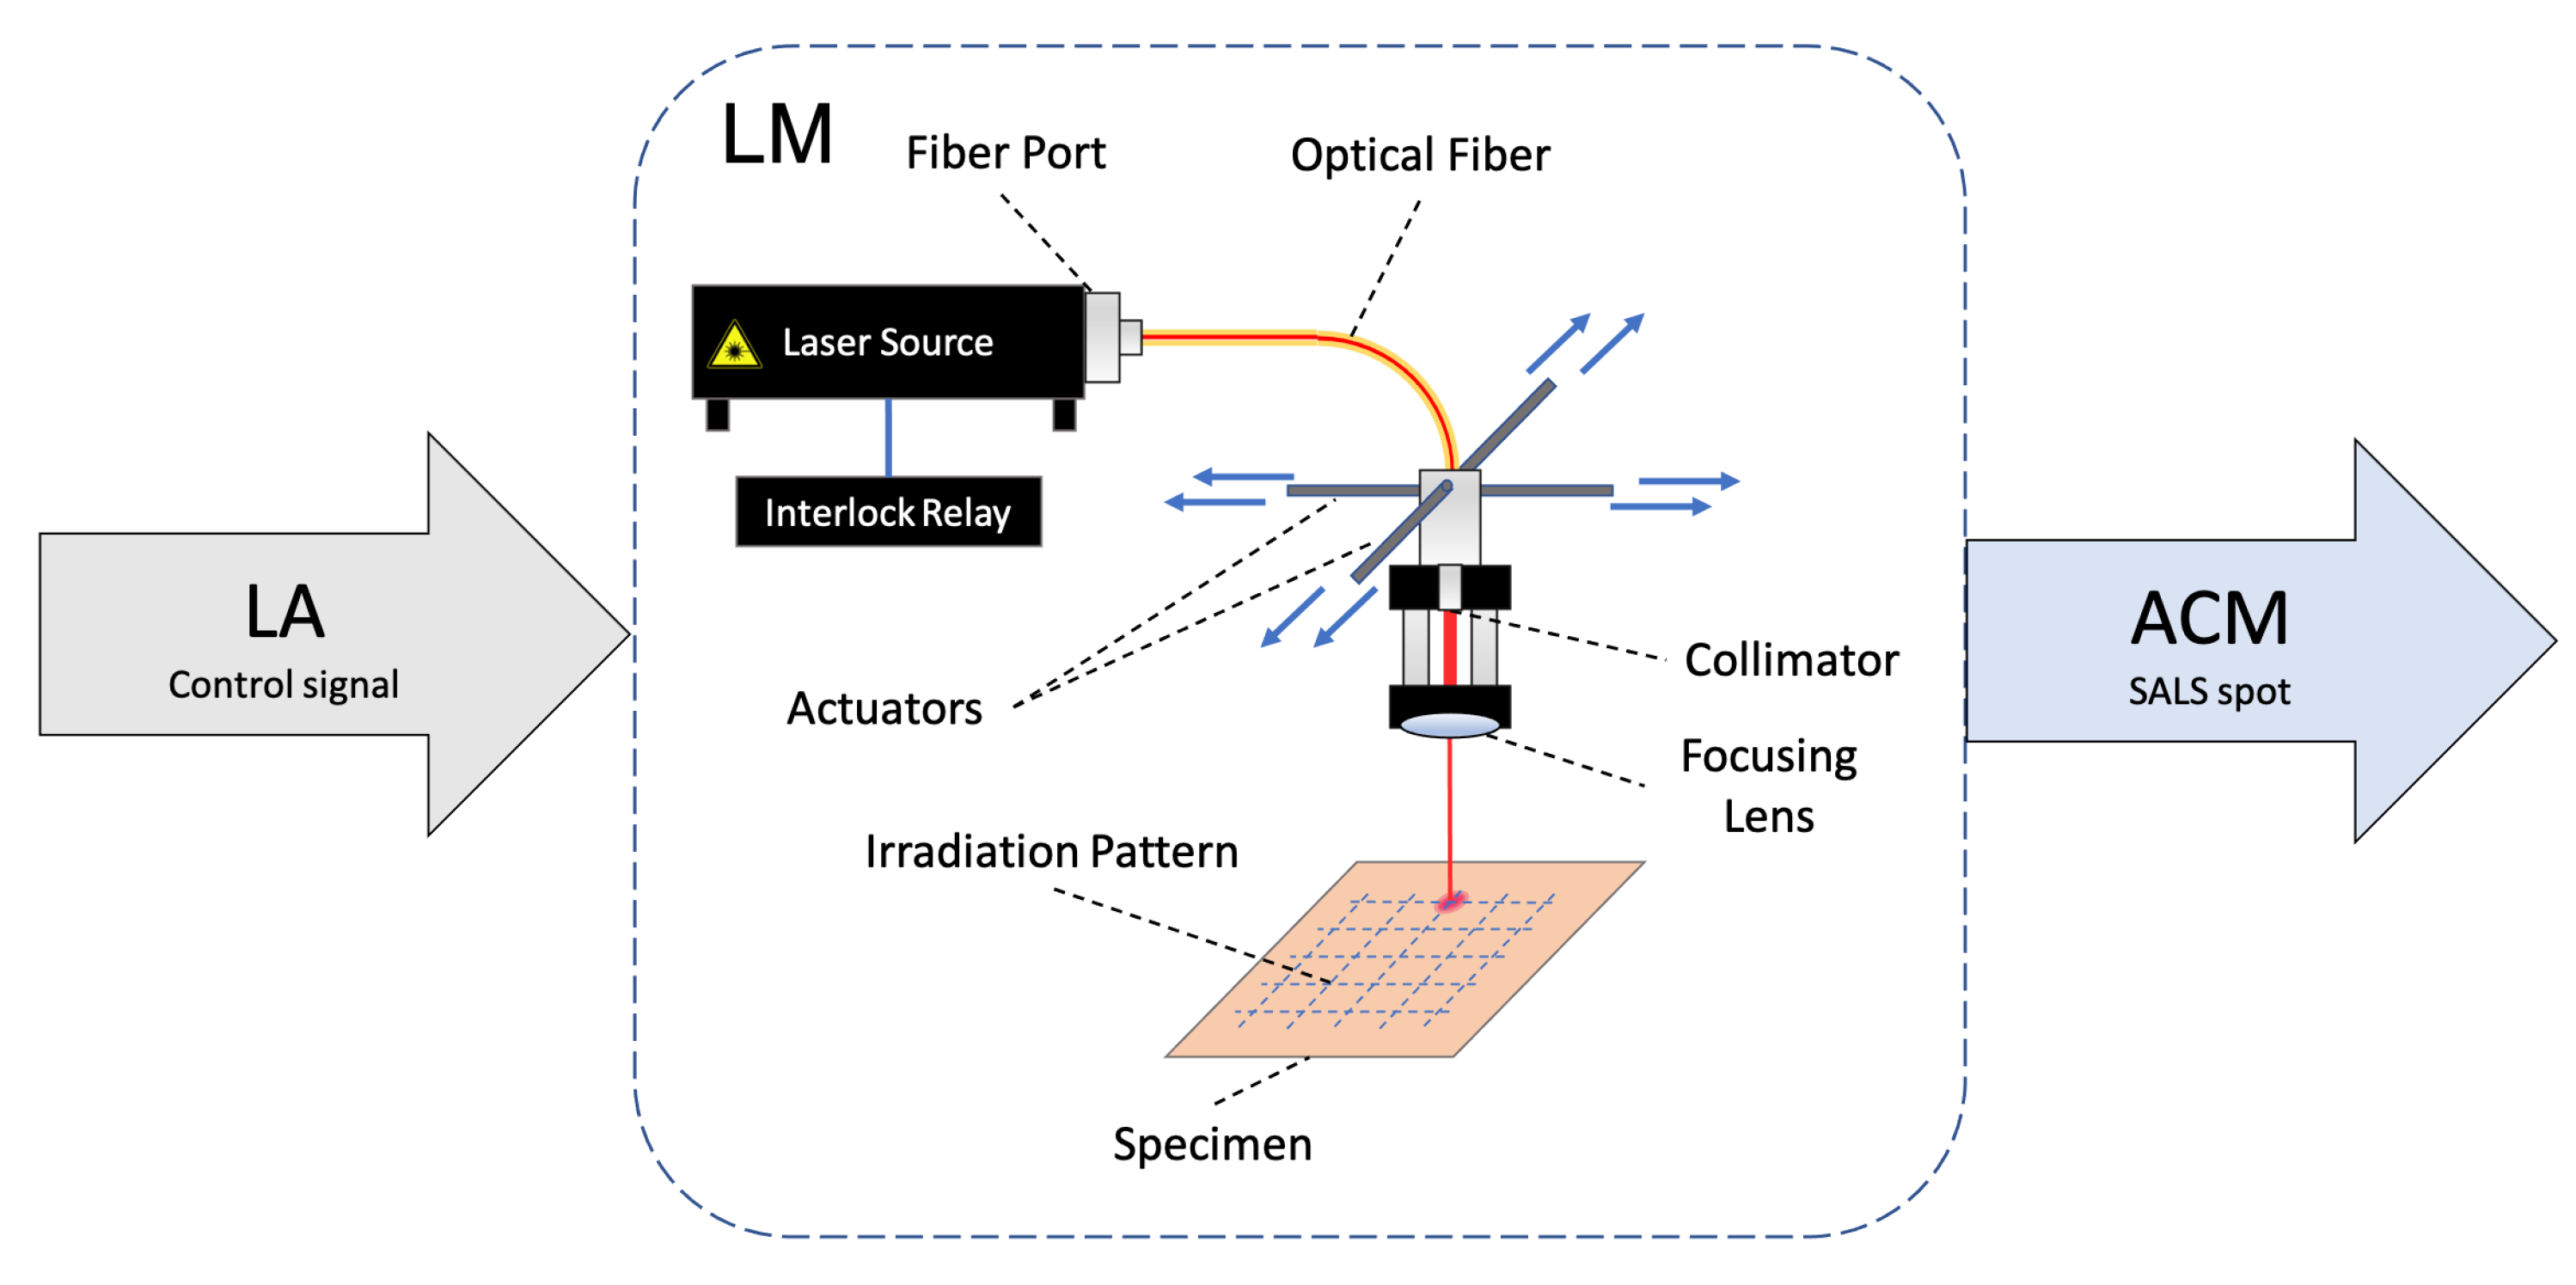
3.4. Laser Module
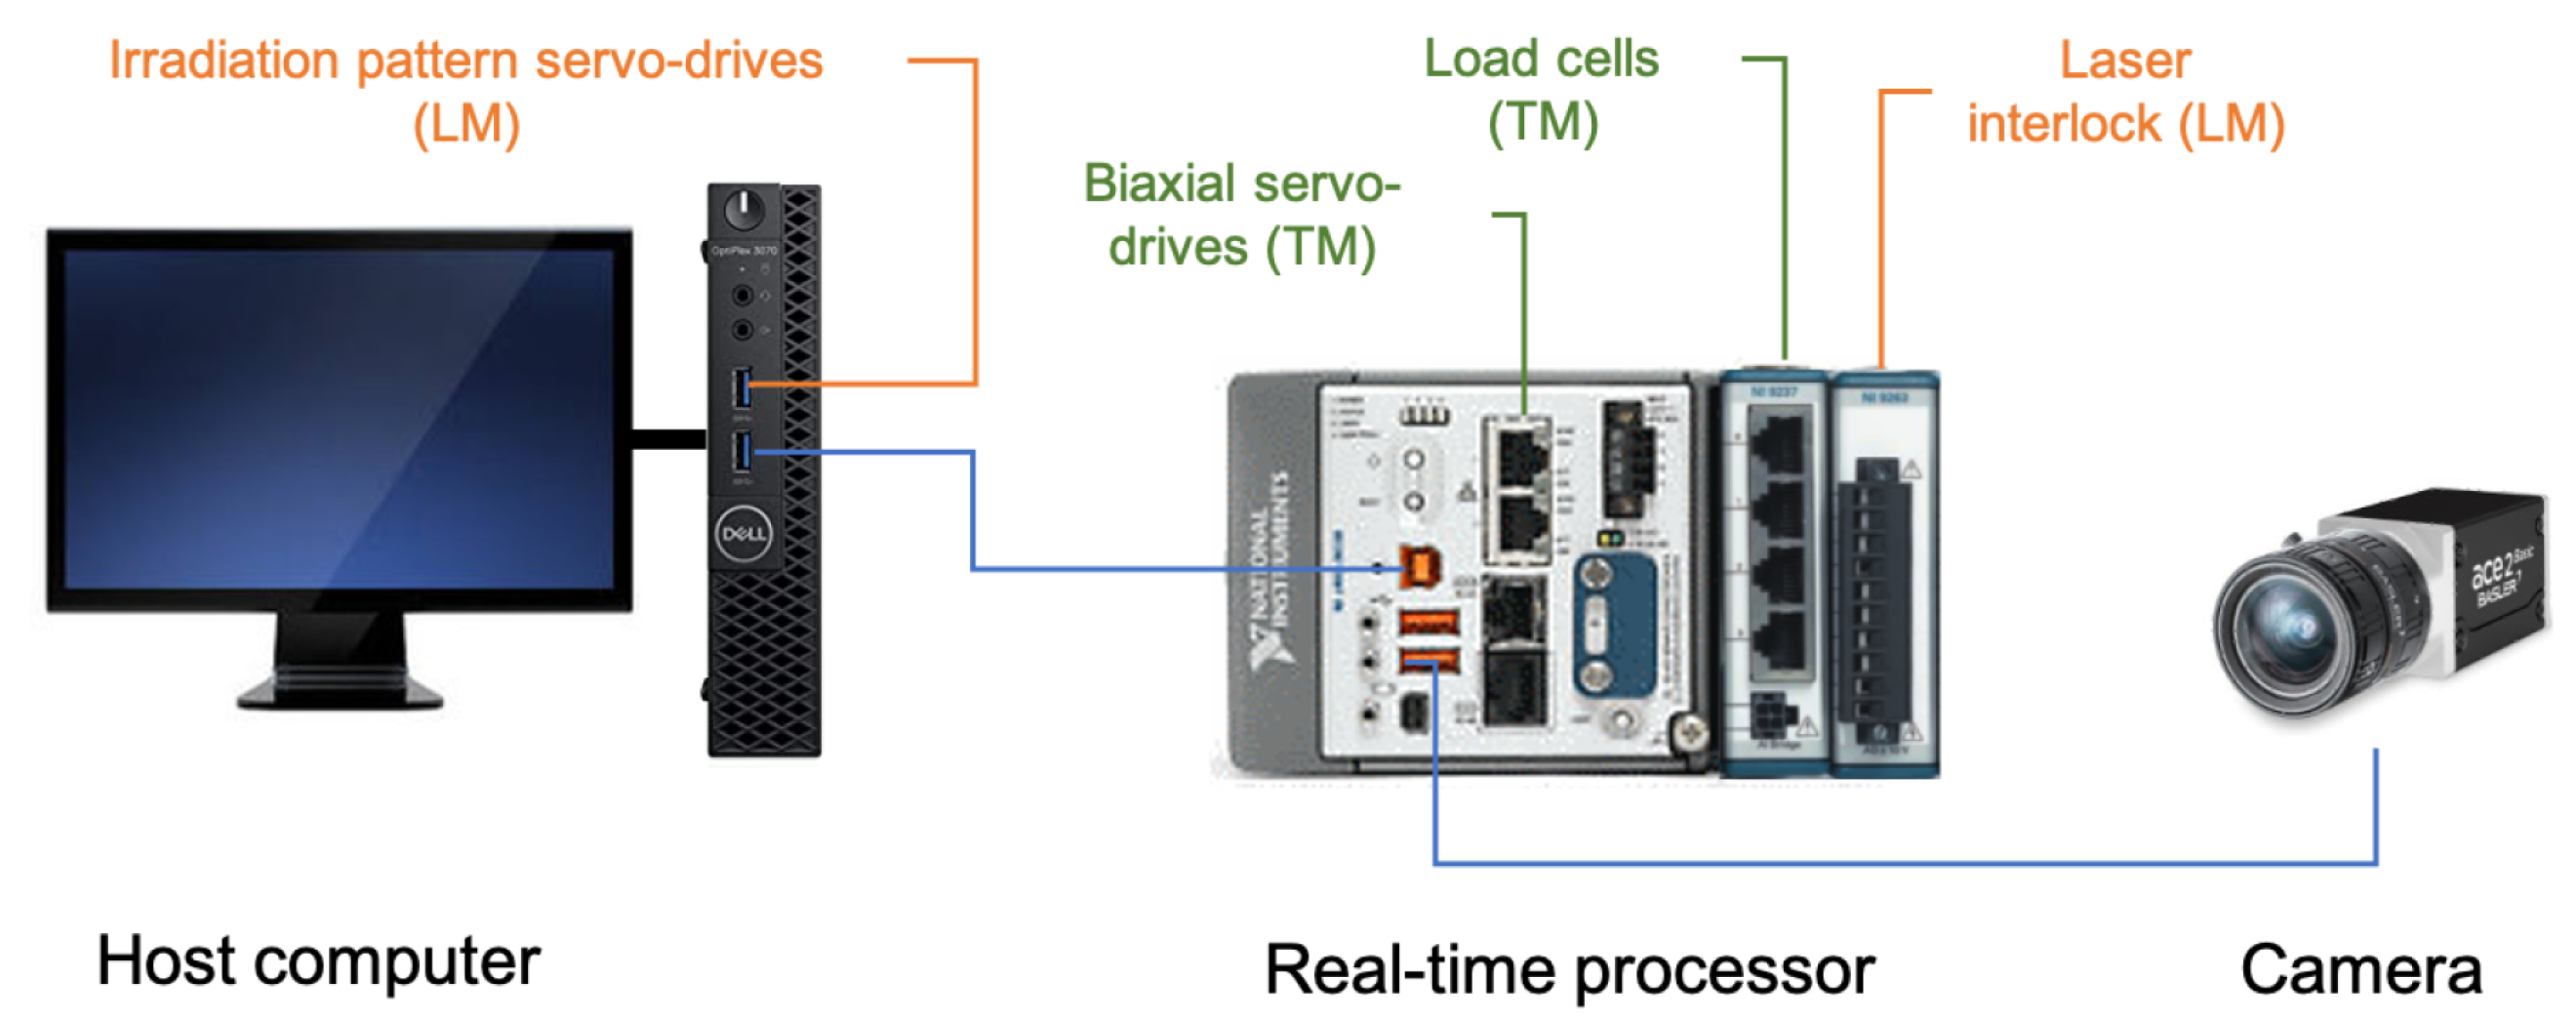
3.5. Acquisition/Control Module
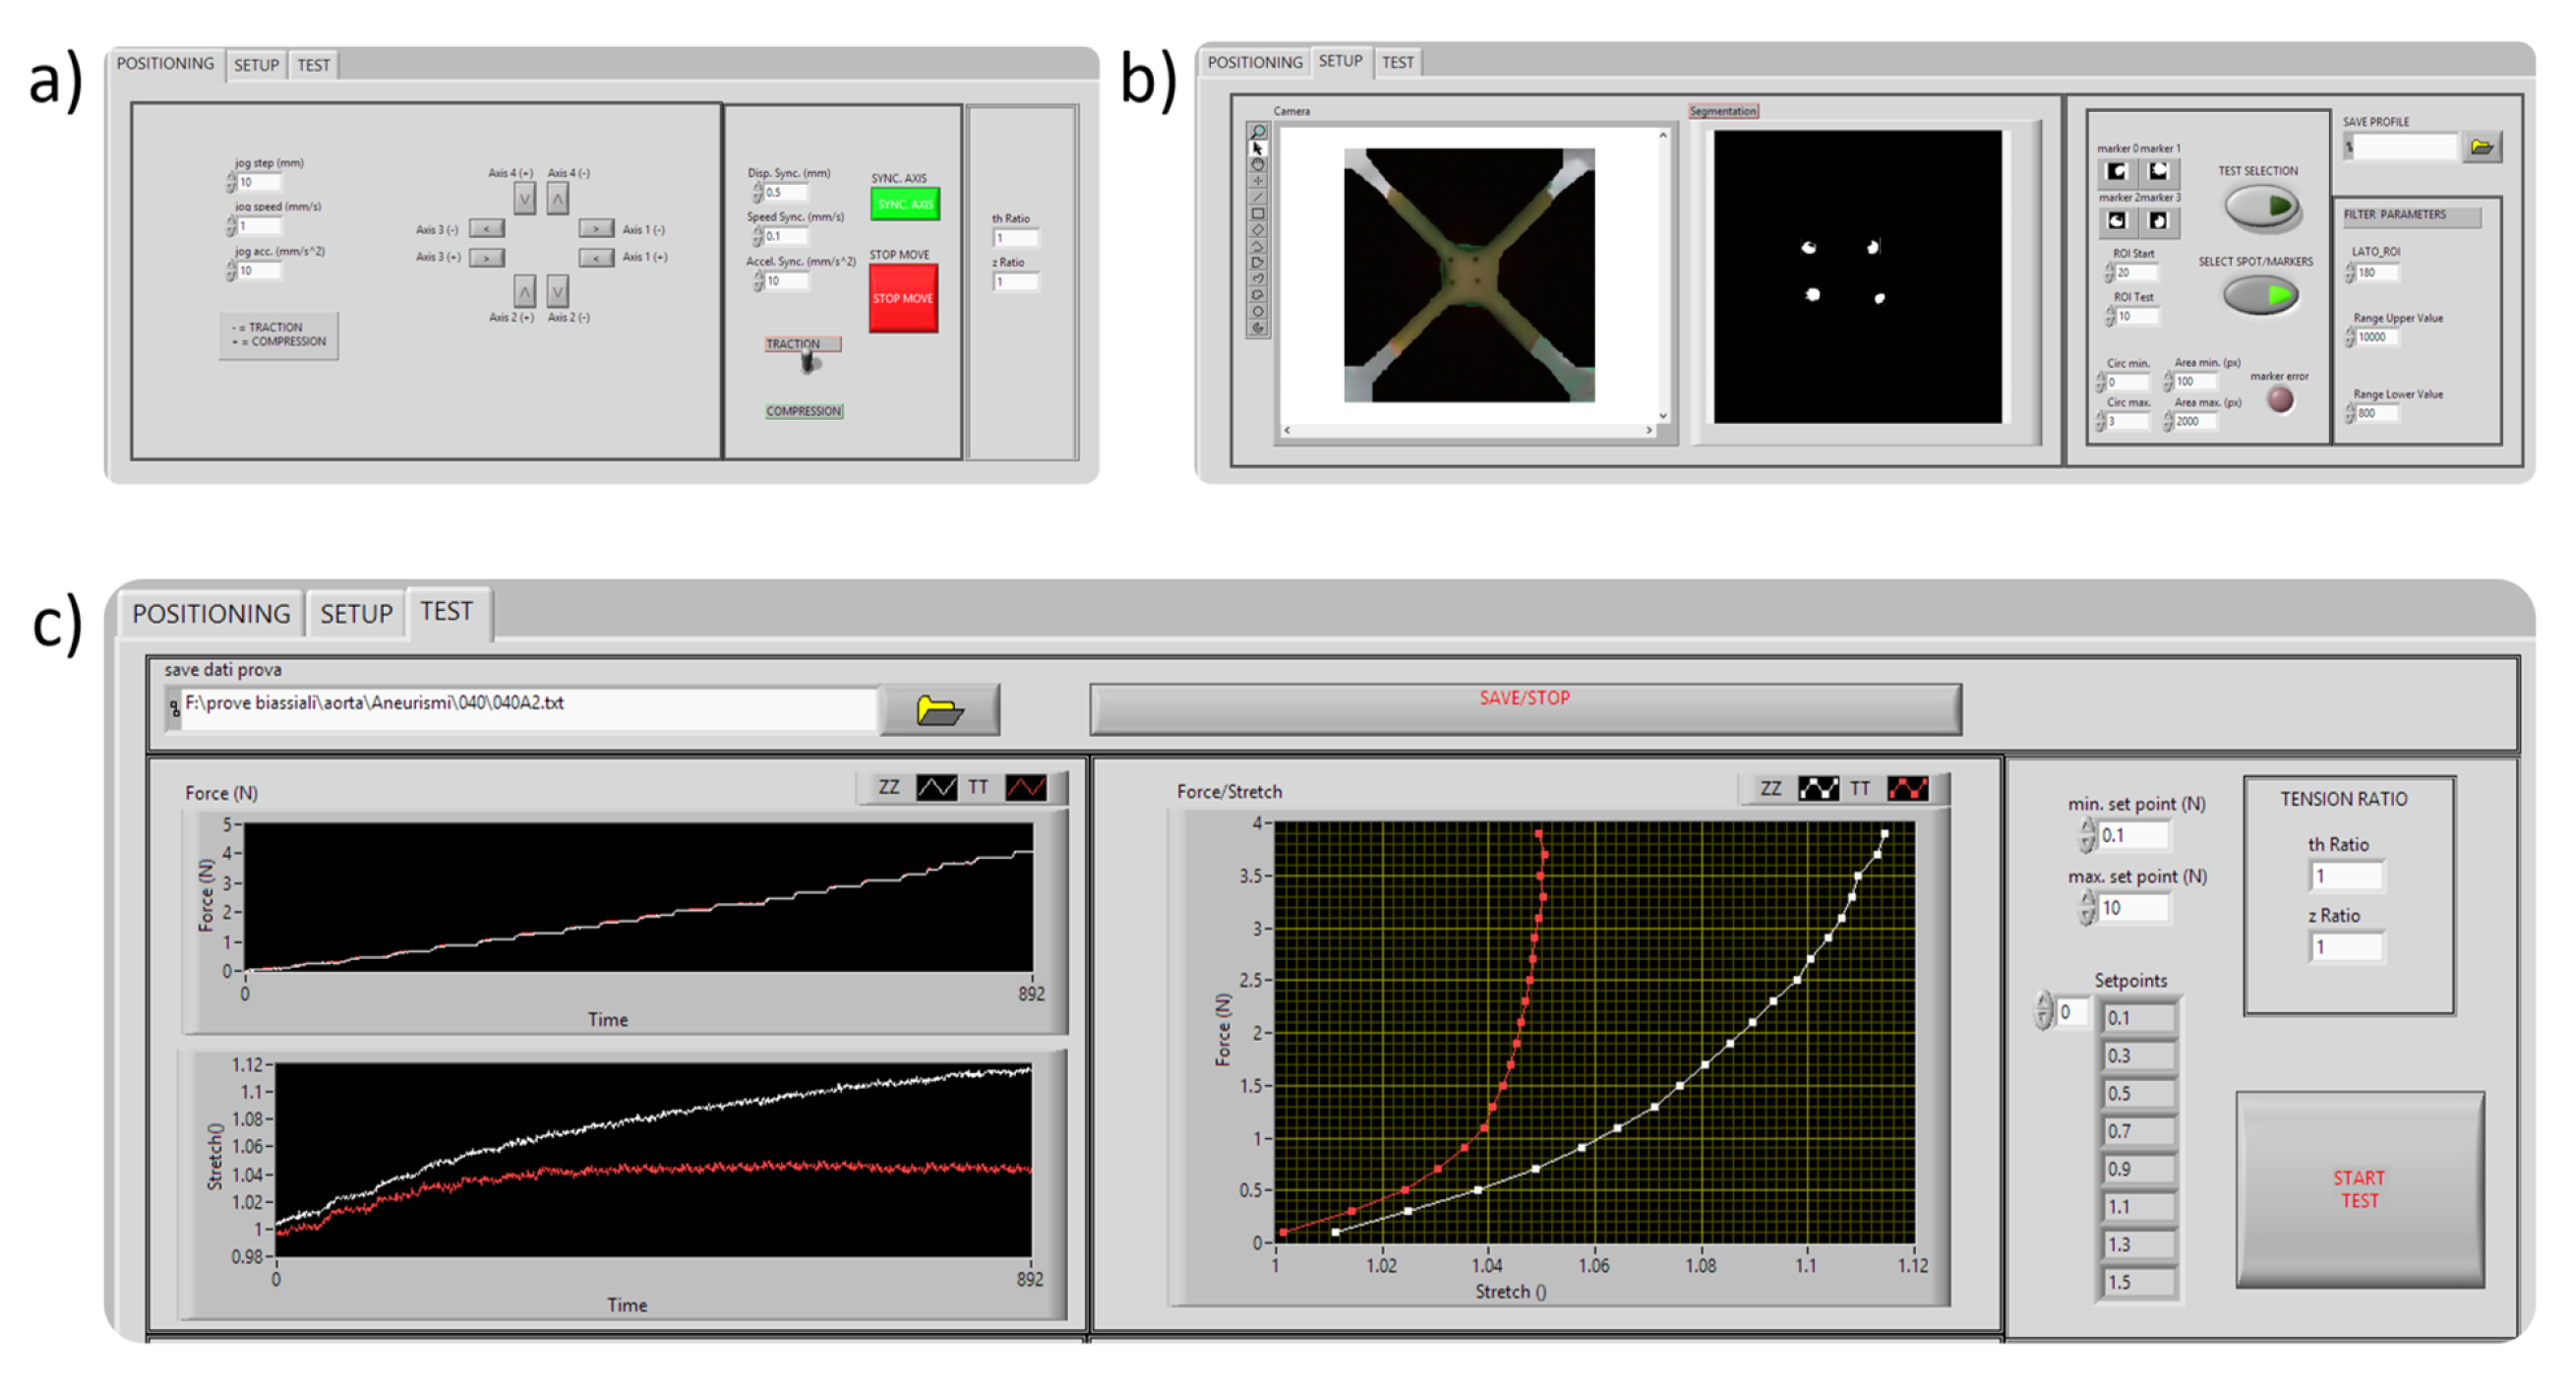
3.6. Tension Application
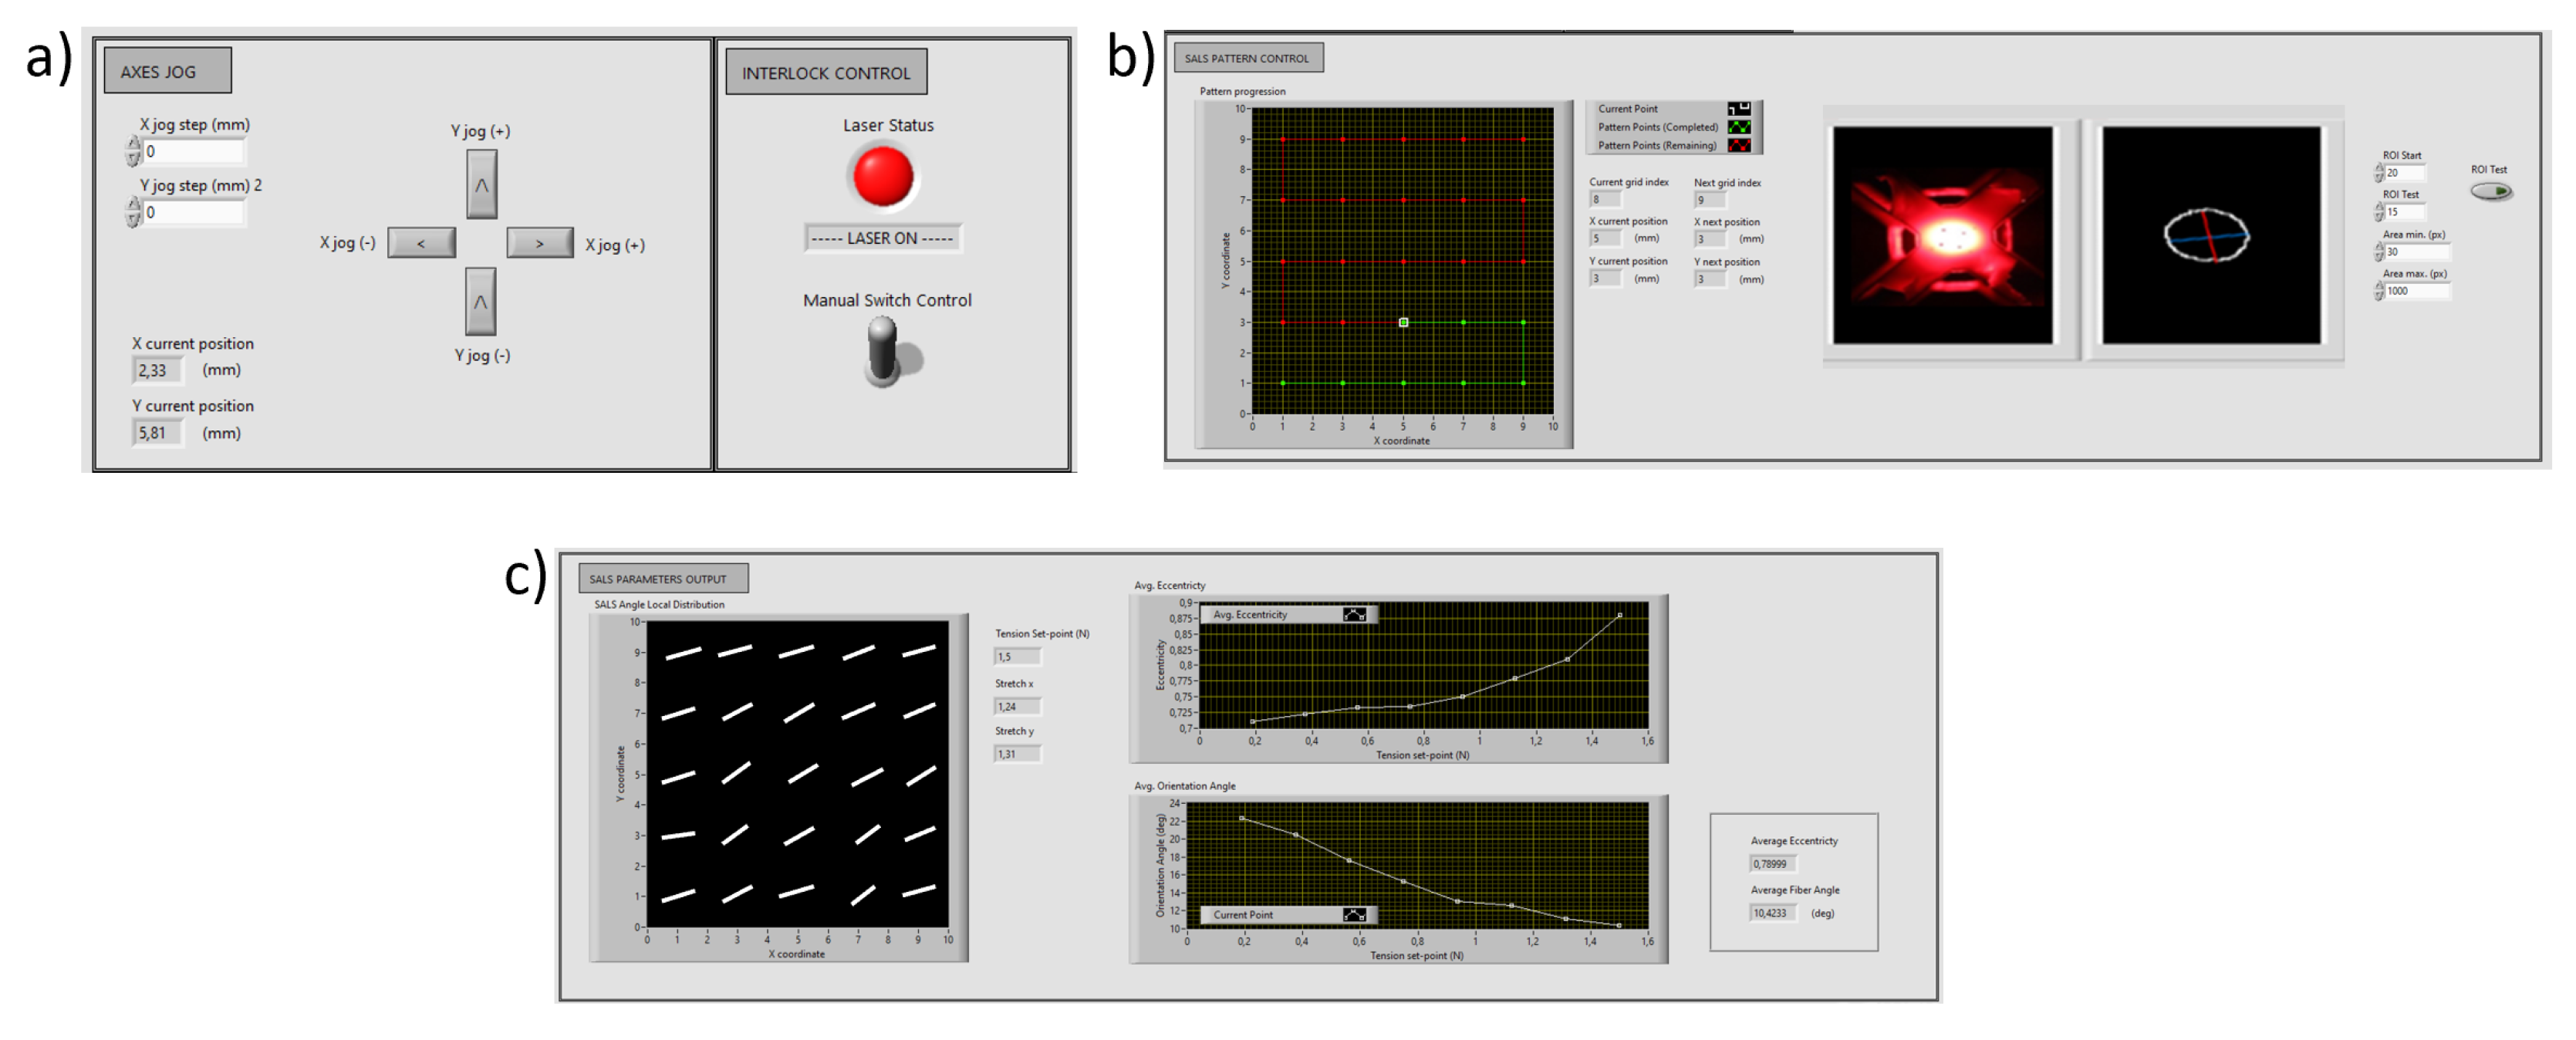
3.7. Laser Application
3.8. Test Case
4. Results
4.1. Realization
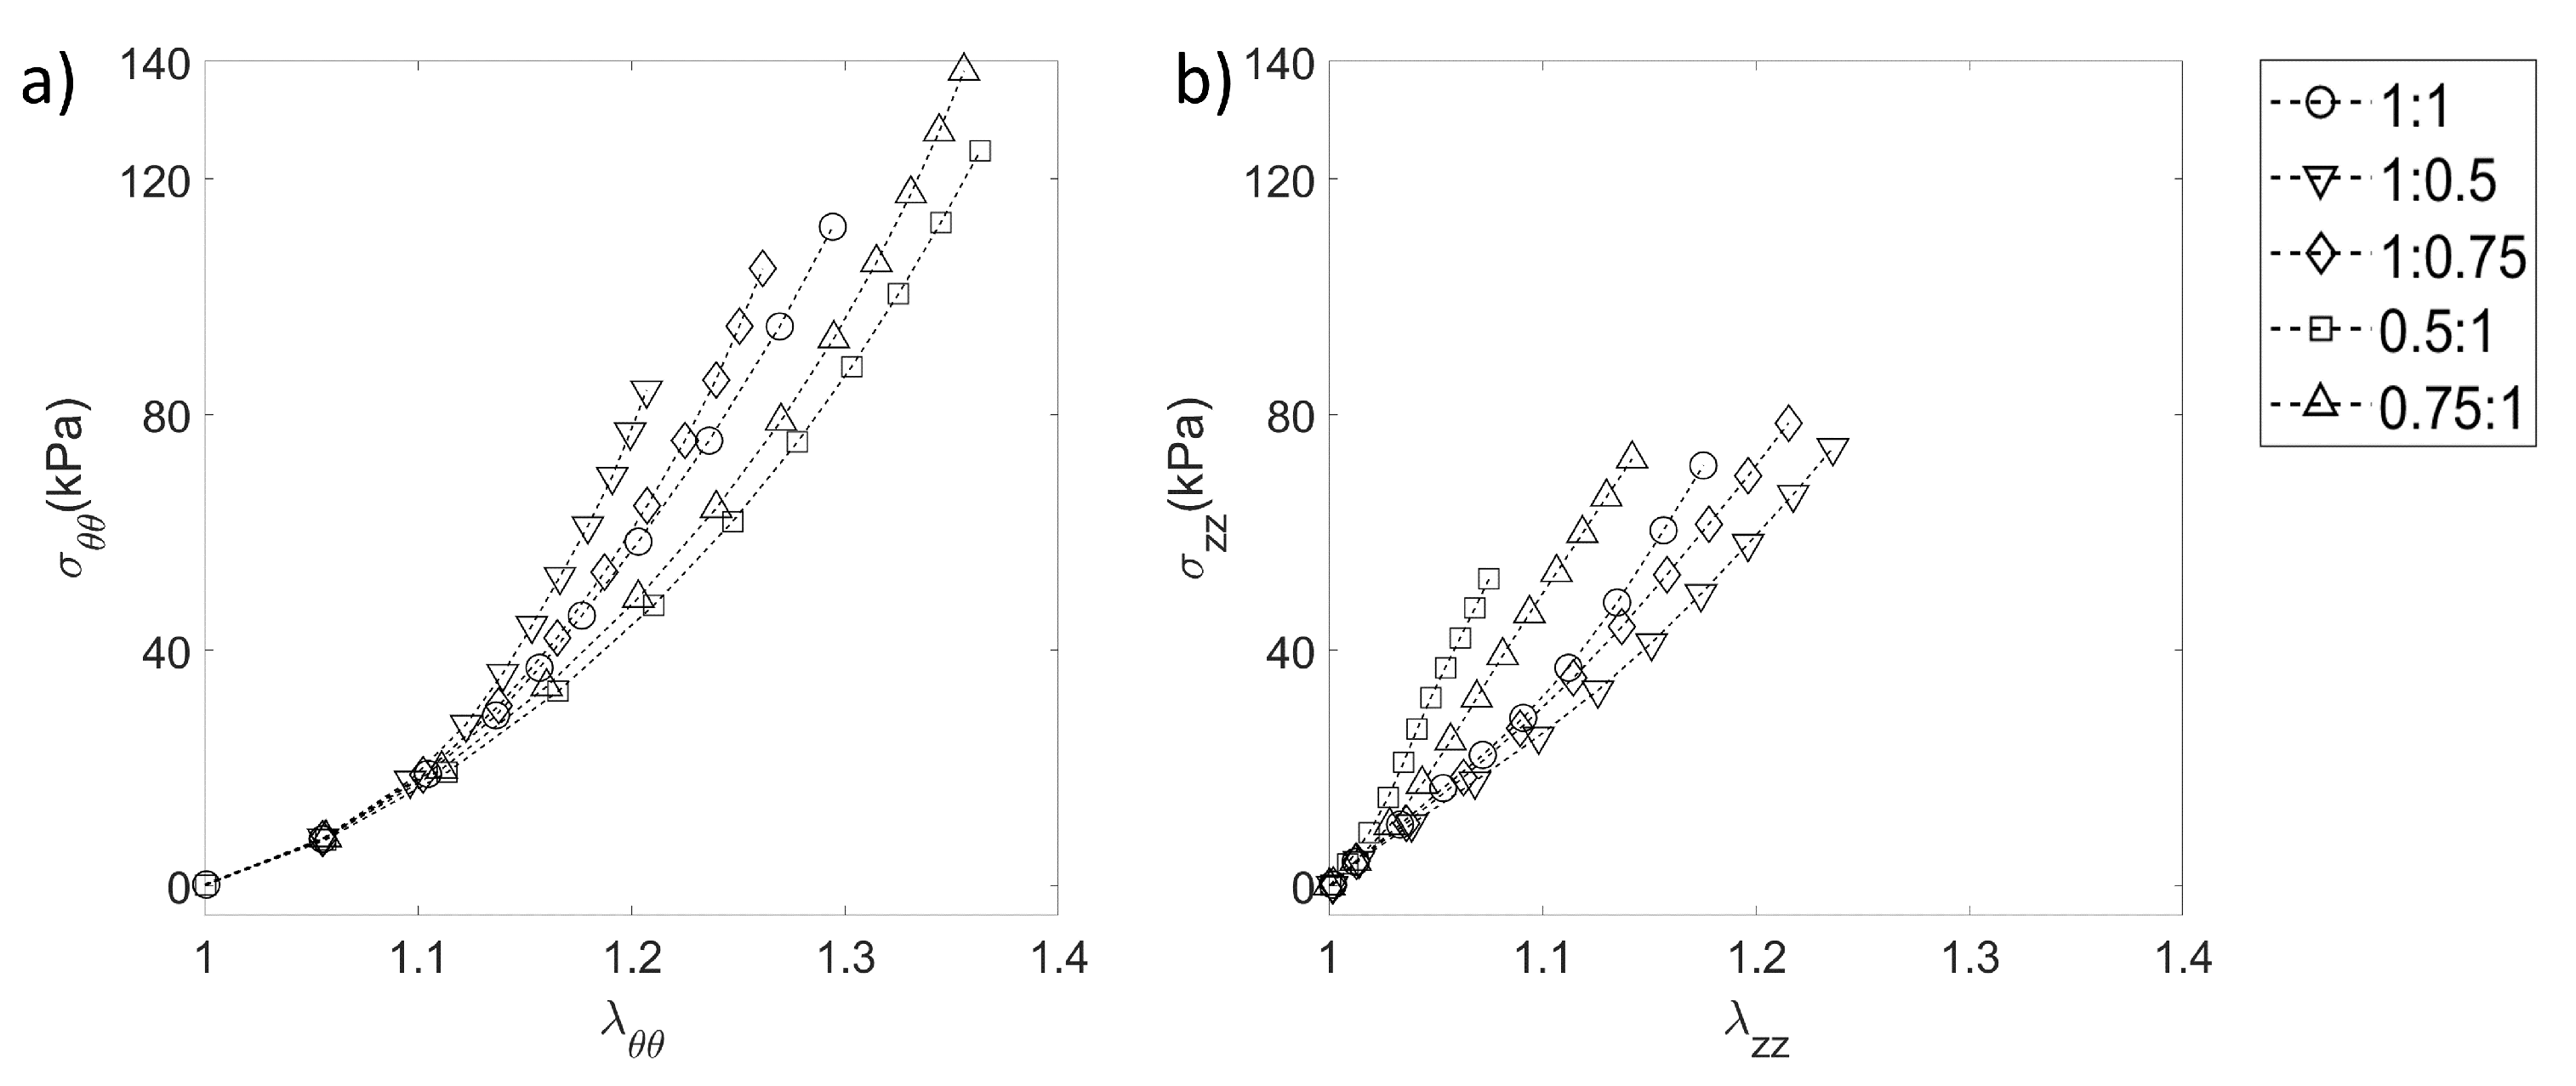
4.2. Test Case
5. Discussion
6. Conclusions
Author Contributions
Funding
Institutional Review Board Statement
Informed Consent Statement
Data Availability Statement
Conflicts of Interest
Abbreviations
| SALS | Small Angle Light Scattering |
| TM | Tensile Module |
| LM | Laser Module |
| ACM | Acquisition/Control module |
| GUI | Graphical User Interface |
| TA | Tension Application |
| LA | Laser Application |
References
- Lammers, S.R.; Kao, P.H.; Qi, H.J.; Hunter, K.; Lanning, C.; Albietz, J.; Hofmeister, S.; Mecham, R.; Stenmark, K.R.; Shandas, R. Changes in the structure-function relationship of elastin and its impact on the proximal pulmonary arterial mechanics of hypertensive calves. Am. J. Physiol. Heart Circ. Physiol. 2008, 295, H1451–H1459. [Google Scholar] [CrossRef] [PubMed] [Green Version]
- Gasser, T.C.; Gallinetti, S.; Xing, X.; Forsell, C.; Swedenborg, J.; Roy, J. Spatial orientation of collagen fibers in the abdominal aortic aneurysm’s wall and its relation to wall mechanics. Acta Biomater. 2012, 8, 3091–3103. [Google Scholar] [CrossRef] [PubMed]
- Hudson, L.T.; Jett, S.V.; Kramer, K.E.; Laurence, D.W.; Ross, C.J.; Towner, R.A.; Baumwart, R.; Lim, K.M.; Mir, A.; Burkhart, H.M.; et al. A Pilot Study on Linking Tissue Mechanics with Load-Dependent Collagen Microstructures in Porcine Tricuspid Valve Leaflets. Bioengineering 2020, 7, 60. [Google Scholar] [CrossRef] [PubMed]
- Fang, F.; Lake, S.P. Experimental evaluation of multiscale tendon mechanics. J. Orthop. Res. 2017, 35, 1353–1365. [Google Scholar] [CrossRef] [PubMed] [Green Version]
- Iliopoulos, D.C.; Kritharis, E.P.; Giagini, A.T.; Papadodima, S.A.; Sokolis, D.P. Ascending thoracic aortic aneurysms are associated with compositional remodeling and vessel stiffening but not weakening in age-matched subjects. J. Thorac. Cardiovasc. Surg. 2009, 137, 101–109. [Google Scholar] [CrossRef] [Green Version]
- Wilson, J.S.; Bersi, M.R.; Li, G.; Humphrey, J.D. Correlation of wall microstructure and heterogeneous distributions of strain in evolving murine abdominal aortic aneurysms. Cardiovasc. Eng. Technol. 2017, 8, 193–204. [Google Scholar] [CrossRef]
- Chen, H.; Kassab, G.S. Microstructure-based biomechanics of coronary arteries in health and disease. J. Biomech. 2016, 49, 2548–2559. [Google Scholar] [CrossRef] [PubMed] [Green Version]
- Davis, F.M.; Luo, Y.; Avril, S.; Duprey, A.; Lu, J. Local mechanical properties of human ascending thoracic aneurysms. J. Mech. Behav. Biomed. Mater. 2016, 61, 235–249. [Google Scholar] [CrossRef] [PubMed] [Green Version]
- Gasparotti, E.; Vignali, E.; Losi, P.; Scatto, M.; Fanni, B.; Soldani, G.; Landini, L.; Positano, V.; Celi, S. A 3D printed melt-compounded antibiotic loaded thermoplastic polyurethane heart valve ring design: An integrated framework of experimental material tests and numerical simulations. Int. J. Polym. Mater. Polym. Biomater. 2019, 68, 1–10. [Google Scholar] [CrossRef]
- Ferrara, A.; Morganti, S.; Totaro, P.; Mazzola, A.; Auricchio, F. Human dilated ascending aorta: Mechanical characterization via uniaxial tensile tests. J. Mech. Behav. Biomed. Mater. 2016, 53, 257–271. [Google Scholar] [CrossRef] [PubMed]
- Karimi, A.; Navidbakhsh, M.; Shojaei, A.; Faghihi, S. Measurement of the uniaxial mechanical properties of healthy and atherosclerotic human coronary arteries. Mater. Sci. Eng. C 2013, 33, 2550–2554. [Google Scholar] [CrossRef] [PubMed]
- Celi, S.; Losi, P.; Berti, S. Investigation on regional variation of intraluminal thrombus: A mechanical and histological study. Bioinspired Biomim. Nanobiomater. 2012, 1, 183–194. [Google Scholar] [CrossRef]
- Duprey, A.; Trabelsi, O.; Vola, M.; Favre, J.; Avril, S. Biaxial rupture properties of ascending thoracic aortic aneurysms. Acta Biomater. 2016, 42, 273–285. [Google Scholar] [CrossRef] [PubMed] [Green Version]
- Amini Khoiy, K.; Amini, R. On the biaxial mechanical response of porcine tricuspid valve leaflets. J. Biomech. Eng. 2016, 138. [Google Scholar] [CrossRef] [PubMed]
- Vignali, E.; di Bartolo, F.; Gasparotti, E.; Malacarne, A.; Concistré, G.; Chiaramonti, F.; Murzi, M.; Positano, V.; Landini, L.; Celi, S. Correlation between micro and macrostructural biaxial behavior of ascending thoracic aneurysm: A novel experimental technique. Med. Eng. Phys. 2020, 86, 78–85. [Google Scholar] [CrossRef] [PubMed]
- Vande Geest, J.P.; Sacks, M.S.; Vorp, D.A. Age-related differences in the biaxial biomechanical behavior of human abdominal aorta. In Proceedings of the ASME International Mechanical Engineering Congress and Exposition, New Orleans, LA, USA, 17–22 November 2002; Volume 36509, pp. 115–116. [Google Scholar]
- Holzapfel, G.A.; Niestrawska, J.A.; Ogden, R.W.; Reinisch, A.J.; Schriefl, A.J. Modelling non-symmetric collagen fibre dispersion in arterial walls. J. R. Soc. Interface R. Soc. 2015, 12, 20150188. [Google Scholar] [CrossRef] [Green Version]
- Di Achille, P.; Celi, S.; Di Puccio, F.; Forte, P. Anisotropic AAA: Computational comparison between four and two fiber family material models. J. Biomech. 2011, 44, 2418–2426. [Google Scholar] [CrossRef] [PubMed]
- Di Puccio, F.; Celi, S.; Forte, P. Review of Experimental Investigations on Compressibility of Arteries and Introduction of a New Apparatus. Exp. Mech. 2012, 52, 895–902. [Google Scholar] [CrossRef]
- Wang, B.; Liu, J.; Li, W.; Zhou, Z. Modeling the initial-volume dependent approximate compressibility of porcine liver tissues using a novel volumetric strain energy model. J. Biomech. 2020, 109. [Google Scholar] [CrossRef]
- Ghazanfari, S.; Driessen-Mol, A.; Strijkers, G.; Kanters, F.; Baaijens, F.; Bouten, C. A comparative analysis of the collagen architecture in the carotid artery: Second harmonic generation versus diffusion tensor imaging. Biochem. Biophys. Res. Commun. 2012, 426, 54–58. [Google Scholar] [CrossRef] [PubMed]
- Schmid, F.; Sommer, G.; Rappolt, M.; Schulze-Bauer, C.; Regitnig, P.; Holzapfel, G.A.; Laggner, P.; Amenitsch, H. In situ tensile testing of human aortas by time-resolved small-angle X-ray scattering. J. Synchrotron Radiat. 2005, 12, 727–733. [Google Scholar] [CrossRef] [PubMed] [Green Version]
- Giannini, C.; Ladisa, M.; Lutz-Bueno, V.; Terzi, A.; Ramella, M.; Fusaro, L.; Altamura, D.; Siliqi, D.; Sibillano, T.; Diaz, A.; et al. X-ray scanning microscopies of microcalcifications in abdominal aortic and popliteal artery aneurysms. IUCrJ 2019, 6, 267–276. [Google Scholar] [CrossRef] [PubMed] [Green Version]
- Belghasem, M.E.; A’amar, O.; Roth, D.; Walker, J.; Arinze, N.; Richards, S.M.; Francis, J.M.; Salant, D.J.; Chitalia, V.C.; Bigio, I.J. Towards minimally-invasive, quantitative assessment of chronic kidney disease 7 using optical spectroscopy. Sci. Rep. 2019, 9, 7168. [Google Scholar] [CrossRef] [PubMed]
- Ávila, F.J.; Del Barco, O.; Bueno, J.M. Quantifying external and internal collagen organization from Stokes-vector-based second harmonic generation imaging polarimetry. J. Opt. 2017, 19, 105301. [Google Scholar] [CrossRef] [Green Version]
- Sacks, M.S.; Smith, D.B.; Hiester, E.D. A small angle light scattering device for planar connective tissue microstructural analysis. Ann. Biomed. Eng. 1997, 25, 678–689. [Google Scholar] [CrossRef] [PubMed]
- Sacks, M.S.; Gloeckner, D.C. Quantification of the fiber architecture and biaxial mechanical behavior of porcine intestinal submucosa. J. Biomed. Mater. Res. Off. J. Soc. Biomater. Jpn. Soc. Biomater. Aust. Soc. Biomater. 1999, 46, 1–10. [Google Scholar] [CrossRef]
- Di Bartolo, F.; Vignali, E.; Gasparotti, E.; Malacarne, A.; Landini, L.; Celi, S. Numerical simulations of light scattering in softanisotropic fibrous structures and validation of anovel optical setup from fibrous mediacharacterization. Electronics 2021. under review. [Google Scholar]
- Chen, Z.W.; Joli, P.; Feng, Z.Q. Anisotropic hyperelastic behavior of soft biological tissues. Comput. Methods Biomech. Biomed. Eng. 2015, 18, 1436–1444. [Google Scholar] [CrossRef] [PubMed]
- Murphy, J. Evolution of anisotropy in soft tissue. Proc. R. Soc. A Math. Phys. Eng. Sci. 2014, 470, 20130548. [Google Scholar] [CrossRef] [Green Version]
- Humphrey, J.; Vawter, D.; Vito, R. Quantification of strains in biaxially tested soft tissues. J. Biomech. 1987, 20, 59–65. [Google Scholar] [CrossRef]
- Ogden, R.W. Non-Linear Elastic Deformations; Courier Corporation: Chelmsford, MA, USA, 1997. [Google Scholar]
- Fung, Y.; Fronek, K.; Patitucci, P. Pseudoelasticity of arteries and the choice of its mathematical expression. Am. J. Physiol. Heart Circ. Physiol. 1979, 237, H620–H631. [Google Scholar] [CrossRef] [PubMed]
- Sacks, M.; Chuong, C. Biaxial mechanical properties of passive right ventricular free wall myocardium. J. Biomech. Eng. 1993, 115, 202–205. [Google Scholar] [CrossRef] [PubMed]
- Matsumoto, T.; Fukui, T.; Tanaka, T.; Ikuta, N.; Ohashi, T.; Kumagai, K.; Akimoto, H.; Tabayashi, K.; Sato, M. Biaxial tensile properties of thoracic aortic aneurysm tissues. J. Biomech. Sci. Eng. 2009, 4, 518–529. [Google Scholar] [CrossRef] [Green Version]
- Jhun, C.S.; Evans, M.C.; Barocas, V.H.; Tranquillo, R.T. Planar biaxial mechanical behavior of bioartificial tissues possessing prescribed fiber alignment. J. Biomech. Eng. 2009, 131, 081006. [Google Scholar] [CrossRef] [PubMed] [Green Version]
- Gaul, R.; Nolan, D.; Lally, C. Collagen fibre characterisation in arterial tissue under load using SALS. J. Mech. Behav. Biomed. Mater. 2017, 75, 359–368. [Google Scholar] [CrossRef] [PubMed]
- Fanni, B.; Sauvage, E.; Celi, S.; Norman, W.; Vignali, E.; Landini, L.; Schievano, S.; Positano, V.; Capelli, C. A Proof of Concept of a Non-Invasive Image-Based Material Characterization Method for Enhanced Patient-Specific Computational Modeling. Cardiovasc. Eng. Technol. 2020, 11, 532–543. [Google Scholar] [CrossRef] [PubMed]
- Lima, R.G.; Martins, P.A.; Ramião, N.; Jorge, R.M. Methodology for mechanical characterization of soft biological tissues: Arteries. Procedia Eng. 2015, 110, 74–81. [Google Scholar]
- Robitaille, M.C.; Zareian, R.; DiMarzio, C.A.; Wan, K.T.; Ruberti, J.W. Small-angle light scattering to detect strain-directed collagen degradation in native tissue. Interface Focus 2011, 1, 767–776. [Google Scholar] [CrossRef] [PubMed] [Green Version]
- Whelan, A.; Williams, E.; Nolan, D.R.; Murphy, B.; Gunning, P.S.; O’Reilly, D.; Lally, C. Bovine Pericardium of High Fibre Dispersion Has High Fatigue Life and Increased Collagen Content; Potentially an Untapped Source of Heart Valve Leaflet Tissue. Ann. Biomed. Eng. 2020, 1–11. [Google Scholar] [CrossRef]
- Shiwarski, D.J.; Tashman, J.W.; Eaton, A.F.; Apodaca, G.; Feinberg, A.W. 3D printed biaxial stretcher compatible with live fluorescence microscopy. HardwareX 2020, 7, e00095. [Google Scholar] [CrossRef]
- Vignali, E.; Gasparotti, E.; Capellini, K.; Fanni, B.M.; Landini, L.; Positano, V.; Celi, S. Modeling biomechanical interaction between soft tissue and soft robotic instruments: Importance of constitutive anisotropic hyperelastic formulations. Int. J. Robot. Res. 2020. [Google Scholar] [CrossRef]
- Deplano, V.; Boufi, M.; Boiron, O.; Guivier-Curien, C.; Alimi, Y.; Bertrand, E. Biaxial tensile tests of the porcine ascending aorta. J. Biomech. 2016, 49, 2031–2037. [Google Scholar] [CrossRef] [PubMed]
- Geest, J.P.V.; Sacks, M.S.; Vorp, D.A. A planar biaxial constitutive relation for the luminal layer of intra-luminal thrombus in abdominal aortic aneurysms. J. Biomech. 2006, 39, 2347–2354. [Google Scholar] [CrossRef] [PubMed]
- Fehervary, H.; Smoljkić, M.; Vander Sloten, J.; Famaey, N. Planar biaxial testing of soft biological tissue using rakes: A critical analysis of protocol and fitting process. J. Mech. Behav. Biomed. Mater. 2016, 61, 135–151. [Google Scholar] [CrossRef] [PubMed]
- Jiang, M.; Lawson, Z.T.; Erel, V.; Pervere, S.; Nan, T.; Robbins, A.B.; Feed, A.D.; Moreno, M.R. Clamping soft biologic tissues for uniaxial tensile testing: A brief survey of current methods and development of a novel clamping mechanism. J. Mech. Behav. Biomed. Mater. 2020, 103, 103503. [Google Scholar] [CrossRef] [PubMed]
- Losi, P.; Mancuso, L.; Al Kayal, T.; Celi, S.; Briganti, E.; Gualerzi, A.; Volpi, S.; Cao, G.; Soldani, G. Development of a gelatin-based polyurethane vascular graft by spray, phase-inversion technology. Biomed. Mater. 2015, 10. [Google Scholar] [CrossRef] [PubMed]
- Cavallo, A.; Gasparotti, E.; Losi, P.; Foffa, I.; Al Kayal, T.; Vignali, E.; Celi, S.; Soldani, G. Fabrication and in-vitro characterization of a Polymeric Aortic Valve for Minimally Invasive Valve Replacement. J. Mech. Behav. Biomed. Mater. 2020, 115, 104294. [Google Scholar] [CrossRef] [PubMed]
- Viceconti, M.; Pappalardo, F.; Rodriguez, B.; Horner, M.; Bischoff, J.; Musuamba Tshinanu, F. In silico trials: Verification, validation and uncertainty quantification of predictive models used in the regulatory evaluation of biomedical products. Methods 2020. [Google Scholar] [CrossRef]
- Boccadifuoco, A.; Mariotti, A.; Celi, S.; Martini, N.; Salvetti, M.V. Uncertainty quantification in numerical simulations of the flow in thoracic aortic aneurysms. In Proceedings of the VII European Congress on Computational Methods in Applied Sciences and Engineering, Crete Island, Greece, 5–10 June 2016; Volume 3, pp. 6226–6249. [Google Scholar] [CrossRef] [Green Version]
- Boccadifuoco, A.; Mariotti, A.; Capellini, K.; Celi, S.; Salvetti, M. Validation of Numerical Simulations of Thoracic Aorta Hemodynamics: Comparison with In Vivo Measurements and Stochastic Sensitivity Analysis. Cardiovasc. Eng. Technol. 2018, 9, 688–706. [Google Scholar] [CrossRef] [PubMed]
- Eekhoff, A.; Bonakdar, N.; Alonso, J.L.; Hoffmann, B.; Goldmann, W.H. Glomerular podocytes: A study of mechanical properties and mechano-chemical signaling. Biochem. Biophys. Res. Commun. 2011, 406, 229–233. [Google Scholar] [CrossRef] [PubMed]
- Qiang, Y.; Liu, J.; Yang, F.; Dieujuste, D.; Du, E. Modeling erythrocyte electrodeformation in response to amplitude modulated electric waveforms. Sci. Rep. 2018, 8, 10224. [Google Scholar] [CrossRef] [PubMed] [Green Version]


| Specifics | OptiMech2 System | Biaxial Commercial System |
|---|---|---|
| Maximum displacement | 100 mm | 110 mm |
| Maximum load | 50 N | ±5 N |
| Force accuracy measurement | 0.2% | 0.5% |
| Specimen gripping approach | Clamps with tunable pressure | Clamps |
| Displacement recording approach | Optical markers | Optical markers |
Publisher’s Note: MDPI stays neutral with regard to jurisdictional claims in published maps and institutional affiliations. |
© 2021 by the authors. Licensee MDPI, Basel, Switzerland. This article is an open access article distributed under the terms and conditions of the Creative Commons Attribution (CC BY) license (http://creativecommons.org/licenses/by/4.0/).
Share and Cite
Vignali, E.; Gasparotti, E.; Landini, L.; Celi, S. Development and Realization of an Experimental Bench Test for Synchronized Small Angle Light Scattering and Biaxial Traction Analysis of Tissues. Electronics 2021, 10, 386. https://doi.org/10.3390/electronics10040386
Vignali E, Gasparotti E, Landini L, Celi S. Development and Realization of an Experimental Bench Test for Synchronized Small Angle Light Scattering and Biaxial Traction Analysis of Tissues. Electronics. 2021; 10(4):386. https://doi.org/10.3390/electronics10040386
Chicago/Turabian StyleVignali, Emanuele, Emanuele Gasparotti, Luigi Landini, and Simona Celi. 2021. "Development and Realization of an Experimental Bench Test for Synchronized Small Angle Light Scattering and Biaxial Traction Analysis of Tissues" Electronics 10, no. 4: 386. https://doi.org/10.3390/electronics10040386