
Provision of Data to Use in Artificial Intelligence Algorithms for Single Room Heating


Abstract
:1. Introduction
2. Related Work
3. Experimental Environment
- Modeling of four basic simulation scenarios containing rooms, their usage and location
- Parameter optimization of controller models according to the room models
- Evaluation of the controller’s suitability
- Increasing the amount of data by parameter variation
- Parameter optimization of controller models for the increased amount of data
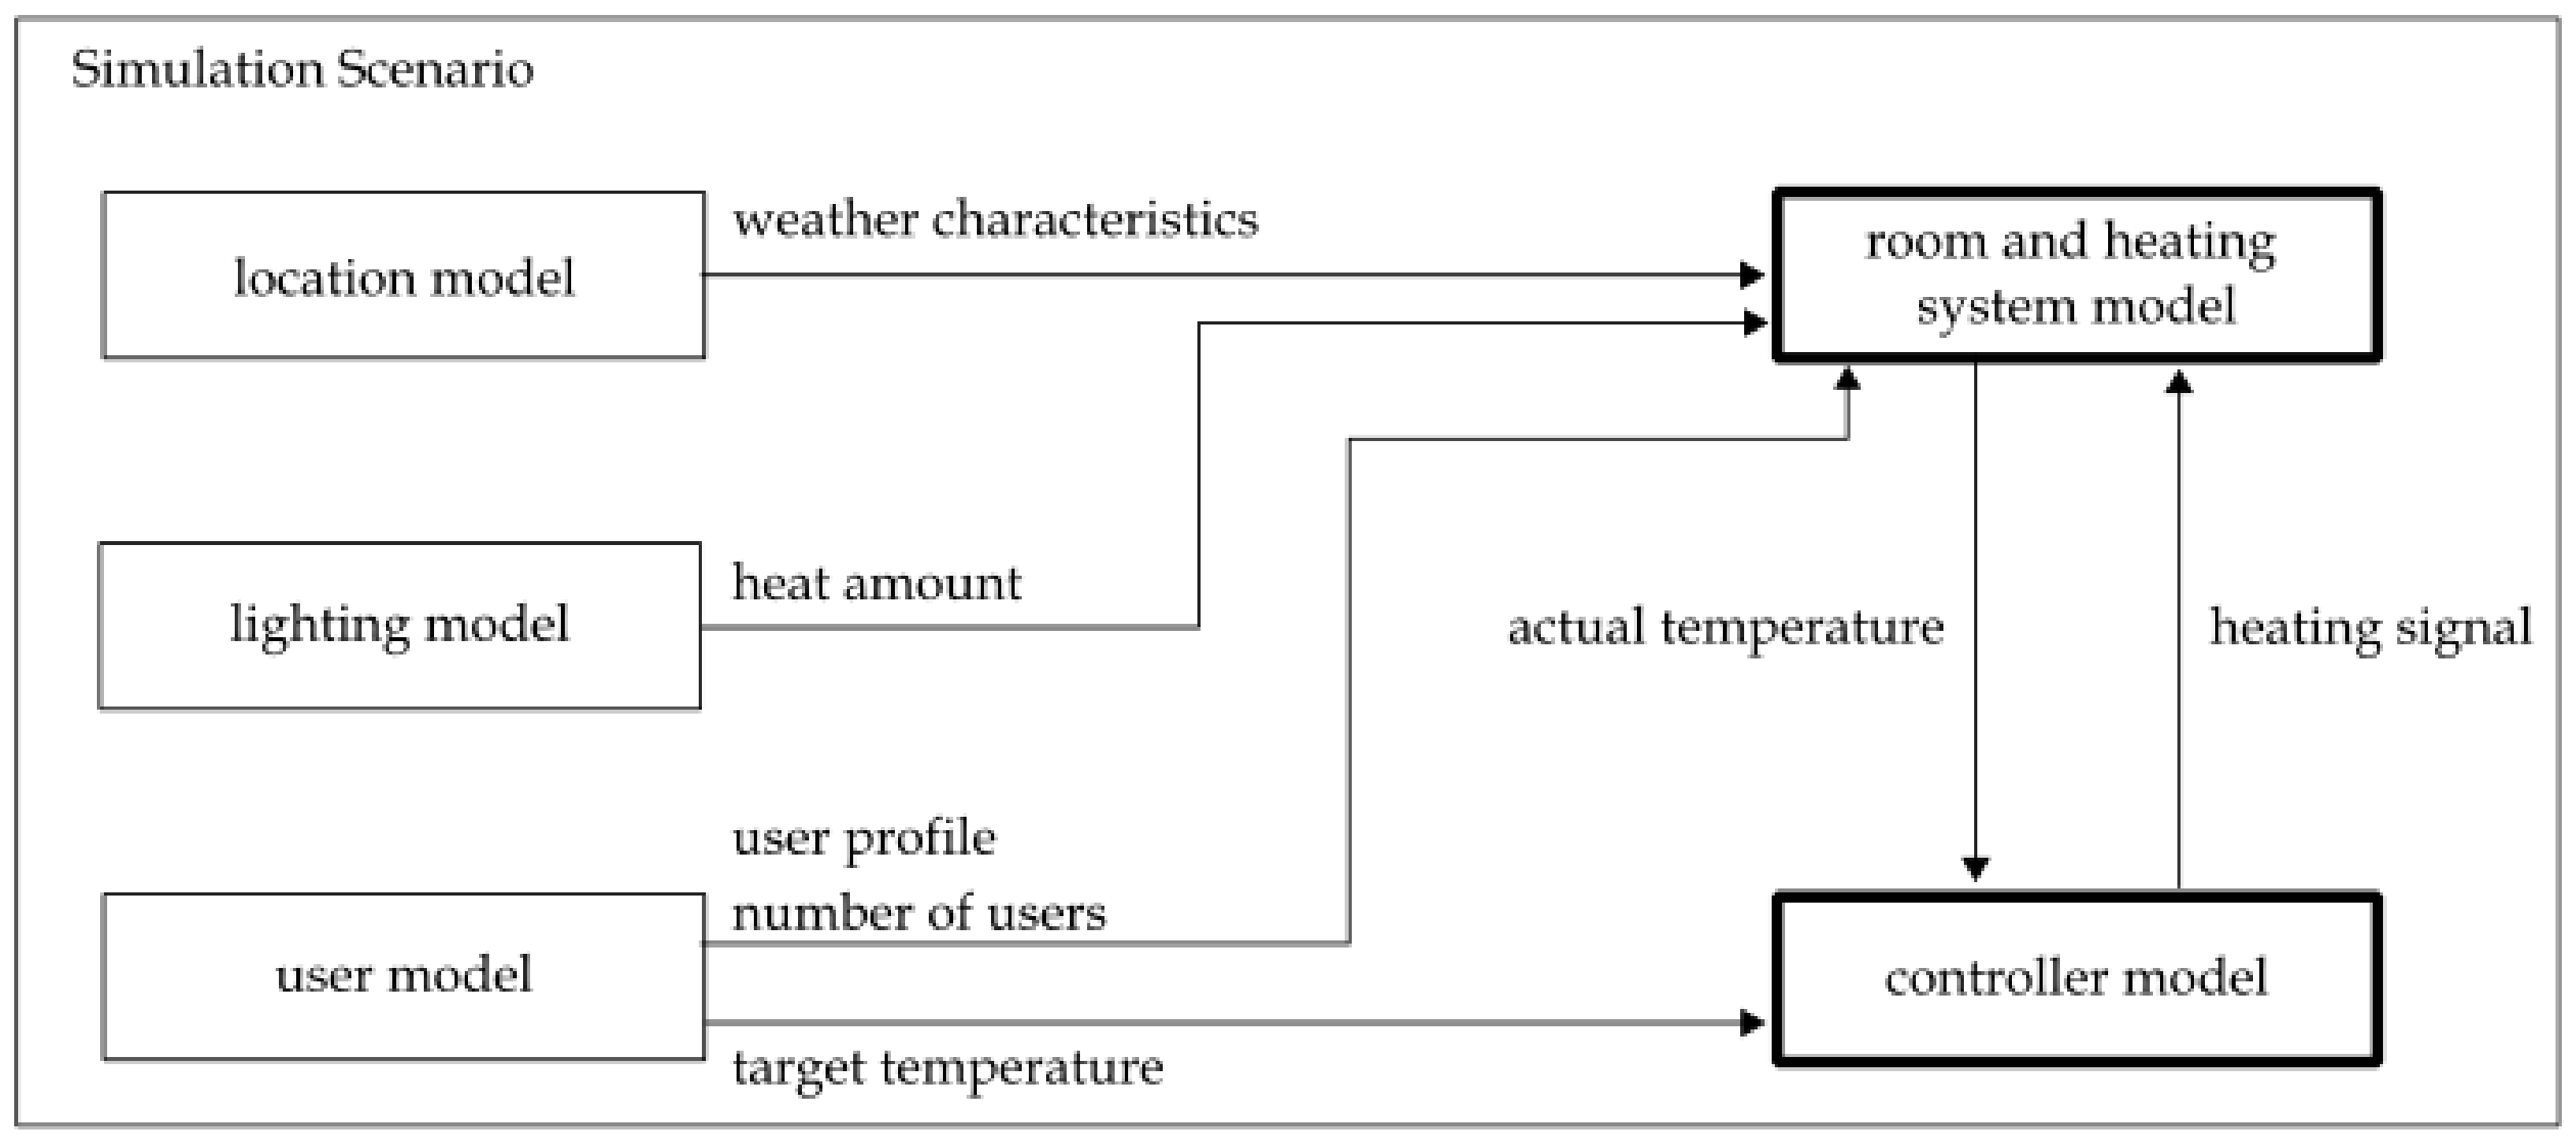
3.1. Simulation Scenarios
- Room and heating system model
- Location model
- User model
- Lighting model
- Controller model
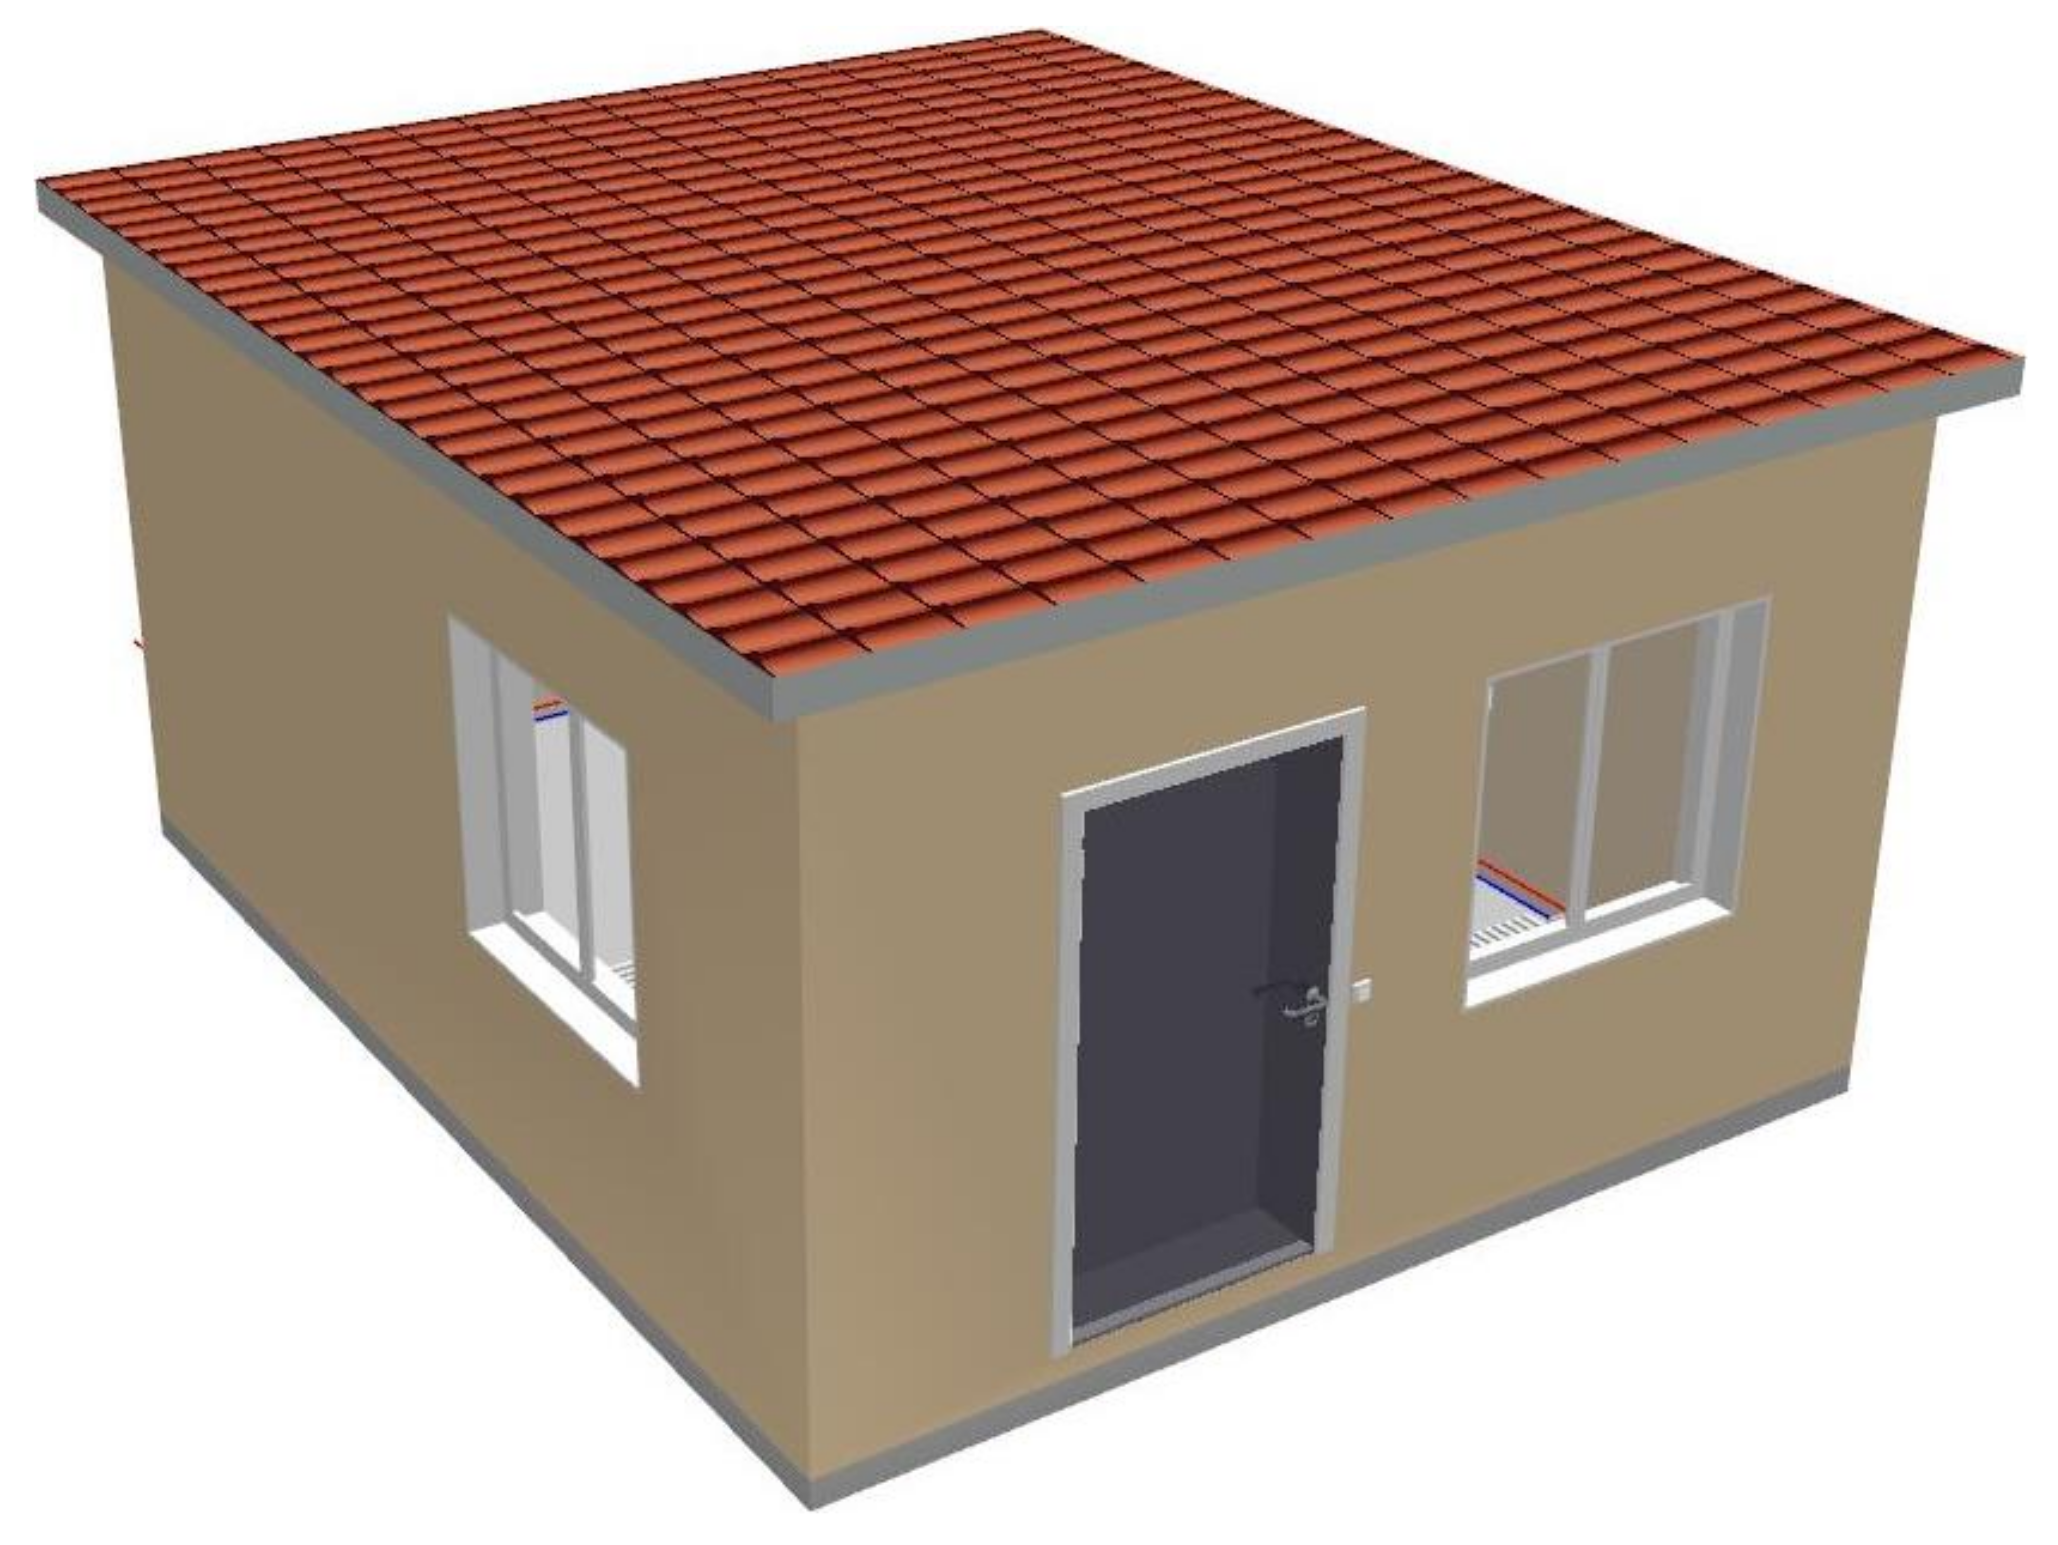
3.1.1. Room and Heating Models
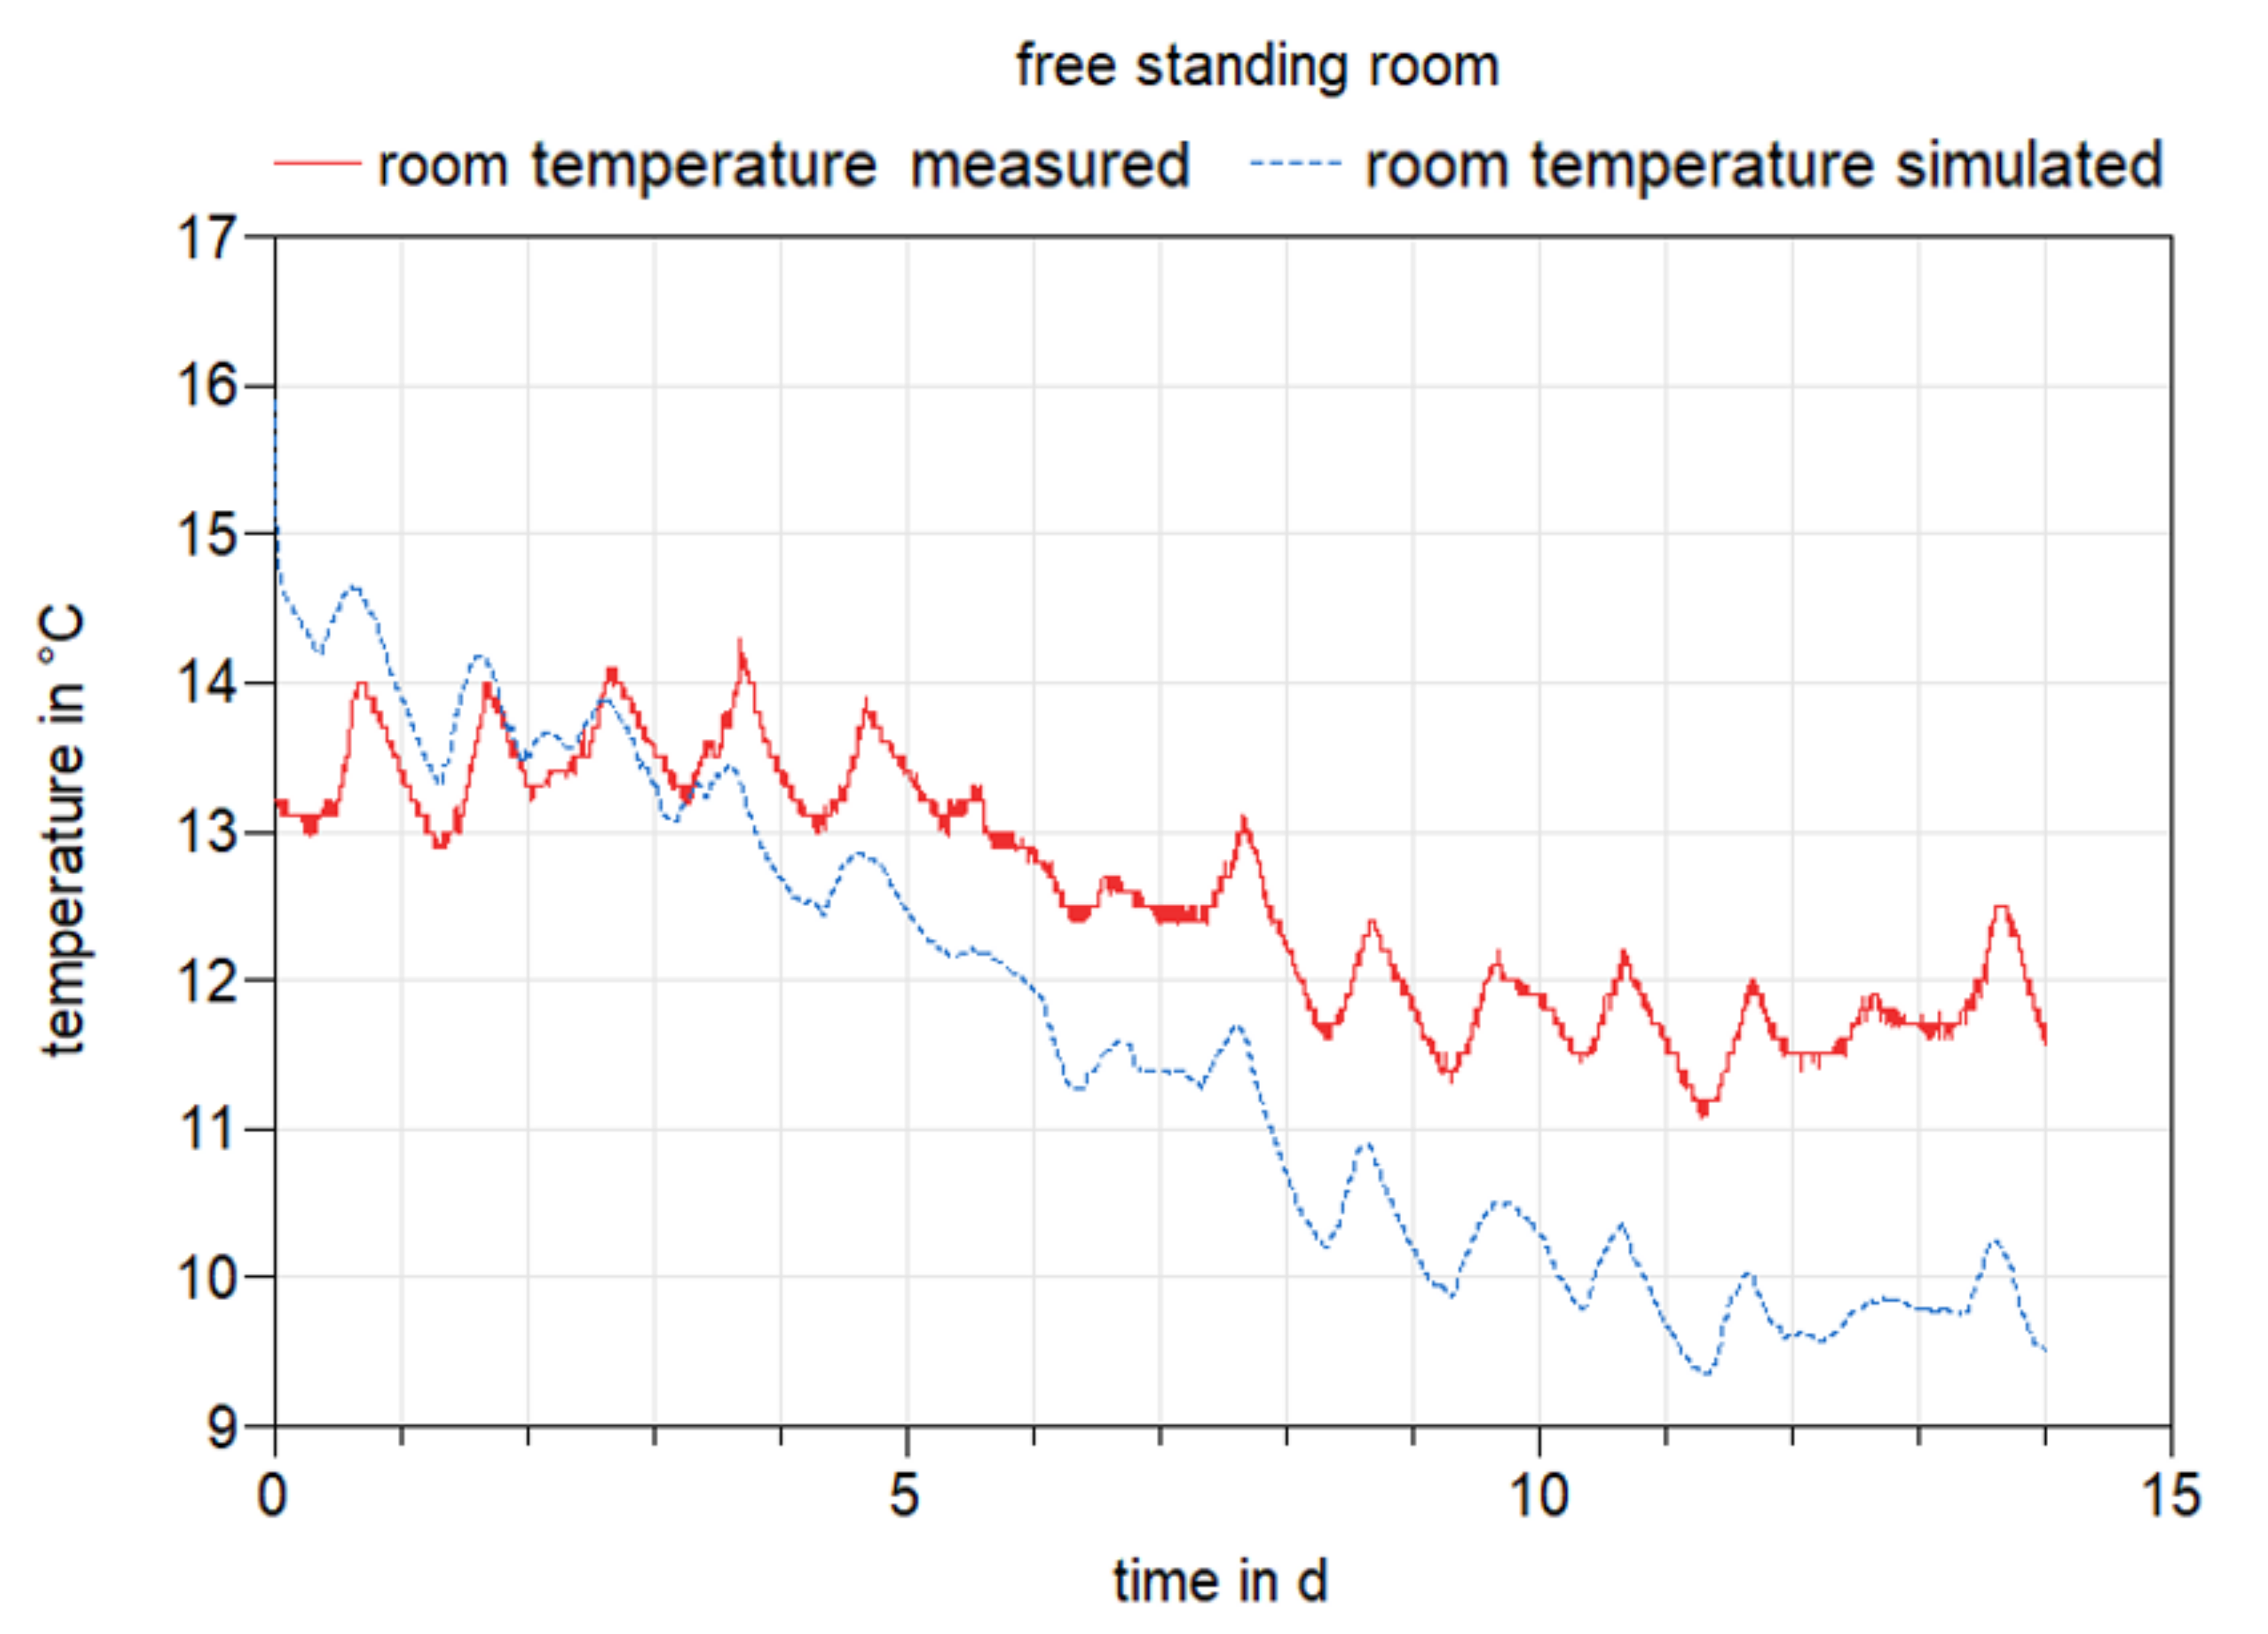
- a single room that is freestanding with a radiator heating system
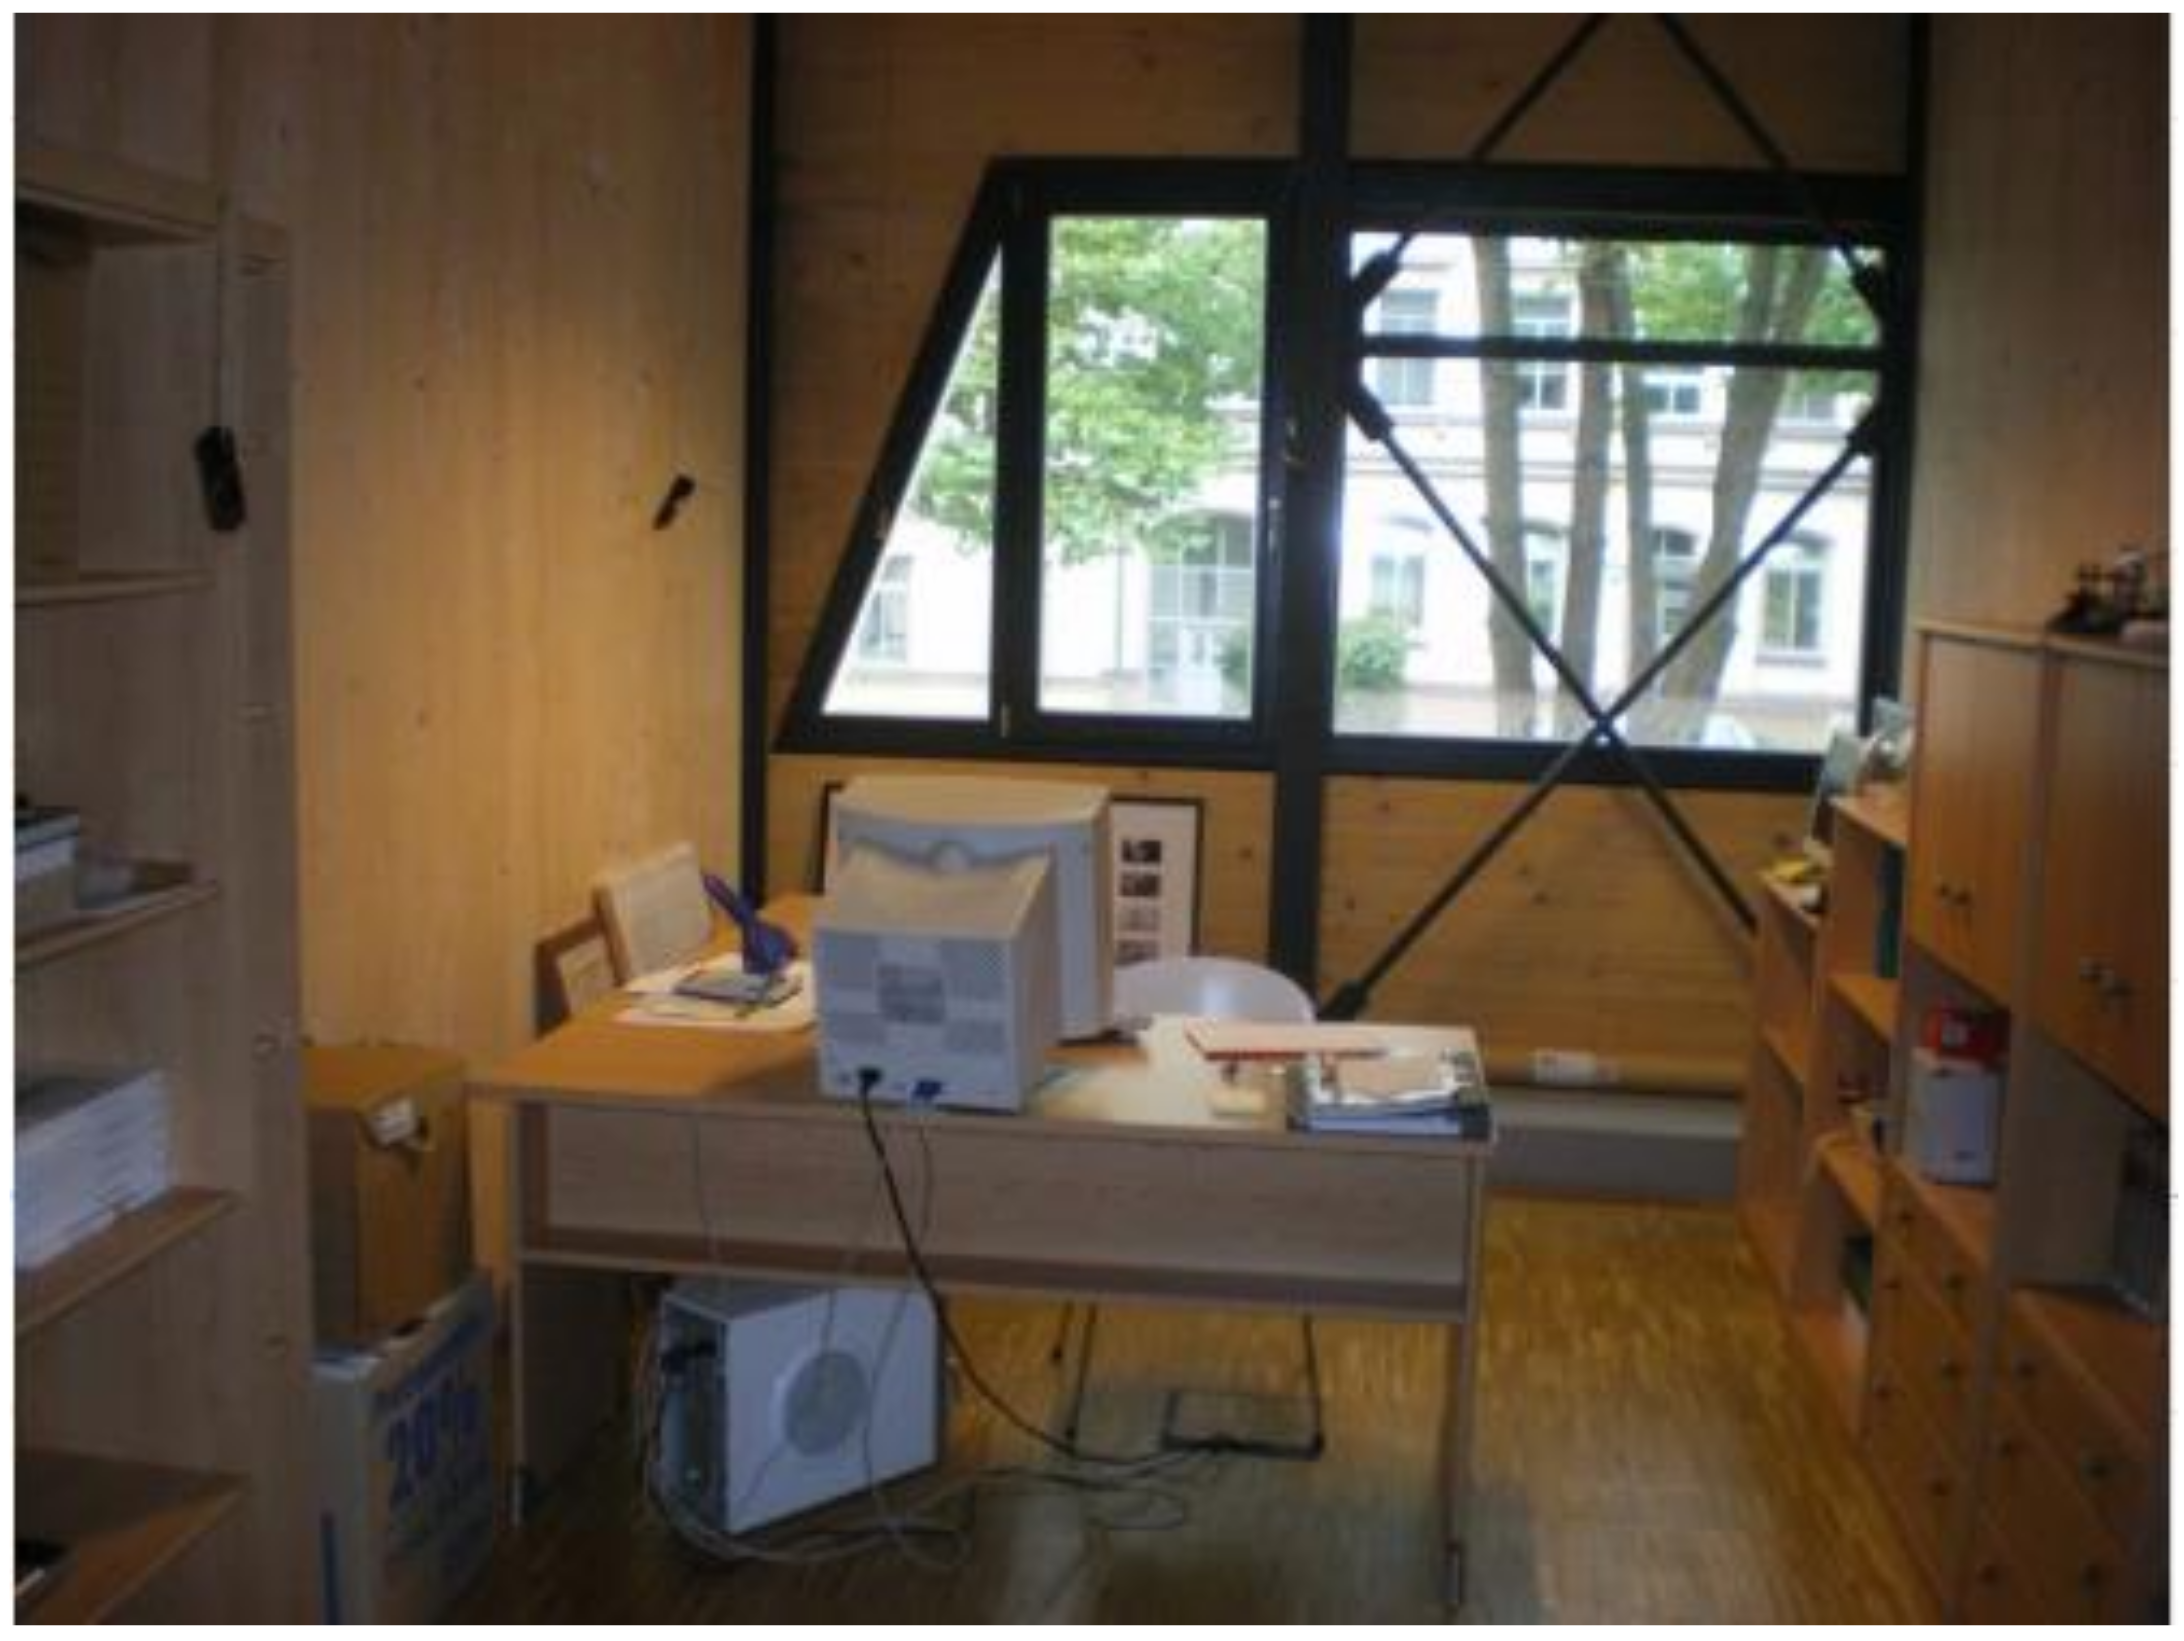
- an office room with a floor heating system
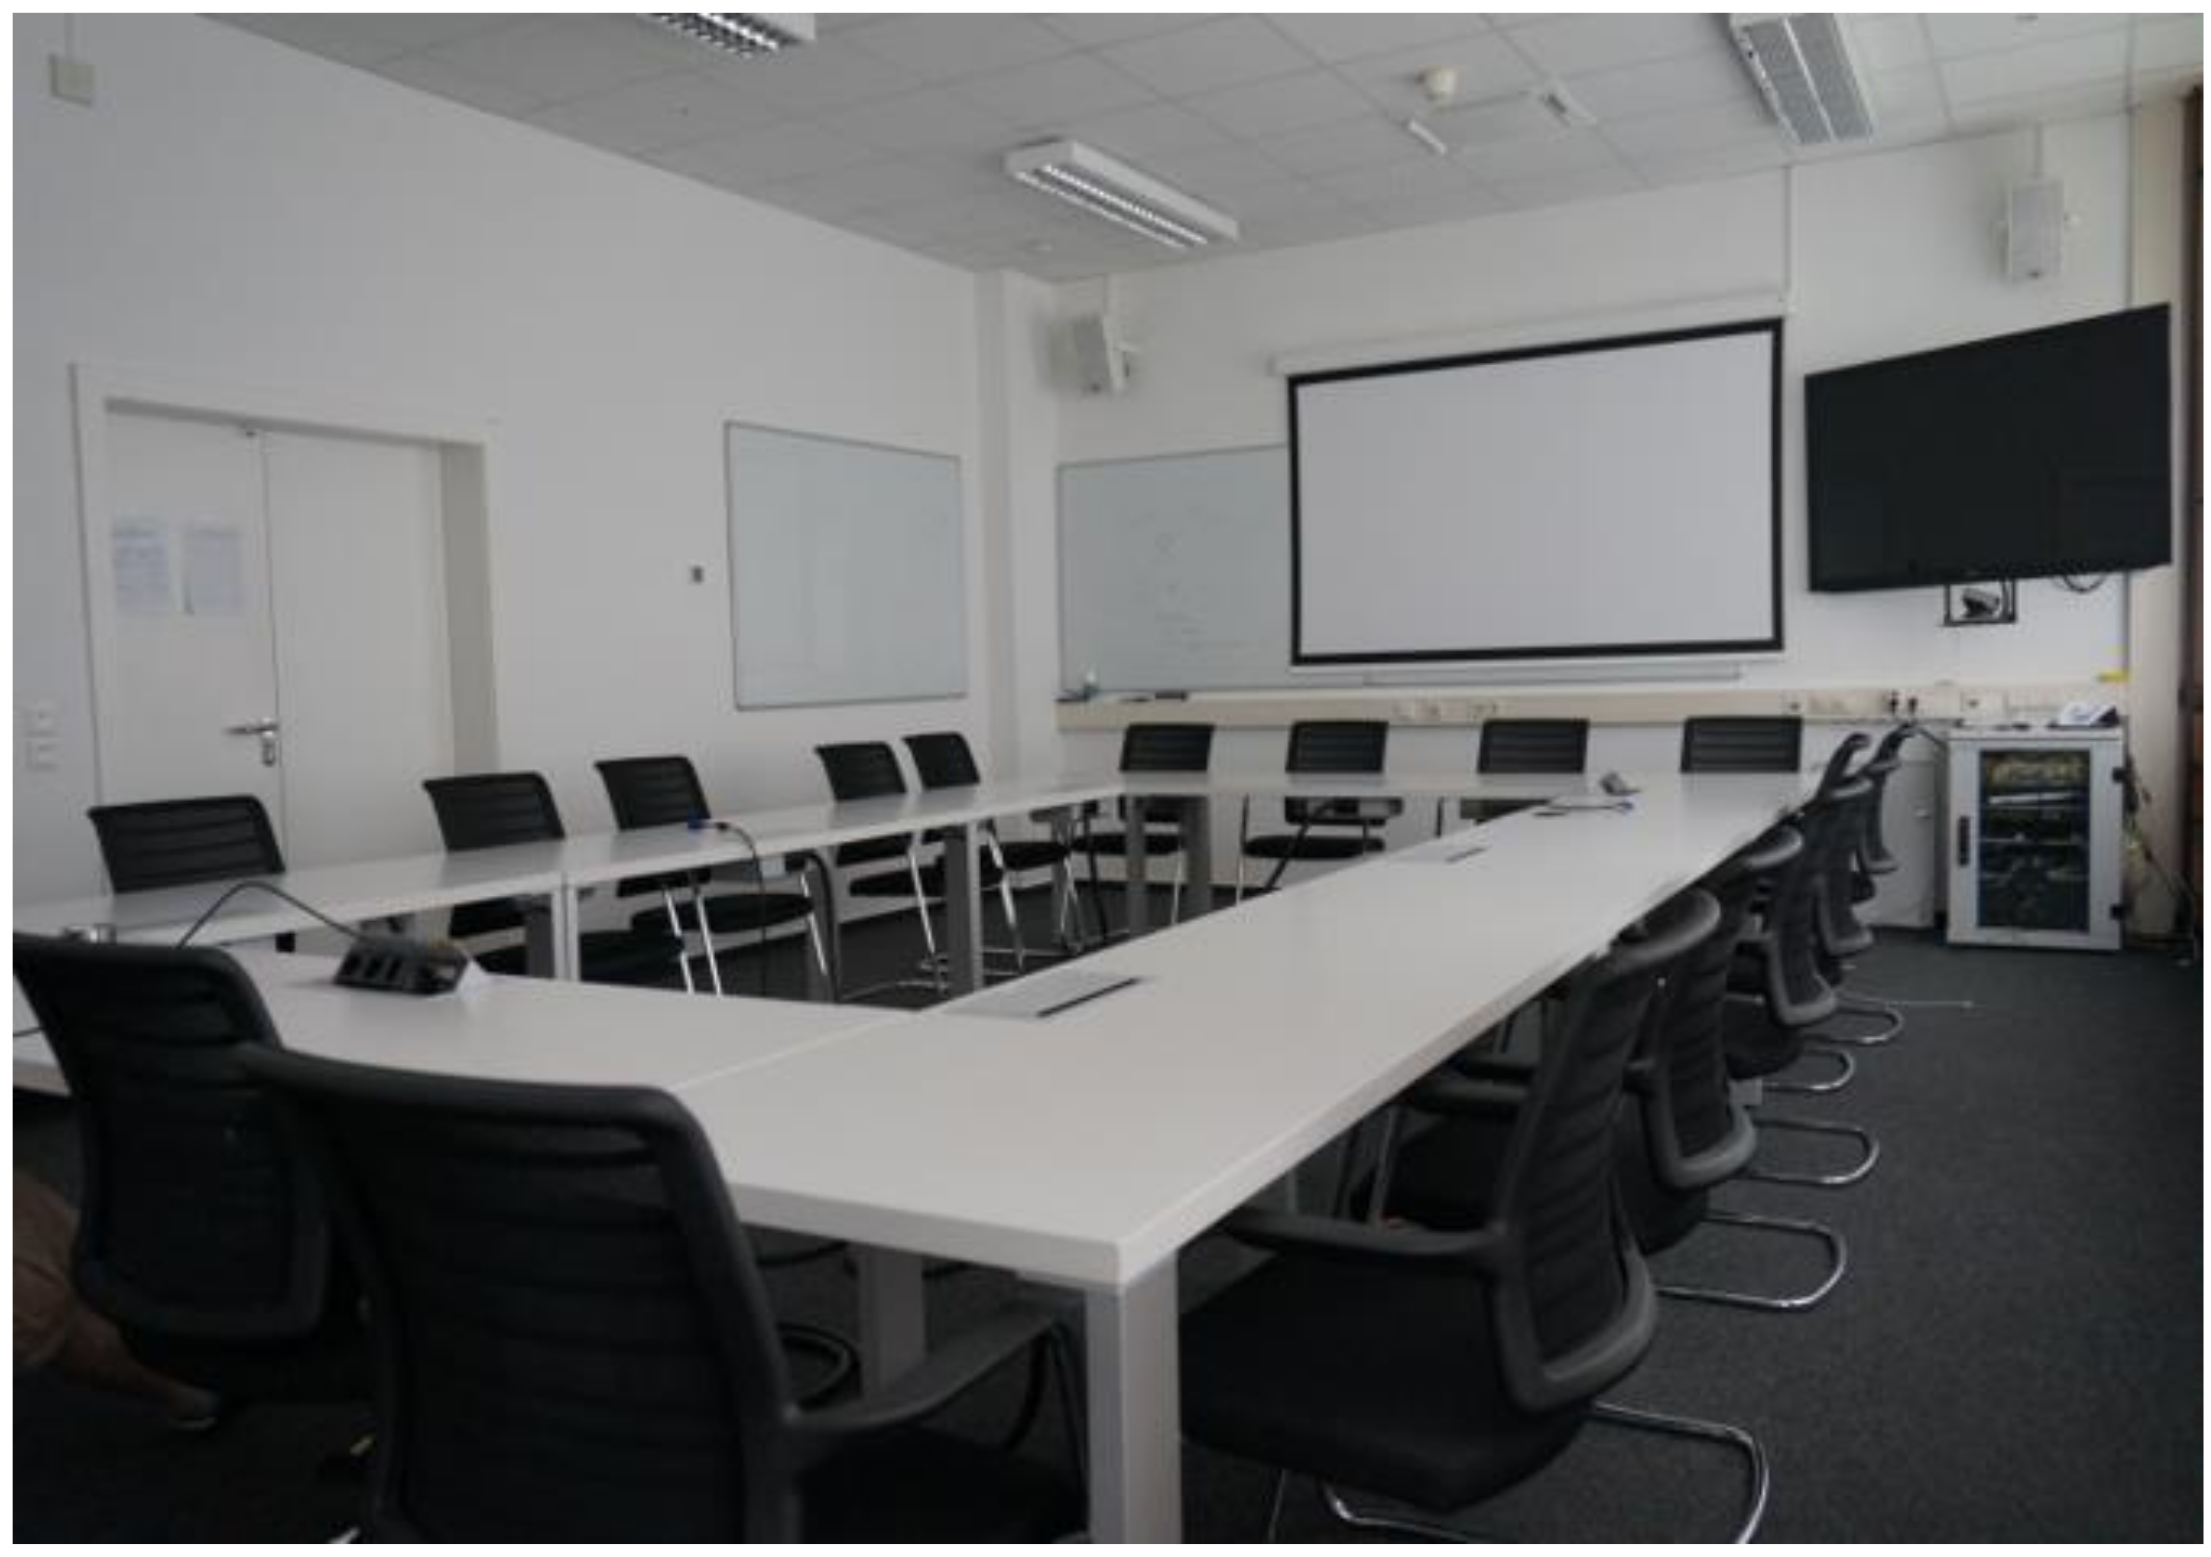
- a meeting room with a radiator heating system
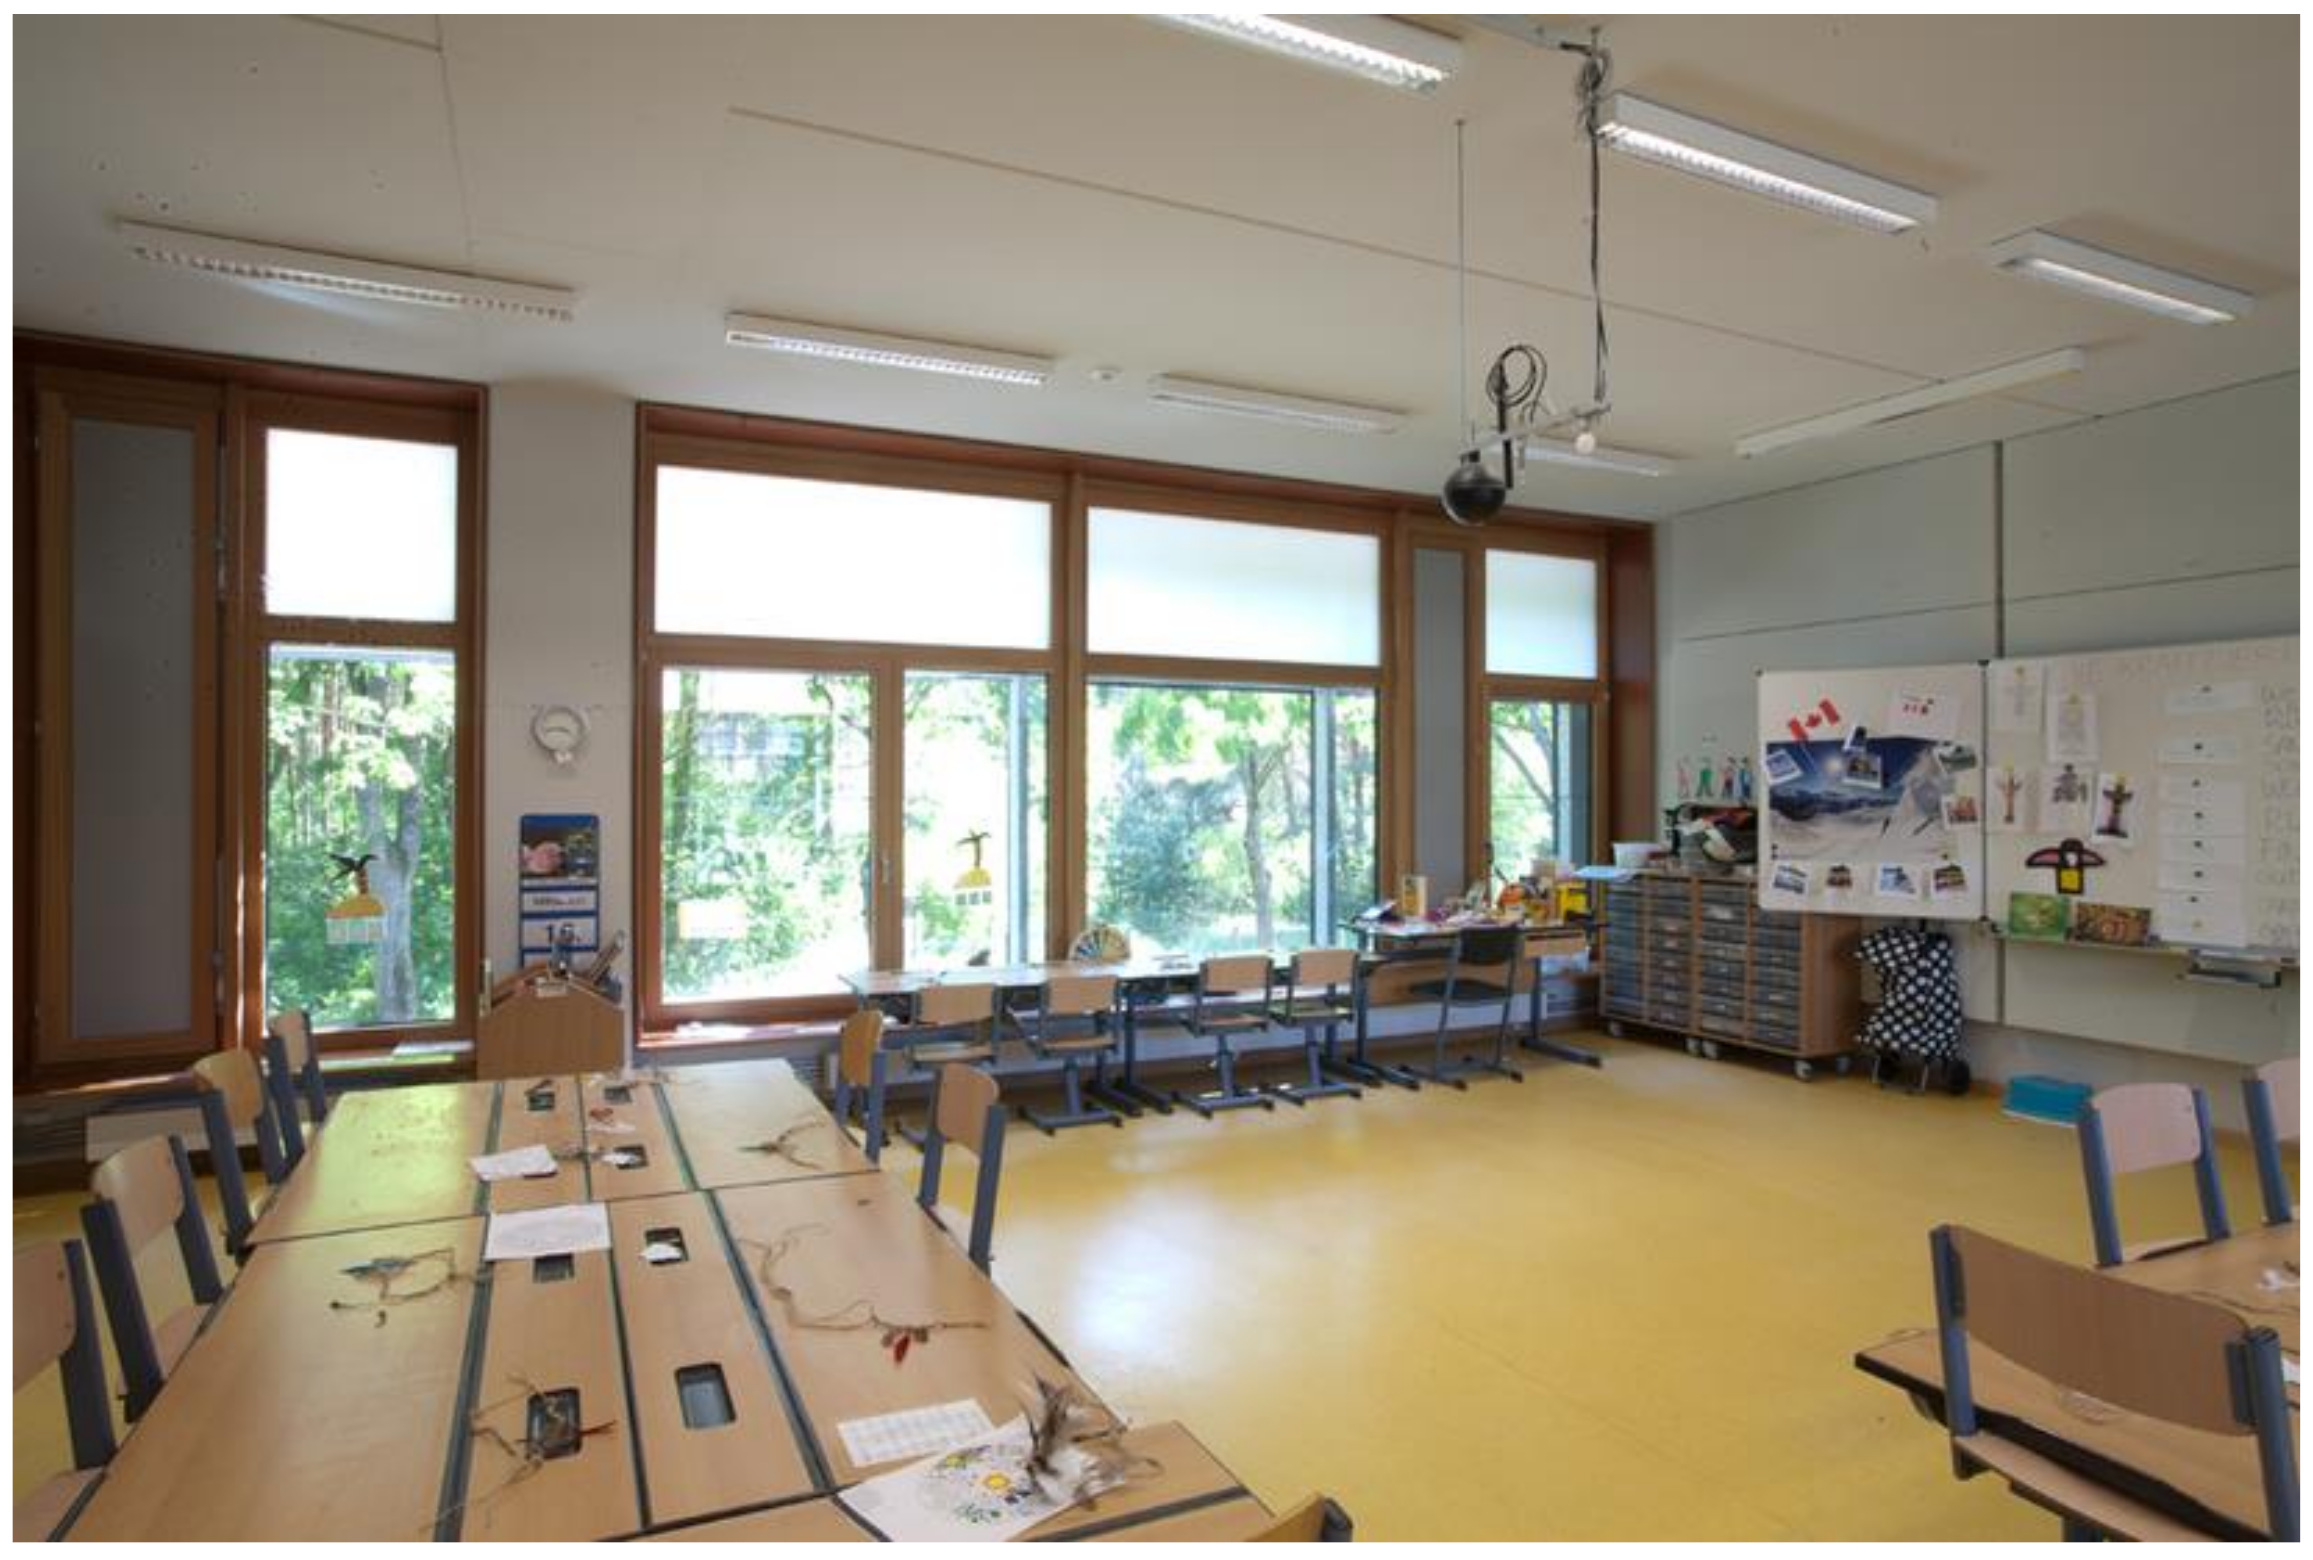
- a classroom with a radiator heating system
Single Freestanding Room (BuildingSystems.Buildings.BuildingTemplates.Building1Zone1DBox)
Office Room (BuildingSystems.Buildings.BuildingTemplates.Building1Zone1DBox)
Meeting Room (BuildingSystems.Buildings.BuildingTemplates.Building1Zone1DBox)
Class Room (BuildingSystems.Buildings.BuildingTemplates.Building1Zone1DBox)
3.1.2. Location model
- air pressure at the ground
- absolute humidity of the outside air
- relative humidity of the outside air
- temperature of the outside air
- direct solar radiation on horizontal surfaces
- diffuse solar radiation on horizontal surfaces
- wind speed
- wind direction
- rate of cloud coverage of the sky
- temperature of the sky
- latitude
- longitude
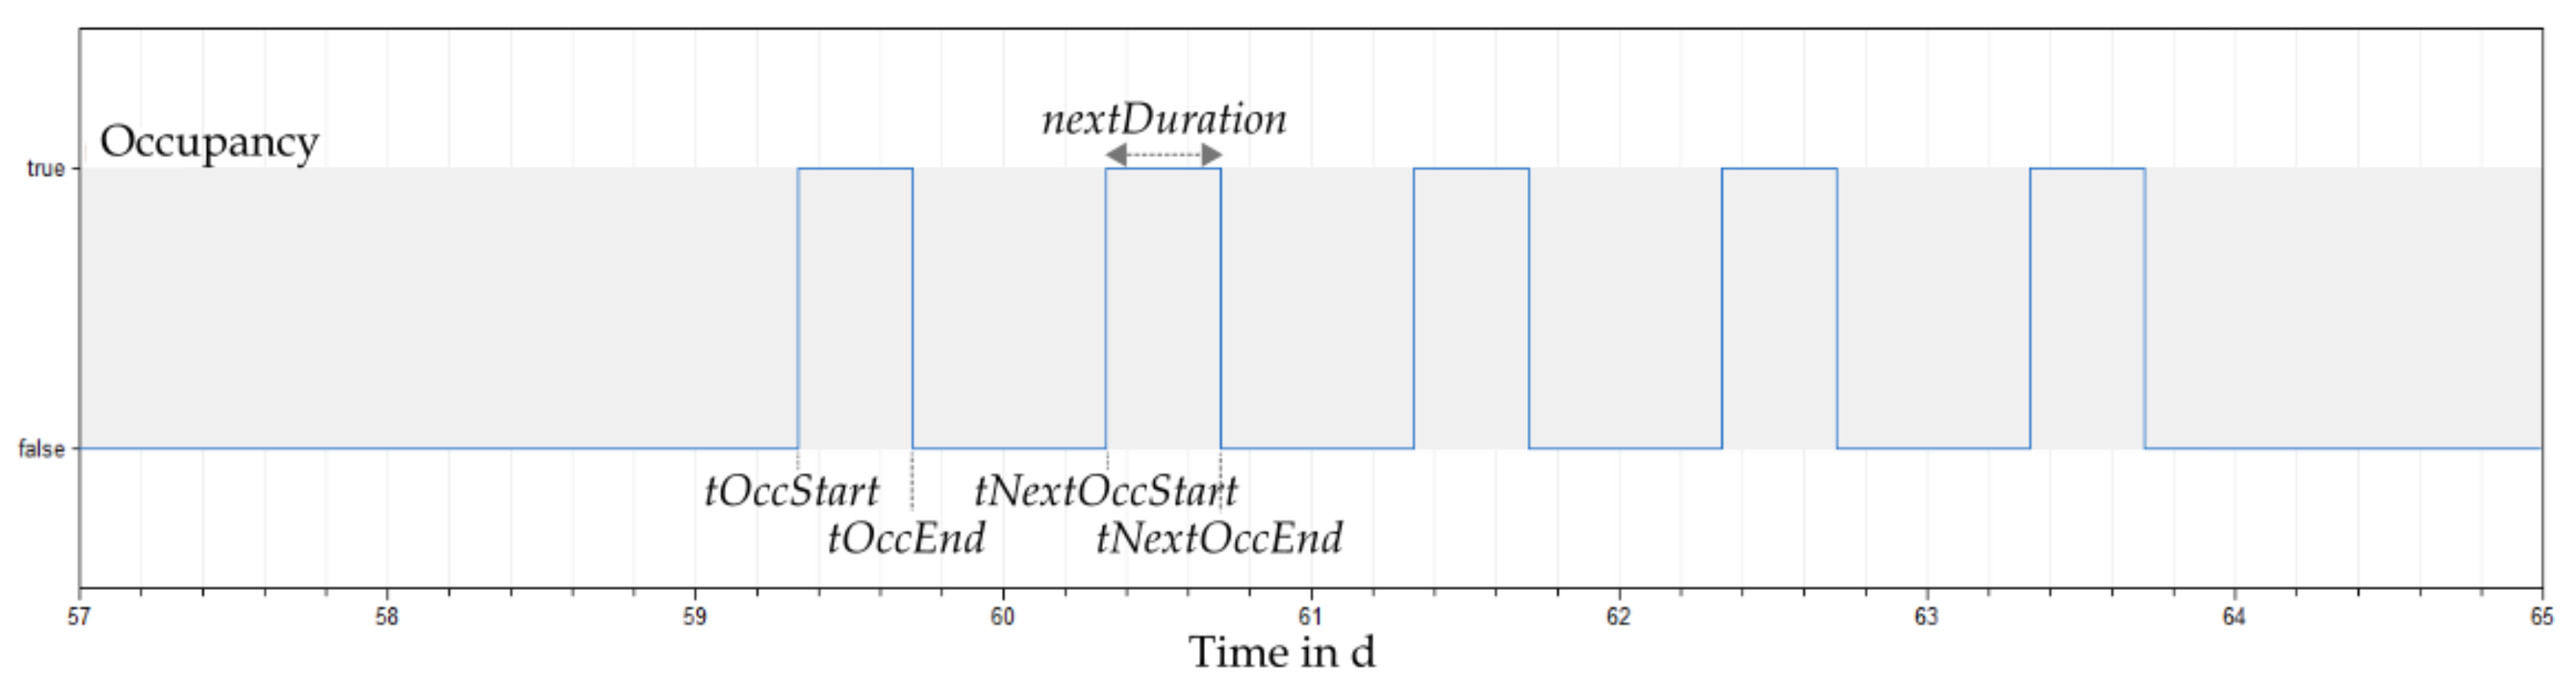
3.1.3. Usage Models
- actual point in time t in s
- start time of the current occupancy tOccStart in s
- start time of the next occupancy tNextOccStart in s
- end time of the current occupancy tOccEnd in s
- end time of the next occupancy tNextOccEnd in s
- number of people in the room during the current occupancy Anz_Personen
- duration of the next occupancy nextDuration in s
3.1.4. Lighting Model
3.1.5. Air Exchange Rate
3.1.6. Controller Models
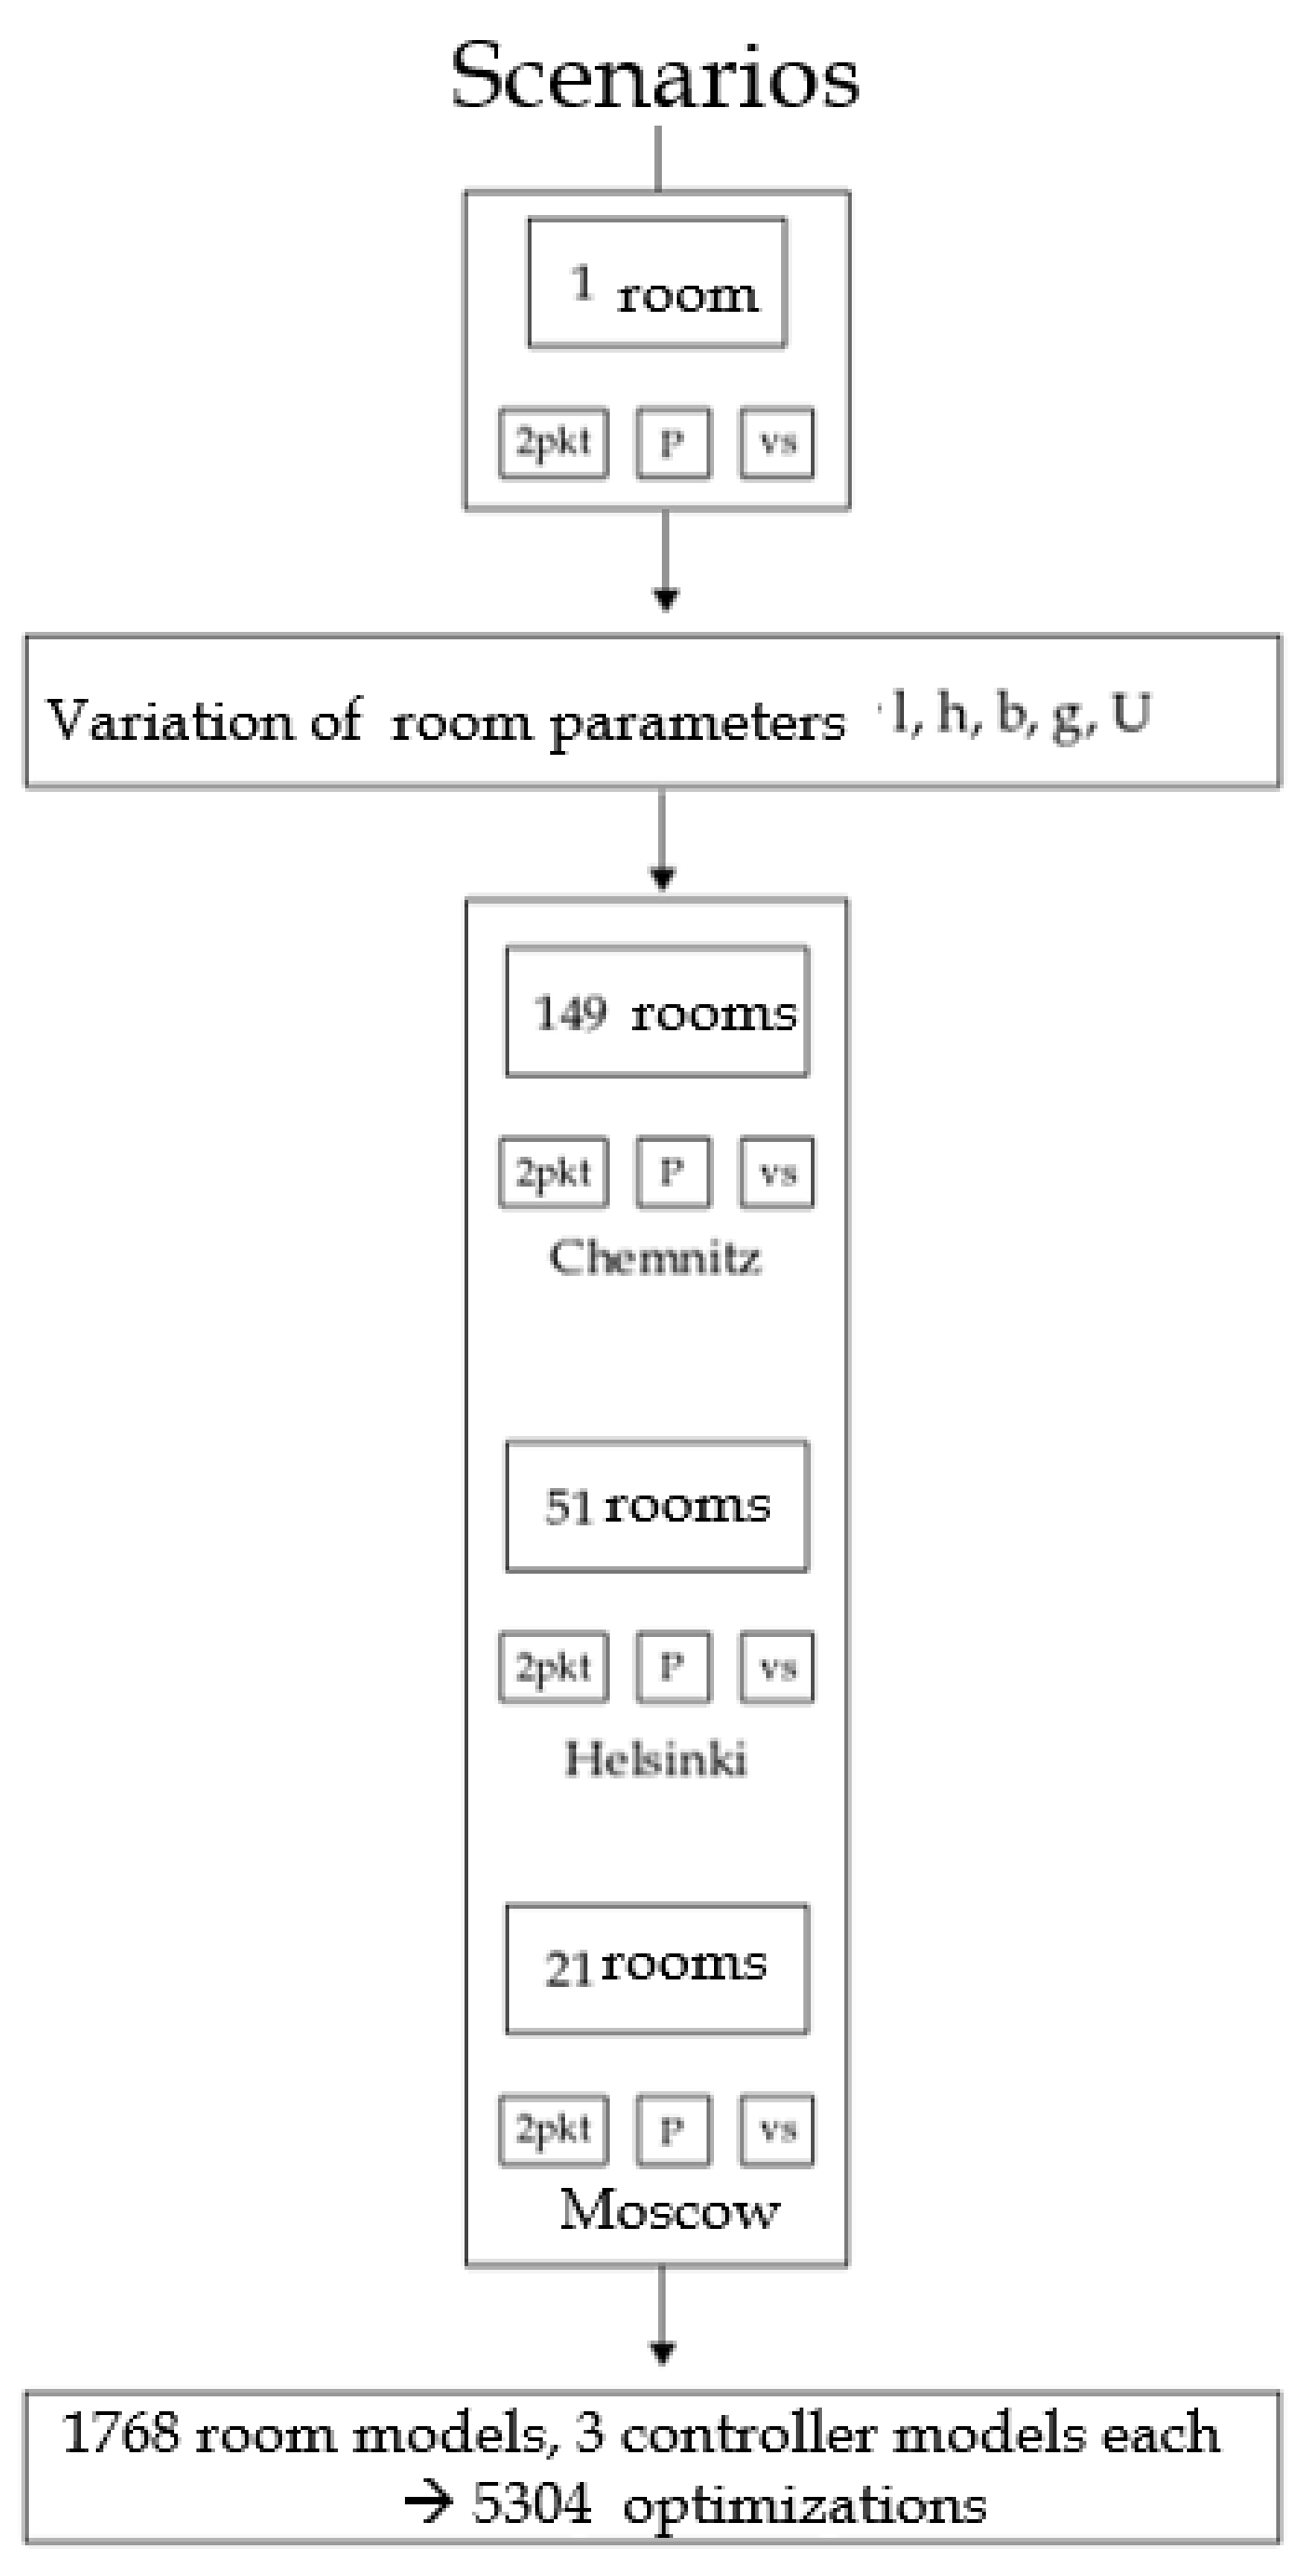
3.1.7. Combining the Models to Scenarios
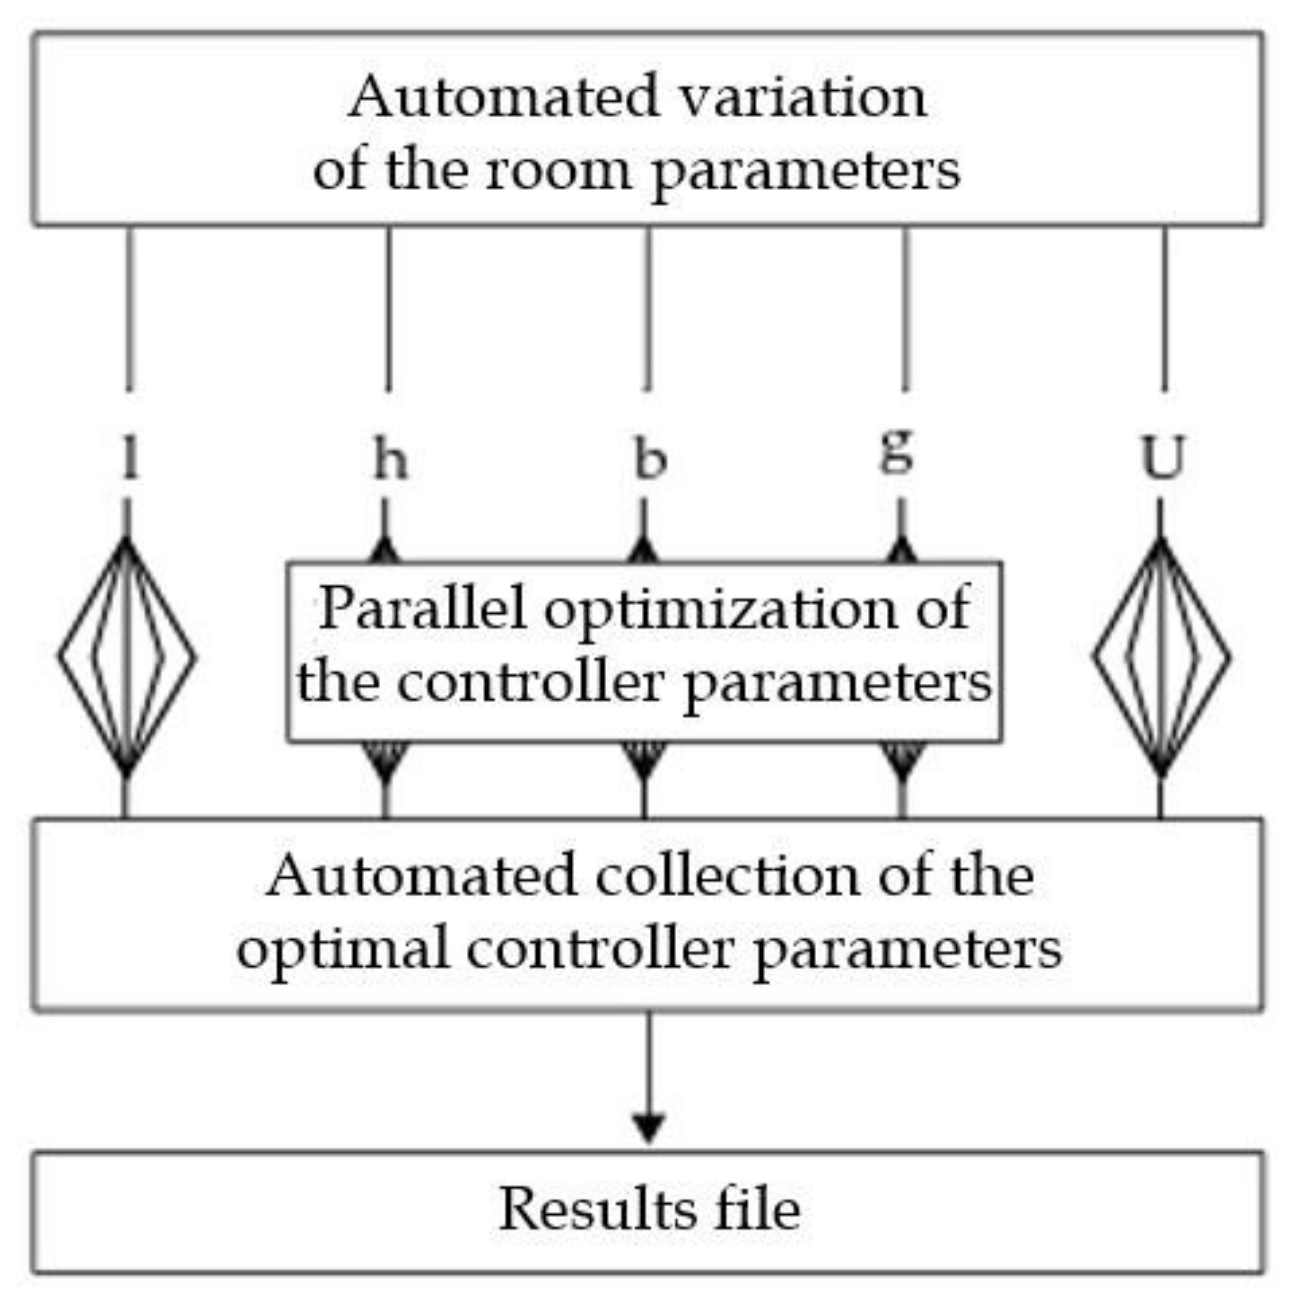
3.2. Increasing the Data Basis
- length of the room, l, in m in the range of 3.0–10.0 m in steps of 0.5 m ((3.0:0.5:10.0))
- height of the room, h, in m in the range of (3.0:0.1:50.0)
- width of the windows, b, in m in the range of (0.5:0.1:4.0)
- g-value of the windows, g, in the range of (0:0.1:1.0)
- U-value of the windows, U, in in the range of (0.5:0.1:7.0)
4. Results and Discussion
5. Conclusions
Supplementary Materials
Author Contributions
Funding
Informed Consent Statement
Data Availability Statement
Conflicts of Interest
References
- Bundesamt für Wirtschaft und Energie (BMWi). Energieeffizienz Gebäude; Bundesamt für Wirtschaft und Energie (BMWi): Berlin, Germany, 2015. [Google Scholar]
- Afram, A.; Janabi-Sharifi, F. Theory and applications of HVAC control systems–A review of model predictive control (MPC). J. Energy Build. 2014, 6, 343–355. [Google Scholar] [CrossRef]
- Yamazakiand, T.; Yamakawa, Y.; Kamimura, K.; Kurosu, S. Air-Conditioning PID Control System with Adjustable Reset to Offset Thermal Loads Upsets. 2011. Chapter 11. pp. 209–228. Available online: http://www.intechopen.com/books/advances-in-pid-control/air-conditioning-pid-control-system-with-adjustable-reset-to-offset-thermal-loads-upsets (accessed on 22 February 2021). [CrossRef] [Green Version]
- Fiducioso, M.; Curi, S.; Schumacher, B.; Gwerder, M.; Krause, A. Safe contextual bayesian optimization for sustainable room temperature PID control tuning. arXiv 2019, arXiv:1906.12086. [Google Scholar]
- Berkenkamp, F.; Krause, A.; Schoellig, A.P. Bayesian optimization with safety constraints: Safe and automatic parameter tuning in robotics. arXiv 2010, arXiv:1602.04450v3. [Google Scholar]
- Ranjan, S.; Sharma, A.; Chaudhary, P. An effective temperature controller system using PID mechanism. In Proceedings of the 2014 Innovative Applications of Computational Intelligence on Power, Energy and Controls with their impact on Humanity (CIPECH), Ghaziabad, India, 28–29 November 2014; pp. 182–185. [Google Scholar]
- Fritzson, P. Principles of Object-Oriented Modeling and Simulation with Modelica 2.1; John Wiley & Sons: Hoboken, NJ, USA, 2010. [Google Scholar]
- Nytsch-Geusen, C.; Huber, J.; Ljubijankic, M.; Rädler, J. Modelica BuildingSystems–Eine Modellbibliothek zur Simulation komplexer energietechnischer Gebäudesysteme. Bauphysik 2013, 35, 21–29. [Google Scholar] [CrossRef]
- Wetter, M.; Zuo, W.; Nouidui, T.; Pang, X. Modelica Buildings library. J. Build. Perform. Simul. 2014, 7, 253–270. [Google Scholar] [CrossRef]
- Meteonorm. Available online: https://meteonorm.com/ (accessed on 16 January 2021).
- Norm DIN EN 12464-1. Licht und Beleuchtung–Beleuchtung von Arbeitsstätten–Teil 1: Arbeitsstätten in Innenräumen; Beuth Verlag GmbH: Berlin, Germany, 2011. [Google Scholar]
- Wikipedia. Available online: https://de.wikipedia.org/wiki/Mindestluftwechsel#Berechnungsverfahren_1:_CO2-Bilanz_nach_ASR_A3.6_und_der_daraus_resultierende_Au%C3%9Fenluftvolumenstrom (accessed on 2 December 2020).
- Lunze, J. Regelungstechnik 1; Springer: Berlin/Heidelberg, Germany, 2016. [Google Scholar]
- Majetta, K.; Clauß, C.; Haufe, J.; Seidel, S.; Blochwitz, T.; Liebold, E.; Hintzen, U.; Klostermann, V. Design and Optimization of an Energy Manager for an Office Building. Simul. Notes Eur. 2015, 25, 581–595. [Google Scholar] [CrossRef] [Green Version]
- Schneider, A. Variantensimulation mit Gridworker. In Proceedings of the ASIM-Conference STS/GMM, Simulation of Technical Systems, Basics and Methods in Modeling and Simulation, (ASIM), Krefeld, Germany, 24–25 February 2011. [Google Scholar]
- Schneider, P.; Schneider, A.; Bastian, J.; Reitz, S.; Schwarz, P. MOSCITO: A program system for MEMS optimization. In Design, Test, Integration, and Packaging of MEMS/MOEMS 2002 Bd.; International Society for Optics and Photonics: Bellingham, DC, USA, 2002; pp. 248–257. [Google Scholar]


| Algorithm | FSQP | NM | CG | BFGS | POWELL | SA |
|---|---|---|---|---|---|---|
| 0.5 | 0.5 | 0.5 | 0.5 | 1.23 | 1.24 | |
| Cost | 0.172 | 0.172 | 0.172 | 0.172 | 0.145 | 0.146 |
| Iterations | 4 | 11 | 35 | 5 | 94 | 354 |
Publisher’s Note: MDPI stays neutral with regard to jurisdictional claims in published maps and institutional affiliations. |
© 2021 by the authors. Licensee MDPI, Basel, Switzerland. This article is an open access article distributed under the terms and conditions of the Creative Commons Attribution (CC BY) license (http://creativecommons.org/licenses/by/4.0/).
Share and Cite
Majetta, K.; Clauß, C.; Nytsch-Geusen, C. Provision of Data to Use in Artificial Intelligence Algorithms for Single Room Heating. Electronics 2021, 10, 523. https://doi.org/10.3390/electronics10040523
Majetta K, Clauß C, Nytsch-Geusen C. Provision of Data to Use in Artificial Intelligence Algorithms for Single Room Heating. Electronics. 2021; 10(4):523. https://doi.org/10.3390/electronics10040523
Chicago/Turabian StyleMajetta, Kristin, Christoph Clauß, and Christoph Nytsch-Geusen. 2021. "Provision of Data to Use in Artificial Intelligence Algorithms for Single Room Heating" Electronics 10, no. 4: 523. https://doi.org/10.3390/electronics10040523