Article

Optimization of a 3D-Printed Permanent Magnet Coupling Using Genetic Algorithm and Taguchi Method

1
Department of Electrical Power Engineering and Mechatronics, Tallinn University of Technology, Ehitajate tee 5, 12616 Tallinn, Estonia
2
Department of Electrical Engineering and Automation, Aalto University, P.O. Box 15500 Aalto, Finland
3
Faculty of Control Systems and Robotics, ITMO University, 197101 Saint Petersburg, Russia
*
Author to whom correspondence should be addressed.
Electronics 2021, 10(4), 494; https://doi.org/10.3390/electronics10040494
Submission received: 19 January 2021 / Revised: 16 February 2021 / Accepted: 18 February 2021 / Published: 20 February 2021
(This article belongs to the Special Issue Robust Design Optimization of Electrical Machines and Devices)

Abstract

:
In recent decades, the genetic algorithm (GA) has been extensively used in the design optimization of electromagnetic devices. Despite the great merits possessed by the GA, its processing procedure is highly time-consuming. On the contrary, the widely applied Taguchi optimization method is faster with comparable effectiveness in certain optimization problems. This study explores the abilities of both methods within the optimization of a permanent magnet coupling, where the optimization objectives are the minimization of coupling volume and maximization of transmitted torque. The optimal geometry of the coupling and the obtained characteristics achieved by both methods are nearly identical. The magnetic torque density is enhanced by more than 20%, while the volume is reduced by 17%. Yet, the Taguchi method is found to be more time-efficient and effective within the considered optimization problem. Thanks to the additive manufacturing techniques, the initial design and the sophisticated geometry of the Taguchi optimal designs are precisely fabricated. The performances of the coupling designs are validated using an experimental setup.

1. Introduction

The term permanent magnet (PM) coupling or clutch refers to a device that is used to transmit torque between two shafts without mechanical contact. Torque transmission is served by the magnetic field induced by PMs placed on the driving member. Throughout the years, PM couplings have been widely employed in blowers and compressors, conveyors and pumps, and food processing equipment due to their unique qualities [1,2]. For instance, the highlighted features of the PM couplings are the ability to transmit torque through a separator and easy maintenance. Still, there are several important aspects to take into account in PM couplings design. Among these concerns, mass characteristics, transmitted torque, and their balance remain challenging.
Nowadays, the design optimization is extensively used for enhancing the performance of PM couplings. The majority of the studies on PM coupling optimization have utilized coupling dimensions as optimization parameters [3,4,5]. On the other hand, the optimization of coupling shapes may propose a better improvement of the device performance.
Researchers have been avoiding the optimization of coupling shapes due to the restricted abilities of conventional manufacturing techniques. Presently, additive manufacturing (AM) is considered a constructive alternative to the conventional ways of fabrication [6,7,8,9]. Being a flexible and low-material waste technique, the AM can construct geometrically intricate components. Overall, the AM techniques provide an opportunity to discover more favorable shapes of PM couplings and greatly enhance their performance.
To date, several methods have been developed to optimize the design of electrical machines and devices. The direct and indirect optimization methods (DOM and IOM), multi-level optimization methods, and robust optimization methods are the main approaches. In this study, two methodological approaches are selected: the DOM accompanied by the genetic algorithm (GA) and the Taguchi optimization method [10,11]. The DOM presents a clear and intuitive structure, since it simply utilizes a finite element model (FEM) along with the GA [12,13,14,15,16]. The unique features of the GA, such as the ability to obtain the global minimum, handle non-analytic formulation of optimization problems, and high flexibility, justify its popularity among researchers. This algorithm not only considerably narrows the solution space during optimization but also presents an impressive searching ability. Regardless of the great advantages of DOM-GA optimization, it often appears time-consuming [17,18,19]. In contrast with the DOM-GA, the Taguchi method requires a considerably lower number of calculations that significantly reduces the execution time [20]. This method takes into account the manufacturing variations of the optimization parameters within the optimization model and, consequently, reaches the high reliability of the optimization results [21,22,23]. However, far too little attention has been paid to the Taguchi method within the design optimization of electromagnetic devices.
This paper aims to carry out the optimization of the PM coupling shapes with the following optimization objectives: minimization of the coupling volume and maximization of the transmitted torque. Additionally, the study compares the DOM-GA and the Taguchi method in terms of the obtained optimization results and the required execution time. The importance and originality of this study is that it explores complex shapes of the PM coupling design and proposes a great improvement of the device performance. Moreover, the comparative analysis of the DOM-GA and Taguchi method should make an important contribution to the field of design optimization of electromagnetic devices.
The paper is organized as follows. First, the initial design of the PM coupling and definition of the optimization model is presented in Section 2 and Section 3, respectively. It will then go on to Section 4, which is dedicated to GA optimization, and Section 5, which presents the Taguchi optimization. Next, Section 6 provides a comprehensive comparison of the applied optimization methods. Then, Section 7 describes the experimental setup and provides the test results for the initial and optimal designs of the coupling, respectively. Finally, the discussion and conclusion of the study are presented in Section 8.

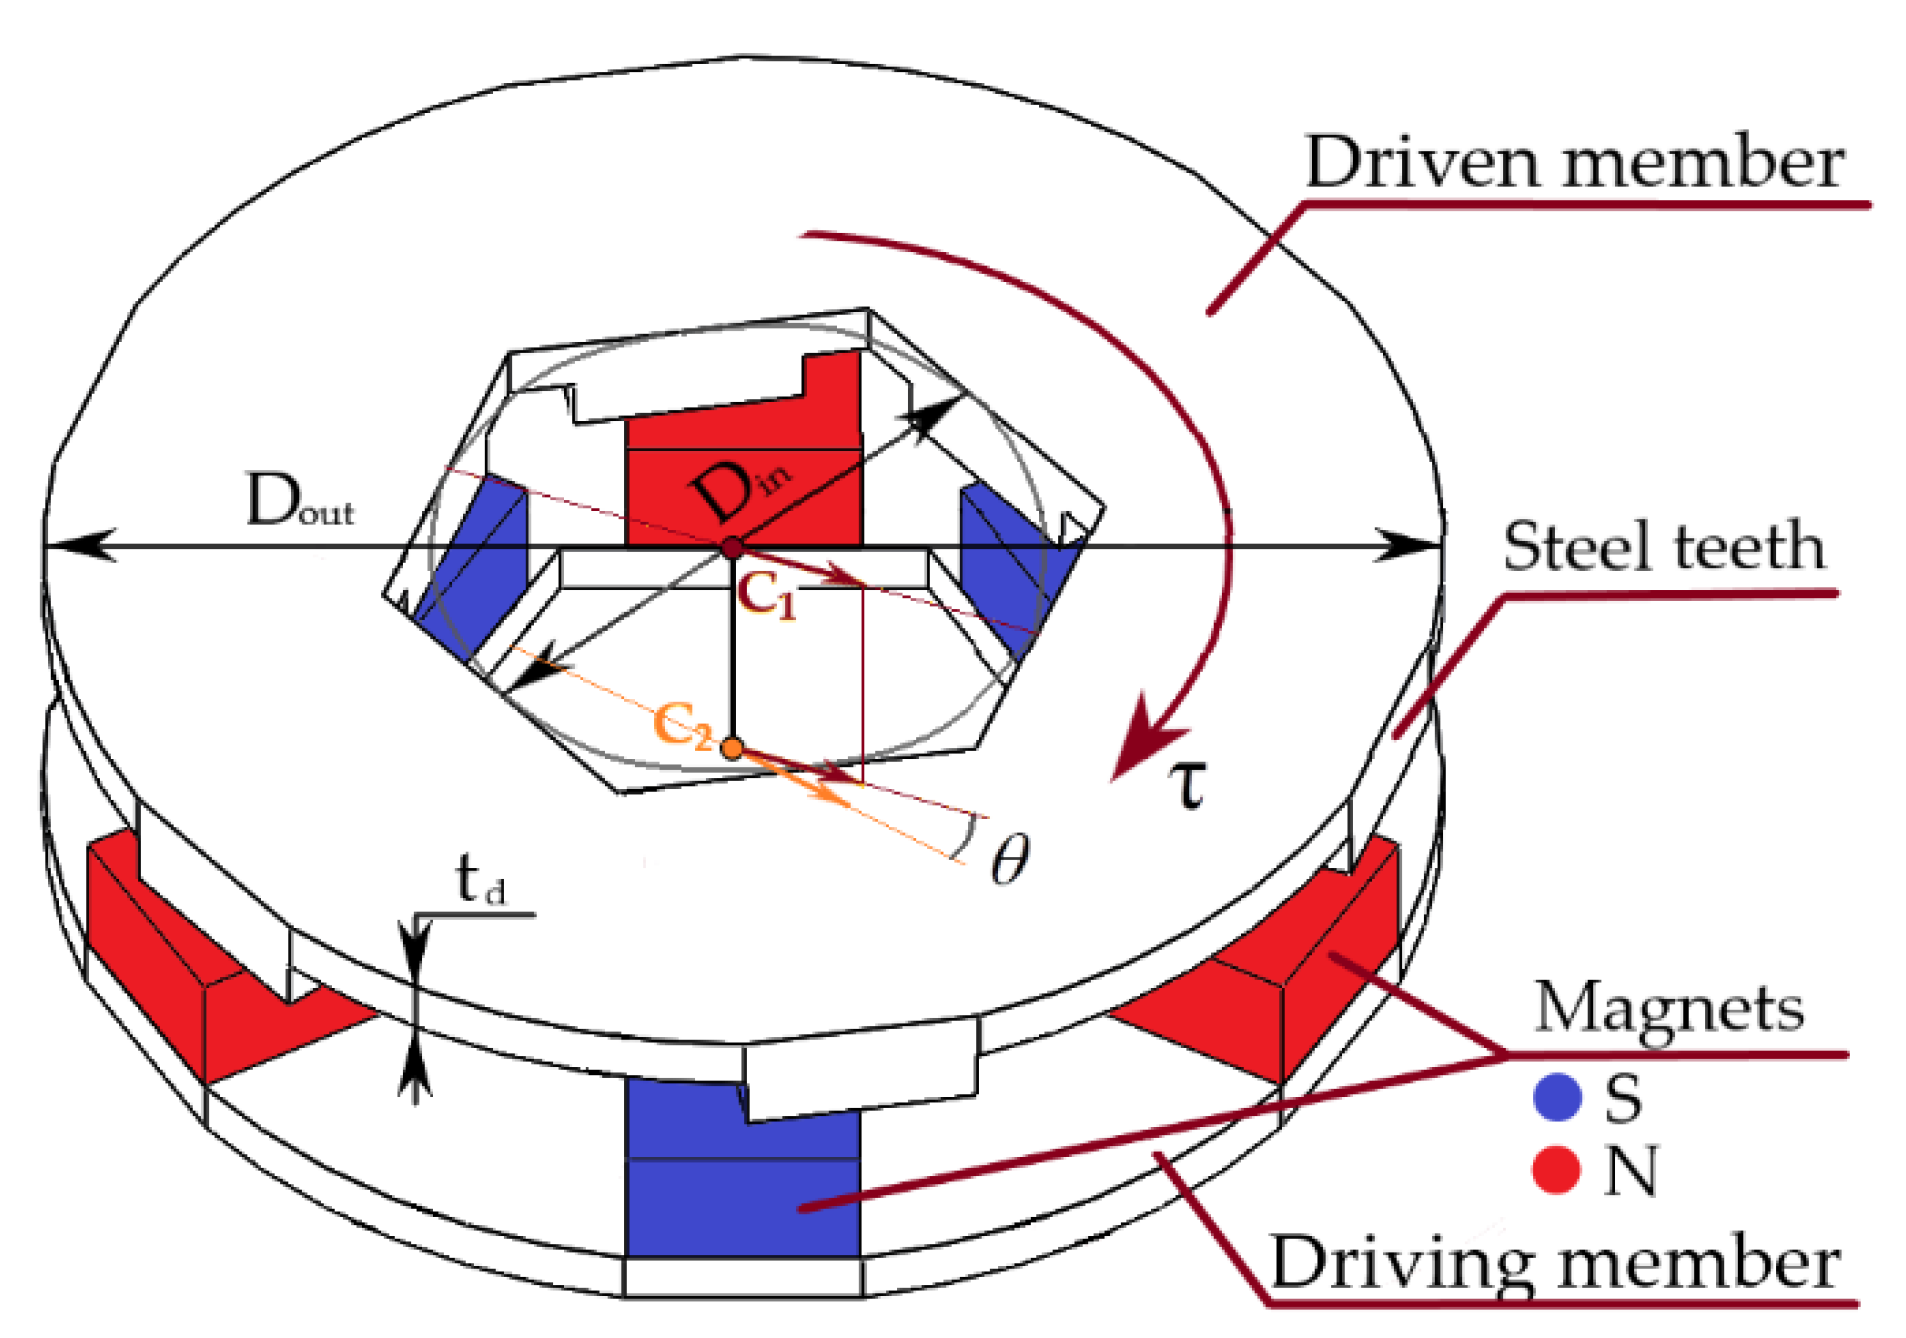
2. Permanent Magnet Coupling Design

This paper considers an optimization problem of a face type PM coupling. Before proceeding to the optimization, it is important to overview the concept of the PM coupling design and operation principle. To illustrate the structure of the coupling, Figure 1 is presented. The figure shows two main components of the coupling: driving and driven members. The driving member possesses magnetic teeth, while the driven member has steel teeth. Along with the structure, Figure 1 demonstrates the main dimensions of the coupling. Additionally, Figure 1 shows the angle of deviation of the coupling members θ. To demonstrate θ, the centers of the disks C1 and C2 are specified. Table 1 lists the main parameters of the coupling geometry.
The operation concept of the PM coupling is based on the attraction efforts that appear between the magnets placed on the driving disk and the driven member made of steel. The magnetic torque induced in the driven disk depends on the angle of deviation of the coupling members θ, magnetic flux density B, and magnetic field intensity H [24]:
τ = δ V o H B d H d V δ θ
For prototyping, the steel material with 6.5% silicon content was utilized for the disks and driven member’s teeth. The neodymium magnets N52 (Sintered Nd-Fe-B) were employed to provide the magnetic force.
The finite element analysis of the coupling initial design was carried out through Symcenter MagNet. According to the initial design modelling, the volume of the coupling was 2.31 × 10⁻⁶ m3 and the maximum magnetic torque was 73.0 × 10⁻³ Nm. Figure 2 presents the dependence of the torque on the angle of deviation. The static simulation results and their approximation are provided. The approximation was carried out by fitting the smoothing spline within the Matlab Curve Fitting Toolbox.
It is important to notice that the magnetic torque reached its maximum when the angle of deviation of the coupling members θ was 17°. Therefore, this position was chosen for static simulations within the optimization.

3. Permanent Magnet Coupling Optimization Model

Figure 3 shows the distribution of the magnetic flux density obtained through the MagNet for the initial design of the coupling. It can be seen that the flux density saturation is quite low in particular areas of the coupling disks. Here, the low saturation is a sign that the material of the coupling is not utilized efficiently. Therefore, the coupling design needs to be improved to enhance the effectiveness of material usage. For this purpose, the design optimization can be employed.
Many researchers have optimized PM couplings paying particular attention to the torque output and volume of the utilized materials [1,4]. Traditionally, linear dimensions, such as diameters of the disks or sizes of magnets, are chosen as optimization parameters. This might be due to the restrictions of the conventional methods of fabrication on design production.
Since AD techniques allow producing complex geometry, the search for optimal dimensions can be replaced with the search for optimal shapes. Therefore, this paper aims to obtain an optimal shape of the PM coupling disks to minimize the material usage and maximize the transmitted torque.
In solving an optimization problem, the first step is to create an optimization model, which involves defining objectives, constraints, and parameters. This study considers the optimization problem, in which the objective functions were non-analytical. More specifically, the volume and the magnetic torque were obtained using FEA within Simcenter MAGNET. The optimization problem was unconstrained. To find an optimal shape of the clutch disks, the vector of optimization parameters was formed by twelve elements, which represented geometrical locations of the points. Figure 3 shows a set of the geometrical points used as the optimization parameters. As can be noted, the points were placed within the area of low saturation of the coupling disks. Within this area, the material could be potentially removed in order to increase the effectiveness of material usage. The demonstrated set was repeated along the circumference of the coupling disks. Within the optimization, the variation of the parameters had the following limits: [0…1] mm. The disks’ general thicknesses td were not included in the group of the optimization parameters, since they were minimized beforehand and their further reduction negatively influenced the torque.

4. Optimization Using Genetic Algorithm

4.1. Genetic Algorithm

To carry out a multi-objective optimization, an optimization model should be formulated in the following view:
minimize   f ( x ) = [ f 1 ( x ) , f 2 ( x ) , , f n ( x ) ] T , subject   to   g i ( x ) 0 ,   i = { 1 m } , h j ( x ) = 0 ,   j = { 1 p } ,
where the vector f (x) is formed from objective functions, and the vector x presents a set of k optimization parameters. The functions gi (x) and hj (x) are constraint functions.
In solving multi-objective problems (MOPs), the ultimate goal is to find good compromises between the objective functions. Traditionally, this goal is achieved using the concept of Pareto Optimality.
To understand the idea of the Pareto Optimality, several definitions should be presented. First, a classic definition of Pareto Optimal Solution can be expressed as follows. A solution x Ω is called a Pareto Optimal Solution if there is no x Ω for which the objective vector fk (x’) dominates fk (x). Here, Ω implies the feasible region of the optimization problem. The feasible region is an area of the parameter space, where all constraints are satisfied. Second, Pareto Dominance can be defined as follows. A vector fk (x) is said to dominate another vector fk (x’) only if fk (x) is partially less than fk (x’).
Essentially, the main functions of the multi-objective genetic algorithm (MOGA) are to obtain a set of Pareto Optimal Solutions (P*). The set P* is a set of optimal values of the optimization parameters. Mathematically, the Pareto Optimal Set can be defined as follows [19]:
P * : = { x Ω   |   ¬   x Ω   |   f ( x ) f ( x ) } ,
The second function of the MOGA is to construct the Pareto Front (PF*). At first, many points within the feasible region should be calculated. If the number of the points is high enough, the GA finds the non-dominated points and identifies PF*:
P F * : = { u = f ( x )   |   x P * } .
The procedure that allows the MOGA to explore the solution space is presented in Algorithm 1 [19]. The specific terms used within the MOGA procedure are the following:
  • The term “gene” implies an optimization parameter;
  • The term “individual” defines a set of optimization parameters;
  • The term “population” presents a group of different parameter sets.
Algorithm 1 MOGA
1:Initialize Population;
2:Evaluate Objective Values;
3:Assign Rank based on Pareto Dominance;
4:Compute Niche Count;
5:Assign Linearly Scaled Fitness;
6:Assign Shared Fitness;
7:fori = 1 to number of Generations do;
8: Tournament Selection;
9: Single-Point Crossover;
10: Uniform Mutation;
11: Evaluate Objective Values;
12: Assign Rank based on Pareto Dominance;
13: Compute Niche Count;
14: Assign Linearly Scaled Fitness;
15: Assign Shared Fitness;
16:end.
The first steps in the MOGA are to generate the initial population and to compute the values of optimization objectives. The next phase involves ranking based on the Pareto Dominance and assigning the fitness values using the niching technique. Fitness value expresses how “good” an individual is. It is a positive real value and, therefore, is often easier to use than the values of the objectives. The niching technique (also called the fitness sharing technique) is responsible for maintaining diversity in the population. To use the niching technique, the size of the neighborhood (niche radius) of each individual should be calculated first. Then, the linearly scaled fitness value of each individual is decreased proportionally to the number of individuals sharing the same neighborhood.
Using the obtained fitness values, the cycle of the evolutionary search starts with the following operators: selection, crossover, and mutation. The general functions of these operators are the following:
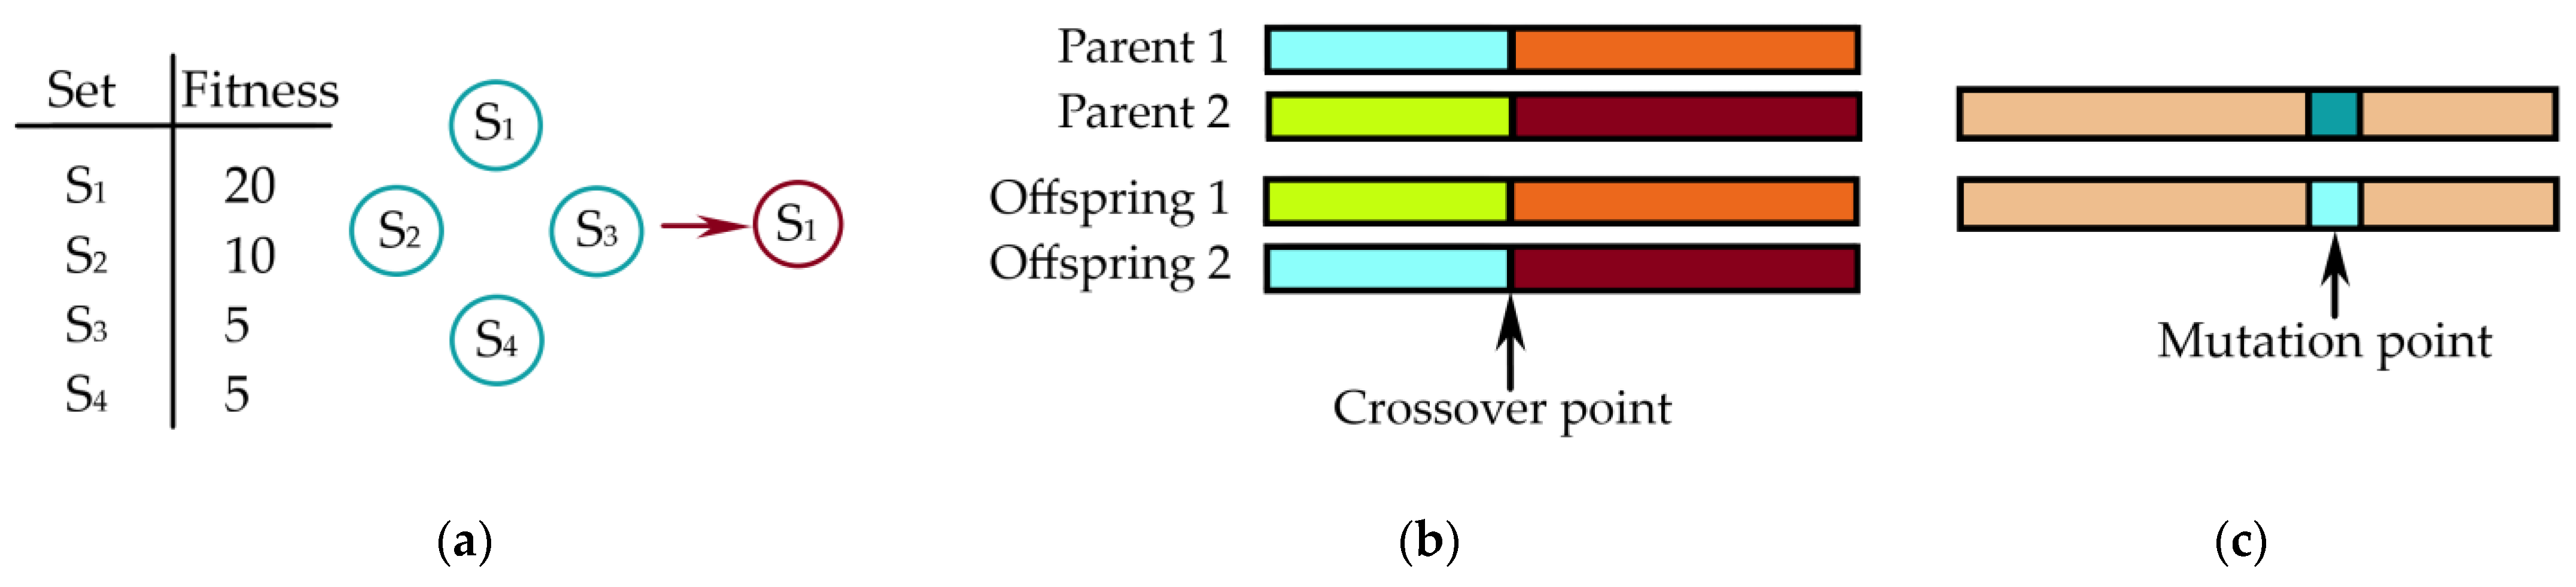
  • The selection operator selects individuals from the current population based on their fitness values; the selected individuals are called “parents”;
  • The crossover operator is applied to the “parents” to create new individuals called “offspring”;
  • The mutation operator broadens the search space by making changes in the current population; then, the “offspring” and mutated individuals form a new generation.
There are many types of selection, crossover, and mutation operators. In this optimization problem, the tournament selection, single-point crossover, and uniform mutation were used. Figure 4 illustrates the basic ideas of the applied operators [19].
The tournament selection acts in the following way: first, it randomly chooses four individuals from the population, and then picks the individual with the higher fitness value for using in the next generation. As for the crossover, it takes two individuals from the current generation and combines them at a random point. The uniform mutation takes an individual and selects one or more random mutation points (genes). Then, this operator replaces the values of the selected genes with a uniform random value between the upper and lower bounds defined for this gene.
After that, the new generation is formed and assessed using fitness values. In the next step of the procedure, the algorithm checks if a stop criterion is satisfied. If it is, then the algorithm stops working. Otherwise, it continues the cycle of creating new generations.
To date, the MOGA has been integrated to different computing environments, such as Matlab and Ārtap [25,26,27]. In this study, the MOGA was applied through the Matlab optimization toolbox.

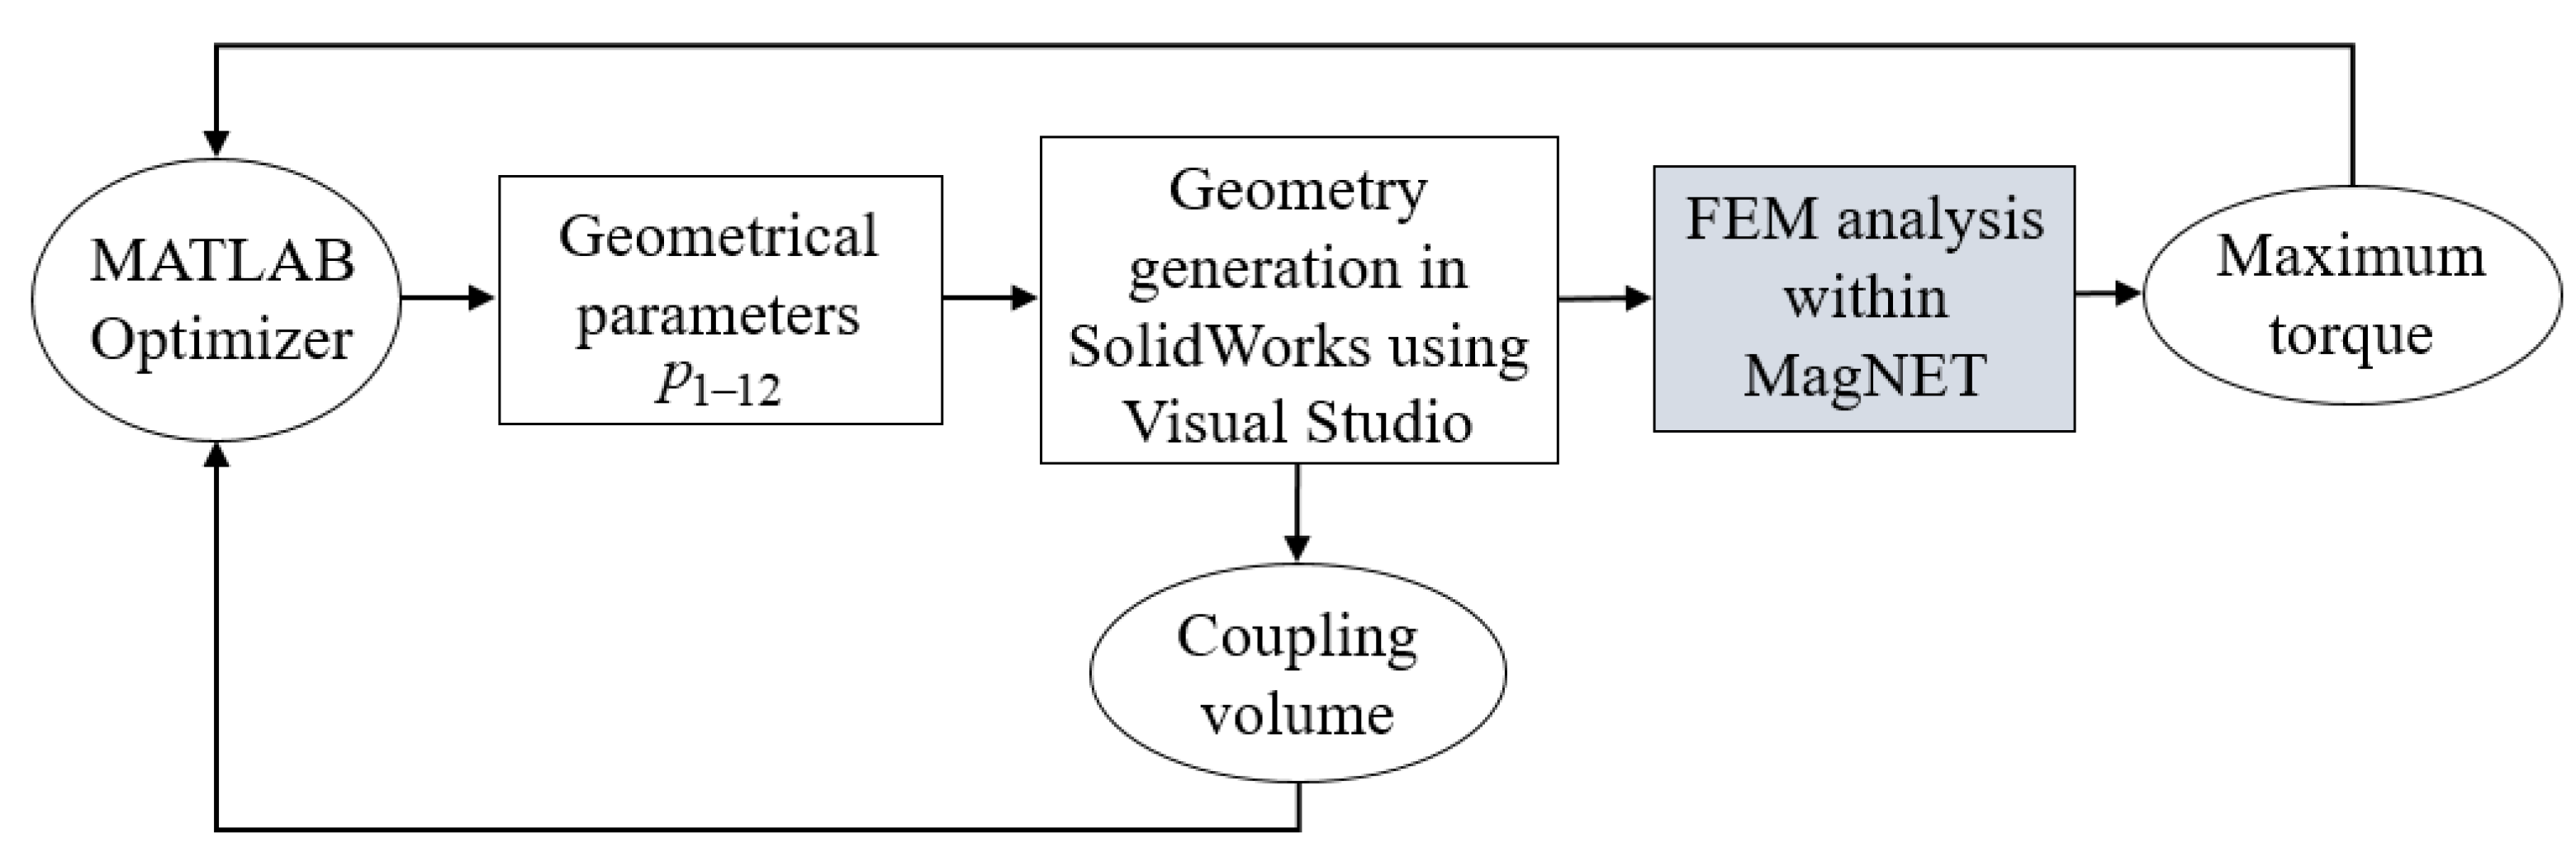
4.2. Optimization Method

The optimization was carried out using the procedure illustrated in Figure 5. The interaction between Matlab, SolidWorks, and MagNet software programs was organized within Visual Studio as follows. The optimization cycle started with a set of parameters defined by the GA within the Matlab optimizer. Then, these parameters were used to build a 3D model using SolidWorks. Once it was complete, MagNET calculated the maximum torque and directed it together with the coupling volume to the Matlab optimizer. Using the obtained values of the objectives, the Matlab optimizer refined the parameters, and the same cycle was executed until the stop criterion had been satisfied. The number of generations and individuals defined the stop criterion. Particularly, the optimization was performed with 30 generations constituted by 50 individuals. Consequently, the cycle was repeated 1500 times.

4.3. Simulation Results of the GA Optimization

The optimal design and the magnetic flux density distribution are presented in Figure 6. The figure shows that the coupling members were deeply saturated. For the driving member body, the average value of flux density |B| was near 0.83 T, and for the driven member it was slightly lower—about 0.78 T. The obtained values of the maximum magnetic torque and the volume are reported in Table 2. A significant reduction in the volume can be noticed from the table. However, no difference greater than 2% was observed in the torque value.
Overall, the GA showed constructive results; however, the execution time was quite high. Fifty hours were required to resolve the optimization problem.

5. Optimization Using Taguchi Method

5.1. Taguchi Methodology

The Taguchi method is a statistical method that discovers the parameter space to find a design with better performance. The parameter space in Taguchi’s terminology is called the orthogonal array. Essentially, the orthogonal array is a matrix that includes various combinations of optimization parameters. Each combination is called an experiment. The experiments should be carried out in a real test or simulation to obtain values of optimization objectives. A major advantage of the Taguchi method is that the procedure of forming the orthogonal array ensures the minimization of experiment quantity.
In the Taguchi method, once the orthogonal array is formed, the experiments are carried out, values of optimization objectives are obtained, and analysis of the results starts. Essentially, this analysis intends to reveal the effect of the optimization parameters and their levels on the objectives using average peak-to-peak values of the objectives.

5.2. Conducting the Taguchi Experiments

Within this study, a standard L50 orthogonal array was used. It included fifty experiments that involve eleven parameters with five levels and one parameter with two levels. The parameters and their levels are listed in Table 3.
The experiments were carried out using MagNET software. The obtained values of the magnetic torque and the volume were organized into the cost function:
f = τ V
To find the best combination of parameters levels, the mean values were calculated and analyzed. The mean values of the objectives and the cost function were as follows.
m V = 1 50 k = 1 50 V i = 1.98 10 6 m 3 ,   m τ = 1 50 k = 1 50 τ i = 75.0 10 3 Nm , m f = 1 50 k = 1 50 f k = 3.79
Then, the average peak-to-peak values of the cost function were calculated for each factor at each level:
m i j ( f ) = 1 n f ( i , j ) ,
where i is the parameter number, j is the level number, n represents the number of experiments, and f(i,j) denotes the value of the objective function for experiments that involved the parameter i at the level j. Figure 7 shows the average peak-to-peak values depending on the parameters and parameters’ levels.
As can be seen, the parameters combination [p12, pi5,] i = 2…12 gives the minimum value of the cost function. The optimal design provided the value of the magnetic torque of 75.0∙10−3 Nm and the value of the volume 1.91∙10−6 m3.
The last step of the Taguchi optimization is the analysis of variance (ANOVA). Using the sum of squares ss, the effect of each parameter on the objective function was computed:
s s i j = n ( m i j m f ) 2 ,
It can be seen from Table 4 that the influence of the parameters on the cost function was nearly equal. Only the parameters p6 and p12 made the exception. This might be because the saturation of the disks near these points was the smallest for all the designs.

5.3. Simulation Results of the Taguchi Optimization

The optimal design of the coupling was obtained by the Taguchi method. The corresponding geometry and the magnetic flux distribution are shown in Figure 8. Closer inspection of the figure reveals that the bodies of the driving and driven member were highly saturated. For the driving member body, the average value of flux density |B| was near 0.86 T, and for the driven member, it was slightly lower—about 0.8 T. Table 5 compares the magnetic torque and volume values of the initial and optimal designs. Using the Taguchi optimization method allowed us to reduce the volume by 17% and to enhance the torque by 2.2% compared to the initial value.

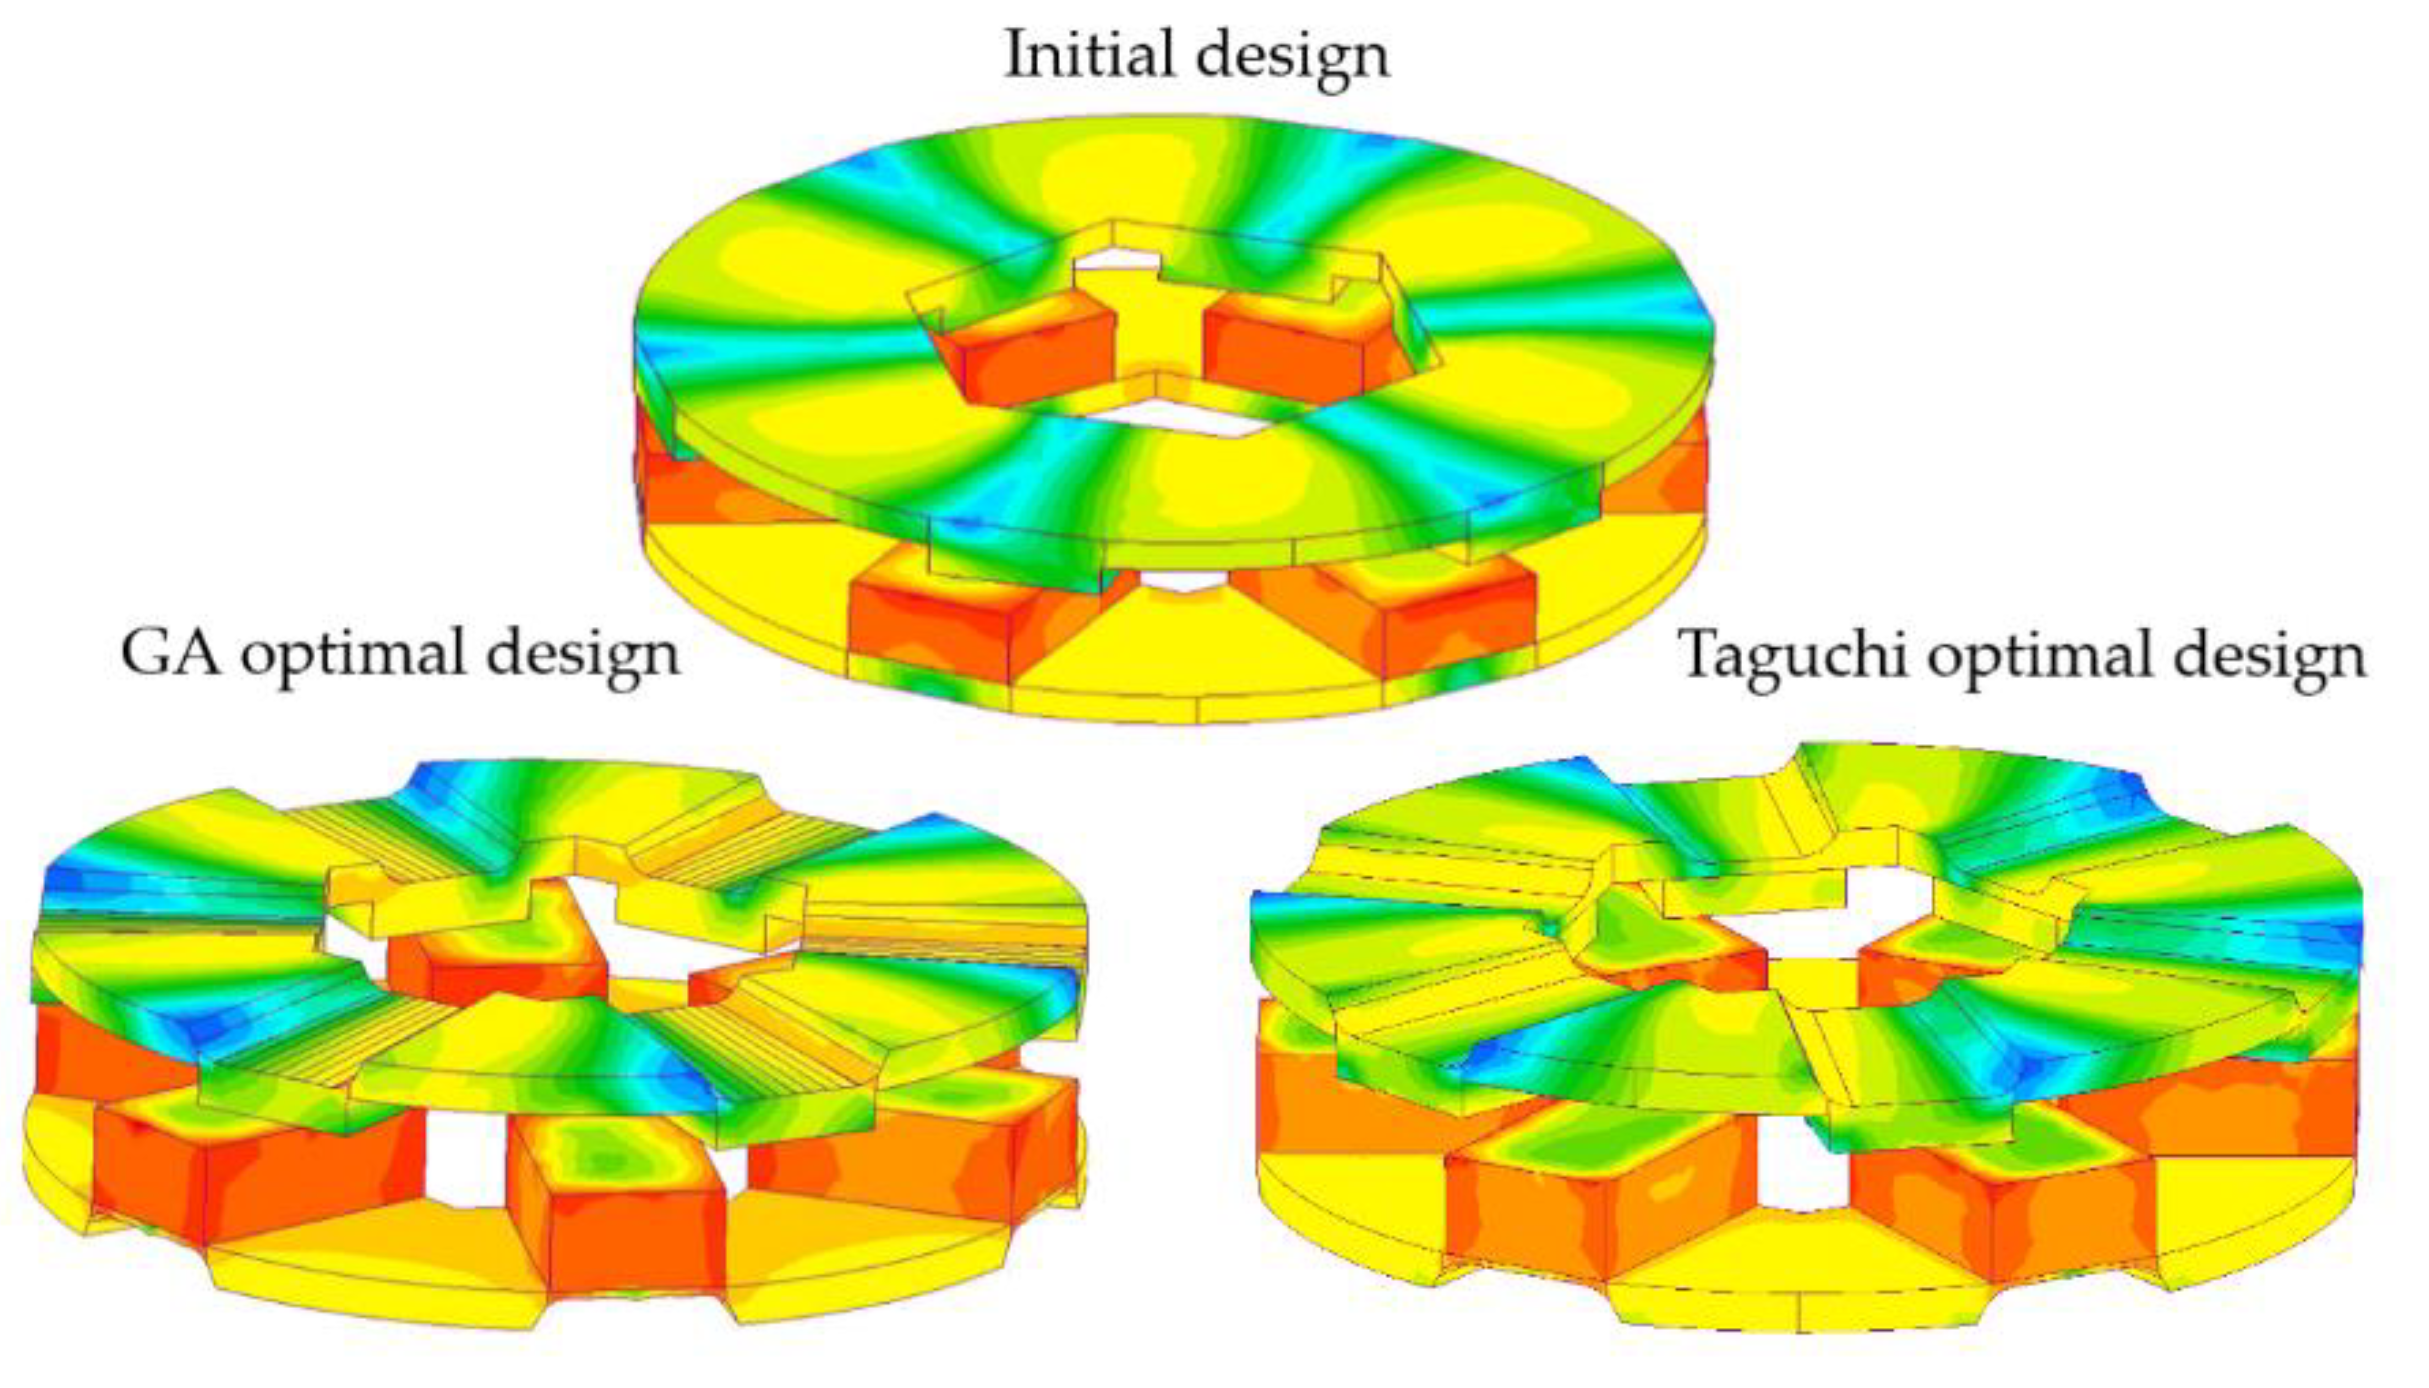
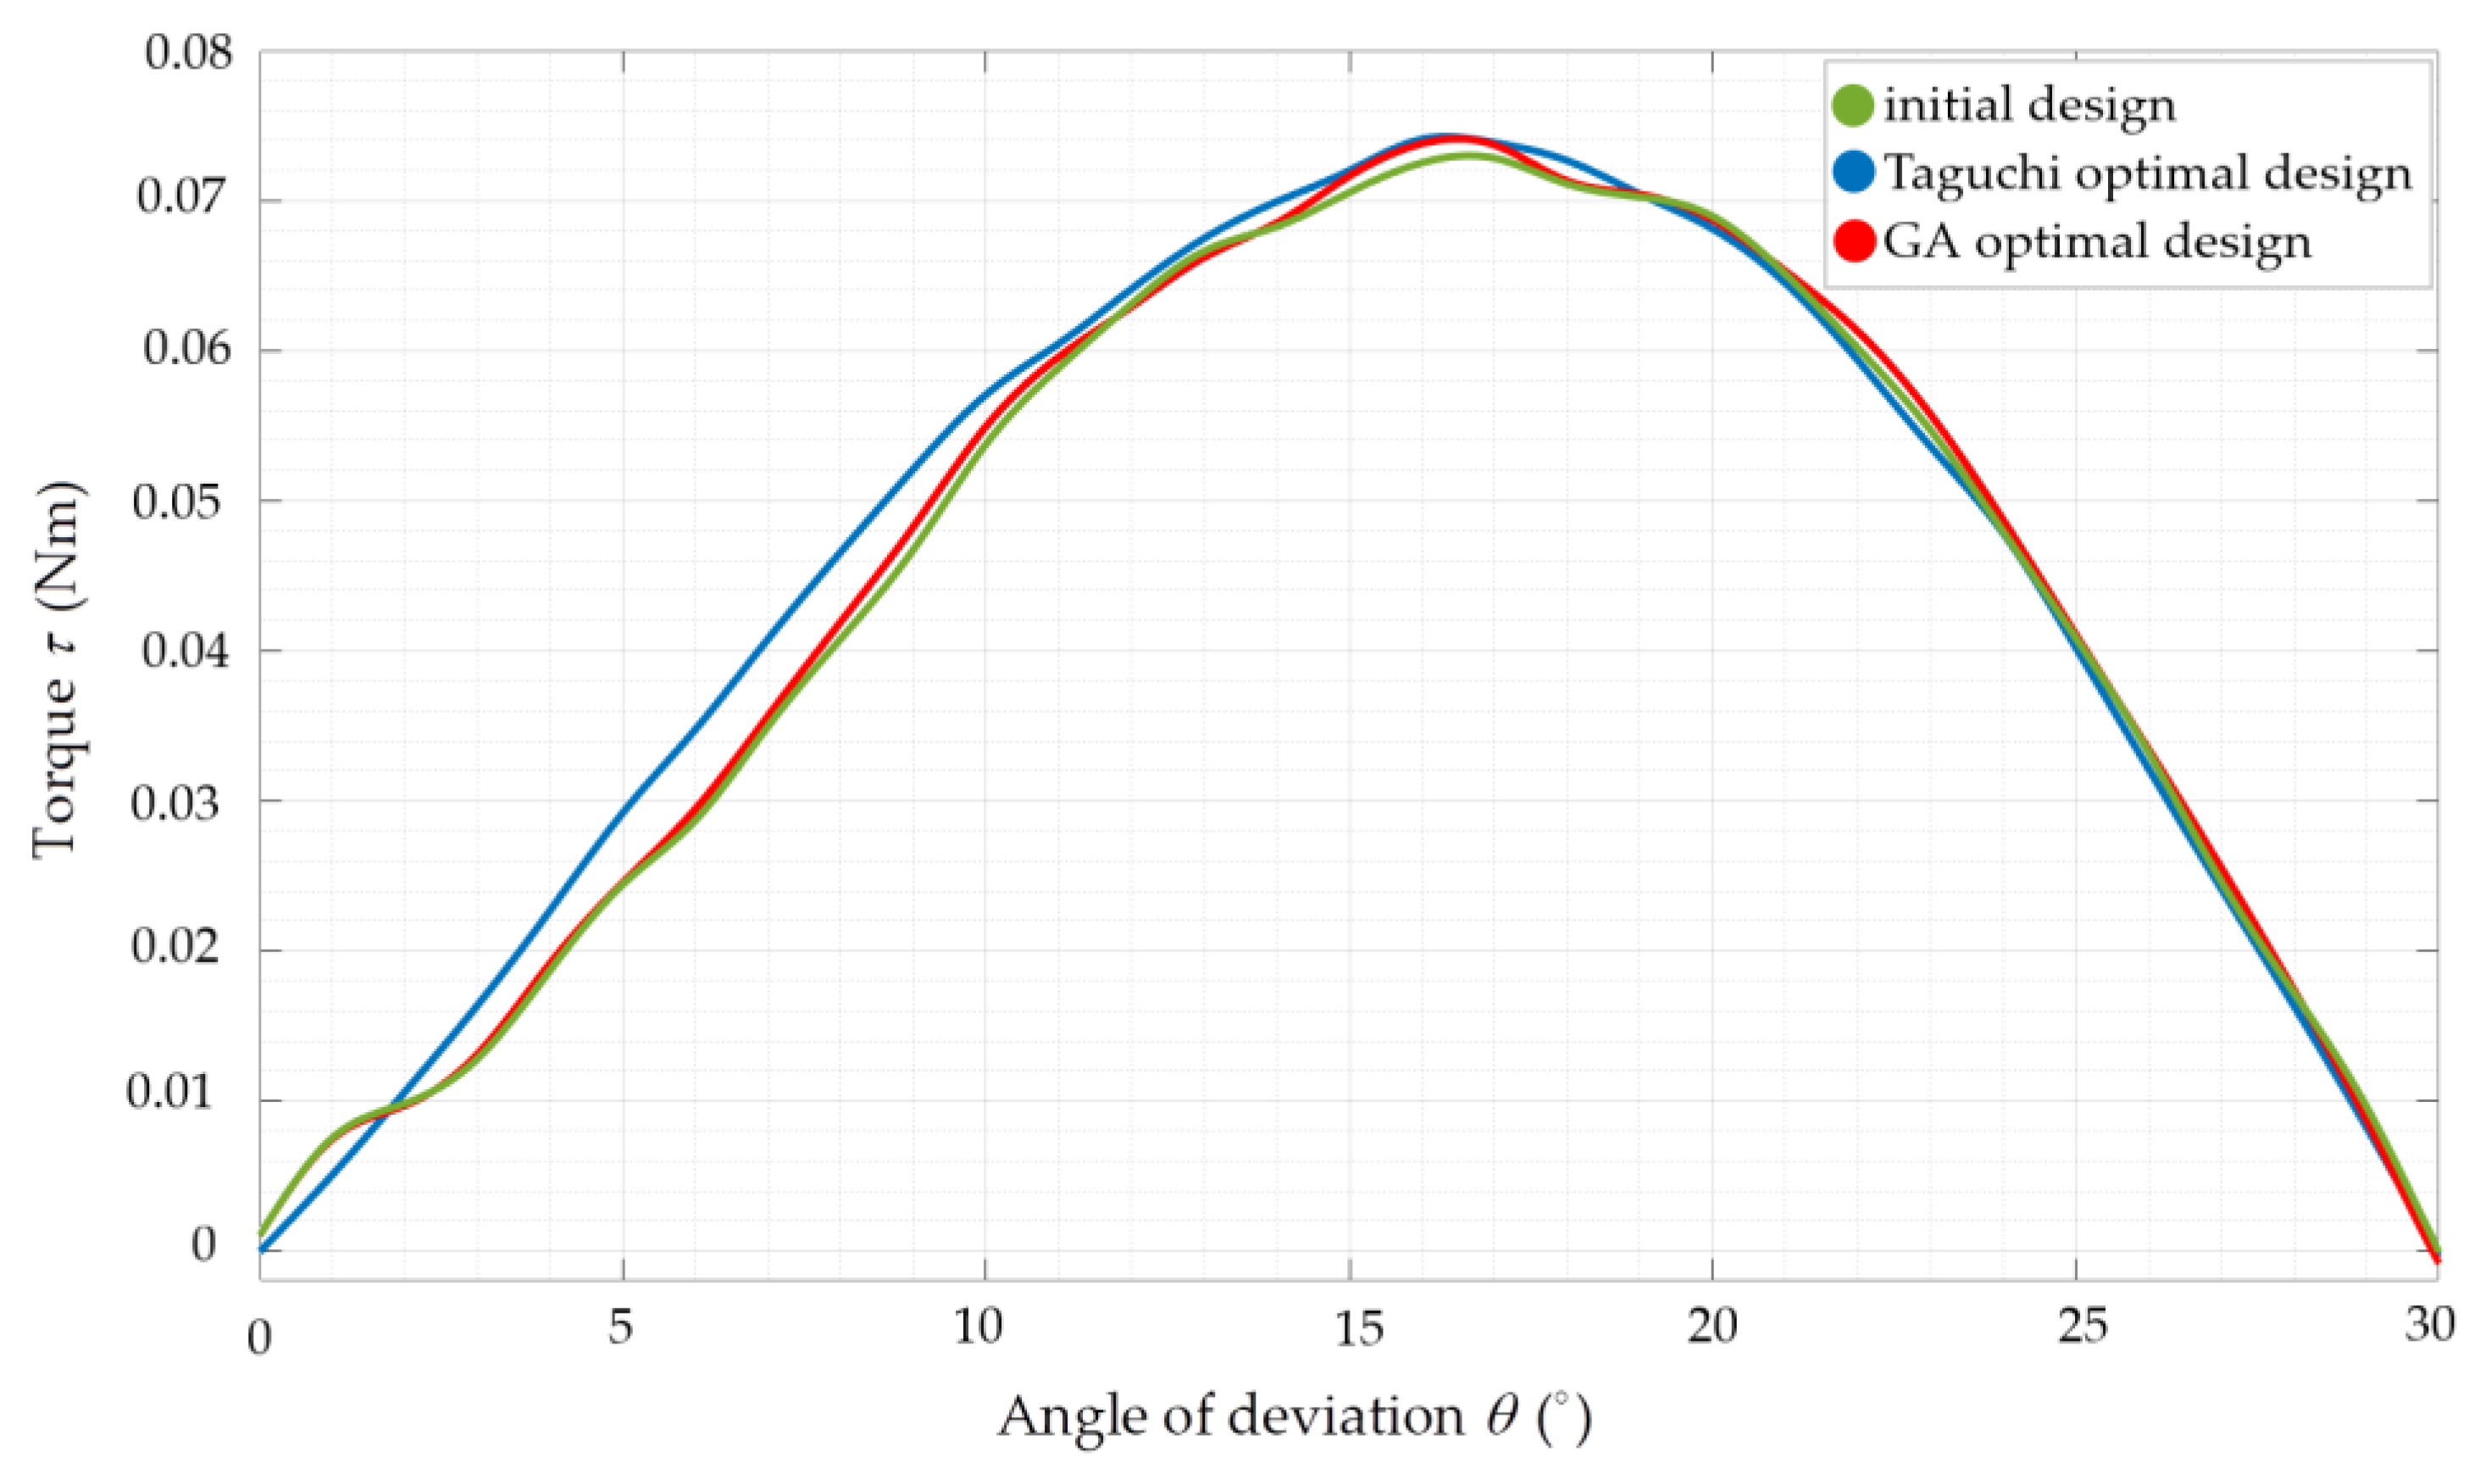
6. Comparison of the Simulation Results of the GA Optimization and the Taguchi Optimization

The designed PM couplings were compared in terms of the volume, magnetic torque, and magnetic torque density. The highlighted characteristics of the couplings are listed in Table 6. It is apparent from this table that the optimal designs showed a considerable improvement in the magnetic torque density—more than 20%. Similarly, the volume of the coupling disks was significantly reduced using both optimization methods. However, only a slight increase in torque was found after optimization—about 2%.
The 3D models of the initial and optimal designs are presented in Figure 9. Additionally, Table 7 provides the thickness values of the disks at the optimization parameters points locations. A comparison of the GA and Taguchi designs reveals that the obtained geometry and volume of the PM coupling were identical. Similarly, the maximum value of the magnetic torque, as well as the magnetic torque density, were quite close for both designs.
To provide a more comprehensive comparison of the coupling designs, the dependence of the magnetic torque on the deviation angle θ was explored. Figure 10 illustrates the approximated results of the simulations. As can be seen from the figure, the torque curves of the optimal and initial designs were quite close. Yet, the variation of the torque in the Taguchi design was more stable in the region of θ change from 0° to 5°.
Moreover, the Taguchi optimization method was considerably more effective in terms of time consumption. Particularly, the GA optimization was performed within 50 hours, while the Taguchi method required just 1.5 hours of calculations. Therefore, these results taken together indicate that the Taguchi optimization had better performance compared to the GA in the scope of PM coupling optimization.

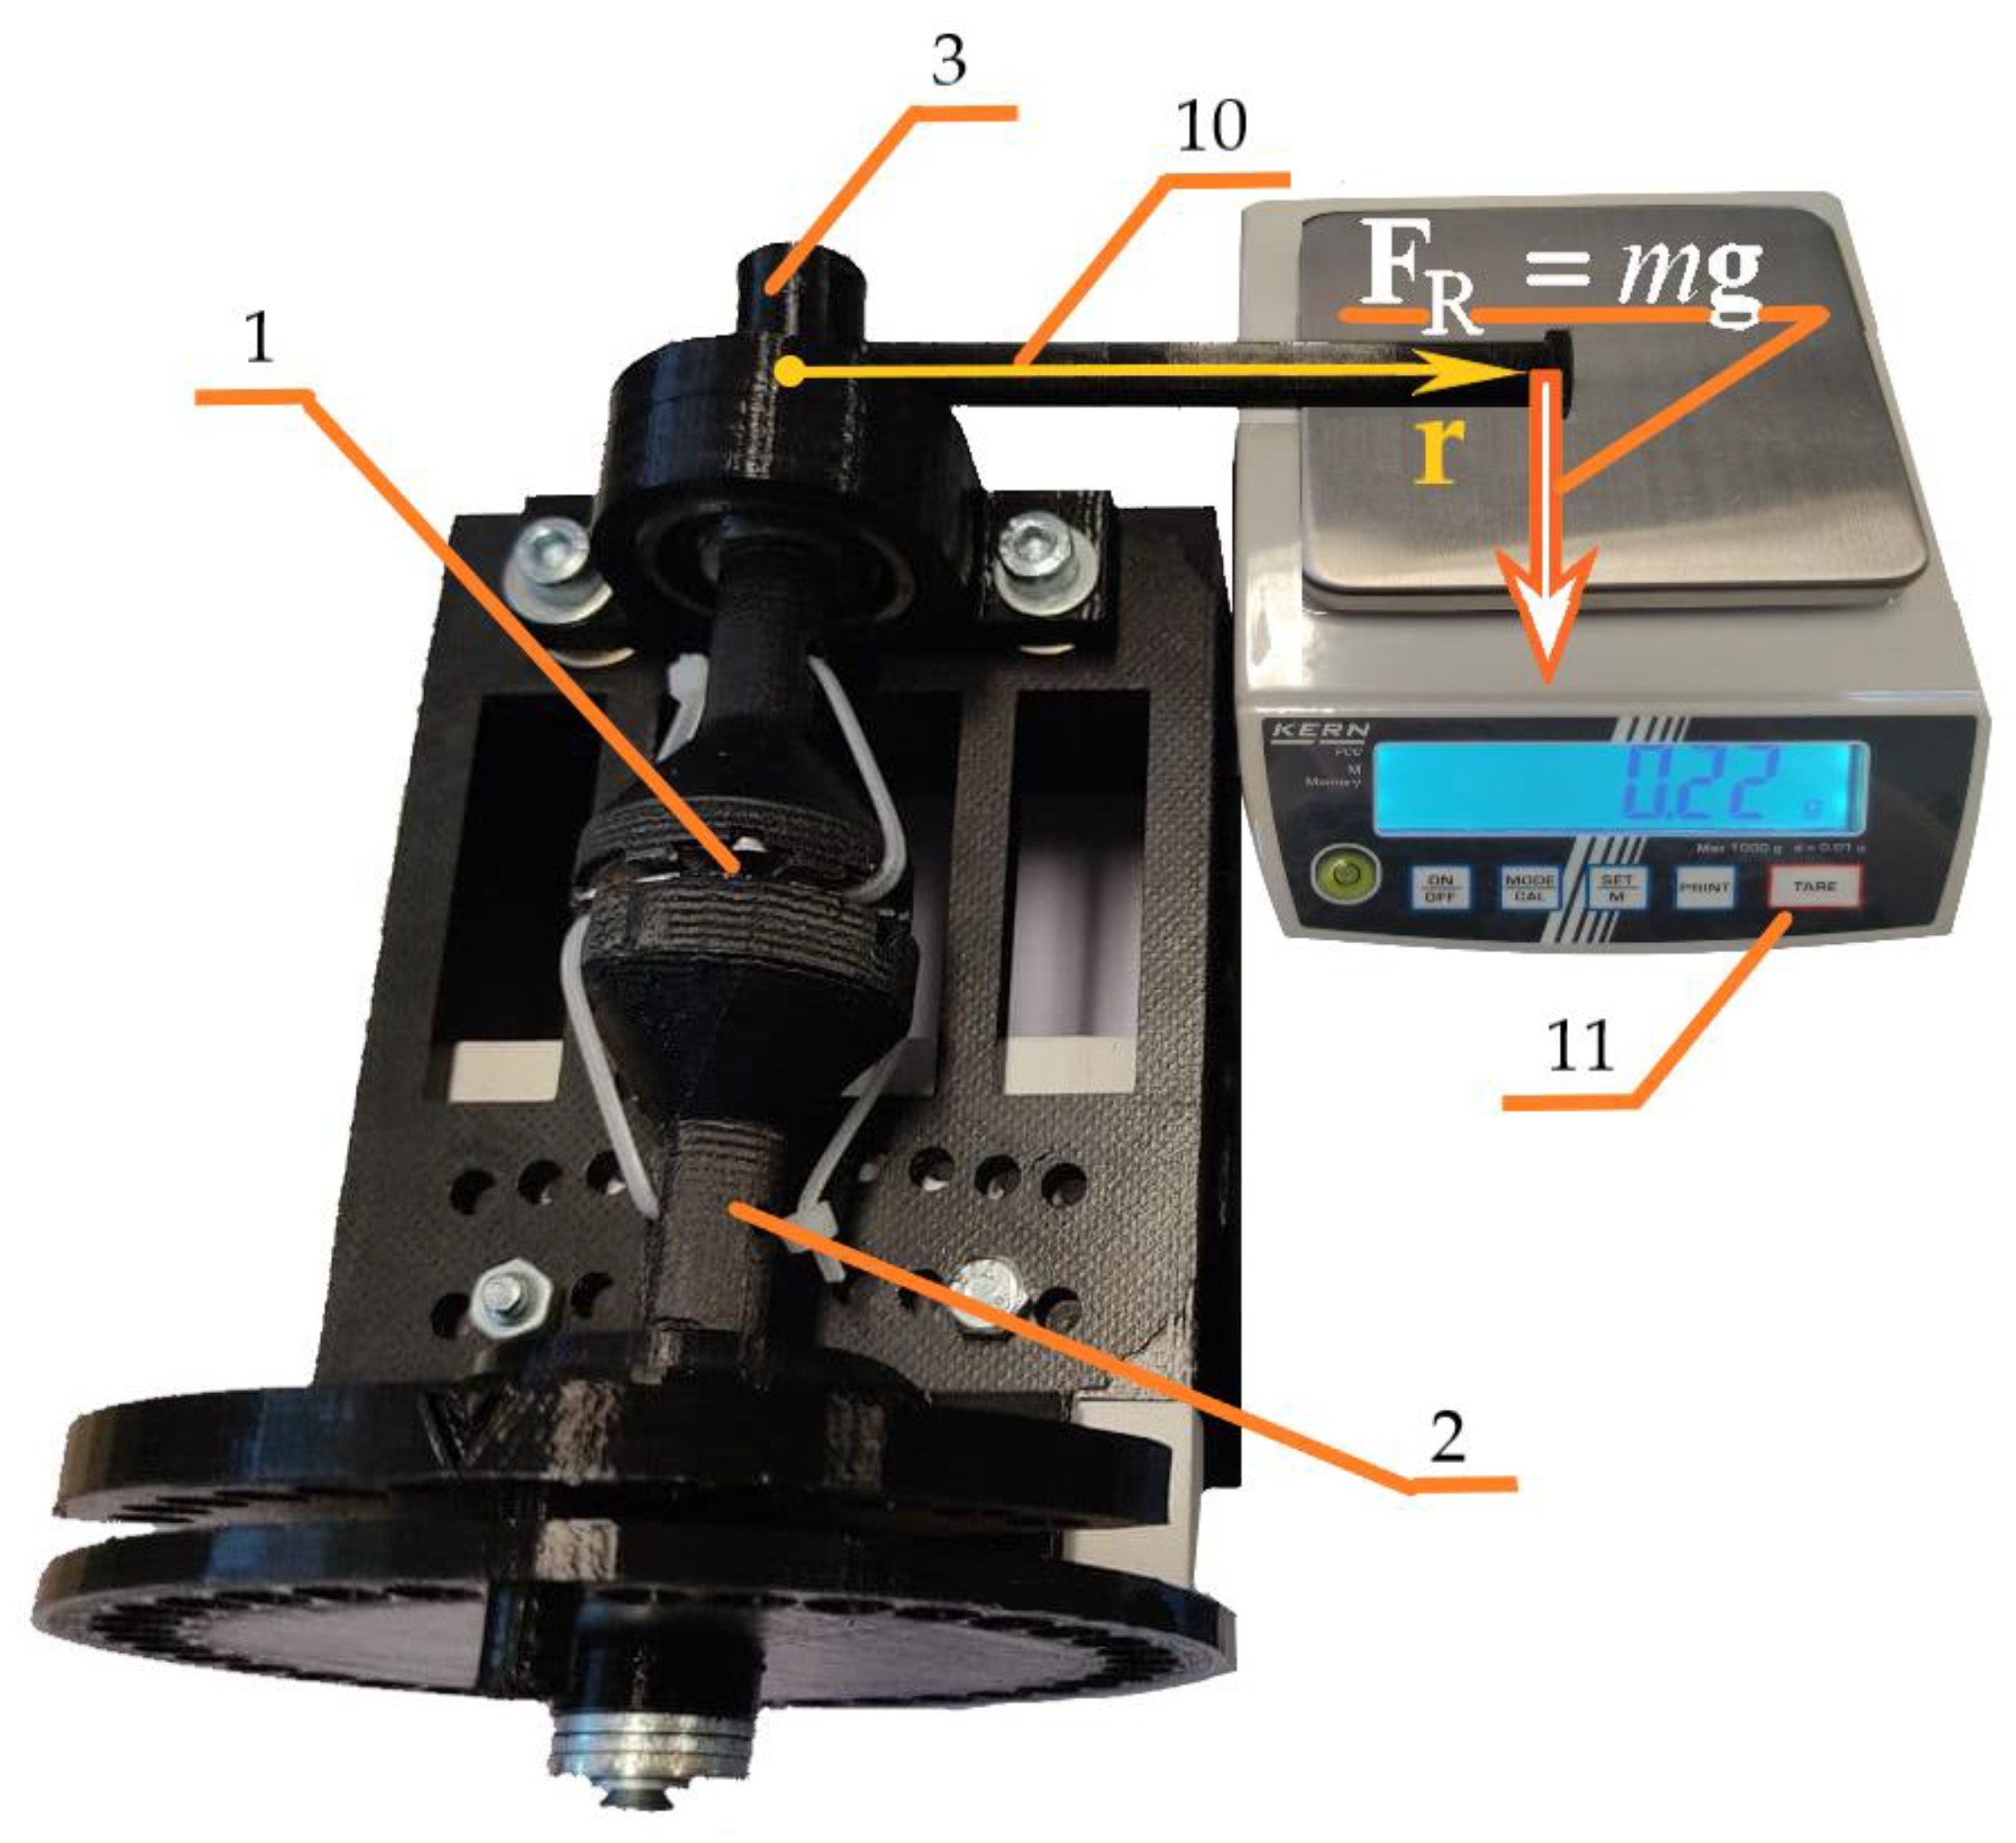
7. Experimental Setup
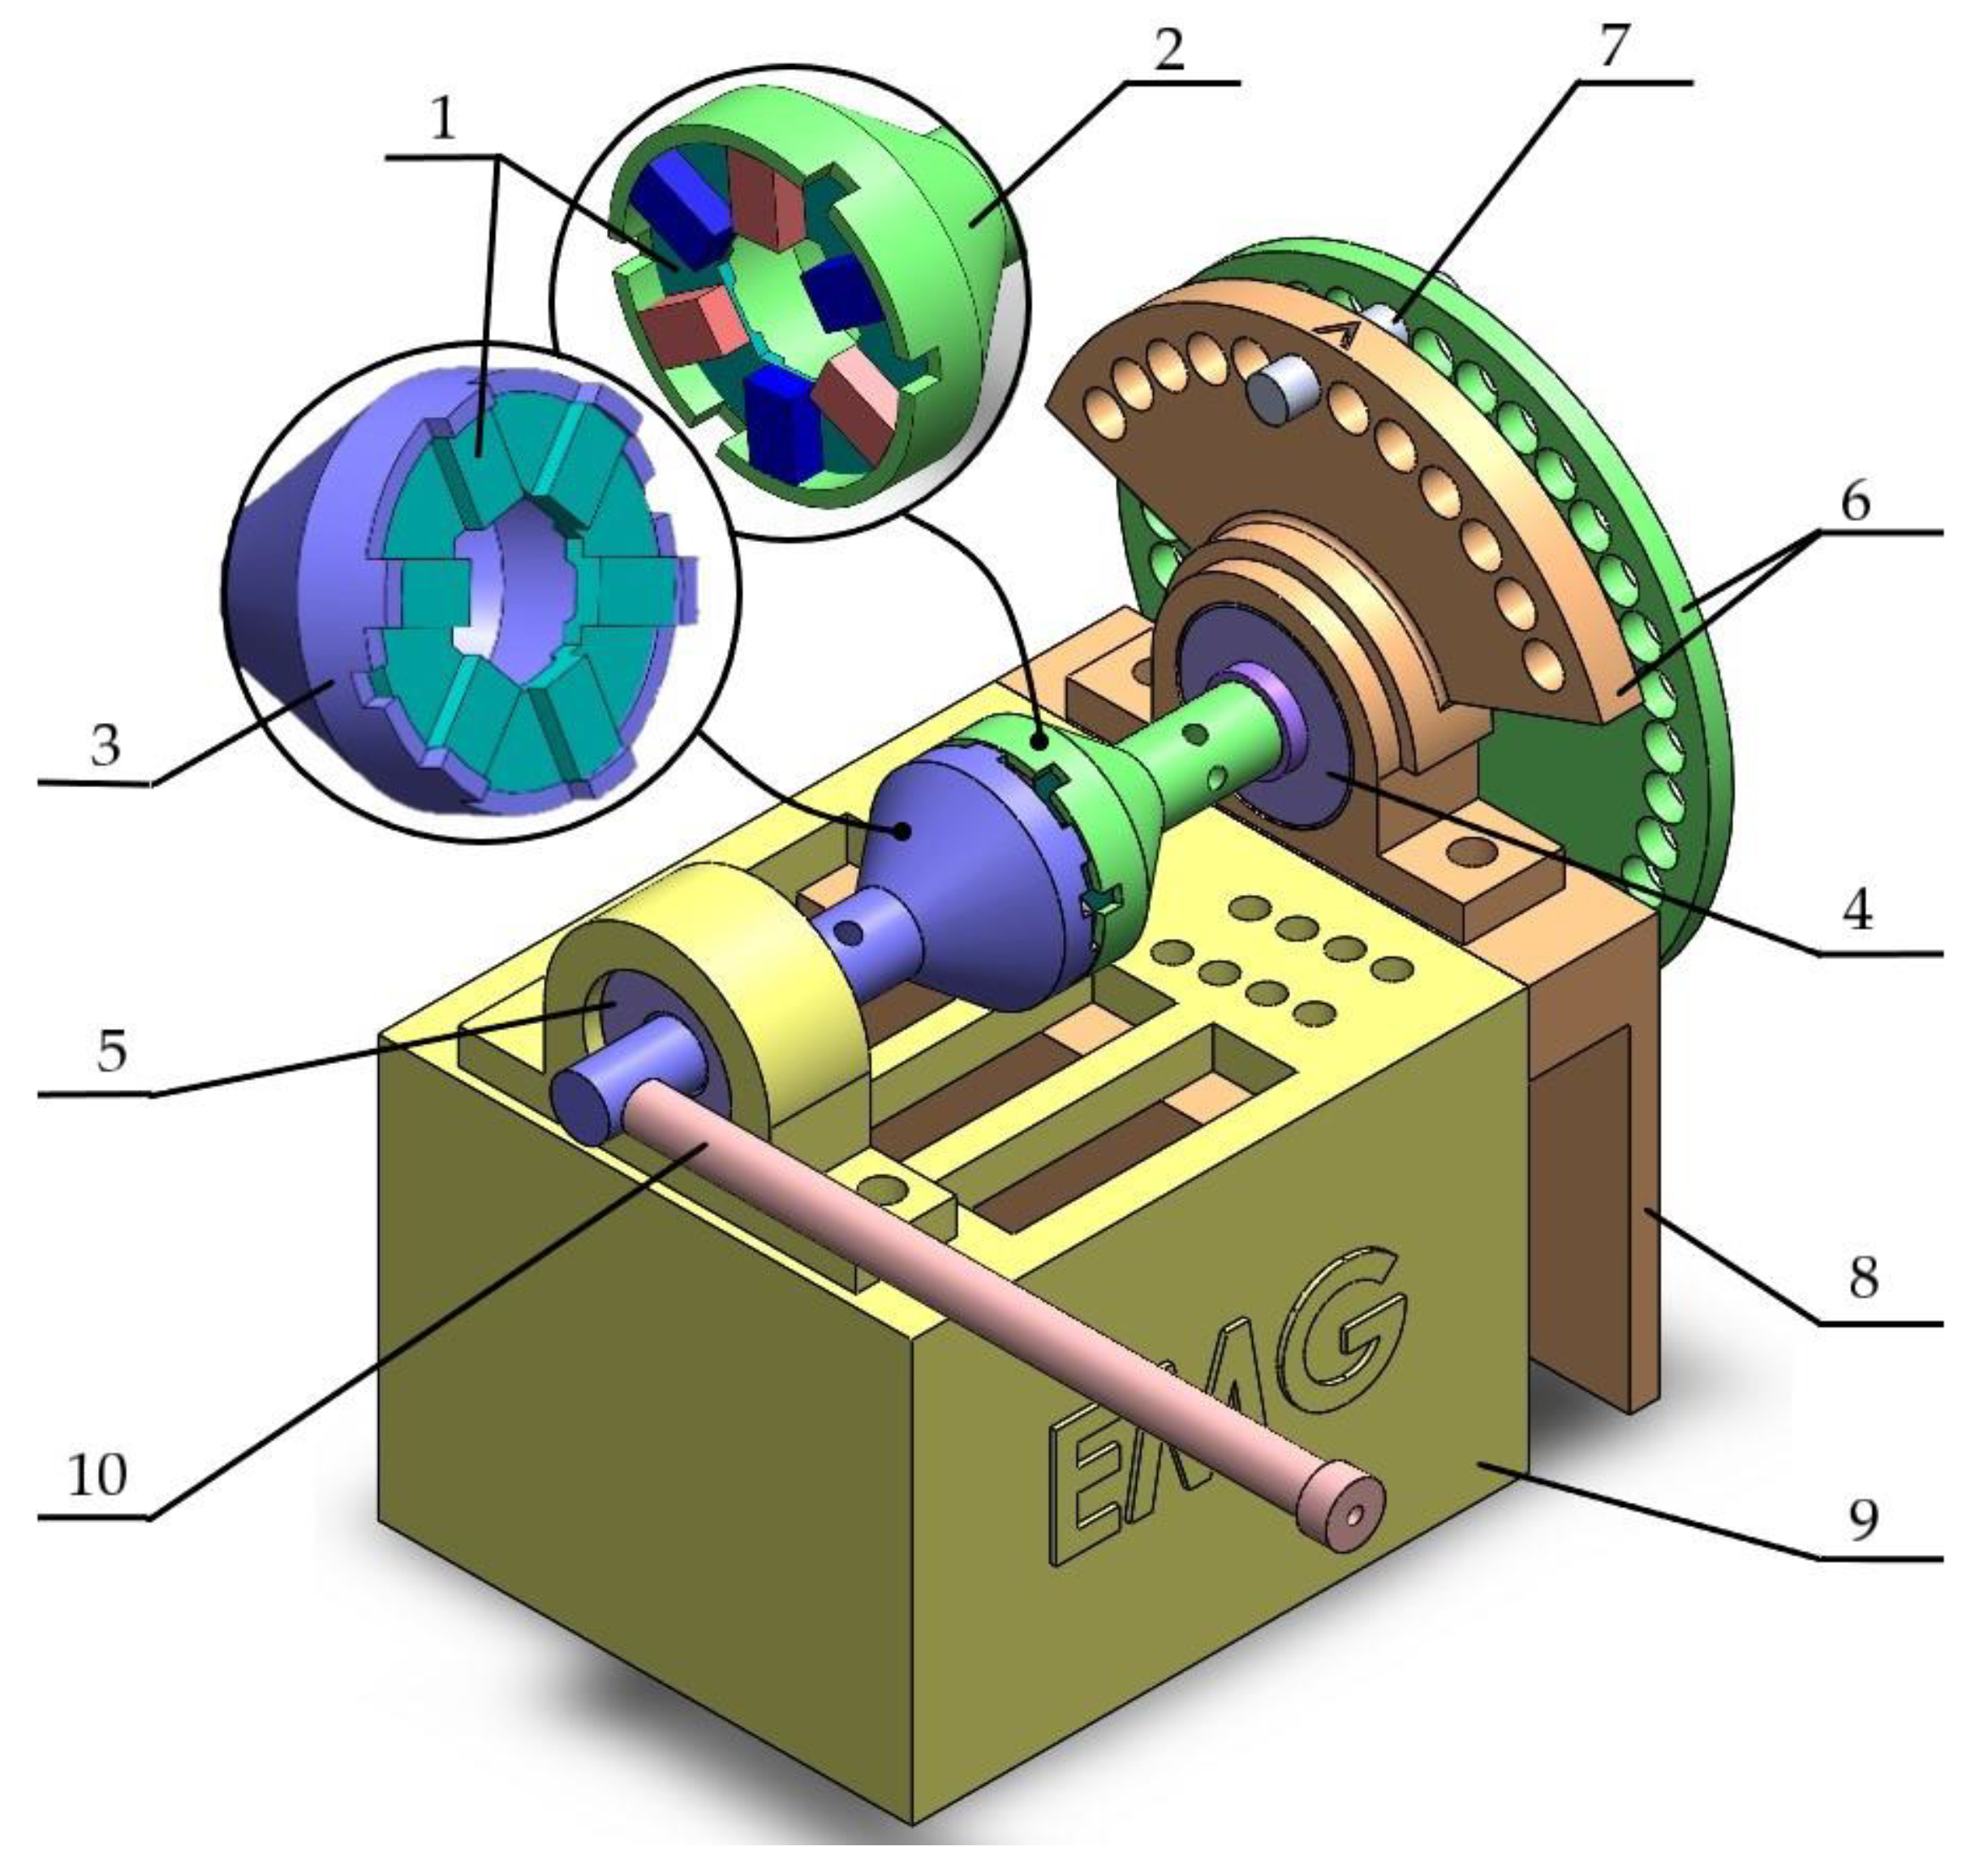
7.1. Test Bench

To validate the performance of the coupling, an experimental setup was designed. First, the initial design of the coupling was printed from electrical steel with 6.5% silicon content by selective laser melting printing [28]. Similarly, the Taguchi optimal design was manufactured. Three-dimensional printed prototypes are presented in Figure 11.
The second step was to construct a test bench with an adjustable air gap and ability to measure the torque in various relative positions of the coupling members. Figure 12 illustrates the experimental design of the coupling together with the designed setup for the test. The driving and driven disks were inserted into two shafts which hold them in a certain position. The shafts were supported by a pair of angular contact ball bearings. The bed components were designed in such a way that the air gap could be regulated. Particularly, the following values of the air gap could be selected: 1, 1.5, 2…3.
Moreover, a mechanism was proposed to vary the angle of deviation between the driving and driven member. As shown in Figure 12, the mechanism included three elements: two disks with holes and one stick. The green disk was placed on the driving member shaft and could be rotated. The beige disk was placed on the support and fixed. The green disk was divided into 36 sectors with the step of 10°. The beige disk was divided into 12 sectors with the step of 11°. In each sector of both disks, a hole was placed to adjust the angle θ with the step 1° using the stick. All components were printed from PLA material using a 3D-printing machine.
The implemented setup was prepared for measuring the torque on the driven member shaft. Utilizing the scale provided the measurement basis for the setup (see Figure 13). In this test, the rotation of the driving member shaft induced torque on the driven member shaft. The last one had the arm, which was in contact with the scales. Essentially, the scales here acted as a measuring device of the force produced by the arm FR. This force had a particular relation with the torque described by Equation (9).
τ = F R × r ,   r = r sin ( φ ) ,   F R = m g ,   φ = π / 2     τ = F R r ,
where the constant r is the length of the arm, θ represents the angle of deviation between coupling members, and φ implies for the angle between vectors r and FR.

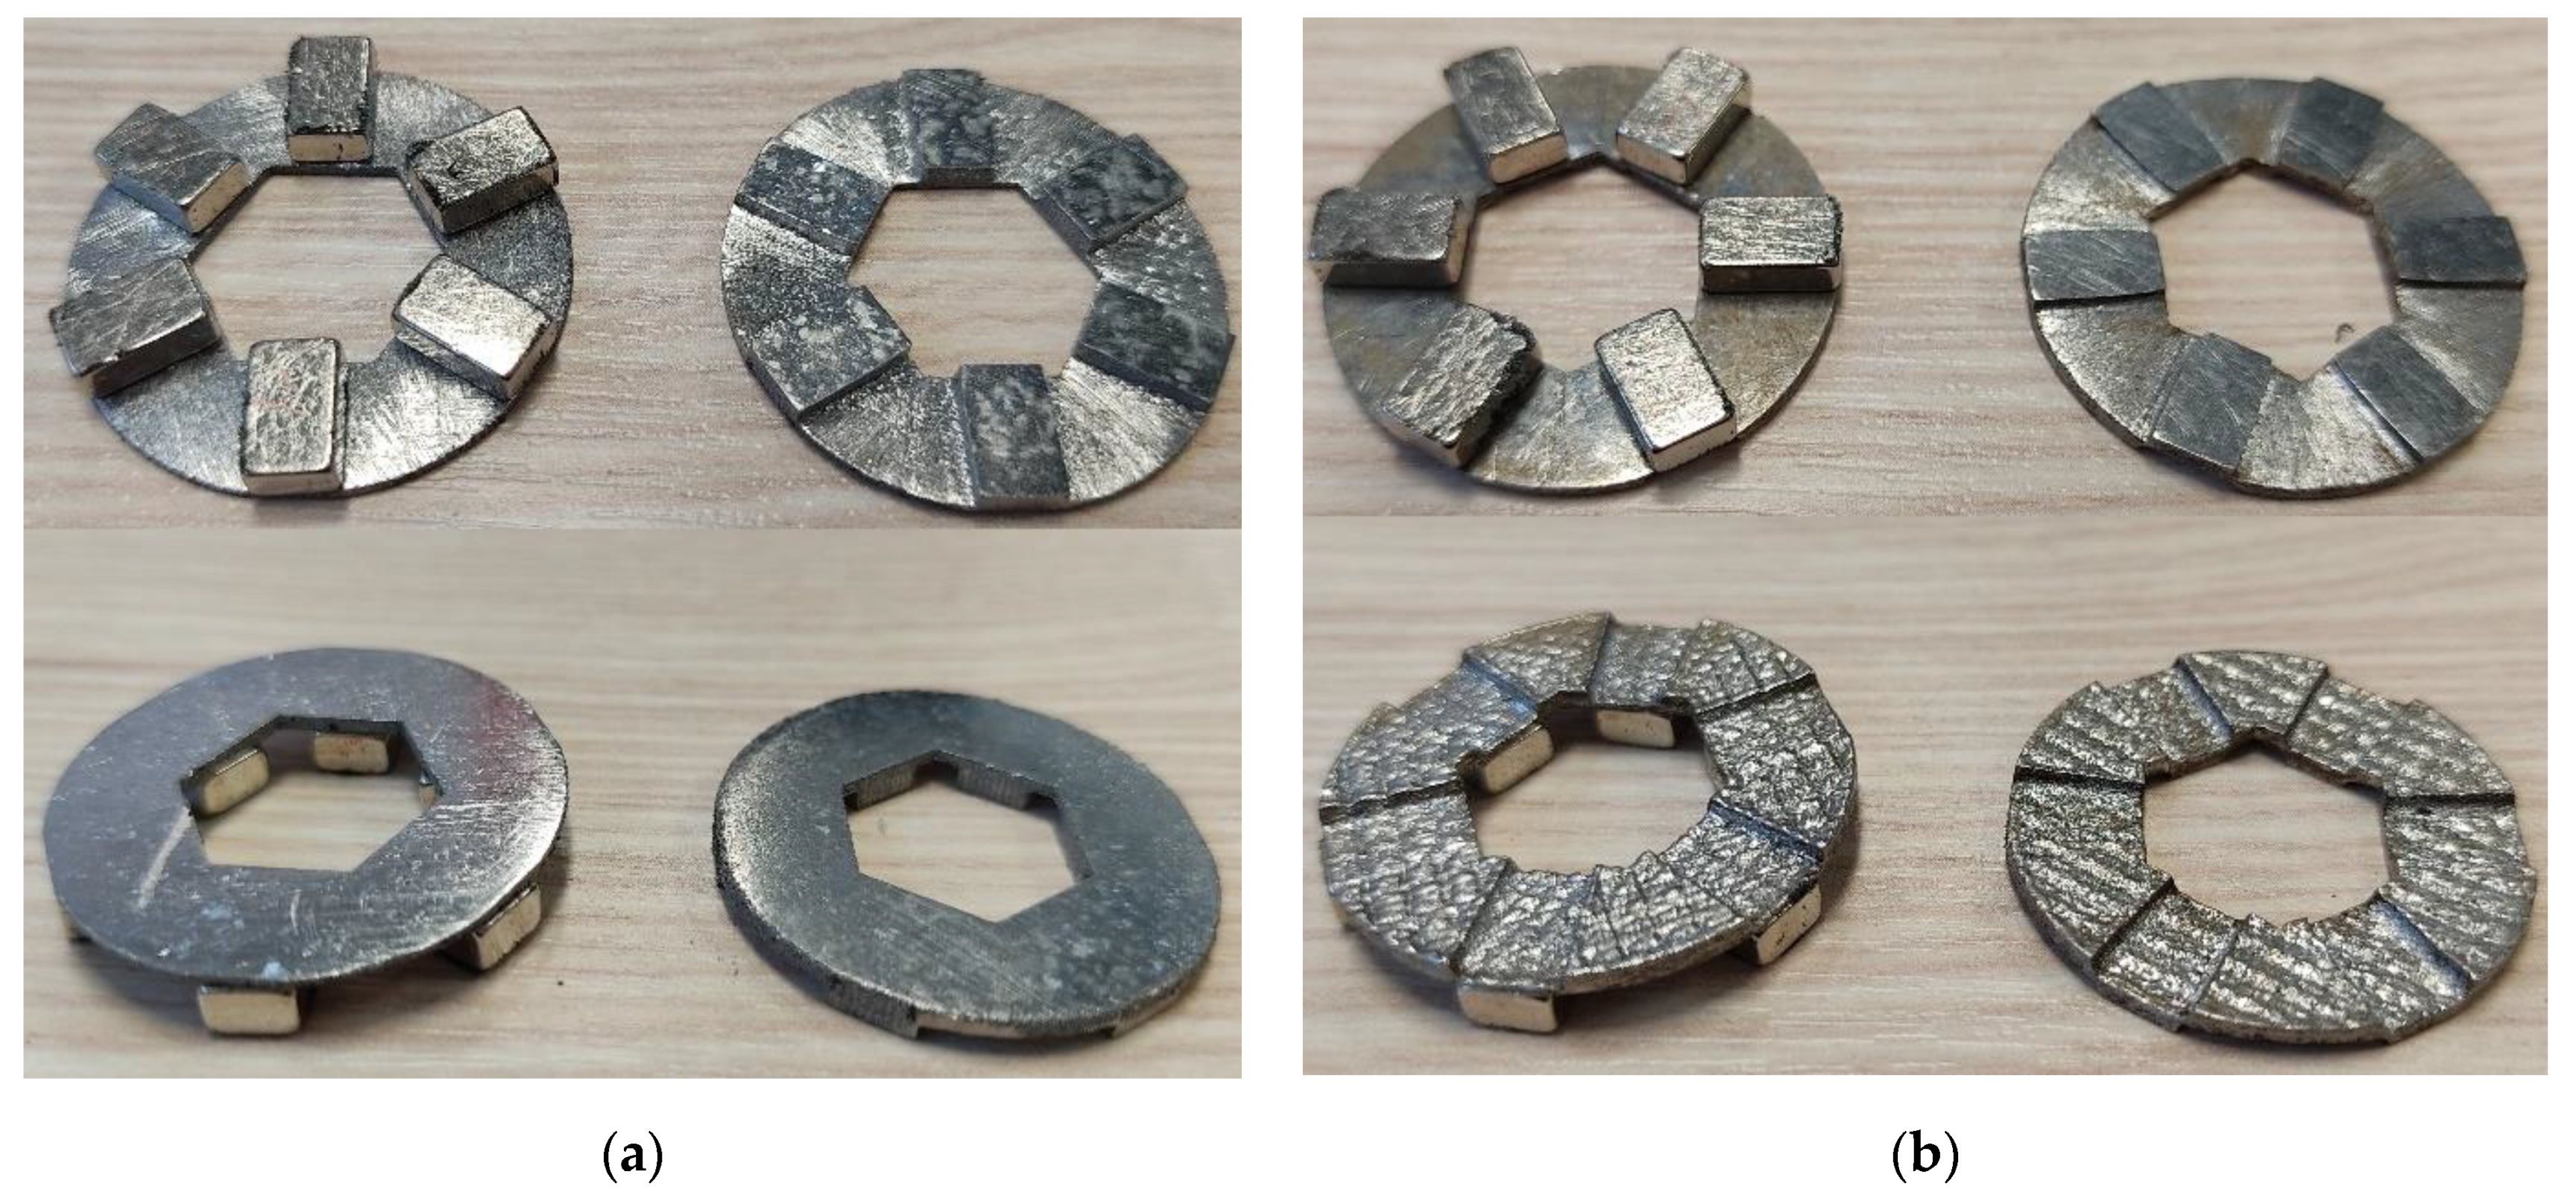
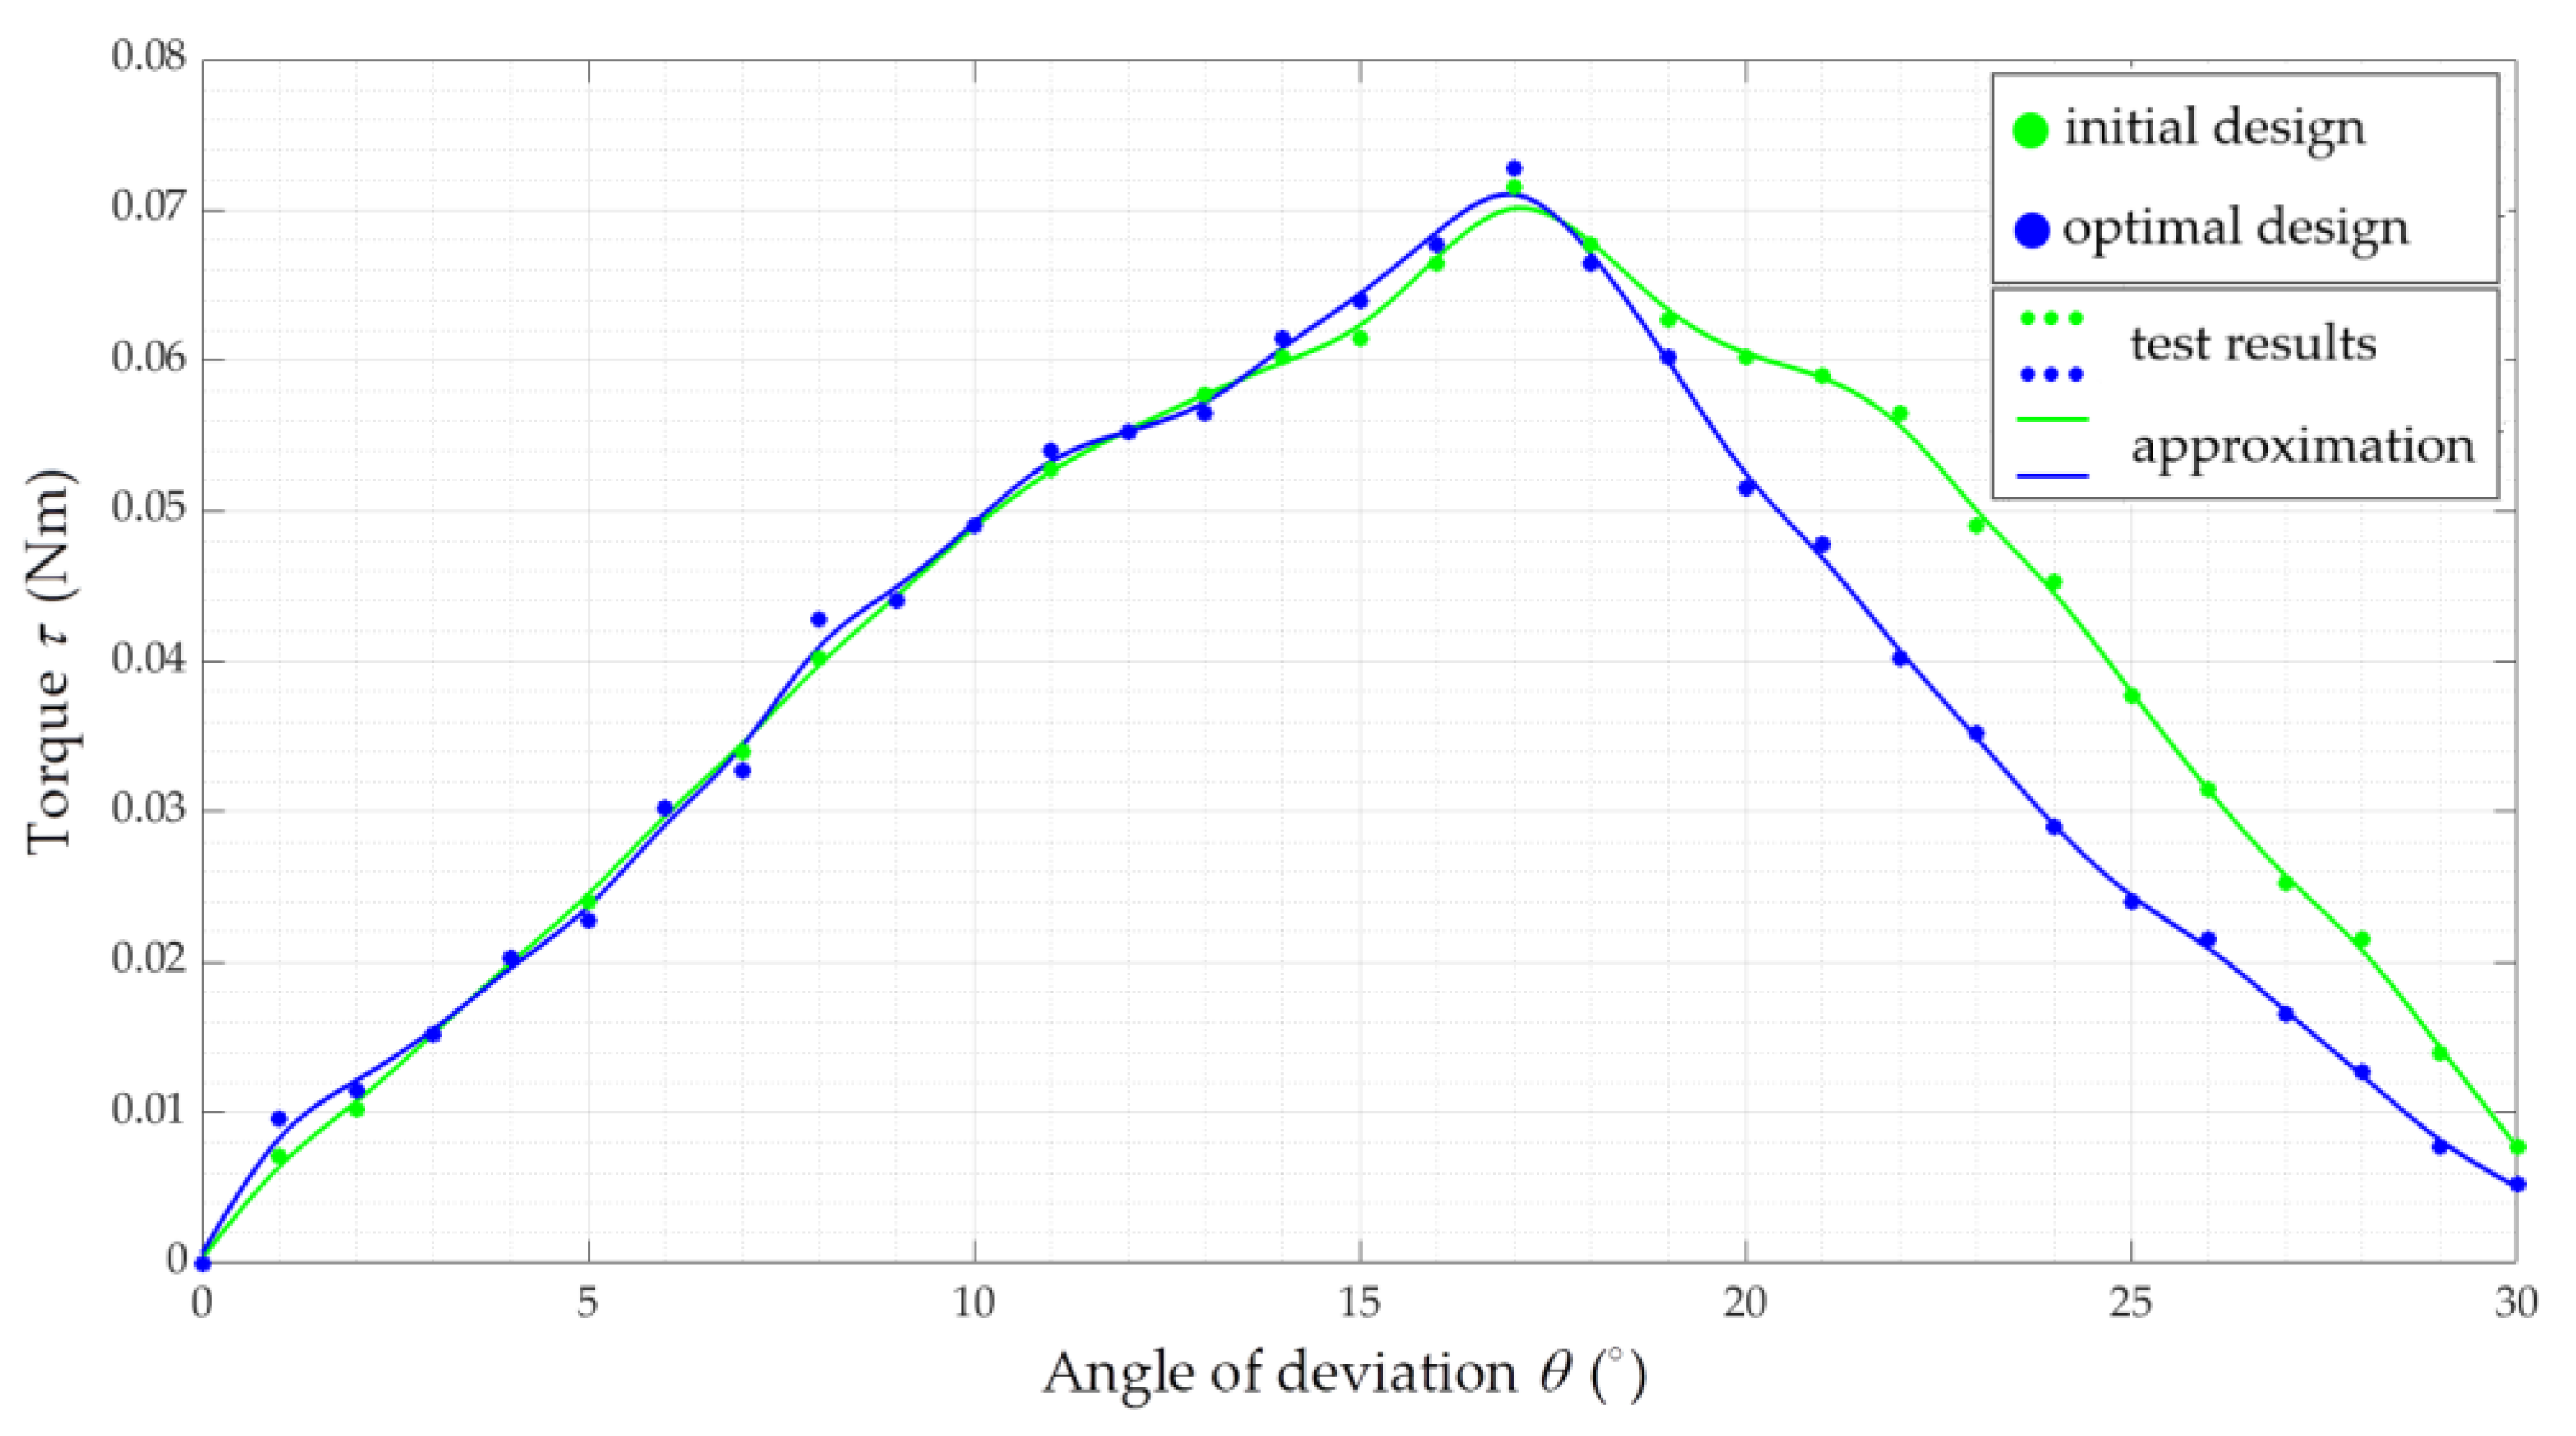
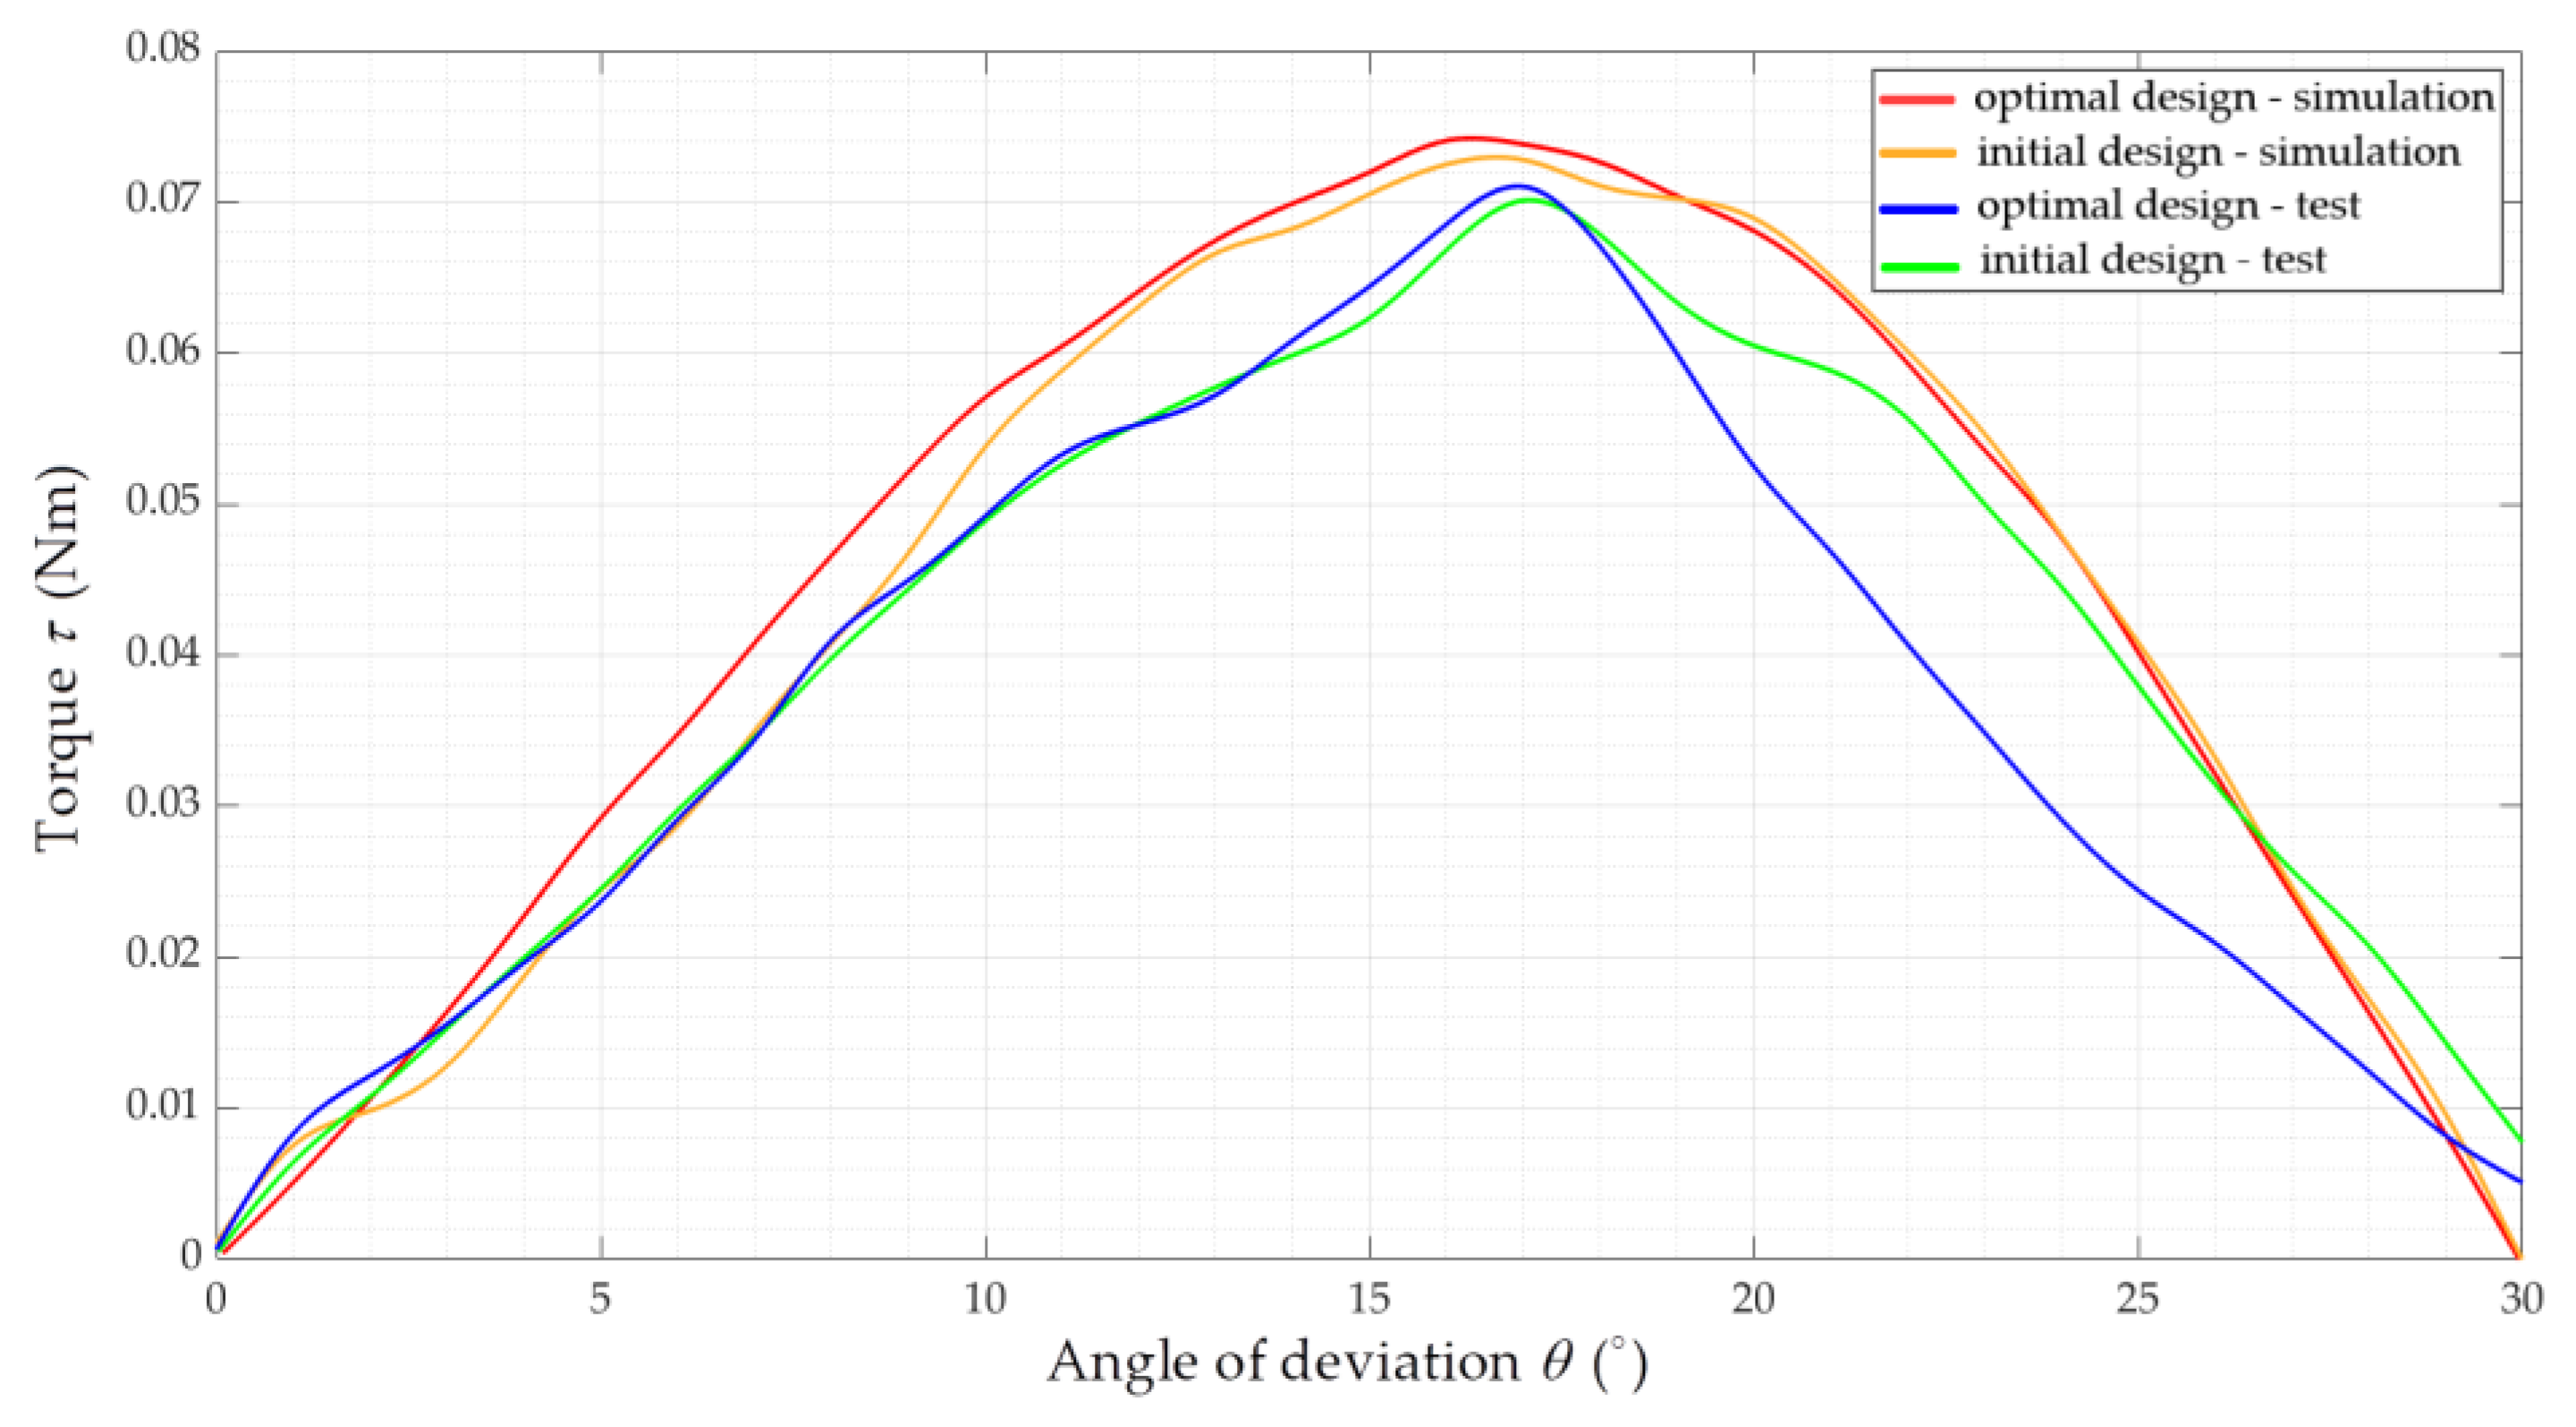
7.2. Experimental Results

To certify the optimization results, the initial and optimal designs were tested and compared. Each design was tested four times, and the means of the torque values were used for further analysis. Figure 14 provides the experimental data on the initial and optimal designs together with the data approximation. Particularly, the graph shows the relation of the torque, induced on the driven member shaft, and the angle θ. It can be seen that the curves were quite close within the change of the deviation angle from 0° to 17°. Yet, there was a slight difference in torque values of initial and optimal designs at the point of the torque maximum (θ = 17°).
Additionally, Figure 15 summarizes the results obtained from the simulation and the experiments. The figure shows that the simulation and test curves were adjacent within the change of θ from 0° to 7°. However, around θ = 7°…17°, the torque, obtained from the test, was slightly lower. Moreover, it should be noted that the experimental curves appeared to be steep which indicated the rapid torque change. An explanation might be that the measured torque was not only dependent on the coupling design but also experienced the influence from the setup structure and the bearings. Additionally, the accuracy of the scales, used for measuring the torque, was not high enough.
To provide a comprehensive comparison of the designs, Table 8 presents the torque-to-volume ratio according to the experiment. The table demonstrates that the optimal design achieved considerably higher performance compared to the initial design. Particularly, the difference in the torque-to-volume ration was above 20%.

8. Discussion and Conclusions

This study presented the optimization of the PM coupling shapes with the following objectives: minimization of the coupling volume and maximization of the transmitted torque. For this optimization problem, two methodological approaches were employed: the DOM accompanied by the GA and Taguchi optimization method. The results of the PM coupling optimization using both approaches were impressive. The DOM and the Taguchi method led to identical geometry and the same reduction in the coupling volume. Consequently, the increase in the magnetic torque density was also quite high for both optimized designs.
Compared to the DOM-GA, the key advantage of the Taguchi method was the significant reduction in the execution time. Taking into account that the obtained results of the optimization by both methods were the same, the overall performance of the Taguchi method optimization was concluded to be higher. However, the major limitation of the Taguchi approach is the incapability to solve multi-objective problems with a high number of the optimization parameters and complex relations between the optimization objectives, constraints, and parameters. Therefore, the findings of this study are not generalizable to all optimization problems. Still, considering the obtained results, the Taguchi optimization method offers a reasonable alternative to the time-consuming DOM-GA for certain optimization problems.
Another portion of this study was dedicated to the performance validation of the initial and Taguchi optimal design of the coupling. For this purpose, the experimental setup was constructed, and both designs were tested. The experiments showed that the couplings achieved relatively similar torque values, while the torque density was improved. These experiments confirmed that the coupling design obtained from the Taguchi optimization had a comparable performance with the simulation results. Yet, to obtain a better accuracy of the torque measurements, further experimental tests need to be carried out using more precise measurement devices.
This study suggests that the capabilities of the Taguchi optimization method can be examined within the optimization of other electromagnetic devices. For example, further research will focus on the design optimization of a switched reluctance motor using the Taguchi optimization method.

Author Contributions

Conceptualization, methodology, software, validation, formal analysis, and writing—original draft preparation, E.A.; writing—review and editing, resources, and funding acquisition, A.K.; project administration, A.B. and T.V.; supervision, A.B., T.V., A.R., and H.H.; investigation, data curation, and visualization, H.H., H.T., and A.R. All authors have read and agreed to the published version of the manuscript.

Funding

The research was supported by the Estonian Research Council under grant PSG137 “Additive Manufacturing of Electrical Machines”.

Data Availability Statement

Data are contained within the article.

Conflicts of Interest

The authors declare no conflict of interest.

References

  1. El-Wakeel, A.S. Design optimization of PM couplings using hybrid Particle Swarm Optimization-Simplex Method (PSO-SM) Algorithm. Electr. Power Syst. Res. 2014, 116, 29–35. [Google Scholar] [CrossRef]
  2. Andriushchenko, E.; Kaska, J.; Kallaste, A.; Belahcen, A.; Vaimann, T.; Rassõlkin, A. Design Optimization of Permanent Magnet Clutch with Ārtap Framework. TechRxiv 2021, in press. [Google Scholar]
  3. Charpentier, J.F.; Lemarquand, G. Optimal design of cylindrical air-gap synchronous permanent magnet couplings. IEEE Trans. Magn. 1999, 35, 1037–1046. [Google Scholar] [CrossRef]
  4. Hornreich, R.M.; Shtrikman, S. Optimal design of synchronous torque couplers. IEEE Trans. Magn. 1978, 14, 800–802. [Google Scholar] [CrossRef]
  5. Zhang, B.; Wan, Y.; Li, Y.; Feng, G. Optimized design research on adjustable-speed permanent magnet coupling. In Proceedings of the IEEE International Conference on Industrial Technology, Cape Town, Western Cape, South Africa, 25–28 February 2013; pp. 380–385. [Google Scholar]
  6. Buchanan, C.; Gardner, L. Metal 3D printing in construction: A review of methods, research, applications, opportunities and challenges. Eng. Struc. 2019, 180, 332–348. [Google Scholar] [CrossRef]
  7. Frazier, W.E. Metal additive manufacturing: A review. J. Mat. Eng. Perform. 2014, 23, 1917–1928. [Google Scholar] [CrossRef]
  8. Zhang, Z.Y.; Jhong, K.J.; Cheng, C.W.; Huang, P.W.; Tsai, M.C.; Lee, W.H. Metal 3D printing of synchronous reluctance motor. In Proceedings of the IEEE International Conference on Industrial Technology, Taipei, Taiwan, 14–17 March 2016; pp. 1125–1128. [Google Scholar]
  9. Wrobel, R.; Mecrow, B. A Comprehensive Review of Additive Manufacturing in Construction of Electrical Machines. IEEE Trans. Energy Convers. 2020, 35, 1054–1064. [Google Scholar] [CrossRef] [Green Version]
  10. Lei, G.; Zhu, J.; Guo, Y.; Liu, C.; Ma, B. A review of design optimization methods for electrical machines. Energies 2017, 10, 1962. [Google Scholar] [CrossRef] [Green Version]
  11. Duan, Y.; Ionel, D.M. A review of recent developments in electrical machine design optimization methods with a permanent magnet synchronous motor benchmark study. In Proceedings of the IEEE Energy Conversion Congress and Exposition: Energy Conversion Innovation for a Clean Energy Future, ECCE 2011, Rostock, Germany, 24–26 August 2011; pp. 3694–3701. [Google Scholar]
  12. López-Torres, C.; Espinosa, A.G.; Riba, J.R.; Romeral, L. Design and optimization for vehicle driving cycle of rare-earth-free SynRM based on coupled lumped thermal and magnetic networks. IEEE Trans. Veh. Technol. 2018, 67, 196–205. [Google Scholar] [CrossRef]
  13. Babetto, C.; Bacco, G.; Bianchi, N. Synchronous Reluctance Machine Optimization for High-Speed Applications. IEEE Trans. Energy Convers. 2018, 33, 1266–1273. [Google Scholar] [CrossRef]
  14. Cupertino, F.; Pellegrino, G.; Gerada, C. Design of synchronous reluctance motors with multiobjective optimization algorithms. IEEE Trans. Ind. Appl. 2014, 50, 3617–3627. [Google Scholar] [CrossRef] [Green Version]
  15. Pellegrino, G.; Cupertino, F.; Gerada, C. Automatic Design of Synchronous Reluctance Motors Focusing on Barrier Shape Optimization. IEEE Trans. Ind. Appl. 2015, 51, 1465–1474. [Google Scholar] [CrossRef]
  16. Andriushchenko, E.A.; Kallaste, A.; Belahcen, A.; Heidari, H.; Vaimann, T.; Rassõlkin, A. Design Optimization of Permanent Magnet Clutch. In Proceedings of the International Conference on Electrical Machines (ICEM), Gothenburg, Sweden, 23–26 August 2020. [Google Scholar]
  17. Jensen, M.T. Reducing the Run-Time Complexity of Multiobjective EAs: The NSGA-II and Other Algorithms. IEEE Trans. Evol. Comput. 2003, 7, 503–515. [Google Scholar] [CrossRef]
  18. Smith, J.E.; Fogarty, T.C. Operator and parameter adaptation in genetic algorithms. Soft Comput. 1997, 1, 81–87. [Google Scholar] [CrossRef] [Green Version]
  19. Lamont, G.B.; Coello, C.A.C.; Van Veldhuizen, D.A. Evolutionary Algorithms for Solving Multi-Objective Problems; Springer: New York, NY, USA, 2007. [Google Scholar]
  20. Hwang, C.C.; Lyu, L.Y.; Liu, C.T.; Li, P.L. Optimal design of an SPM motor using genetic algorithms and Taguchi method. IEEE Trans. Magn. 2008, 44, 4325–4328. [Google Scholar] [CrossRef]
  21. Sorgdrager, A.; Wang, R.J.; Grobler, A. Taguchi method in electrical machine design. SAIEE Africa Res. J. 2017, 108, 150–164. [Google Scholar] [CrossRef] [Green Version]
  22. Yang, B.Y.; Hwang, K.Y.; Rhee, S.B.; Kim, D.K.; Kwon, B.I. Optimization of novel flux barrier in interior permanent magnet-type brushless dc motor based on modified Taguchi method. J. Appl. Phys. 2009, 105, 07F106. [Google Scholar] [CrossRef]
  23. Ashabani, M.; Mohamed, Y.A.R.I.; Milimonfared, J. Optimum design of tubular permanent-magnet motors for thrust characteristics improvement by combined taguchineural network approach. IEEE Trans. Magn. 2010, 46, 4092–4100. [Google Scholar] [CrossRef]
  24. Ferreira, C.; Vaidya, J. Torque analysis of permanent magnet coupling using 2d and 3d finite elements methods. IEEE Trans. Magn. 1989, 25, 3080–3082. [Google Scholar] [CrossRef]
  25. Panek, D.; Orosz, T.; Karban, P. Artap: Robust Design Optimization Framework for Engineering Applications. In Proceedings of the 3rd International Conference on Intelligent Computing in Data Sciences, ICDS 2019, Marrakech, Morocco, 28–30 October 2019. [Google Scholar]
  26. Kaska, J.; Orosz, T.; Karban, P.; Dolezel, I.; Pechanek, R.; Panek, D. Optimization of Reluctance Motor with Printed Rotor. In Proceedings of the COMPUMAG 2019—22nd International Conference on the Computation of Electromagnetic Fields, Paris, France, 15–19 July 2019. [Google Scholar]
  27. Karban, P.; Pánek, D.; Orosz, T.; Petrášová, I.; Doležel, I. FEM based robust design optimization with Agros and Ārtap. Comput. Math. Appl. 2020, 81, 618–633. [Google Scholar] [CrossRef]
  28. Tiismus, H.; Kallaste, A.; Vaimann, T.; Rassolkin, A.; Belahcen, A. Axial Synchronous Magnetic Coupling Modeling and Printing with Selective Laser Melting. In Proceedings of the 2019 IEEE 60th International Scientific Conference on Power and Electrical Engineering of Riga Technical University (RTUCON), Riga, Latvia, 7–9 October 2019; pp. 1–4. [Google Scholar]
Figure 1. The initial design of the permanent magnet (PM) coupling.
Electronics 10 00494 g001
Figure 2. Magnetic torque versus angle of deviation of the initial design of the coupling.
Electronics 10 00494 g002
Figure 3. Initial design of the coupling with the distribution of magnetic flux density and illustration of the optimization parameters.
Electronics 10 00494 g003
Figure 4. (a) Tournament selection; (b) single-point crossover; (c) uniform mutation.
Electronics 10 00494 g004
Figure 5. Optimization flowchart.
Electronics 10 00494 g005
Figure 6. GA optimal design with the distribution of magnetic flux density.
Electronics 10 00494 g006
Figure 7. Parameter effects on the objective function.
Electronics 10 00494 g007
Figure 8. Taguchi optimal design with the distribution of magnetic flux density.
Electronics 10 00494 g008
Figure 9. Comparison of initial and optimal design geometries.
Electronics 10 00494 g009
Figure 10. Comparison of three designs in terms of magnetic torque versus angle of deviation.
Electronics 10 00494 g010
Figure 11. (a) Prototype of the initial design of the coupling; (b) prototype of the optimized design on the coupling.
Electronics 10 00494 g011
Figure 12. First view of the experimental setup. 1—PM coupling; 2—driving member shaft; 3—driven member shaft; 4 and 5—bearings; 6—mechanism for the angle θ variation; 7—stick for fixing the angle θ; 8 and 9—bed components; 10—arm.
Electronics 10 00494 g012
Figure 13. The measurement setup.
Electronics 10 00494 g013
Figure 14. Test results for the initial and optimal designs of the coupling.
Electronics 10 00494 g014
Figure 15. Comparison of simulation and experimental results for the initial and optimal designs of the coupling.
Electronics 10 00494 g015
Table 1. Coupling specifications.
Dimension/MaterialsValue
Outer diameter Dout30 mm
Inner diameter Din12.5 mm
Thickness of the disks td1.2 mm
Steel teeth height1.6 mm
Steel teeth width5 mm
Steel teeth length8 mm
Magnets thickness 3 mm
Magnets width5 mm
Magnets length 8 mm
Air gap1.5 mm
Table 2. Simulation results of genetic algorithm (GA) optimization.
ObjectiveInitial DesignGA
τ max 73.0 × 10⁻³ Nm74.5 × 10−3 Nm
V2.31 × 10−6 m31.91 × 10−6 m3
Table 3. Optimization parameters and their levels.
ParameterLevel 1Level 2Level 3Level 4Level 5
10.81---
2–120.60.70.80.91
Table 4. Effects of different parameters on the cost function.
VariableSum of SquaresFactor Effect (%)VariableSum of SquaresFactor Effect (%)
10.00010.570.002310.0
20.00198.780.002510.9
30.002310.190.002510.7
40.002511.1100.002711.7
50.00218.9110.002410.5
60.00083.8120.00073.1
Table 5. Simulation results of Taguchi optimization.
ObjectiveInitial DesignTaguchi Design
τ max 73.0 × 10⁻³ Nm75.0 × 10−3 Nm
V2.31 × 10−6 m31.91 × 10−6 m3
Table 6. Simulation results of GA and Taguchi optimization.
ObjectiveInitial DesignGA DesignTaguchi Design
τ max 73.0 × 10⁻³ Nm74.5 × 10−3 Nm75.0 × 10−3 Nm
V2.31 × 10−6 m31.91 × 10−6 m31.91 × 10−6 m3
τ max /V31.6 kN∙m/m339.0 kN∙m/m339.3 kN∙m/m3
Table 7. Discs thicknesses values for initial and optimal designs.
Parameter NumberInitial DesignGA DesignTaguchi Design
11.2 mm0.21 mm0.2 mm
21.2 mm0.2 mm0.2 mm
31.2 mm0.2 mm0.2 mm
41.2 mm0.2 mm0.2 mm
51.2 mm0.4 mm 0.2 mm
61.2 mm0.2 mm0.2 mm
71.2 mm0.5 mm0.2 mm
81.2 mm0.2 mm0.2 mm
91.2 mm0.2 mm0.2 mm
101.2 mm0.2 mm0.2 mm
111.2 mm0.2 mm 0.2 mm
121.2 mm0.6 mm0.2 mm
Table 8. Test results of GA and Taguchi optimization.
SpecificationInitial DesignTaguchi Design
τ max 71.0 × 10⁻³ Nm72.0 × 10−3 Nm
V2.31 × 10−6 m31.91 × 10−6 m3
τ max /V30.7 kN∙m/m337.7 kN∙m/m3
Publisher’s Note: MDPI stays neutral with regard to jurisdictional claims in published maps and institutional affiliations.

