1. Introduction
A portable grounding system is vital to provide the essential safety, reliability, and continuity of the power distributive system’s services. Grounding systems have a twofold role in electrical power systems: first, to ground high impulse current in the shortest possible time; second, to provide a reference potential point for electrical equipment. The grounding system is primarily designed for power frequency fault conditions such as short circuits; with design improvement, it can divert high impulse currents such as lightning strikes into the earth. Lightning strikes have an enormous amount of energy in the form of high magnitude current and voltage and fast rise times. They can severely damage the electrical equipment as well as put human safety in jeopardizing situations [
1]. The frequency and rate of energy transferring make the difference between these systems, as lightning strikes have a frequency up to 10 kHz, while the power system has a frequency of 50/60 Hz [
2,
3]. The grounding system behavior under power fault conditions is distinct from transient fault conditions as under later conditions. The current can vary from a few Amps to 20–30 kA [
4]. Consequently, a carefully designed power system suitable to dissipate high impulse current is imperative regardless of the fault type [
5].
Soil resistance is subjected to several variables, such as the chemical content of soils, water content, geography, and temperature [
6]. Rain is another significant source affecting soil resistivity. Thus, it is essential that grounding resistance values must be controlled during the system’s operation to ensure a low impedance path for the surge current to dissipate in the ground in the shortest possible time [
7,
8]. In general, the resistance value for the grounding system must be lower than the demanded value. Literature suggests that for lightning protection, its value should be around 10 Ω [
9]. Similarly, for protective devices on site requiring a quick operation, the grounding resistance value must be lower than 0.1 Ω [
10,
11]. However, it is a very challenging task to obtain the desired resistance value, especially in troubled environments such as forests, deserts, and hilly areas. For such circumstances, the ground resistance is decreased by increasing the number of grounding electrodes or using backfill material. The phenomena that occur in the surrounding soil of the electrode resulting in arching and coupling are referred to as potential ground rise [
12]. In literature, various ground-enhancement compounds, such as chemical and natural products, have been used on different grounding system types. Though numerous research studies have focused on the problem of grounding resistance, there is room for improvement [
13,
14,
15].
Grounding electrode impedance is measured at a low frequency (50/60 Hz), as these systems are designed to absorb nominal power frequency. Moreover, practical constraints arise due to high frequencies while measuring grounding impedance. Grounding impedance is mainly represented by the resistance of electrodes, the mass of the soil, and the contact resistance between the electrode and the soil [
16]. The soil’s electrical and magnetic properties under fast transient conditions such as lightning strikes can be explained by three parameters: electrical conductivity, magnetic permeability, and dielectric permittivity [
17]. Soil behavior varies under electromagnetic fields due to the different parameters comprising its structure, such as grain size, moisture, salt content, lattice arrangement, and temperature [
18,
19,
20]. Soil homogeneity is divided into two layers. The upper layer soil resistivity typically ranges from 10 Ω to 100 Ω, while the lower layer soil resistivity generally remains at 400 Ω [
21]. The soil magnetic permeability is equivalent to the permeability of air in most cases and does not vary with frequency. However, up until now, it was considered on the basis of experimental results that the permeability and resistivity of soil are dependent on field frequency [
22].
The relative permittivity and electrical resistivity are the basic physical agents of grounding materials. The ability to resist the flow of electric current is the volume resistivity of the material. Hence, it is used to estimate the time required for the electrical charge to dissipate in the ground [
23]. Relative permittivity shows the polarizability of material, i.e., electric field variation inside a material relative to a vacuum. The relative permittivity is a function of the frequency of the applied electric field. If the material is homogenous in nature, the resistivity to some extent relates to the relative permittivity of the material. Resistivity is measured using a parallel plate cell. The powder is placed between two cells of the capacitor, voltage is generated across electrodes, and current is measured. The measure capacitance is directly proportional to relative permittivity [
24,
25].
The conventional method of a deeply driven electrode for grounding is still used for household applications in many countries. The ufer grounding technique, which utilizes the metal framework of structures such as high-rise buildings and towers, is also in practice [
26]. The limitation in these systems is the grounding resistance. The main feature of the grounding system is to dissipate the unwanted electrical surges providing them with a low impedance path [
27]. Ground resistance value depends on soil resistivity and electrode configurations. A convenient method to reduce grounding resistivity is the use of Grounding Enhancement Compounds (GEC). Many materials are tested in literature, such as coconut coir peat, palm kernel oil cake (PKOC), paddy dust, bentonite, etc., and chemical products such as concrete, water-absorbent polymer, synthetic resins, mixed inorganic salts are used as GEC [
28]. Yet, these compounds show discrepancies in terms of grounding the high voltages.
Table 1 shows the properties comparison of conventional materials and proposed material for grounding system.
Aiming at finding solutions to the problems of the deep digging of electrodes and high-resistance soils, this paper makes a novel contribution by presenting an application of electrical breakdown characteristics of various mineral compounds for portable Applications. Mineral compounds such as laterite, bauxite, and china clay are introduced as novel materials, and their breakdown behaviors are analyzed for an improved grounding system. The main contribution of this research work is an easy installation at troubled environments, i.e., forests, rocky desert terrains, etc., easy maintenance, better conductivity, and lower breakdown voltages. Compared to a conventional grounding system, the proposed system is cost-efficient, and the minerals used are easily available at low prices in the market. Prior to experimental testing, material characterizations such as XRD analysis is performed to observe the orientation and electrical characteristics of the proposed samples. The electric field intensity of the proposed setup is measured using an FEA tool. The grounding system is made portable, illustrating that it will apply to equipment as well as system grounding. A portable grounding system is movable. It is composed of an acrylic sheet container with grounding compounds in it. The size of the grounding system depends upon the requirement of the system and the type of equipment. This system has the advantage of preventing the deep digging of electrodes and can be easily installed in the troubled environment and high-resistance soil. The proposed materials (minerals and ores) used for grounding purposes act as an interface between earth and high-voltage surges. The system allows high voltages effectively into the ground to avoid back flashover. Experimental results showed that proposed materials could be effectively used for portable applications.
2. Faults in Power System
Transient voltages or impulses are defined as a sudden sizing of voltage to a peak in a very short interval of time. Two types of transient voltage arise in the electrical power systems: one occurs due to external sources; the second occurs due to internal sources. The internal sources’ faults are insulation failure, arcing ground, and resonance, etc. during insulation failure, a live conductor is earthed that produces voltage peaks in the power system. Resonance is the phenomenon that occurs in a power system when capacitive reactance and inductive reactance become equal and thus cancel each other’s effects, and the line becomes purely resistive; hence, the system voltage increases sufficiently and is called low-frequency faults. The external faults are lightning impulse (LI) and switching impulses, which occur due to direct lightning strikes on energized conductors and have a very high frequency (up to 300 kHZ). When a no-load transmission line is suddenly switched on, transient voltage arises; similarly, when the loaded line is switched off or turned on, a large peak is generated across the transmission line, which has a very high frequency. In order to avoid these types of faults in a power system, an efficient grounding system is required.
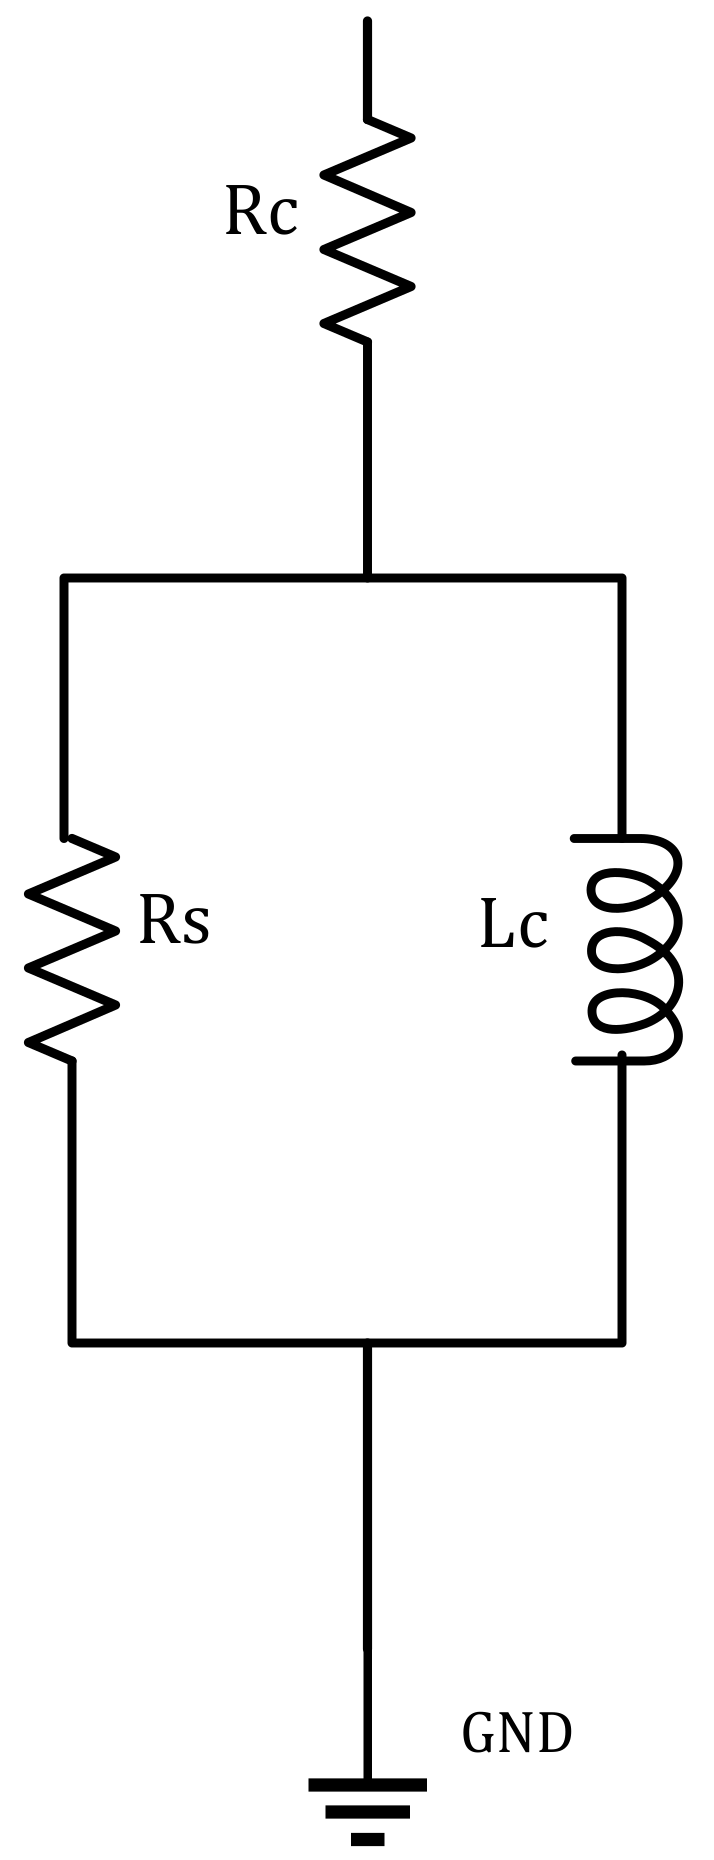
The primary high-frequency electrical circuit model of the grounding grid system is shown in
Figure 1. The passive parameters of resistance and inductance are shown to evaluate the high-frequency behavior of the grounding system with soil ionization.
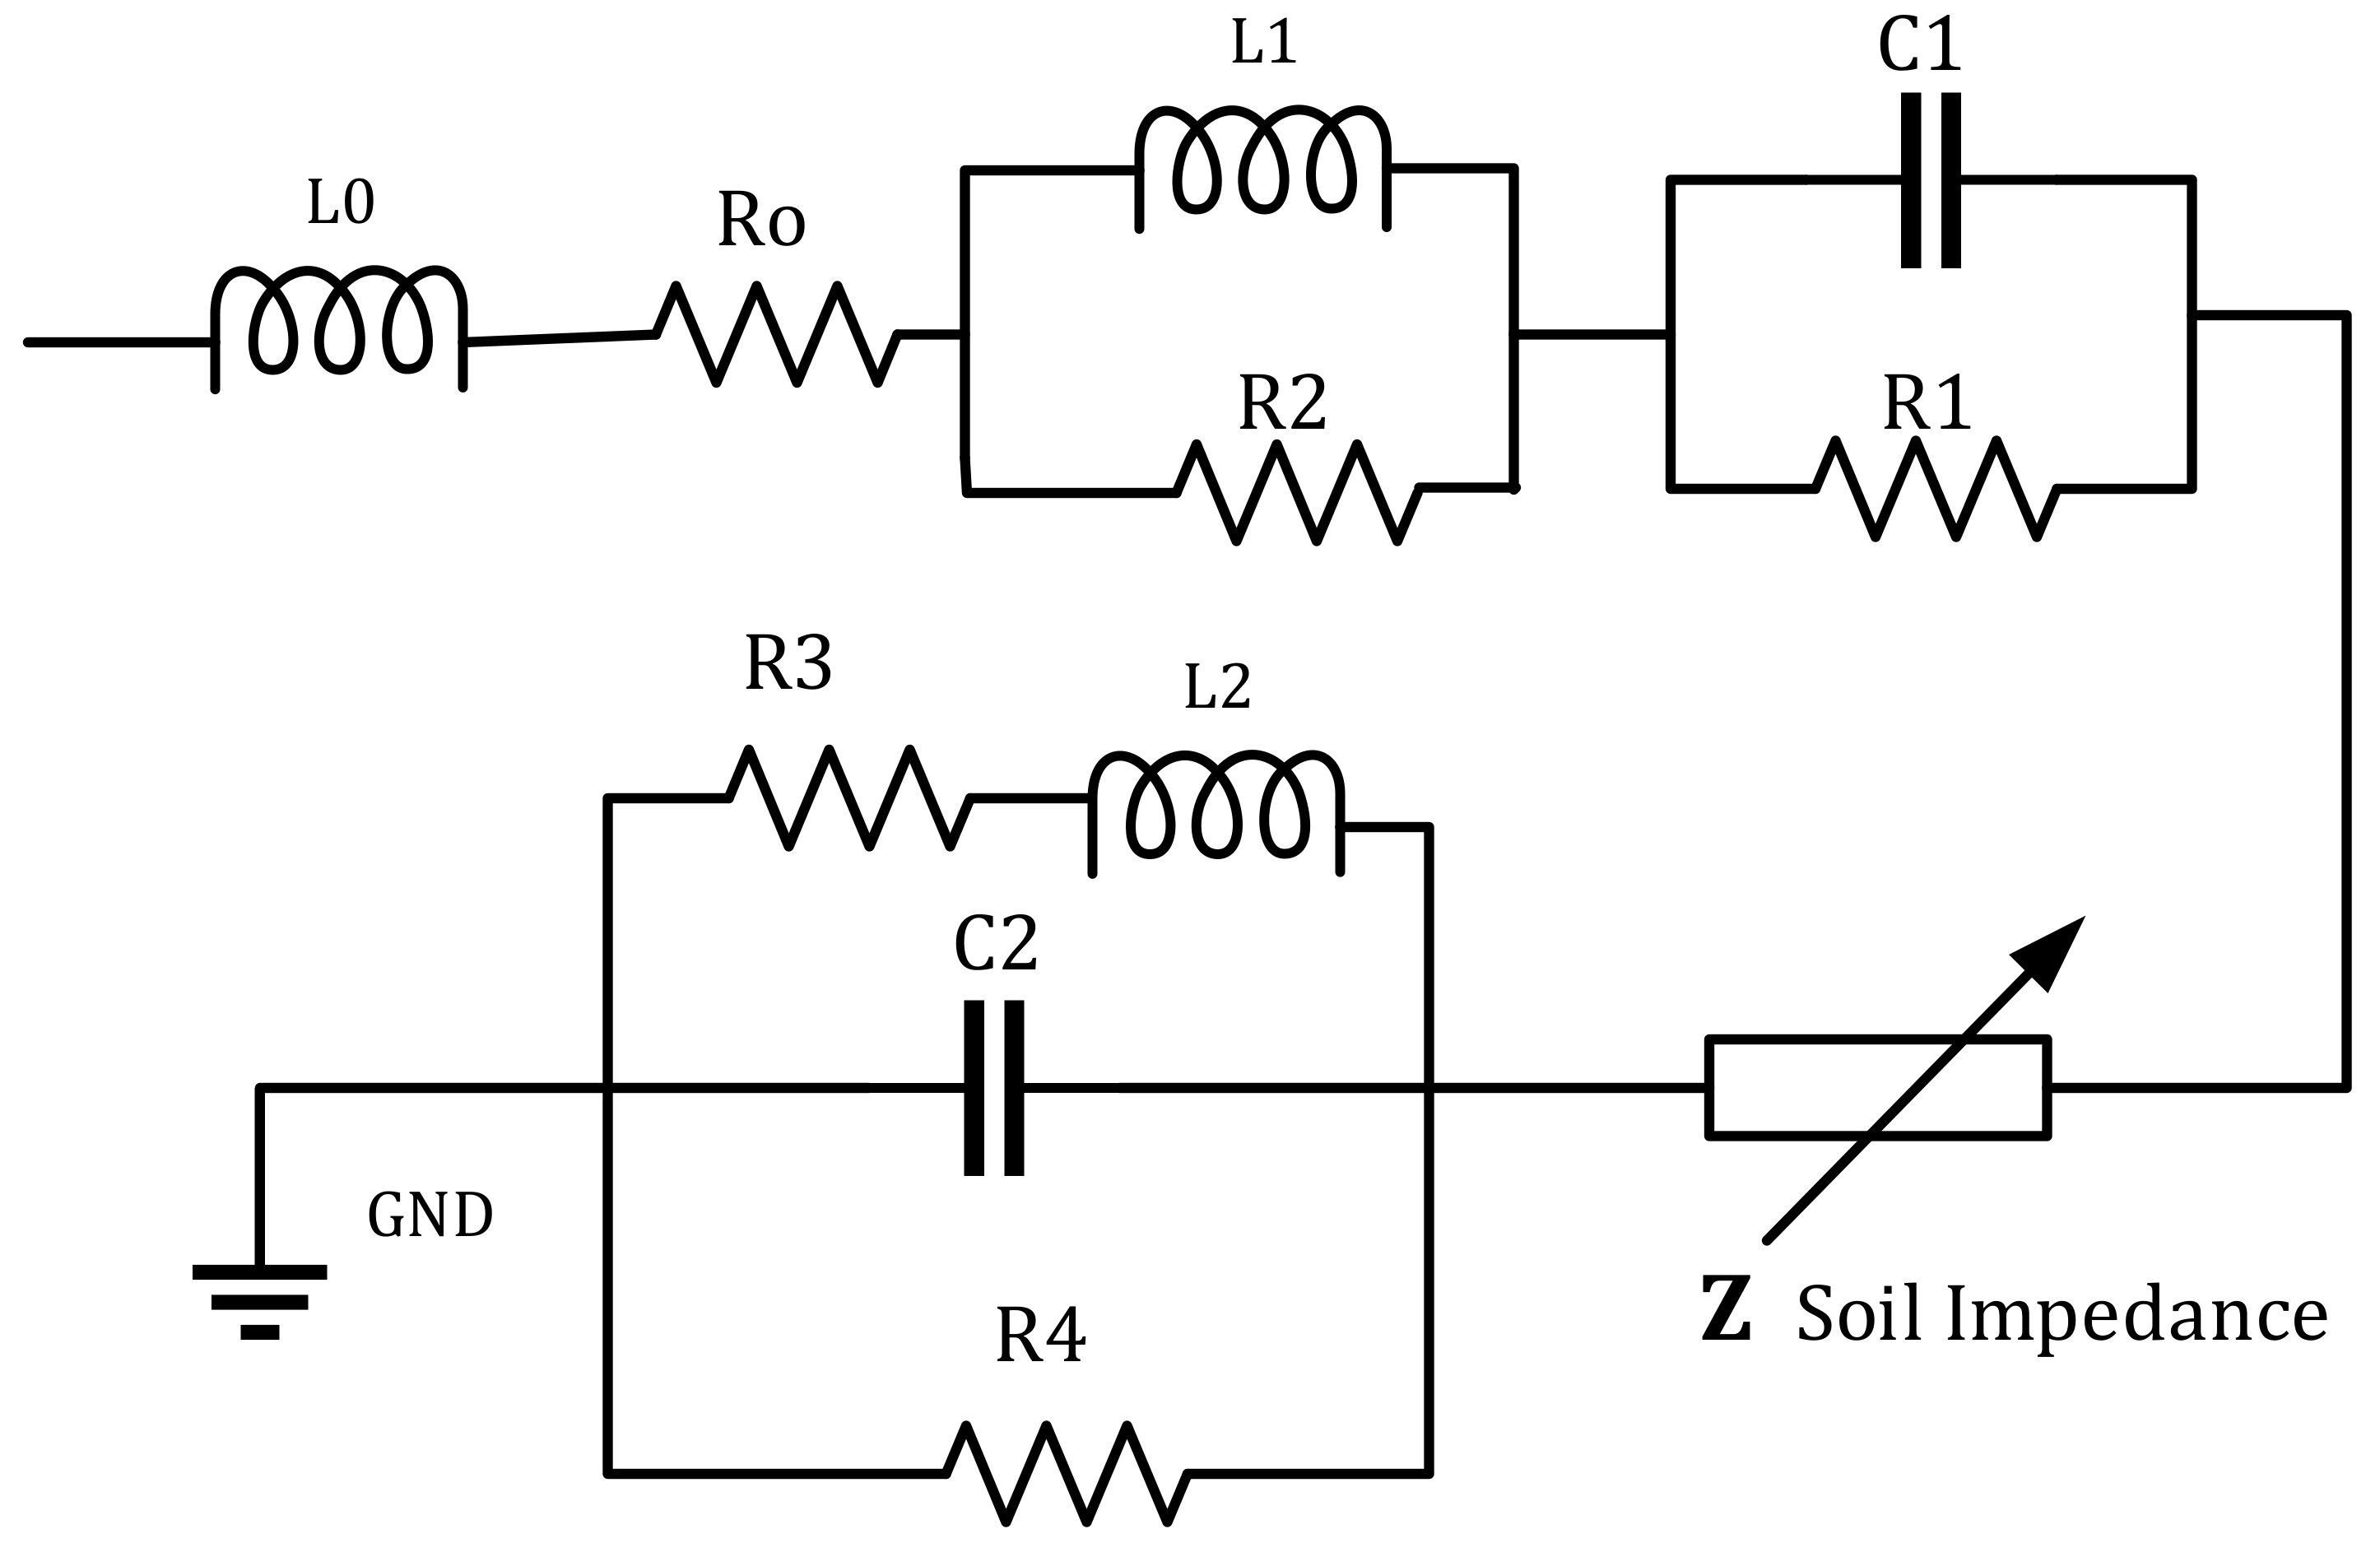
Figure 2 shows the circuit-based diagram. As can be seen, there are some series impedance branches with real and complex conjugate poles enforced to be at a stable state. Hence, the real part of fitted poles will have a negative value, as located at the left side of the imaginary axis in the complex plane. “d and h” are real if they existed, d = L0, and h = Ro.
4. Experimental Result
The breakdown voltages of test samples were calculated subjected to Alternating and Direct current conditions. Tests were conducted following IEC60060-1 (2010), and standard atmospheric conditions were maintained in lab (temperature t0 = 20 °C, pressure b0 = 101.3 kPa, absolute humidity h0 = 11 gm/m3).
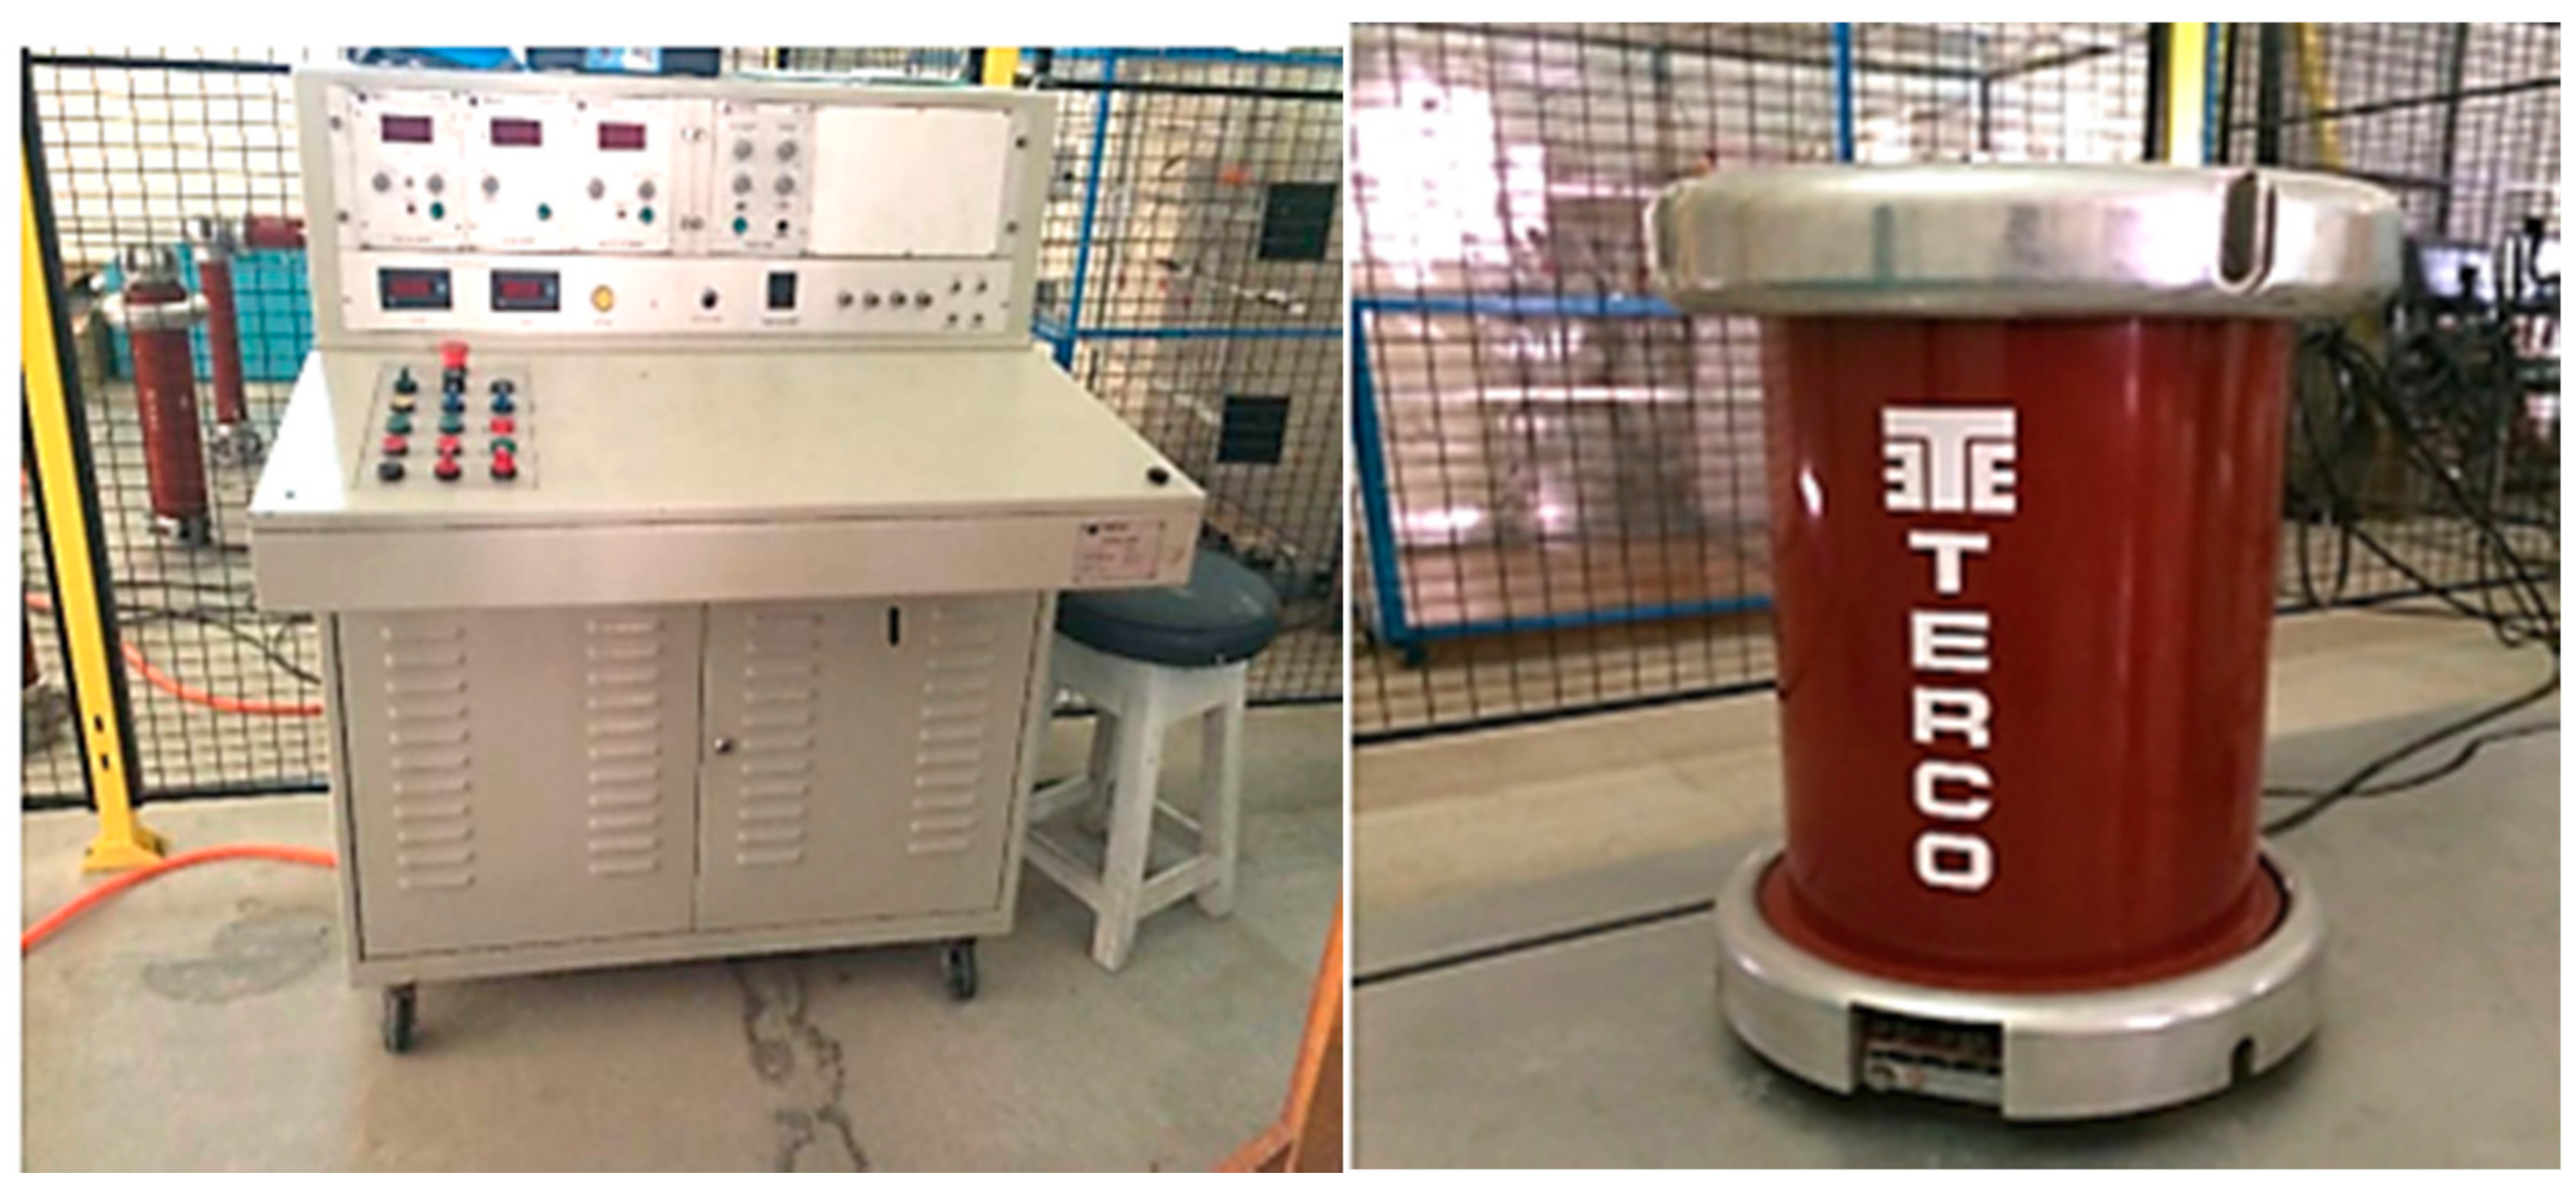
The TERCO transformer generated alternating and direct current voltages. The experimental circuit consists of a control desk (CD), HV 9103, with a built-in peak voltmeter, HV 9150, whose voltage ranges are from 100 kV to 1000 kV and variable voltage supply ranges from 0 V to 230 V. Control desk specification is discussed in
Table 2. The test transformer specification is discussed in
Table 3.
Figure 6 shows a pictorial view of the control desk and test transformer.
4.1. AC Setup
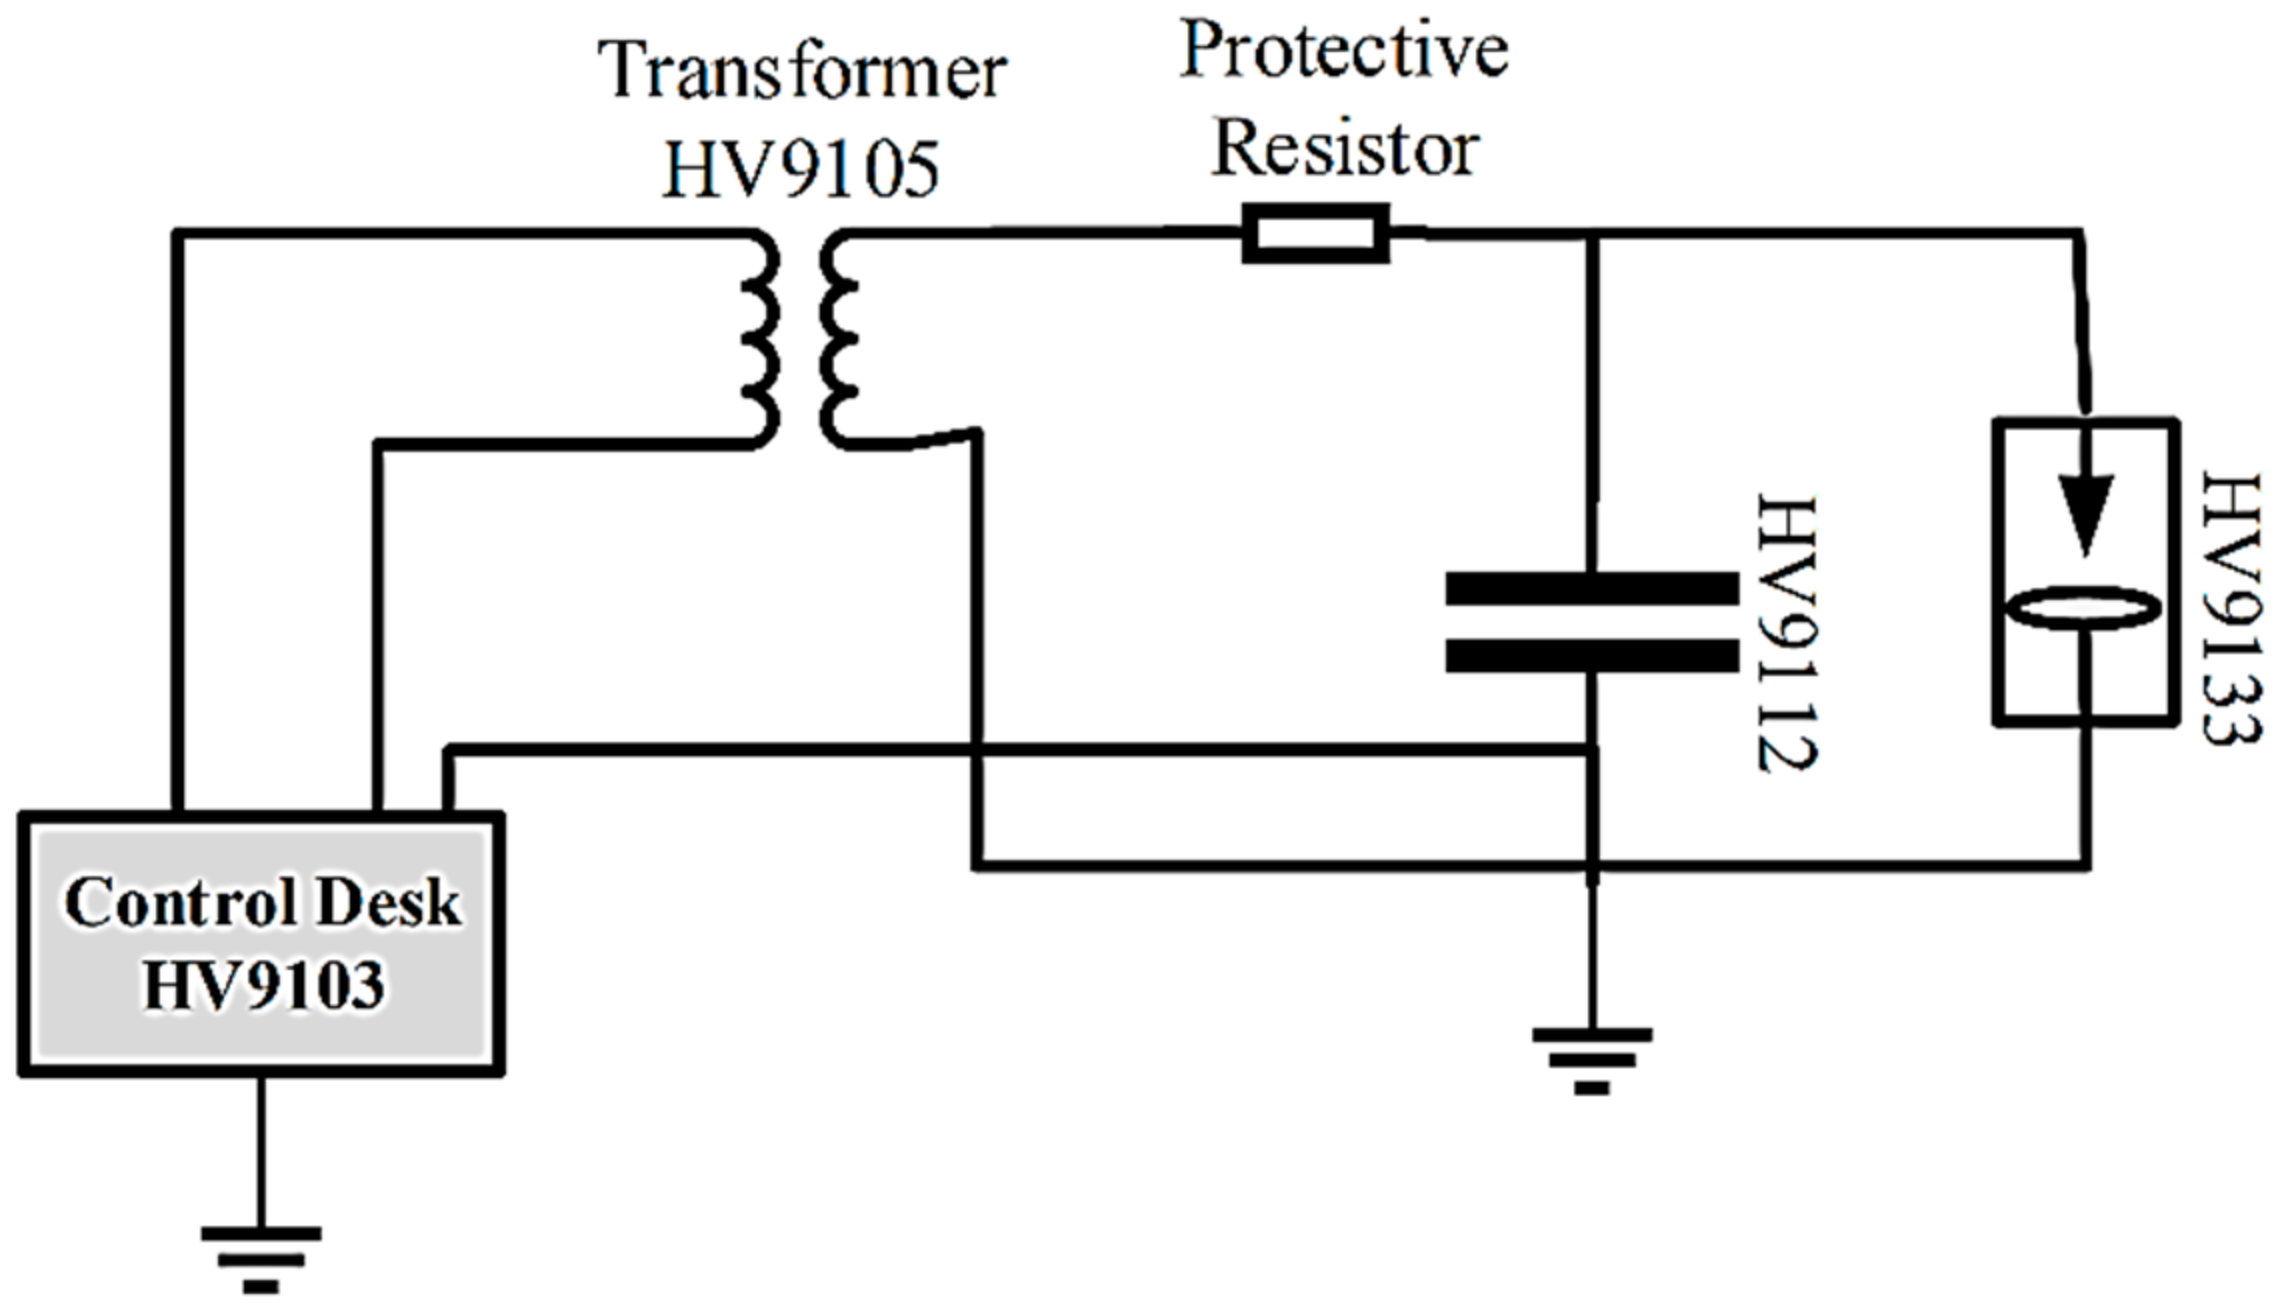
Two stages of the TERCO Test transformer up to 200 kV (HV 9105) are used. For protection purposes, a resistor was connected while performing the test. The AC voltage of already-known values was applied to the measuring apparatus and voltmeter to calibrate it to avoid any error and improve the accuracy of the experiments. The block diagram of the AC setup is shown in
Figure 7.
4.2. DC Setup
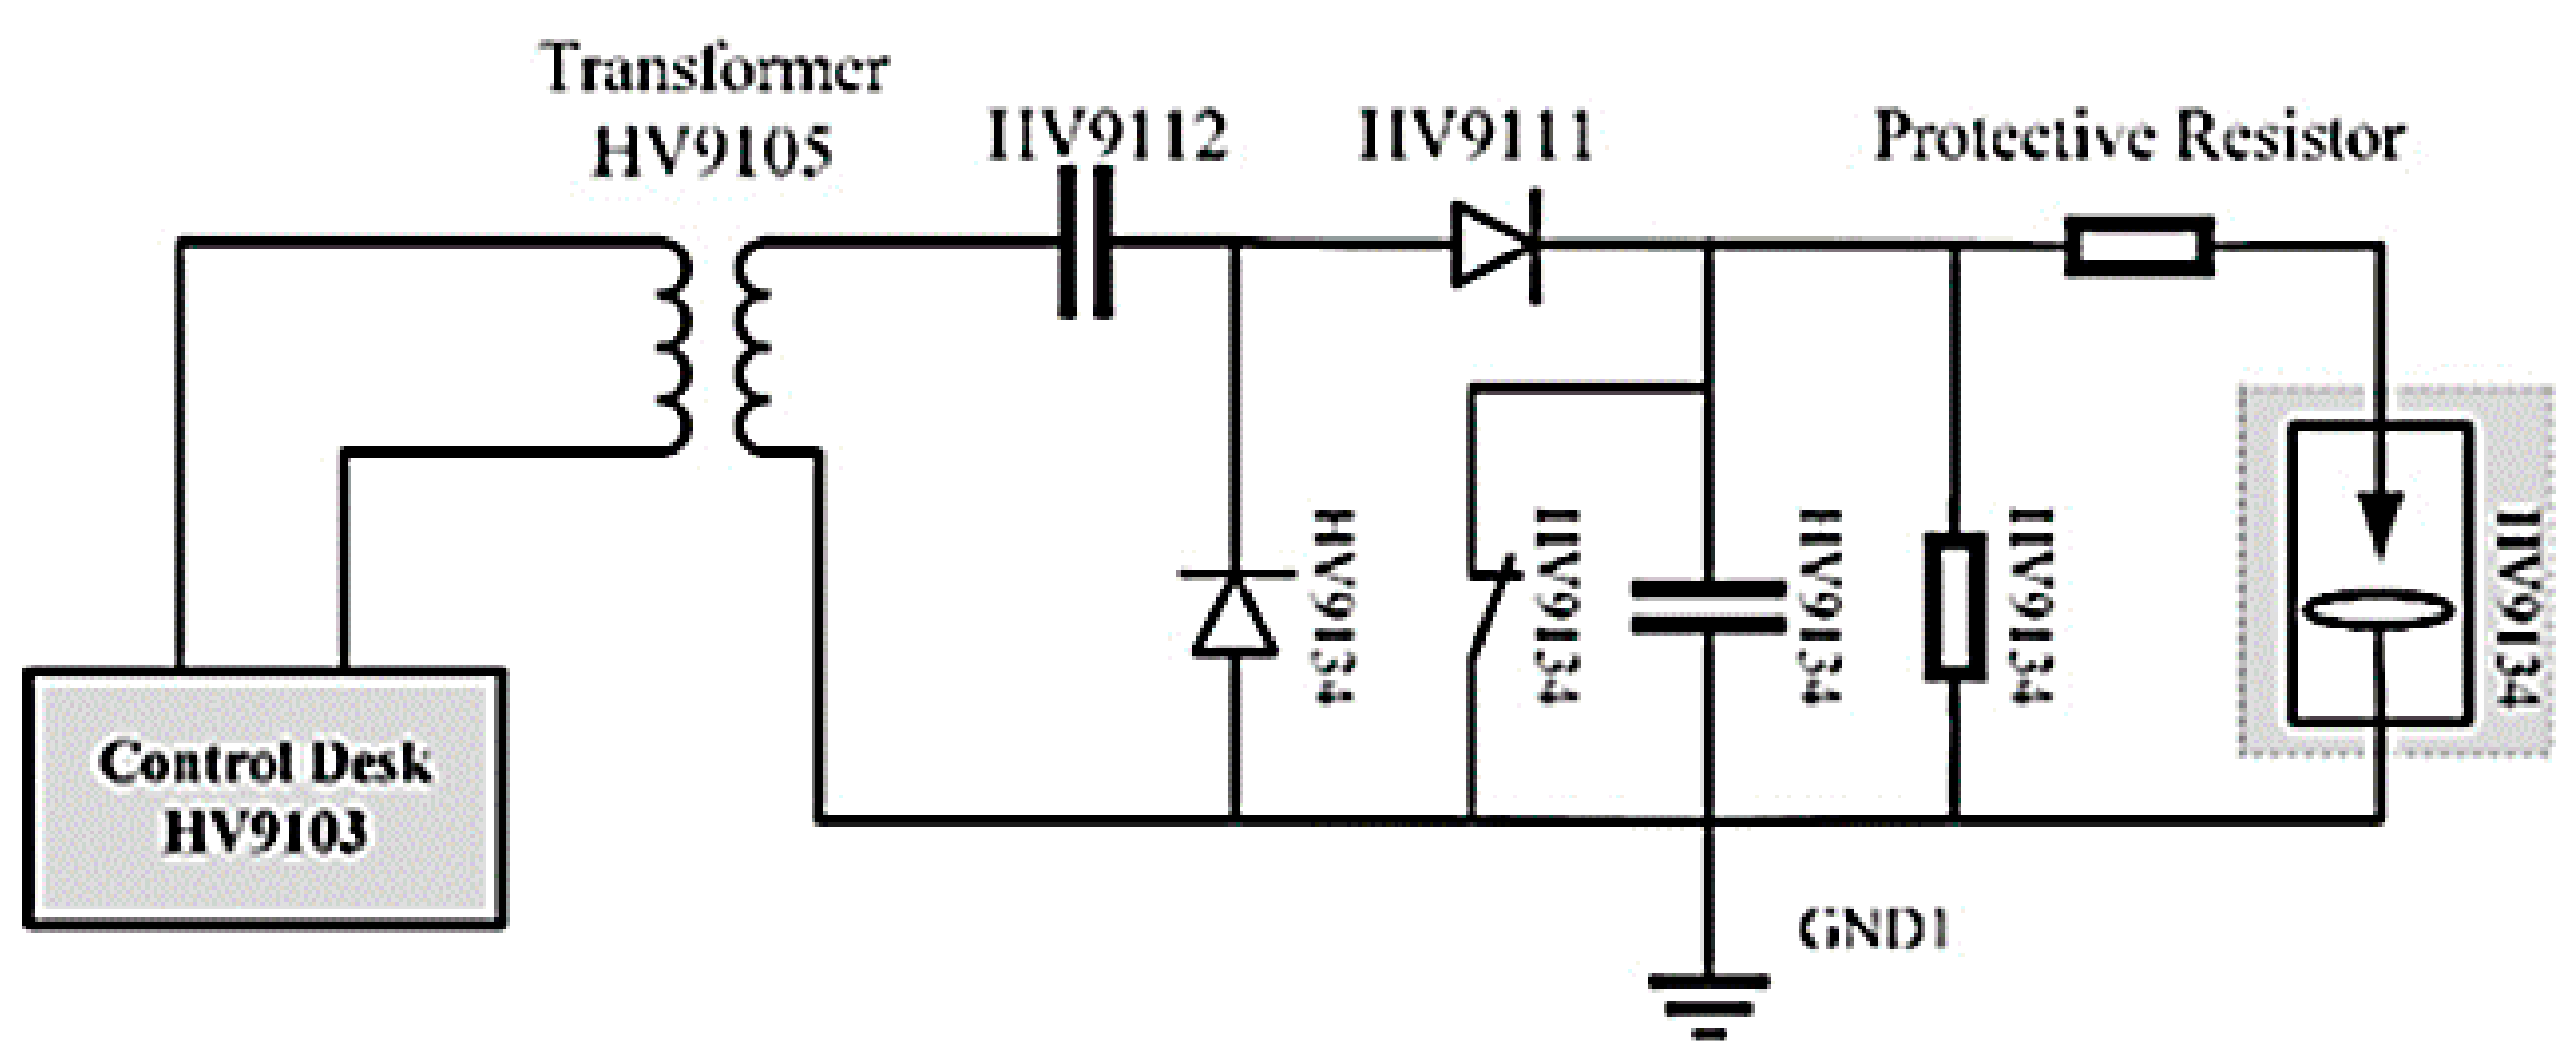
The breakdown voltages of selected samples are tested by applying DC voltage. The breakdown voltages of the samples and their mixes are calculated and compared with each other. The DC setup consists of a control desk (HV9103), transformer (HV9105), series and parallel capacitor (HV9112), diode rectifier (HV9111), resistor (HV9113), a protective resistor of 100 Ω, and a test panel (HV9133). The block diagram of the DC setup used is shown in
Figure 8.
4.3. FEA Analysis
Quick field software is used to simulate the grounding system. The problem was solved in two stages: the first one is pre-processing, the second one is solving and getting a result. In the first stage, the properties and boundary conditions were assigned. In the second stage, parametric analysis was performed, and electric field intensity was calculated. The impedance of the grounding electrodes is shown in Equations (1) and (2).
where Z is the impedance, V is the voltage applied to the material its unit is (Volts), I is the input injected current unit (A), Zc is the characteristic impedance, γ is the propagation constant, λ is the reflection factor, and l is the length of the electrode. The proposed samples are of an ohmic nature, i.e., they show low resistance to high impulse current in the case of short circuits or lightning strikes, as can be seen from Equations (1) and (3).
ρ is the resistivity, R is the resistance (Ω), A is area (m
2), and L is the lengths (l) of the material. x1 and x2 are the material ratios, and the effective resistivity of two random mixtures can be obtained by using Equation (4).
The effective resistivity of two ordered mixtures, i.e., having the same proportion of materials, can be found using Equation (5).
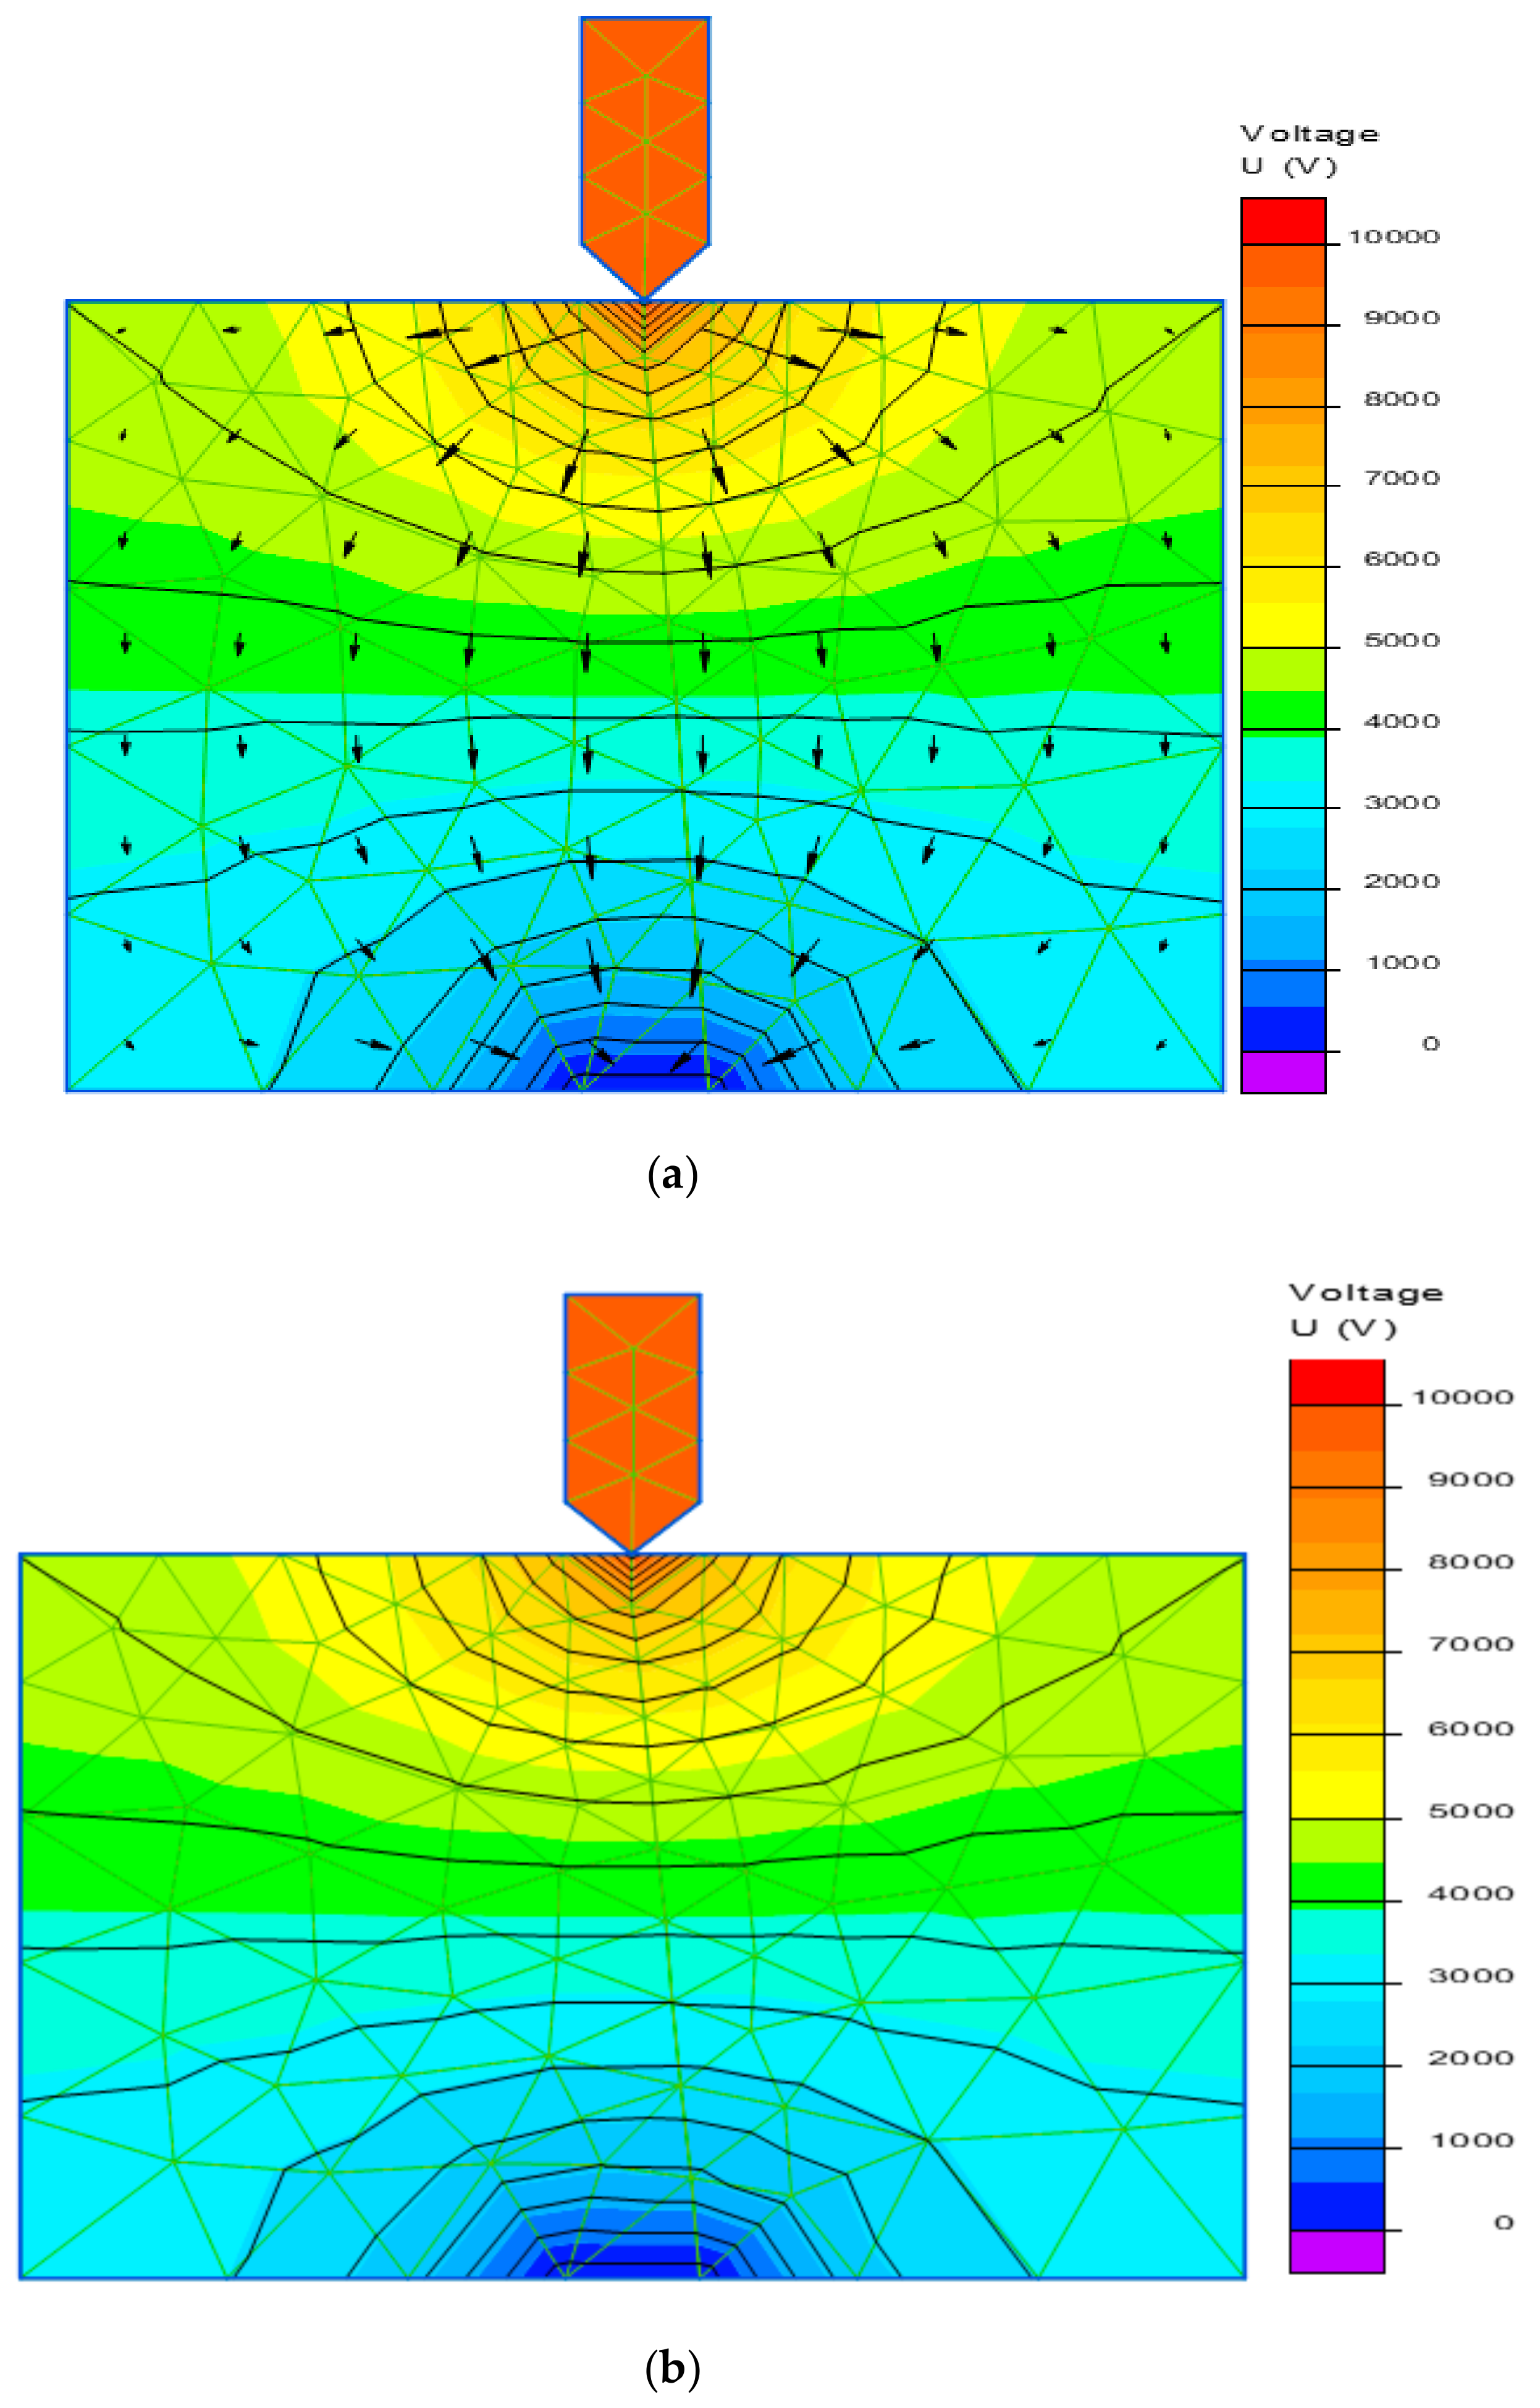
Figure 9 reveals the voltage distribution with and without electric field vector presentation.
is the effective permittivity of two ordered mixtures and
are the material ratio. The relative permittivity of the powder mixture is obtained using Equations (6) and (7). The minerals induce strong charge trapping, i.e., capacitance effect, so they help retain the charge and avoid back flashover in the case of short circuits or lightning impulse.
The quantity of the backfill material used in designing the grounding system can be obtained using Equations (8) and (9).
The process involved in the first stage is as follows. First, the AC/DC module selected is electrostatic, and the geometric model is a 2D axisymmetric plot. The parameters selected are relative permittivity. The relative permittivity of copper, laterite, bauxite, china clay and silica sand are 1.0006, 3.25, 4.10, 5, 7.0, respectively. The boundary conditions are electric potential (material breakdown voltage), and ground meshing is selected as fine.
The process involved in the second stage is as follows. The solver used in the FEA software is parametric analysis. The result obtained is for electric field strength. The surface plot obtained is (2D), and the line plot is (1D).
The FEA simulation is done using Gauss’s law, the current continuity equation, and ohm’s law given in Equations (10)–(12) was applied in this analysis.
where δ is conductivity, ε is the dielectric constant, J is the current density (A/m
2), and ᴇis is the electric field strength (V/m). The surface plot of voltage showing vectors of electron strength from a high-voltage electrode to the ground and without electron strength is shown in
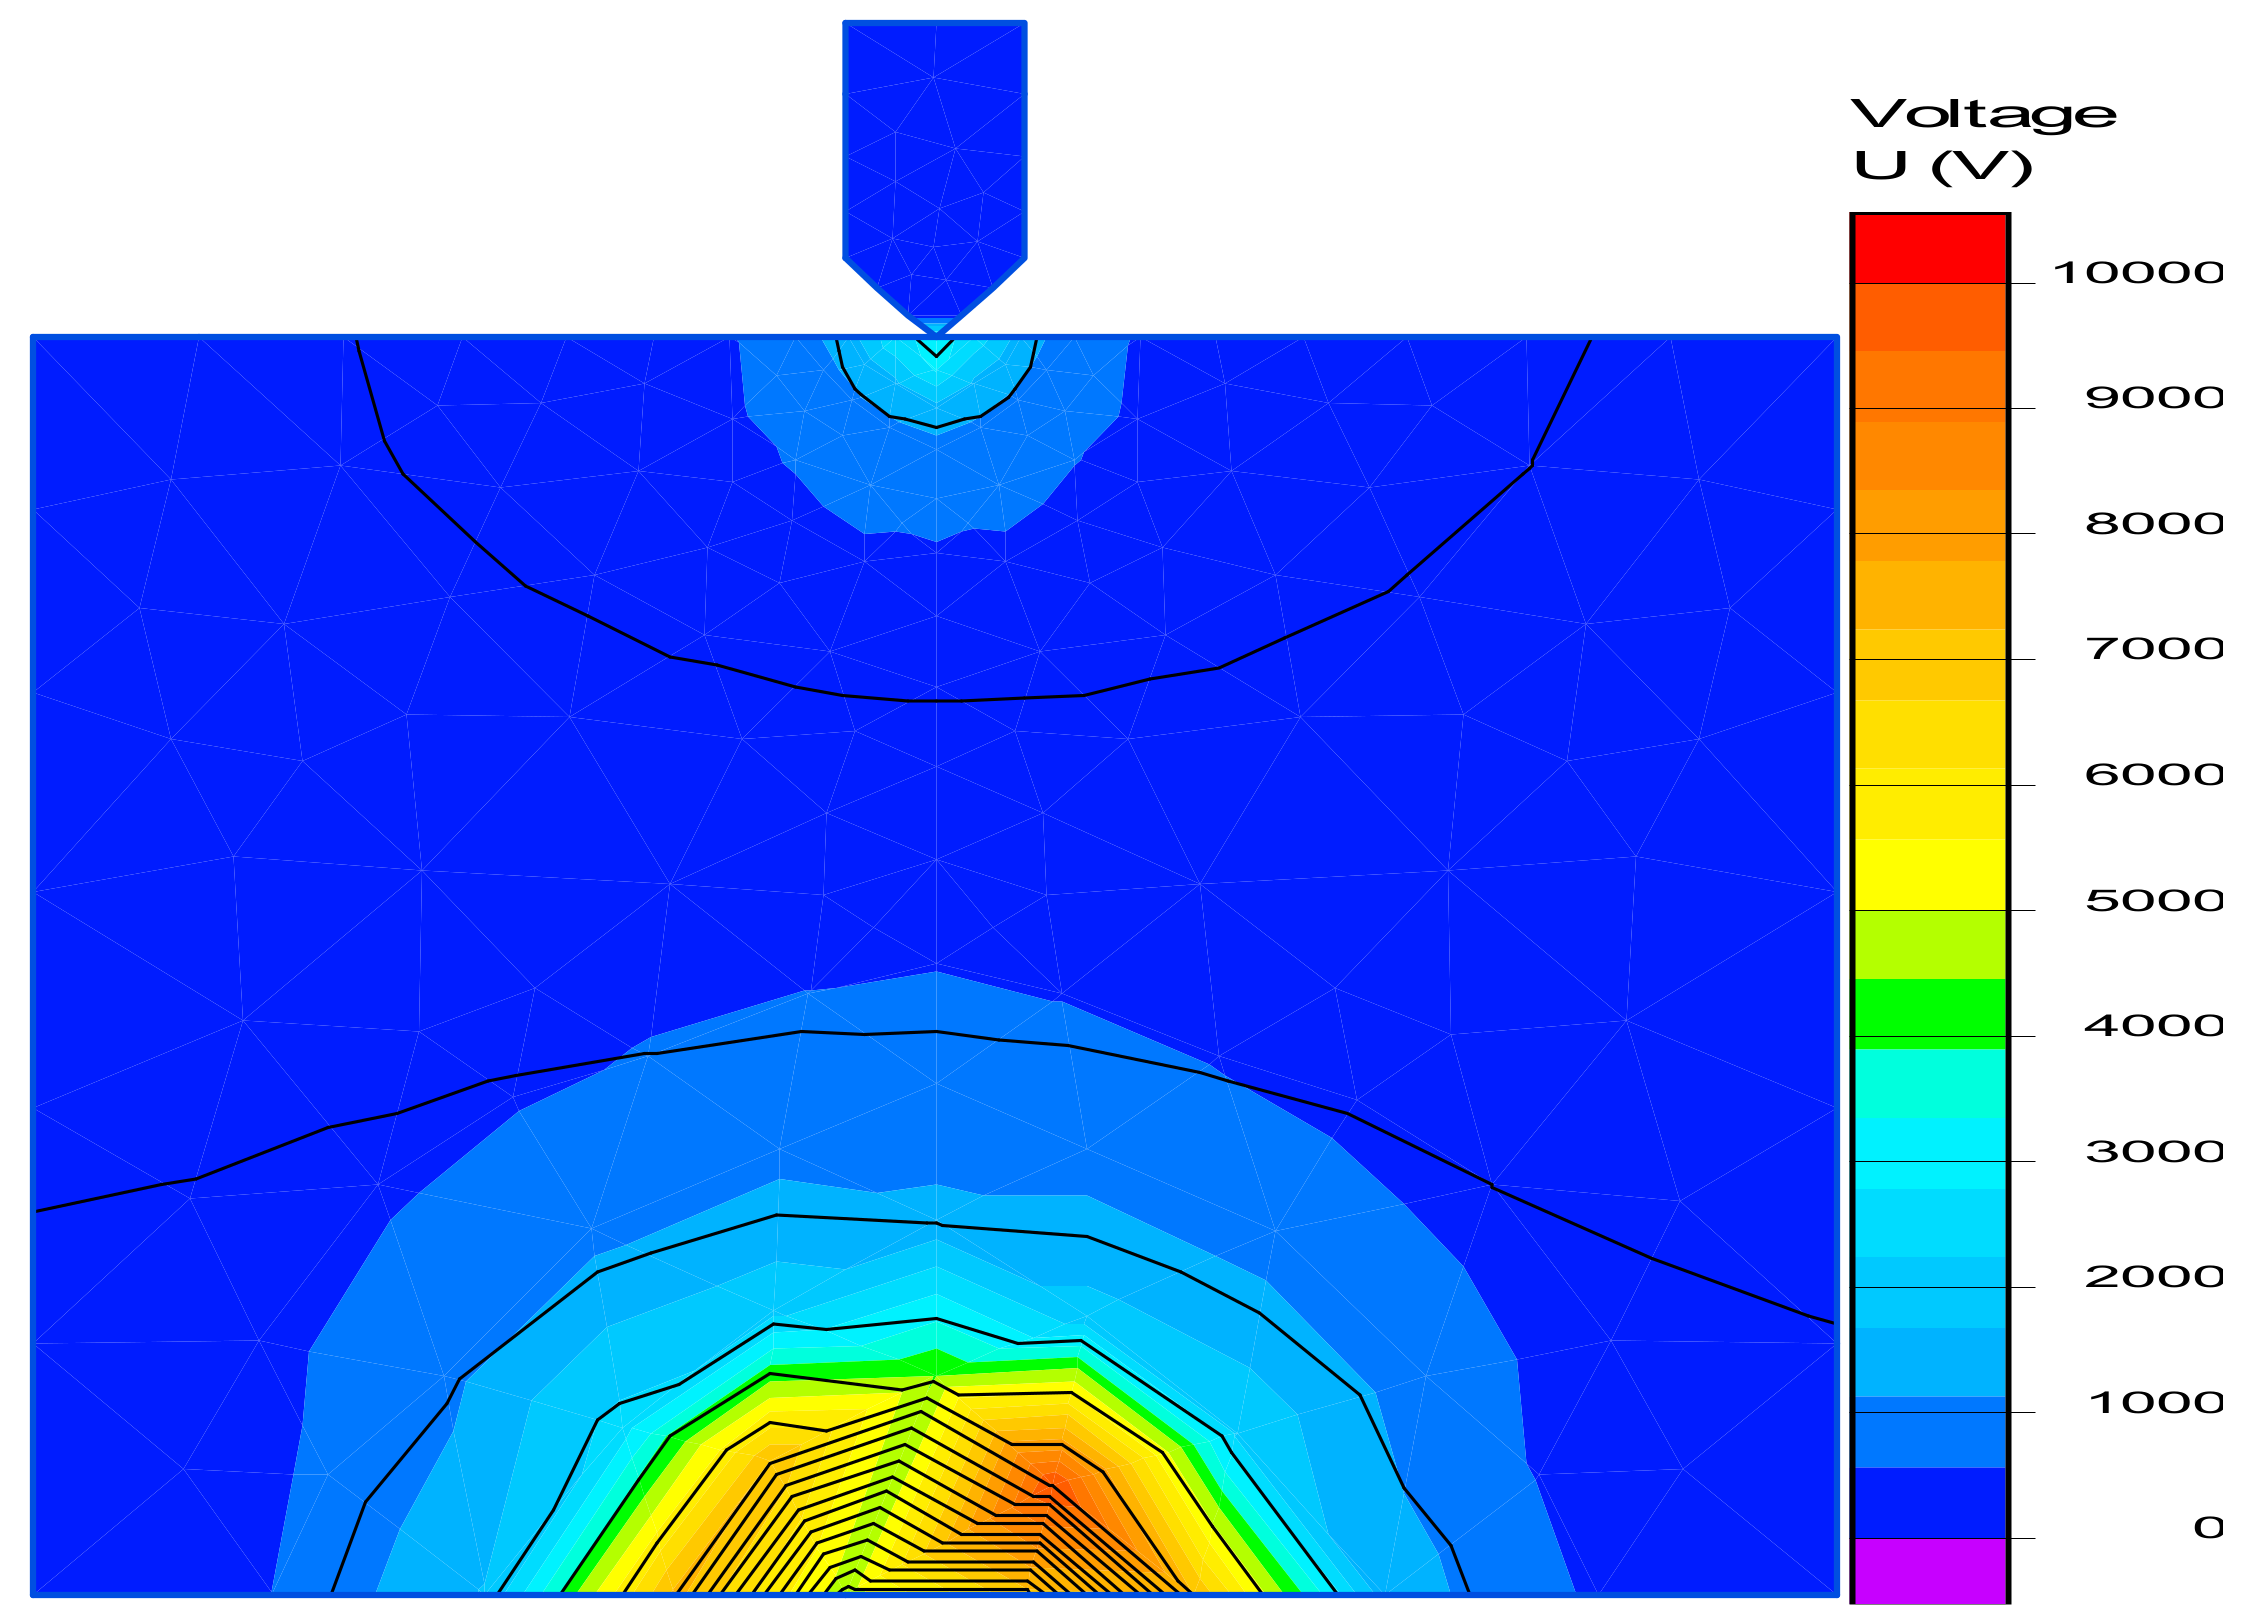
Figure 8. Furthermore, the surface plot of the laterite green and bentonite mixture is shown in
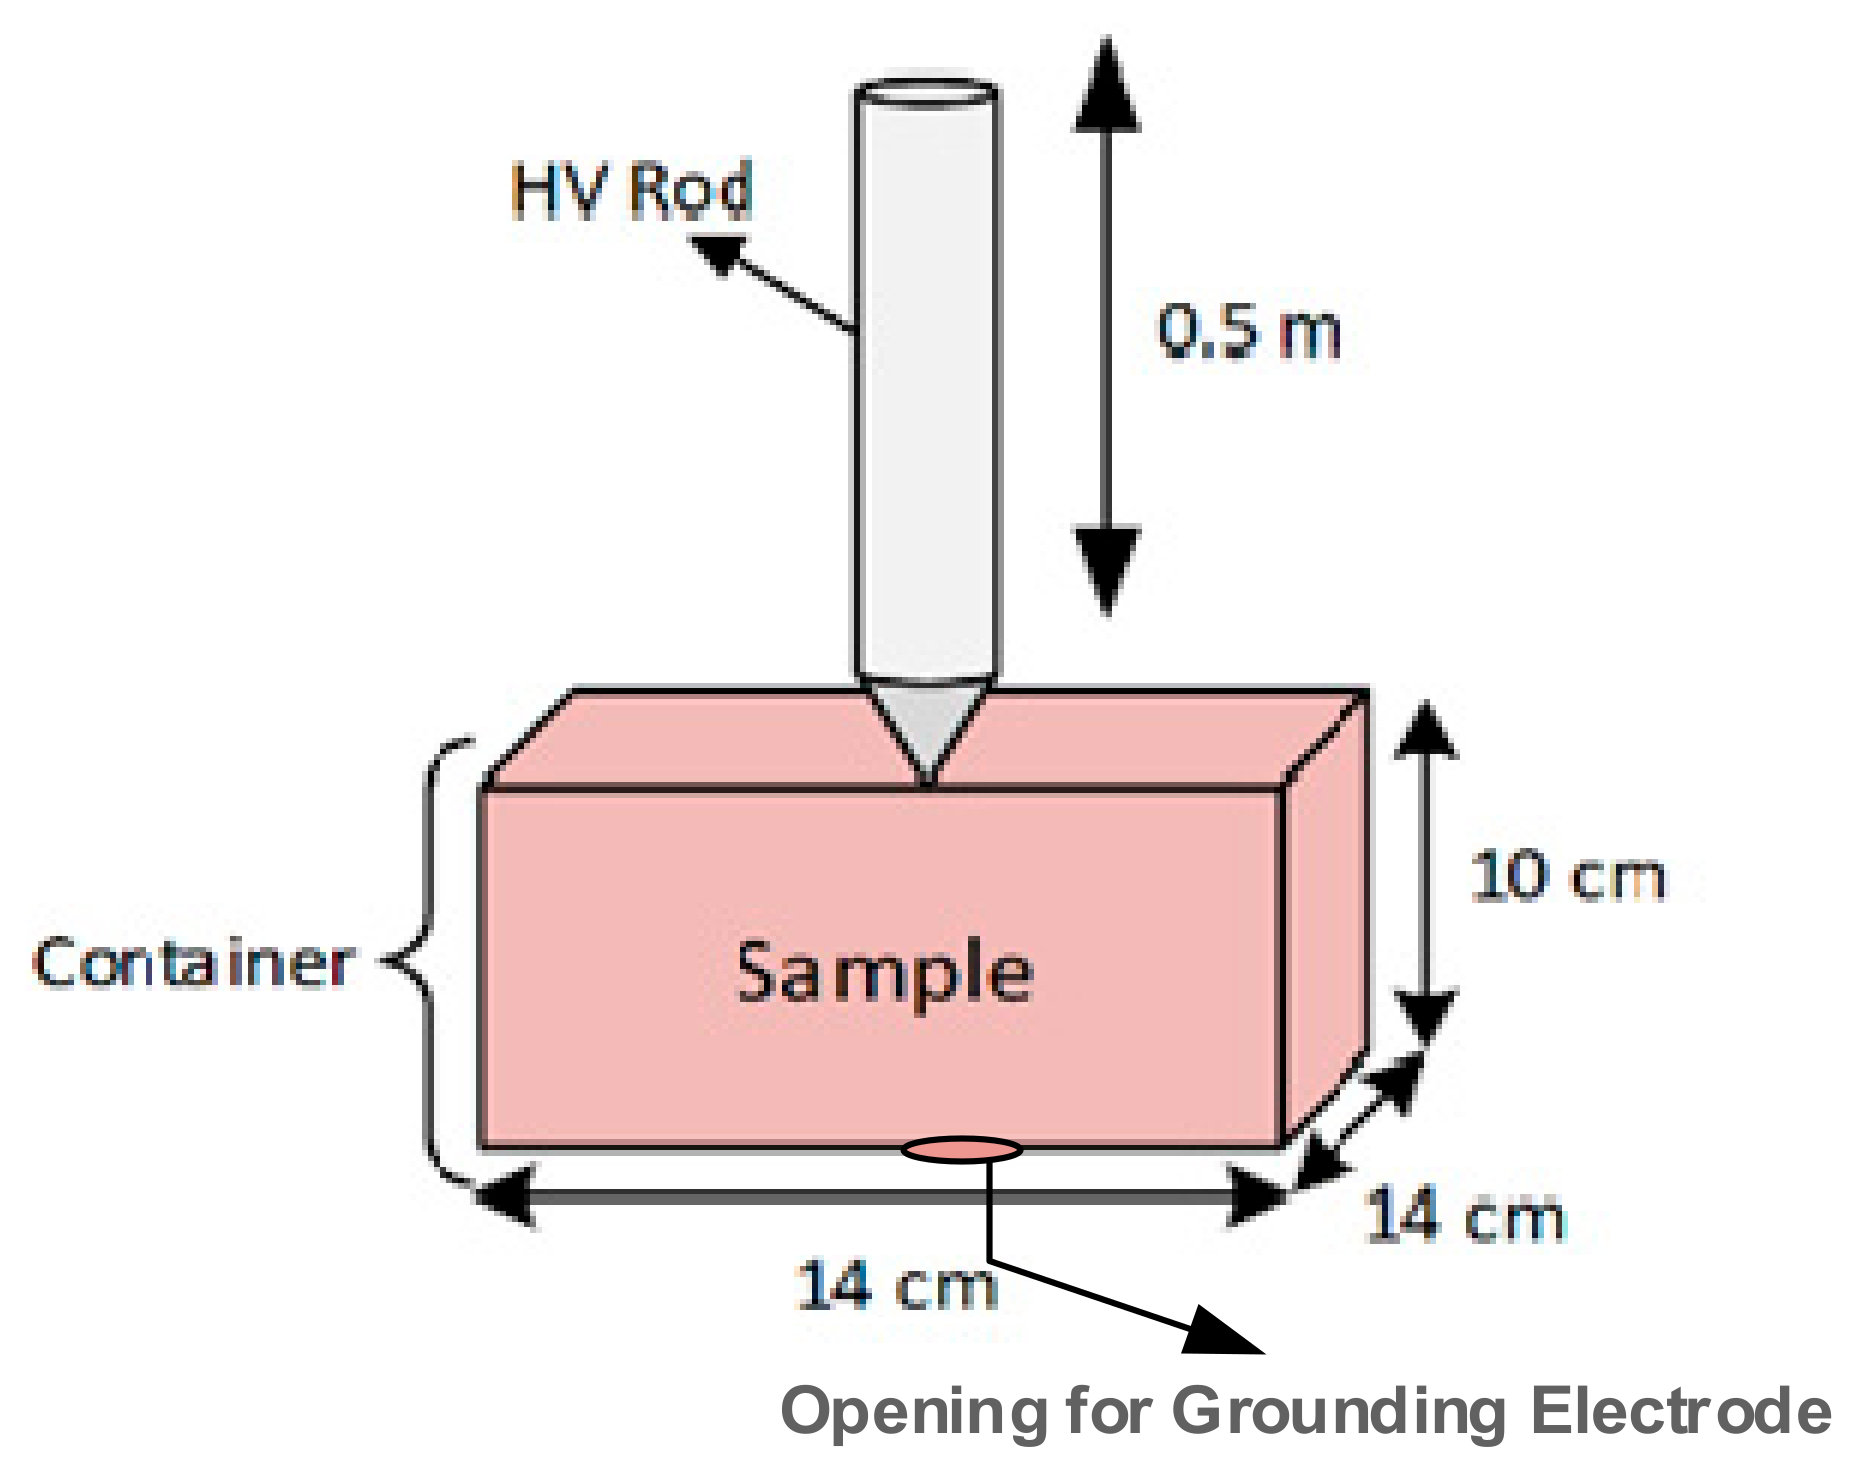
Figure 10. The container of dimension 14 × 14 × 10 cm
3 is designed in solver and assigned properties of a material to it. The copper rod with a pointy tip is designed and made in contact with the material. A vertex P1 is selected at the top of the container. After completion of the simulation, a parametric analysis of the results was performed. In the parametric analysis, the vertex P1 is displaced downward with the step size of 0.4 cm; the parametric analysis will help us get the electric field strength of materials from the tip to the end. The electric field strength is strong at the tip point, as this is the point where high voltage is applied. The field strength is weak at the middle point; the electric field strength is firm at the bottom. The field strength is weak in the middle, as we have assigned it with the properties of our proposed material, which are conductive in nature; the bottom region is the grounding point. Its high intensity reveals that incoming charges are effectively grounded.
Figure 10 shows the electric field intensity when 10 kV of voltage is applied to bentonite and laterite green mixture.
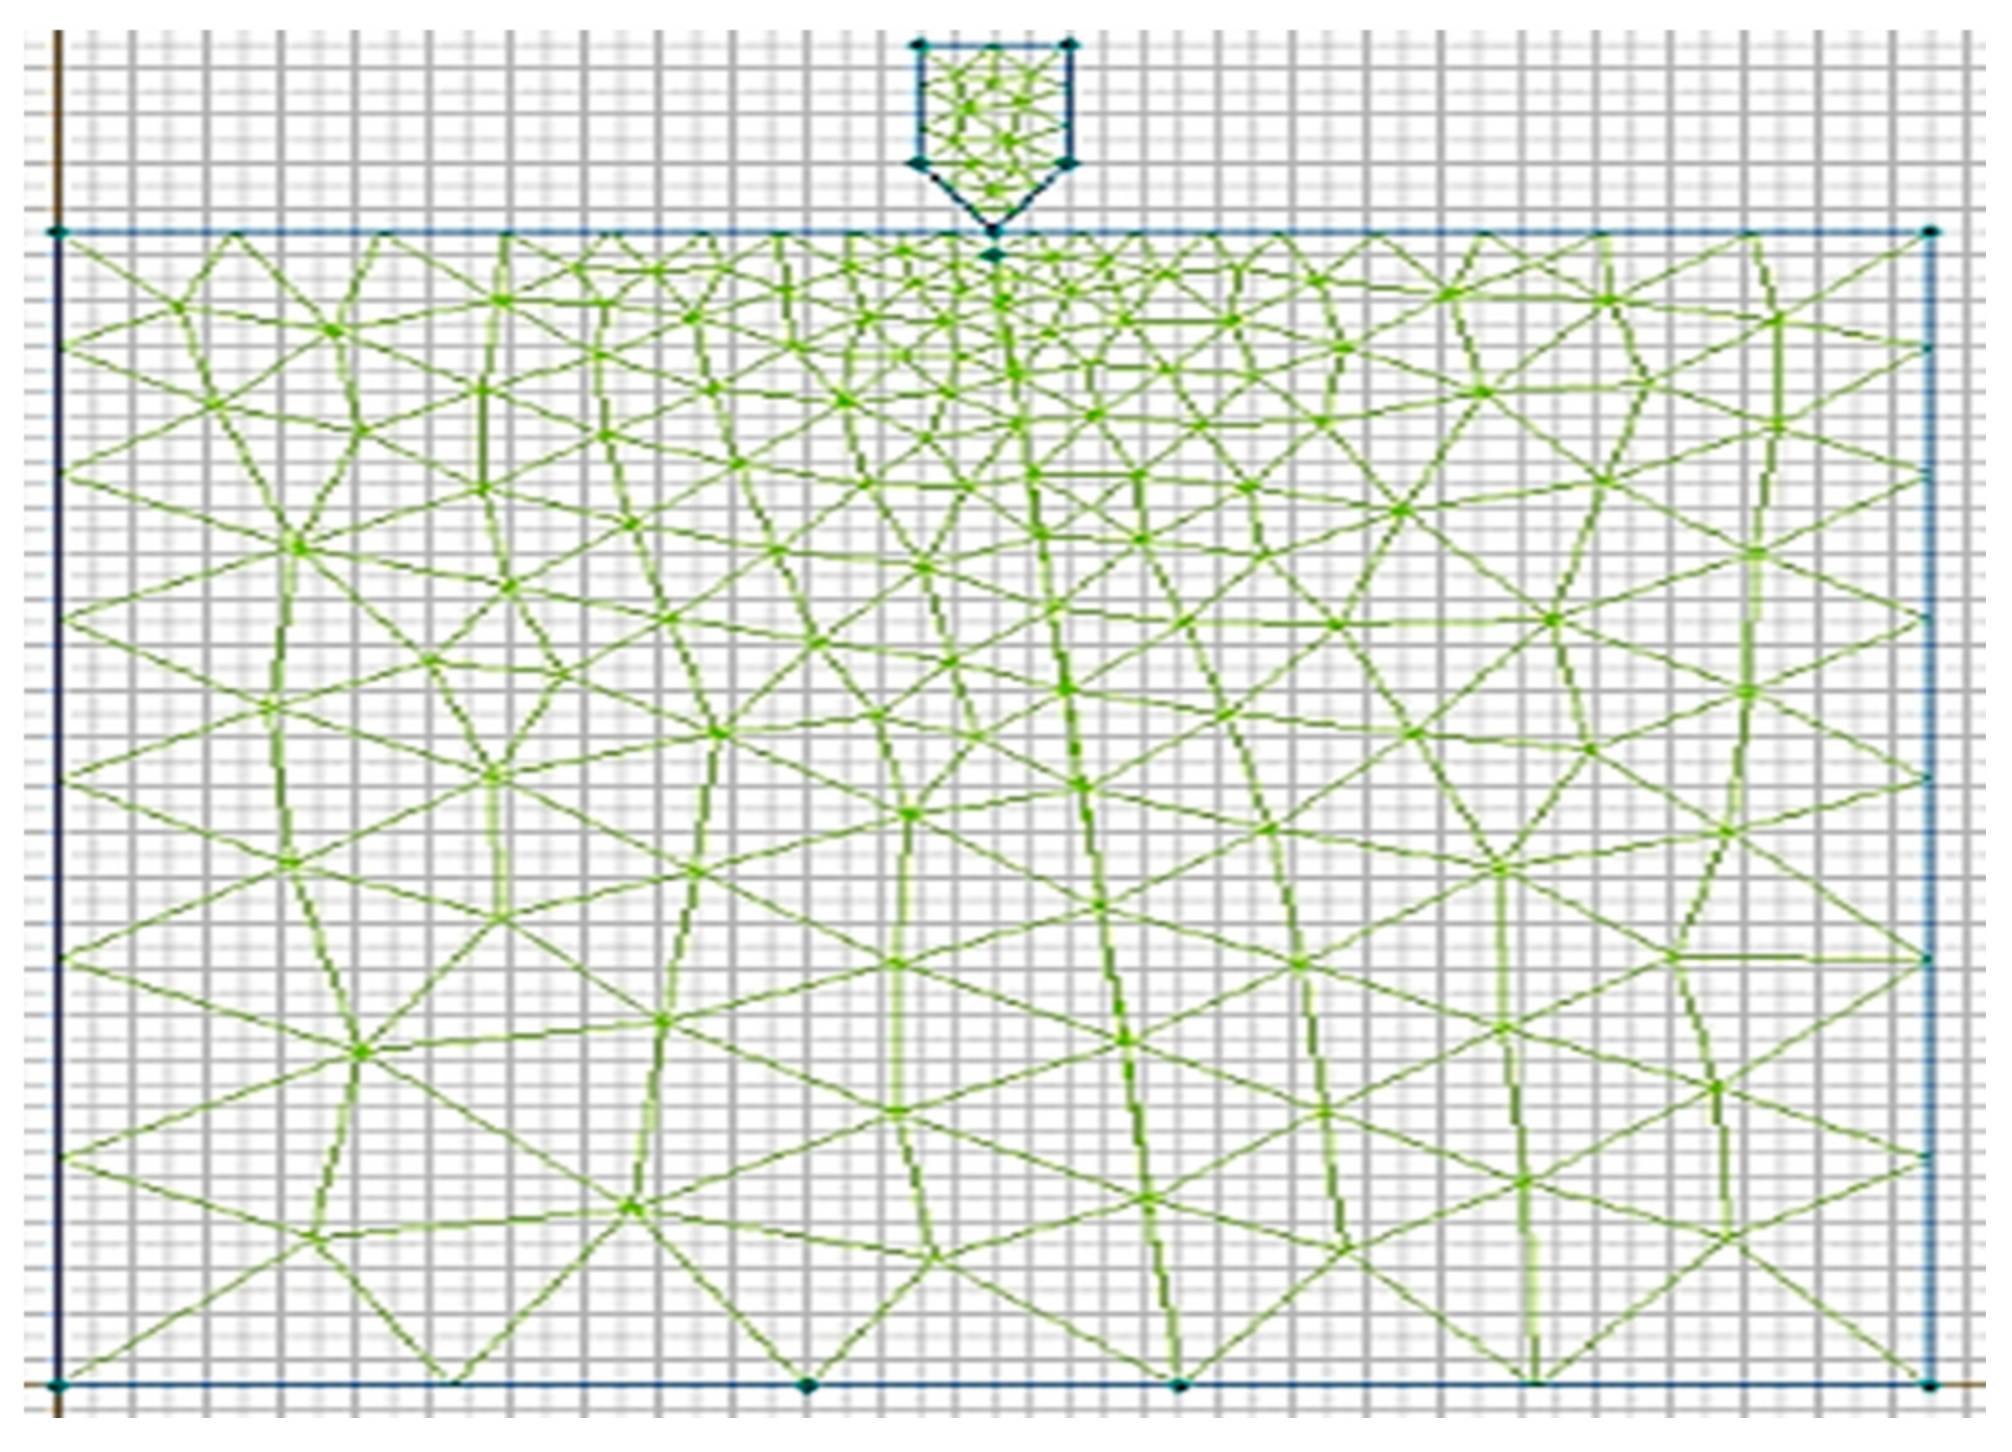
Figure 11 shows the meshing and design of the grounding system composed of a high-voltage electrode and the container comprising grounding materials.
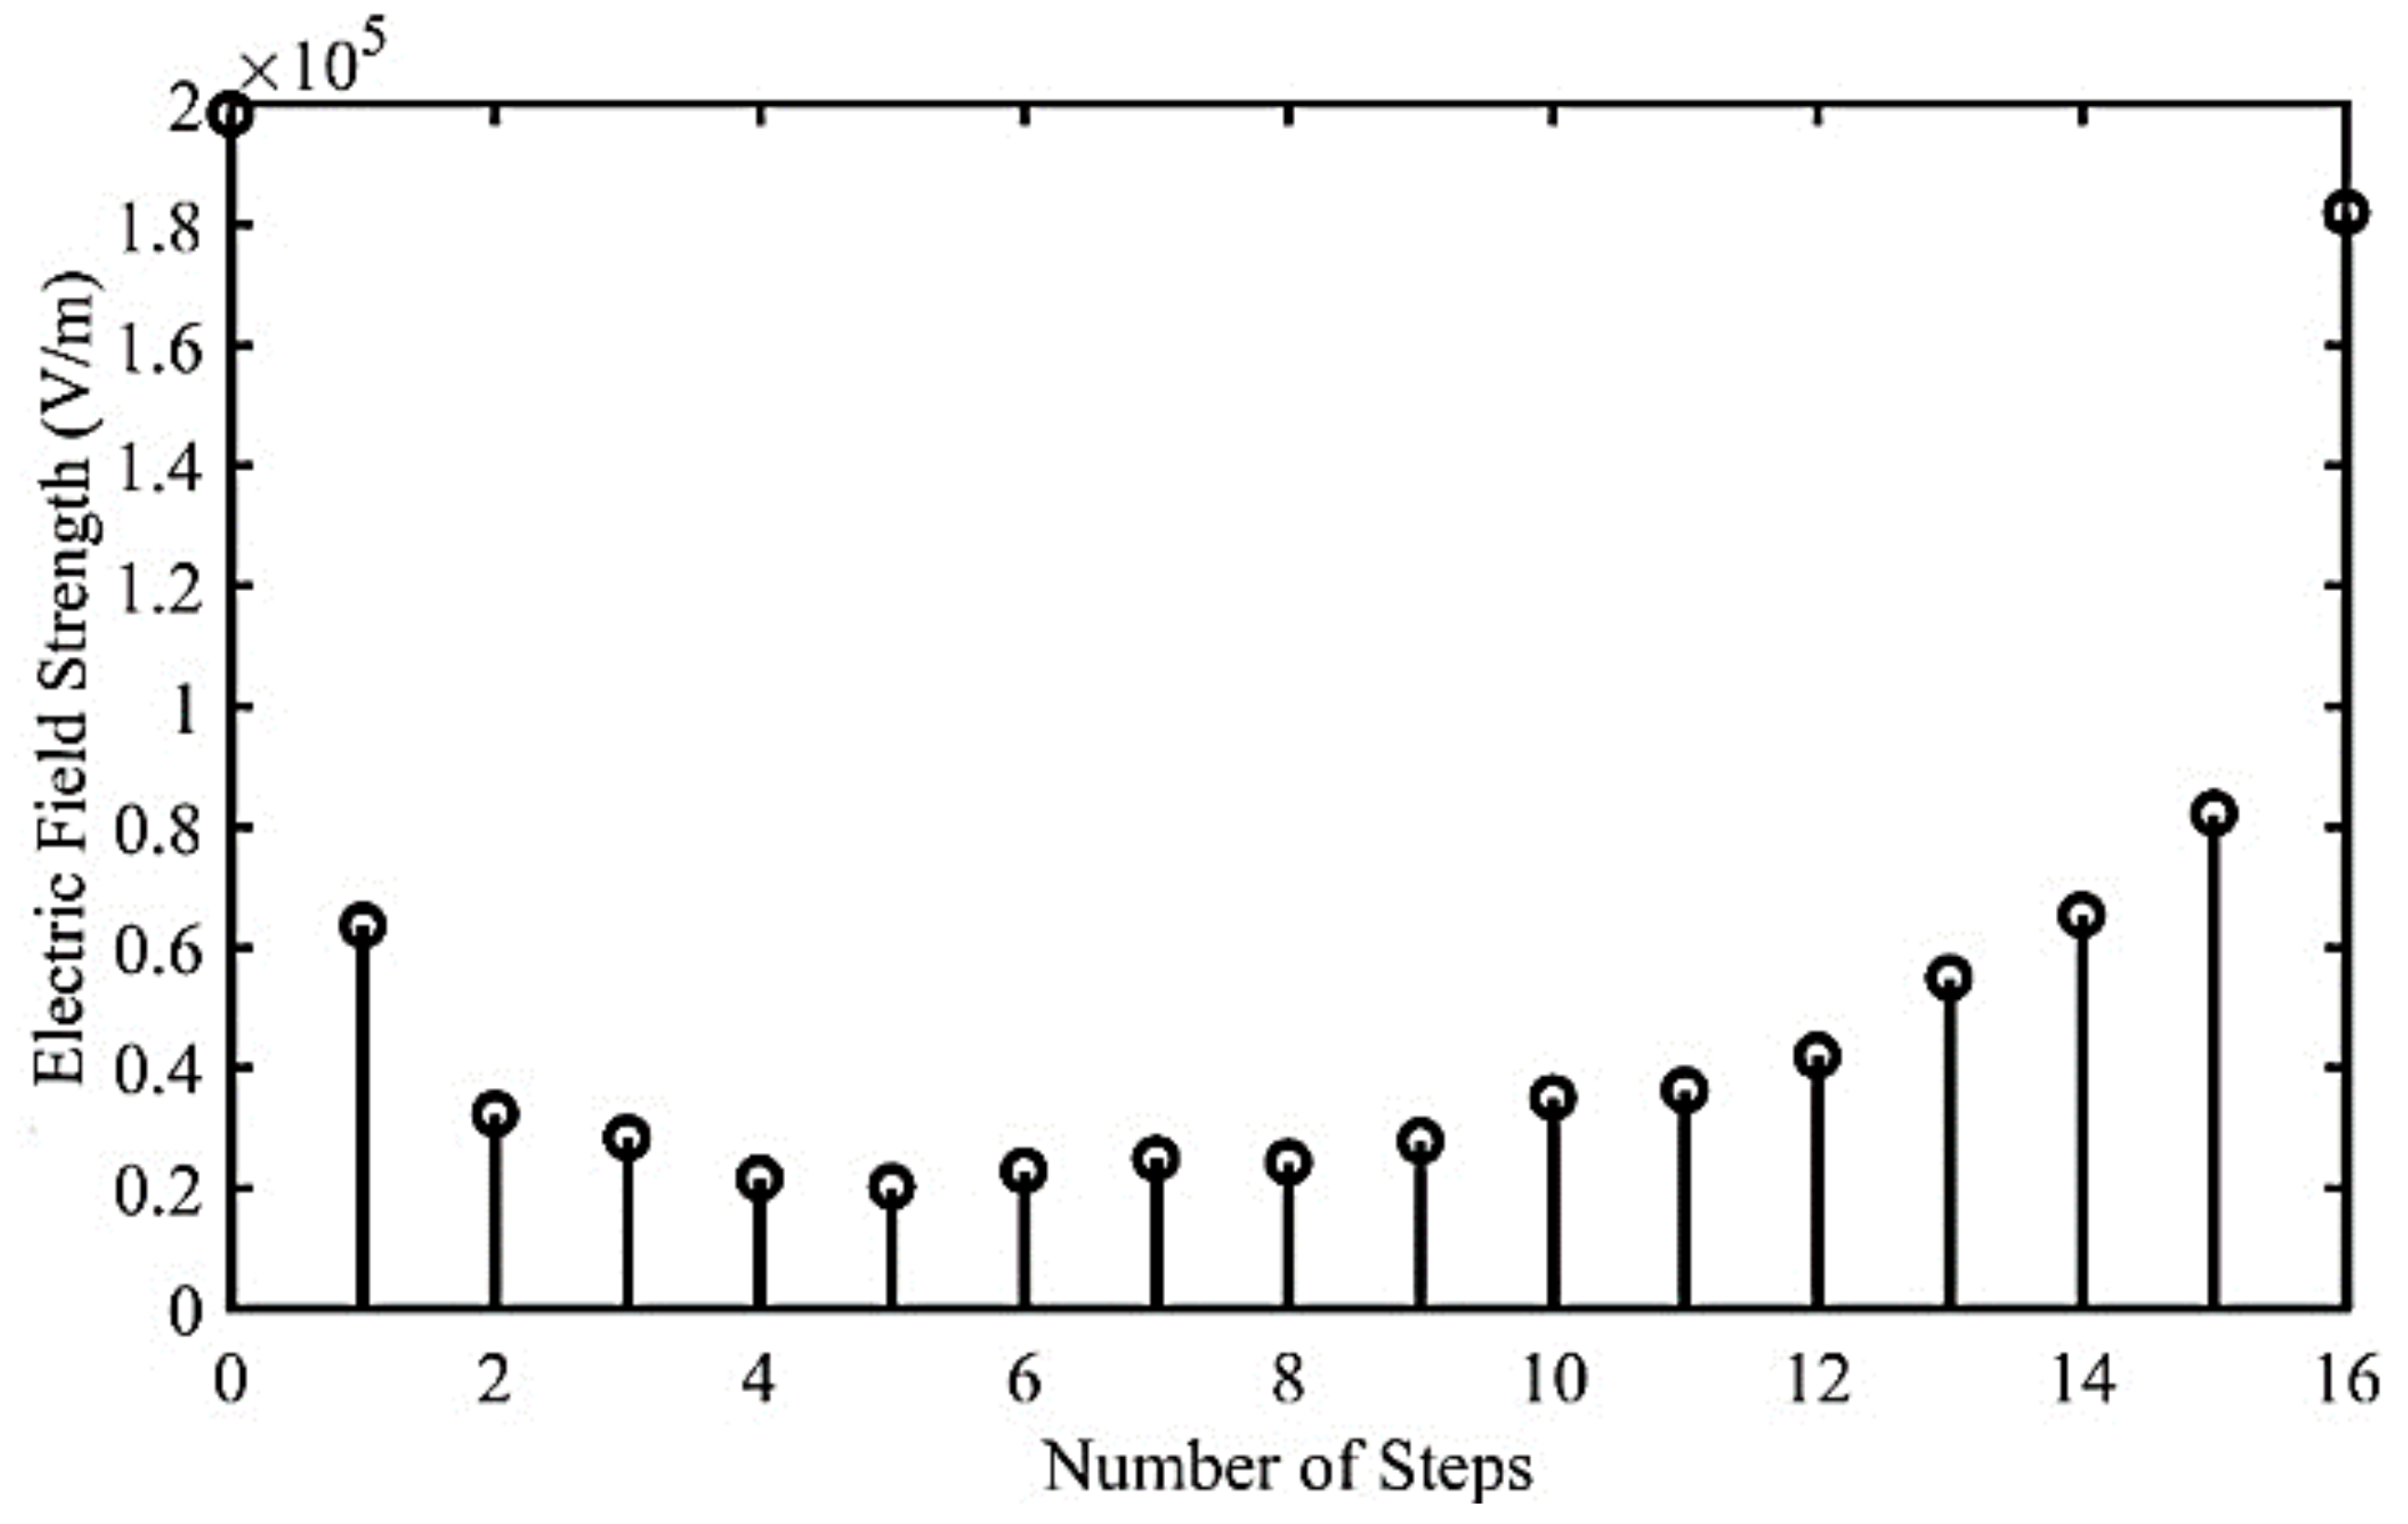
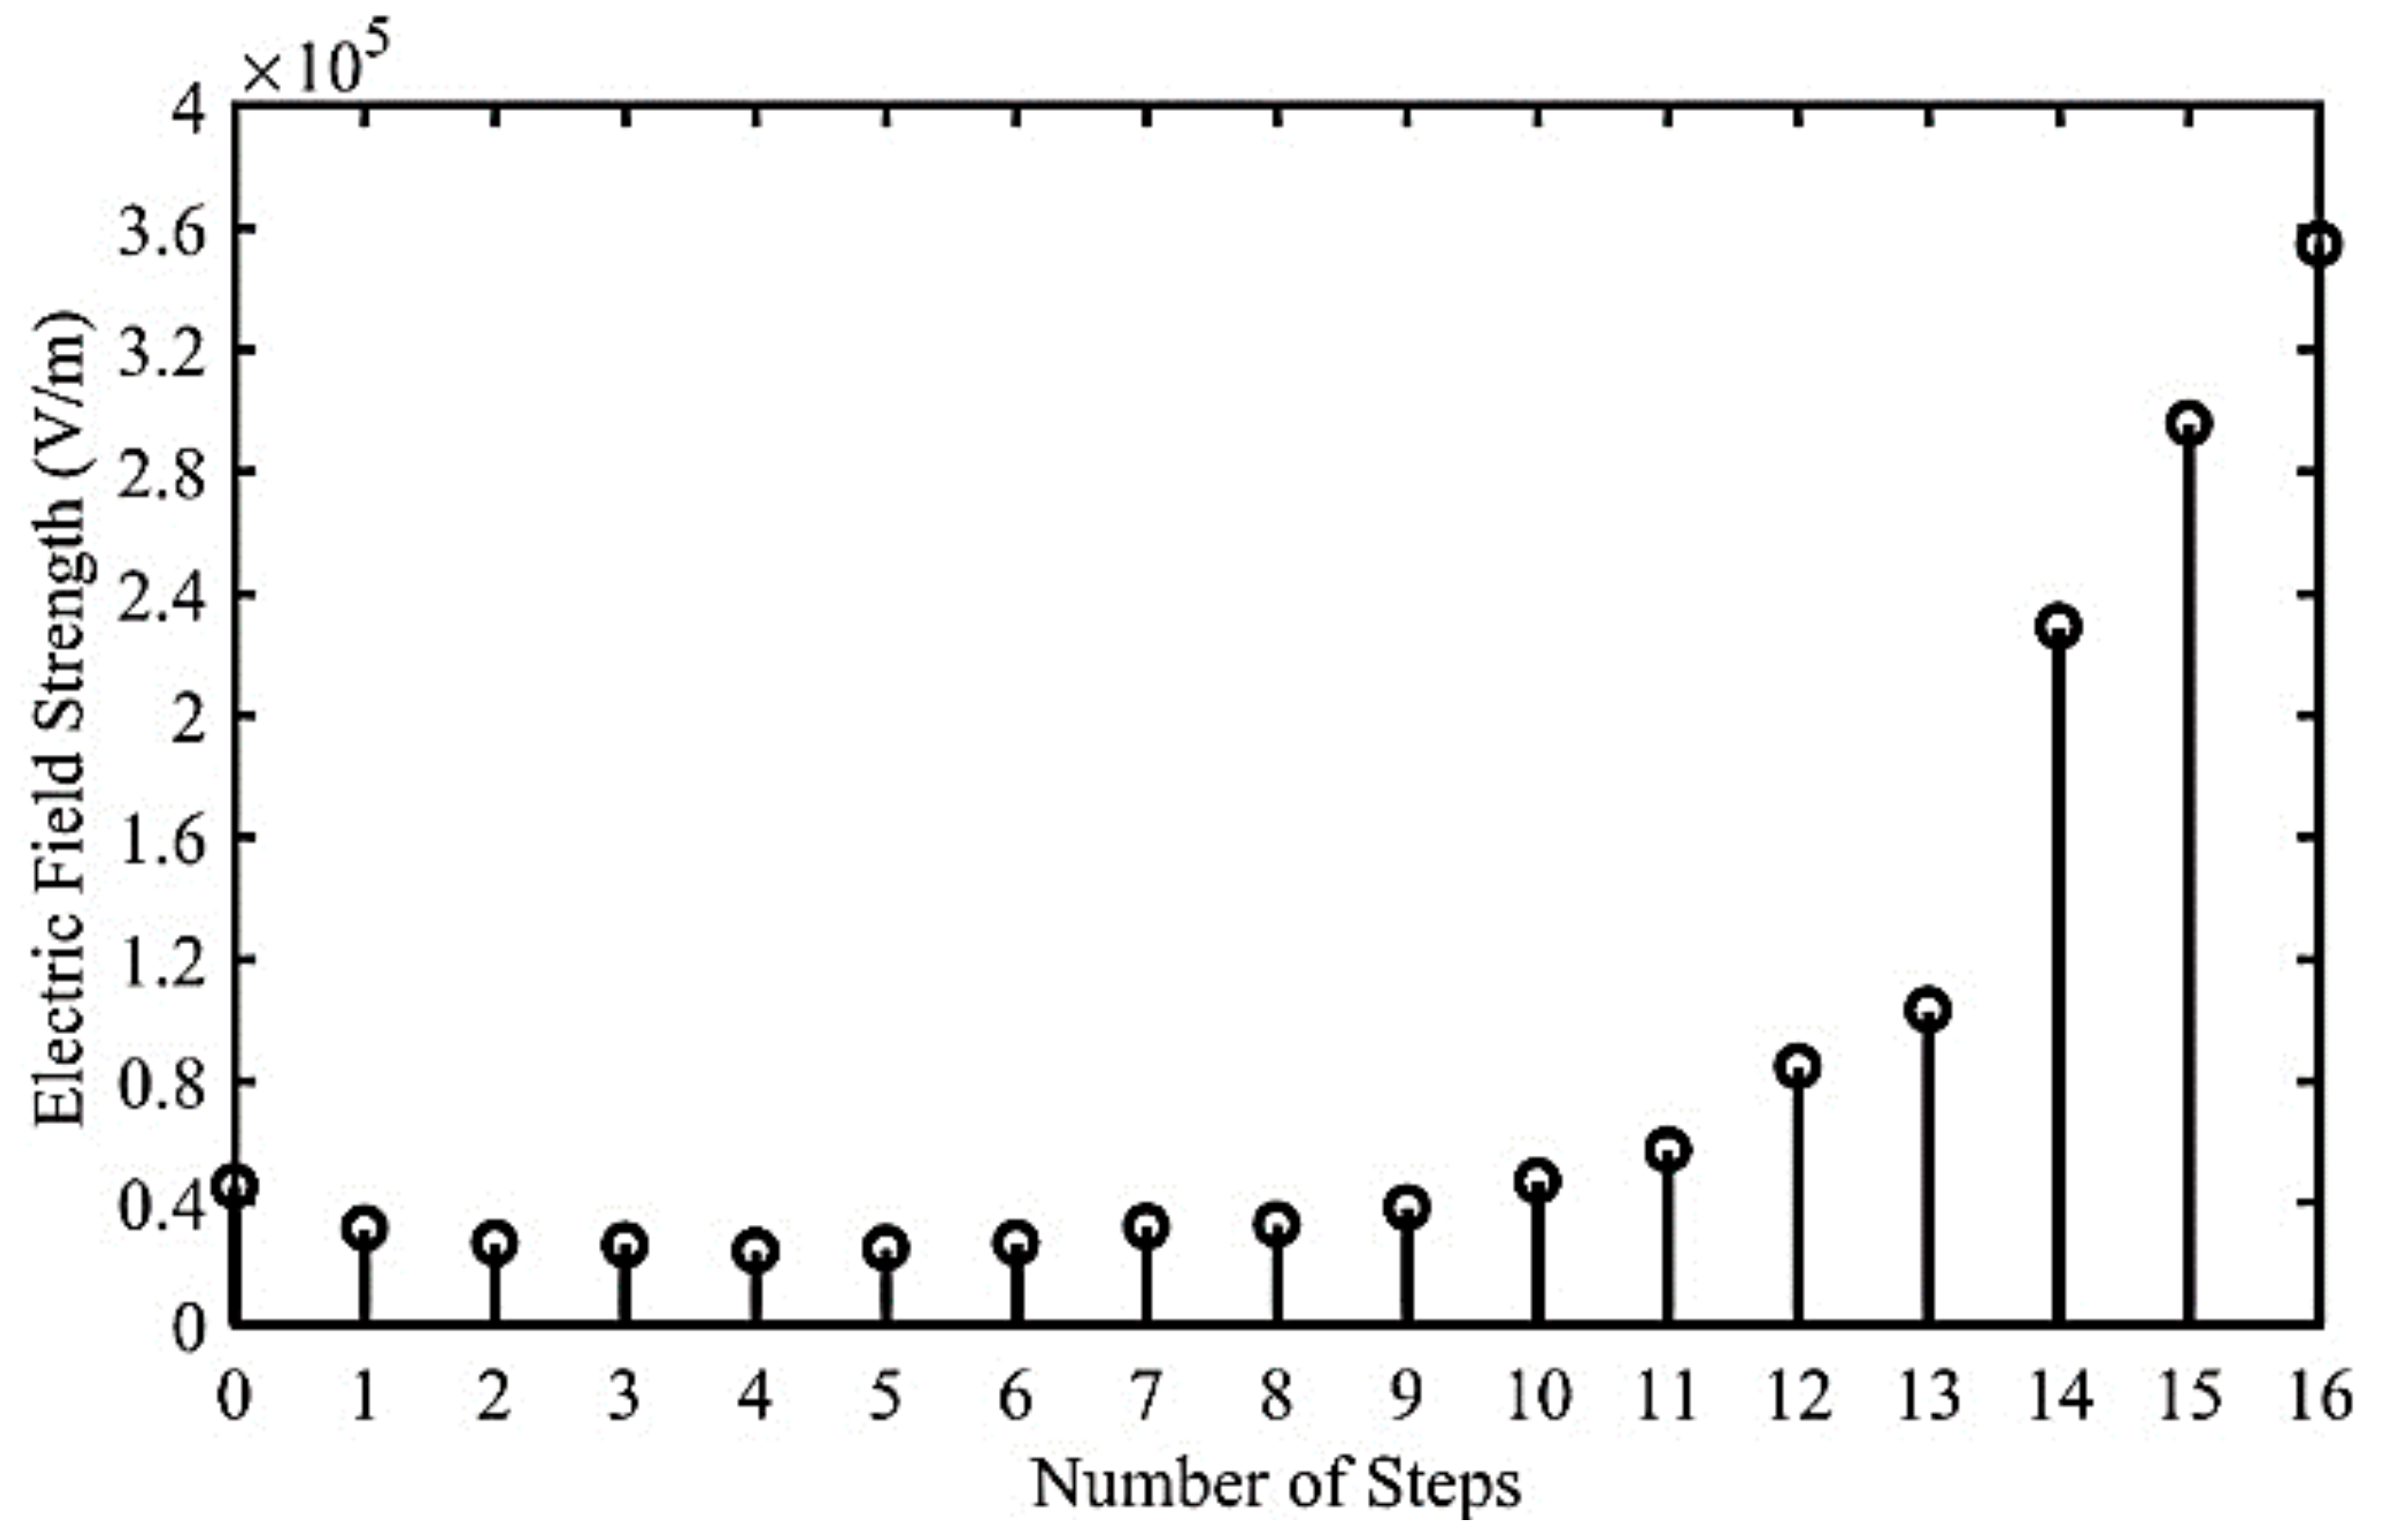
The line plot of the electric field intensity of the laterite green and bentonite mixture is shown in
Figure 12. The vertex point is displaced from the tip of the electrode to the bottom of the material using 16 steps of equal size (0.4 cm). The field strength at the top is a maximum of 4 ×
and nearly equal to 1.5
in the middle of the container. The field strength increases at the bottom of the container, illustrating that the proposed mixture allows for the shortest path for the incoming surges and immediately grounds the high voltages, as the field strength is minimum at the center and maximum at the ground plate of the container. The vertical axis represents the electric field intensity, and the horizontal axis represents the equal distance of 0.4 from the tip of the high-voltage electrode to the ground electrode. The electric field intensity as a function of distance is shown in
Figure 12,
Figure 13,
Figure 14,
Figure 15 and
Figure 16.
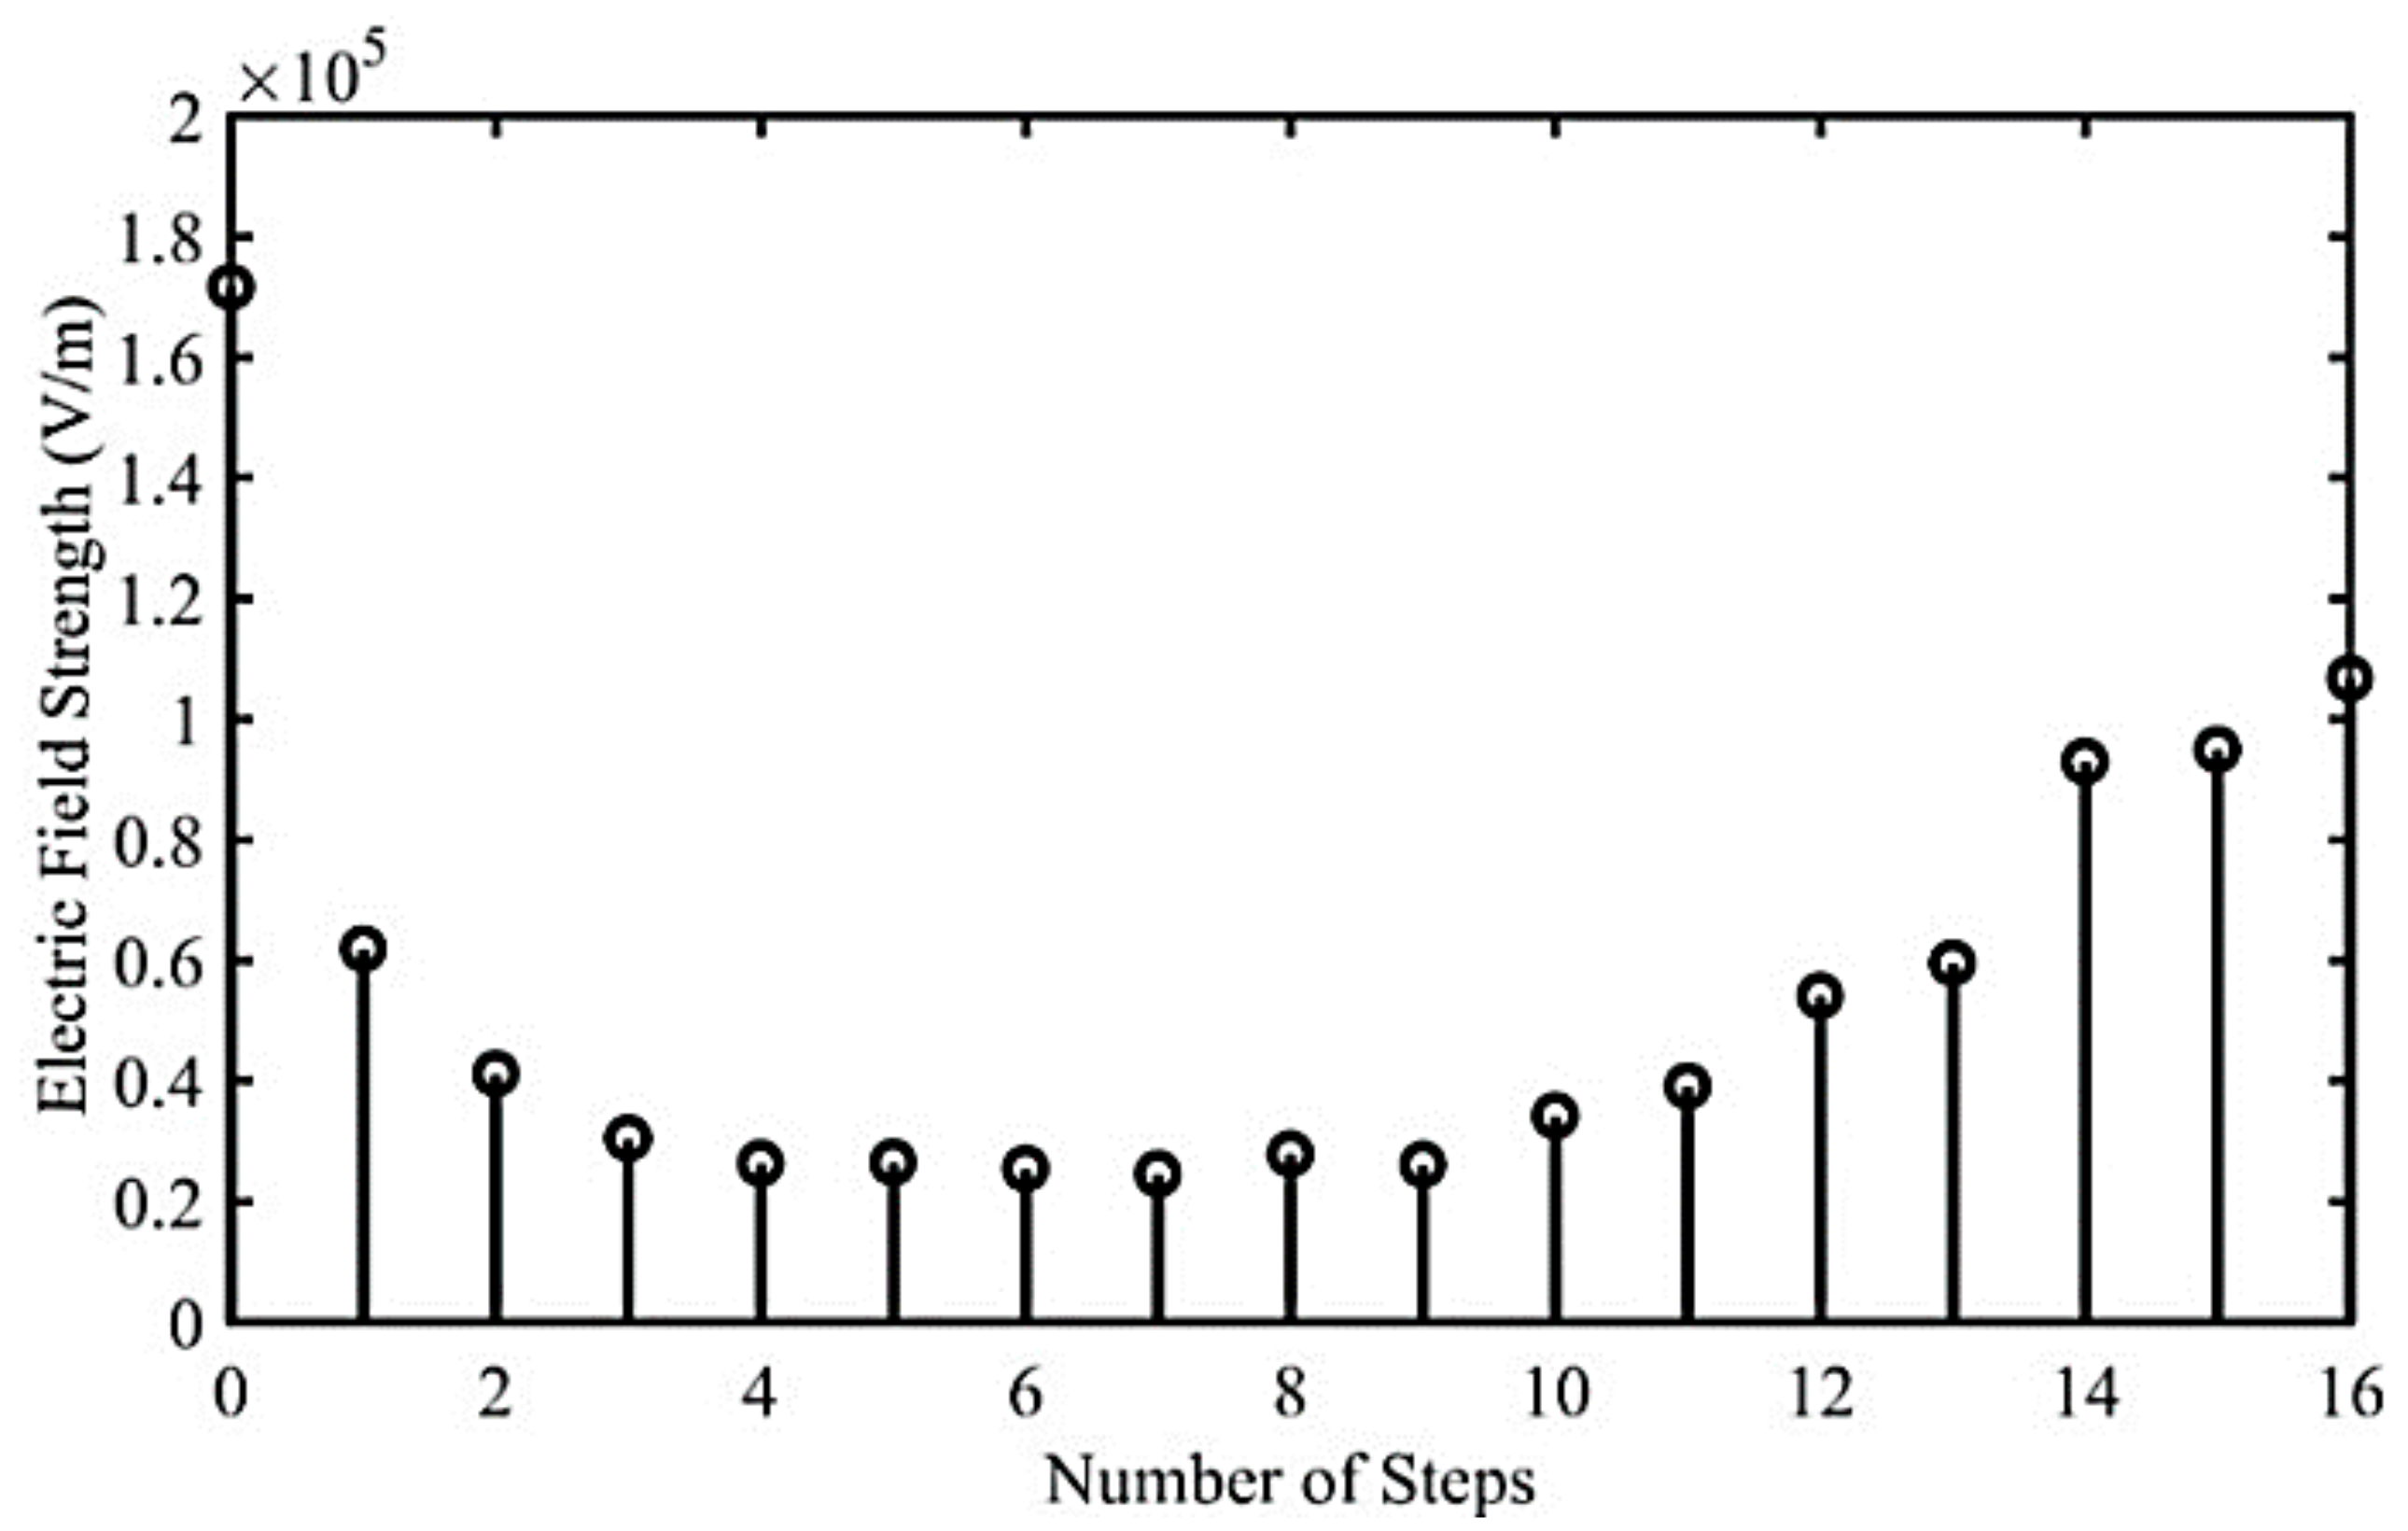
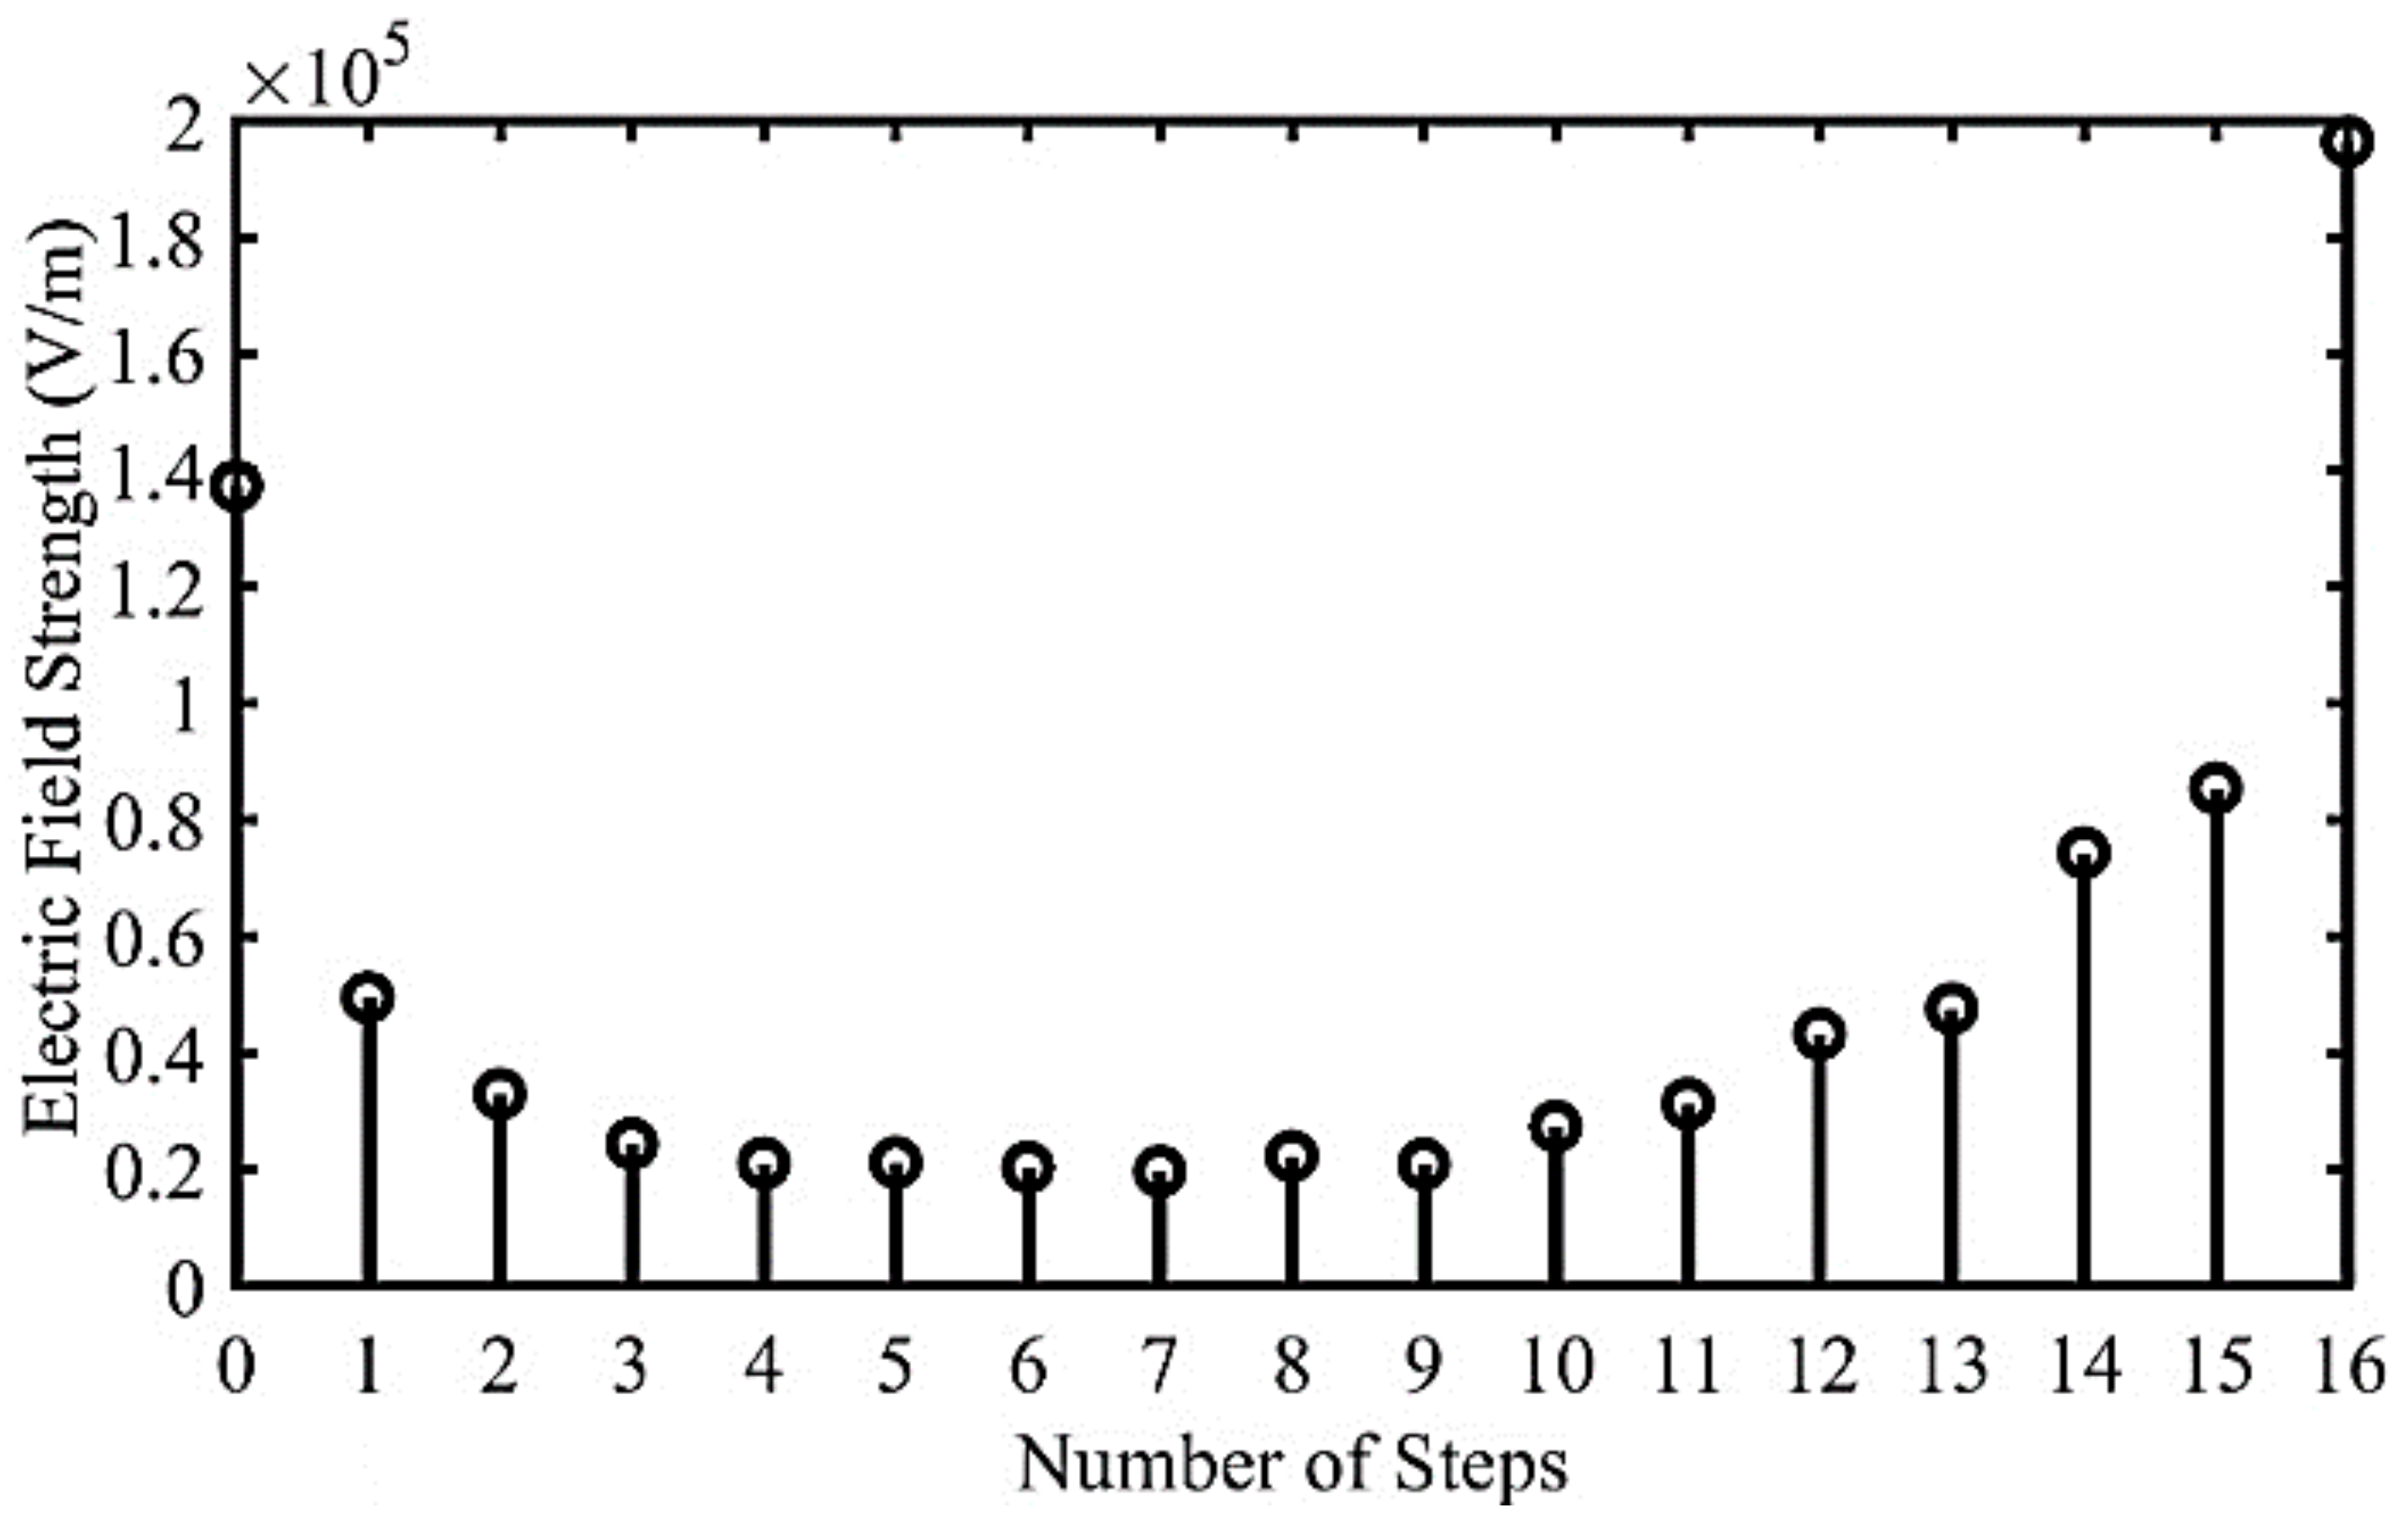
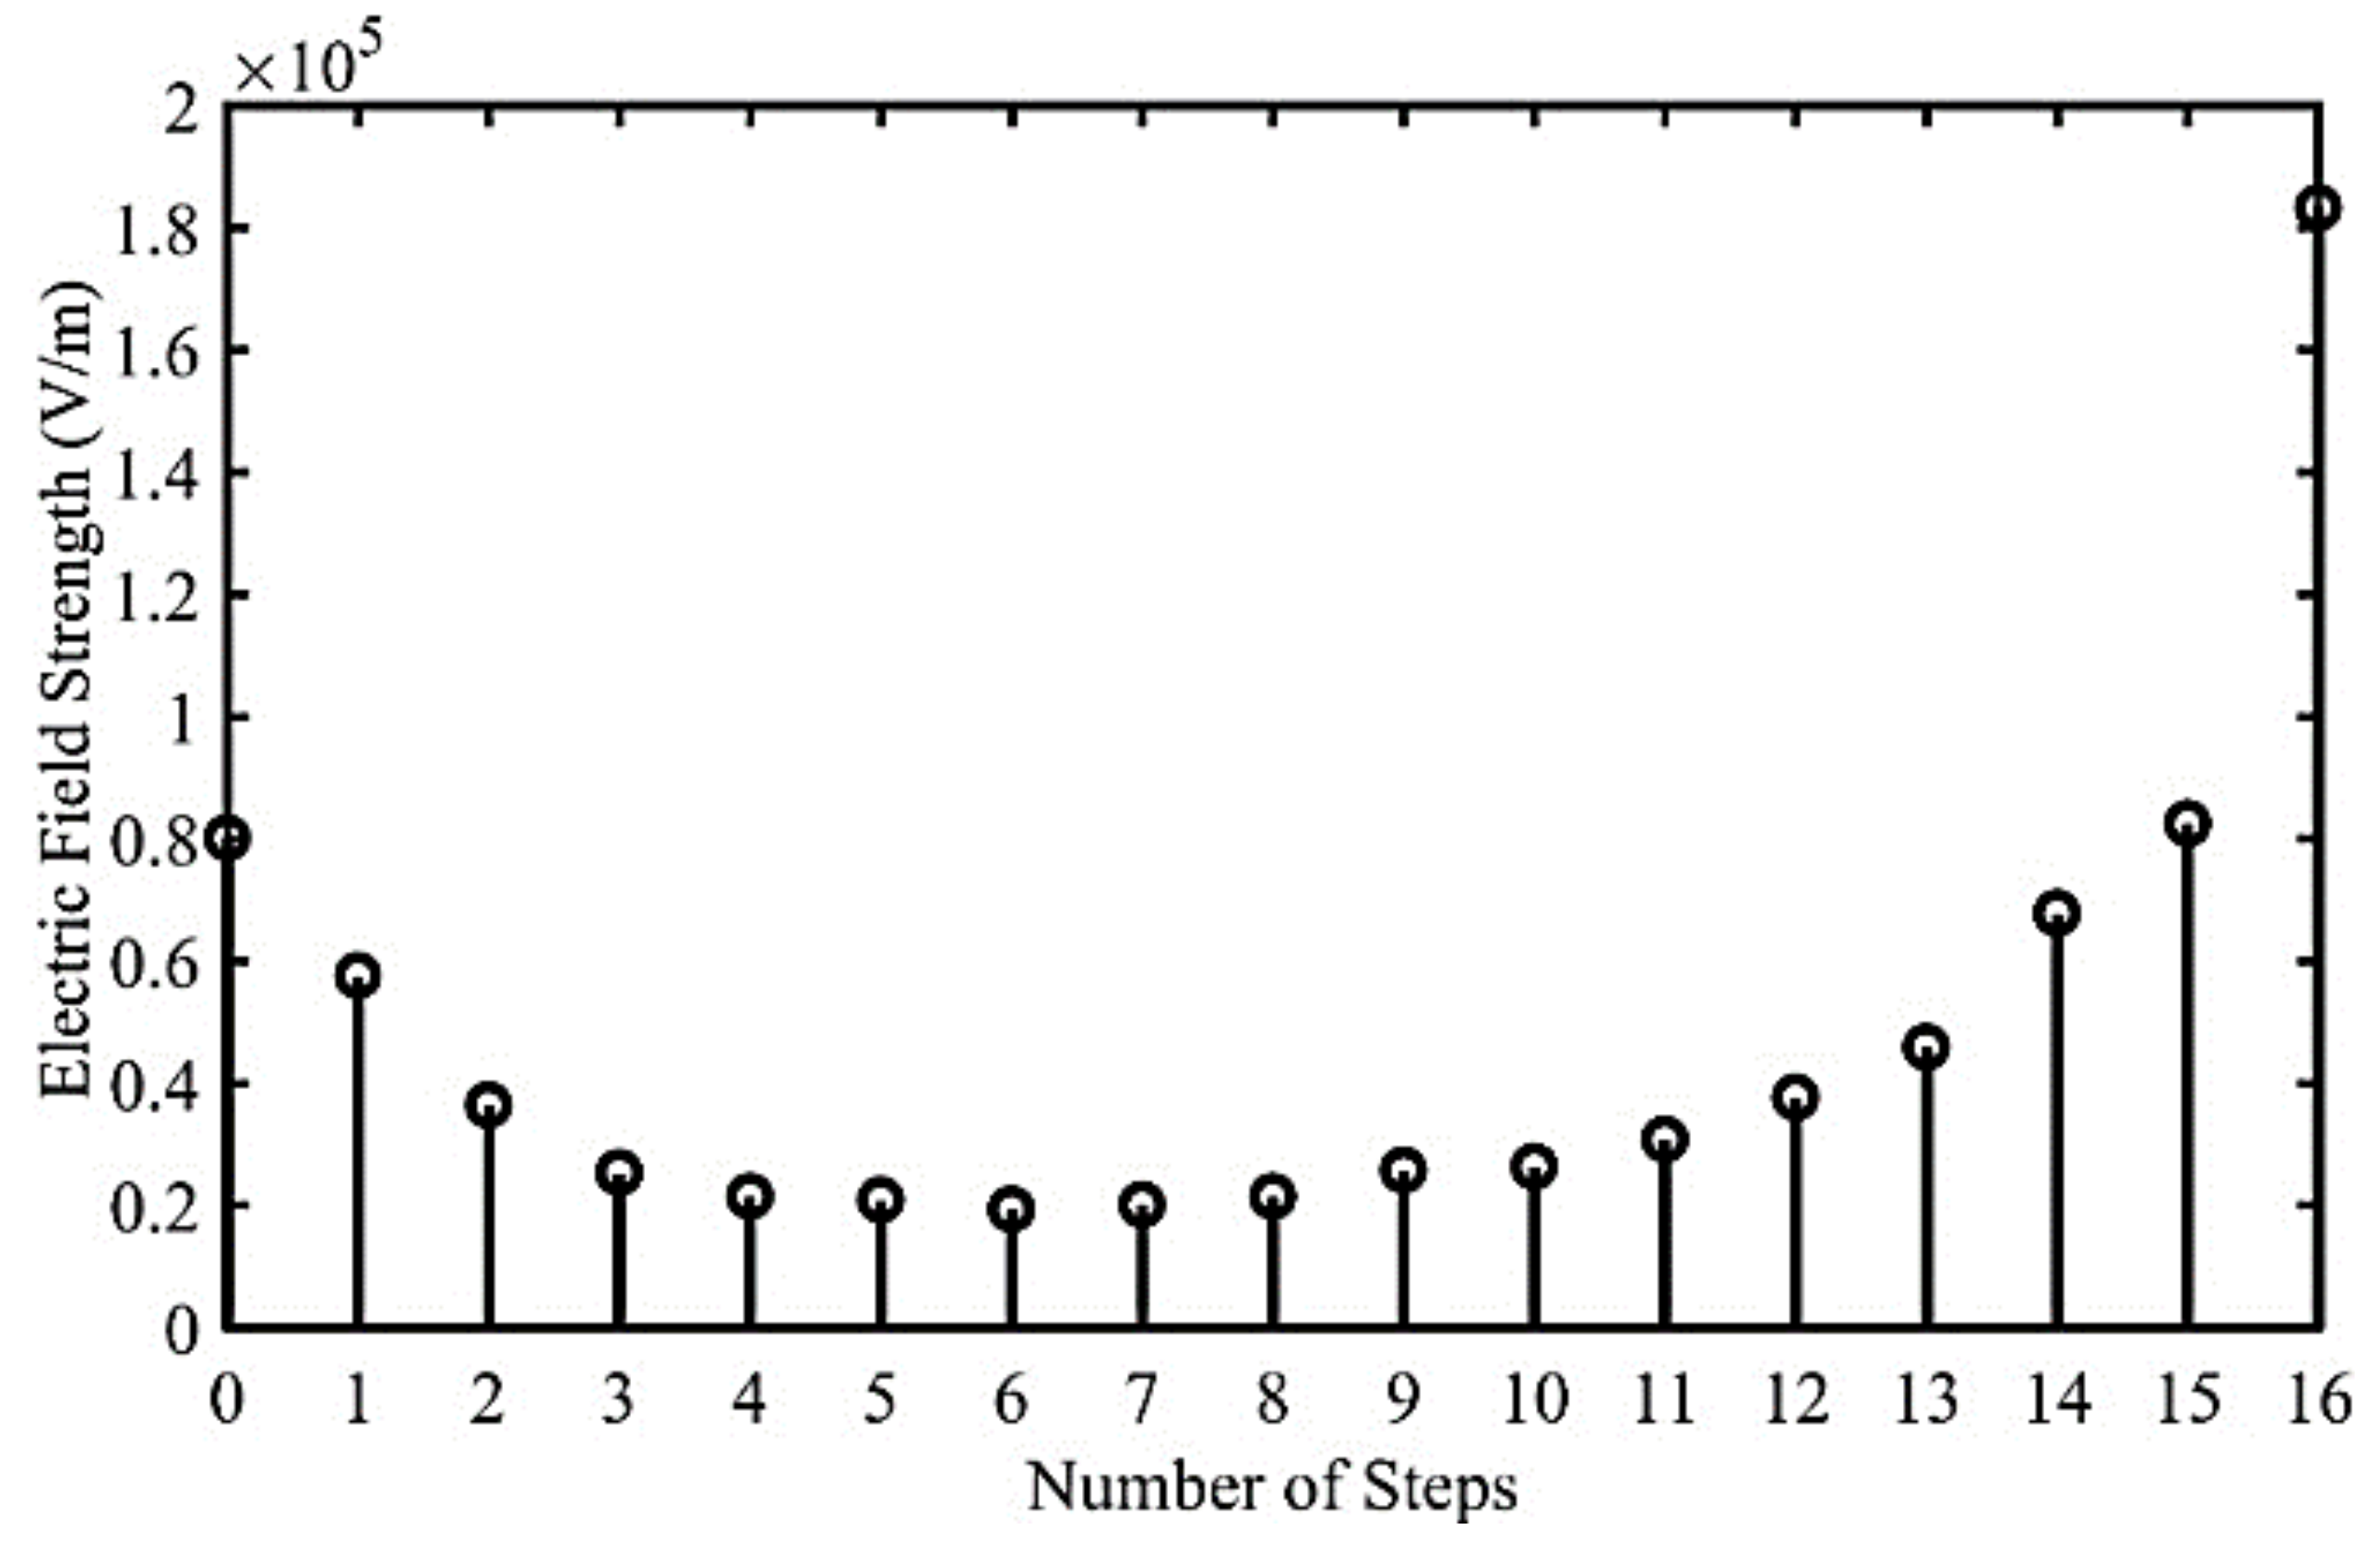
Similarly, the line plots of all the other samples tested are as follows.
5. XRD Analysis of the Proposed Sample
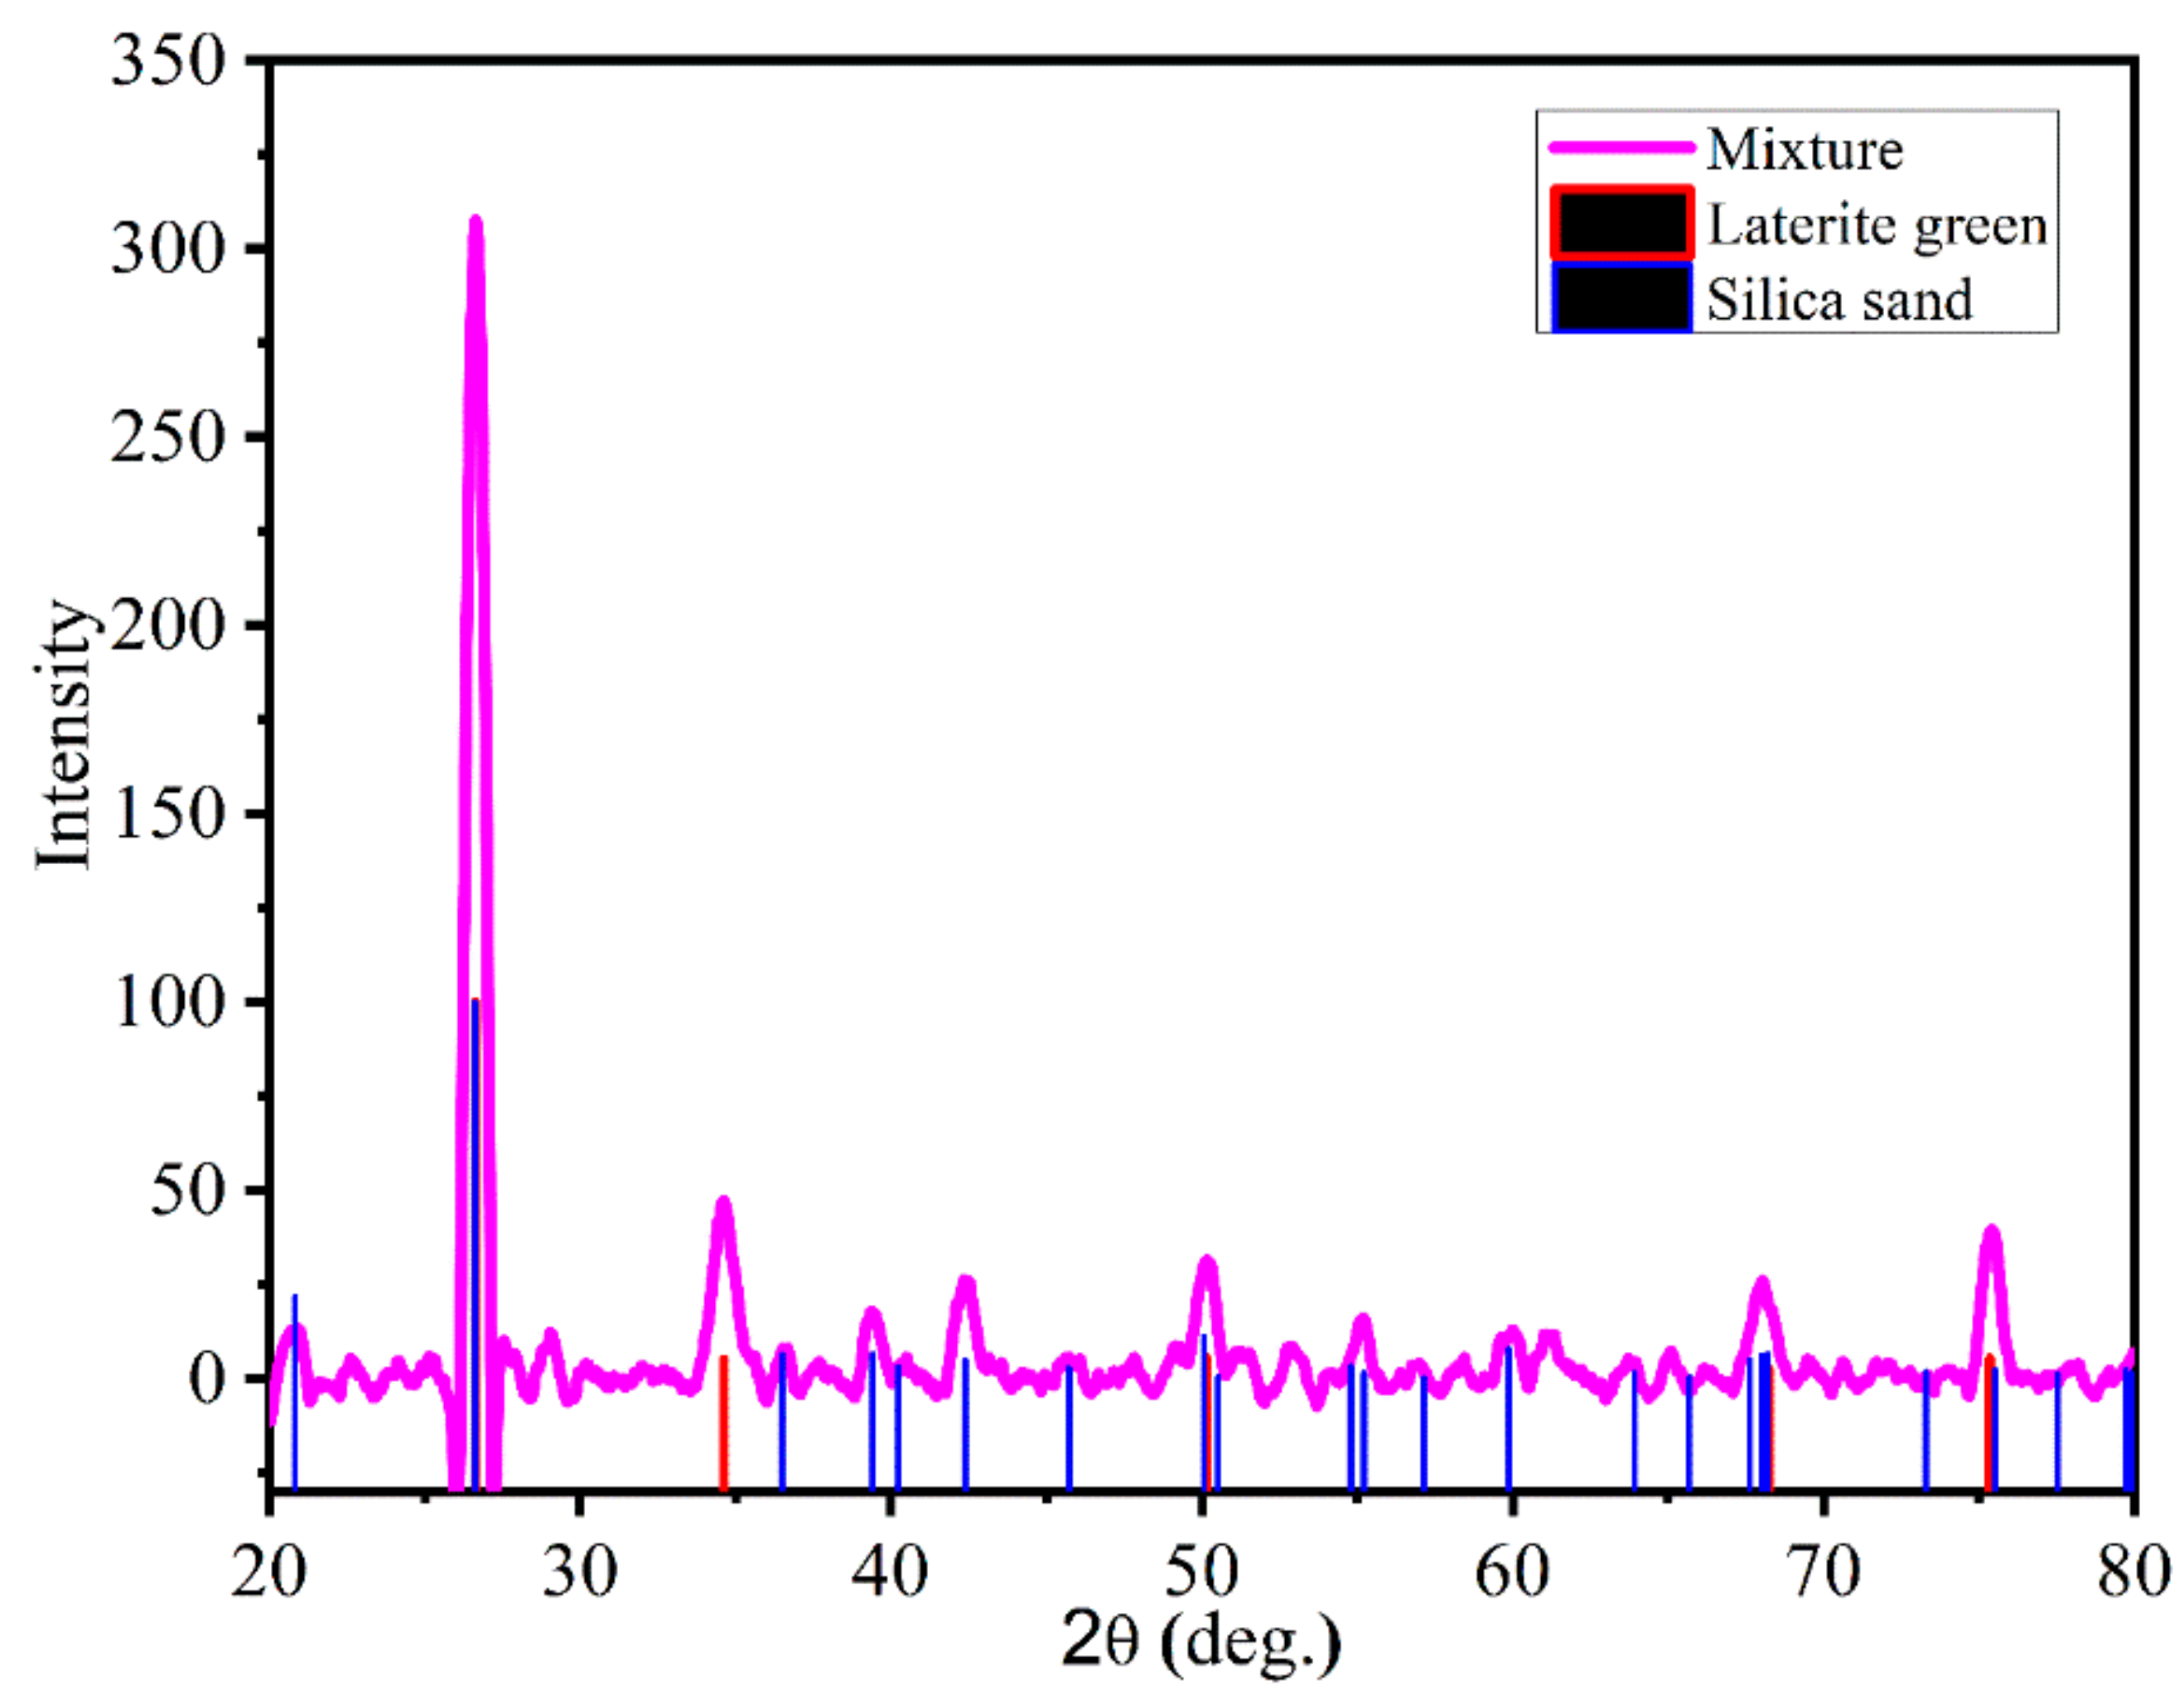
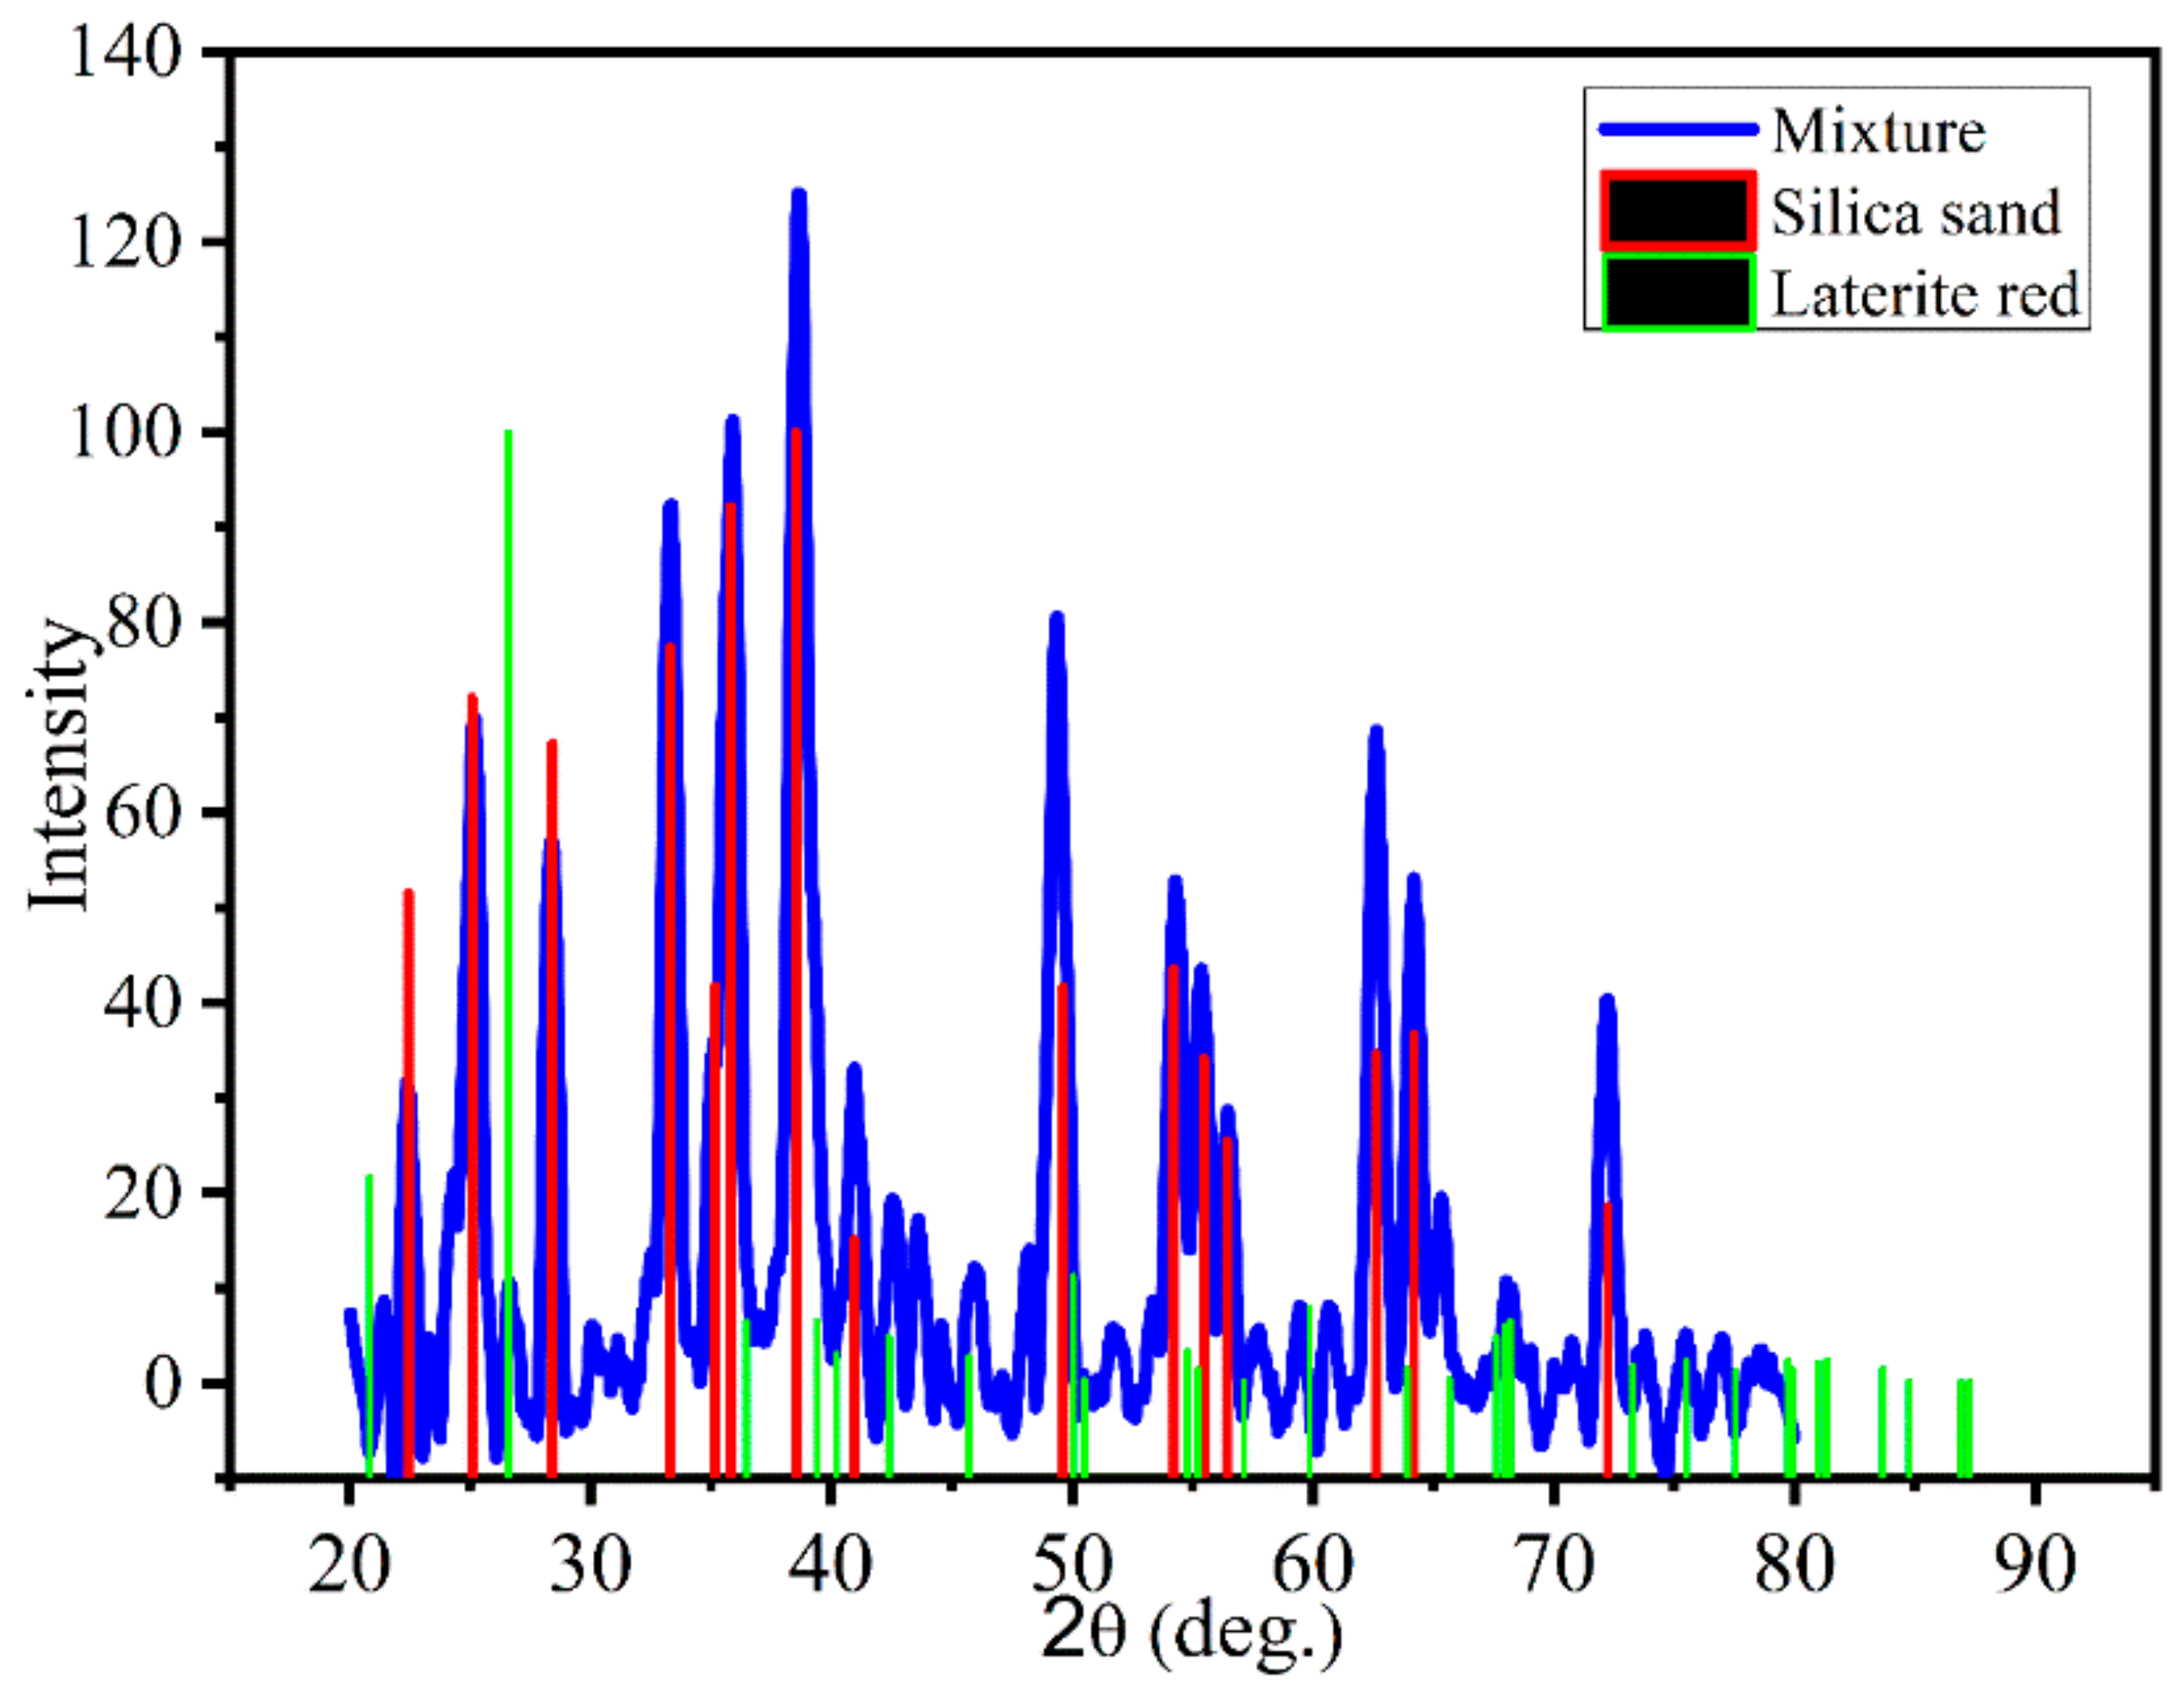
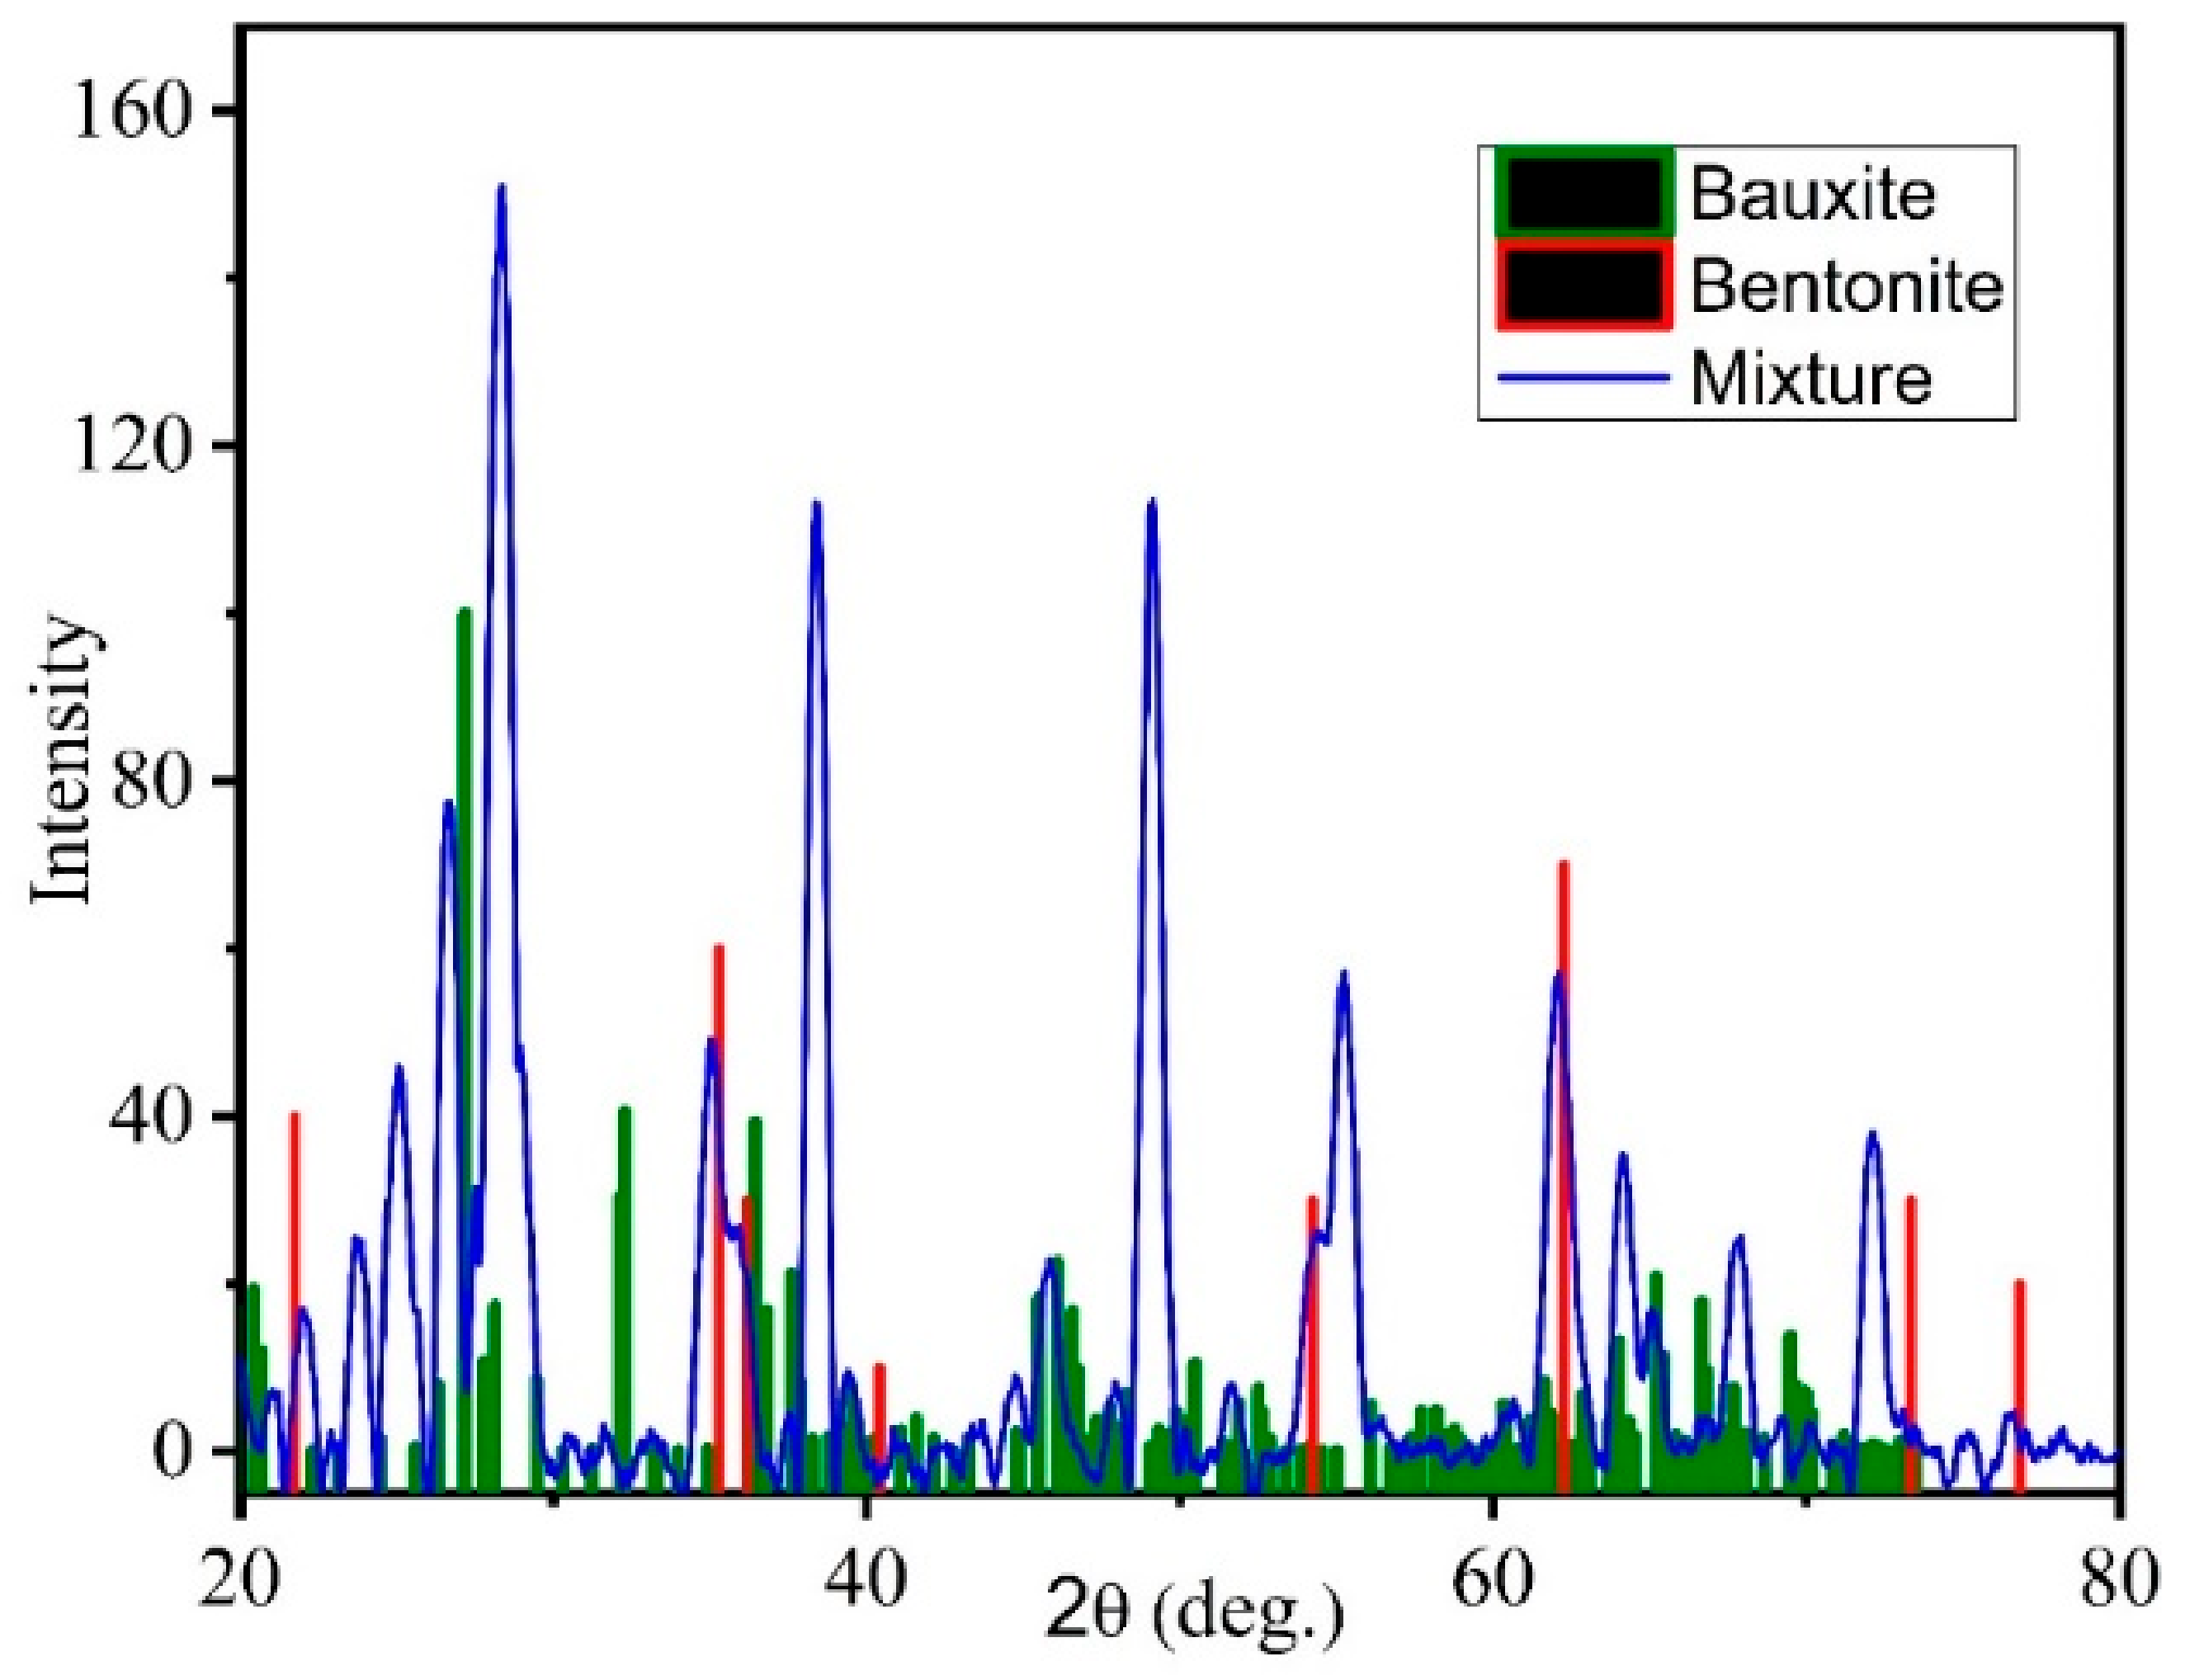
The atomic and molecular structure of a crystal can be obtained using an X-ray diffraction technique, in which the X-ray beam is diffracted into many specific directions due to the sample crystalline structure. X-ray crystallography or diffraction is the only technique that shows structural data such as crystal structure, chemical composition, crystallite size, orientation, and layer thickness. XRD curves for all the samples were done, and the obtained results are shown in
Figure 17,
Figure 18 and
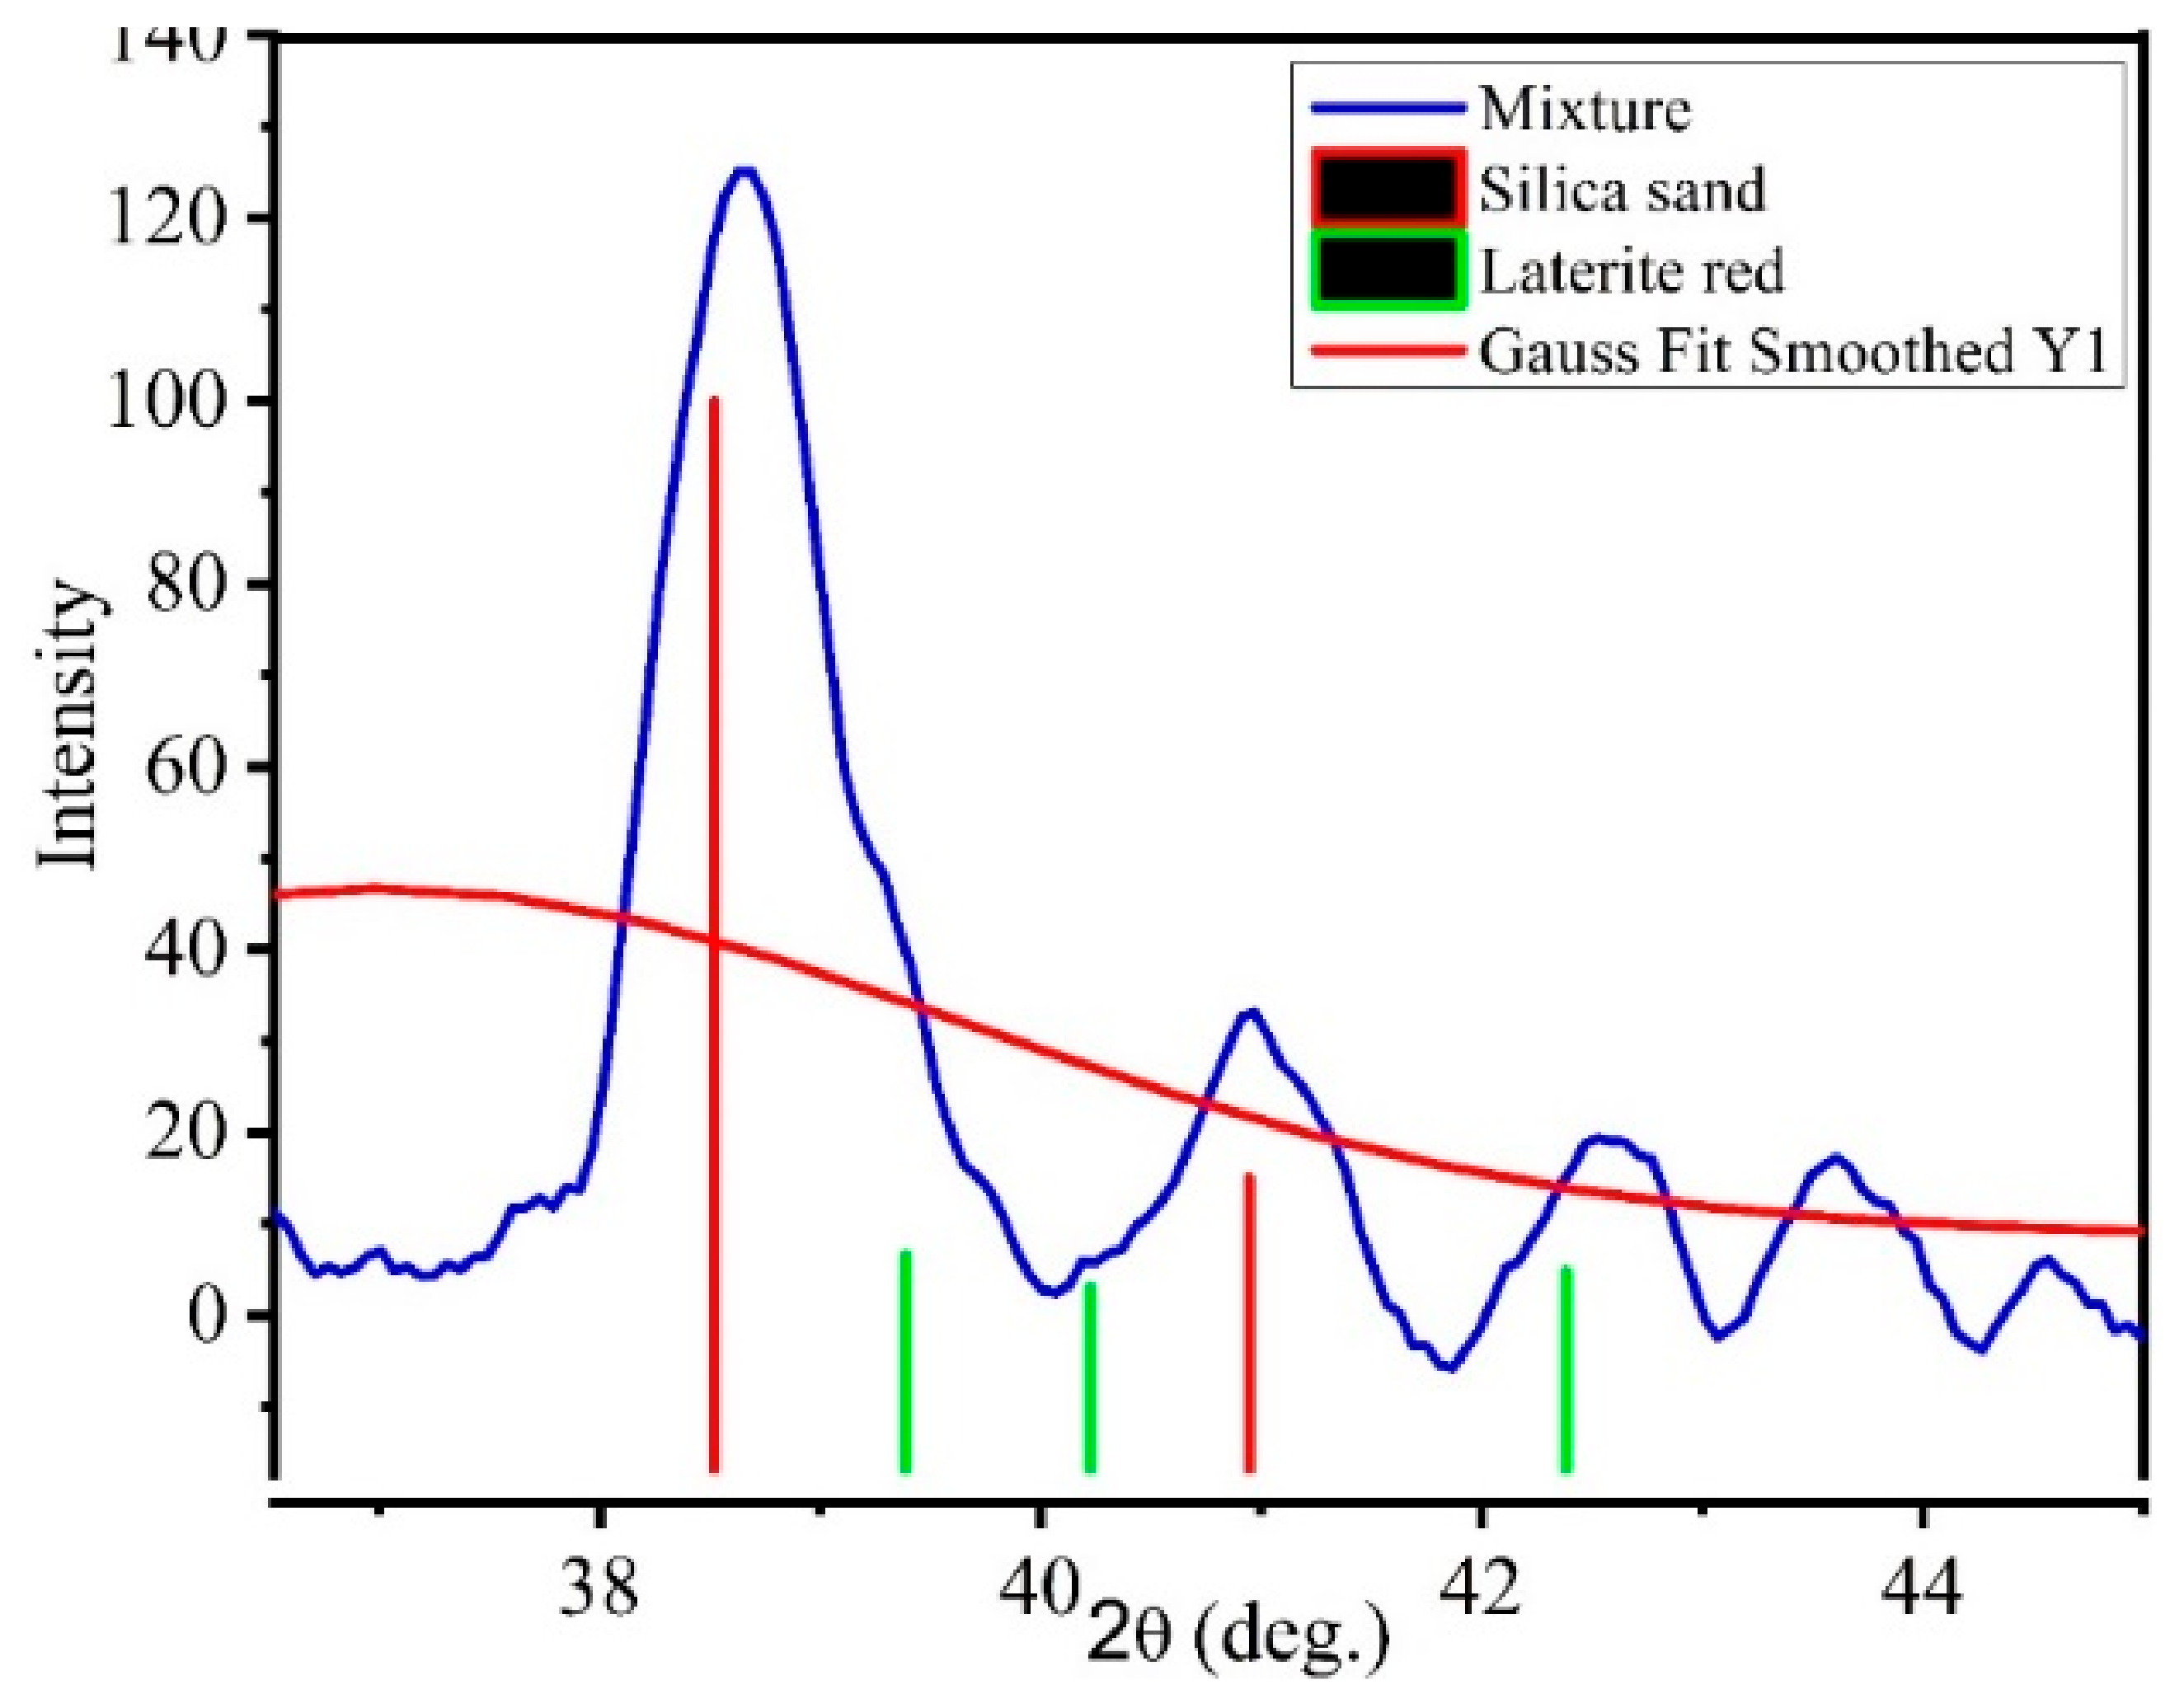
Figure 19, whereas the Gaussian curve fitting is presented in
Figure 20,
Figure 21 and
Figure 22. XRD analysis can be performed on powder, solids, thin films, and nanomaterials. XRD stands on the constructive interference of monochromatic X-rays and refines crystalline powder samples. X-rays are generated by cathode ray tubes. These rays are then filtered to generate monochromatic radiations, concentrated and directed towards the sample placed on the stand. When Bragg’s law is satisfied, the incident ray after hitting the sample produces constructive interference [
31].
Here, λ is the incident X-ray beam wavelength, and d is the distance between two consecutive lattices, which means the distance between the two layers of samples. n is a positive integer, θ is the angle of incidence. Bragg’s law relates the X-rays’ radiation to the crystalline sample’s lattice spacing and diffraction angle. The X-rays after diffraction are detected, counted, and processed. The samples are scanned through a range of 2θ angles, and all possible diffraction directions of a powdered mixture are obtained.
where
is the mean size of the crystalline domain,
is the dimensionless shape factor,
is the X-ray wavelength,
is the line broadening at half the maximum intensity, and
is the Bragg’s law. The obtained peaks are then converted to d-spacing using Gaussian fitting and Scherrer formulae; this allows us to identify the minerals, as all minerals have a set of unique d-spacing. Identification of minerals can be achieved by comparing them with the standard patterns. XRD analysis is performed for the characterization of material and unit crystalline structure, and the level of purity of the powder material is achieved. The 2θ angles are set according to the standard, i.e., 20–80 degrees. As the samples are extracted from Mines in Pakistan to determine their natural characteristics and compare them with standard materials, pattern XRD analysis is compulsory. XRD analysis helps in configuring the test sample’s orientation, phases, chemical combination, lattice structure, and other natural characteristics. The chemical combination and phases of the test sample suggest its conduction and dielectric properties.
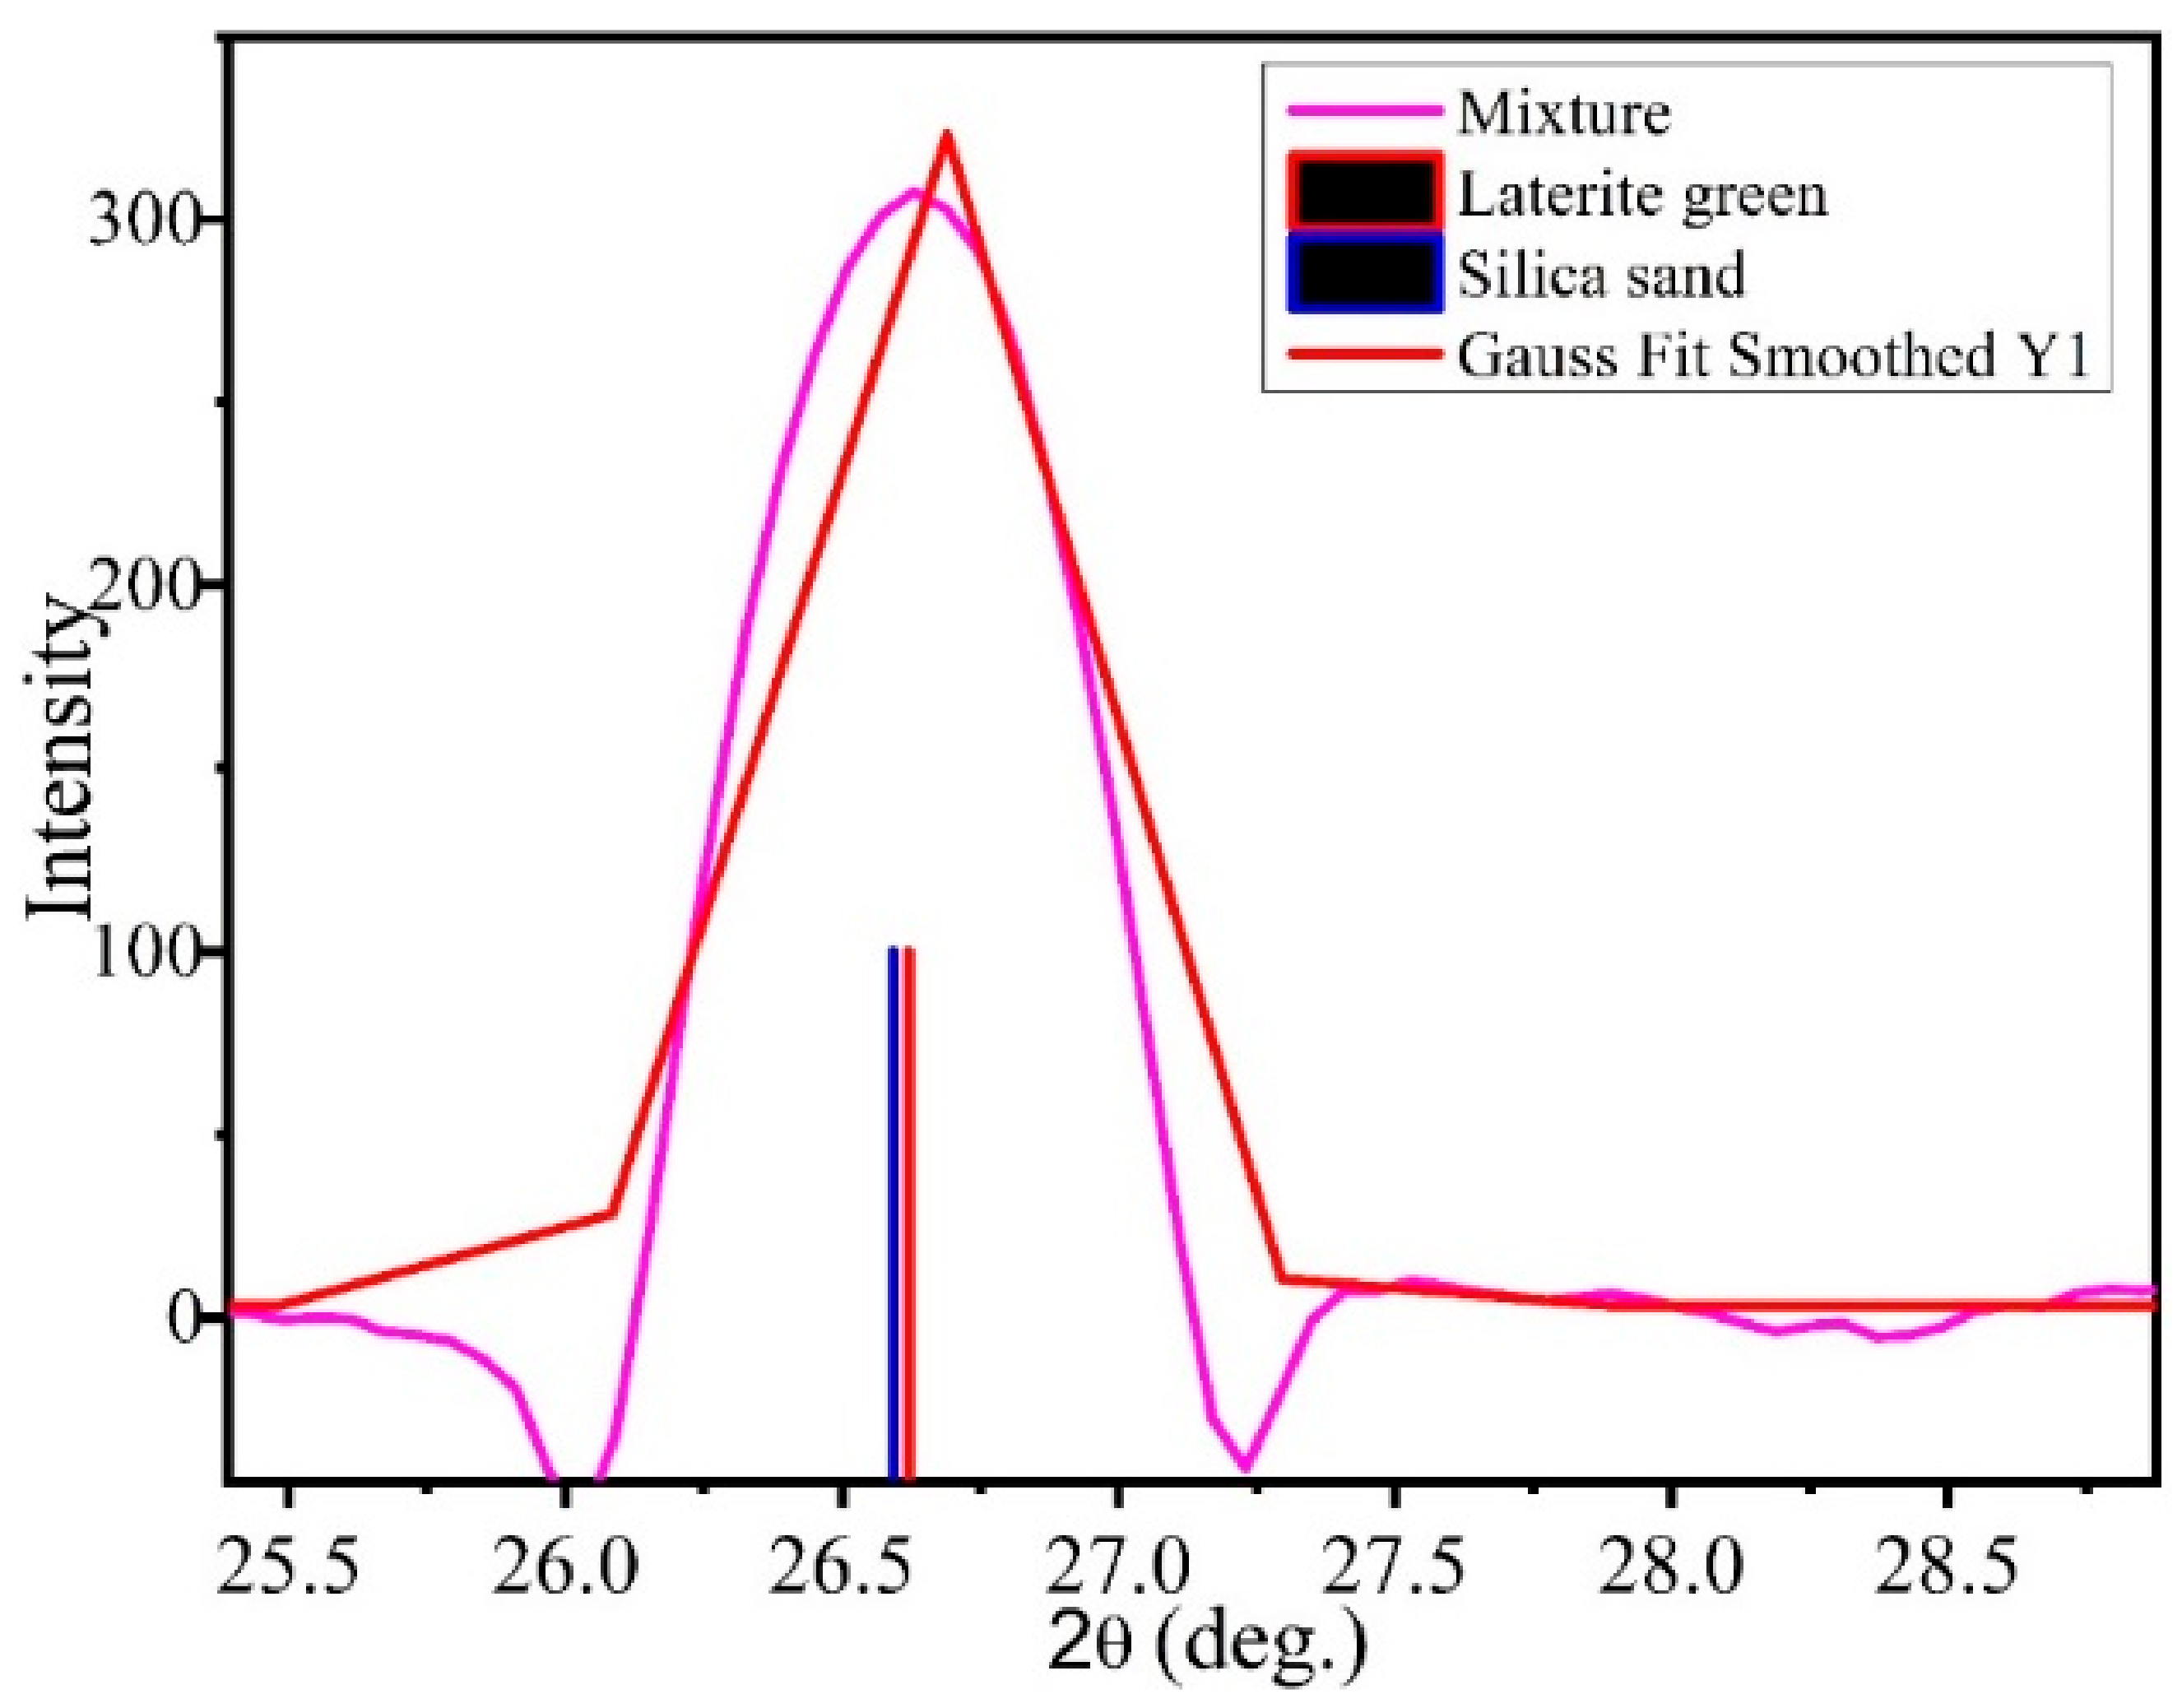
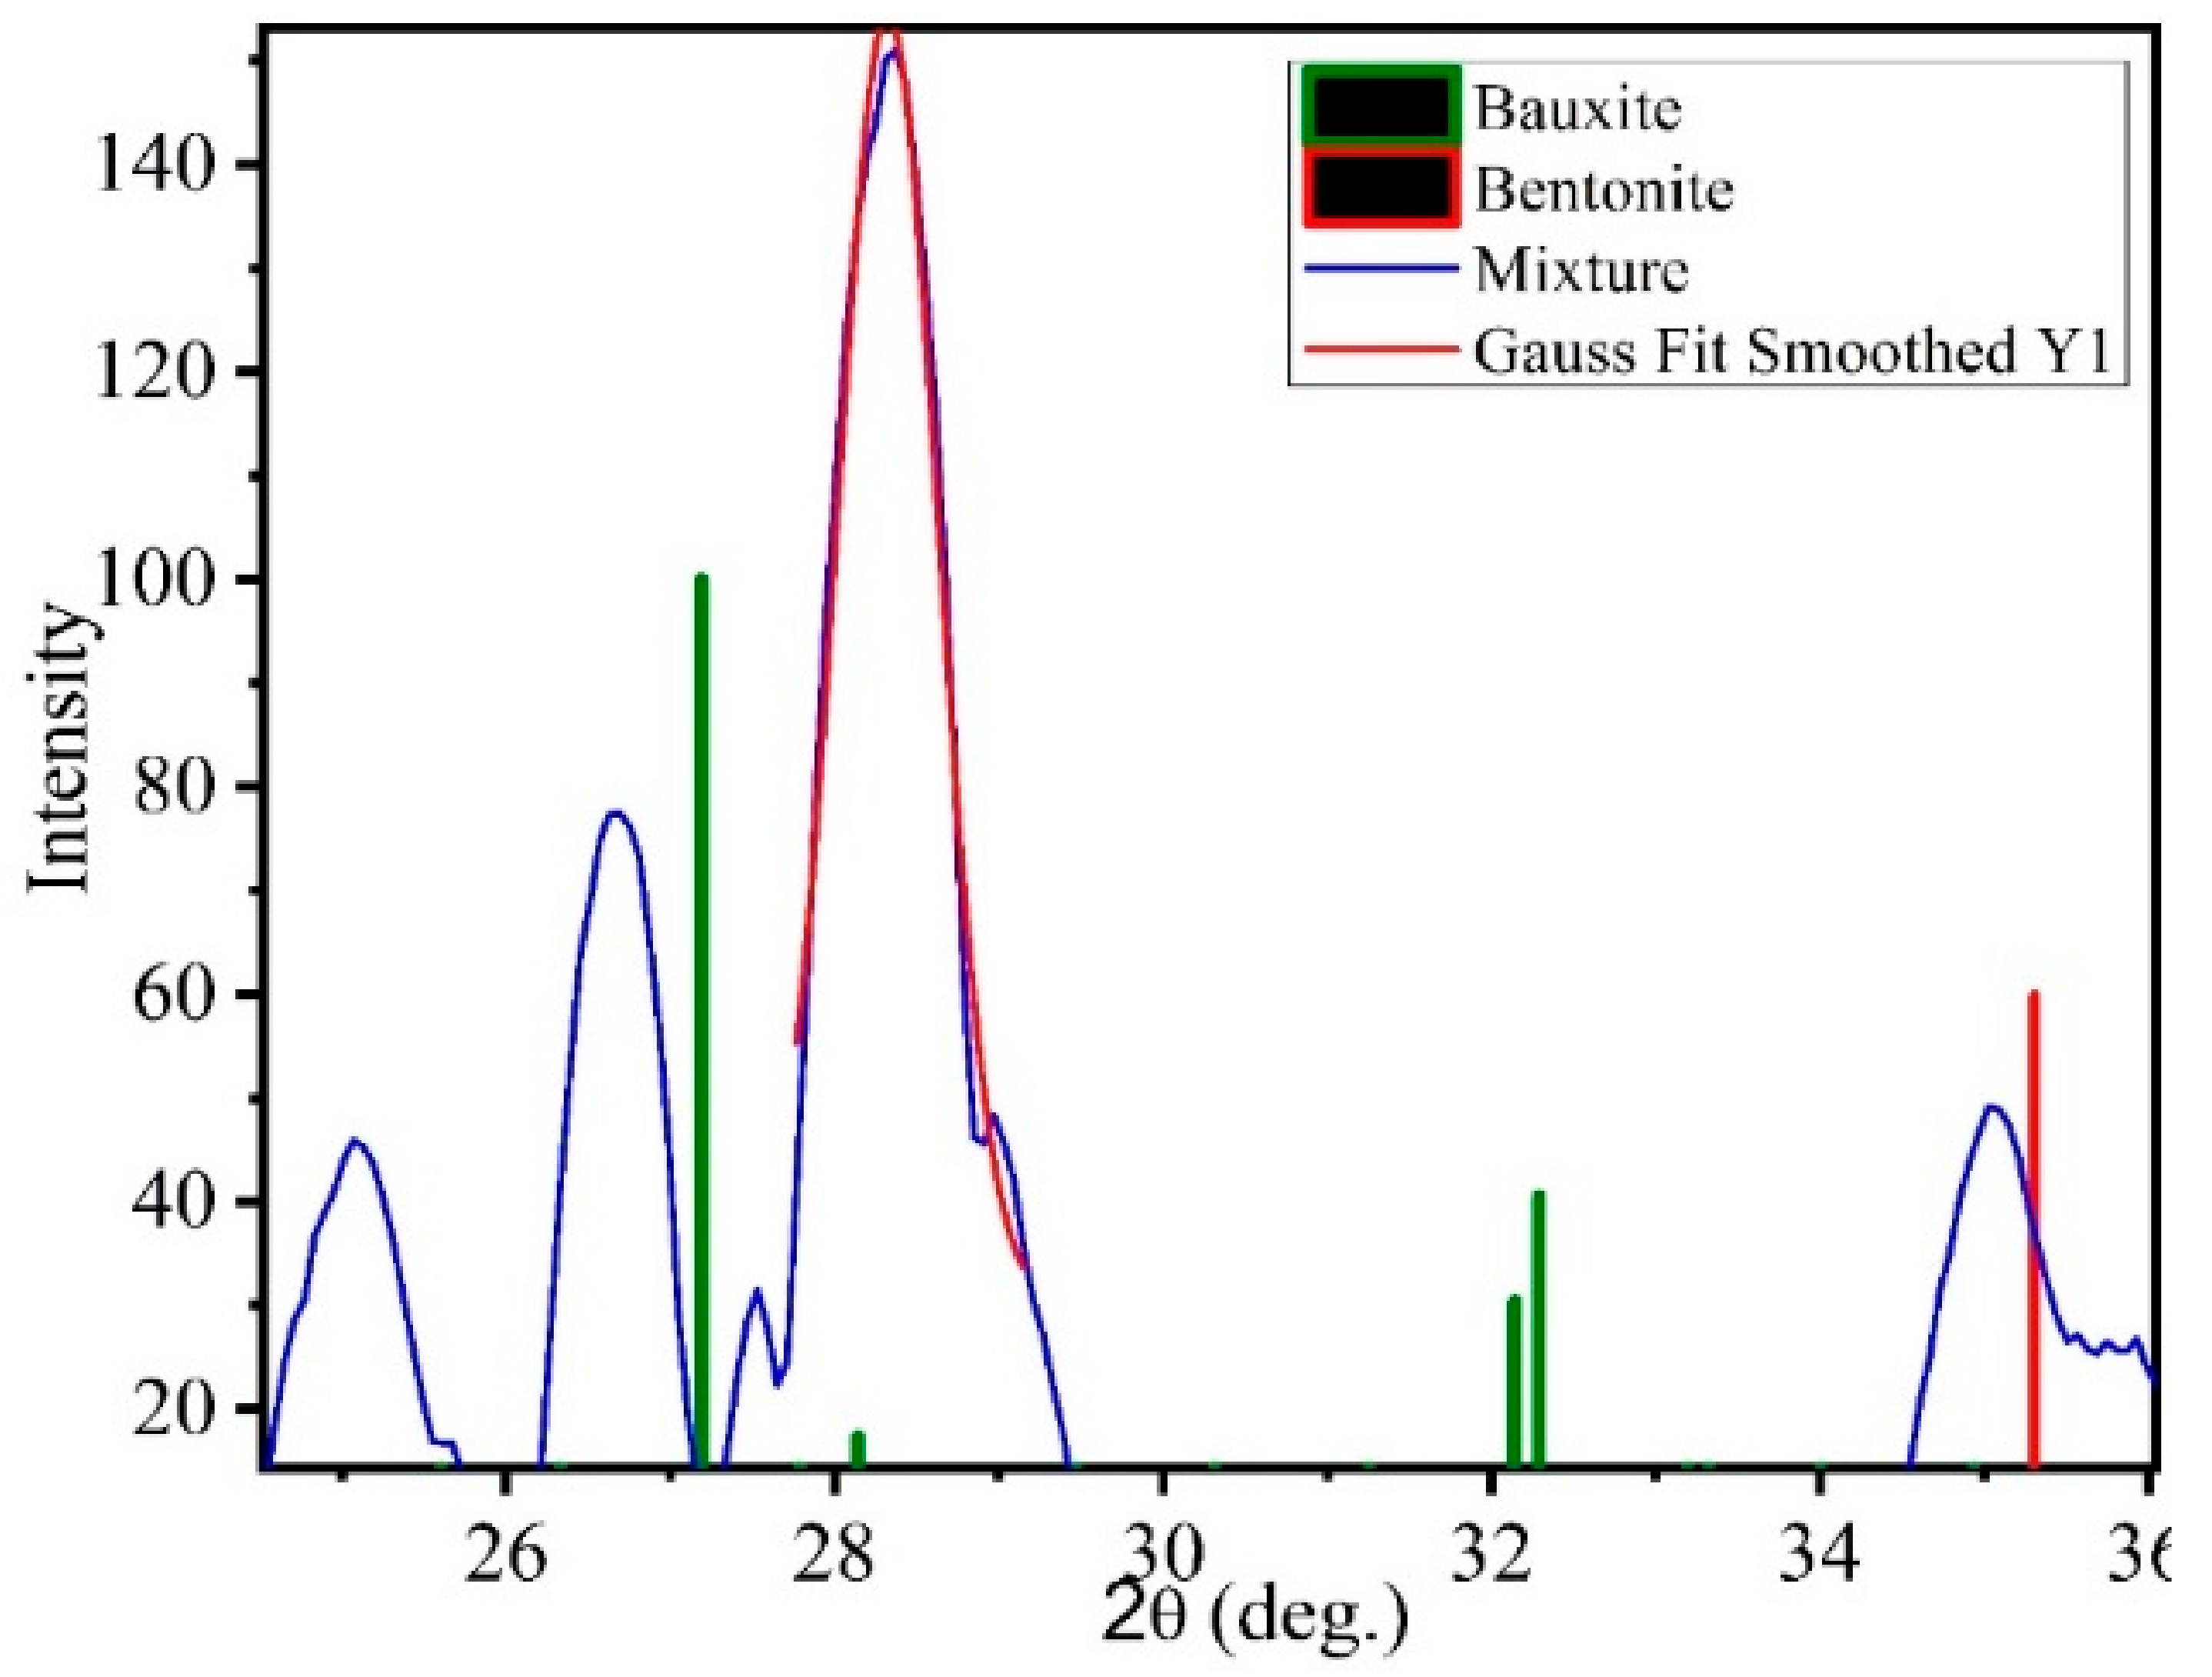
The Gaussian fitting graph of test samples are presented let us take laterite green and silica sand for explanation. Here, the pink line represents the laterite green and silica sand mixture curve. The vertical blue line represents the silica sand standard pattern, and the vertical red line represents the laterite standard curve. The horizontal red line is obtained by applying the Gaussian fitting smoothening factor. The vertical lines almost cover all the mixture curves; hence, it is proved that the sample tested shows properties equivalent to standard material.
The XRD curves of the test samples are campared with the standard pattern. The Gaussian fitting curves of all the samples fitted the standard curve almost at every peak, showing that the minerals selected are almost close to standard materials.
6. Experimental Result
The test specimens were prepared carefully, tested through XRD analysis for their origin properties, and simulated through FEA software for their electric field distribution properties for the laboratory results. The next step was to test the selected samples experimentally. The samples are two ores of laterite (laterite green and laterite red), two ores of bauxite (white and red), china clay, silica sand, and bentonite as backfill material. The samples were tested in a high-voltage lab under alternating and direct current conditions. Three forms of tests are conducted firstly; samples were tested separately, then tested as compound mixed with 1:1 proportion, and then tested with bentonite to achieve better results. Breakdown voltages of proposed minerals are indicated in
Table 4.
The samples were tested ten times each, and their average value was taken. Under alternating current conditions, bauxite ores and laterite showed the lowest rate of breakdown. Under direct current conditions, laterite yielded a lower value of breakdown voltage.
The materials tested separately are then investigated by adding the backfill-material bentonite for both the AC and the DC conditions. Bentonite is added to lower the earth resistance; hence, the conductivity of materials is increased, resulting in an acquired low breakdown voltage. The sample showing the lowest breakdown voltage is preferred for the grounding system, as over-voltage transients that arise in the system are grounded within a short period of time. Practical experiments are conducted to prove the claim.
Table 5 shows the breakdown characteristics of the test specimen.
Bentonite was added in a 1:1 proportion. Laterite ore mixed with bentonite showed the lowest breakdown voltage than other test samples. The silica sand and bentonite mixture also reduces breakdown characteristics under both AC and DC conditions.
The test samples were then tested with each other to analyze their breakdown capability. The materials were mixed in a 1:1 proportion, and the results were obtained as shown in
Table 6.
Under the AC conditions, the silica sand and bauxite mixture and the laterite and bauxite mixture showed a lower breakdown voltage value than all the other samples tested. Under DC conditions, the china clay and laterite ore (green) mixture and the bauxite and laterite mixture had a lower breakdown voltage value than all the other samples tested. The corresponding results are presented in
Table 5.
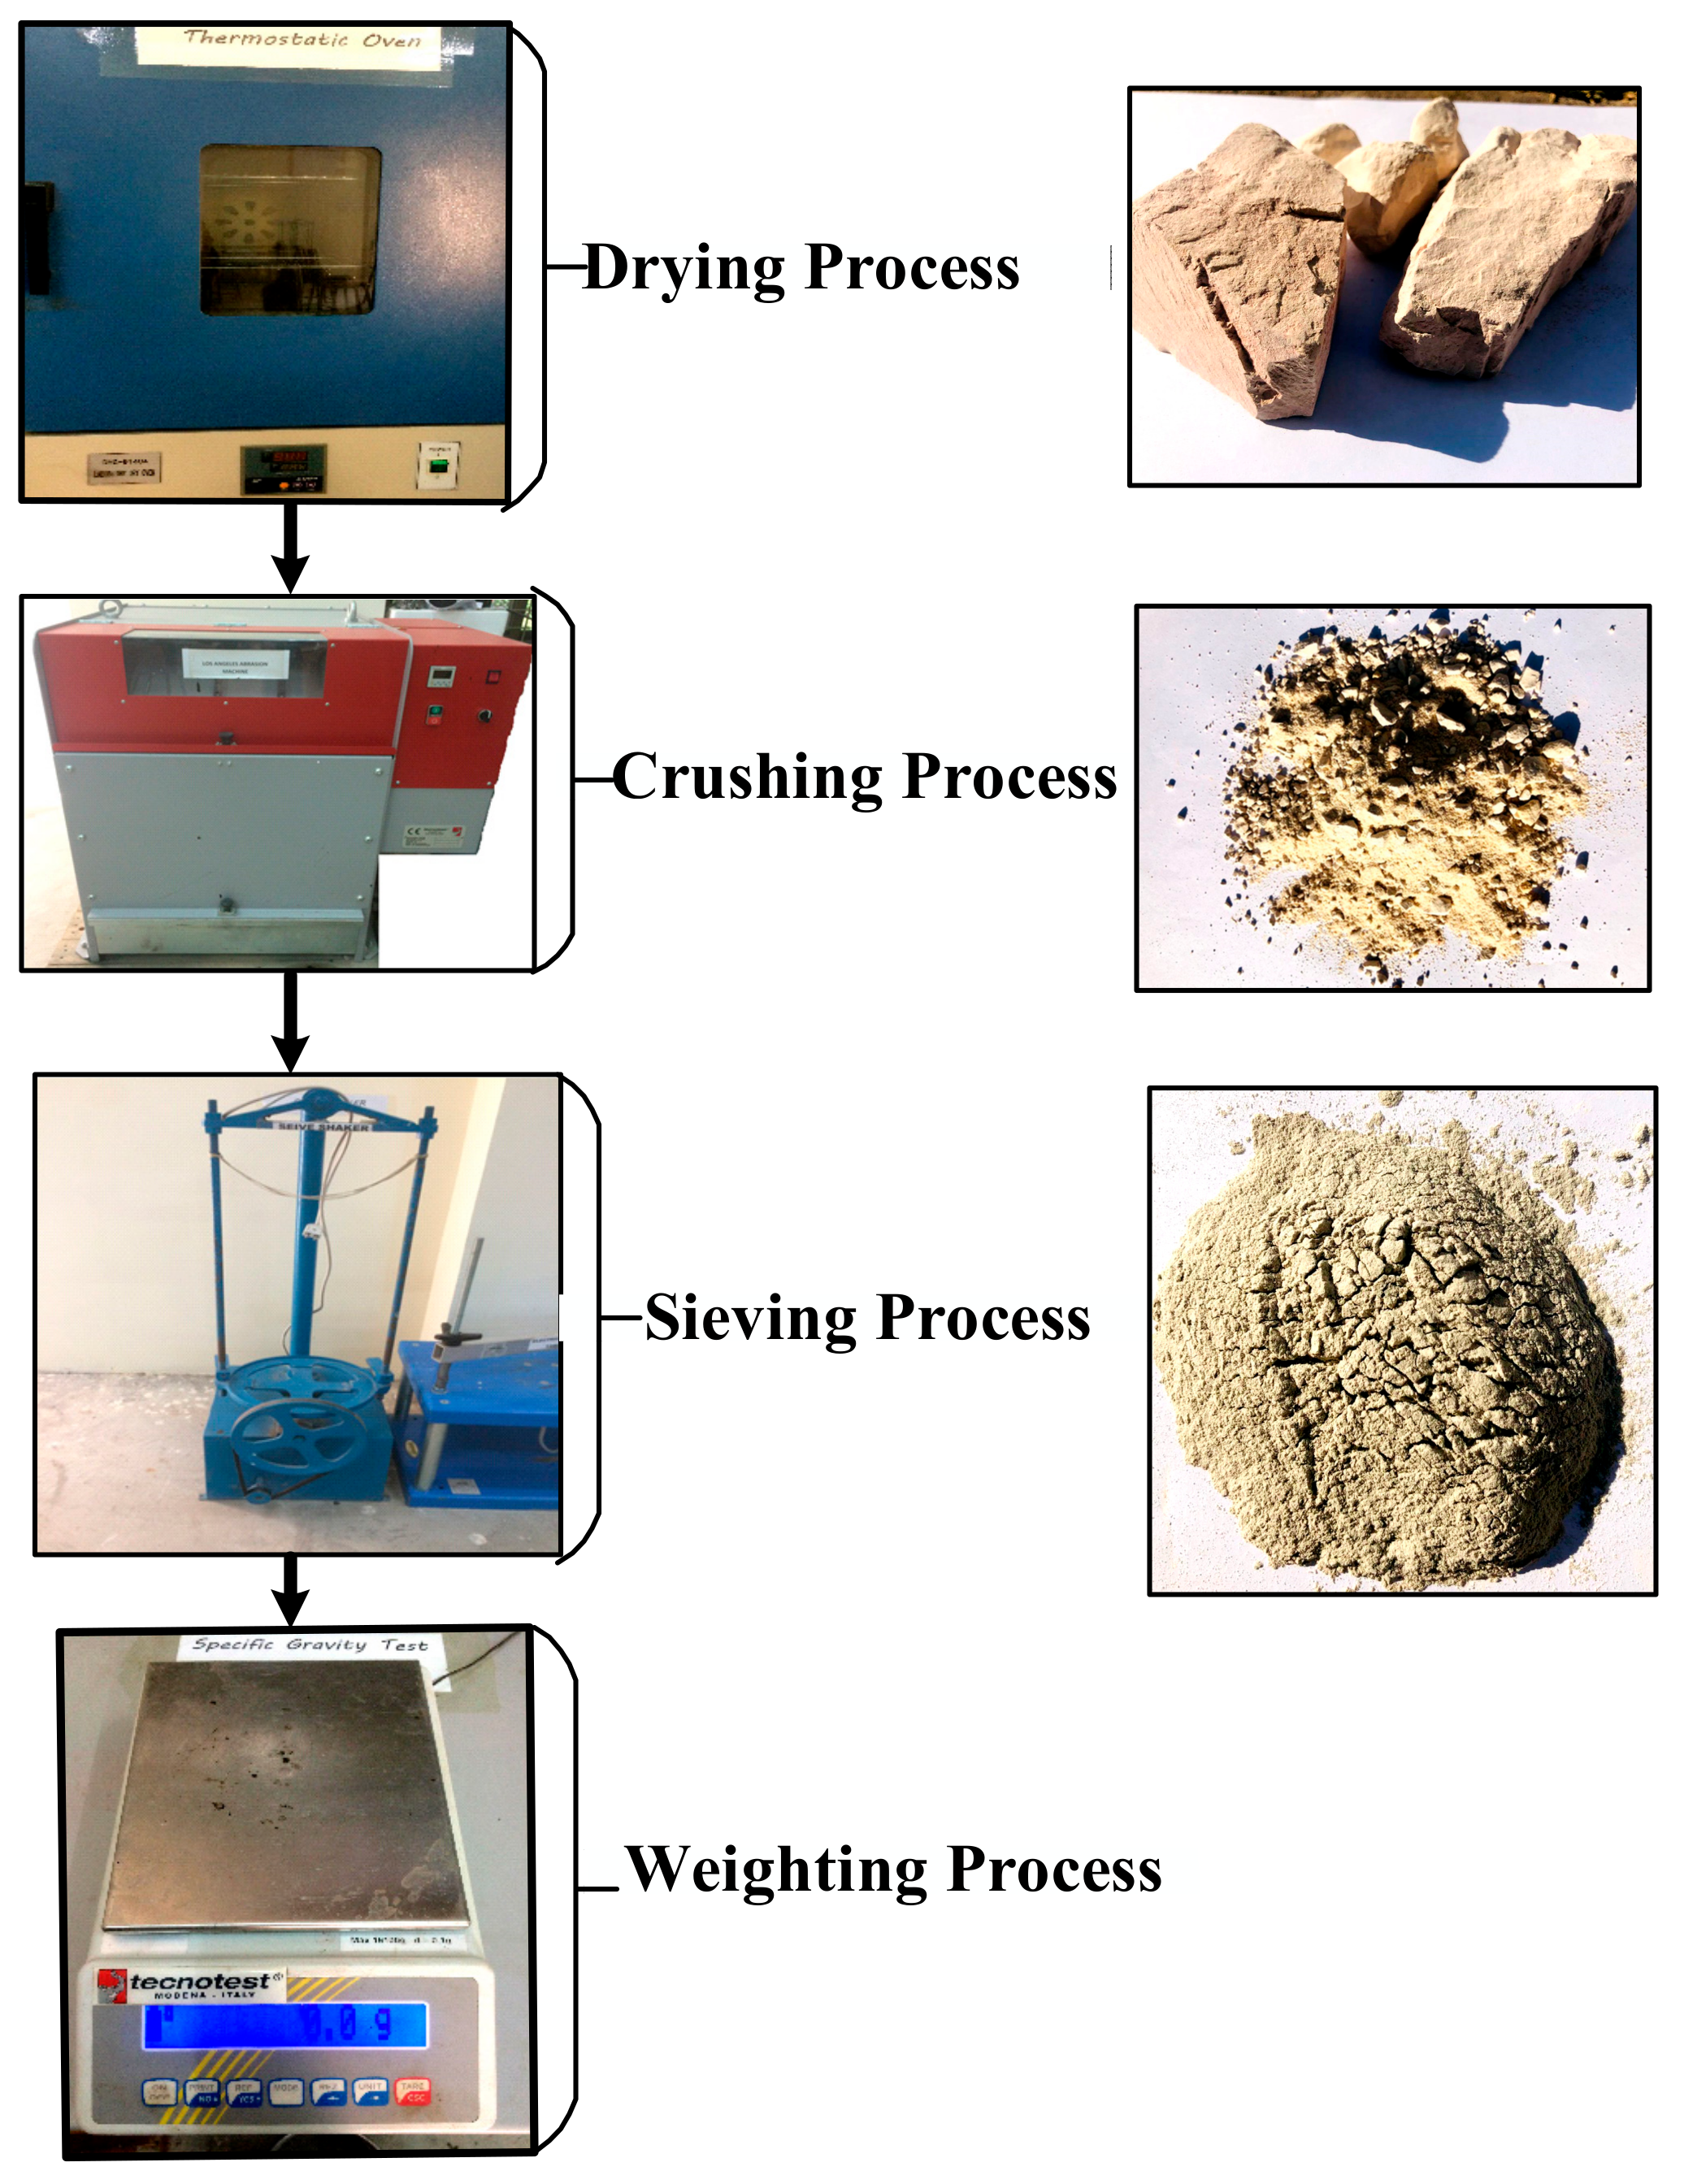
All the samples tested were carefully tested for grain size and moisture content. Samples are processed through a sieve shaker machine to attain uniform particle size and placed in an oven for 48 h at 105 °C to remove all the moisture content. It is concluded by performing experimental tests that china clay and bauxite ore showed a lower value of breakdown voltages than the other samples tested. Bauxite mixed with laterite and china clay mixed with laterite gives the most feasible results among all mixed compounds. Bentonite addition clearly lowers the breakdown voltage due to its intrinsic properties (resistance reduction and increasing conduction), as seen in
Table 4,
Table 5 and
Table 6.
The limitation that occurs in conducting this research is finding the mineral samples in their purest form. Many samples were collected and tested under XRD analysis, but they lack properties—that is, their pattern does not match the standard curves of material and s, thus, rejected.


 ,
, 


