Article

Forecasting Energy Consumption of Wastewater Treatment Plants with a Transfer Learning Approach for Sustainable Cities

ALGORITMI Centre, Department of Informatics, University of Minho, 4710-057 Braga, Portugal
*
Author to whom correspondence should be addressed.
Electronics 2021, 10(10), 1149; https://doi.org/10.3390/electronics10101149
Submission received: 31 March 2021 / Revised: 1 May 2021 / Accepted: 3 May 2021 / Published: 12 May 2021

Abstract

:
A major challenge of today’s society is to make large urban centres more sustainable. Improving the energy efficiency of the various infrastructures that make up cities is one aspect being considered when improving their sustainability, with Wastewater Treatment Plants (WWTPs) being one of them. Consequently, this study aims to conceive, tune, and evaluate a set of candidate deep learning models with the goal being to forecast the energy consumption of a WWTP, following a recursive multi-step approach. Three distinct types of models were experimented, in particular, Long Short-Term Memory networks (LSTMs), Gated Recurrent Units (GRUs), and uni-dimensional Convolutional Neural Networks (CNNs). Uni- and multi-variate settings were evaluated, as well as different methods for handling outliers. Promising forecasting results were obtained by CNN-based models, being this difference statistically significant when compared to LSTMs and GRUs, with the best model presenting an approximate overall error of 630 kWh when on a multi-variate setting. Finally, to overcome the problem of data scarcity in WWTPs, transfer learning processes were implemented, with promising results being achieved when using a pre-trained uni-variate CNN model, with the overall error reducing to 325 kWh.

1. Introduction

Over the years, there has been an increase in global urbanisation through a greater concentration of people in small spaces. According to the World Urbanisation Perspectives report carried out in 2017 by the United Nations on the number of people living in urban and rural areas worldwide, it was found that 4.1 billion people already lived in urban areas [1]. In fact, cities have a fundamental role in sustainable development, namely related to economic and environmental concerns.
With the increase in energy consumption, concerns about the energy sector have expanded substantially. Although there has been a greater awareness of the impact of non-renewable energy sources on the planet and the high emission of greenhouse gases, if concrete and imperative measures are not applied, this problem will only worsen. Thus, over the years, the term energy efficiency has become increasingly important and indispensable. Energy efficiency can help reduce energy production and, consequently, reduce greenhouse gas emissions and preserve fossil fuel resources, ensuring a notable contribution to reducing environmental problems on our planet [2].
There are several infrastructures where energy consumption is high in a city, with Wastewater Treatment Plants (WWTPs) being one of them. In a WWTP, achieving a high energy efficiency level has become an increasingly important topic [3]. WWTPs, with the execution of their functions, demand high levels of energy, reflecting about 7% of all energy consumed worldwide [4]. In Portugal, about 4% of the consumed electricity is urban water cycle’s responsibility, with approximately 25% of that energy being used in WWTPs [5]. Reducing energy consumption, emission of greenhouse gases and operating costs has been one of the main concerns of WWTP managers, who have been adopting more efficient equipment and technologies [6,7]. Hence, a WWTP must always consider the efficient management of all its resources, including energy.
Currently, in most WWTPs, low levels of energy efficiency performance are found. In fact, several factors influence the consumed energy in this type of facilities, depending on their characteristics and the types of treatments being applied. In general, the lack of energy efficiency is due to [8]:
  • A growing need for water recycling due to the scarcity of this resource;
  • Types of motors and pumps that are used;
  • Higher requirements on discharge parameters in the treated effluent;
  • Water pumping processes, which require high energy consumption;
  • Absence of energy recovery mechanisms;
  • Low efficiency in operations, mixing, and aeration systems;
  • Influent flow.

1.1. State of the Art

A study carried out by Li et al. [9] aimed at predicting energy consumption in a WWTP through the use of a Radial Basis Function (RBF) neural network. To evaluate the conceived models, they compared these with a Multi-variate Linear Regression (MLR) model. The data were based on a WWTP located in China, with daily periodicity. The data collected corresponded to 360 records, between December 2015 and December 2016, with six invalid records removed. To decide which features were given as input to the model, the authors used the Fuzzy C-Means (FCM) method. This method identified three indicators: the influential charge, the Chemical Oxygen Demand (COD), and the total nitrogen removed. The authors defined the FCM hyperparameters without any search for the best value for each of them, such as the number of iterations or clusters. Each of these selected indicators was used, one at a time, as input to the RBF model. The authors used min relative error, max relative error, and mean absolute percentage error (MAPE) for performance measurement metrics. In total, the authors developed four models with different inputs, three of them for each set of selected indicators and another with the total data. Using only data from each indicator’s subset, the RBF model performed better than the MLR model. On the contrary, the MLRM model performed better when using the total dataset as input. Overall, both models performed better when using only the data subset of the indicators.
Harrou et al. [10] conducted a study to make short-term forecasts of energy consumption in a WWTP, using statistical and Deep Learning (DL) models. The data used in this study are between 2010 and 2017, belonging to a WWTP in Saudi Arabia. In total, the authors used six statistical models, such as the Auto-regressive Integrated Moving Average (ARIMA) or the Ordinary Least Square (OLS). Two types of networks were based on DL models, Long Short-Term Memory (LSTM) and Gated Recurrent Units (GRU). The models conceived by the authors used a uni-variate approach, where only the feature they intend to forecast, the energy consumption, is given as input to the different candidate models. The data were normalised between 0 and 1 for all conceived models. There was no particular attention to the case of LSTM networks working internally with a hyperbolic tangent. Throughout the manuscript, no cross-validation or overfitting control techniques are mentioned in the conceived models. Regarding the evaluation metrics of the models, the authors used four, i.e., MAPE, Mean Absolute Error (MAE), Root Mean Square Error (RMSE), and Root Mean Squared Log Error (RMSLE). By observing the obtained results, the authors verified that the statistical-based models slightly outperformed the DL models, with ARIMA getting a MAPE of 2.29%, while the best DL model, LSTMs, presented a MAPE of 2.42%. The authors also verified that the models’ parameters were updated recursively, given a better performance than the models with no updates. However, they concluded that the DL models could provide forecast results with more significant performance when applying more data. No reference was made regarding fitting times.
The study carried out by Huang et al. [11] had as objective the construction of an energy consumption model in a WWTP based on Elman Neural Network-Energy Consumption Model (ENN-ECM) to identify the relationship between energy consumption and the quality of the effluent. The benchmark simulation model (BSM1) was used to compare the authors’ model results. Both models were based on data related to an activated sludge model, being obtained from BSM1, which provided data for a period of two weeks in 15-minutes time intervals. Firstly, the authors used the energy consumption model to verify which effluent characteristics had a more significant relationship with the characteristics related to energy consumption. Then, they implemented the ENN-ECM with five characteristics of the effluent obtained from the energy consumption model to forecast four energy consumption parameters. The network architecture, namely the number of layers, was obtained through empirical formulas and the Kolmogorov theorem. The authors concluded that the ENN-ECM model obtained better performance concerning energy consumption with the analysis of the obtained results.
Ramli et al. [12] conducted a study to forecast energy consumption in a WWTP in Malaysia using an ARIMA model. To compare the obtained results, the authors used a linear regression method. The data used in this study were based on four years of active power in the WWTP. To achieve the best ARIMA model, the authors used the Time Series Modeler, incorporated in the SPSS software, obtaining the values (0, 1, 0) for ARIMA’s parameters. The results allowed the authors to verify that the ARIMA model obtained better performance than the linear regression with an RMSE of 55.59, compared to 67.51, respectively. The authors further concluded that it was possible to increase energy efficiency by 10% of energy recovery, which could reduce the cost of electricity in the studied WWTP.
Another study carried out by Maki et al. [13] aimed to forecast the total energy consumption of a WWTP and the consumption in different processes, using a Markov switching model. The data were collected by applying several sensors connected to a WWTP energy distribution network in Japan and transmitted over a 3G line. The data collection was carried out between March 2015, and March 2017, with a 1-min periodicity. The authors then grouped the data into an hourly periodicity. In addition to the forecast of total energy consumption at the WWTP, the authors also forecast the energy consumption in the water treatment, sludge treatment, and auxiliary facilities processes. Additionally, as the sum of the three identified processes’ energy consumed did not coincide with the total energy consumed in the WWTP, they made the forecast for the remaining operations, marked as “others”. An analysis was made of energy consumption over time, where it was possible to verify that there is greater energy consumption in summer than winter. In addition to the data collected by the sensors, the authors added six more features to be used in the conceived model: holidays, office hours, temperature, humidity, wind speed, and the previous five hours of energy consumption. Only 1 week was considered as input. With the obtained results, the authors found that, except for the sludge treatment and auxiliary facilities, the values were below 10%. Besides, the relationships between the variables that affect the energy consumption forecast equation were verified in each process. The authors then concluded that an increase in the WWTP’s energy consumption, together with the increase in seasonal temperatures, leads to a rise between 0.1% and 0.2% for each 1 C in temperature.
Oulebsir et al. [14] conducted a study where they conceived an Artificial Neural Network (ANN) to create an energy consumption model in a WWTP using the active sludge process. The authors used data provided by a WWTP in Algeria between January 2006 and March 2016. In this study, the authors use four parameters: (1) the Biological Oxygen Demand ( B O D 5 ), (2) the COD, (3) suspended solids and (4) ammonium. In addition, they also use the water temperature, and flow of the influent, the flow of recirculated sludge, and the total consumed energy. The authors applied a set of methods to clean the dataset, keeping 318 days of observations even though the original dataset had 10 years of data. The different ANNs had six hidden layers with a total of 200 neurons each. The architecture of the models was established using the trial-and-error method. In each conceived model, data were divided into 80% for training and 20% for testing, without using a time series cross-validator. The authors confirmed that the pollution load contributes more significantly to forecasting energy consumption than the removal efficiency. The authors also applied the k-means algorithm, observing three clusters. The authors were thus able to verify three classes of energy consumption: under-consumption, over-consumption, and optimal consumption.
As an overall conclusion, it can be said that some studies have already considered the use of DL models to forecast energy consumption in a WWTP. Typically, studies follow a single-step approach, i.e., they only forecast consumption value for the next day. Furthermore, it is usual to find studies that do not consider certain aspects of time series problems, such as using an appropriate cross-validator, not breaking the time series when removing missing values or missing timesteps, or even when searching the best hyperparameters. In addition, it is not easy to understand the existence of overfitting as learning curves are not analysed. All this may lead to significant problems when deploying the best candidate model in a real-life scenario.

1.2. Goals, Research Questions, and Paper Structure

This work aims to conceive, tune, and evaluate a set of candidate DL models to forecast energy consumption in a WWTP, going from recurrent to convolutional candidates. In addition, the goal is to implement a recursive multi-step approach to forecast the next two days, providing a stronger understanding of future patterns. We also aim to experiment two different methods for outliers’ handling and the performance of the candidates in uni- and multi-variate settings. Then, as last goal, we aim to evaluate the best candidate model in a WWTP with a low volume of data. For that, we are required to apply transfer learning processes, overcoming the problem of data scarcity.
This study uses data provided by a Portuguese water company. The elicited goals can be translated into the following research questions:
  • Do recurrent neural networks have a better performance when forecasting energy consumption in a WWTP than convolutional ones?
  • Which features facilitate the process of forecasting energy consumption in a WWTP?
  • Is it possible to apply transfer learning processes, with the goal being to use a pre-trained model to forecast the energy consumption of a WWTP with low volumes of data?
The remainder of this manuscript is structured in three more sections. Section 2 describes the materials and methods, namely the collection, exploration, and pre-processing of data, the developed DL models, and the conducted experiments. Section 3 is responsible for summarising the obtained results, as well as their interpretation. Finally, Section 4 discusses the obtained results and gathers the conclusions drawn from this study.

2. Materials and Methods

The following lines describe the materials and methods used throughout this study, including collecting, exploring, and treating data. Additionally, the models used throughout the work are described, as well as the evaluation metrics, the used technologies, and the designed experiments.

2.1. Dataset

The data used in this study took into account three different datasets. Dataset one was related to energy consumption while the second dataset described the volume of the flow of water at the entrance of a WWTP. The third dataset described the climatological conditions. The first two datasets were made available by a Portuguese wastewater company and were related to a single WWTP. Regarding the energy consumption value, which is the target feature, there is an intrinsic relationship between the different processes present in a WWTP and the required energy (typically, the larger the WWTP, the greater its energy consumption). However, this relation was captured and described in the time series in itself as the values were a snapshot of the state of the WWTP. The third dataset was collected using the Open Weather Map API, and contains climatological data regarding the same city where the WWTP was located. All datasets contained observations belonging to the period between January 2016 to May 2020.
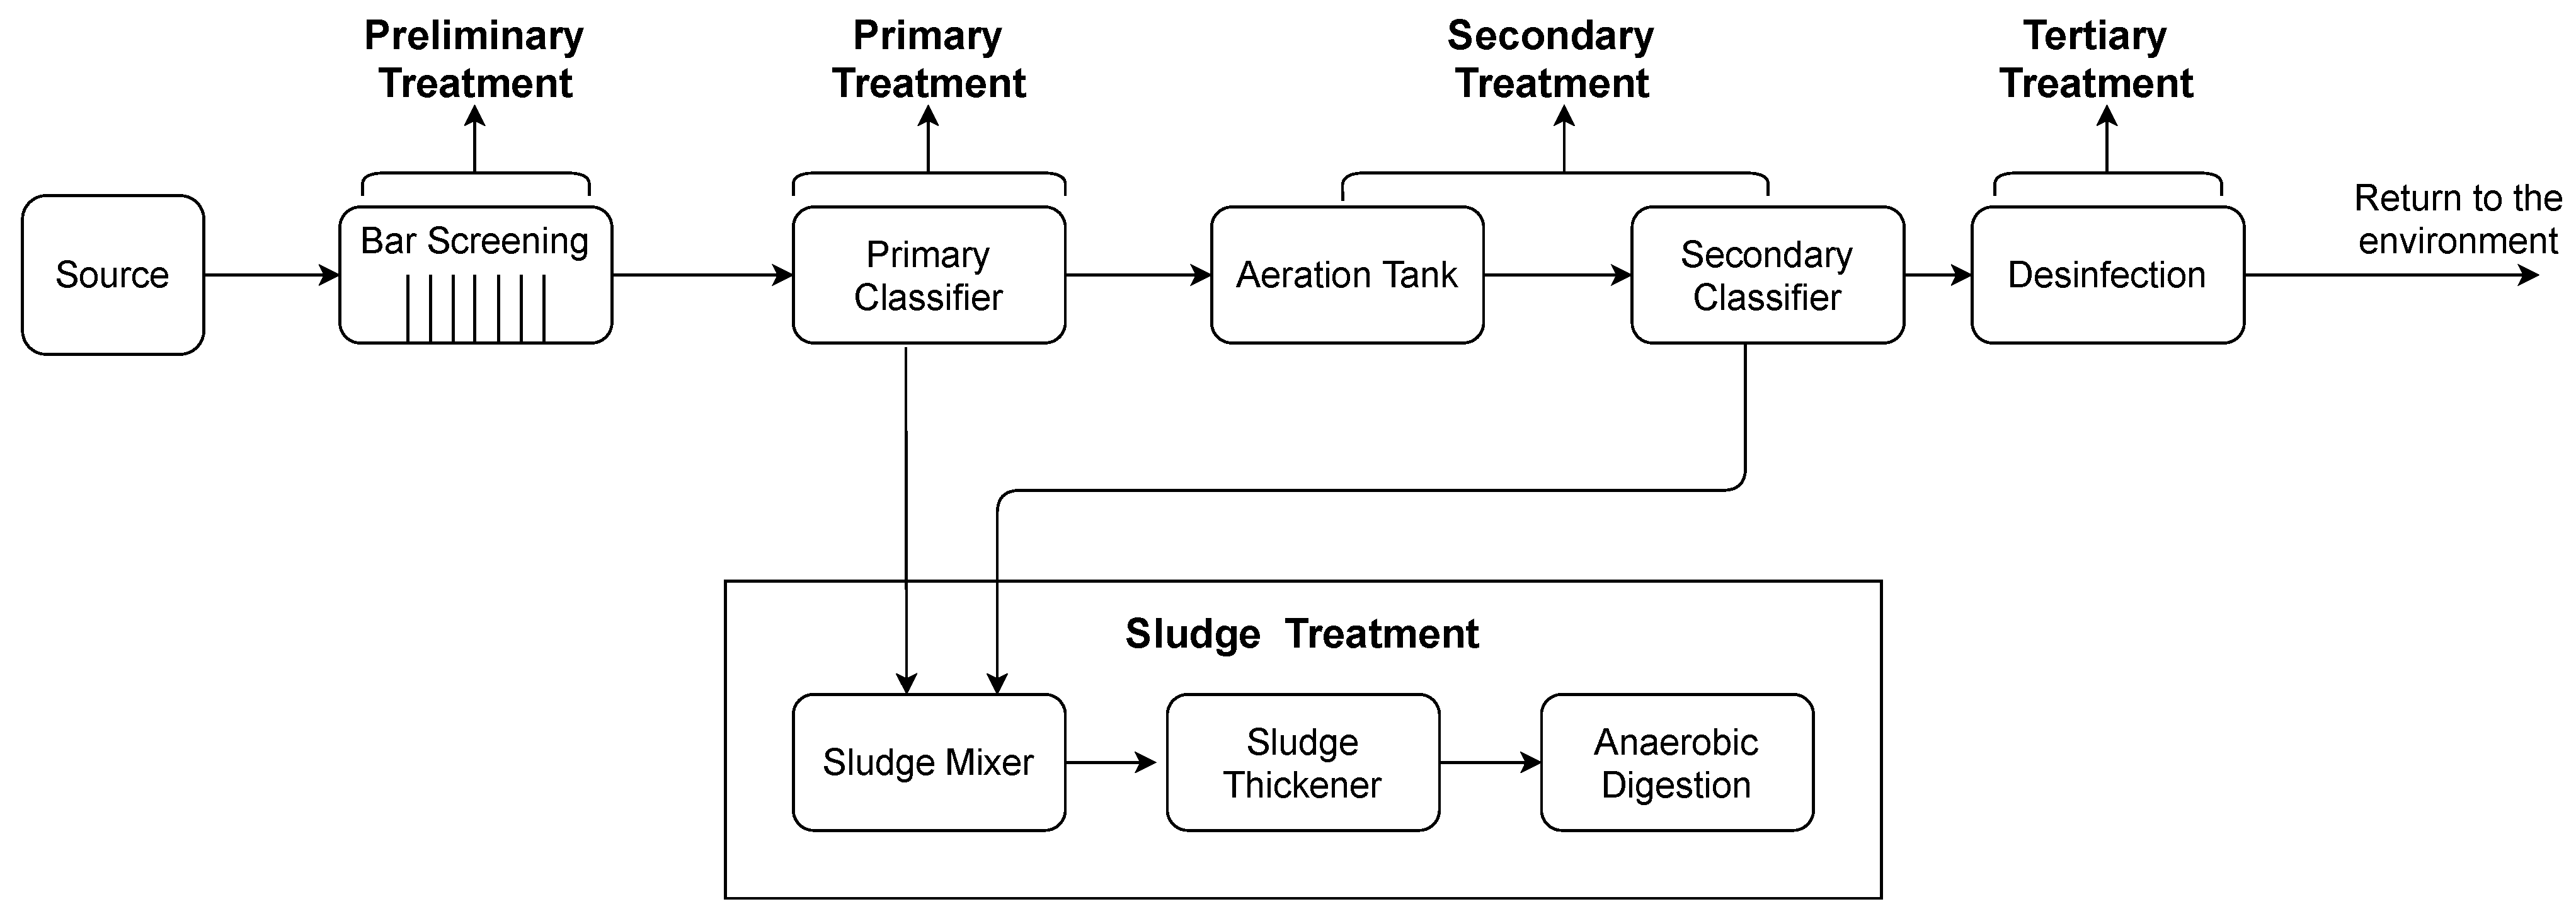
Figure 1 illustrates the WWTP layout used in this study. This WWTP was based on four main stages: preliminary, primary, secondary and tertiary treatments. In addition, there was also a line responsible for the sludge treatment. The preliminary treatment, which included bar screening, was accountable for removing solids and materials of greater volume, an essential step in the WWTP process since some of these objects could damage some equipment in the following steps. The primary treatment, which included the primary classifier, aimed to remove the smaller volume solids, namely the suspended solids, from the previous stage and the organic matter present. In the secondary treatment, two processes were included, the aeration tank and the secondary classifier. This stage aimed to remove biodegradable organic matter from wastewater, in addition to suspended solids and nutrients, such as nitrogen. Finally, the tertiary treatment was responsible for removing the remaining suspended solids resulting from the previous stages. The sludge produced in the primary and secondary treatment was inserted in the sludge treatment line. This line was responsible for dewatering and disinfecting the sludge, reusing it as an energy source.

2.1.1. Data Exploration

The energy consumption dataset comprised two features: the energy consumption value (in kWh) and the corresponding timestamp, making 1522 records with a daily periodicity. The influent flow dataset also contained two features, i.e., the value of the influent flow (in m 3 ) and the timestamp, with a total of 1535 records, again with a daily periodicity. Finally, the climatological dataset had a total of 25 features, including the timestamp, air temperature, and humidity, among others, with a total of 38,651 hourly timesteps. Table 1 presents the different features available in the three datasets, detailing its characteristics and presenting the corresponding units of measure.
None of the three datasets had missing values. However, as in its genesis the problem identified in this study was based on a time series problem, it was essential to pay attention to missing timesteps. In the case of the climatological dataset, there were no missing timesteps. On the contrary, both the energy consumption and the influent inflow datasets contained missing timesteps. In the former, there were 88 missing timesteps, while in the latter 75 missing timesteps were identified. In a subsequent section, it is explained how to overcome the missing timesteps problem.
As the main goal of this study was to forecast energy consumption, data exploration emphasized the value_energy feature of the energy consumption dataset. Firstly, it is worth mentioning that this feature presented an accumulated value. Hence, it was necessary to subtract, from each observation, the value of the previous one, in order to obtain its real value. Since the first observation had no previous one, it was removed. A box plot analysis allowed us to identify the existence of some extreme outliers that were derived from an incorrect insertion of values by the operators of the WWTP.
A statistical analysis of the energy consumption values was performed, being described in Table 2. It was possible to verify that the mean energy consumption value in the dataset presents a value of 8050.96 kWh, with a standard deviation of 3736.359 kWh. The skewness was 3.172, representing an asymmetric distribution, i.e., the positive value indicates a positive inclination in the distribution of the data, in which the tail size of the right hand is larger than that of the left. Regarding the kurtosis value, it was 28.101. A kurtosis value greater than 1 indicates that the distribution of energy consumption has a very high peak (a leptokurtic distribution).
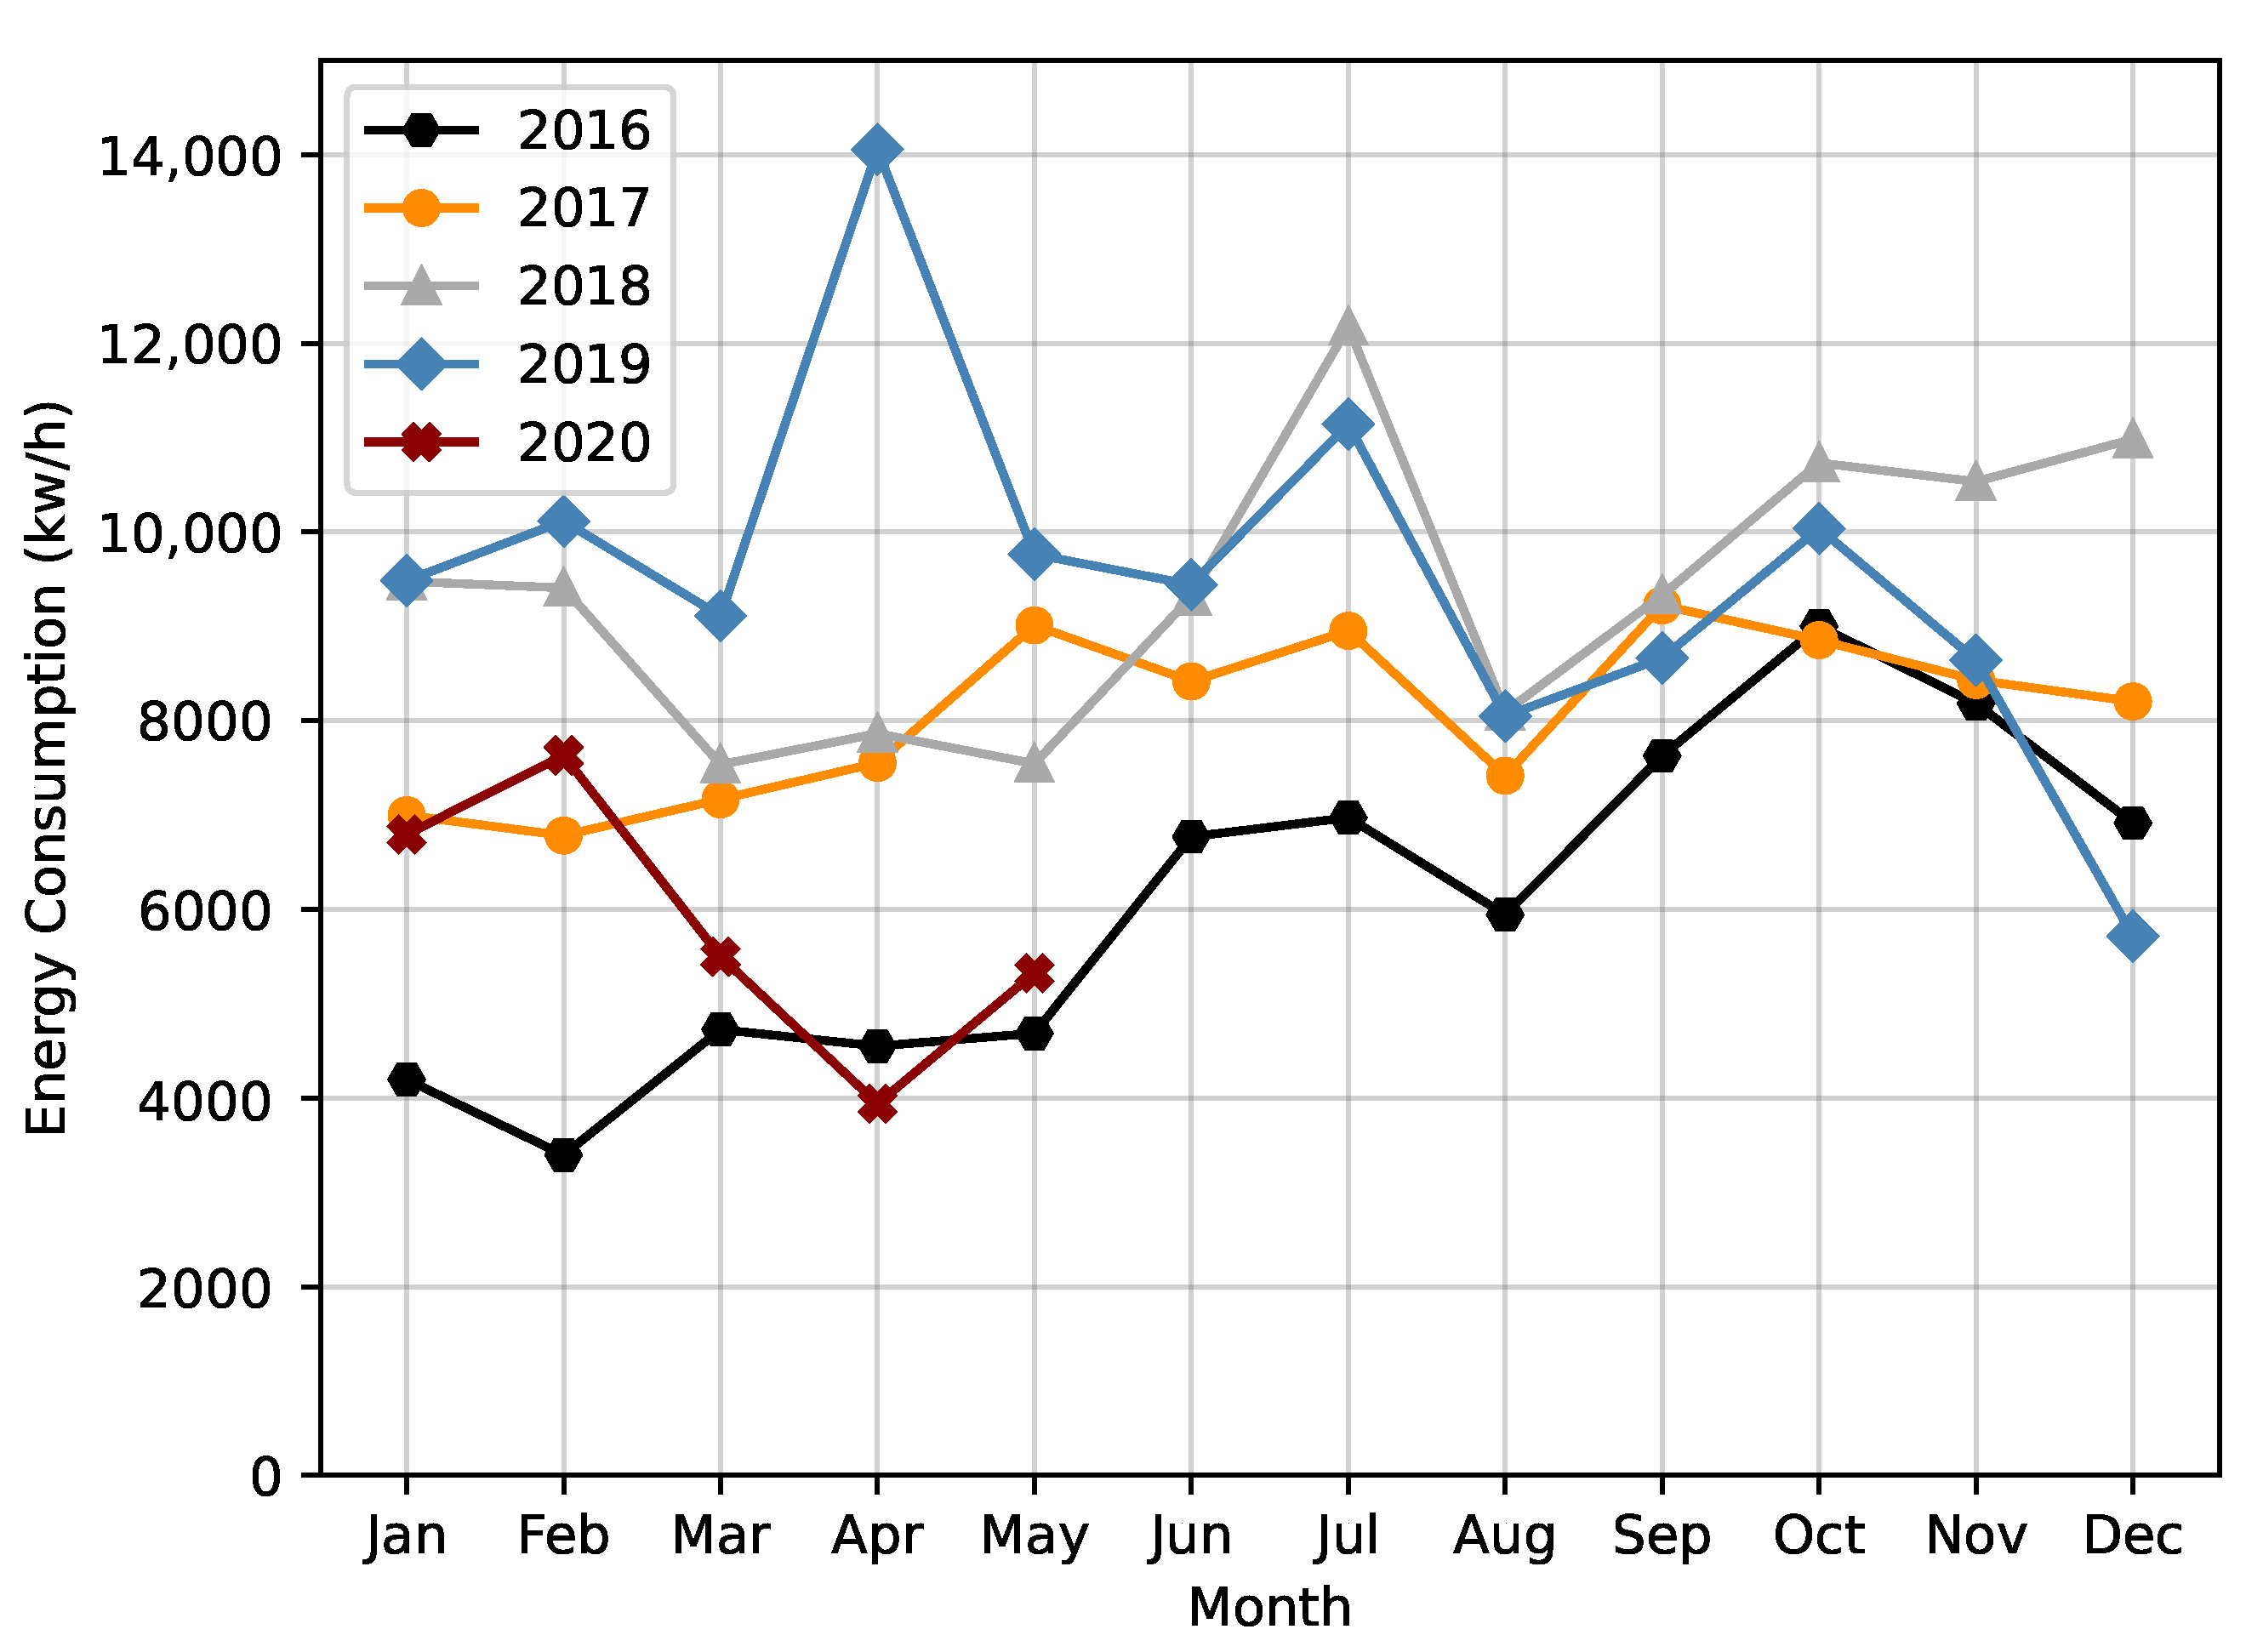
We then explored the energy consumption over the months of a year, during the 5 years present in the dataset. In Figure 2 it is possible to verify a pattern in all the explored years, with a constant drop in energy consumption between July and August.
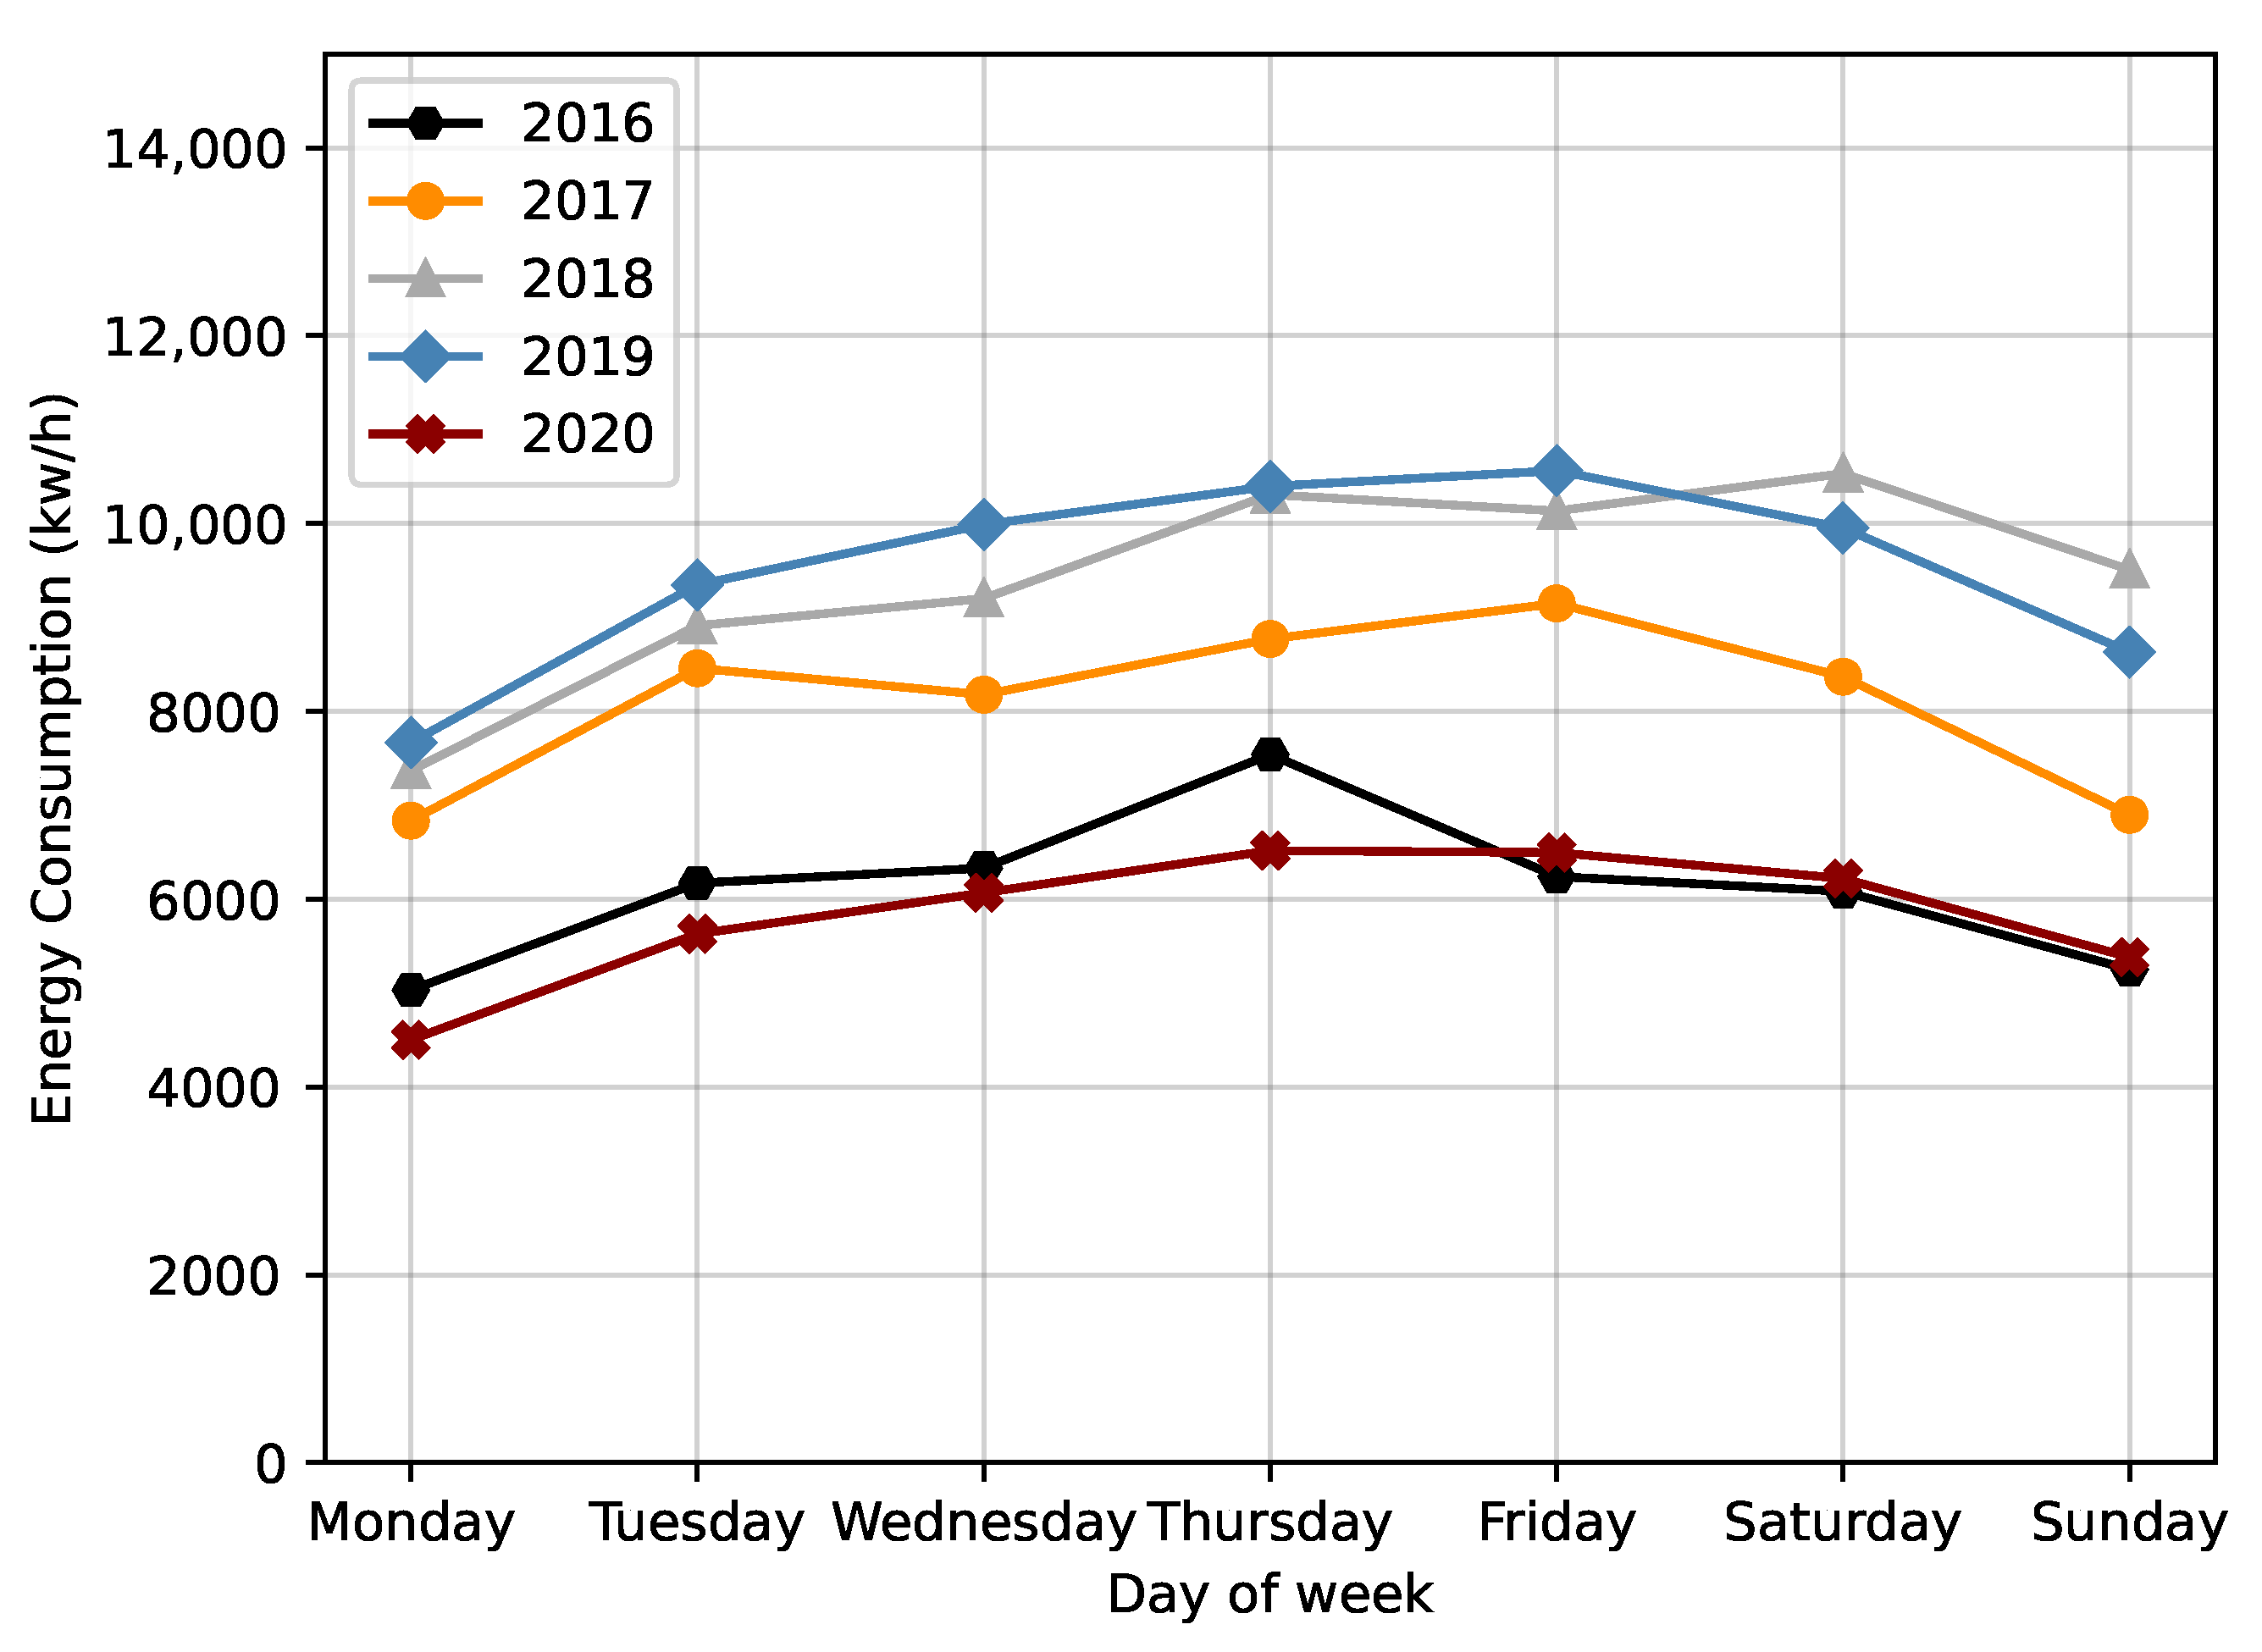
Another analysis took into account the variation in energy consumption over the different days of the week. This analysis was based on the mean value of the days of the week for each year. As shown in Figure 3, it is possible to verify that Sunday and Monday were the days when there was less energy consumption in the WWTP. In conclusion, it appears that the traditional working days had a higher energy consumption on average, while on weekends there was a decrease.
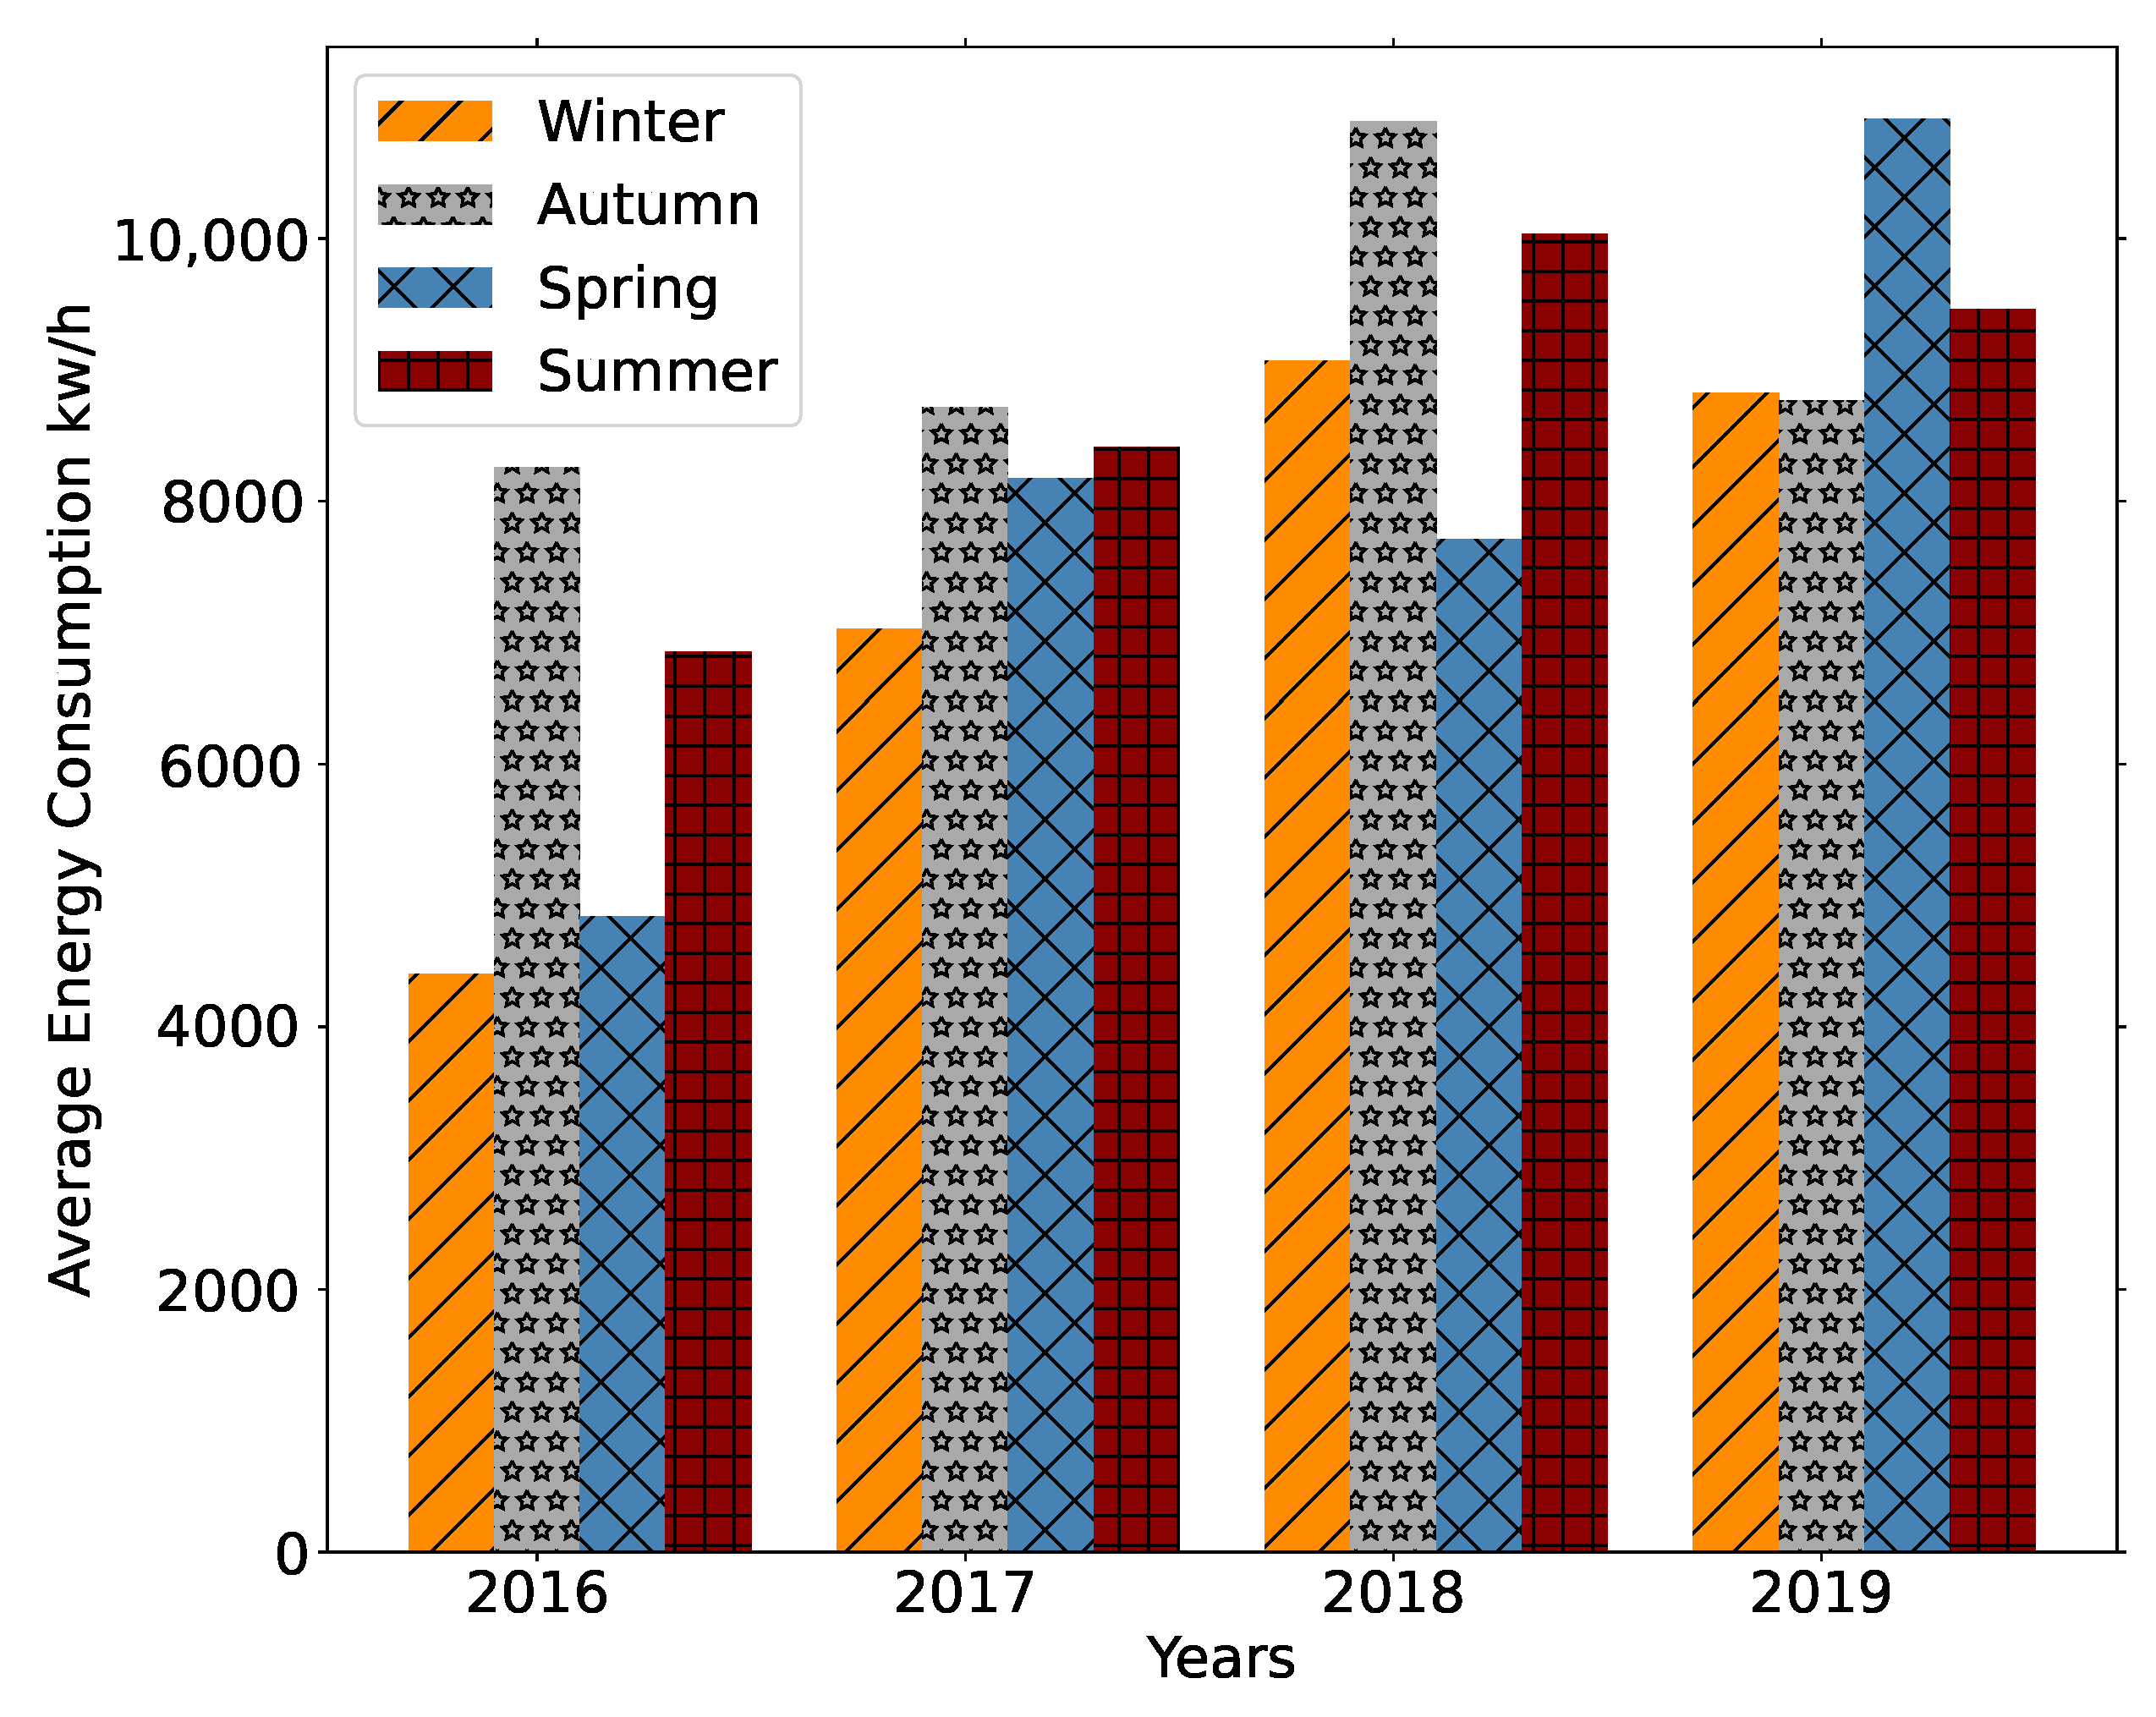
To understand seasonality, we performed two different analyses on the energy consumption data between 2016 and 2019: the first relative to the average consumption by season and the second related to the energy consumption per trimester. Figure 4 depicts the first analysis, being possible to verify that, typically, more energy was consumed during the autumn. Interestingly, in 2019, autumn was the season with the lowest average energy consumption value. In general, it was also possible to see that over the years, energy consumption was rising in different seasons. Despite a higher number of average consumption values, it was not in the autumn that the highest average peak was reached, but in the spring of 2019 with a value of 10,912 kWh. Regarding the lowest peak, it occurred in the winter of 2016, with a value of 4398 kWh. Additionally, it was possible to verify that, in general, winter was the season with less consumption of energy.
The trimesters analysis showed that the fourth trimester had the highest energy consumption values over the first three years. Despite this, the highest value was verified in the second trimester of 2019, with 11,072 kWh. As demonstrated in the seasons’ analysis, in general, the average values increased during the first three years. In 2019, there was an increase in the first and second trimester and a decrease in the third and fourth ones.
Regarding the influent flow, an analysis was carried out considering the average for each year, described in Table 3. As can be seen, 2019 was the year with the highest volume of influent flow on the WWTP (1155.33 m 3 ). Interestingly, checking the year of 2019 concerning the energy consumption (Figure 2), we verified that this year also obtained, in general, the highest average of energy. On the other hand, looking at 2016, excluding the incomplete year of 2020, this was where the lowest average influent flow value occurred, this being, in general, the year with the lowest energy consumption value.

2.1.2. Data Preparation

The first step to prepare the data were to carry out a feature engineering process in the three datasets, thus creating three new features from the timestamps (i.e., year, month, and day). The dataset related to climatological data, as mentioned, had an hourly periodicity, so to match the same periodicity as the other datasets, these were grouped by day, month and year, aggregating the mean value per feature.
As referred above, as both the energy consumption and influent flow datasets presented accumulated values, a method was applied to obtain the value that would correspond to each specific day. The identified extreme outliers, which corresponded to miss insertions of values by the operators of the WWTP (for example, extra digits), were also solved. The remainder of the data treatment is specified in the following lines.
Handling Missing Timesteps
To deal with the missing timesteps verified in the energy consumption and the influent flow datasets, a dataset was created comprising all days (i.e., timesteps) that should have been present in the dataset. In both cases, the start date was 2nd January 2016 and the end date 28 May 2020. The datasets were joined, with missing timesteps being added and having its features filled with the −99 value. Solving the missing timesteps problem created a new one, missing values, i.e., timesteps that were missing were now present but all their features had the −99 value.
Handling Missing Values
To fill the missing values, a queue-based approach was followed. Each record was read for each of the two datasets with missing values, saving its value (energy consumption or influent flow) in the mentioned structure, with a maximum size of eight values. Whenever reading a record, if the queue was full, a push operation would be performed at the beginning of the queue. When a timestep had a feature with the −99 value, its value would be computed based on the average of the last eight records, i.e., the previous 8 days, present in the queue. Once calculated, this value would then be pushed to the queue, eliminating the oldest record. By the end of this process, no dataset had missing values neither missing timesteps.
Joining Datasets
When reaching this point, each one of the three datasets was made of 1609 observations. However, we were required to join the three datasets into a single one. This was performed using the features year, month, and day. In the end, a single dataset was created, having 1609 observations with 30 features each.
Correlation Analysis
To verify which features had a more significant correlation with the target feature (value_energy), it was first necessary to check whether the data followed a normal distribution. Using a p < 0.05 and the Kolmogorov–Smirnov test, it was possible to verify that all features assumed a non-Gaussian distribution. Hence, it was necessary to use the non-parametric Spearman’s rank correlation coefficient, being possible to verify that the features that had a more significant correlation with the target were the year, month, temperature, and flow_value. Since the other features had a low correlation with the target, they were removed. After this treatment, the final dataset had 1609 observations with a shape (1609, 5). Table 4 shows an example of a record in the final dataset.
Handling Outliers
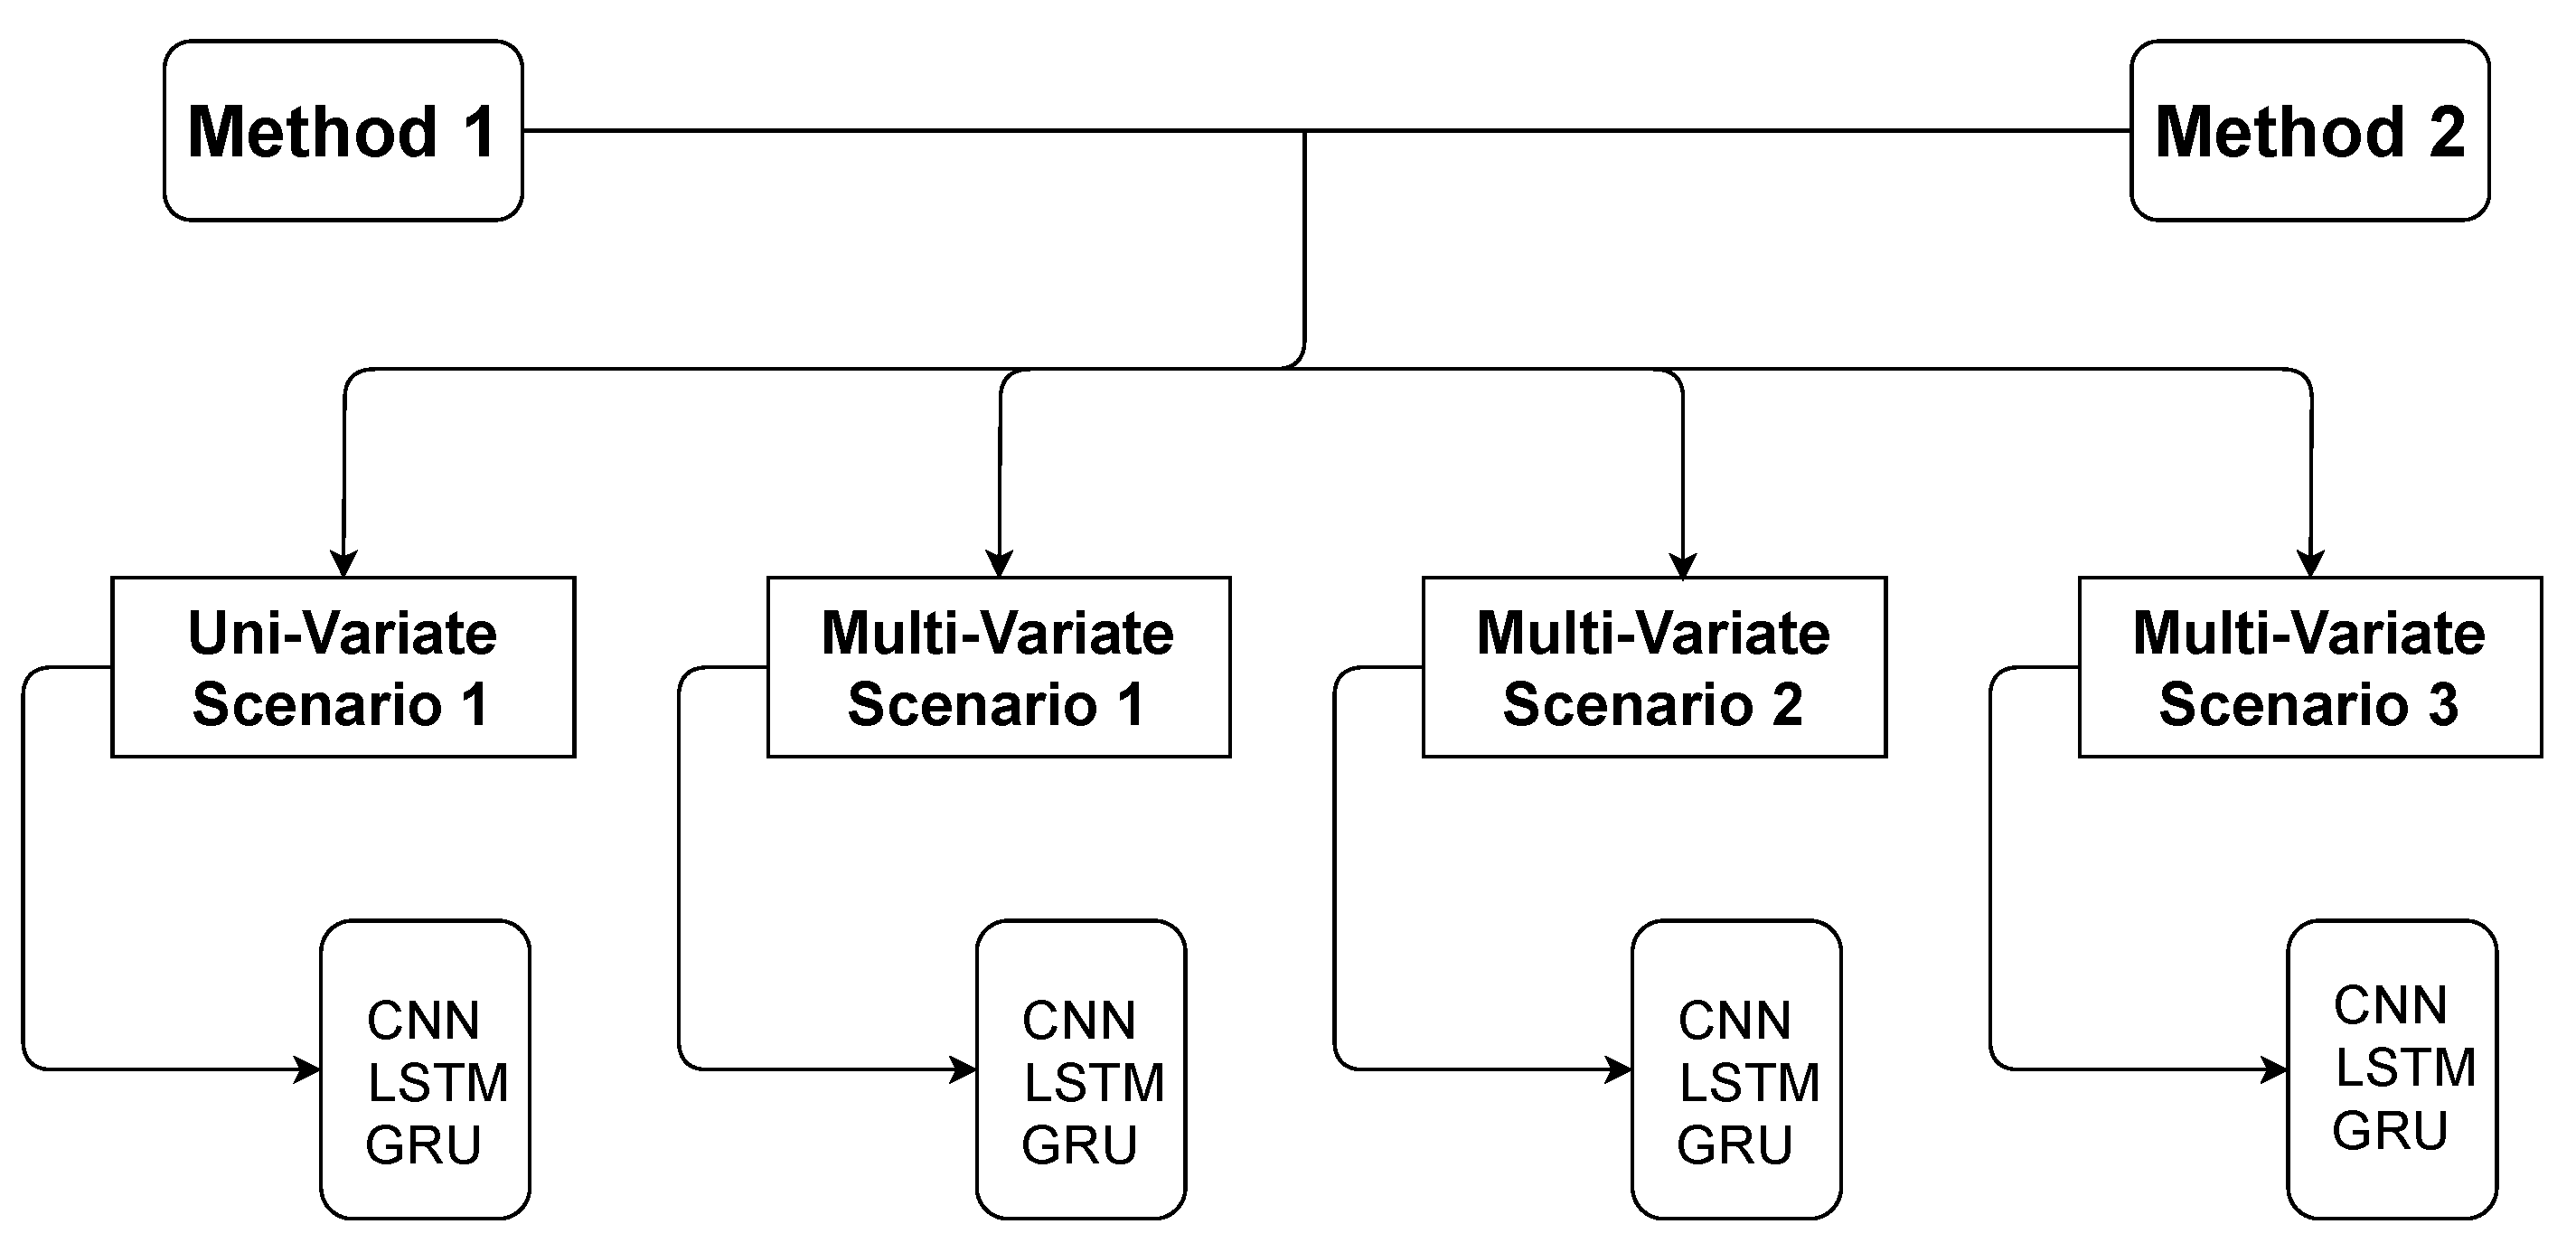
Extreme outliers were above 14,000 kWh. Only six observations were below 2000 kWh. Since the range between the maximum and minimum values for the feature value_energy was large, and considering the reduced amount of observations that were causing it, two different methods were experimented to handle outliers. These two methods provided a comparative term for the different experiments, causing slight modifications to the input data that were fed to the models. The two methods were as follows:
  • Method 1—to further reduce the amplitude of the target feature, the few timesteps with value_energy greater than 10,000 kWh or lower than 2000 kWh had their value updated, using the queue-based approach described above. The goal was to use interpolation to replace the outliers;
  • Method 2—to further reduce the amplitude of the target feature, the few timesteps with value_energy greater than 10,000 kWh or lower than 2000 kWh had their value truncated. The goal was not to use interpolation to update the target value.
Normalisation
With the data prepared, the next step was to normalize them. Since LSTMs work internally with the hyperbolic tangent, we decided that the applied normalization would be in the range [−1, 1], according to the following equation:
x i m i n ( x ) m a x ( x ) m i n ( x )
Supervised Problem
The final step was to go from an unsupervised problem to a supervised one, with the respective inputs (X) and corresponding labels (y). Thus, it was necessary to create sequences of data, which depend on the number of timesteps used as input for the models. A sliding window was used over the initial dataset to create the different sequences and the respective labels, thus creating a set of sequences that can be fed to the models. As an example, if the shape of a model’s input was (1601, 7, 5), the first element set the number of samples, the second the number of input timesteps, and the last the number of features. In this example, the labels would have the shape (1601, 1). A similar algorithm can be seen in the work of Fernandes et al. [15].

2.2. Model Conception

To achieve the objective of forecasting energy consumption in a WWTP, three different DL models were conceived and evaluated, namely LSTMs, GRUs, and uni-dimensional Convolutional Neural Networks (CNNs). Regarding the choice of models, concerning the LSTM and GRU models, these were selected since they belong to the set of Recurrent Neural Networks (RNNs), which has shown an outstanding performance in time series problems. While traditional ANNs cannot remember what they learned in previous iterations, RNNs can learn from earlier timesteps [16,17,18,19]. Regarding the choice of CNNs as the third model to be used, despite its greater use in image processing, it has shown promising results in terms of time series problems when using uni-dimensional convolutions [20,21,22,23].
To find the best combination of hyperparameters, two error metrics were used. The RMSE is an error measure, as it measures the difference between the values predicted by the model ( y ^ ) and the true values observed (y). RMSE equation is as follows:
RMSE = i = 1 n ( y i y ^ i ) 2 n
The second metric, the MAE, is the mean of the differences between predicted and observed values. Its use is mainly to complement and strengthen the confidence on the obtained values. Its equation is as follows:
MAE = 1 n i = 1 n y i y i ^

2.2.1. LSTMs

One of the models used in this study was based on a particular RNN, i.e., LSTMs. RNNs are a type of network that, unlike ANNs, can have as input the current input and pay attention to past inputs [24,25]. In other words, the decision taken on the timestep t − 1 will affect the timestep t. LSTMs, introduced in 1997 by Hochreiter and Schmidhubber [26], can learn temporal dependencies over a long period, in addition to the short term. These networks came to fill an existing problem in RNNs, where there was an exponential drop in the backpropagated error in long periods. Nowadays, LSTMs are widely used in forecasting problems, such as in road traffic or weather, and their use in detecting anomalies in time series problems [27,28,29,30,31].
Regarding the architecture of LSTMs, it consists of multiple memory cells. There are two states in each of these memory cells: the hidden state and the cell state. The hidden state, already present in RNNs, is responsible for short-term memory, while on the other hand, the cell state (not present in RNNs) has the capacity for long-term memory. Additionally, each memory cell has internal gates, which allow a LSTM to forget ( f t ), include ( i t ), and output ( o t ) information [26]. The following equations describe the calculation performed on each of the gates.
i t = σ ( w i [ h t 1 , x t ] + b i )
f t = σ ( w f [ h t 1 , x t ] + b f )
o t = σ ( w o [ h t 1 , x t ] + b o )
where σ represents the sigmoid function, w x the weight for the respective gate, h t 1 the output of the previous block, x t input at current timestep and b x the biases for the respective gate.
First, through the sigmoid layer, it is necessary to decide which information will leave the cell state (forget gate) and remain the same. The action on what will keep information is divided into two stages, the first deciding which values should be updated through another sigmoid layer (input gate) and the second creating a vector of new deals that can add to the state through a hyperbolic tangent layer. The next cell state update is obtained through a point multiplication operation on the two previous steps results. Finally, the output is decided using a sigmoid layer (output gate) followed by a hyperbolic tangent one [26]. Figure 5 provides a graphical view of such a memory cell. The following equations describe the calculation of the cell state, the candidate cell state and the final output.
c t ˜ = t a n h ( w c [ h t 1 , x t ] + b c )
c t = f t × c t 1 + i T × c t ˜
h t = o t × t a n h ( c t )
where c t represents the cell state at timestep t and c t ˜ represents the candidate for cell state at timestep t.

2.2.2. GRUs

Another model used in this study was the GRU. These networks are a subtype of RNNs, introduced in 2014 by Kyunghyun Cho [32]. Like LSTMs, GRUs were developed to solve the vanishing gradient problem of RNNs. GRUs are a simpler version of LSTMs, and they can be faster than these, obtaining similar performance. Unlike LSTMs, GRU cells only have the hidden state, which can maintain long and short term dependencies, thus eliminating the LSTM cell state. Another difference is that GRUs only have two layers of neural networks and have only two gates: reset ( r t ) and update ( z t ) [33]. The following equations describe the calculation performed on each of the gates.
z t = σ ( w z . [ h t 1 , x t ] )
r t = σ ( w r . [ h t 1 , x t ] )
The first step performed in a GRU cell is to represent the information removed by a sigmoid layer, from the previous hidden states, through the reset gate, working in a very similar way to the LSTM forget gate. Then, through the update gate, the amount of information from the previous timesteps is decided to be transmitted to the next state through a sigmoid layer. The next step uses the reset gate, applying a hyperbolic tangent layer, to introduce a new memory content, called the hidden state candidate. Finally, the update gate effect is incorporated to create the new hidden state [33]. GRUs are, like LSTM, widely used in forecasting problems in time series [34,35,36]. Figure 6 provides a graphical view of a GRU cell. The following equations describe the calculation of the current memory content and the final memory at current time step.
h t ˜ = t a n h ( w . [ r t × h t 1 , x t ] )
h t = ( 1 z t ) × h t 1 + z t × h t ˜
where h t ˜ represents the current memory cell and h t the vector which holds information for the current unit.

2.2.3. CNNs

The last model used in this study was a CNN, a type of neural network developed a few decades ago [37,38]. Its appearance was based on a survey carried out by Hubel and Wiesel, in 1962, on the visual cortex of cats [39]. Over the past few years, CNNs has been closely linked to the classification of images and object detection [40,41]. In general, CNNs have a set of essential aspects: the convolutional layer, the pooling layer, and the fully connected one. Based on an image as an input, the convolutional layer is responsible for dividing the image’s features, while the fully connected layer uses the output of the convolutional layer to classify. The pooling layer is used to reduce the amount of information coming from the convolutional one.
Recent times came with the use of CNNs for time series problems, mainly using uni-dimensional ones [21,22,23]. In the context of a time series problem, a significant aspect that needs to be taken into account is the approach being followed in terms of the data format, i.e., whether channels’ last or channels’ first. Concerning channels’ last, this approach aims to reduce the number of timesteps while keeping the number of filters intact. On the other hand, the channels’ first approach does just the opposite, i.e., reduces the number of filters and keeps the number of timesteps intact. Depending on the followed approach, this will always cause differences in the convolutional layer, which has the format ( t i m e s t e p s , f i l t e r s ) . The kernel size is yet another parameter responsible for defining the timesteps window length that is affected by each filter. An illustrative example of a channels’ last approach can be seen in work of Oliveira et al. [23]. Finally, the form of calculating the shape of the output follows the following equation:
( T i m e s t e p s K e r n e l S i z e ) + 1

2.3. Experiments

Several experiments were carried out, taking into account different scenarios as shown in the next lines. The same random seed (91195003) was used in all conducted experiments.

2.3.1. Technologies

For data exploration, the Knime platform was used as well as the Python programming language, version 3.7. Python was also used for data pre-processing and for the development and evaluation of the DL models. Pandas, NumPy, scikit-learn, and matplotlib were the used libraries. In addition to these, TensorFlow v2.0.0 was used to develop the models. Regarding the hardware, all of it was made available by Google’s Colaboratory.

2.3.2. Experimental Setup

To achieve the goal of forecasting the energy consumption of a WWTP, it was necessary to evaluate multiple candidate models. All candidates were designed to follow a recursive multi-step approach, i.e., to forecast energy consumption for the next 2 days.
For each type of DL model used in this study, candidate models were designed based on an uni-variate and multi-variate approach. In the case of being uni-variate, the models would only receive, as input, the value_energy feature. In the multi-variate approach, three distinct scenarios were defined, with each scenario consisting in a different set of features. Table 5 summarises the features that each scenario contains. These scenarios are useful to understand the importance of temporal and climatological context data in the energy consumption of WWTPs. The influent flow is included in all multi-variate scenarios, since it had the highest correlation coefficient with the target feature.
Two distinct datasets were built, one for each outliers’ method. For each method, two approaches were followed: uni- and multi-variate. Then, for each approach, a set of scenarios were defined. Figure 7 sets the different combinations of data used to fit and evaluate the candidate models.
The search for the best hyperparameters’ configuration was performed using grid search. This method was applied to tune parameters such as the model architecture, batch size, or the number of timesteps that make an input sequence. Table 6 describes the hyperparameters’ searching space considered for each model type. Besides, two callbacks were defined over the validation’s loss. One aimed to automatically reduce the learning rate, while the other stopped the training when the RMSE stopped improving.
To prevent overfitting and underfitting situations, learning curves were plotted, stored, and analyzed. It should also be noted, taking into account that we were facing a time series problem, that a time series cross-validator was used ( k = 3 ), namely the TimeSeriesSplit API of scikit-learn. This cross-validator, unlike traditional ones, had successive training sets as supersets of those that came before. Each of these training sets was further split into training and validation sets.

3. Results

Several hundred experiments were run in order to evaluate all possible candidate models. The candidates were evaluated considering their RMSE and MAE.

3.1. Method 1

The first method had the outliers updated as per the conceived queue-based approach. Table 7 presents the best hyperparameter configurations for each combination in this method. Within these combinations, it was possible to verify that the best one concerned CNNs for the third multi-variate scenario, with a MAE of 630 and a RMSE of 690 kWh.
Regarding the uni-variate approach, it was possible to verify some differences between some hyperparameters between the RNN-based models and the CNN-based model. Concerning the number of timesteps and the value of the batch size, it appeared that the CNN-based had the lowest value of both models, 14 and 10, respectively. Regarding the number of layers and the number of neurons/filters, the GRU-based model presented the highest values of 3, 5 and 64, respectively.
Overall, CNN candidates showed better results in all uni- and multi-variate scenarios, except for the second scenario, where GRUs presented a better performance. Regarding the training times, CNNs candidate models demonstrated lower values than the other two, with LSTM-based models being the ones taking more time to fit. It was also notable that the number of timesteps given as input increased, in general, with the number of features provided to the model. Concerning the activation function, it was also possible to verify that there was a tendency to use tanh in the uni-variate approach, while in the multi-variate, the best candidate models tended to use ReLU.
The best multi-variate scenario is the one that added, to the value_energy feature, the flow_value, i.e., the influent flow value combined with energy consumption value. In this approach, it was possible to verify that approach in terms of the number of timesteps, in Scenario 1 and Scenario 2, the model based on LSTM and the model based on CNN presented the same value in both cases, 21 timesteps (3 weeks). Regarding the batch size, note that the LSTM-based model in Scenarios 1 and 2 had a lower value than the others, while in Scenario 3, both models had the same value (20). It was also possible to verify that the best candidate models had a better performance with climatological context and without temporal context, except for CNN-based models. On the other hand, GRU-based models had their the best performance in the uni-variate approach, while the other two models presented their best performance in the multi-variate approach, more specifically in Scenario 3 (value_energy and flow_value features).
Figure 8 plots eight multi-step forecasts for the best candidate model in this method (the best CNN candidate in the third multi-variate scenario). These forecasts describe a set of 28 timesteps (i.e., days) given as input, making a successive two-day forecast for a total of 8 days.

3.2. Method 2

The second method used a dataset that had the outliers truncated. Table 8 depicts the best hyperparameter configuration for each combination of this method, with the best candidate, a CNN, following a uni-variate approach and presenting a MAE of 784 and a RMSE of 869 kWh. This meant that when truncating the outliers, a uni-variate approach presented better results than a multi-variate one.
As in Method 1, the CNN-based models presented a training time shorter than the others. It was also possible to verify that the CNN-based models had better performance. These models show an interesting uniformity in the cardinality of timesteps, while in the other models there was a higher fluctuation. Regarding the number of layers, it was possible to verify a constant value in most models (three layers), except for two CNN-based models.
In the uni-variate approach, it was possible to verify that the model based on CNN presented a lower value of timesteps given as input to the model (14) than models based on RNN. On the other hand, regarding the batch size value, the CNN-based model presented a higher value than the others (30).
Regarding the models conceived over the multi-variate approach, it was possible to verify that the best performance was again obtained by a CNN-based model but now in the second scenario. This scenario had, as input features, the value_energy, temperature, and flow_value. In this approach, it was possible to verify that in the scenario with the most significant number of features given with input to the models, all three models presented the same value of timesteps (21). In the remaining scenarios, where there was a decrease in the number of features, in general, the CNN-based model requires a lower timestamp value than the rest. It should also be noted that, for the most part, all DL models required an equal value of layers in each of the scenarios. It is also interesting to note that this scenario held the best multi-variate candidates for CNNs, LSTMs, and GRUs.
Figure 9 illustrates several multi-step forecasts made by the best candidate model in this method. Here, the input sequence was made of 14 timesteps (i.e., days).

3.3. Transfer Learning

It is usual to find situations where an WWTP has insufficient data. Hence, a goal of this study was to understand the applicability of transfer learning processes in this domain. To achieve such a goal, data were obtained from a second WWTP. However, no influent flow data were available. Hence, we were limited to apply transfer learning processes over the uni-variate approach since it only considers the value_energy feature, which was only available in a daily periodicity for the years of 2016 and 2017. The best uni-variate candidate model, a CNN, was conceived over the first method, i.e., the one that had the outliers interpolated. Hence, the data from the second WWTP were treated similarly. Finally, 2016 data were used for training and 2017 for testing.
To carry out the transfer learning process, it was necessary to store several parameters of the best uni-variate CNN including its architecture, hyperparameters, and weights (the pre-trained model). Two different settings were tried. The first one re-trained the entire pre-trained CNN model, while the second one only re-trained the layers after the last Conv1D/AveragePooling1D pair, inclusive. This is achieved by enabling, or disabling, the trainable property of each layer. Table 9 describes the results achieved by the pre-trained uni-variate CNN model, in each setting.
It was possible to verify that the method with better performance was the one that re-trained the entire model. This method had a MAE of 324 and a RMSE of 357 kWh. Figure 10 illustrate eight multi-step forecasts for the best model. A total of 14 timesteps were used as input, with successive two-day forecasts encompassing the next 8 days.

4. Discussion and Conclusions

Energy consumption forecasting in a WWTP can significantly impact these installations, making them increasingly sustainable, obtaining greater energy efficiency, and reducing costs. After a diversity of experiments being carried out, from all the candidate models, the one achieving a better performance was a multi-variate CNN over the dataset created by Method 1, with a RMSE and MAE of 690 and 630 kWh, respectively.
Another interesting result was the differences in performance concerning the uni- and multi-variate approaches, for the two methods. If in Method 1 the best candidate model was a multi-variate one, in Method 2 it was uni-variate. Regarding both methods, it can be said that the method in which interpolations are made (Method 1) allowed all candidate models to achieve better performances when compared to the method that truncated the outliers (Method 2). Overall, CNN models presented a better performance than the remaining models. Table 10 summarises the obtained results.
Within the different scenarios in the multi-variate approach, there were some differences between both methods. In Method 1, the best multi-variate scenario was found when combining the influent flow with the energy consumption values (Scenario 3). However, in Method 2, the best multi-variate scenario was found when adding the climatological context to the influent flow and energy consumption values (Scenario 2). In both methods, it was possible to verify that the temporal context (year and month) worsened the energy consumption forecasts.
Regarding the cardinality of timesteps required as input by the models, in CNN-based models, the increase in the number of features usually led to an increase in the number of timesteps. On the other hand, GRU-based models showed that more features led to a lower number of timesteps. LSTM candidates had their results varying significantly.
Finally, an analysis was carried out to compare the three models’ performance. A critical difference diagram was developed to represent the results of a two-tailed Nemenyi post-hoc test, with a p < 0.05 , as depicted in Figure 11. When the average ratings of two models differ by, at least, the critical difference, we can say that the performance between the two is statistically significant. Considering the mean MAE as measure, it is possible to verify that CNNs have better performance than LSTMs and GRUs, being this difference statistically significant.
In regard to the applied transfer learning processes, promising results were achieved using a pre-trained uni-variate CNN model. The best performance was achieved when re-training the whole model. To answer the research questions raised at the beginning of the study, it can be said that (RQ1) CNNs performed better than RNNs, with CNN-based models being the best in practically the whole set of experiments; (RQ2) that the feature that most facilitated the process of forecasting energy consumption in a WWTP was the influent flow; and (RQ3) it was found that it is viable to use transfer learning processes in WWTP with a low volume of data and still present promising results.
However, it is known that other factors can be correlated with energy consumption in a WWTP, such as the concentration of certain pollutants in water like B O D 5 . Nevertheless, to obtain this data, laboratory analysis of WWTP waters is required. Thus, it can take us several days to know the B O D 5 value, among many others. Hence, from a data exploration perspective, it is interesting to understand the impact of such pollutants on energy consumption. Although, from an engineering point of view, this is a significant limitation as the goal of this study is to deploy the best DL model to have real-time forecasts of energy consumption. If we were expected to include the concentration of such pollutants, it would only be possible to predict the value of energy consumption in the WWTP for tomorrow after obtaining the results from the laboratory, and this would only be available the day after tomorrow. In this way, we would not be able to implement the model to predict the value of energy consumption for tomorrow due to some input parameters of the model would be unknown and would only be available in a few days.
Considering that we are handling a real-life scenario and that the goal is to deploy the best candidate model in a WWTP, future work and research will focus on the use of more extensive sets of data, as well as the conception and evaluation of hybrid models to forecast energy consumption. An additional goal is to conceive a dashboarding platform for Machine Learning Operations (MLOps) to improve the process of monitoring the execution and performance of the deployed models.

Author Contributions

Conceptualization, P.O. and B.F.; methodology, P.O. and B.F.; software, P.O. and B.F.; validation, P.O. and B.F.; formal analysis, P.O. and B.F.; investigation, P.O. and B.F.; resources, P.N. and C.A.; data curation, P.O. and B.F.; writing—original draft preparation, P.O. and B.F.; writing—review and editing, P.N. and C.A.; visualization, P.O. and B.F.; supervision, P.N.; project administration, P.N. and C.A.; funding acquisition, P.N. and C.A. All authors have read and agreed to the published version of the manuscript.

Funding

The work of Paulo Novais and Cesar Analide has been supported by FCT—Fundação para a Ciência e Tecnologia within the R&D Units Project Scope: UIDB/00319/2020. The work of Pedro Oliveria and Bruno Fernandes is also supported by National Funds through the Portuguese funding agency, FCT—Fundação para a Ciência e a Tecnologia within project DSAIPA/AI/0099/2019.

Data Availability Statement

The data presented in this study are available on request from the corresponding author. The data are not publicly available due to having been made available by a multi-municipal water systems company.

Conflicts of Interest

The authors declare no conflict of interest.

Abbreviations

The following abbreviations are used in this manuscript:
ANNArtificial Neural Networks
ARIMAAutoregressive Integrated Moving Average
BSM1Benchmark Simulation Model
B O D 5 Biological Oxygen Demand
CODChemical Oxygen Demand
CNNConvolutional Neural Network
DLDeep Learning
ENN-ECMElman Neural Network-Energy Consumption Model
FCMFuzzy C-Means
GRUGated Recurrent Units
LSTMLong Short-Term Memory
MAEMean Absolute Error
MAPEMean Absolute Percentage
MLOpsMachine Learning Operations
MLRMulti-variable Linear Regression
OLSOrdinary Least Square
RBFRadial Basis Function
RMSERoot Mean Square Error
RMSLERoot Mean Squared Log Error
RQResearch Question
WWTPWastewater Treatment Plant

References

  1. World Urbanization Prospects-Population Division-United Nations. 2018. Available online: https://population.un.org/wup/ (accessed on 21 January 2021).
  2. Omer, A.M. Energy, environment and sustainable development. Renew. Sustain. Energy Rev. 2018, 12, 2265–2300. [Google Scholar] [CrossRef]
  3. Daw, J.; Hallett, K.; DeWolfe, J.; Venner, I. Energy Efficiency Strategies for Municipal Wastewater Treatment Facilities; National Renewable Energy Lab.(NREL): Golden, CO, USA, 2012. [Google Scholar] [CrossRef] [Green Version]
  4. Liu, F.; Ouedraogo, A.; Manghee, S.; Danilenko, A. A Primer on Energy Efficiency for Municipal Water and Wastewater Utilities; World Bank: Washington, DC, USA, 2012. [Google Scholar]
  5. Frade, J.; Lacasta, N.; Mendes, P.; Cardoso, P.; Trindade, I.; Newton, F.; Franco, P.; Serra, A.; Póvoa, C.; Narciso, F. PENSAAR 2020–Uma Estratégia ao Serviço da População: Serviços de Qualidade a um Preço Sustentável. Available online: https://www.apambiente.pt/index.php?ref=16&subref=7&sub2ref=9&sub3ref=1098 (accessed on 22 January 2021).
  6. Rajaeifar, M.; Ghanavati, H.; Dashti, B.; Heijungs, R.; Aghbashlo, M.; Tabatabaei, M. Electricity generation and GHG emission reduction potentials through different municipal solid waste management technologies: A comparative review. Renew. Sustain. Energy Rev. 2017, 79, 414–439. [Google Scholar] [CrossRef]
  7. Zeng, S.; Chen, X.; Dong, X.; Liu, Y. Efficiency assessment of urban wastewater treatment plants in China: Considering greenhouse gas emissions. Resour. Conserv. Recycl. 2017, 120, 157–165. [Google Scholar] [CrossRef]
  8. De Haas, D.; Foley, J.; Marshall, B.; Dancey, M.; Vierboom, S.; Bartle-Smith, J. Benchmarking Wastewater Treatment Plant Energy Use in Australia. Available online: https://www.researchgate.net/profile/David-De-Haas-2/publication/276921977_Benchmarking_Wastewater_Treatment_Plant_Energy_Use_in_Australia/links/5599093e08ae793d137e2735/Benchmarking-Wastewater-Treatment-Plant-Energy-Use-in-Australia.pdf (accessed on 25 January 2021).
  9. Li, Z.; Zou, Z.; Wang, L. Analysis and forecasting of the energy consumption in wastewater treatment plant. Math. Probl. Eng. 2019, 2019. [Google Scholar] [CrossRef] [Green Version]
  10. Harrou, F.; Cheng, T.; Sun, Y.; Leiknes, T.O.; Ghaffour, N. A Data-Driven Soft Sensor to Forecast Energy Consumption in Wastewater Treatment Plants: A Case Study. IEEE Sens. J. 2020, 21, 4908–4917. [Google Scholar] [CrossRef]
  11. Huang, X.; Han, H.; Qiao, J. Energy consumption model for wastewater treatment process control. Water Sci. Technol. 2013, 67, 667–674. [Google Scholar] [CrossRef] [PubMed] [Green Version]
  12. Ramli, N.A.; Abdul, M.F. Analysis of energy efficiency and energy consumption costs: A case study for regional wastewater treatment plant in Malaysia. J. Water Reuse Desalin. 2017, 7, 103–110. [Google Scholar] [CrossRef] [Green Version]
  13. Maki, S.; Chandran, R.; Fujii, M.; Fujita, T.; Shiraishi, Y.; Ashina, S.; Yabe, N. Innovative information and communication technology (ICT) system for energy management of public utilities in a post-disaster region: Case study of a wastewater treatment plant in Fukushima. J. Clean. Prod. 2019, 233, 1425–1436. [Google Scholar] [CrossRef]
  14. Oulebsir, R.; Lefkir, A.; Safri, A.; Bermad, A. Optimization of the energy consumption in activated sludge process using deep learning selective modeling. Biomass Bioenergy 2020, 132, 105420. [Google Scholar] [CrossRef]
  15. Fernandes, B.; Silva, F.; Alaiz-Moreton, H.; Novais, P.; Neves, J.; Analide, C. Long Short-Term Memory Networks for Traffic Flow Forecasting: Exploring Input Variables, Time Frames and Multi-Step Approaches. Informatica 2020, 31, 723–749. [Google Scholar] [CrossRef]
  16. Jin, X.; Yang, N.; Wang, X.; Bai, Y.; Su, T.; Kong, J. Integrated predictor based on decomposition mechanism for PM2.5 long-term prediction. Appl. Sci. 2019, 9, 4533. [Google Scholar] [CrossRef] [Green Version]
  17. Zhang, T.; Song, S.; Li, S.; Ma, L.; Pan, S.; Han, L. Research on gas concentration prediction models based on LSTM multidimensional time series. Energies 2019, 12, 161. [Google Scholar] [CrossRef] [Green Version]
  18. Mbatha, N.; Bencherif, H. Time series analysis and forecasting using a novel hybrid LSTM data-driven model based on empirical wavelet transform applied to total column of ozone at Buenos aires, Argentina (1966–2017). Atmosphere 2020, 11, 457. [Google Scholar] [CrossRef]
  19. Chatterjee, A.; Gerdes, M.W.; Martinez, S.G. Statistical explorations and univariate timeseries analysis on covid-19 datasets to understand the trend of disease spreading and death. Sensors 2020, 20, 3089. [Google Scholar] [CrossRef]
  20. Zhang, W.; Yu, Y.; Qi, Y.; Shu, F.; Wang, Y. Short-term traffic flow prediction based on spatio-temporal analysis and CNN deep learning. Transp. Transp. Sci. 2019, 15, 1688–1711. [Google Scholar] [CrossRef]
  21. Dong, X.; Qian, L.; Huang, L. Short-term load forecasting in smart grid: A combined CNN and K-means clustering approach. In Proceedings of the International Conference on Big Data and Smart Computing (BigComp), Jeju, Korea, 13–16 February 2017; pp. 119–125. [Google Scholar] [CrossRef]
  22. Hussain, D.; Hussain, T.; Khan, A.A.; Naqvi, S.A.A.; Jamil, A. A deep learning approach for hydrological time-series prediction: A case study of Gilgit river basin. Earth Sci. Informatics 2020, 13, 915–927. [Google Scholar] [CrossRef]
  23. Oliveira, P.; Fernandes, B.; Aguiar, F.; Pereira, M.A.; Analide, C.; Novais, P. A Deep Learning Approach to Forecast the Influent Flow in Wastewater Treatment Plants. In Proceedings of the International Conference on Intelligent Data Engineering and Automated Learning, Guimarães, Portugal, 4–6 November 2020; pp. 362–373. [Google Scholar] [CrossRef]
  24. Schmidhuber, J. Deep learning in neural networks: An overview. Neural Netw. 2015, 61, 85–117. [Google Scholar] [CrossRef] [PubMed] [Green Version]
  25. Medsker, L.; Jain, L. Recurrent Neural Networks: Design and Applications; CRC Press: Boca Raton, FL, USA, 1999. [Google Scholar]
  26. Hochreiter, S.; Schmidhuber, J. Long short-term memory. Neural Comput. 1997, 9, 1735–1780. [Google Scholar] [CrossRef]
  27. Kang, D.; Lv, Y.; Chen, Y. Short-term traffic flow prediction with LSTM recurrent neural network. In Proceedings of the 20th International Conference on Intelligent Transportation Systems (ITSC), Yokohama, Japan, 16–19 October 2017; pp. 1–6. [Google Scholar] [CrossRef]
  28. Yang, B.; Sun, S.; Li, J.; Lin, X.; Tian, Y. Traffic flow prediction using LSTM with feature enhancement. Neurocomputing 2019, 320–327. [Google Scholar] [CrossRef]
  29. Fente, D.N.; Singh, D.K. Weather forecasting using artificial neural network. In Proceedings of the 2018 Second International Conference on Inventive Communication and Computational Technologies (ICICCT), Coimbatore, India, 20–21 April 2018; pp. 1757–1761. [Google Scholar] [CrossRef]
  30. Kim, T.; Cho, S. Web traffic anomaly detection using C-LSTM neural networks. Expert Syst. Appl. 2018, 106, 66–76. [Google Scholar] [CrossRef]
  31. Feng, C.; Li, T.; Chana, D. Multi-level anomaly detection in industrial control systems via package signatures and LSTM networks. In Proceedings of the 47th Annual IEEE/IFIP International Conference on Dependable Systems and Networks (DSN), Denver, CO, USA, 26–29 June 2017; pp. 261–272. [Google Scholar] [CrossRef] [Green Version]
  32. Cho, K.; Van Merriënboer, B.; Bahdanau, D.; Bengio, Y. On the properties of neural machine translation: Encoder-decoder approaches. arXiv 2014, arXiv:1409.1259. [Google Scholar]
  33. Chung, J.; Gulcehre, C.; Cho, K.; Bengio, Y. Empirical evaluation of gated recurrent neural networks on sequence modeling. arXiv 2014, arXiv:1412.3555. [Google Scholar]
  34. Niu, Z.; Yu, Z.; Tang, W.; Wu, Q.; Reformat, M. Wind power forecasting using attention-based gated recurrent unit network. Energy 2020, 196, 117081. [Google Scholar] [CrossRef]
  35. Wang, R.; Li, C.; Fu, W.; Tang, G. Deep learning method based on gated recurrent unit and variational mode decomposition for short-term wind power interval prediction. IEEE Trans. Neural Netw. Learn. Syst. 2019, 31, 3814–3827. [Google Scholar] [CrossRef] [PubMed]
  36. Wang, Y.; Liao, W.; Chang, Y. Gated recurrent unit network-based short-term photovoltaic forecasting. Energies 2018, 11, 2163. [Google Scholar] [CrossRef] [Green Version]
  37. Fukushima, K.; Miyake, S. Neocognitron: A Self-Organizing Neural Network Model for a Mechanism of Visual Pattern Recognition; Springer: Berlin/Heidelberg, Germany, 1982; pp. 267–285. [Google Scholar] [CrossRef]
  38. LeCun, Y.; Bottou, L.; Bengio, Y.; Haffner, P. Gradient-based learning applied to document recognition. Proc. IEEE 1998, 86, 2278–2324. [Google Scholar] [CrossRef] [Green Version]
  39. Hubel, D.H.; Wiesel, T.N. Receptive fields, binocular interaction and functional architecture in the cat’s visual cortex. J. Physiol. 1962, 160, 106–154. [Google Scholar] [CrossRef] [PubMed]
  40. Li, Q.; Cai, W.; Wang, X.; Zhou, Y.; Feng, D.D.; Chen, M. Medical image classification with convolutional neural network. In Proceedings of the 13th International Conference on Control Automation Robotics & Vision (ICARCV), Singapore, 10–12 December 2014; pp. 844–848. [Google Scholar] [CrossRef]
  41. Chen, C.; Liu, M.; Tuzel, O.; Xiao, J. R-CNN for small object detection. In Proceedings of the 13th Asian Conference on Computer Vision, Taipei, Taiwan, 20–24 November 2016; pp. 214–230. [Google Scholar] [CrossRef]
Figure 1. WWTP (Wastewater Treatment Plants) layout.
Electronics 10 01149 g001
Figure 2. Monthly variation of energy consumption over the years present in the dataset.
Electronics 10 01149 g002
Figure 3. Day of the week variation of energy consumption over the years.
Electronics 10 01149 g003
Figure 4. Mean energy consumption per seasons of the year.
Electronics 10 01149 g004
Figure 5. Architecture of a LSTM (Long Short-Term Memory) cell.
Electronics 10 01149 g005
Figure 6. Architecture of a GRU (Gated Recurrent Units) cell.
Electronics 10 01149 g006
Figure 7. Different combinations for the conception of the candidate models.
Electronics 10 01149 g007
Figure 8. Eight multi-step forecasts for the best candidate model in Method 1.
Electronics 10 01149 g008
Figure 9. Eight multi-step forecasts for the best candidate model in Method 2.
Electronics 10 01149 g009
Figure 10. Eight multi-step forecasts when re-train the entire model.
Electronics 10 01149 g010
Figure 11. Critical difference diagram showing pairwise comparison of the average ranks in terms of MAE (Mean Absolute Error) ( p < 0.05 ).
Electronics 10 01149 g011
Table 1. Features available in the used datasets. Only the main features of the climatological dataset are presented.
#FeaturesDescriptionUnit
Energy Consumption Dataset
1dateTimestampdate and time
2value_energyTotal energy consumptionkWh
Influent Flow Dataset
1dateTimestampdate and time
2flowAccumulated influent flow valuem 3
Climatological Dataset
1dt_isoTimestampdate and time
2tempTemperature C
3feels_likeHuman perception of climate C
4temp_minMinimum temperature C
5temp_maxMaximum temperature C
6pressureAtmospheric pressurehPa
7humidityHumidity percentage%
8wind_speedWind speed valuem/s
9wind_degWind directionDegrees
10rainRain volumemm
11clouds_allCloudiness percentage%
Table 2. Descriptive statistics for energy consumption.
Number of ItemsMeanMedianStd. DeviationSkewnessKurtosis
15228050.96076893736.3593.17228.101
Table 3. Average influent flow per year.
YearValue (m 3 )
2016910.69
20171025.23
2018981.26
20191155.33
2020849.19
Table 4. Features present in the final dataset.
#FeaturesObservation Example
1year2018
2month5
3temperature11.96
4flow_value829
5value_energy5155
Table 5. Uni- and multi-variate data scenarios.
Uni-Variate
Scenario 1value_energy
Multi-Variate
Scenario 1value_energy, year, month, temperature, flow_value
Scenario 2value_energy, temperature, flow_value
Scenario 3value_energy, flow_value
Table 6. Hyperparameters searching space.
ParameterLSTM and GRUCNN
Layers[3, 4, 5][3, 4, 5]
Neurons[32, 64, 128]-
Activation[ReLU, Tanh][ReLU, Tanh]
Timesteps[14, 21, 28][14, 21, 28]
Batch Size[5, 10, 20][5, 10, 20]
Dropout[0.0, 0.5][0.0, 0.5]
Kernel Size-[3, 4, 5]
Filters-[16, 32]
Pool Size-[2, 3]
Table 7. Best results, per scenario, for Method 1. The letters stand as follows: a. timesteps; b. batch size; c. number of layers; d. number of neurons/filters; e. pool size; f. kernel size; g. dropout; h. activation; i. RMSE; j. MAE; k. time (s).
Modela.b.c.d.e.f.g.h.i.j.k.
Uni-Variate-Scenario 1
CNN1410332330.0tanh702.71645.7033
LSTM2120332--0.5tanh779.13714.5836
GRU2120564--0.0ReLU715.42653.7578
Multi-Variate-Scenario 1
CNN2120532330.5ReLU737.47677.4832
LSTM215464--0.0tanh788.46720.77175
GRU1410332--0.5tanh755.56693.7873
Multi-Variate-Scenario 2
CNN2120416330.0ReLU742.35684.9219
LSTM215364--0.0ReLU760.75699.45136
GRU2820364--0.0ReLU727.07670.5350
Multi-Variate-Scenario 3
CNN2820432330.5ReLU690.00630.6327
LSTM21204128--0.5ReLU729.73668.6291
GRU2120332--0.5ReLU746.98683.0238
Table 8. Best results, per scenario, for Method 2. The letters stand as follows: a. timesteps; b. batch size; c. number of layers; d. number of neurons/filters; e. pool size; f. kernel size; g. dropout; h. activation; i. RMSE; j. MAE; k. time (s).
Modela.b.c.d.e.f.g.h.i.j.k.
Uni-Variate-Scenario 1
CNN1430432240.5tanh869.78784.2313
LSTM2120332--0.5tanh913.90828.4872
GRU2820364--0.5ReLU869.85798.9483
Multi-Variate-Scenario 1
CNN2110516340.0ReLU926.23845.1127
LSTM215364--0.0ReLU961.34881.92186
GRU2110332--0.5ReLU950.09863.8946
Multi-Variate-Scenario 2
CNN1420316340.0tanh885.90796.0721
LSTM28203128--0.0ReLU913.90845.2851
GRU2120364--0.0ReLU887.41808.7543
Multi-Variate-Scenario 3
CNN1420316330.0tanh916.27831.9012
LSTM14303128--0.5tanh946.63854.8131
GRU2120332--0.5ReLU898.67816.2739
Table 9. Results of the pre-trained CNN (Convolutional Neural Networks) model on the second WWTP (Wastewater Treatment Plants).
SettingRMSEMAE
1-All model re-trained357.98324.69
2-Re-train after the last pair, inclusive367.72334.18
Table 10. Ordered list of best candidate models.
MethodApproachScenarioBest CandidateRMSEMAE
1Multi-Variate3CNN690.00630.63
1Uni-Variate1CNN702.71645.70
1Multi-Variate2GRU727.07670.53
1Multi-Variate1CNN737.47677.48
2Uni-Variate1CNN869.78784.23
2Multi-Variate2CNN885.90796.07
2Multi-Variate3GRU898.67816.27
2Multi-Variate1CNN926.23845.11
Publisher’s Note: MDPI stays neutral with regard to jurisdictional claims in published maps and institutional affiliations.

