Article

The Impact of the Digital Economy on Total-Factor Carbon Emission Efficiency in the Yellow River Basin from the Perspectives of Mediating and Moderating Roles

1
Research Institute of Resource-Based Economic Transformation and Development, Shanxi University of Finance and Economics, Taiyuan 030006, China
2
College of Business, University of Nevada, Reno, NV 89557, USA
3
UniSA Business, University of South Australia, Adelaide, SA 5000, Australia
*
Author to whom correspondence should be addressed.
Systems 2024, 12(3), 99; https://doi.org/10.3390/systems12030099
Submission received: 5 February 2024 / Revised: 8 March 2024 / Accepted: 13 March 2024 / Published: 15 March 2024
(This article belongs to the Section Systems Practice in Social Science)

Abstract

:
China’s digital economy has been expanding rapidly in the past decade. This expansion is having a profound impact on the country’s economy. Using panel data on 97 prefecture-level cities in the Yellow River Basin from 2011 to 2020, this study investigates the multifaceted relationship between the digital economy and total-factor carbon emission efficiency. The research yields three key findings: (1) The digital economy positively enhances overall carbon emission efficiency. This conclusion is drawn with robustness tests. (2) Green technology innovation serves as a partial mediator between the digital economy and total-factor carbon emission efficiency, and this mediation role is influenced by government intervention, which negatively moderates the relationship between the digital economy and green technology innovation but positively impacts the mediation role of green technology innovation between the digital economy and total-factor carbon emission efficiency. (3) The positive impact of the digital economy on total-factor carbon emission efficiency is more significant in the upper reaches, lower reaches, and resource-based cities of the Yellow River Basin. These findings provide new perspectives and empirical evidence for better understanding the relationship between digital economy development and total-factor carbon emission efficiency. They also provide policy recommendations for achieving strategic objectives, including digital economy development, carbon emission reduction, carbon peaking, and carbon neutrality.

1. Introduction

In recent years, climate change caused by massive emissions of greenhouse gases has attracted widespread attention from countries around the world and from all sectors of society, and it has become the focus of discussion by researchers. According to the International Energy Agency (IEA), China’s carbon emissions reached an alarming 10.523 billion tons in 2021, making it the world’s largest carbon emitter. This highlights the seriousness of the emission reduction challenges [1]. Accordingly, China has committed to “strive for carbon peak by 2030 and carbon neutrality by 2060”.
The Yellow River Basin (YRB), commonly hailed as the mother river of China, spans China’s western, central, and eastern regions, covering an expansive drainage area of 767,000 km2 [2]. In the year 2020, the combined population of the nine provinces and autonomous regions along the Yellow River reached approximately 405.96 million people, constituting 28.75% of the total national population. The collective regional gross domestic product (GDP) amounted to around 24.685 trillion yuan, contributing to 24.35% of the nation’s overall economic output. Recognized for its abundant natural resources, such as coal, oil, and natural gas, the basin holds strategic importance in China’s resource portfolio. Beyond its role as a vital ecological barrier in Northern China, the YRB functions as one of China’s indispensable energy bases, ecological safeguards, and economic development zones [3]. However, this region is known for its high pollution and high emissions, and the contradiction between ecological conservation and economic and social development is very prominent [4]. This dilemma demands immediate attention. At present, ecological protection and high-quality development in the Yellow River Basin are national strategies. Therefore, the questions of how to break the resource and environmental constraints in the region, improve carbon emission efficiency, and promote carbon emission reduction have become major issues that need to be solved urgently [5].
At the same time, as network information technology continues to innovate, digital economy has developed rapidly due to its high penetration, scale, and network effects. It is becoming an unstoppable global trend, significantly influencing a country’s competitiveness [6]. In March 2021, China’s State Council released the “14th Five-Year Plan for Digital Economy Development”, emphasizing the need to vigorously promote the industrialization of digital sectors and the digitization of traditional industries, establish internationally competitive digital industry clusters, accelerate the development of the modern service sector, facilitate a deeper integration of online and offline activities, and expedite the construction of new infrastructure. According to the China Academy of Information and Communications Technology, China’s digital economy reached 50.2 trillion yuan in 2022, marking a yearly growth rate of 10.32 percent [7]. This upward trajectory underscores the increasing role of digital economy in supporting the nation’s economy. It also highlights its growing integration into all facets of society, presenting great opportunities for more sustainable and low-carbon economic development. China’s development strategy sees that digital economy serves as a vital avenue for fostering high-quality economic growth and realizing the “dual-carbon” goal during the “14th Five-Year Plan” period. Furthermore, digital economy facilitates the transformation and upgrading of traditional sectors, the nurturing of emerging industries, the expansion of new consumer demands, and the advancement of new infrastructure. At the industry level, the digital economy promotes low-carbon development by driving the transformation and modernization of traditional industries, fostering new sectors, expanding consumer demand, and spurring the development of new infrastructure [8,9]. To individuals, the digital economy can also help reduce carbon emissions by impacting people’s lifestyle choices, for example, by using shared mobility and smart transportation based on digital technology [10].
There are many existing studies that have studied the relationship between the digital economy and carbon emissions [11,12]. The majority of these studies are focused on empirical analyses at the provincial city level in China [13,14]. There is a noticeable scarcity of studies that have studied the logical relationship between digital economy and total-factor carbon emission efficiency. The spatiotemporal evolution patterns of the two subjects and the regional heterogeneity of the impact of the digital economy on carbon emission reduction have not been fully considered.
Based on a systematic assessment of the development level of the digital economy and total-factor carbon emission efficiency, this paper investigates the mechanisms through which the digital economy influences total-factor carbon emission efficiency. The objective is to enhance the understanding of the relationship between the digital economy and total-factor carbon emission efficiency. It aims to provide theoretical contributions and policy recommendations for ecological environmental protection and the high-quality development of the Yellow River Basin.
The contributions of this paper are threefold. Firstly, this study provides a fresh perspective for examining the relationship between the digital economy and carbon emission efficiency by examining this relationship through the lens of total-factor carbon emission efficiency, in contrast to previous studies, which have been mainly focused on the impact of the digital economy on carbon emission intensity. Therefore, it supplements the existing body of knowledge in this area. Secondly, this study focuses on 97 prefecture-level cities within the Yellow River Basin, whereas previous studies have been mainly centered on the provincial city level. Therefore, it broadens the scope of investigation into the relationship between digital economy and total-factor carbon emission efficiency. Moreover, this study takes spatial variability into consideration for data analysis, thereby contributing to the understanding of regional heterogeneity within the Yellow River Basin. Thirdly, this study employs the non-radial directional distance function (NDDF) model, which accounts for non-radial directional distance functions when evaluating all-factor carbon emission efficiency, thereby complementing the measurement methodology for carbon emission efficiency.
The remainder of this paper is organized as follows. Section 2 is a review of the relevant literature, and Section 3 narrates the theoretical assumptions of this study. Section 4 describes the methodology, variables, and data, while Section 5 reports the estimation results and contains discussion on the results. Section 6 highlights the research findings and contributions.

2. Literature Review

2.1. Total-Factor Carbon Emission Efficiency

Scholars have conducted extensive research on measurement methods for total-factor carbon emission efficiency and its influencing factors. A review of existing studies shows that scholars predominantly employ techniques such as stochastic frontier analysis (SFA) [15,16], Data Envelopment Analysis (DEA) [17], the non-radial distance function [18], and super-efficiency SBM model [19,20] to measure total-factor carbon emission efficiency. When examining the socio-economic factors influencing carbon emission efficiency, scholars typically employ empirical models such as dynamic spatial panel models [21], a panel threshold–STIRPAT model [22], a fixed effect model [23], or a threshold regression model [24]. These investigations primarily center around factors related to industrial structure upgrading, technological advancement, energy efficiency, green finance, and environmental regulation. Specifically, industrial structure upgrading, technological progress, improved energy efficiency, and enhanced access to green finance are identified as drivers that positively impact total-factor carbon emission efficiency. However, the effect of environmental regulation on carbon emission efficiency is twofold. On one hand, the “green paradox” perspective argues that positive environmental regulation policies may inadvertently lead to increased carbon emissions and reduced carbon emission efficiency. On the other hand, environmental regulation can induce a reverse emission reduction effect through technological innovation, thereby improving carbon emission efficiency [25].

2.2. Digital Economy

The digital economy, as a burgeoning economic paradigm, has been the subject of research in recent years. Scholars have primarily focused their investigations on unraveling the economic advantages of digital economy. The inception of the term “digital economy” is credited to [26], who described it as an economic system heavily reliant on information and communication technologies. As research has evolved, the spotlight has gradually shifted towards elucidating the economic functions of digital technology and its transformative impact on production relations. Ref. [27] asserts that digital economy represents a novel economic structure rooted in next-generation information technologies such as the Internet and the Internet of Things. This framework hinges on data resources as pivotal production factors, utilizes information networks as crucial conduits, and is driven by digital technological innovation to foster a more profound amalgamation of equity and efficiency. Regarding the economic benefits of the digital economy, from a macro perspective, it catalyzes high-quality economic development by enhancing input factors, optimizing resource allocation efficiency, and boosting total-factor productivity [8,28]. The digital technology seamlessly integrates with various industries, effectuating the digitization of industrial systems and the industrialization of digital technology. This synergy continually begets novel industries and technologies [29], ushering in fresh business models and paradigms. From a micro perspective, the digital economy wields a dual impact. On the one hand, digital consumption greatly amplifies interaction between supply and demand, mitigates information asymmetry, anticipates consumer decision-making behavior, and reshapes consumer preferences [30]. On the other hand, an Internet-centric digital economy significantly enhances enterprise performance, ignites innovation within enterprises [31], propels enterprise digital transformations [32], and expedites the realization of economies of scale and scope.

2.3. Impact of the Digital Economy on Carbon Emission Efficiency

With the increasing severity of environmental issues, scholars have started paying attention to the environmental impact of the digital economy. Nonetheless, the academic community has not yet reached a consensus regarding the effects that the digital economy has on carbon emission reduction. Some scholars posit a positive correlation between the digital economy and overall carbon emission efficiency. Ref. [33] contends that digital economy notably curbs carbon emissions through the upgrading of industrial structures. The enhancement of energy efficiency also serves as one of the avenues for carbon emission reduction. Conversely, some other scholars emphasize the potential adverse relationship between the digital economy and overall carbon emission efficiency. The advancement of digital technologies can escalate energy demand, with the energy consumption of the IT industry and the inputs required for energy-intensive products playing a substantial role in carbon emissions [34,35]. Therefore, the connection between the digital economy and overall carbon emission efficiency remains uncertain and not straightforward; for example, ref. [12] found that digital economy exhibited an inverted U-shaped relationship with carbon emissions, implying that digital economy initially increases and subsequently reduces carbon emissions.
In summary, a review of existing research on the digital economy and total-factor carbon emission efficiency shows an insufficient theoretical explanation as to how the digital economy affects carbon emissions. Furthermore, there are few studies on the intrinsic mechanism of the digital economy on carbon emissions. Bearing this in mind, this paper adopts the double fixed effect model, the mediating effect model, and the moderated mediating effect model and integrates digital economy, total-factor carbon emission efficiency, green technology innovation, and government intervention into a unified framework to analyze the carbon emission reduction effect of digital economy and its regional heterogeneity. Multiple methods are used to test robustness, which is detailed and discussed in Section 4. Therefore, this paper provides more powerful empirical evidence and adds to the existing literature on the topic.

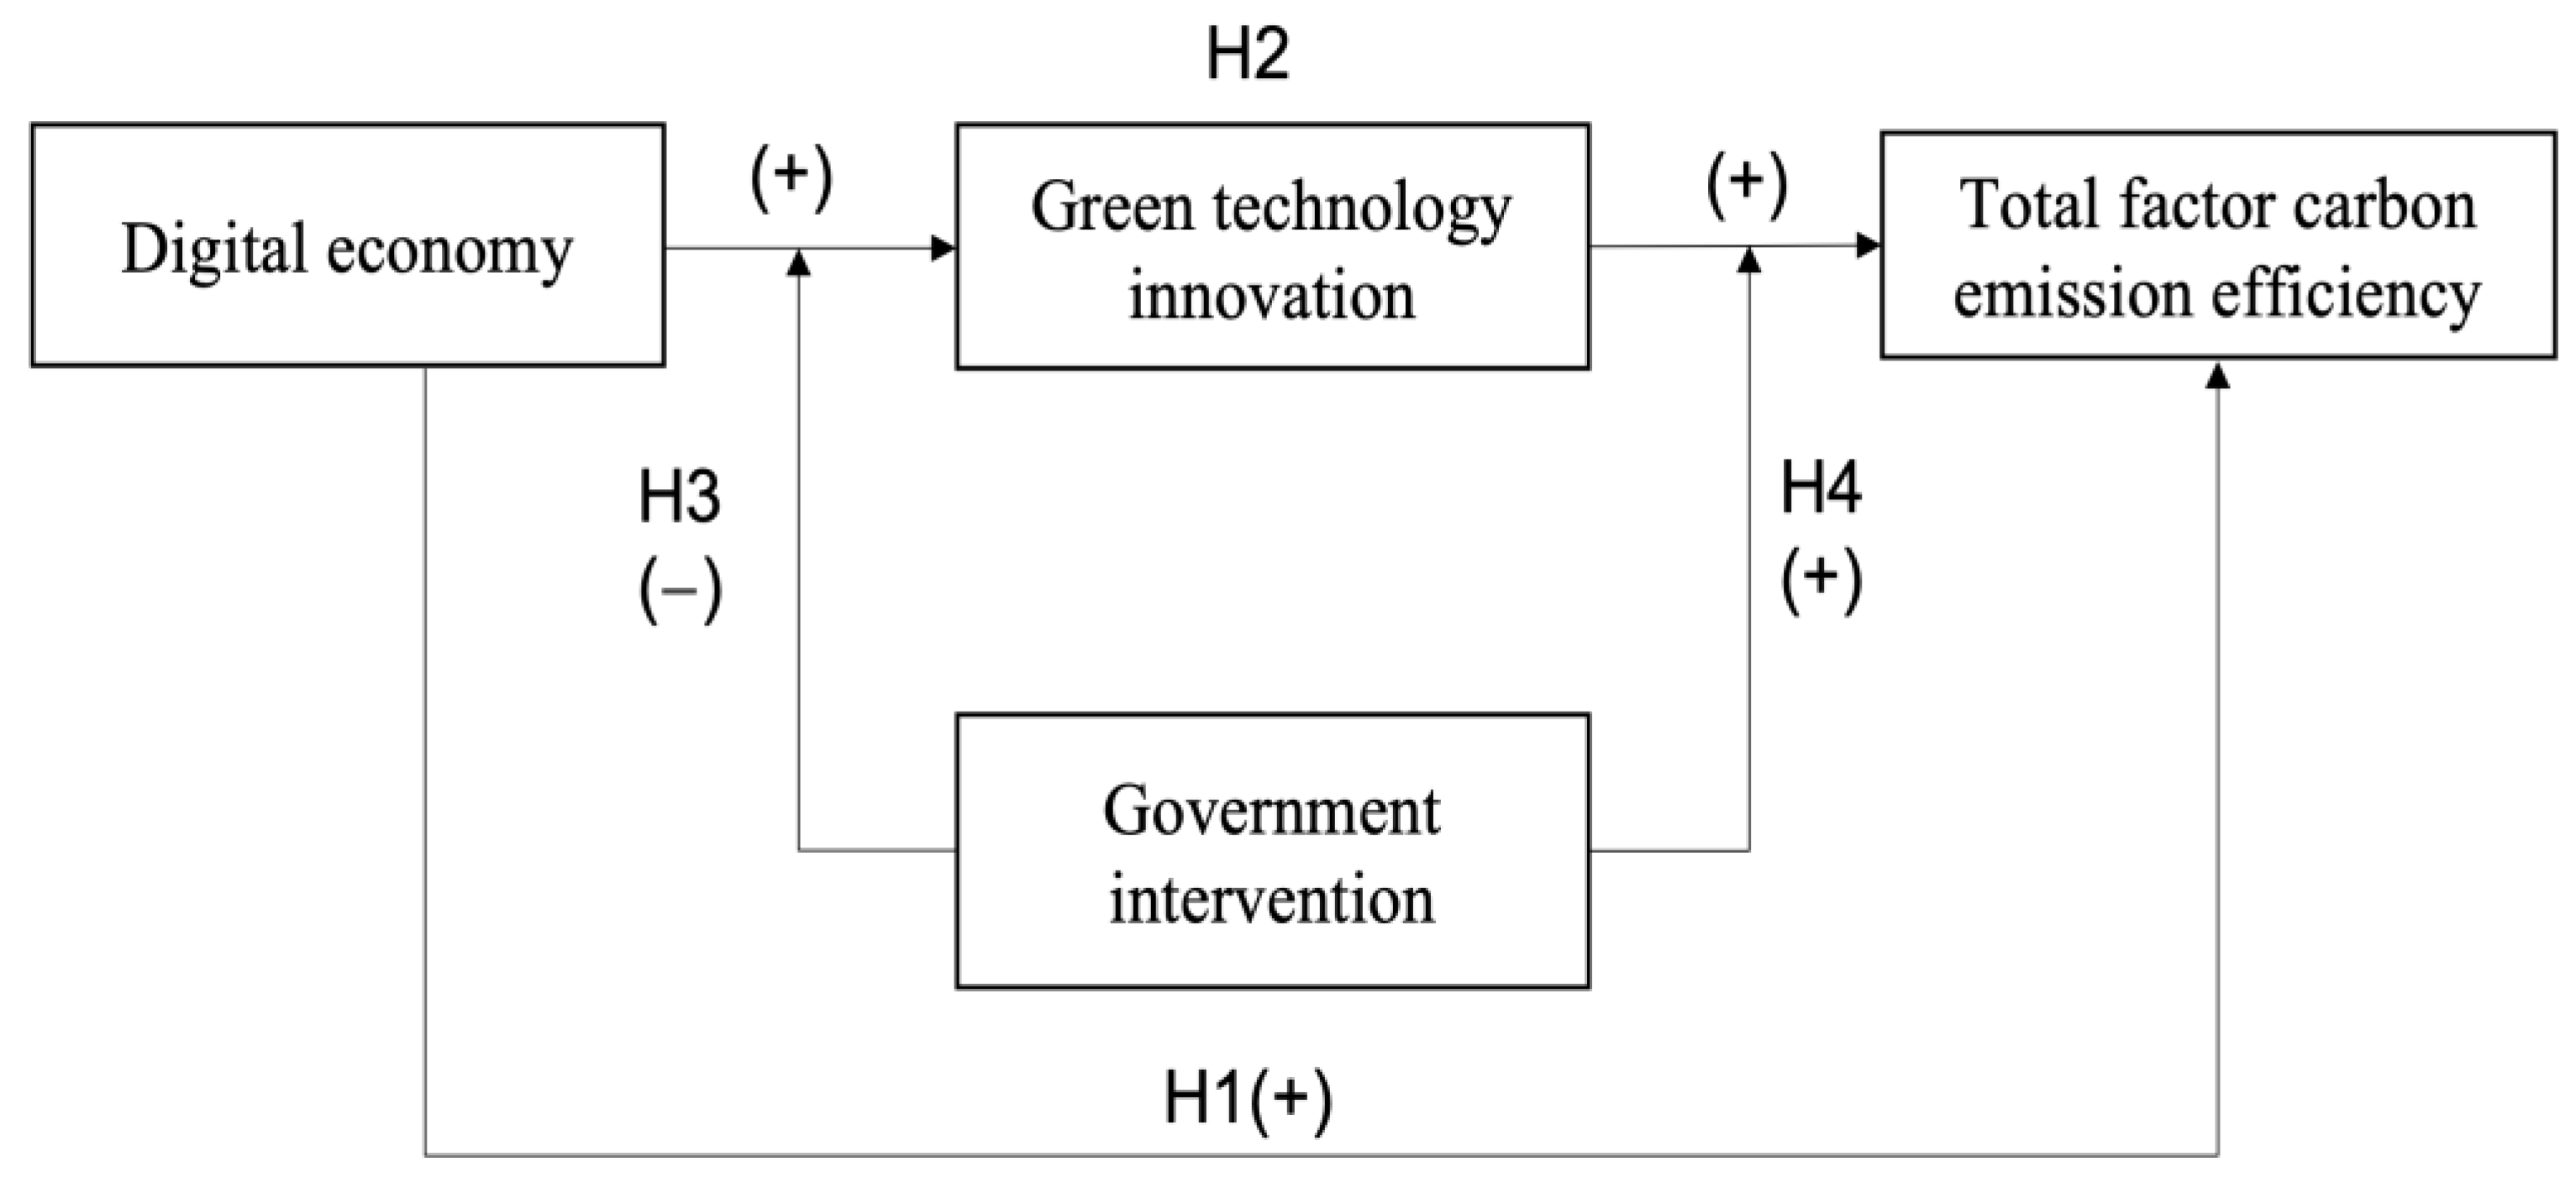
3. Theoretical Hypotheses

3.1. Direct Impact of Digital Economy on Total-Factor Carbon Emission Efficiency

The digital economy is a new form of economic development with data resources as the key production factor, digital technology innovation as the core driving force, and digital platforms such as modern information networks and digital infrastructure as important carriers [36]. From a macro perspective, the digital economy relies on the deep integration of digital technologies such as “Internet +”, big data, cloud computing, and artificial intelligence with industries, changing the previous extensive economic growth model with high energy consumption and high emissions and promoting the digitalization and intelligent transformation of traditional industries [37]. The application of “Metcalfe’s Law” in the digital network realm has led to widespread use of digital technology in key sectors with high carbon emissions, such as power, energy, manufacturing, transportation, construction, and environmental monitoring [38,39]. This has significantly reduced costs, improved profitability, and lowered energy consumption in these fields, thereby improving total-factor carbon emission efficiency [40]. Furthermore, the digital economy has facilitated the adoption of clean and renewable energy sources, such as wind and solar energy, shifting away from heavy reliance on biomass energy and high-carbon fossil fuels. This transition has empowered the move towards a low-carbon economy [41,42]. From a micro perspective, the digital economy has reshaped industries. On the one hand, it has enabled enterprises to gain competitive advantages by transforming their products, creating new value, and establishing a digital presence [43], thereby optimizing input factor allocation. On the other hand, through intelligent data management and monitoring, the digital economy has optimized production processes, reducing energy consumption and carbon emissions and thus improving total-factor carbon emission efficiency [44]. Additionally, digital technologies like cloud computing and big data have enabled demand forecasting, altering consumption patterns and expanding the market scale [45]. New digital economy models, such as paperless communication, online work and education, and live streaming, have reduced unnecessary logistics and commuting, curbing energy consumption and enhancing total-factor carbon emission efficiency [46]. Therefore, this paper posits the following hypothesis:
Hypothesis 1 (H1).
The digital economy enhances total-factor carbon emission efficiency.

3.2. Indirect Effects of the Digital Economy on Total-Factor Carbon Efficiency

Technological innovation plays a pivotal role in fostering long-term, sustainable economic growth. It accelerates the transition of the traditional economy towards a low-carbon economy, with green technological innovation being a key component characterized by knowledge-friendly and environmentally friendly externalities. The digital economy’s characteristics have broken barriers between different innovation fields, encouraging diversification among innovation subjects [47]. Digital platforms specializing in industry–university–research collaboration have attracted various stakeholders, facilitating collaboration and knowledge-sharing, ultimately promoting technological innovation and green industry development [48]. From the perspective of innovation efficiency, green technology innovation requires a large amount of human and material resources and capital investment in its early stages and may not be widely used in practice due to the high initial R&D costs [49]. Moreover, digital technologies, like the Internet, big data, and cloud computing, carry rich external knowledge and information. The application of these technologies allows companies to swiftly access, integrate, and efficiently utilize external information, transitioning from closed innovation to open innovation. This accordingly enhances research and development efficiency in green technological innovation [50].
On the other hand, the digital economy serves as the pivotal driving force behind green technological innovation, a highly effective approach to enhancing the efficiency of total-factor carbon emissions. Firstly, green technology innovation consistently nurtures novel technologies, encompassing areas like carbon capture and storage, air quality management, water pollution control, and end-of-pipe management innovations [51]. These advancements are instrumental in augmenting the overall efficiency of total-factor carbon emissions. Secondly, the widespread application of green technology innovation in enterprises enables them to provide more and better green products and more convenient green services to society. This, in turn, meets the demand of residents for a healthier ecological environment, amplifies their inclination towards consuming environmentally friendly products, and encourages a greater number of people to embrace a green lifestyle. The expansion of green enterprises’ production scale, coupled with the optimization of the supply chain and value chain of traditional industries, forces the transformation and upgrading of high-energy-consuming and high-emission sectors. This systematic shift paves the way for the establishment of scale effects in green industries. In the long run, this approach would significantly reduce carbon emissions and improve the overall efficiency of total-factor carbon emissions [49]. Accordingly, this paper proposes following hypothesis:
Hypothesis 2 (H2).
The digital economy improves the efficiency of total-factor carbon emissions through its facilitation of green technology innovation.

3.3. The Moderating Role of Government Intervention

3.3.1. Digital Economy, Green Technology Innovation, and Government Intervention

Government intervention is frequently utilized as a tool for regulating or guiding markets in order to enhance economic performance and social welfare [52]. However, when government intervention reaches a certain degree, it can have adverse effects on the digital economy. This government intervention in the economic model necessitates significant capital investments and is marked by uncertainty. The current promotion systems for government officials in China encourage local officials to favor traditional energy-intensive industries with established technologies, shorter business cycles, and higher short-term returns for the sake of their position promotion, which closely relates to maximizing economic growth benefits [53]. However, such practices will ultimately obstruct the progress of the digital economy. Furthermore, a high degree of government intervention often leads to an increase in public expenditures on research and development (R&D) [54]. This, in turn, intensifies competition for innovation resources and encourages rent-seeking behavior among innovation actors [55]. As a result, the rise of social R&D creates a crowding-out effect on the digital technology industry [56]. This consequently leads to a decline in innovation capacity [57]. Dysfunctional competition also hinders the diffusion of new technologies, causing a lock-in effect on knowledge spillovers [58]. China’s digital economy is still in its early stages and faces many practical challenges, one of which is government intervention. Government intervention could impede the positive impact of the digital economy on green technology innovation. Therefore, this paper posits following hypothesis:
Hypothesis 3 (H3).
Government intervention plays a negative moderating role in the influence of the digital economy on green technology innovation.

3.3.2. Green Technology Innovation, Total-Factor Carbon Efficiency and Government Intervention

Government intervention plays a crucial role not only in regulating the relationship between the digital economy and green technological innovation but also in influencing the connection between green technological innovation and overall carbon emission efficiency. On one hand, as government intervention deepens in response to the escalating environmental challenges and regulatory demands, the performance evaluation of government officials has shifted from a sole focus on “GDP growth” to “effective environmental governance”. Accordingly, local governments now favor high-quality environmental factors more [59]. This shift serves as a driver for green technological innovation among enterprises. Increased government intervention and environmental regulation provide a conducive environment for technological innovation within businesses. This, in turn, leads to a mutually beneficial outcome characterized by improved financial performance and environmental sustainability. On the other hand, government intervention encourages enterprises to facilitate the transition from high-pollution, high-emission, and labor-intensive industries to green and knowledge- and technology-intensive sectors. This transformation is achieved through the optimal allocation of resources within the region [59]. As a result, this approach enhances the overall efficiency of total-factor carbon emissions. Therefore, government intervention empowers enterprises to drive the green transformation of the economy and enhance the overall carbon emission efficiency of a city by concentrating resources effectively. Accordingly, this paper proposes the following hypothesis:
Hypothesis 4 (H4).
Government intervention plays a positively moderating role in the influence of green technology innovation on total-factor carbon emission efficiency.
Based on the discussions above, the mechanism illustrating the relationship between the digital economy and total-factor carbon emission efficiency is depicted in Figure 1.

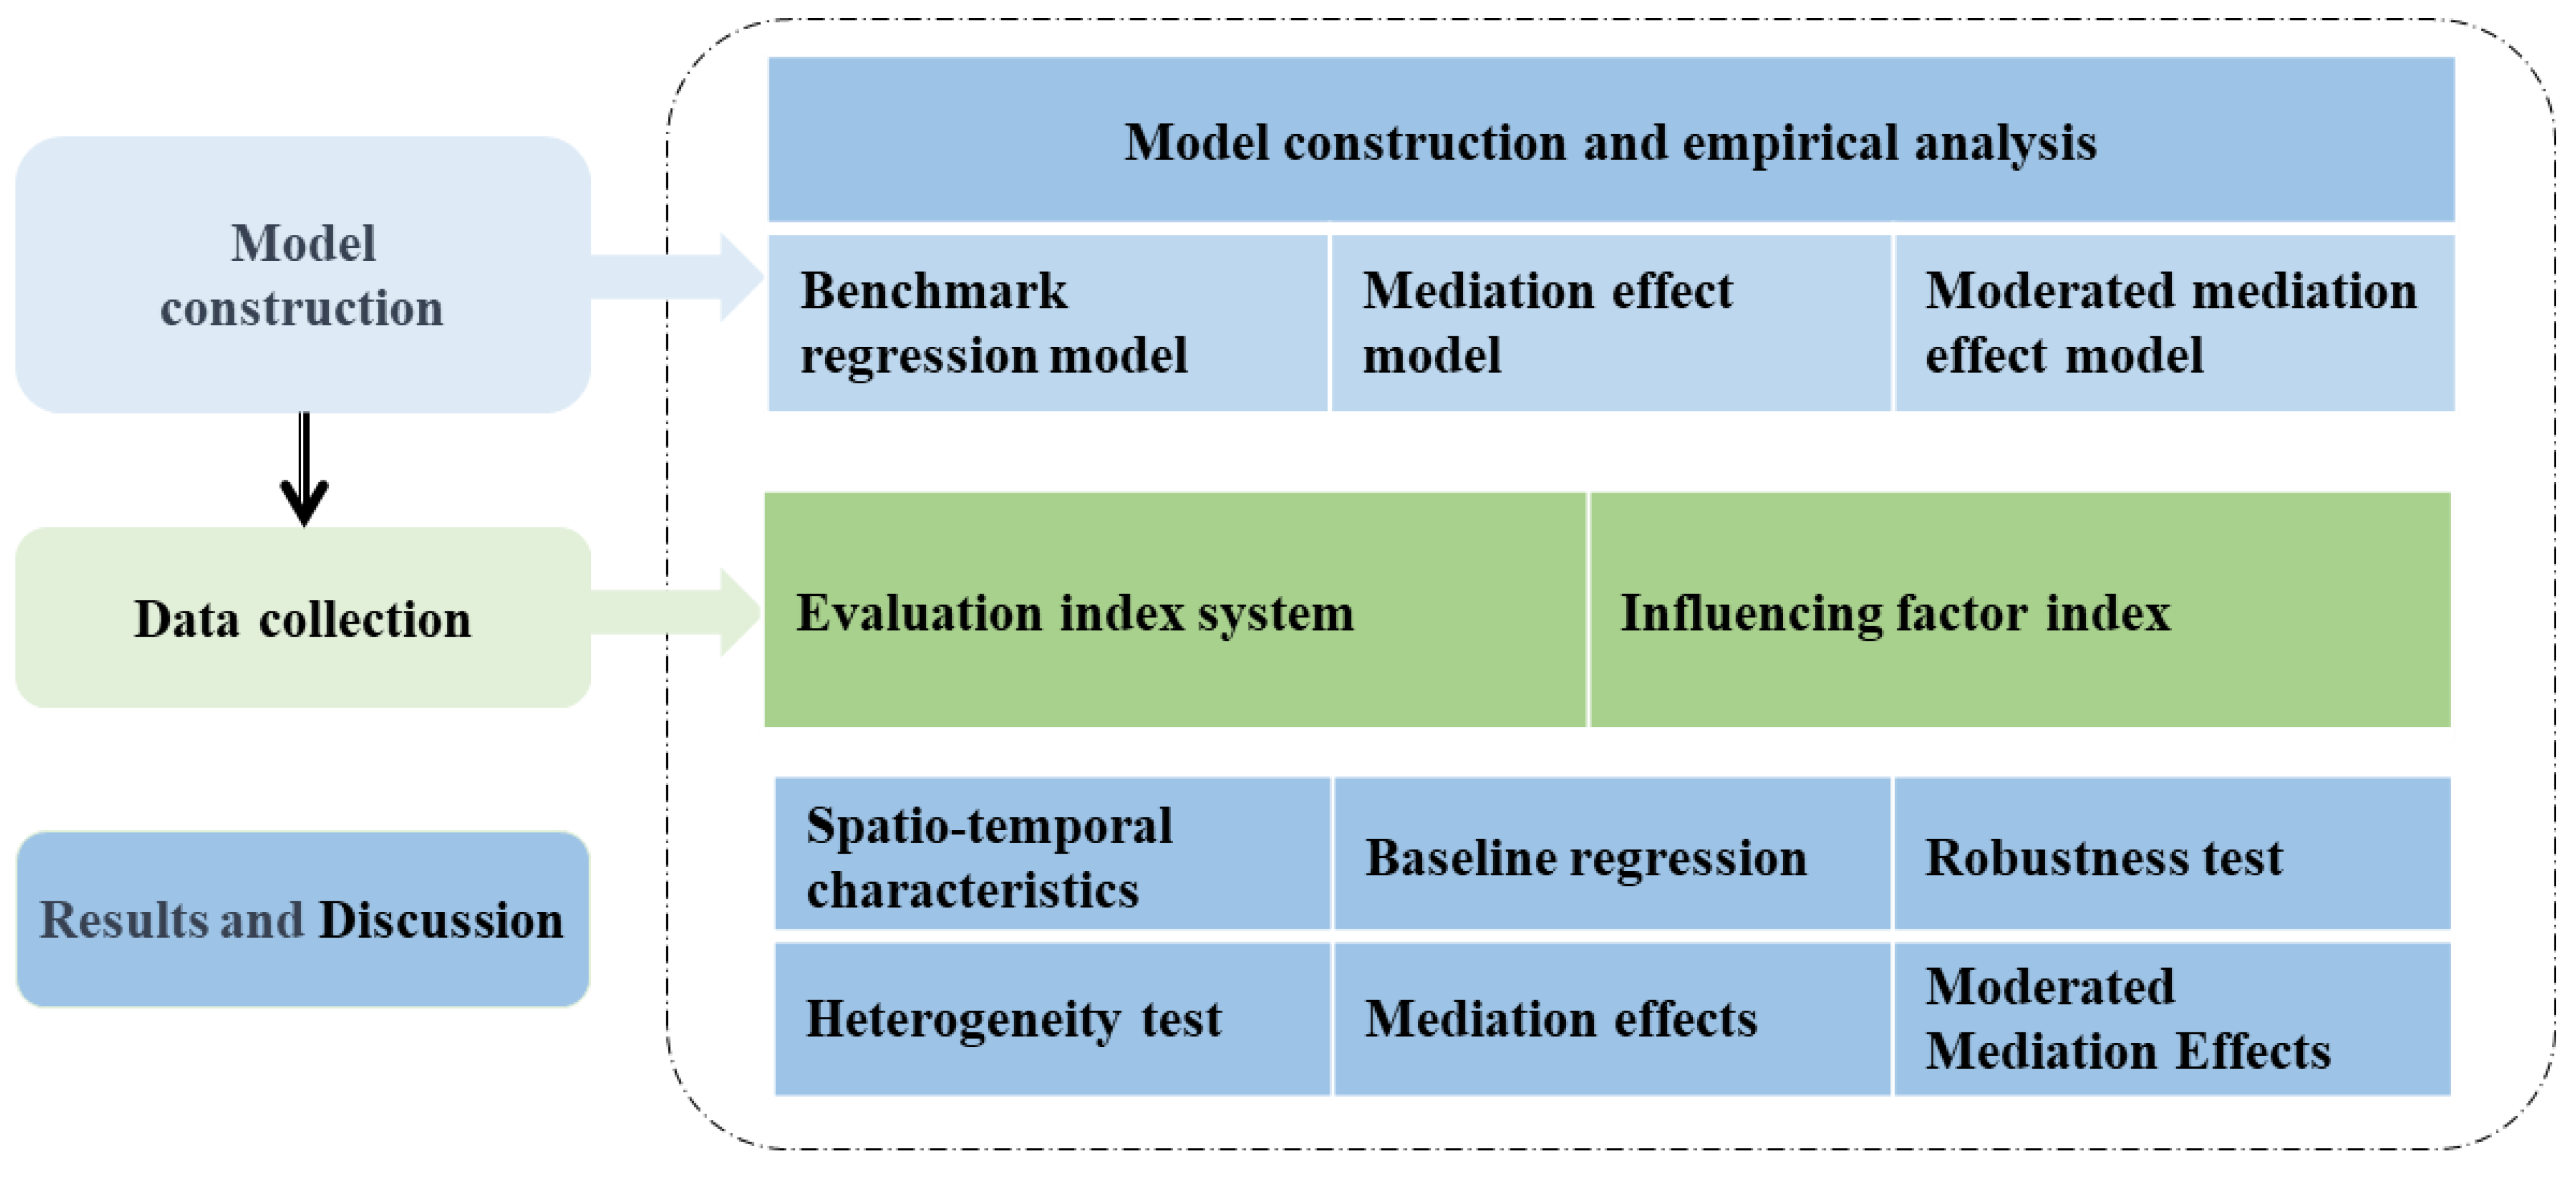
4. Methodology, Variables, and Data

To verify the research hypotheses, this study proceeds with empirical testing as follows (Figure 1). Firstly, we construct the models, which primarily consist of the baseline regression model, the mediation effect model, and the moderation effect model. Secondly, we gather data, including indicators for the digital economy and carbon emission efficiency, as well as data on influencing factors. Thirdly, we conduct a results analysis, which encompasses spatiotemporal characteristics, baseline regression findings, robustness checks, heterogeneity analysis, mediation effects, and moderation effects analysis. As shown in Figure 2 below.

4.1. Model Construction

4.1.1. Benchmark Regression Model

A double fixed-effects model is established to empirically examine the impact of digital economy development on total-factor carbon emission efficiency. The baseline model is structured as follows:
tcpi it = α 0 + α 1 dige it + α 2 Control it + u i + δ t + ε it .
where i and t represent city and time, respectively. t c p i i t denotes total-factor carbon emission efficiency, d i g e i t signifies the level of the digital economy, C o n t r o l i t encompasses a set of control variables, and α 0 , α 1 , a n d   α 2 are the coefficients subject to estimation. ui, δt, εit. denote the individual effects, time effects, and random disturbance terms, respectively.

4.1.2. Mediation Effect Model

According to previous discussions on transmission mechanisms, the digital economy may have an impact on the efficiency of total-factor carbon emissions through green technology innovation. To test whether the factors identified above can act as mediating variables, a mediation effect model is formulated as follows:
M it = β 0 + β 1 dige it + β 2 Control it + u i + δ t + ε it
tcpi it = γ 0 + γ 1 dige it + γ 2 M it + γ 3 Control it + u i + δ t + ε it
where M i t represents the intermediary variable, which is green innovation, while the other variables remain consistent with Equation (1). First, if β 1 is statistically significant, this indicates that there is a significant mediation effect; otherwise, the mediation effect is not significant. Second, if γ 1 and γ 2 are both statistically significant, a partial mediating effect is revealed; if γ 2 is statistically significant but γ 1 is not, a complete mediating effect is confirmed.

4.1.3. Moderated Mediation Effect Model

In order to further reveal the impact of the role of digital economy on total-factor carbon emissions under different levels of government intervention, this paper follows ref. [60] and constructs the mediation model with regulation as such:
tcpi it = α 0 + α 1 dige it + α 2 gov it + α 3 gov it × dige it + Control it + u i + δ t + ε it
M it = β 0 + β 1 dige it + β 2 gov it + β 3 gov it × dige it + γ Control it + u i + δ t + ε it
tcpi it = π 0 + π 1 dieg it + π 2 M it + π 3 gov it + π 4 g o v i t × i n o v i t + γ Control it + u i + δ t + ε it
where Mit signifies the intermediary variable, which represents green innovation, and govit serves as the moderating variable for government intervention, while the other variables maintain consistent with Equation (1). The first step is to test the coefficients α 1 and α 3 of the regression Equation (4). If α 3 is significant, the direct effect is adjusted; otherwise, the direct effect is not adjusted. The second step is to examine the adjusting path by testing the significance of any set of (β1 and π 4 , adjusting the posterior path), ( β 3   a n d   π 2 , adjusting the front half of the path), or ( β 3 and π 4 , adjusting the anterior and posterior paths).

4.2. Variables

4.2.1. Total-Factor Carbon Emission Efficiency

(1)
Measurement of Total-Factor Carbon Emission Efficiency
A Data Envelopment Analysis (DEA) model based on a non-radial directional distance function is employed in this study to conduct a comprehensive investigation into the interplay roles among inputs, desired outputs, and non-desired outputs. Building on the work of refs. [61,62,63], the total-factor carbon emission efficiency index is defined as the ratio of the potential target carbon intensity to the actual carbon intensity. This relationship is expressed by using the following formula:
TCPI = ( C β c C ) / ( Y + β Y Y ) C / Y = 1 β c 1 + β Y
where C represents carbon emissions; Y denotes the desired output (GDP); and carbon intensity C/Y signifies the carbon emissions per unit of GDP. β c and β Y are calculated by the non-radial direction distance function (NDDF).
Notably, TCPI falls within the range of 0 to 1, with a higher value of TCPI indicating a more superior carbon emission performance. If TCPI equals 1, it signifies that the observation lies on the frontier, denoting the best possible carbon emission performance.
With regard to the NDDF, ref. [61] introduced the following definition of the NDDF, which takes undesirable outputs into account via the following:
N D ( x ,   y ,   b ; g ) = sup w T β : x , y , b + g × d i a g ( β ) T ( x )
where w = ( ω n x , ω p y , ω q b ) T represents a vector of normalized weights associated with inputs and outputs, g = ( g x , g y , g b ) stands for the direction vector, and β = ( β n x , β p y , β q b ) T 0 is the vector of scale factors. Combining environmental production technology and the definition of NDDF, the value of N D (x, y, b;g) can be measured by solving the following DEA model:
N D ( x ,   y ,   b ; g ) = max ( ω n x β n x + ω p y β p y + ω q b β q b )
s . t . k = 1 K λ k x n k x n β n x g x n , n = 1,2 , , N k = 1 K λ k y p k y p + β p y g y p , p = 1,2 , , P k = 1 K λ k b q k = b q + β q b g b q , q = 1,2 , , Q z k 0 , k = 1,2 , K β n x , β p y , β q b 0
If N D (x, y, b;g) = 0, it signifies that the evaluated decision unit lies on the optimal production frontier of the “g” vector, taking into account the slack variables. Furthermore, the NDDF offers the advantage of computing the inefficiency values for individual input factors and outputs ( β n x , β p y , β q b ). By contrast, the radial DDF assigns identical inefficiency values to both input factors and outputs ( β ), without distinguishing between the inefficiency values of input factors and outputs.
(2)
Description of total-factor carbon emission efficiency indicators
Total-factor carbon efficiency (TCPI) is the result of a collective interplay involving capital, energy, and labor. In this analysis, the labor input is represented by the number of employees at the end of the year in each city. Capital stock is calculated using a perpetual inventory approach. The energy input encompasses various factors, including the consumption of natural gas, liquefied petroleum gas, and the total annual electricity consumption converted to standard coal. The output metrics comprise the desired output, typically GDP, and the non-desired output, specifically carbon dioxide (CO2) emissions. To compute CO2 emissions comprehensively, a reference is made to the methodology outlined by ref. [64]. The total carbon emissions of each city are obtained by summing the carbon emissions produced by the consumption of electric power, gas, liquefied petroleum gas, and thermal energy. A more detailed overview of the associated indicators is found in Table 1.

4.2.2. Development Level of the Digital Economy

Digital Economy Index (dige): Considering the data availability for cities at the prefecture level, we follow ref. [65] to measure the degree of digital economy development from the perspective of Internet development and digital finance. Internet development is assessed using four key indicators: Internet penetration, related workforce, related output, and cell phone penetration. These indicators encompass total telecommunication services per capita, the proportion of employees within the computer services and software industry relative to the total year-end employees, the number of Internet broadband access subscribers per 100 people, and the number of cell phone subscribers per 100 people, respectively. The evaluation of digital financial development relies on the Digital Inclusive Finance Index, derived from the Digital Inclusive Finance Index of prefecture-level cities, as compiled by the Digital Finance Research Center at Peking University.1 Subsequently, these indices are standardized and weighted using the entropy weight method to derive the Digital Economic Development Index. The detailed description is shown in Table 2.

4.2.3. Mediation Variable

Green technological innovation (inov): In this study, the measurement of green technological innovation draws upon the combined sum of green invention patent applications and green utility model patent applications, in accordance with the approach employed in the study of refs. [66,67]. To be specific, the data on green patent applications for each city is acquired by collecting comprehensive patent application information published by the State Intellectual Property Office (SIPO).2 Subsequently, the patent classification numbers for prefecture-level cities are matched with the green list provided by the World Intellectual Property Organization (WIPO) for international patent classifications.

4.2.4. Moderator Variable

Government intervention (gov): This study follows ref. [68] and measures government intervention using the ratio of local government fiscal expenditure to GDP. Government intervention could lead to two consequences. The first is that local governments prioritize traditional industries with higher return on investment for economic growth, which means higher energy consumption and carbon emissions. The second is that as the environment continues to deteriorate, local governments will incorporate environmental regulations into their assessment standards so as to achieve carbon emission reduction to a certain extent.

4.2.5. Control Variables

Acknowledging the multifaceted nature of factors influencing total-factor carbon emissions efficiency and following the approaches employed in the study of refs. [69,70], this study incorporates the following control variables into analysis in order to obtain more comprehensive results. ① Population size (lnpeo) takes the natural logarithm of the resident population to be employed as a measure. In general, the more populated the area is, the more developed the economy of the area is. It is likely to lead to higher carbon emissions. ② Industrial structure (industry) is represented by the ratio of the output value of the tertiary industry to that of the secondary industry. The secondary industry is mostly heavy industry, which consumes a great amount of energy, and its carbon emission intensity is much higher than that of the primary industry and tertiary industry. The tertiary industry is mostly the service industry, which produces lowers carbon emissions. ③ Employment density (ED) is calculated as the ratio of the number of employed individuals to the administrative district’s area. Employment density reflects the geographical agglomeration of labor and enterprises. An increase in agglomeration will lead to an increase in carbon emissions and environmental pollution. ④ Environmental regulation (ER) captures the regulatory aspect by considering three indicators: the rate of the harmless treatment of domestic garbage, the centralized treatment rate of sewage treatment plants, and the utilization rate of general industrial solid waste. A composite index is computed using the entropy weight method, consolidating these three indicators into a single measure. Generally, the higher the degree of environmental regulation is, the smoother carbon reduction works.

4.3. Data Sources

This study focuses on the 97 prefecture-level cities situated within the Yellow River Basin. The primary data sources include the China Urban Statistical Yearbook, China Energy Statistical Yearbook, China Carbon Emission Database, and the statistical yearbooks of each prefecture-level city. The Digital Financial Inclusion Index is sourced from the research conducted by the Digital Finance Research Center of Peking University.3 As the Digital Finance Research Center began to measure the Digital Financial Inclusion Index in 2011, the timeframe of this study spans from 2011 to 2020. In instances if a city has missing data for certain years, interpolation methods such as linear interpolation and the average value method are employed to replace the missing data. All indicators involving prices have been adjusted to constant 2007 prices. The descriptive statistics of the variables are summarized in Table 3.

5. Results and Discussion

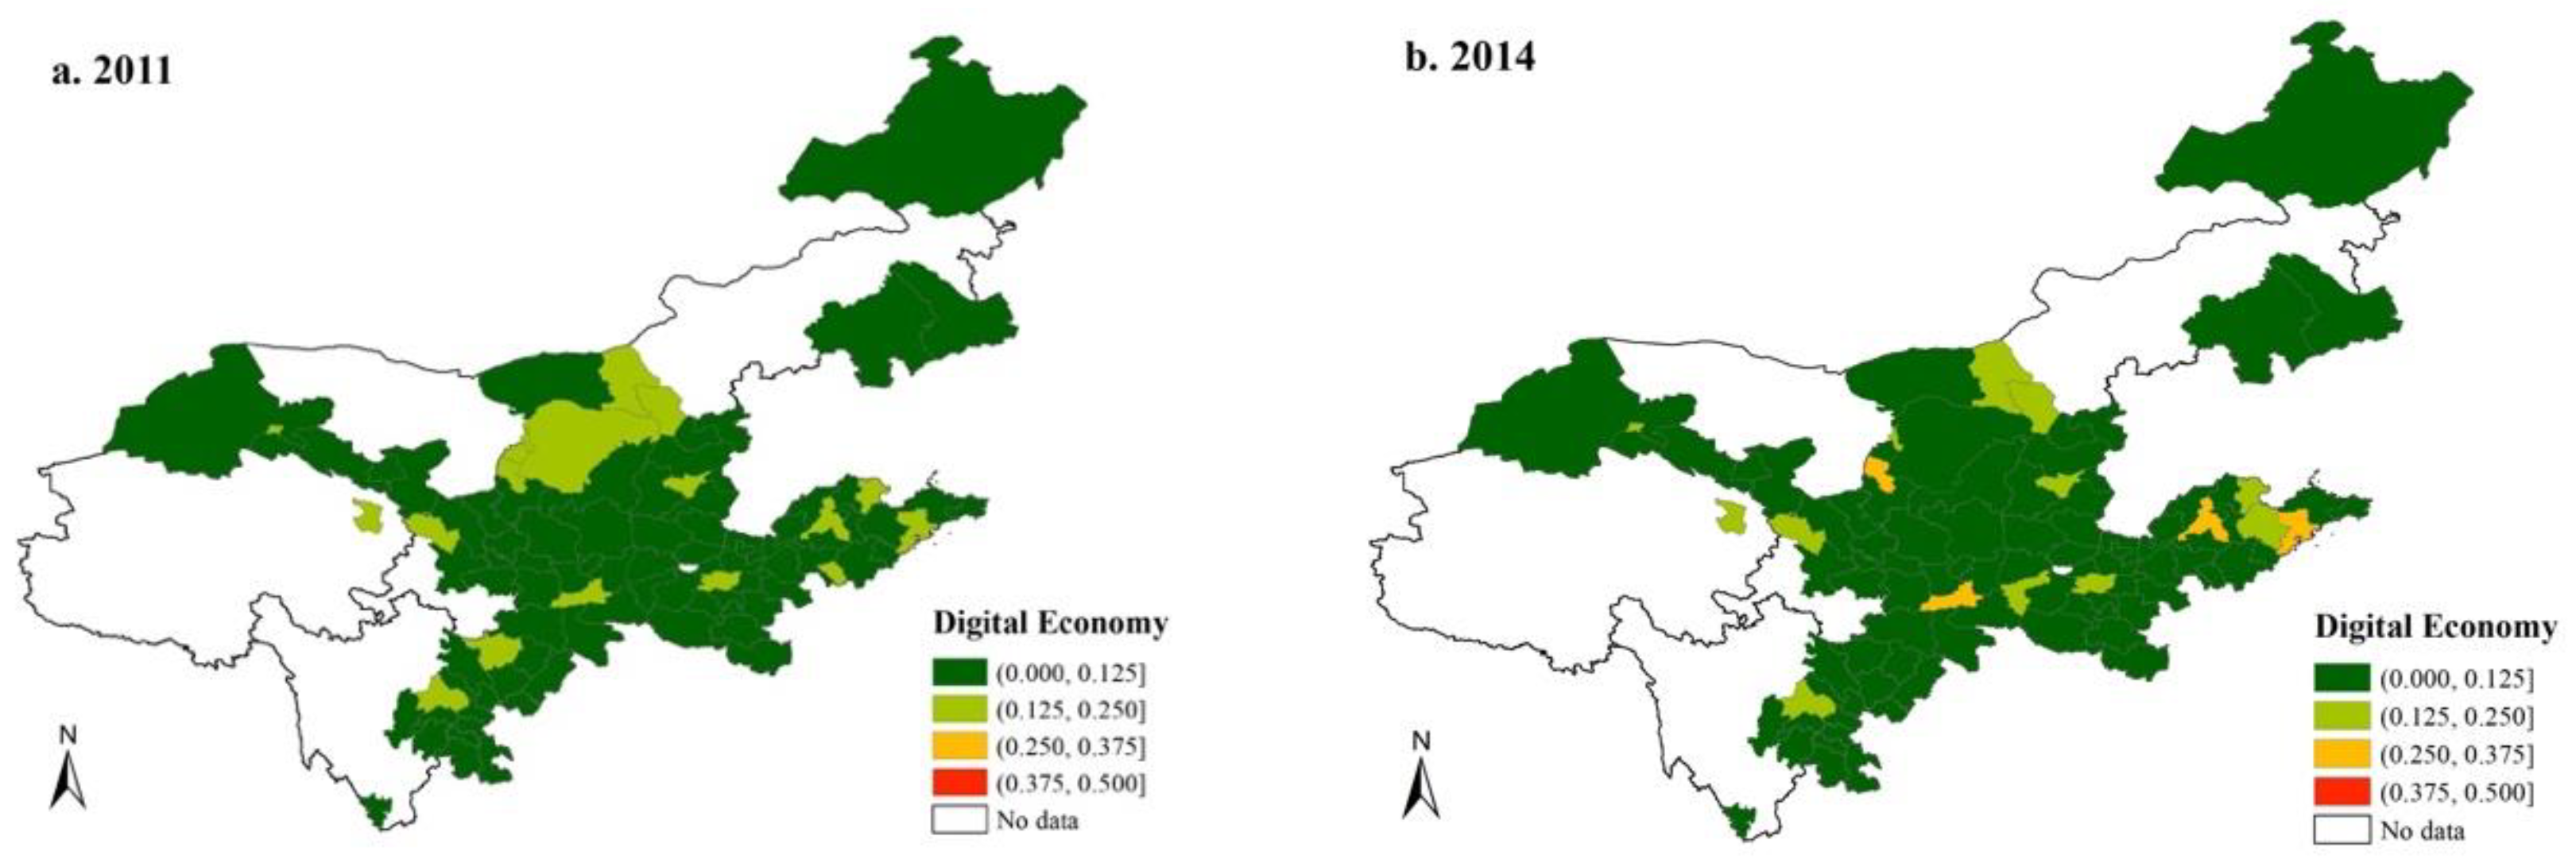
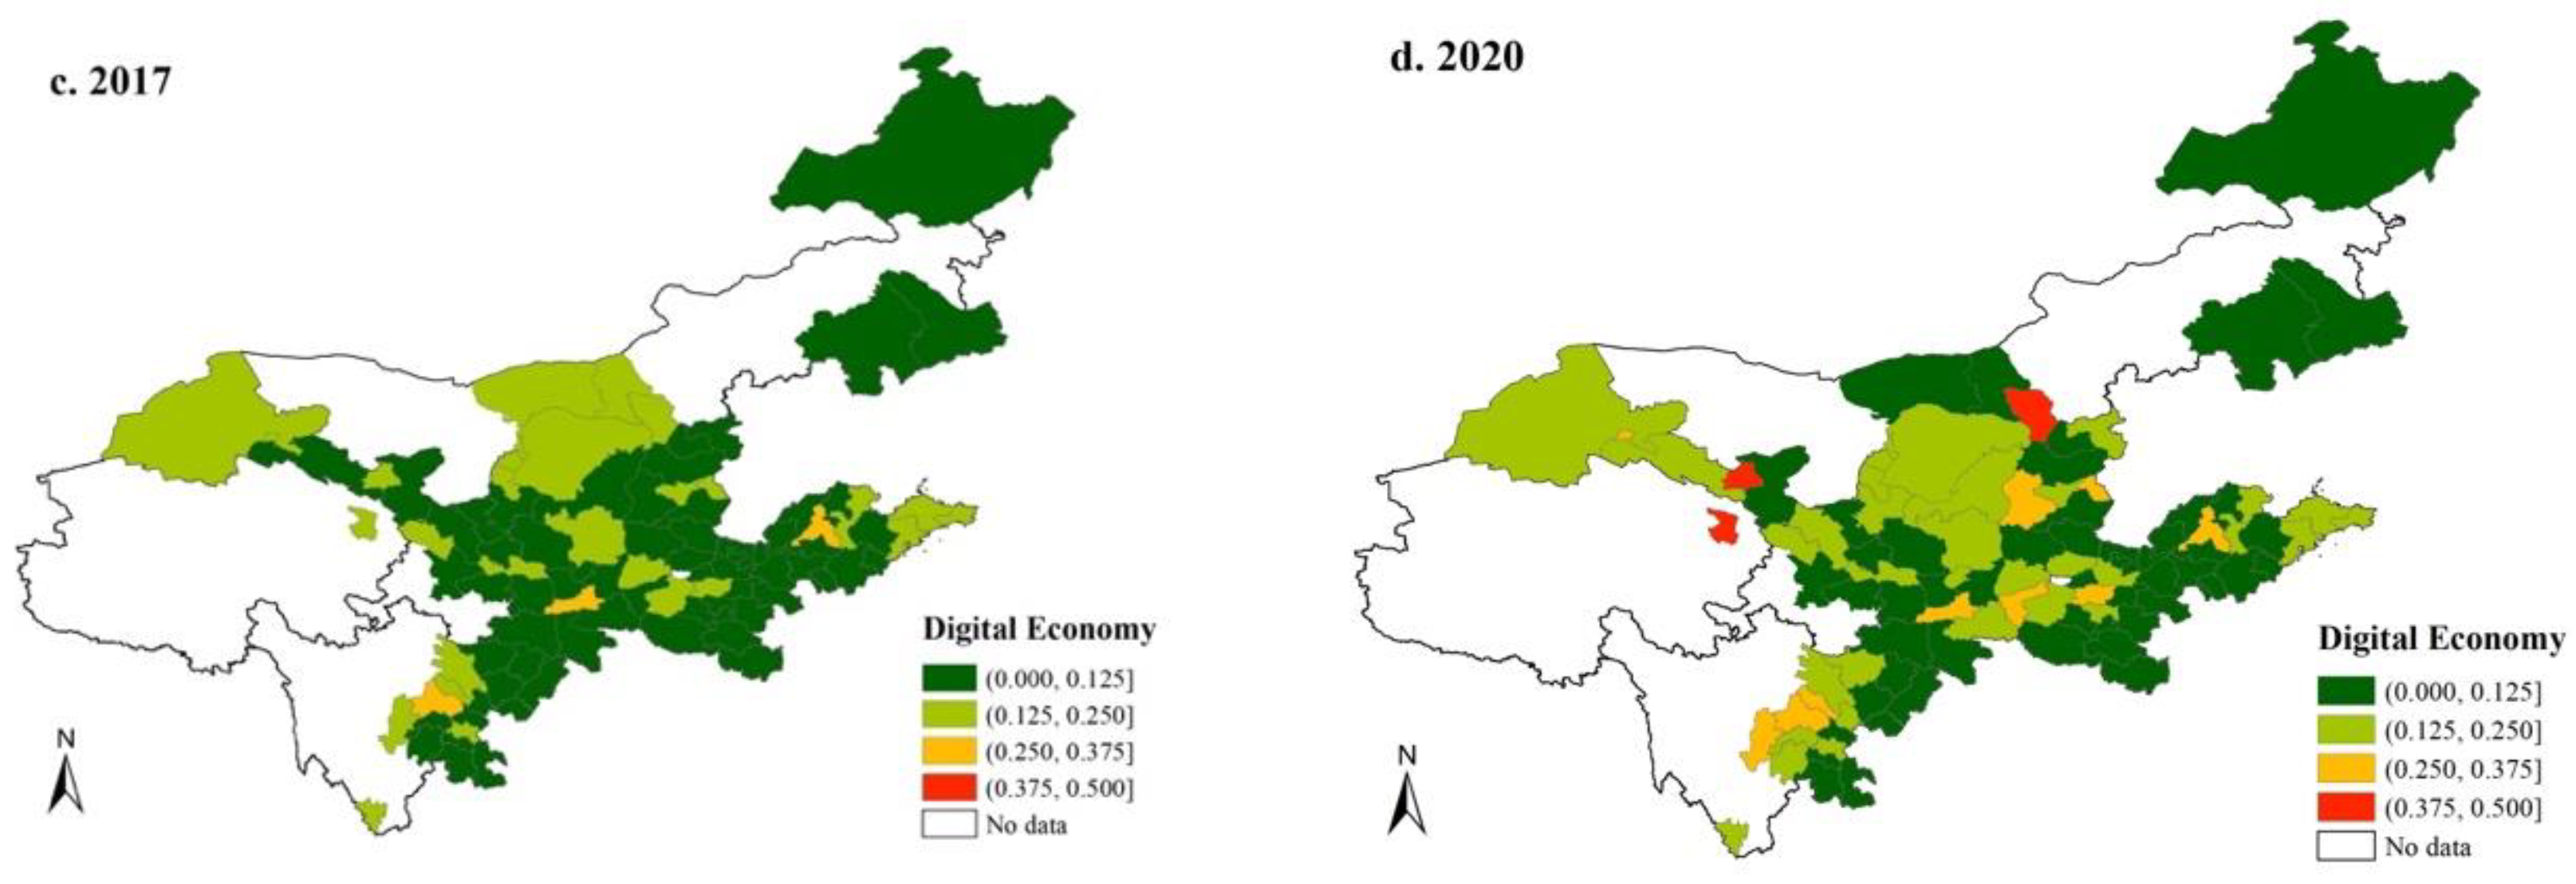
5.1. Temporal and Spatial Evolution

To provide a more comprehensive depiction of the spatial and temporal evolution trends regarding the digital economy development level of the 97 prefecture-level cities within the Yellow River Basin, this study leveraged ArcGIS 10.7 software to generate maps to illustrate the spatial distribution of the Digital Economy Development Index and total-factor carbon emission efficiency for the years 2011, 2014, 2017, and 2020 (Figure 3).
(1)
Temporal and spatial evolution of the digital economy
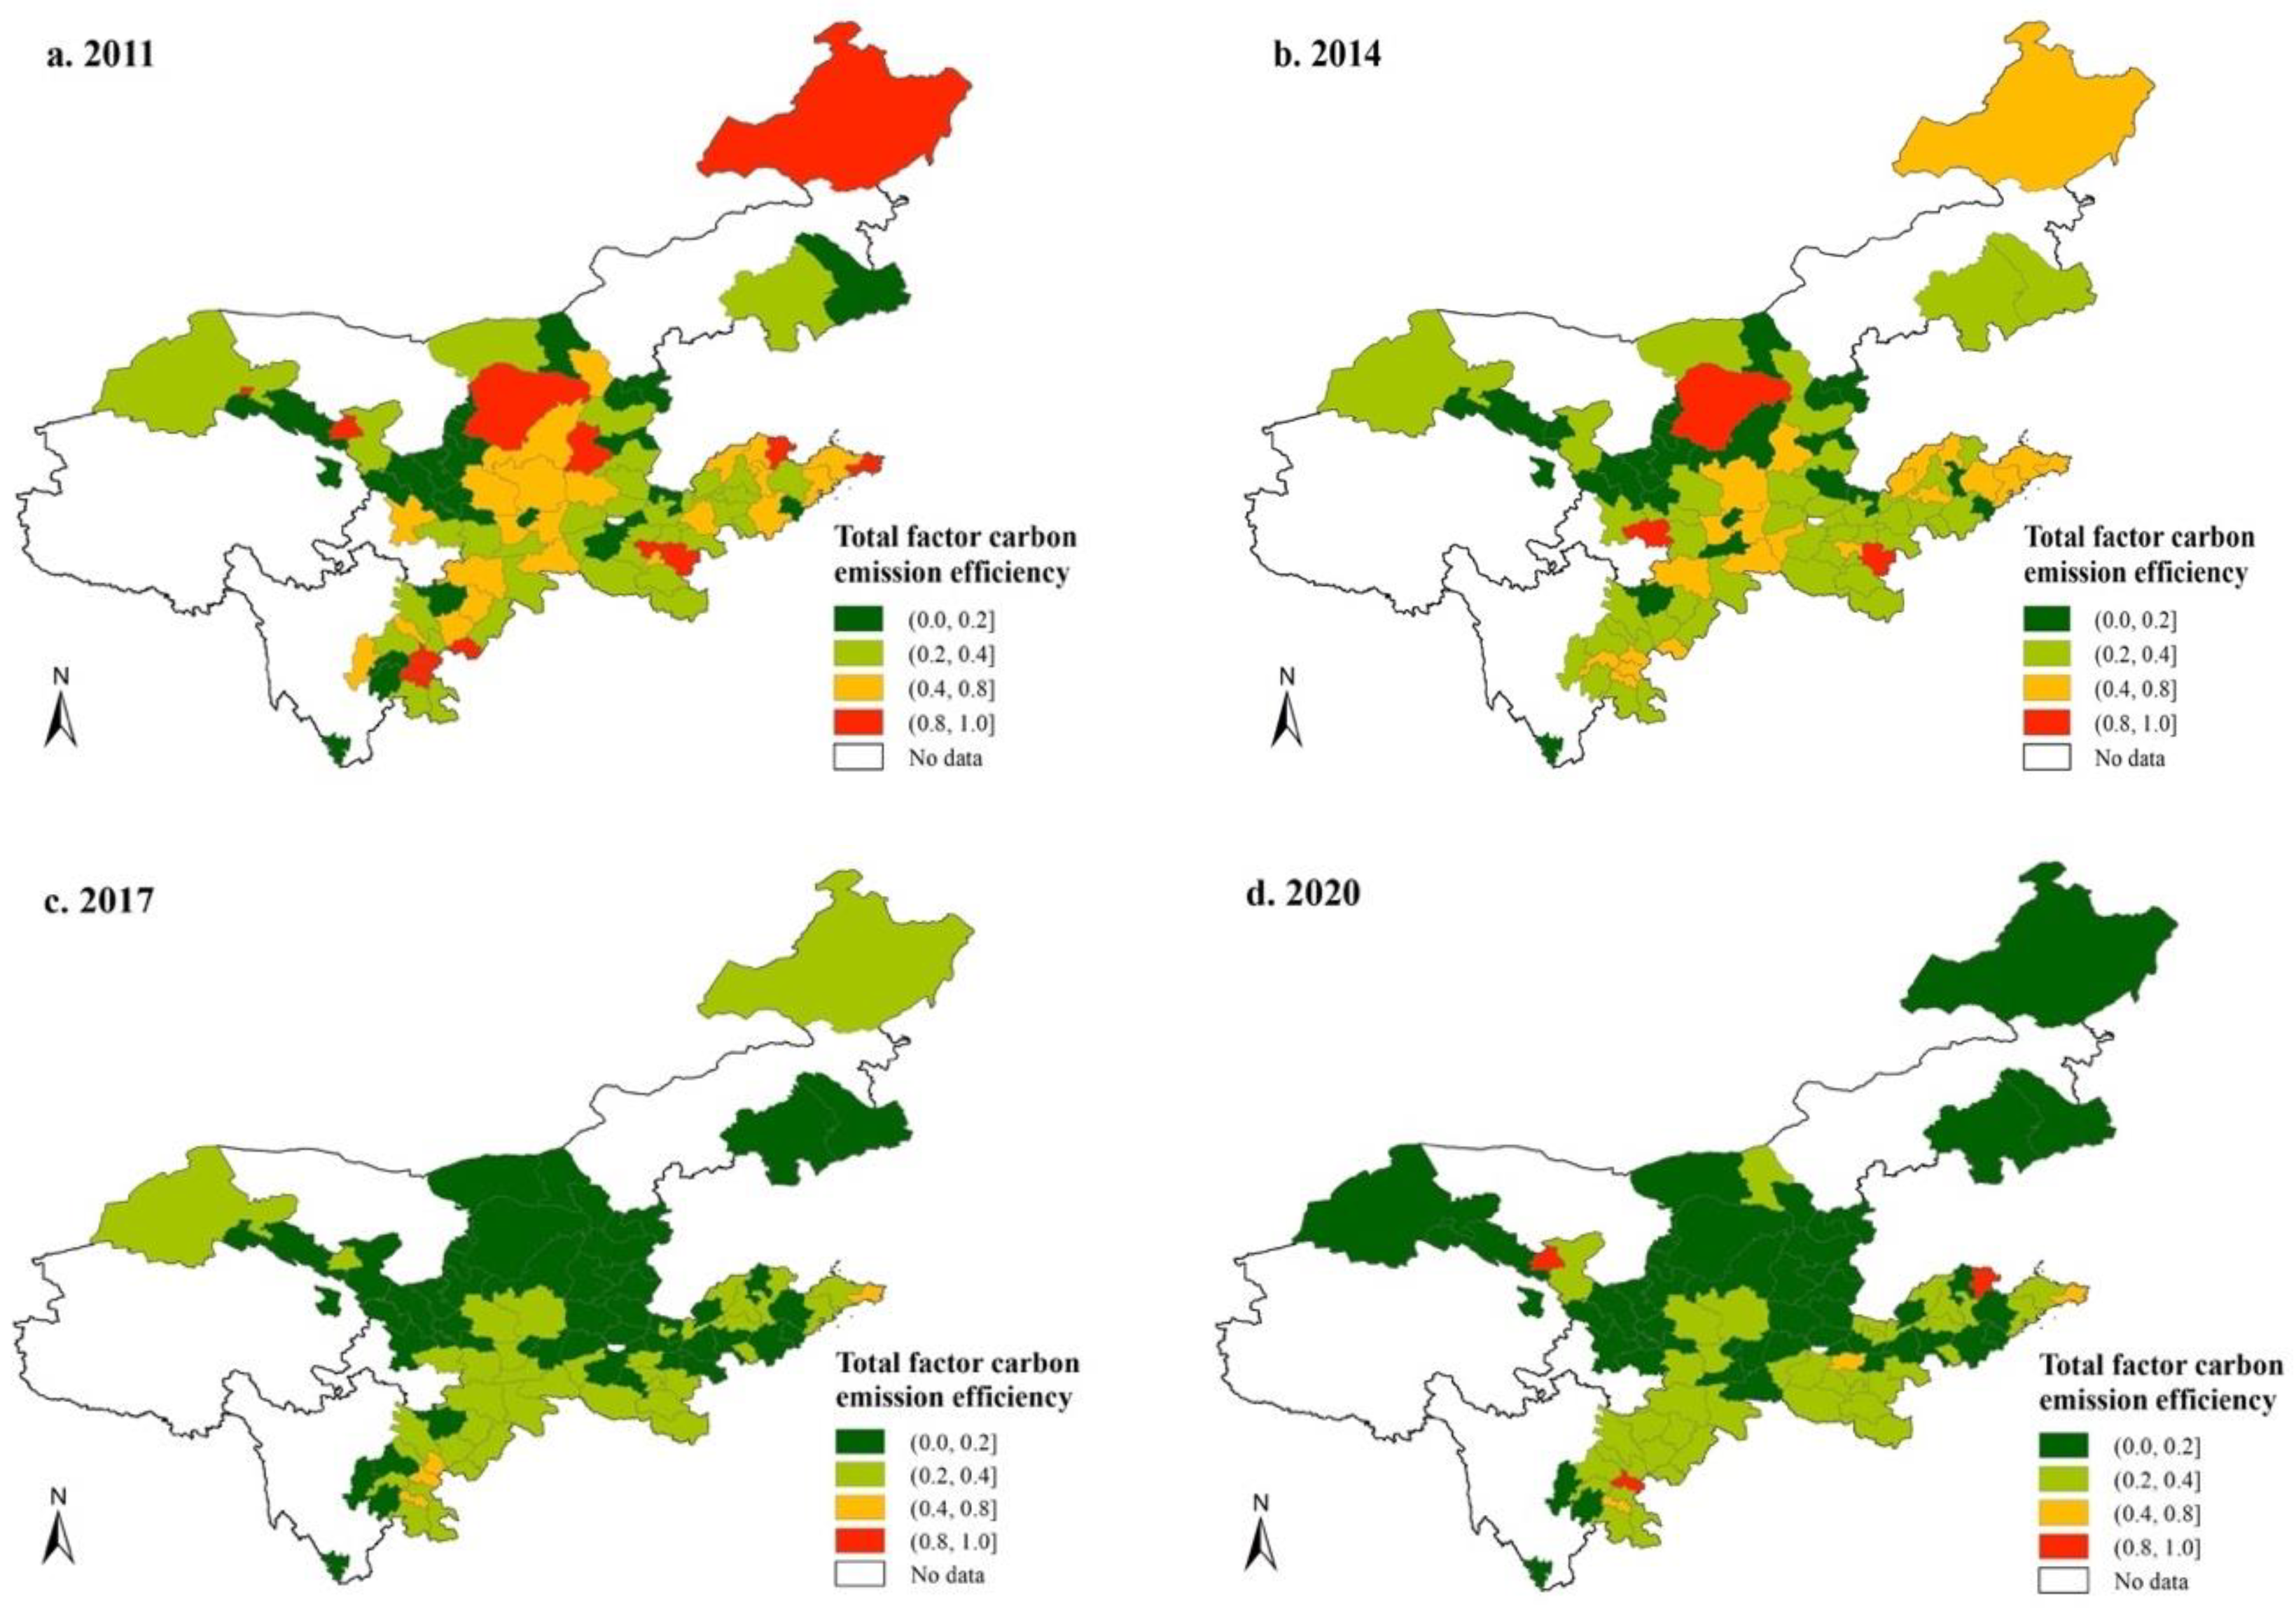
As shown in Figure 3. Overall, the level of digital economy development within the Yellow River Basin exhibited a consistent upward trajectory during 2011–2020, especially from 2017 to 2020. However, there are obvious gaps in the development of the digital economy amongst cities. Specifically, in 2011, the overall level of digital economic development in most cities was low, with a prominent development gap. No city’s digital economic development reached a high level. From 2014 to 2017, the level of digital economic development in various cities increased significantly. The areas exhibiting favorable development trends were mainly concentrated in the economically developed regions located in the middle and lower reaches of the Yellow River.4 By contrast, some cities in the upper reaches showed a lagging trend in digital economy development. By 2020, the digital economy development in each city within the Yellow River Basin had undergone further improvements. The number of cities reaching high-level digital economic development increased. Notably, some middle reaches and upper reaches cities joined the high-level ranks of digital economic development. This may be due to the robust support from both the state and local governments in these areas, which has fostered a conducive environment for digital economy development.
(2)
Temporal and spatial evolution of total-factor carbon emission efficiency
As shown in Figure 4. Overall, the total-factor carbon emission efficiency across the Yellow River Basin has shown a downward trend from 2011 to 2020, especially during 2014–2017. This decline may be attributed to the fact that the regional economic development level improved during this period, accompanied by a rise in population. This naturally led to increased energy and resource utilization. As energy consumption rose, the issue of extensive and inefficient use of energy became severe, resulting in a reduction in total-factor carbon emission efficiency [71].
From a spatial perspective, the carbon emission efficiency of cities within the Yellow River Basin follows a distinctive pattern, with the highest in the lower reaches, the second highest in the middle reaches, and the lowest in the upper reaches. The main reason is that the upper reaches of the Yellow River Basin are dominated by coal consumption, and the primary energy industry accounts for a large proportion. This energy consumption structure inhibits the improvement of total-factor carbon emission efficiency. By contrast, cities in the middle and lower reaches have improved their total-factor carbon emission efficiency due to their natural geographical advantages, strong economic development foundation, and continuous optimization of industrial structure.

5.2. Baseline Regression

Table 4 presents the results of baseline regression analysis, assessing the impact of the digital economy on total-factor carbon emission efficiency. Without controlling for any variables that could potentially influence total-factor carbon emissions efficiency, the estimated coefficient of dige is 0.334, passing the significance test, indicating that the digital economy has had a significantly positive impact on carbon emission efficiency. With control variables included in the regression model, column (2) shows that the estimated coefficient of dige slightly increases, from 0.334 to 0.35—also significantly positive at the 5% level. Therefore, hypothesis H1 is confirmed. Every 1 unit increase in the digital economy development index would lead to an improvement of a 0.35 unit in total-factor carbon emission efficiency in the Yellow River Basin. This finding proves the substantial positive impact of the digital economy on total-factor carbon emission efficiency.

5.3. Robustness Test

To check the robustness of the benchmark regression findings, this study conducted the following robustness tests. First, this paper used the alternative explanatory variable measurement method and adopted principal component analysis to calculate the development level of the digital economy. Second, this paper changes the measurement indicators of the explanatory variables by replacing energy inputs with electricity consumption and keeping other indicators unchanged. Third, to mitigate the influence of potential outliers on the estimation accuracy, variables used in the study are subjected to bilateral truncation at the first percentile and then re-regressed. Last, given that there are delays in the influence of the digital economy on overall carbon emission efficiency, this study applied a one-period lag to the explanatory variables. The corresponding outcomes are presented in Table 5.
All the columns in Table 5 showcase the outcomes of the four robustness tests outlined above. It is noteworthy that the sign of total-factor carbon emission efficiency consistently remains significantly positive regardless of the approaches employed. This implies that the digital economy indeed exerts a statistically significant enhancement on total-factor carbon emission efficiency. These consistent findings reinforce the reliability and robustness of the benchmark regression results.

5.4. Heterogeneity Test

5.4.1. Heterogeneity Test of Urban Locations

The regional heterogeneity in this study was studied by dividing the Yellow River Basin into three regions based on their geographical positions: the upper reaches, middle reaches, and lower reaches. The impact of the digital economy on the total-factor carbon emission efficiency of each region is accordingly examined. Table 6 presents the results.
From the regional perspective, the digital economy exhibits a positive influence on carbon emission efficiency in both the upper and lower reaches of the Yellow River. The influence is statistically significant, passing significance tests at the 10% level for the upper region and the 1% level for the lower region. The upper region has strong support from national policies that promote digital economy development, while the lower region is more economically developed and can leverage advanced technologies such as artificial intelligence, the Internet, blockchain, and cloud computing to become highly integrated into traditional industries. This synergy allows the lower region to give full play to the advantages of the digital economy, make full use of data elements, optimize its industrial structure, and unlock the potentials of the digital economy. As a result, this improves the overall efficiency of total-factor carbon emission reduction [5]. Conversely, Table 6 shows that the digital economy has significantly inhibited the efficiency of total-factor carbon emissions in the middle reaches of the Yellow River. This could be due to the fact that the digital economy in this region is still in its early stages. The development of digital infrastructure in the region is behind, and the level of its integration with other industries remains relatively low. Consequently, there are breakthrough bottlenecks, resulting in a limited impact on carbon emission efficiency. In summary, due to the unbalanced development of the Yellow River Basin, there are differences in the degree of digital economic development in the Yellow River region, resulting in differences in total-factor carbon emission efficiency among regions.

5.4.2. Heterogeneity Tests of Urban Nature

The Yellow River Basin represents a typical ecologically fragile region in China, where the economic development of resource-based and non-resource-based cities varies significantly. Therefore, it can be expected that the impact of the digital economy on total-factor carbon emission efficiency would be different in cities with different attributes. To explore these potential differences, the cities within the Yellow River Basin have been classified into 49 resource-based cities and 48 non-resource-based cities, following the classification standards set by the State Council of China.5 This classification allows for us to examine whether the impact of the digital economy on high-quality economic development differs depending on city attributes.
The outcomes of the heterogeneity test, categorized by city attributes, are presented in Table 7, in which columns (1) and (2) represent the results for resource-based and non-resource-based cities while controlling for time and area effects, respectively. The influence of the digital economy on total-factor carbon emission efficiency is significantly different for resource-based cities and non-resource-based cities. As demonstrated in column (1) of Table 7, the development of the digital economy significantly improves total-factor carbon emission efficiency for resource-based cities. By contrast, the digital economy does not exert a significant promotional effect for non-resource-based cities, as shown by the figures in column (2) for non-resource-based cities. There might be several reasons explaining the differences. Resource-based cities, in contrast to their non-resource-based counterparts, often rely on a single economic path and are characterized by resource dependence. Since China has initiated economic transform for these resource-dependent cities, a great deal of efforts, such as establishing specialized projects for comprehensive resource utilization and fostering alternative industries, developing the digital economy, and optimizing and upgrading industrial structures, have been made, which have promoted economic and social sustainability. Consequently, the efficiency of total-factor carbon emissions has progressively improved [72]. Conversely, non-resource-based cities consume considerable energy, which results in significant carbon emissions due to their advanced economy, substantial population size, and spatial constraints [73]. Therefore, the emission reduction impact of the digital economy has been limited for non-resource-based cities.

5.5. Mediation Effects

The transmission mechanism of the digital economy’s impact on total-factor carbon emission efficiency was hypothesized and discussed from the previous perspective of green technology innovation. In order to verify the hypothesized transmission mechanism, this paper employed a mediation effect model to conduct an empirical analysis of the hypothesis. The results are shown in Table 8. The development level of digital economy exhibits a significant and positive impact on the advancement of green technology innovation, referring to column (2) in Table 8. The digital economy’s capacity to promote green technology innovation, which subsequently leads to an improvement of total-factor carbon emission efficiency, is evident, given the positive coefficients for digital economy development and green technology innovation, referring to column (3) in Table 8. Therefore, the digital economy improves the efficiency of social and economic operations, accelerates the pace of corporate green technology innovation, contributes to the problem-solving of excessive urban carbon emissions, and ultimately helps to achieve the goal of improving the efficiency of total-factor carbon emissions. Accordingly, Hypothesis 2 is confirmed.

5.6. Analysis of Moderated Mediation Effects

A moderated mediated effects model was employed in this study to test the moderated mediation effects of the digital economy on total-factor carbon emission efficiency, following the research conducted by ref. [12]. Table 9 presents the results. The moderation effect of the digital economy on total-factor carbon emission efficiency is demonstrated, this referring to column (1) in Table 9. Looking at column (2), the coefficient of the gov × dige interaction term is significantly negative, with −1.63 at the 1% significance level. This finding suggests that government intervention has a negative moderation effect on the promotion of green technological innovation of the digital economy. This finding confirms Hypothesis 3. The coefficient of the gov × inov interaction term is significantly positive, with 5.66 at the 10% significance level, as shown in column (3). This result suggests that government intervention positively regulates the mediating role of green technological innovation in enhancing total-factor carbon emissions efficiency, thereby affirming Hypothesis 4.

6. Research Conclusions

6.1. Conclusions

Using panel data during 2011–2020 from 97 prefecture-level cities in the Yellow River Basin, this paper conducts a comprehensive assessment of the digital economy development and its impact on total carbon emission efficiency in both spatial and temporal dimensions. We obtained three main conclusions. Firstly, the level of digital economy development in the Yellow River Basin has been on the rise, with many cities having reached a high level of digitalization by the year 2020. Secondly, the digital economy exerts a positive influence on enhancing total-factor carbon emission efficiency, and this conclusion is substantiated through rigorous robustness analyses [74,75]. Thirdly, the impact of the digital economy on total-factor carbon emission efficiency exhibits regional heterogeneity. This impact is notably significant in upstream cities, downstream cities, and resource-based cities within the Yellow River Basin. It is also believed that there is obvious regional heterogeneity in the carbon emission efficiency. Areas with a high level of digital economy development have higher carbon emission efficiency, and digital economy is conducive to promoting energy conservation and pollution reduction in China [76,77].
In addition, employing mediated effect models and moderated mediated effect models, this research empirically investigates the impact of the digital economy on total-factor carbon emission efficiency and unravels its intrinsic mechanisms. We found that the digital economy significantly enhances total-factor carbon emission efficiency through green technological innovation. The mechanism of this impact is subject to government intervention. Specifically, government intervention has a significantly negative moderating effect on the relationship between the digital economy and green technological innovation, while simultaneously exerting a positive regulatory influence on the mediating role of green technological innovation in the relationship between the digital economy and total-factor carbon emission efficiency. The results of previous studies have also shown that the digital economy reduces carbon emission efficiency by reducing energy consumption and upgrading the industrial structure [78,79].

6.2. Recommendations Based on Our Empirical Findings: Proposal of a Few Policy Recommendations

Firstly, local governments could accelerate the development of the digital economy by channeling their efforts into integrating the digital economy with traditional industries in order to promote sustainable economic transformation. The digital economy can not only bring economic benefits but also mitigate climate change and provide a feasible path for China to achieve its dual carbon goals in the next decades. Secondly, green technological progress can reduce carbon emissions from energy utilization and improve total-factor carbon emission efficiency. Local governments not only need to improve their terminal pollution control capabilities but also must leverage the important role of green technology in achieving low-carbon development, strengthen the guidance of green policies, and give full play to the economic benefits of the digital economy. Thirdly, it is recommended that when formulating policies for digital economy development and carbon emission reduction, local governments should consider differentiated strategies addressing the regional disparities within the Yellow River Basin. The geographical heterogeneity in carbon emission efficiency across the Basin necessitates a multifaceted approach and joint efforts among local governments. Lastly, tailored government interventions would be required to guide the integration and optimization of Internet resources, strengthen carbon emission policies, accelerate the establishment of a comprehensive carbon emission restriction system, and increase carbon emission monitoring.

6.3. Research Limitations and Future Recommendations

This study examines the impact and mechanisms of digital economy on carbon emission efficiency yet acknowledges the limitations encountered during the research process, which warrant further investigation in future studies.
Firstly, due to the constraints of the available data, there is a considerable absence of digital economy indicator data prior to 2011. Consequently, the calculation of the digital economy’s development level commences from 2011, thus setting the research’s starting year to 2011. Should big data methods enable the acquisition of digital economy indicators for 2011 in the future, the research timeframe could be extended. Moreover, this paper selected 97 prefecture-level cities within the Yellow River Basin as the research sample. Expanding the geographical scope to include all prefecture-level cities in China could yield additional research findings.
Secondly, future research could delve into the micro-level impact mechanisms of the digital economy on carbon emission efficiency from an enterprise perspective. Enterprises are significant contributors to carbon emissions, and the evolution of the digital economy can influence their technological upgrades and management practices, subsequently affecting carbon emission efficiency. Obtaining enterprise-level indicator data in the future to explore the impact of the digital economy on carbon emission efficiency would be of substantial significance for China’s carbon reduction goals.

Author Contributions

Conceptualization, L.N., S.S. and X.B.; methodology, X.B. and S.S.; software, X.B.; validation, X.B.; formal analysis, X.B.; data curation, X.B.; writing—original draft preparation, L.N. and X.B.; writing—review and editing, L.N., S.S. and Z.W.; visualization, L.N.; supervision, L.N., and Z.W.; project administration, L.N. and Z.W.; funding acquisition, L.N. All authors have read and agreed to the published version of the manuscript.

Funding

This study was supported by the Humanities and Social Science Project of Ministry of Education (Grant No. 22YJAZH124), Program for the Philosophy and Social Sciences Key Research Base of Higher Education Institutions of Shanxi (Grant No. 2022J019), Basic Research Program Project of Shanxi (Grant No.202203021212494), Philosophy and Social Science Planning Project of Shanxi (Grant No. 2022YY099), and General Research Project on Socioeconomic Statistics of Shanxi (Grant No. 2023LY037).

Data Availability Statement

The data presented in this study are available on request.

Conflicts of Interest

The authors declare no conflict of interest.

Notes

1
The information comes from https://www.idf.pku.edu.cn/./zsbz/index.htm (accessed on 21 April 2021).
2
The information comes from https://www.wipo.int/classifications/ipc/green-inventory/home (accessed on 8 January 2024).
3
The information comes from https://www.idf.pku.edu.cn/./zsbz/index.htm (accessed on 21 April 2021).
4
The upper reaches includes Sichuan, Gansu, Qinghai Province and Ningxia Hui Autonomous Region; The middle reaches includes Shanxi Province, Inner Mongolia Autonomous Region and Shaanxi Province; The lower reaches includes Shandong Province and Henan Province.
5
Notice of the State Council on Printing and Distributing the National Plan for Sustainable Development of Resource-based Cities (https://www.gov.cn/zwgk/2013-12/03/content_2540070.htm (accessed on 3 December 2013)).

References

  1. Wang, J.; Luo, X.; Zhu, J. Does the Digital Economy Contribute to Carbon Emissions Reduction? A City-Level Spatial Analysis in China. Chin. J. Popul. Resour. Environ. 2022, 20, 105–114. [Google Scholar] [CrossRef]
  2. Xu, Y.; Liu, S.; Wang, J. Impact of Environmental Regulation Intensity on Green Innovation Efficiency in the Yellow River Basin, China. J. Clean. Prod. 2022, 373, 133789. [Google Scholar] [CrossRef]
  3. Zhang, X.; Liu, K.; Wang, S.; Wu, T.; Li, X.; Wang, J.; Wang, D.; Zhu, H.; Tan, C.; Ji, Y. Spatiotemporal Evolution of Ecological Vulnerability in the Yellow River Basin under Ecological Restoration Initiatives. Ecol. Indic. 2022, 135, 108586. [Google Scholar] [CrossRef]
  4. Wang, H.; Tao, J.; Xu, J.; Li, Z. Positive or Negative Coordination? Spatiotemporal Coupling Analysis between Economic Growth and Carbon Neutrality in the Yellow River Basin. Energy Rep. 2023, 9, 140–153. [Google Scholar] [CrossRef]
  5. Wang, X.; Shen, Y.; Su, C. Spatial—Temporal Evolution and Driving Factors of Carbon Emission Efficiency of Cities in the Yellow River Basin. Energy Rep. 2023, 9, 1065–1070. [Google Scholar] [CrossRef]
  6. Dexeus, C.R. The Deepening Effects of the Digital Revolution. In The Future of Tourism; Springer: Cham, Switzerland, 2019; pp. 43–69. [Google Scholar] [CrossRef]
  7. Li, C.; Lu, Y.; Meng, Y.; Zhao, W. Research on the Nexus between the Digital Economy and Carbon Emissions—Evidence at China’s Province Level. J. Clean. Prod. 2023, 413, 137484. [Google Scholar] [CrossRef]
  8. Pan, W.; Xie, T.; Wang, Z.; Ma, L. Digital Economy: An Innovation Driver for Total Factor Productivity. J. Bus. Res. 2022, 139, 303–311. [Google Scholar] [CrossRef]
  9. Zhang, R.; Wu, K.; Cao, Y.; Sun, H. Digital Inclusive Finance and Consumption-Based Embodied Carbon Emissions: A Dual Perspective of Consumption and Industry Upgrading. J. Environ. Manag. 2023, 325, 116632. [Google Scholar] [CrossRef] [PubMed]
  10. Ming, Y.; Liu, Y.; Sheng, M.S.; Wen, L. Effects of Digital Economy on Carbon Emission Reduction: New Evidence from China. Energy Policy 2022, 171, 113271. [Google Scholar] [CrossRef]
  11. Wu, R.; Hua, X.; Peng, L.; Liao, Y.; Yuan, Y. Nonlinear Effect of Digital Economy on Carbon Emission Intensity—Based on Dynamic Panel Threshold Model. Front. Environ. Sci. 2022, 10, 943177. [Google Scholar] [CrossRef]
  12. Li, Z.; Wang, J. The Dynamic Impact of Digital Economy on Carbon Emission Reduction: Evidence City-Level Empirical Data in China. J. Clean. Prod. 2022, 351, 131570. [Google Scholar] [CrossRef]
  13. Zhu, Z.; Liu, B.; Yu, Z.; Cao, J. Effects of the Digital Economy on Carbon Emissions: Evidence from China. Int. J. Environ. Res. Public Health 2022, 19, 9450. [Google Scholar] [CrossRef] [PubMed]
  14. Yu, Z.; Liu, S.; Zhu, Z. Has the Digital Economy Reduced Carbon Emissions?: Analysis Based on Panel Data of 278 Cities in China. Int. J. Environ. Res. Public Health 2022, 19, 11814. [Google Scholar] [CrossRef] [PubMed]
  15. Sun, W.; Huang, C. How Does Urbanization Affect Carbon Emission Efficiency? Evidence from China. J. Clean. Prod. 2020, 272, 122828. [Google Scholar] [CrossRef]
  16. Cai, B.; Guo, H.; Ma, Z.; Wang, Z.; Dhakal, S.; Cao, L. Benchmarking Carbon Emissions Efficiency in Chinese Cities: A Comparative Study Based on High-Resolution Gridded Data. Appl. Energy 2019, 242, 994–1009. [Google Scholar] [CrossRef]
  17. Xie, Q.; Hu, P.; Jiang, A.; Li, Y. Carbon Emissions Allocation Based on Satisfaction Perspective and Data Envelopment Analysis. Energy Policy 2019, 132, 254–264. [Google Scholar] [CrossRef]
  18. Wang, G.; Deng, X.; Wang, J.; Zhang, F.; Liang, S. Carbon emission efficiency in China: A spatial panel data analysis. China Econ. Rev. 2019, 56, 101313. [Google Scholar] [CrossRef]
  19. Fang, T.; Fang, D.; Yu, B. Carbon Emission Efficiency of Thermal Power Generation in China: Empirical Evidence from the Micro-Perspective of Power Plants. Energy Policy 2022, 165, 112955. [Google Scholar] [CrossRef]
  20. Teng, X.; Liu, F.; Chiu, Y. The Change in Energy and Carbon Emissions Efficiency after Afforestation in China by Applying a Modified Dynamic SBM Model. Energy 2021, 216, 119301. [Google Scholar] [CrossRef]
  21. Cheng, Z.; Li, L.; Liu, J. Industrial Structure, Technical Progress and Carbon Intensity in China’s Provinces. Renew. Sustain. Energy Rev. 2018, 81, 2935–2946. [Google Scholar] [CrossRef]
  22. Zhang, L.; Mu, R.; Zhan, Y.; Yu, J.; Liu, L.; Yu, Y.; Zhang, J. Digital Economy, Energy Efficiency, and Carbon Emissions: Evidence from Provincial Panel Data in China. Sci. Total Environ. 2022, 852, 158403. [Google Scholar] [CrossRef]
  23. Wang, J.; Tian, J.; Kang, Y.; Guo, K. Can Green Finance Development Abate Carbon Emissions: Evidence from China. Int. Rev. Econ. Financ. 2023, 88, 73–91. [Google Scholar] [CrossRef]
  24. Zhang, W.; Li, G.; Uddin, M.K.; Guo, S. Environmental Regulation, Foreign Investment Behavior, and Carbon Emissions for 30 Provinces in China. J. Clean. Prod. 2020, 248, 119208. [Google Scholar] [CrossRef]
  25. Huang, X.; Tian, P. How Does Heterogeneous Environmental Regulation Affect Net Carbon Emissions: Spatial and Threshold Analysis for China. J. Environ. Manag. 2023, 330, 117161. [Google Scholar] [CrossRef]
  26. Tapscott, D. The Digital Economy: Promise and Peril in the Age of Networked Intelligence. Educom Rev. 1996, 31, 52–54. [Google Scholar]
  27. Dong, F.; Hu, M.; Gao, Y.; Liu, Y.; Zhu, J.; Pan, Y. How Does Digital Economy Affect Carbon Emissions? Evidence from Global 60 Countries. Sci. Total Environ. 2022, 852, 158401. [Google Scholar] [CrossRef] [PubMed]
  28. Guo, B.; Wang, Y.; Zhang, H.; Liang, C.; Feng, Y.; Hu, F. Impact of the Digital Economy on High-Quality Urban Economic Development: Evidence from Chinese Cities. Econ. Model. 2023, 120, 106194. [Google Scholar] [CrossRef]
  29. Shi, Y.; Gao, Y.; Luo, Y.; Hu, J. Fusions of Industrialisation and Digitalisation (FID) in the Digital Economy: Industrial System Digitalisation, Digital Technology Industrialisation, and Beyond. J. Digit. Econ. 2022, 1, 73–88. [Google Scholar] [CrossRef]
  30. Li, K.; Kim, D.J.; Lang, K.R.; Kauffman, R.J.; Naldi, M. How Should We Understand the Digital Economy in Asia? Critical Assessment and Research Agenda. Electron. Commer. Res. Appl. 2020, 44, 101004. [Google Scholar] [CrossRef] [PubMed]
  31. Peng, Y.; Tao, C. Can Digital Transformation Promote Enterprise Performance?—From the Perspective of Public Policy and Innovation. J. Innov. Knowl. 2022, 7, 100198. [Google Scholar] [CrossRef]
  32. Li, S.; Gao, L.; Han, C.; Gupta, B.; Alhalabi, W.; Almakdi, S. Exploring the Effect of Digital Transformation on Firms’ Innovation Performance. J. Innov. Knowl. 2023, 8, 100317. [Google Scholar] [CrossRef]
  33. Chen, S.; Ding, D.; Shi, G.; Chen, G. Digital Economy, Industrial Structure, and Carbon Emissions: An Empirical Study Based on a Provincial Panel Data Set from China. Chin. J. Popul. Resour. Environ. 2022, 20, 316–323. [Google Scholar] [CrossRef]
  34. Zhou, X.; Zhou, D.; Wang, Q. How Does Information and Communication Technology Affect China’s Energy Intensity? A Three-Tier Structural Decomposition Analysis. Energy 2018, 151, 748–759. [Google Scholar] [CrossRef]
  35. Zhou, X.; Zhou, D.; Wang, Q.; Su, B. How Information and Communication Technology Drives Carbon Emissions: A Sector-Level Analysis for China. Energy Econ. 2019, 81, 380–392. [Google Scholar] [CrossRef]
  36. Balcerzak, A.P.; Pietrzak, B.M. Digital Economy in Visegrad Countries. Multiple-Criteria Decision Analysis at Regional Level in The Years 2012 and 2015. J. Compet. 2017, 9, 5–18. [Google Scholar] [CrossRef]
  37. Chang, H.; Ding, Q.; Zhao, W.; Hou, N.; Liu, W. The Digital Economy, Industrial Structure Upgrading, and Carbon Emission Intensity—Empirical Evidence from China’s Provinces. Energy Strategy Rev. 2023, 50, 101218. [Google Scholar] [CrossRef]
  38. Lyu, Y.; Wu, Y.; Wu, G.; Wang, W.; Zhang, J. Digitalization and Energy: How Could Digital Economy Eliminate Energy Poverty in China? Environ. Impact Assess. Rev. 2023, 103, 107243. [Google Scholar] [CrossRef]
  39. Rehman, F.U.; Islam, M.M.; Ullah, M.; Khan, S.; Rehman, M.Z. Information Digitalization and Renewable Electricity Generation: Evidence from South Asian Countries. Energy Rep. 2023, 9, 4721–4733. [Google Scholar] [CrossRef]
  40. Lyu, W.; Liu, J. Artificial Intelligence and Emerging Digital Technologies in the Energy Sector. Appl. Energy 2021, 303, 117615. [Google Scholar] [CrossRef]
  41. Chen, P. Is the Digital Economy Driving Clean Energy Development?—New Evidence from 276 Cities in China. J. Clean. Prod. 2022, 372, 133783. [Google Scholar] [CrossRef]
  42. Shahbaz, M.; Wang, J.; Dong, K.; Zhao, J. The Impact of Digital Economy on Energy Transition across the Globe: The Mediating Role of Government Governance. Renew. Sustain. Energy Rev. 2022, 166, 112620. [Google Scholar] [CrossRef]
  43. Zhang, W.; Liu, X.; Wang, D.; Zhou, J. Digital Economy and Carbon Emission Performance: Evidence at China’s City Level. Energy Policy 2022, 165, 112927. [Google Scholar] [CrossRef]
  44. Wu, J.; Lin, K.; Sun, J. Improving Urban Energy Efficiency: What Role Does the Digital Economy Play? J. Clean. Prod. 2023, 418, 138104. [Google Scholar] [CrossRef]
  45. Schöggl, J.-P.; Rusch, M.; Stumpf, L.; Baumgartner, R.J. Implementation of Digital Technologies for a Circular Economy and Sustainability Management in the Manufacturing Sector. Sustain. Prod. Consum. 2023, 35, 401–420. [Google Scholar] [CrossRef]
  46. Zhang, J.; Lyu, Y.; Li, Y.; Geng, Y. Digital Economy: An Innovation Driving Factor for Low-Carbon Development. Environ. Impact Assess. Rev. 2022, 96, 106821. [Google Scholar] [CrossRef]
  47. Dian, J.; Song, T.; Li, S. Facilitating or Inhibiting? Spatial Effects of the Digital Economy Affecting Urban Green Technology Innovation. Energy Econ. 2024, 129, 107223. [Google Scholar] [CrossRef]
  48. Gamidullaeva, L.; Tolstykh, T.; Bystrov, A.; Radaykin, A.; Shmeleva, N. Cross-Sectoral Digital Platform as a Tool for Innovation Ecosystem Development. Sustainability 2021, 13, 11686. [Google Scholar] [CrossRef]
  49. Zhang, M.; Liu, Y. Influence of Digital Finance and Green Technology Innovation on China’s Carbon Emission Efficiency: Empirical Analysis Based on Spatial Metrology. Sci. Total Environ. 2022, 838, 156463. [Google Scholar] [CrossRef] [PubMed]
  50. Li, G.; Li, X.; Huo, L. Digital Economy, Spatial Spillover and Industrial Green Innovation Efficiency: Empirical Evidence from China. Heliyon 2023, 9, e12875. [Google Scholar] [CrossRef]
  51. Xu, L.; Fan, M.; Yang, L.; Shao, S. Heterogeneous Green Innovations and Carbon Emission Performance: Evidence at China’s City Level. Energy Econ. 2021, 99, 105269. [Google Scholar] [CrossRef]
  52. Knowles, S.; Ozanne, A. Government Intervention and Economic Performance in East Asia. Econ. Dev. Cult. Chang. 2003, 51, 451–477. [Google Scholar] [CrossRef]
  53. Que, W.; Zhang, Y.; Schulze, G. Is Public Spending Behavior Important for Chinese Official Promotion? Evidence from City-Level. China Econ. Rev. 2019, 54, 403–417. [Google Scholar] [CrossRef]
  54. Jiang, Z.; Shi, J. Government Intervention and Technological Innovation in the Wind Power Industry in China: The Role of Industrial Environmental Turbulence. Appl. Energy 2023, 344, 121265. [Google Scholar] [CrossRef]
  55. Wu, W.; Hu, Y.; Wu, Q. Subsidies and Tax Incentives—Does It Make a Difference on TFP? Evidences from China’s Photovoltaic and Wind Listed Companies. Renew. Energy 2023, 208, 645–656. [Google Scholar] [CrossRef]
  56. Wang, X.; Su, Z.; Mao, J. How Does Haze Pollution Affect Green Technology Innovation? A Tale of the Government Economic and Environmental Target Constraints. J. Environ. Manag. 2023, 334, 117473. [Google Scholar] [CrossRef] [PubMed]
  57. Marino, M.; Lhuillery, S.; Parrotta, P.; Sala, D. Additionality or Crowding-out? An Overall Evaluation of Public R&D Subsidy on Private R&D Expenditure. Res. Policy 2016, 45, 1715–1730. [Google Scholar] [CrossRef]
  58. Lu, H.; Liu, M.; Song, W. Place-Based Policies, Government Intervention, and Regional Innovation: Evidence from China’s Resource-Exhausted City Program. Resour. Policy 2022, 75, 102438. [Google Scholar] [CrossRef]
  59. Kou, J.; Xu, X. Does Internet Infrastructure Improve or Reduce Carbon Emission Performance?—A Dual Perspective Based on Local Government Intervention and Market Segmentation. J. Clean. Prod. 2022, 379, 134789. [Google Scholar] [CrossRef]
  60. Li, L.; Hang, R.; Qin, L.; Liu, H.; Liu, H.; Hu, F.; Huang, L. Relationship between Stress Response and Depression in Vocational Medical School Students in the COVID-19 Epidemic: A Moderated Mediation Model. Acta Psychol. 2022, 227, 103617. [Google Scholar] [CrossRef]
  61. Zhou, P.; Ang, B.W.; Wang, H. Energy and CO2 Emission Performance in Electricity Generation: A Non-Radial Directional Distance Function Approach. Eur. J. Oper. Res. 2012, 221, 625–635. [Google Scholar] [CrossRef]
  62. Zhang, N.; Choi, Y. A Comparative Study of Dynamic Changes in CO2 Emission Performance of Fossil Fuel Power Plants in China and Korea. Energy Policy 2013, 62, 324–332. [Google Scholar] [CrossRef]
  63. Zhang, N.; Zhou, P.; Choi, Y. Energy Efficiency, CO2 Emission Performance and Technology Gaps in Fossil Fuel Electricity Generation in Korea: A Meta-Frontier Non-Radial Directional Distance Functionanalysis. Energy Policy 2013, 56, 653–662. [Google Scholar] [CrossRef]
  64. Wu, J.; Wu, Y.; Guo, X.; Cheong, T.S. Convergence of Carbon Dioxide Emissions in Chinese Cities: A Continuous Dynamic Distribution Approach. Energy Policy 2016, 91, 207–219. [Google Scholar] [CrossRef]
  65. Jing, S.; Wu, F.; Shi, E.; Wu, X.; Du, M. Does the Digital Economy Promote the Reduction of Urban Carbon Emission Intensity? Int. J. Environ. Res. Public Health 2023, 20, 3680. [Google Scholar] [CrossRef] [PubMed]
  66. Tang, C.; Xu, Y.; Hao, Y.; Wu, H.; Xue, Y. What Is the Role of Telecommunications Infrastructure Construction in Green Technology Innovation? A Firm-Level Analysis for China. Energy Econ. 2021, 103, 105576. [Google Scholar] [CrossRef]
  67. Chen, X.; Zhou, P.; Hu, D. Influences of the Ongoing Digital Transformation of the Chinese Economy on Innovation of Sustainable Green Technologies. Sci. Total Environ. 2023, 875, 162708. [Google Scholar] [CrossRef] [PubMed]
  68. Xiang, Y.; Cui, H.; Bi, Y. The Impact and Channel Effects of Banking Competition and Government Intervention on Carbon Emissions: Evidence from China. Energy Policy 2023, 175, 113476. [Google Scholar] [CrossRef]
  69. Song, M.; Pan, H.; Vardanyan, M.; Shen, Z. Evaluating the Energy Efficiency-Enhancing Potential of the Digital Economy: Evidence from China. J. Environ. Manag. 2023, 344, 118408. [Google Scholar] [CrossRef]
  70. Zhang, S.; Li, Z.; Ning, X.; Li, L. Gauging the Impacts of Urbanization on CO2 Emissions from the Construction Industry: Evidence from China. J. Environ. Manag. 2021, 288, 112440. [Google Scholar] [CrossRef]
  71. Özbuğday, F.C.; Erbas, B.C. How Effective Are Energy Efficiency and Renewable Energy in Curbing CO2 Emissions in the Long Run? A Heterogeneous Panel Data Analysis. Energy 2015, 82, 734–745. [Google Scholar] [CrossRef]
  72. Pan, M.; Zhao, X.; Lv, K.; Rosak-Szyrocka, J.; Mentel, G.; Truskolaski, T. Internet Development and Carbon Emission-Reduction in the Era of Digitalization: Where Will Resource-Based Cities Go? Resour. Policy 2023, 81, 103345. [Google Scholar] [CrossRef]
  73. Xu, Y.; Cheng, Y.; Zheng, R.; Wang, Y. Spatiotemporal Evolution and Influencing Factors of Carbon Emission Efficiency in the Yellow River Basin of China: Comparative Analysis of Resource and Non-Resource-Based Cities. Int. J. Environ. Res. Public Health 2022, 19, 11625. [Google Scholar] [CrossRef] [PubMed]
  74. Han, J.; Jiang, T. Does the Development of the Digital Economy Improve Carbon Emission Efficiency? Front. Ecol. Evol. 2022, 10, 1031722. [Google Scholar] [CrossRef]
  75. Lyu, K.; Yang, S.; Zheng, K.; Zhang, Y. How Does the Digital Economy Affect Carbon Emission Efficiency? Evidence from Energy Consumption and Industrial Value Chain. Energies 2023, 16, 761. [Google Scholar] [CrossRef]
  76. Liu, L.; Zhang, Y.; Gong, X.; Li, M.; Li, X.; Ren, D.; Jiang, P. Impact of Digital Economy Development on Carbon Emission Efficiency: A Spatial Econometric Analysis Based on Chinese Provinces and Cities. Int. J. Environ. Res. Public Health 2022, 19, 14838. [Google Scholar] [CrossRef]
  77. Xie, N.-Y.; Zhang, Y. The Impact of Digital Economy on Industrial Carbon Emission Efficiency: Evidence from Chinese Provincial Data. Math. Probl. Eng. 2022, 2022, e6583809. [Google Scholar] [CrossRef]
  78. Li, Y.; Yang, X.; Ran, Q.; Wu, H.; Irfan, M.; Ahmad, M. Energy Structure, Digital Economy, and Carbon Emissions: Evidence from China. Environ. Sci. Pollut. Res. 2021, 28, 64606–64629. [Google Scholar] [CrossRef]
  79. Peng, H.; Lu, Y.; Wang, Q. How Does Heterogeneous Industrial Agglomeration Affect the Total Factor Energy Efficiency of China’s Digital Economy. Energy 2023, 268, 126654. [Google Scholar] [CrossRef]
Figure 1. Theoretical framework of this study.
Systems 12 00099 g001
Figure 2. Empirical research design.
Systems 12 00099 g002
Figure 3. Spatial distribution of digital economy development level in the Yellow River Basin.
Systems 12 00099 g003aSystems 12 00099 g003b
Figure 4. Spatial distribution of total-factor carbon emission efficiency in the Yellow River Basin.
Systems 12 00099 g004
Table 1. Description of total-factor carbon emission efficiency indicators.
First-Grade IndexSecond-Grade IndexThird-Grade IndexDescription of Indicators
Total-factor carbon efficiencyInput indicatorsLaborNumber of employees by the end of the year in the city (10,000 people)
CapitalFixed capital stock (10,000 yuan)
EnergyEnergy consumption (10,000 tons)
Output indicatorsExpected outputsGDP (10,000 yuan)
Non-expected outputsCarbon dioxide (10,000 tons)
Table 2. Digital economy indicator system.
Target LevelStandardized LayerIndicator LayerDescription of IndicatorsUnit
Digital economyInternet developmentInternet penetrationNumber of Internet broadband access subscribers per 100 peopleHousehold
Relevant practitionersShare of employees in computer services and software industry in urban units--
Status of related outputsTotal telecommunication services per capitaYuan
Cell phone penetration rateNumber of cell phone subscribers per 100 peopleHousehold
Digital Financial InclusionDigital Inclusive Finance IndexDigital Inclusive Finance Index--
Table 3. Descriptive statistics of variables.
Variables NameSymbolUnitObsMeanSdMinMax
Total-factor carbon efficiencytcpi--9700.2980.2000.0291
Digital Economy Indexdige--9700.1110.0620.0180.412
Size of populationlnpeo10,000 people9705.7810.7093.1487.647
Industrial structureindustry--9700.9170.4870.2044.107
Employment densityED10,000 people/square kilometer9700.0050.0065.29 × 10−40.048
Environmental regulationER--9700.5750.0930.2730.813
Green technology innovationinov10,000 patents9700.0430.1110.1 × 10−31.203
Government interventiongov-9700.2100.1190.0670.916
Table 4. Baseline regression results.
Variables(1)
tcpi
(2)
tcpi
dige0.334 **
(0.140)
0.350 **
(0.142)
lnpeo 0.150 *
(0.084)
industry −0.004
(0.021
ED −0.132 ***
(0.032)
ER 0.037
(0.083)
Constant0.368
(0.496)
−0.553
(0.496)
City FEYESYES
Year FEYESYES
R20.2530.257
Observations970970
Note: *** p < 0.01, ** p < 0.05, * p < 0.1, and standard errors in parentheses.
Table 5. Robustness estimation results.
(1)(2)(3)(4)
VariablesReplaced the Explanatory
Variable
Replaced the Explained
Variable
Bilateral IndentationLagged Effects
Estimation
dige0.787 ***0.285 **0.386 ***0.256 *
(0.244)(0.137)(0.152)(0.155)
Constant0.897−0.321−0.649−0.377
(0.768)(0.480)(0.520)(0.470)
ControlYESYESYESYES
City FEYESYESYESYES
Year FEYESYESYESYES
Observations970970970873
R-squared0.2200.2590.2580.256
Note: *** p < 0.01, ** p < 0.05, * p < 0.1, and standard errors in parentheses.
Table 6. Analysis of regional heterogeneity.
Variables(1)
Upper Region
(2)
Middle Region
(3)
Lower Region
dige0.715 ***−0.522 *0.599 **
(0.244)(0.286)(0.234)
Constant−1.935 ***0.416−4.186 **
(0.735)(0.530)(1.840)
ControlYESYESYES
City FEYESYESYES
Year FEYESYESYES
Observations350290330
R-squared0.2290.3760.295
Note: *** p < 0.01, ** p < 0.05, * p < 0.1, and standard errors in parentheses.
Table 7. Heterogeneity test of urban nature.
Variables(1) Resource-Based Cities(2) Non-Resource-Based Cities
dige0.657 ***0.100
(0.224)(0.181)
Constant−0.6390.416
(0.793)(0.530)
ControlYESYES
City FEYESYES
Year FEYESYES
Observations490480
R-squared0.2560.305
Note: *** p < 0.01, and standard errors in parentheses.
Table 8. Mediation model regression tests.
Variables(1)
tcpi
(2)
inov
(3)
tcpi
dige0.350 **0.199 ***0.320 **
(0.142)(0.057)(0.143)
inov 0.152 *
(0.085)
Constant−0.553−0.732 ***−0.442
(0.496)(0.198)(0.500)
ControlYESYESYES
City FEYESYESYES
Year FEYESYESYES
Observations970970970
R-squared0.2570.3040.260
Note: *** p < 0.01, ** p < 0.05, * p < 0.1, and standard errors in parentheses.
Table 9. Regression results of the mediation model with moderation.
Variables(1)(2)(3)
tcpiinovtcpi
dige0.293 **0.172 ***0.248 *
(0.142)(0.057)(0.143)
gov−0.417 ***−0.030−0.230
(0.139)(0.055)(0.169)
inov 0.535 **
(0.232)
gov   × dige−2.455 **−1.630 ***−2.431 **
(1.132)(0.451)(1.143)
gov   × inov 5.660 *
(3.001)
Constant−0.301−0.680 ***−0.220
(0.498)(0.199)(0.501)
ControlYESYESYES
City FEYESYESYES
Year FEYESYESYES
Observations970970970
R-squared0.2680.3140.273
Note: *** p < 0.01, ** p < 0.05, * p < 0.1, and standard errors in parentheses.
Disclaimer/Publisher’s Note: The statements, opinions and data contained in all publications are solely those of the individual author(s) and contributor(s) and not of MDPI and/or the editor(s). MDPI and/or the editor(s) disclaim responsibility for any injury to people or property resulting from any ideas, methods, instructions or products referred to in the content.

