
Data Science Supporting Lean Production: Evidence from Manufacturing Companies
Abstract
:1. Introduction
- RQ1:
- Which DS techniques and tools support LP practices in manufacturing companies?
- RQ2:
- How do DS techniques and tools support LP practices in manufacturing companies?
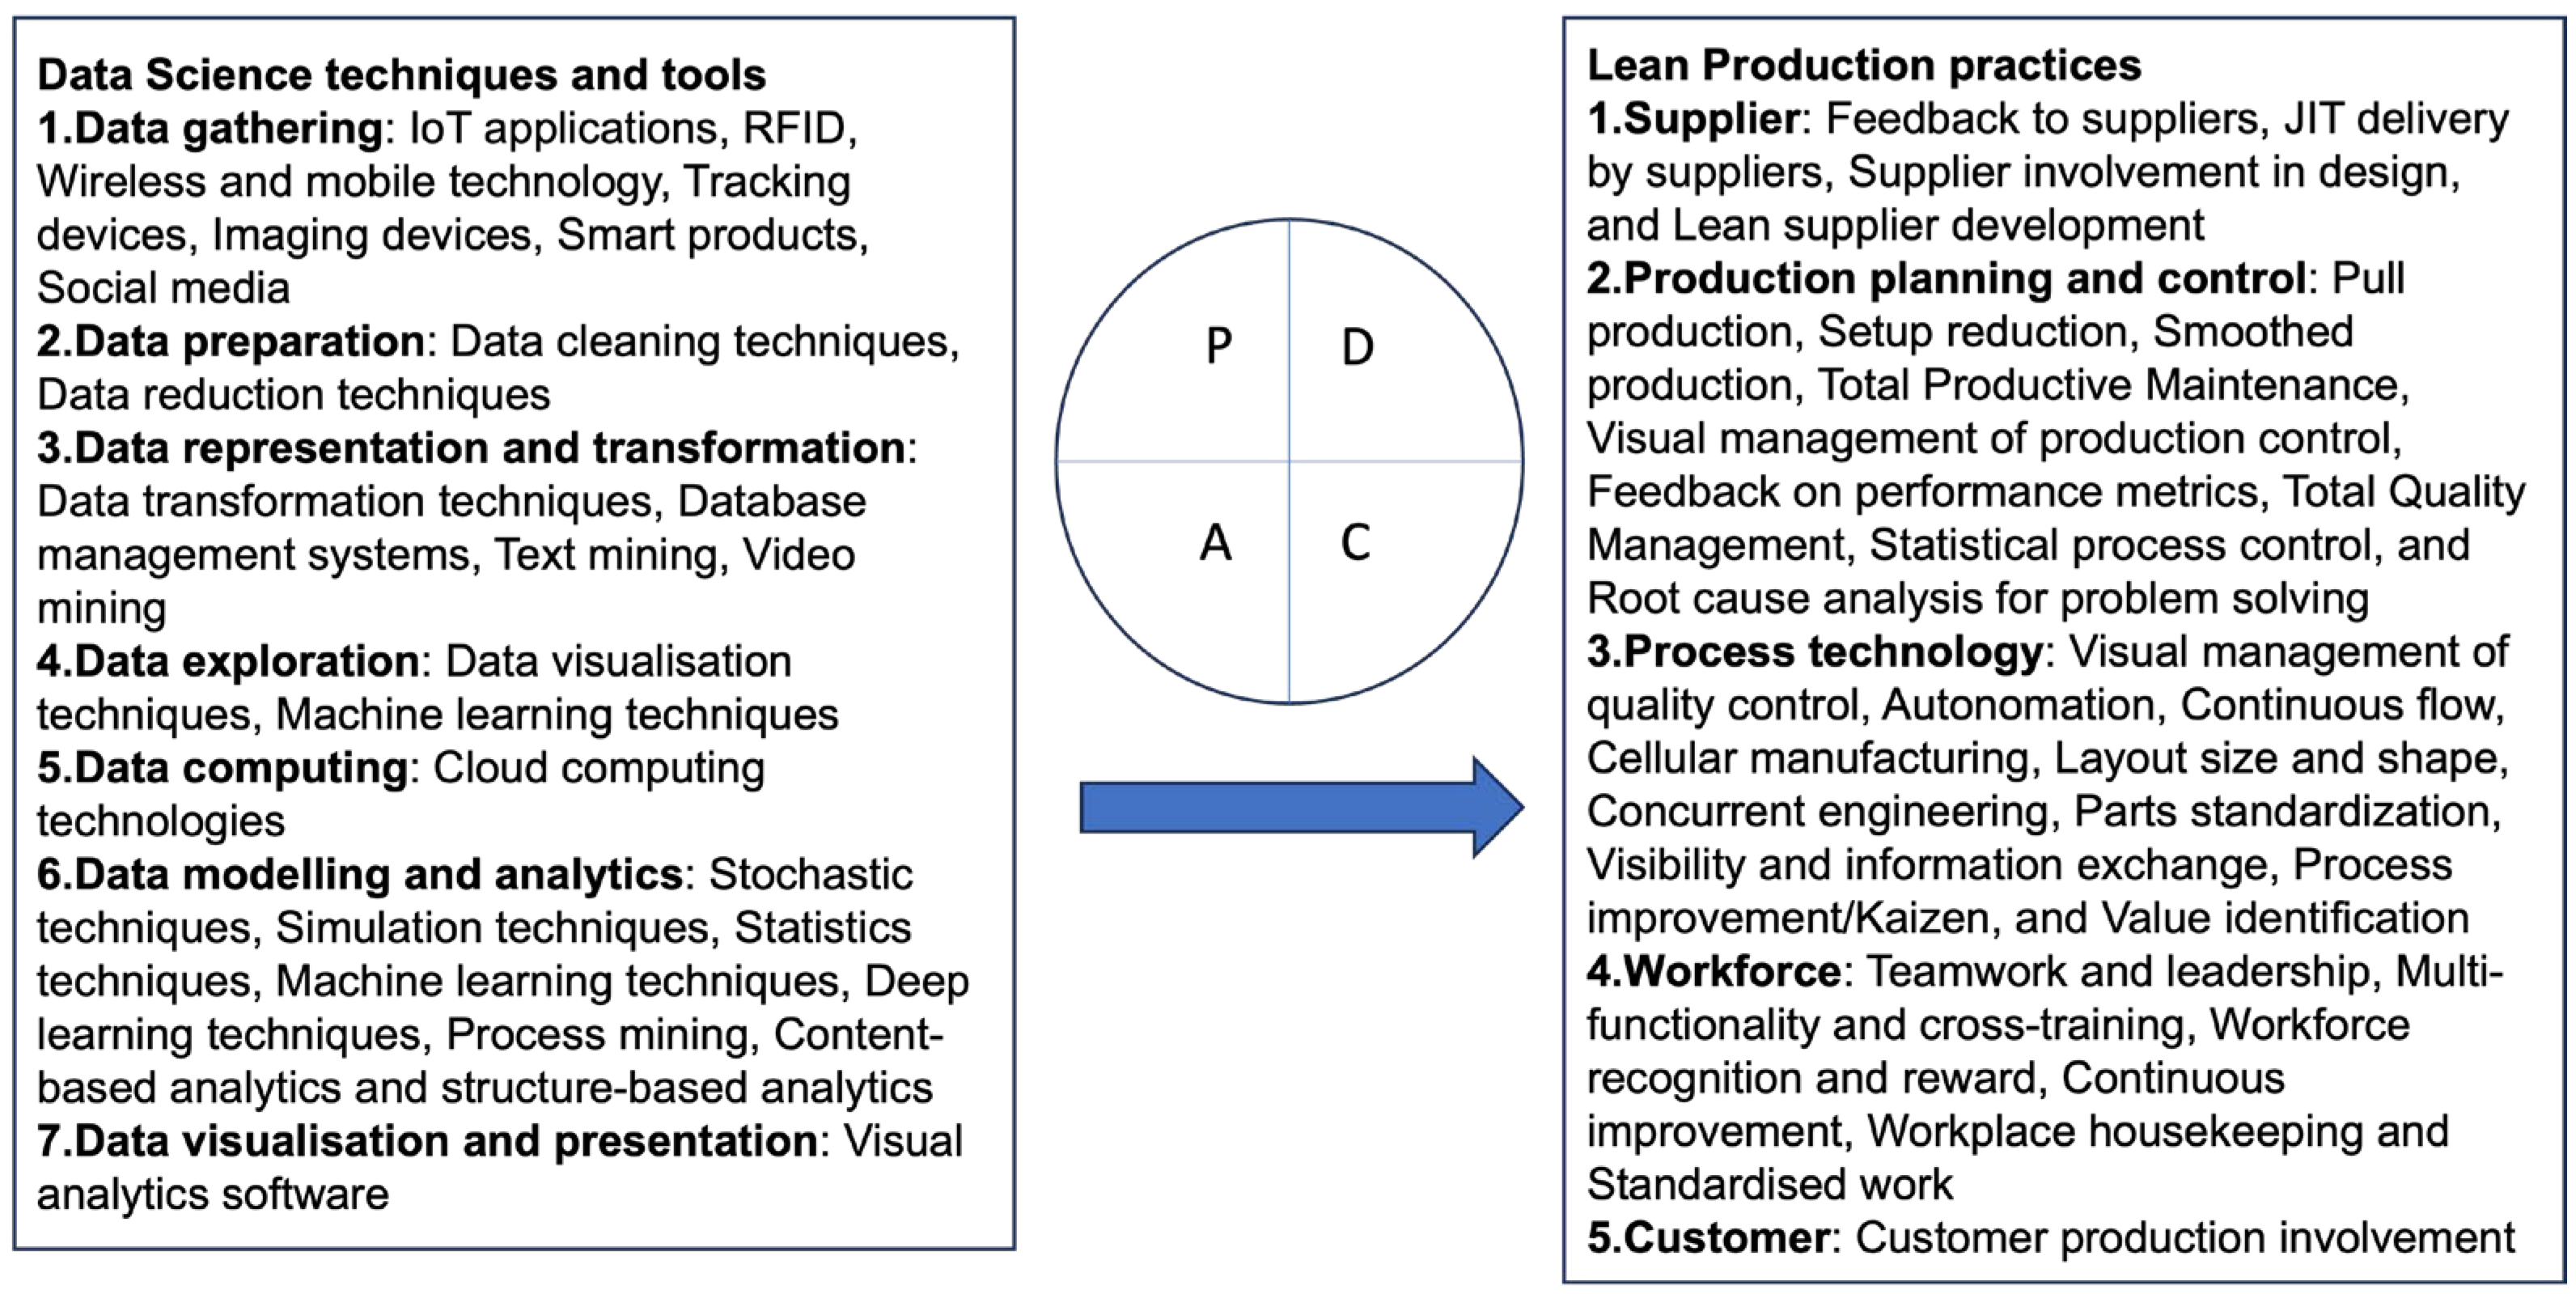
2. Background
3. Materials and Methods
4. Results
4.1. DS Techniques and Tools Supporting TPM
4.2. DS Techniques and Tools Supporting Visual Management of Production Control
4.3. DS Techniques and Tools Supporting Feedback on Performance Metrics
4.4. DS Techniques and Tools Supporting TQM
4.5. DS Techniques and Tools Supporting Statistical Process Control
4.6. DS Techniques and Tools Supporting Root Cause Analysis for Problem-Solving
4.7. DS Techniques and Tools Supporting Visual Management of Quality Control
4.8. DS Techniques and Tools Supporting Process Improvement/Kaizen
5. Discussion
6. Conclusions
Author Contributions
Funding
Data Availability Statement
Conflicts of Interest
References
- Womack, J.P.; Jones, D.T. Beyond Toyota: How to root out waste and pursue perfection. Harv. Bus. Rev. 1996, 74, 140–151. [Google Scholar]
- Peças, P.; Encarnação, J.; Gambôa, M.; Sampayo, M.; Jorge, D. Pdca 4.0: A new conceptual approach for continuous improvement in the industry 4.0 paradigm. Appl. Sci. 2021, 11, 7671. [Google Scholar] [CrossRef]
- Basulo-Ribeiro, J.; Amorim, M.; Teixeira, L. How to accelerate digital transformation in companies with Lean Philosophy? Contributions based on a practical case. Int. J. Ind. Eng. Manag. 2023, 14, 94–104. [Google Scholar] [CrossRef]
- Naciri, L.; Mouhib, Z.; Gallab, M.; Nali, M.; Abbou, R.; Kebe, A. Lean and industry 4.0: A leading harmony. Procedia Comput. Sci. 2022, 200, 394–406. [Google Scholar] [CrossRef]
- Xu, L.D.; Xu, E.L.; Li, L. Industry 4.0: State of the art and future trends. Int. J. Prod. Res. 2018, 56, 2941–2962. [Google Scholar] [CrossRef]
- Klingenberg, C.O.; Borges, M.A.V.; Antunes, J.A.V. Industry 4.0 as a data-driven paradigm: A systematic literature review on technologies. J. Manuf. Technol. Manag. 2021, 32, 570–592. [Google Scholar] [CrossRef]
- Ivanov, D.; Tang, C.S.; Dolgui, A.; Battini, D.; Das, A. Researchers’ perspectives on Industry 4.0: Multi-disciplinary analysis and opportunities for operations management. Int. J. Prod. Res. 2021, 59, 2055–2078. [Google Scholar] [CrossRef]
- Abd Rahman, M.S.B.; Mohamad, E.; Abdul Rahman, A.A. Bin Development of IoT—Enabled data analytics enhance decision support system for lean manufacturing process improvement. Concurr. Eng. 2021, 29, 208–220. [Google Scholar] [CrossRef]
- Valamede, L.S.; Akkari, A.C.S. Lean 4.0: A new holistic approach for the integration of lean manufacturing tools and digital technologies. Int. J. Math. Eng. Manag. Sci. 2020, 5, 851–868. [Google Scholar] [CrossRef]
- Tortorella, G.; Sawhney, R.; Jurburg, D.; de Paula, I.C.; Tlapa, D.; Thurer, M. Towards the proposition of a lean automation framework: Integrating industry 4.0 into lean production. J. Manuf. Technol. Manag. 2020, 32, 593–620. [Google Scholar] [CrossRef]
- Anosike, A.; Alafropatis, K.; Garza-Reyes, J.A.; Kumar, A.; Luthra, S.; Rocha-Lona, L. Lean manufacturing and internet of things—A synergetic or antagonist relationship? Comput. Ind. 2021, 129, 103464. [Google Scholar] [CrossRef]
- Agostini, L.; Filippini, R. Organizational and managerial challenges in the path toward Industry 4.0. Eur. J. Innov. Manag. 2019, 22, 406–421. [Google Scholar] [CrossRef]
- Bittencourt, V.L.; Alves, A.C.; Leão, C.P. Industry 4.0 triggered by Lean Thinking: Insights from a systematic literature review. Int. J. Prod. Res. 2021, 59, 1496–1510. [Google Scholar] [CrossRef]
- Ojha, R. Lean in industry 4.0 is accelerating manufacturing excellence—A DEMATEL analysis. TQM J. 2023, 35, 597–614. [Google Scholar] [CrossRef]
- Cifone, F.D.; Hoberg, K.; Holweg, M.; Staudacher, A.P. ‘Lean 4.0’: How can digital technologies support lean practices? Int. J. Prod. Econ. 2021, 241, 108258. [Google Scholar] [CrossRef]
- Pozzi, R.; Cannas, V.G.; Ciano, M.P. Linking data science to lean production: A model to support lean practices. Int. J. Prod. Res. 2021, 60, 6866–6887. [Google Scholar] [CrossRef]
- Komkowski, T.; Antony, J.; Garza-Reyes, J.A.; Tortorella, G.L.; Pongboonchai-Empl, T. The integration of Industry 4.0 and Lean Management: A systematic review and constituting elements perspective. Total Qual. Manag. Bus. Excell. 2022, 34, 1052–1069. [Google Scholar] [CrossRef]
- Buer, S.-V.; Strandhagen, J.O.; Chan, F.T.S. The link between Industry 4.0 and lean manufacturing: Mapping current research and establishing a research agenda. Int. J. Prod. Res. 2018, 56, 2924–2940. [Google Scholar] [CrossRef]
- Rosin, F.; Forget, P.; Lamouri, S.; Pellerin, R. Impacts of Industry 4.0 technologies on Lean principles. Int. J. Prod. Res. 2020, 58, 1644–1661. [Google Scholar] [CrossRef]
- Buer, S.V.; Semini, M.; Strandhagen, J.O.; Sgarbossa, F. The complementary effect of lean manufacturing and digitalisation on operational performance. Int. J. Prod. Res. 2021, 59, 1976–1992. [Google Scholar] [CrossRef]
- Voss, C.; Tsikriktsis, N.; Frohlich, M. Case research in operations management. Int. J. Oper. Prod. Manag. 2002, 22, 195–219. [Google Scholar] [CrossRef]
- Bai, C.; Satir, A.; Sarkis, J. Investing in lean manufacturing practices: An environmental and operational perspective. Int. J. Prod. Res. 2019, 57, 1037–1051. [Google Scholar] [CrossRef]
- Watson, G.H.; DeYong, C.F. Design for six sigma: Caveat emptor. Int. J. Lean Six Sigma 2010, 1, 66–84. [Google Scholar] [CrossRef]
- Yuik, C.J.; Puvanasvaran, P. Development of Lean Manufacturing Implementation Framework in Machinery and Equipment SMEs. Int. J. Ind. Eng. Manag. 2020, 11, 157–169. [Google Scholar] [CrossRef]
- Eisenhardt, K.M.; Graebner, M.E. Theory Building from Cases: Opportunities and Challenges Linked references are available on JSTOR for this article: Theory Building from Cases: Opportunities and Challenges. Acad. Manag. J. 2007, 50, 25–32. [Google Scholar] [CrossRef]
- Yin, R.K. Case study Research and Applications; Des. Methods; Sage Publication, Inc.: Los Angeles, CA, USA, 2018. [Google Scholar]
- Classification Ateco (Classification of Economic Activity). 2007. Available online: https://www.istat.it/en/archivio/17959 (accessed on 7 March 2024).
- Aida Analisi Informatizzata Delle Aziende Italiane. Available online: https://login.bvdinfo.com/R0/AidaNeo (accessed on 7 March 2024).
- What Is an SME? Available online: https://web.archive.org/web/20150208090338/http:/ec.europa.eu/enterprise/policies/sme/facts-figures-analysis/sme-definition/index_en.htm (accessed on 7 March 2024).
- Hays, P.A. Case study research. In Foundations for Research: Methods of Inquiry in Education and the Social Sciences; de Marrais, K., Lapan, S.D., Eds.; Lawrence Erlbaum Associates, Inc.: Mahwah, NJ, USA, 2004; pp. 217–234. [Google Scholar]
- Cheng, Y.; Chen, K.; Sun, H.; Zhang, Y.; Tao, F. Data and knowledge mining with big data towards smart production. J. Ind. Inf. Integr. 2018, 9, 1–13. [Google Scholar] [CrossRef]
- Boyer, K.K.K.; McDermott, C. Strategic consensus in operations strategy. J. Oper. Manag. 1999, 17, 289–305. [Google Scholar] [CrossRef]
- Voss, C.; Johnson, M.; Godsell, J. 5 Case research. In Research Methods for Operations Management; Routledge: London, UK, 2016; Volume 165. [Google Scholar]
- Stojanovic, L.; Dinic, M.; Stojanovic, N.; Stojadinovic, A. Big-data-driven anomaly detection in industry (4.0): An approach and a case study. In Proceedings of the 2016 IEEE International Conference on Big Data (Big Data), Washington, DC, USA, 5–8 December 2016; pp. 1647–1652. [Google Scholar] [CrossRef]
- Shahin, M.; Chen, F.F.; Bouzary, H.; Krishnaiyer, K. Integration of Lean Practices and Industry 4.0 Tech- nologies: Smart Manufacturing for Next-Generation Enter-prises. Int. J. Adv. Manuf. Technol. 2020, 107, 2927–2936. [Google Scholar] [CrossRef]


| Case | Industry | Number of Employees | Turnover (M€) | Size | Number of Informants | Job Position |
|---|---|---|---|---|---|---|
| A | Medicines and other pharmaceutical preparations | 250 | 200 | Large | 2 |
|
| B | Rubber component | 270 | 80 | Large | 3 |
|
| C | Electrical equipment | 36 | 10 | Small | 2 |
|
| D | Electric motors | 40 | 10 | Small | 2 |
|
| E | Sun lenses | 180 | 30 | Medium | 1 |
|
| F | Electrical equipment | 240 | 40 | Medium | 2 |
|
| Source 1: Face-to-Face Interview | |
| General information | Companies’ approximate turnover, employees, industrial sector, competitive environment, interviewee/s role |
| Lean production practices | Regarding each lean production bundle (supplier, production planning and control, process technology, workforce, customer), what are the practices adopted by the company? |
| Data science tools and techniques | Regarding the seven data science activities (data gathering, data preparation, data representation and transformation, data exploration, data computing, data modelling and analytics, data visualisation, and presentation), what are the tools and techniques applied by the company? |
| Data science and lean production |
|
| Source 2: Direct observations | |
| Plant tour | Direct observation of the production department during work shifts with the possibility of observing manufacturing and/or assembly activities and asking the employees and/or managers additional questions related to the processes, lean production practices applied, and data science techniques and tools implemented. |
| Source 3a: Official documents | |
| Company’s website | Company information (history, strategy, mission, success factors, and others) and product information (product types, product features, technical data, applications, and others). |
| News and press | Up-to-date information related to recent business initiatives, new product launches, and new technology introductions. |
| National database | 10 years of history-related information on Italian companies (balance sheet, number of employees, sector, and others). |
| Source 3b: Internal documents | |
| Documents (digital or paper) | Procedures, budgets, product catalogues, etc. |
| Tools | Data science tools are applied for data gathering, preparation, representation and transformation, exploration, computing, modelling and analytics, visualisation, and presentation. |
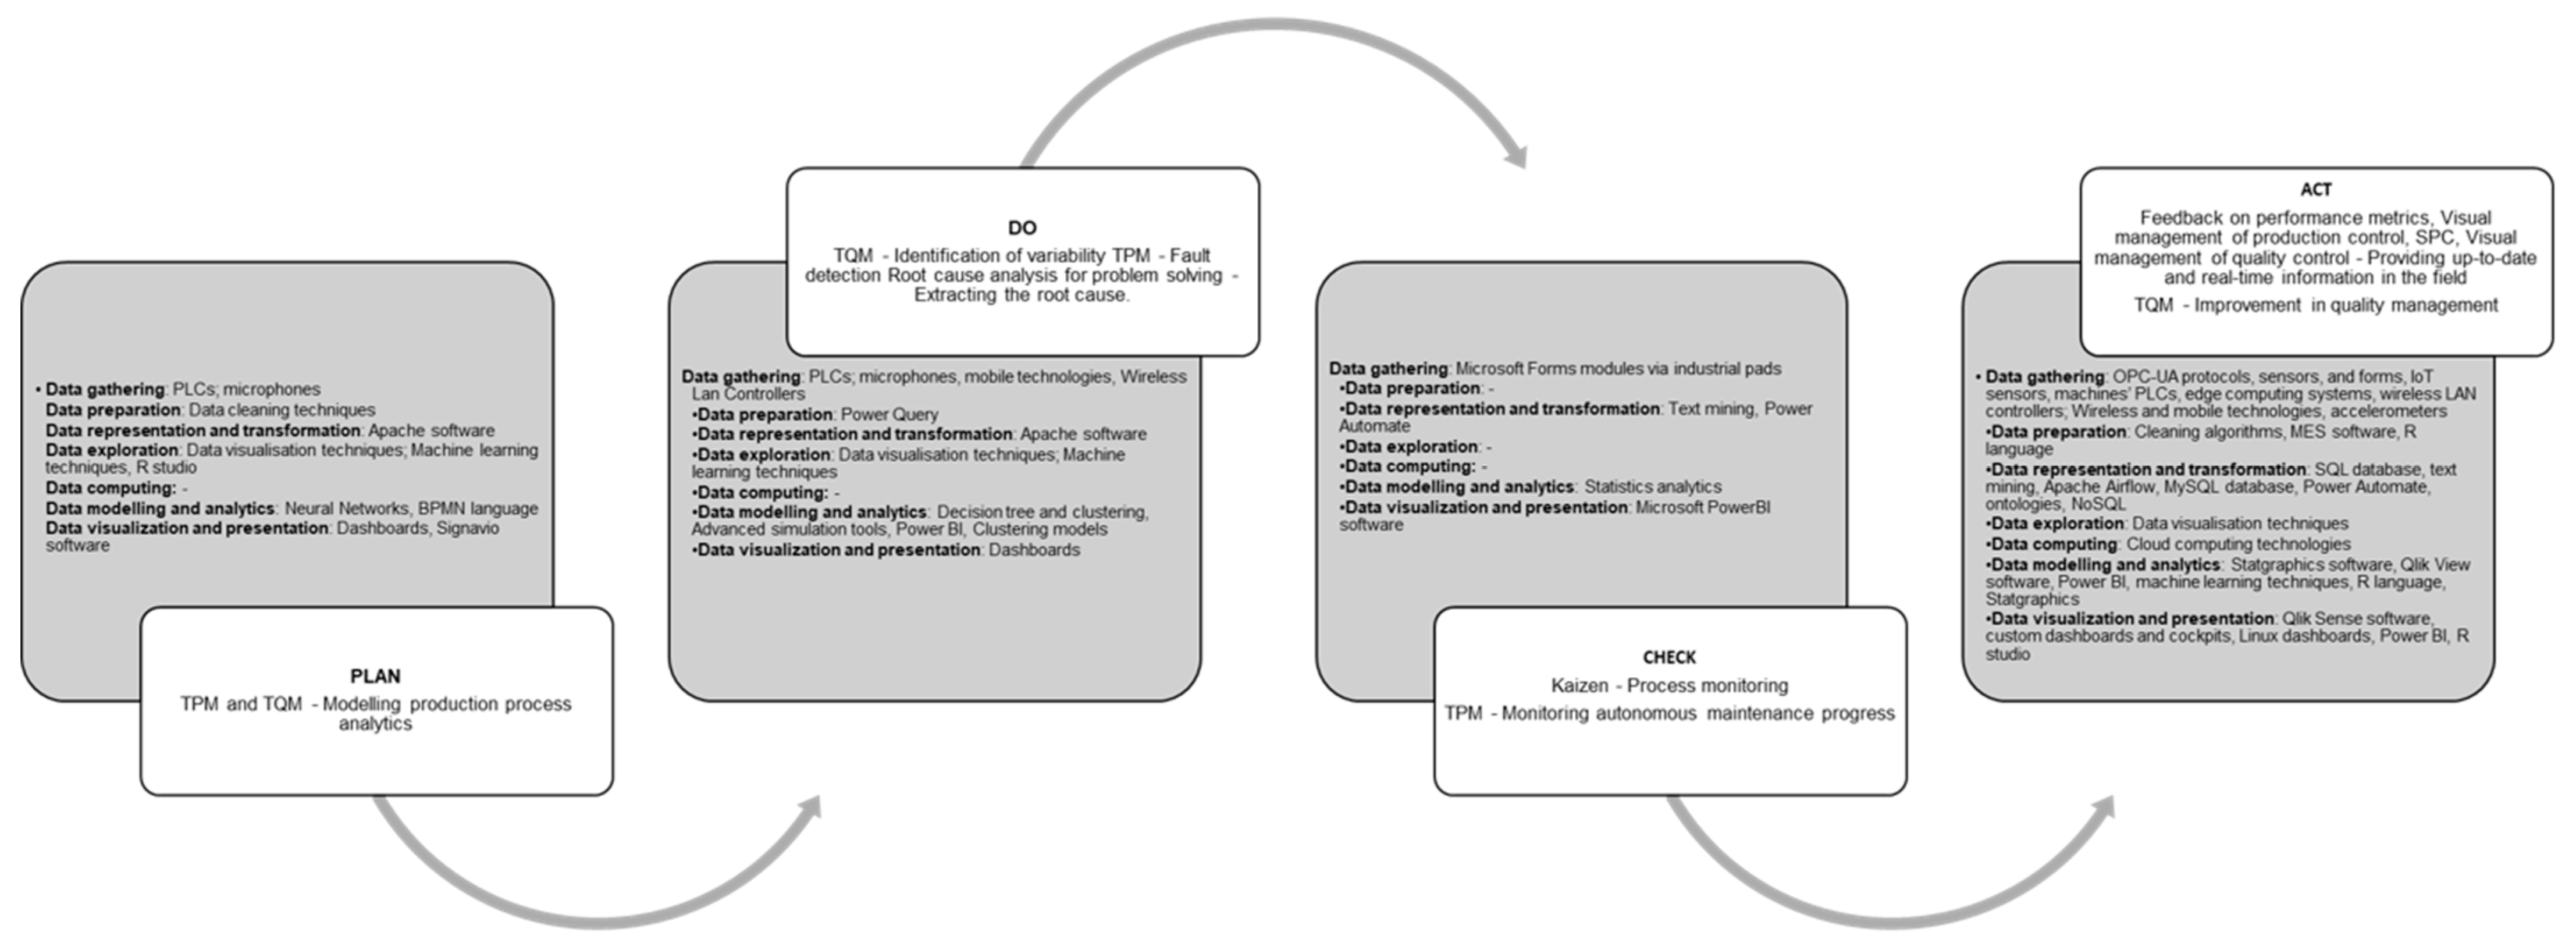
| Case | LP Bundle | LP Practice | DS Activity, Techniques, and Tools DS Activity Legend: (1) Data Gathering, (2) Data Preparation, (3) Data Representation and Transformation, (4) Data Exploration, (5) Data Computing, (6) Data Modelling and Analytics, (7) Data Visualization and Presentation | PDCA Stage |
|---|---|---|---|---|
| A | PPC | Feedback on performance metrics | (1): IoT applications; (3): Data transformation; Database management systems; Text mining; (4): Data visualisation techniques; (6): Statistics and Machine learning techniques; (7): Visual analytics software | ACT Providing up-to-date and real-time information in the field |
| TQM | (1): IoT applications; (6): Machine learning techniques; (7): Visual analytics software | ACT Improvement in quality management | ||
| SPC | (1): IoT applications; (3): Database management systems; (6): Statistics techniques; (7): Visual analytics software | ACT Providing up-to-date and real-time information in the field | ||
| Process technology | Process improvement/Kaizen | (1): Wireless and mobile technology; (3): Text mining; (6): Statistics techniques; (7): Visual analytics software | CHECK Process monitoring | |
| B | PPC | TPM | (1): Wireless and mobile technology; (6): Statistics techniques; (7): Visual analytics software | CHECK Monitoring autonomous maintenance progress |
| Feedback on performance metrics | (1): IoT applications; Wireless and mobile technology; (3): Database management systems; Text mining; (6): Statistics techniques; (7): Visual analytics software | ACT Providing up-to-date and real-time information in the field | ||
| TQM | (1): IoT applications; (2): Data cleaning techniques; (3): Data transformation techniques; Database management systems; (4): Data visualisation techniques; (6): Process mining; (7): Visual analytics software | PLAN Modelling production process analytics | ||
| (1): IoT applications; (2): Data cleaning techniques; (3): Data transformation techniques; Database management systems; (4): Data visualisation techniques; (6): Simulation tools; Statistics analytics; (7): Visual analytics software | DO Identification of variability | |||
| (1): IoT applications; (2): Data cleaning techniques; (3): Database management systems; (5): Cloud computing technologies; (6): Machine learning techniques; (7): Visual analytics software | ACT Improvement in quality management | |||
| C | PPC | TPM | (1): IoT applications; (2): Data cleaning techniques; (4): Machine learning techniques; (6): Machine learning techniques; (7): Visual analytics software | PLAN Modelling production process analytics |
| (1): IoT applications; (2): Data cleaning techniques; (3) Cloud computing technologies; (4): Machine learning techniques; (6): Machine learning techniques; (7): Visual analytics software | DO Fault detection | |||
| Feedback on performance metrics | (1): Wireless and mobile technology (3): Database management systems; (6): Statistics techniques; (7): Visual analytics software | ACT Providing up-to-date and real-time information in the field | ||
| Root cause analysis for problem-solving | (1): Wireless and mobile technology: (6): Machine learning techniques | DO Extracting the root cause | ||
| D | PPC | Visual management of production control | (1): IoT applications; (2): Data cleaning technique; (3): Database management systems (6): Statistics techniques; (7): Visual analytics software | ACT Providing up-to-date and real-time information in the field |
| Feedback on performance metrics | (1): IoT applications; (2): Data cleaning techniques; (3): Database management systems; (6): Statistics techniques; (7): Visual analytics software | ACT Providing up-to-date and real-time information in the field | ||
| SPC | (1): IoT applications; (3): Data transformation techniques; Database management systems; (6): Statistics techniques; (7): Visual analytics software | ACT Providing up-to-date and real-time information in the field | ||
| E | PPC | Visual management of production control | (1): IoT applications; (2): Data cleaning technique; (6): Statistics techniques; (7): Visual analytics software | ACT Providing up-to-date and real-time information in the field |
| Feedback on performance metrics | (1): IoT applications; Wireless and mobile technology; (2): Data cleaning technique; (3): Database management systems; (6): Statistics techniques; (7): Visual analytics software | ACT Providing up-to-date and real-time information in the field | ||
| TQM | (1): Wireless and mobile technology; (3): Database management systems; (6): Statistics techniques; (7): Visual analytics software | DO Identification of variability | ||
| Process technology | Visual management of quality control | (1): IoT applications; (2): Data cleaning technique; (6): Statistics techniques; (7): Visual analytics software | ACT Providing up-to-date and real-time information in the field | |
| F | PPC | Visual management of production control | (1): IoT applications; Wireless and mobile technology; (2): Data cleaning technique; (3): Database management systems; Text mining; (5): Cloud computing technologies; (6): Statistics techniques; (7): Visual analytics software | ACT Providing up-to-date and real-time information in the field |
| Feedback on performance metrics | (1): IoT applications; Wireless and mobile technology; (2): Data cleaning technique; (3): Database management systems; Text mining; (5): Cloud computing technologies; (6): Statistics techniques; (7): Visual analytics software | ACT Providing up-to-date and real-time information in the field | ||
| Process technology | Visual management of quality control | (1): IoT applications; Wireless and mobile technology; (2): Data cleaning technique; (3): Database management systems; Text mining; (5): Cloud computing technologies; (6): Statistics techniques; (7): Visual analytics software | ACT Providing up-to-date and real-time information in the field |
Disclaimer/Publisher’s Note: The statements, opinions and data contained in all publications are solely those of the individual author(s) and contributor(s) and not of MDPI and/or the editor(s). MDPI and/or the editor(s) disclaim responsibility for any injury to people or property resulting from any ideas, methods, instructions or products referred to in the content. |
© 2024 by the authors. Licensee MDPI, Basel, Switzerland. This article is an open access article distributed under the terms and conditions of the Creative Commons Attribution (CC BY) license (https://creativecommons.org/licenses/by/4.0/).
Share and Cite
Pozzi, R.; Cannas, V.G.; Rossi, T. Data Science Supporting Lean Production: Evidence from Manufacturing Companies. Systems 2024, 12, 100. https://doi.org/10.3390/systems12030100
Pozzi R, Cannas VG, Rossi T. Data Science Supporting Lean Production: Evidence from Manufacturing Companies. Systems. 2024; 12(3):100. https://doi.org/10.3390/systems12030100
Chicago/Turabian StylePozzi, Rossella, Violetta Giada Cannas, and Tommaso Rossi. 2024. "Data Science Supporting Lean Production: Evidence from Manufacturing Companies" Systems 12, no. 3: 100. https://doi.org/10.3390/systems12030100