Article

Analysis of Spatial and Temporal Evolution Characteristics and Influencing Factors of the Water Footprint in Xinjiang from 2000 to 2020

1
College of Management and Economics, Tianjin University, Tianjin 300072, China
2
State Key Laboratory of Hydraulic Engineering Simulation and Safety, School of Civil Engineering, Tianjin University, Tianjin 300072, China
3
State Key Laboratory of Simulation and Regulation of Water Cycle in River Basin, China Institute of Water Resources and Hydropower Research, Beijing 100044, China
*
Authors to whom correspondence should be addressed.
These authors contributed equally to this work.
Systems 2023, 11(7), 349; https://doi.org/10.3390/systems11070349
Submission received: 4 June 2023 / Revised: 29 June 2023 / Accepted: 30 June 2023 / Published: 7 July 2023

Abstract

:
Xinjiang is home to one of the most serious resource-based water shortages, and at the same time, it is an important main production area of grain, cotton, and high-quality fruits and vegetables in China, placing a heavy burden on water resources. Based on this, this paper determines the basic condition of water resources in regions of Xinjiang using the water footprint method. It then identifies the drivers of water footprint changes using the population scale effect, policy support effect, investment–output effect, economic structure effect, water use efficiency effect, and water use structure effect via the LMDI decomposition model. Finally, this paper illustrates the trajectory of the regional water footprint through individual stochastic convergence. This study found the following: (1) The water footprint of Xinjiang showed a fluctuating upward trend, and the total water footprint varied significantly between regions. From a compositional standpoint, most regions were dominated by the agricultural water footprint, while spatially, the regional water footprint had a high distribution trend in the south and a low distribution in the north. (2) The driving effects of the water footprint, policy support, population scale, and water use structure were incremental, while the effects of water use efficiency, economic structure, and investment output were decremental. (3) Most regions in Xinjiang showed individual stochastic convergence trends, indicating that regions converged to their respective compensating difference equilibrium levels. In this regard, it is necessary to strengthen R&D and the promotion of water use technology, further optimize the industrial structure, and leverage the positive effect of government investment to alleviate the regional water constraint dilemma and promote high-quality regional economic development.

1. Introduction

Water is an important economic and natural resource, and water resources have become a strategic issue for sustainable socio-economic development in many countries worldwide [1]. Water scarcity is the most critical natural factor limiting the socio-economic development of the northwest arid zone in China [2]. Located in the northwest region of China, Xinjiang has limited water resources. At the same time, Xinjiang is an important grain, cotton, and high-quality fruit and vegetable exporting area in China, with unresolved water resource utilization problems.
The efficient and intensive use of water resources is an important way to ensure the security of regional water resources. Given the water situation in Xinjiang, saving regional water resources and ensuring water security is the focus of current research. Accurately determining the amount of water resources in Xinjiang is the primary requirement for conducting driver studies. The water footprint theory, proposed by the Dutch scholar Hoekstra, provides a novel approach to water quantity identification [3]. The water footprint refers to the water consumed to produce the goods or services required by human society, including not only direct water use in production but also indirect water use from the supply chain [4]. This study examines water stress [5] and water security [6] in the Xinjiang region from the perspective of the water footprint, which provides feasible suggestions for the region’s development. Estimation methods for determining the water footprint are divided into top-down and bottom-up methods. The former is suitable for water footprint assessment at the provincial or national scale and relies more on trade data, while the latter is focused on product consumption, which is equal to the physical water consumed in the region along with the virtual water of the product used by the residents. Due to the difficulty of obtaining municipal-level trade data, this paper uses a bottom-up approach to calculate the regional water footprint [7].
The LMDI (Logarithmic Mean Divisia Index) decomposition method is widely used in the analysis of water footprint drivers of agricultural products [8]. Compared with other methods, the LMDI decomposition method has many advantages, such as full multiplicative decomposition, no residuals, and ease of interpretation, and it has been widely used in time series data analysis [9]. In terms of agricultural water resource utilization in Xinjiang, the economic effect is positive, the efficiency effect is negative, and the overall contribution of the scale effect is not significant [10]. The potential of agricultural water conservation is not only related to the current situation of water consumption, but also to the level of economic development, investment efforts, water conservation mode, water consumption structure, and other factors. Therefore, it is a reflection of the combined effect of many factors [11]. Agricultural water use is the main area of water consumption in the Xinjiang region and is important for reducing the water footprint. Based on previous studies, this paper adopts the LMDI method for driver decomposition and considers the impact of policy investment on the water footprint of the Xinjiang region based on the economic level effect, population size effect, and water use efficiency [12].
Convergence analysis is often used to represent the evolutionary trends and dynamic characteristics of regional differences over time, such as σ convergence [13], β convergence [14], and club convergence [15]. Individual stochastic convergence takes into account the effects of external shocks (structural breakpoints) on this basis, and is mostly used for studies of carbon emissions [16,17,18], energy consumption [19], pollutant emissions [20], ecological footprint [21], and water efficiency [22]. Structural breakpoints appear mostly in alignment with historical events. The development of the Xinjiang region is influenced by government investment, and the impact of external shocks can accurately judge the regional growth path. Zhang et al. [23] used the alpha convergence method and found evidence that the gap in water use efficiency in the northwest will further widen and that government intervention will have a negative impact.
This paper aims to identify the drivers of water footprint change and provide a theoretical basis for regional water resources management, focusing on a water conservation as a priority and factor identification as a key aspect. This article scientifically quantifies the water resources situation in Xinjiang using the water footprint method and analyzes the six aspects of population size, policy support, investment output, economic structure, water use efficiency, and water use structure based on regional characteristics using the LMDI decomposition method. Finally, the analysis is validated by individual stochastic convergence, and the path of the water footprint change in each region is judged to provide recommendations and theoretical support for water resource management in Xinjiang.

2. Materials and Methods

2.1. Study Area

Xinjiang (shown in Figure 1) is located in the northwest region of China, and it faces one of the most serious water resource shortages. It spans between 73 ° 46 ~ 96 ° 23   E and 34 ° 25 ~ 49 ° 50   N , with a total area of 1.66 × 10⁶ km2. The topography of Xinjiang is characterized by three mountains and two basins, forming a distinct pattern from north to south. The southern and northern regions of Xinjiang are divided by the Tianshan Mountains. Since the 21st century, the climate of Xinjiang has changed significantly, with a sharp increase in temperature, high-temperature fluctuations, and a slight decrease in rainfall [24].
In 2020, the average annual temperature in Xinjiang was 8.7 °C, and the number of hours of sunlight reached 2771.8 h. The spatial and temporal distribution of water resources in the region are uneven. Spatially, there were more resources in the west and less in the east, with an average rainfall of 199.6 mm in 2020, including 149.3 mm in the north, 76.3 mm in the south, and 76.3 mm in the east. In terms of intra-year distribution, there were spring droughts and summer floods. The incoming water resources from June to September accounted for 70–80% of the annual runoff, primarily causing summer floods. The incoming water during the irrigation season only accounted for approximately 10% of the annual runoff, which increased the susceptibility to spring droughts and insufficient water for irrigation in spring [25]. In 2021, the national rainfall was 691.6 mm, and the rainfall in Xinjiang was 161.7 mm. Precipitation in the region was scarce, and resource-based water shortages was serious, making it the most water-poor region in China.
Water is the lifeblood of Xinjiang’s economic and social development, serving as a basic natural resource and a strategic economic resource. In 2019, Xinjiang’s annual runoff was 8.30 × 10¹⁰ m3, with total reservoir storage of 9.12 × 10⁹ m3 at the end of the year. The water consumption of 105 CNY of the GDP was 407.76 m3, achieving an annual regional GDP of 1.36 × 10¹¹ CNY. The resident population at the end of the year was 2.56 × 10¹¹ people, with per capita urban living water consumption reaching 219.54 L/d in urban areas and 104.12 L/d in rural areas. The average water consumption for irrigation in agricultural fields was 565.37 m3/acre, and the annual grain output was 1.53 × 10⁷ tons, including a cotton output of 5.00 × 10⁶ tons. Due to the low total amount of regional water resources, regional production and living water conflicts are prominent, and water shortages are the most critical natural factor restricting social and economic development in Xinjiang.

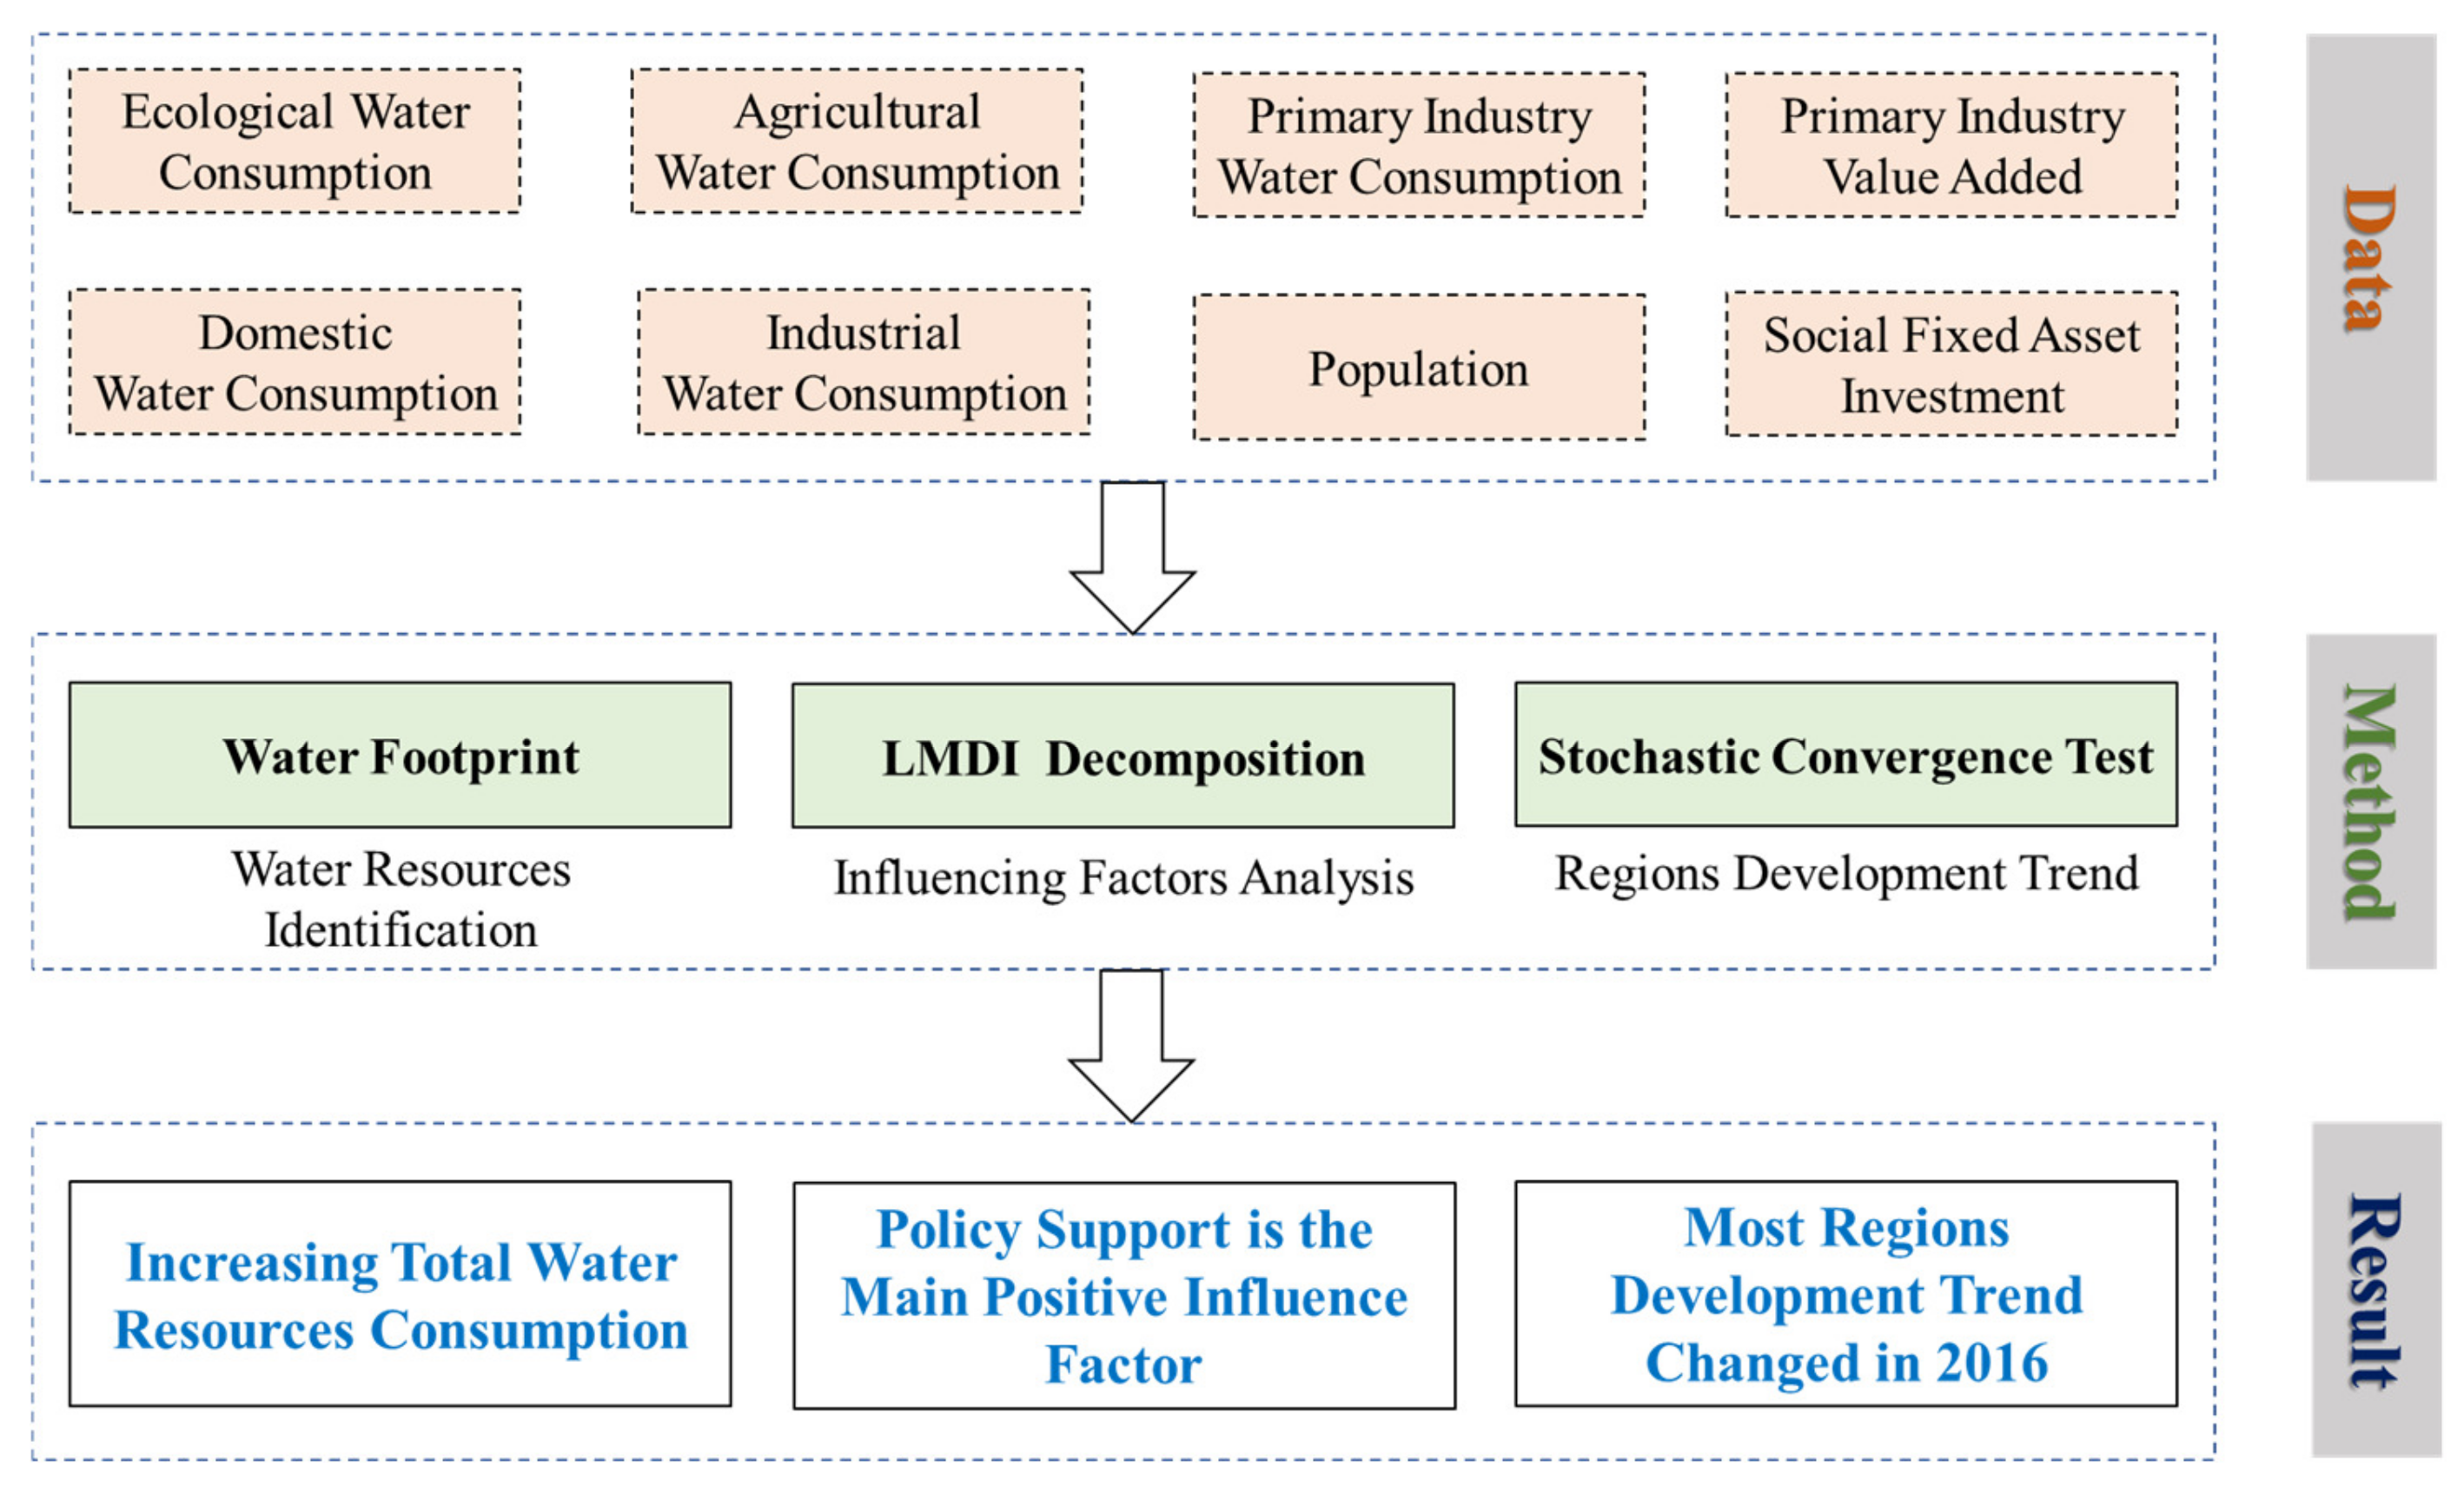
2.2. Research Framework

The research framework is shown in Figure 2.

2.3. Data Sources and Preprocessing

The data used included industrial, domestic, and ecological water use data, as well as agricultural water footprint calculations for the production of agricultural products. Additionally, it included crop acreage and livestock production data from the Xinjiang Statistical Yearbook (2000–2020) and crop evapotranspiration (ET0) data obtained from the FAO CLIMWAT 2.0 database through the UN FAO Cropwat Model [26,27]. This study focused on the virtual water ( V W c ) content per unit of agricultural products in 14 prefectures (cities and towns) in Xinjiang from 2000 to 2020. The unit of virtual water content for livestock products ( V W a ) was sourced from related domestic and international studies [4,28,29,30]. This study analyzed wheat, corn, beans, potatoes, cotton, sunflower, sugar beets, vegetables, melons, alfalfa, rice, and livestock products (cattle, pigs, sheep, and poultry meat) in Xinjiang. Production information for these commodities was extracted from the Xinjiang Statistical Yearbook (2000–2020). Data on LMDI decomposition indicators, including gross regional product, value added in the primary industry, total population, total social fixed asset investment, and water consumption in primary production were obtained from the Xinjiang Statistical Yearbook and the statistical yearbooks of various cities and towns (2000–2020). For any missing years, data were processed and supplemented via time series interpolation techniques.

2.4. Research Methodology

The research methodology includes three parts: water footprint accounting, LMDI decomposition analysis, and convergence analysis. (1) In the water footprint accounting, the industrial water use, domestic water use, and ecological water use directly adopted the blue water footprint data corresponding to the statistical yearbook of Xinjiang Autonomous Region. The water footprint of agriculture (mentioned in Section 2.3) was calculated using the “crop water demand method” [5] for major crops and livestock products in 14 prefectures and cities in Xinjiang. (2) The LMDI decomposition analysis was used to determine the impact of population size effect, policy support, investment and output, economic structure, water use efficiency, and water use structure on the water footprint of each city. This analysis aimed to explore effective ways to reduce the water footprint. (3) The convergence analysis involved using individual stochastic convergence tests verify trend evolution considering the influence of structural breakpoints. This analysis was used to determine the impact of external shocks (economic policy changes) over time.

2.4.1. Water Footprint

Referring to the study of Liu Ning [31], this paper gives the following formula for calculating the water footprint of Xinjiang region:
W F = W F a g r + W F i n d + W F p e o + W F e c o
where W F is the water footprint of Xinjiang, which consists of the agricultural water footprint W F a g r , industrial water footprint W F i n d , residential water use W F p e o , and ecological environment water use W F e c o . The agricultural gray water footprint in Xinjiang is relatively small [27] and was not considered in this section of the study. The agricultural water footprint was calculated based on the water footprint of the main agricultural products in Xinjiang using the following equation:
W F a g r = W F c + W F a
where the agricultural water footprint consists of the water footprint of planted crops W F c and the water footprint of livestock products W F a .
  • The water footprint of planted crops was accounted for using the “crop water demand method” [5] with the following formula:
    W F c = V W c × Y = 10 × K c × E T 0 Y c × Y c × S c
    where V W c is the virtual water content per unit of planted crop c , and Y is the total yield of crop c in the region. Y c is the crop yield per hectare of land, and S c is the area of land used for a crop planted in the region. C W R c is the crop’s water requirement during the growing period under certain climatic conditions. E T c is the accumulated evapotranspiration of the soil’s water during the actual growth and development period of the crop. K c is the average crop coefficient at each reproductive stage, and E T 0 is the evapotranspiration of the reference crop.
  • The water footprint of livestock products was calculated as follows:
    W F a = V W a × Y a
With reference to relevant domestic and foreign studies [4,28,29,30], the unit virtual water content V W a was obtained for various types of livestock products, and Y a is the total production of livestock products a .

2.4.2. LMDI Decomposition

Ang [32] proposed eight LMDI models that use different weights, decomposition methods, and indicators. In order to quantitatively decompose the changes in water footprint and analyze them in both spatial and temporal dimensions, the additivity decomposition analysis method was used in this study.
Referring to the index selection methods of Ruzi Li [33], Xinying Wu [34], Zhang S L [35], and Yang J [36], the six effects of population scale effect, policy support effect, investment output effect, economic structure effect, water use efficiency effect, and water use structure effect were used as factors to measure their effects on the water footprint in areas of Xinjiang, taking into account the current situation of water resources and water use characteristics. The total water footprint of all cities and towns in Xinjiang in year t is W t , and the calculation formula used in this paper is expressed as follows:
W t = i W i t = i ( P i t ) · ( F i t P i t ) · ( G i t F i t ) · ( V i t G i t ) · ( C i t V i t ) · ( W i t C i t )
W t = i ( P i t · F P i t · G P i t · S i t · W I i t · W S i t )
where P i t is the total population of city i in a given year, F i t is the social fixed asset investment of city i in that year, G i t is the regional GDP of city i in that year, V i t is the value added to the regional primary industry of city i in that year, C i t is the water consumption of the regional primary industry of city i in that year, and W i t is the total water consumption calculated using the water footprint of city i in that year.
The increase in the water footprint from the adjacent year t 1 to the target year t , expressed as Δ W t o t t , can be decomposed into six influencing factors (shown in Table 1): (1) population scale effect, (2) policy support effect, (3) investment output effect, (4) economic structure effect, (5) water use efficiency effect, and (6) water use structure effect. Therefore, Δ W t o t t can be calculated using the following equation:
Δ W t o t t = Δ W P t + Δ W F P t + Δ W G P t + Δ W S t + Δ W W I t + Δ W W S t
where each influencing factor can be expressed as
Δ W P t = i W i t W i t 1 l n W i t l n W i t 1 · l n ( P i t P i t 1 )
Δ W F P t = i W i t W i t 1 l n W i t l n W i t 1 · l n ( F P i t F P i t 1 )
Δ W G P t = i W i t W i t 1 l n W i t l n W i t 1 · l n ( G P i t G P i t 1 )
Δ W S t = i W i t W i t 1 l n W i t l n W i t 1 · l n ( S i t S i t 1 )
Δ W W I t = i W i t W i t 1 l n W i t l n W i t 1 · l n ( W I i t W I i t 1 )
Δ W W S t = i W i t W i t 1 l n W i t l n W i t 1 · l n ( W S i t W S i t 1 )
The population size effect indicates the impact of population growth, while the policy support effect reflects the effect of regional fixed asset investment on the water footprint. The investment output effect indicates the water footprint generated in the process of economic growth introduced by fixed asset investment. The economic structure effect indicates the impact of regional economic structure on the regional water footprint. The water use efficiency effect reflects the impact of the water utilization rate and technology level, and finally, the water use structure effect indicates the impact generated by the different proportions of industrial water use.

2.4.3. Stochastic Convergence Test

Unlike the traditional concept of convergence, stochastic convergence observes relative numbers, and its convergence depends on whether the gap between economies maintains a relatively smooth trajectory. Before proceeding to stochastic conditional convergence, a variable applicable to the test is constructed, i.e., the number relative to the mean value of the water footprint intensity of all cities. The formula is as follows:
R W i t = L n ( W i t a v e r a g e W t )
From this, the relative water footprint R W applicable to the test is generated, with W i t representing the water footprint of city i at time t and a v e r a g e W t representing the average water footprint of all cities and towns in Xinjiang at time t . In this paper, i is 14, and the number of time series t is 21, which is a balanced panel with a sample size of 294. Perron [37] proposed a unit root test for structural mutation, and Nelson and Plosser [38] used this method to test 13 non-stationary variables in the United States. They found that 10 variables were trend-stable and contained structural mutations, indicating that structural changes can have an impact on the unit root test results. However, Perron’s choice of structural breakpoints was based on pre-acquired information and data mining, i.e., the structural mutation points were already known (external). This results in an over-rejection of the original hypothesis. Zivot and Andrews [39] found that some of Perron’s conclusions were incorrect by internalizing the structural breakpoints, and on this basis, proposed the Zivot Andrews (ZA) test. As some time series often exhibit multiple structural mutations, and mutation events with high impact repeatedly occurred in areas of Xinjiang [40], considering only one breakpoint may lead to over-rejection of the original hypothesis using the unit root test. Therefore, this paper is complemented by the CMR (Clemente–Montanes–Reyes) univariate unit root test, which extends the results of Perron and Vogelsang to the case where the mean of the variable exhibits a double change, i.e., the series has two structural changes [41].

3. Results and Discussion

This paper scientifically identified the water resources of regions in Xinjiang using the water footprint accounting method and explored the LMDI decomposition method. This analysis determined that the population size, policy support, and water use structure have positive effects on Xinjiang’s water footprint, while the investment output, economic structure, and water use efficiency have negative inhibiting effects. Finally, through individual stochastic convergence tests, it was found that the positive effects of some regions had only a short-lived impact on the increase in the regional water footprint, which did not affect the long-term development inertia of the region. This research provides novel ideas for efficient and intensive water use and social development of the region.

3.1. Analysis of Total Water Consumption in Xinjiang

3.1.1. Main Components of Regional Water Footprint

As can be seen from Table 2 below, the main composition of the water footprint varied among regions, and the main source of the water footprint in most regions was the agricultural water footprint. The ecological water footprint accounted for a relatively high proportion in the Altay and Karamay regions, 52.19% and 44.61%, respectively, and the industrial water footprint dominated in Urumqi, accounting for 38.02% of the regional water footprint. The rest of the regions were dominated by the agricultural water footprint, with more than half of the water used in agriculture. Among them, Kashi, Aksu, and Ili were particularly significant, comprising 92.67%, 92.66%, and 90.77% of the agricultural water footprint, respectively. The share of the agricultural water footprint in the Turpan region was slightly lower, at 58.85%, while the rest of the regions were close to 80%.
In recent years, Altay has attached importance to the construction of ecological civilization and made significant investments in natural forests, river valley forests, and pasture restoration. This region has vigorously implemented major ecological projects, such as returning farmland to forests, returning pasture to grass, and greening barren hills, to continuously optimize the ecological environment and improve the ecological status. Altay has been implementing ecological flooding and irrigation in the middle and lower reaches of the Erches River for two consecutive years, and the ecology of the local river valley has been significantly improved [42]. As a typical resource-based city, Karamay adheres to the development model: that the development of the oil industry and the construction of the ecological civilization promote each other [43]. Thus, the regional water resources are mainly reflected in the industrial and ecological water footprints. Urumqi, the capital of Xinjiang, is a population center, and the living standard of the people in the region is relatively high; therefore, the living water footprint is also relatively high. At the same time, Urumqi is an important component city of the “eight industrial clusters” and “industrial system” [44], with huge industrial investment and rapid development, and the industrial water footprint accounts for relatively heavy consumption. The rest of the region is restricted by policies and geographical conditions. Agriculture is the focus of regional development, and according to the natural characteristics of the region, the economy of special agricultural products has been created to drive economic development and realize the overall high-quality development of the region.

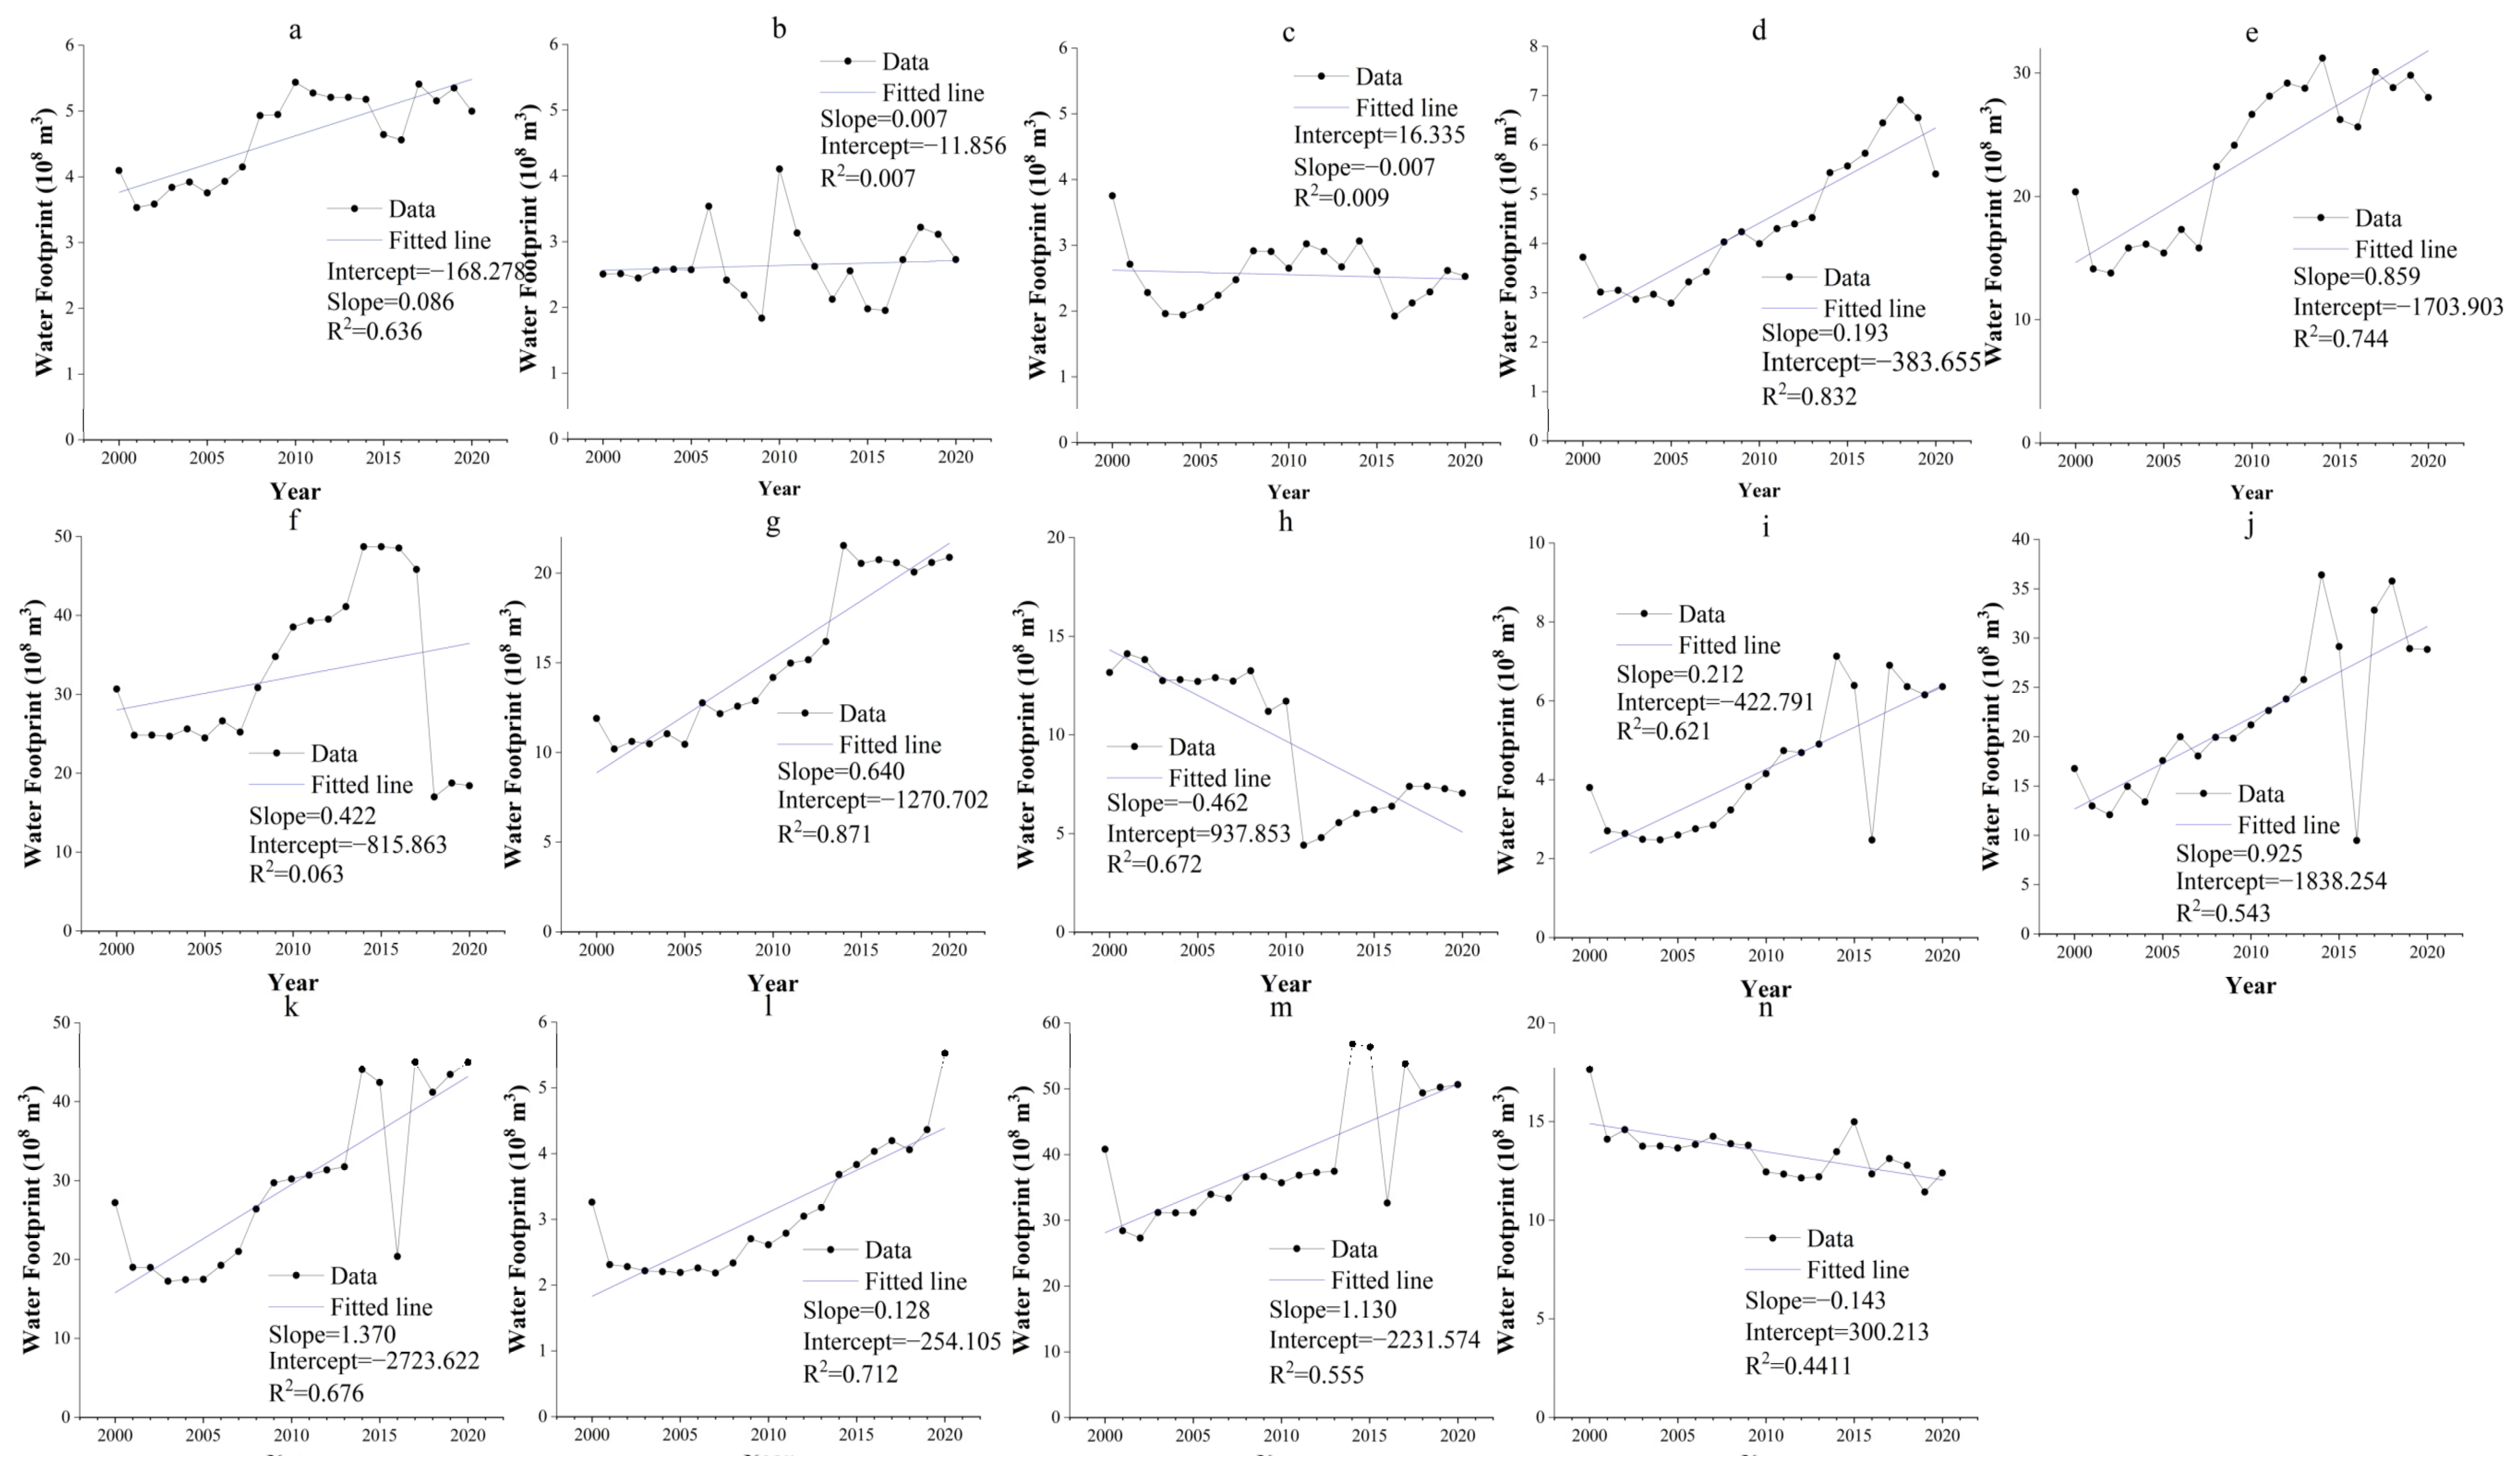
3.1.2. Trends in the Evolution of Regional Water Footprints

Overall, the total water footprint of specific regions in Xinjiang increased from 2.00 × 10¹⁰ m3 to 2.39 × 10¹⁰ m3 from 2000 to 2020, showing a dynamic evolution characteristic of fluctuation and increase. The evolution trend of 14 prefectures and cities in Xinjiang is shown in Figure 3. The water footprints of the Karamay and Turpan regions fluctuated from 2000 to 2020, and the overall trend was stable. The water footprints of the Hotan and Altay regions showed a clear decreasing trend. The decrease in the water footprint in Hotan was the result of the combined effect of agriculture, industry, and the ecological water footprint. The decrease in the water footprint of the Altay region was mainly due to the decrease in ecological water use. The remaining regions showed dynamic evolutionary characteristics, including a fluctuating increase in the water footprint, among which Kashi, Bortala, Bayingolin, and Aksu showed significant decreases in 2016 of 42.10%, 61.32%, 67.49%, and 51.94%, respectively.
In 2016, Xinjiang issued a series of documents to implement a strict water resource management system, adopt new water resource fee collection standards, and promote water supply price reform for water conservancy projects [45]. In the Ili region, in 2017, the agricultural planting structure was adjusted, and wheat, corn, and other food crops, as well as cotton, sugar beets, and other cash crops’ planting areas, were reduced to an extent. Crop production also decreased, and the regional crop water footprint decreased, driving an overall decline in the water footprint. The water footprint of the Altay region showed a clear decline, with a noticeable turnaround in 2010 and a change from a downward trend to an upward trend after 2011. This was mainly caused by a reduction in the ecological water footprint, from 7.66 × 10⁸ m3 in 2010 to 1.10 × 10⁸ m3 in 2011, and a gradual rebound in the ecological water footprint thereafter. The policy adjustments in 2016 and 2017 may have had a significant impact on the regional water footprint, and individual stochastic convergence tests were conducted later for further validation analysis.

3.1.3. Spatial Distribution of Regional Water Footprints

The regional water footprint distribution in Xinjiang (shown in Figure 4) shows a high distribution in the south and low distribution in the north, and the total regional water footprint varies significantly. The 2000–2020 regional water footprints were as follows (ordered from largest to smallest): Kashi, Yili, Aksu, Changji, Bayingolin, Tacheng, Hotan, Altay, Urumqi, Hami, Bortala, Kizilsu, Karamay, and Turpan. The highest cumulative water footprint in Kashi was 8.28 × 10¹⁰ m3, which was 14 times higher than the lowest water footprint in Turpan: 5.37 × 10⁹ m3.
The large water footprint is mainly attributed to the fact that some regions are rich in water resources and dominated by agriculture, which is an important base for exporting agricultural products that consume a high proportion of the available water. The three regions with the highest water footprints are Aksu, Ili, and Kashi. The annual runoff of the Dolang River in the Aksu region can account for nearly 60% of the annual runoff of the Tarim River, which has the most abundant water resources in southern Xinjiang. The region is famous for its agricultural specialties and is an important production base for cotton, which accounts for approximately one-ninth of the country’s annual cotton production. Unlike the Ili region, the Kashi region has scarce precipitation and vigorous evaporation, and the Altash Water Conservancy Hub Project has improved the regional water resources. The percentage of agricultural water use shows a layout including a high periphery and low middle, mainly due to the different priorities of regional economic development, with the lowest percentage in the Urumqi and Karamay regions.

3.2. Analysis of Factors Influencing the Total Water Consumption

According to the above-mentioned composition and evolution of the water footprint in regions of Xinjiang, the agricultural water footprint is an important part of Xinjiang’s water footprint and is crucial to reducing the overall water footprint. Meanwhile, living, ecology, and industry also contribute significantly to the water footprint of some regions. Based on this, the population scale effect, policy support effect, investment output effect, economic structure effect, water use efficiency effect, and water use structure effect were selected to decompose the total water footprint of the region. This was done to explore ways to effectively reduce the water footprint, realize the efficient use and allocation of water resources, and drive high-quality development of the regional economy.

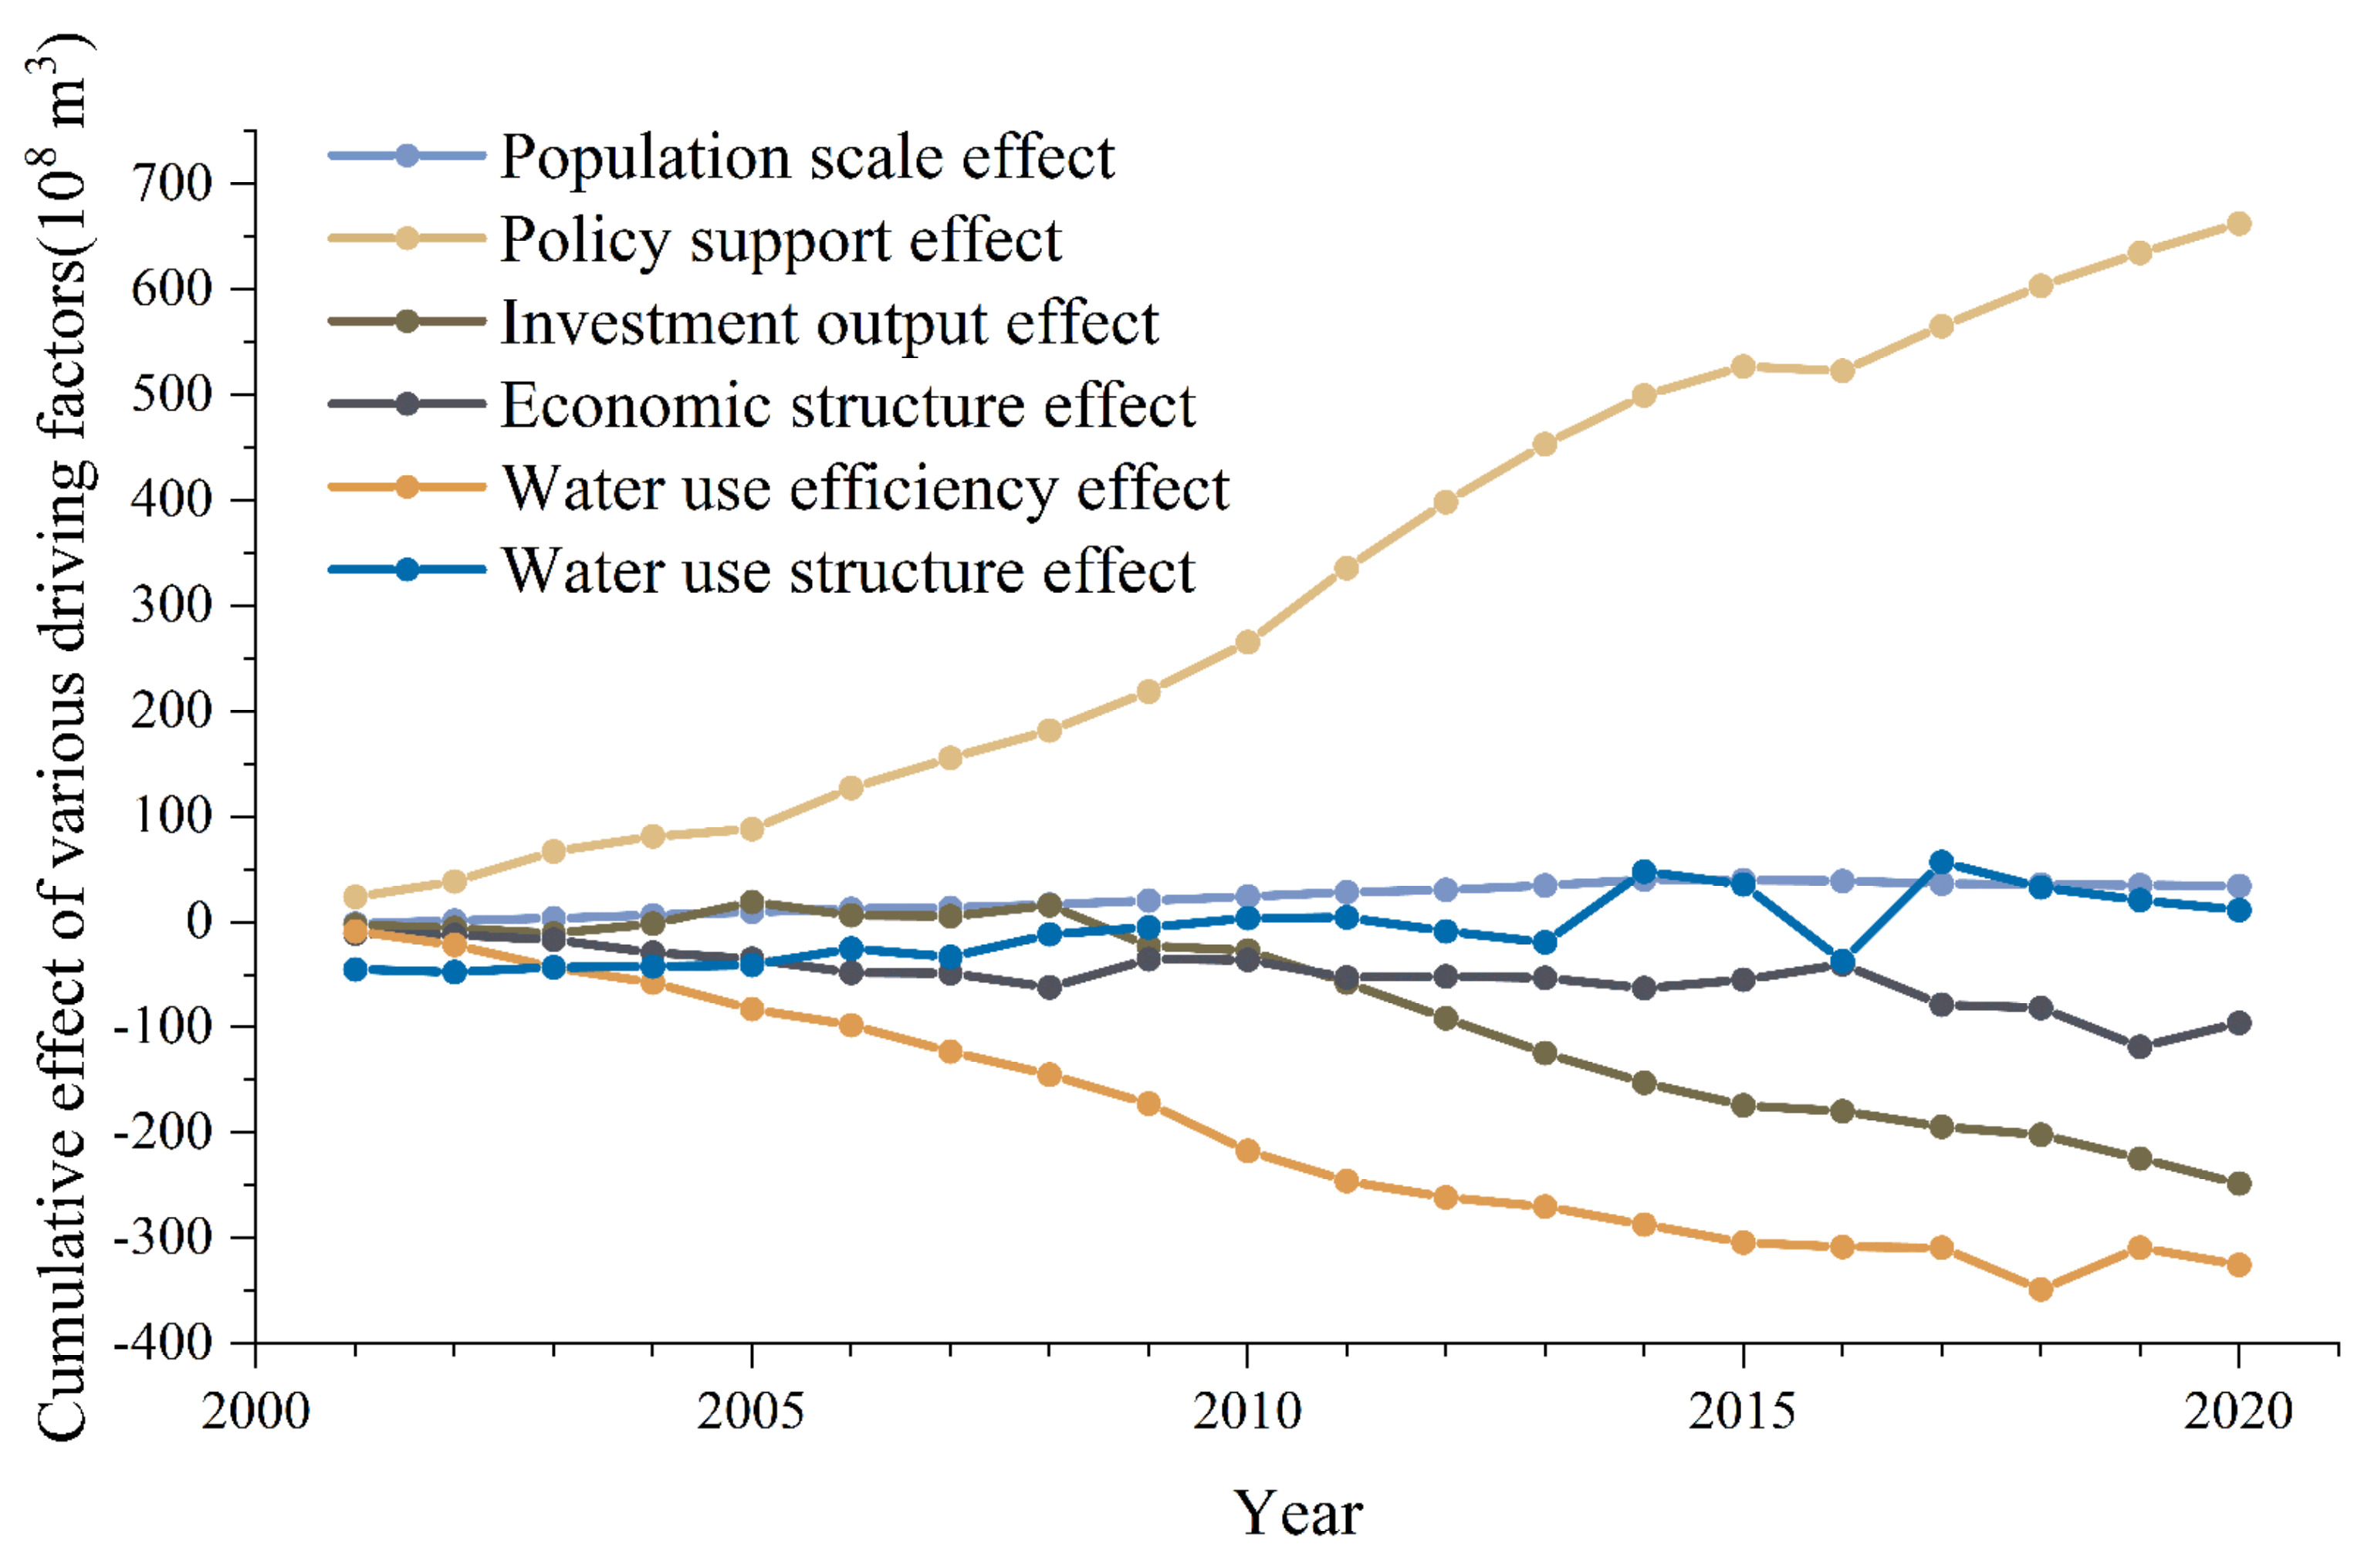
3.2.1. Temporal Evolution Trend

In order to analyze the drivers affecting the water footprint of each city in Xinjiang, the LMDI method was used to analyze the population, policy, investment output, economic structure, water use efficiency, and water use structure, and the related values are shown in Table 3.
The main positive driver affecting the water footprint in Xinjiang is the policy support effect (shown in Figure 5), and this effect was prominent in 2006–2007 and 2011–2015, with impacts of 2.86 × 10⁹ m3, 6.28 × 10⁹ m3, 5.50 × 10⁹ m3, 4.60 × 10⁹ m3, and 2.75 × 10⁹ m3, respectively, significantly driving the growth of the water footprint. However, in 2015–2016, the policy support effect showed a weakly reduced effect of −4.08 × 10⁸ m3.
In 2006, the investment in the fixed assets of the whole population reached 1.35 × 10¹¹ CNY, representing an increase of 16.4%, of which 4.80 × 10¹⁰ CNY was invested in key projects such as the comprehensive management of the Tarim River basin, the Lower Bandi Water Conservancy Hub, the South Bank Trunk Canal of the Ili River, and the irrigation district project. The “Dui Eqiwu” and “Dui Eqi Ke” projects were fully completed and running in the northern Xinjiang region [46], and some of the water conservancy hubs of the Ili River were also constructed, resulting in a significant expansion of agricultural irrigation and cultivated areas. In 2007, approximately 4.90 × 10¹⁰ CNY was invested in the construction of the drinking water hub of the Ili River and the north bank trunk canal, the Kizigal Reservoir in Altay, and the Daxigou Reservoir in Urumqi. The Xinjiang government attaches great importance to the development and utilization of water resources. From 2011 to 2015, the aid funds for Xinjiang were used to invest approximately 6.40 × 10¹⁰ CNY in agriculture and light industries, such as textiles [46], greatly contributing to the further development of Xinjiang. As shown in Figure 6, the policy support effect and the cumulative effect on the total water footprint of Xinjiang is positive and growing, and the investment in water conservancy projects supports the expansion of agricultural irrigation area, leading to an increase in the water footprint.
The water use efficiency effect is the main negative driver of Xinjiang’s water footprint, and the impact was most prominent from 2001–2005 when the country introduced its 10th five-year plan. This plan proposed reform, opening up, and technological progress as development ideas. The inhibitory effect of water use efficiency on the water footprint gradually strengthened over time, reaching a minimum value of −3.49 × 10¹⁰ m3 in 2018, with a slight decrease in the inhibitory effect in the following two years. The economic structure effect was always suppressive, with significant fluctuations in the observed period and a turning point in 2019, after which the suppressive effect decreased slightly. The fluctuations in the water use structure effect showed a dramatic magnitude, alternating between positive promotion and negative inhibition effects. This was mainly due to Xinjiang’s special agricultural policy, which involves different agricultural plans at different times, such as “promoting agricultural structure adjustment”, “standardized production and industrialized operation”, and “expanding the planting area of special advantageous crops”. The population movement in Xinjiang was relatively small, so the population size effect showed a smooth promotion effect. The investment output effect was suppression, which gradually strengthened after 2019 due to a lag in the fixed asset investment output. Thus, improvements in technology, effective improvements in water use efficiency, and reasonable investment output can effectively suppress the water footprint of Xinjiang.
Water use efficiency is the most significant factor inhibiting the growth of the water footprint, and improving the water use efficiency can improve the regional water footprint, which is also consistent with many scholars’ studies [33,34,47]. In terms of water use efficiency, the Xinjiang government attaches great importance to improving the intensive and economical use of water resources. The government also insists on prioritizing water conservation, strengthening the centralized and unified management of water resources, accelerating the preparation of the Xinjiang Water Network Construction Plan, and vigorously promoting efficient and water-saving agriculture. These initiatives will deepen the reform of agricultural, industrial, and domestic water use and promote water conservation, efficiency, and green development.

3.2.2. Spatial Analysis

Figure 6 show the main impact drivers for the 14 prefectures and cities in Xinjiang. For each city, the policy investment effect was the most important positive pull factor, while the water use efficiency effect and the investment output effect were two important negative inhibitors. The Altay, Changji, and Bortala regions were more significantly inhibited by the investment output effect, while the water use efficiency effect showed stronger inhibition in the Turpan, Hami, and Aksu regions. Altay is one of the water-abundant regions in Xinjiang, relying on the three major water systems of the Irtysh River, the Ulungu River, and the Jimunai Mountain Stream. These rivers represent a significant investment in water conservation facilities. Changji realized the consecutive growth of social fixed asset investment from 2000 to 2018 and achieved significant growth in 2010, and Bortala relied on water conservation facilities such as the Jing River and the Bo River, with remarkable results for special agricultural products. The opening of the Central European and Central Asian trains provides convenient transportation conditions to achieve rapid economic growth. Science-based water efficiency and sound policy input programs can reduce the water footprint and ensure stable economic growth.

3.3. Individual Stochastic Convergence Analysis

Based on the results of the above analysis, it is clear that the main component of Xinjiang’s water footprint is the agricultural water footprint, and the water use efficiency effect, investment output effect, and policy support effect are the main driving factors. In this section, we tested the individual stochastic convergence trends to determine the future development trend of the region and further analyze the role of the above drivers. In this paper, a smoothness test was performed using the ZA test containing one breakpoint and the CMR test containing two structural breakpoints to determine whether the regional trend followed the existing inertia trend.

3.3.1. ZA Test

According to the results in Table 4, most regions maintain a smooth trend of development, showing individual stochastic convergence trends. The majority of time breakpoints in the test results occurred in 2016, consistent with the results of the water footprint evolution trend analysis in the previous section. The strictest water resource management system implemented in 2016 has had a significant impact on most regions in Xinjiang.

3.3.2. CMR Test

Tacheng, Karamay, and Turpan showed a trend of random dispersion. Considering that these regions may be subject to multiple policy shocks, this paper further determines the trend using a CMR test containing two structural breakpoints. The test results are shown in Table 5.
The results show that only the Karamay region exhibited stochastic dispersion, indicating that the shocks experienced by Karamay have a long-term effect and a profound impact on regional development. The structural breakpoint between Altay and Kizilsu occurred in 2009, when the main driver of the regional water footprint was the policy support effect. In the Altay region, breakthroughs were made in the construction of key water control projects, and the Kizigal Water Conservancy Hub Project completed an investment of 108 CNY and successfully achieved dam cut-off [48]. In Kizilsu, the aid policy to Xinjiang was effective, with cadres’ aid playing a leading role through comprehensive economic, cultural, scientific, and technological aid, as well as several aid projects in education, health, grassroots power, public infrastructure construction, etc. The policy has been successfully promoted, the infrastructure has been newly improved, and many major projects, such as those supporting water conservancy and people’s livelihoods, have been built. Although the policy support effect was manifested as a pull effect of water footprint growth, the region showed stochastic convergence, indicating that this pull was short-lived, while the convenience and benefits brought by water facilities were long-lasting, indicating the effectiveness of the investment. The year 2014 was a breaking point for the Urumqi, Changji, and Kashi regions. During this period, Urumqi actively promoted major infrastructure construction, implementing the central city water supply bottleneck transformation, drainage network reconstruction, and the Guangyuan Road regional water supply project. In the “new normal” situation of Changji, the deployment of “stable growth, promoting reform, adjusting the structure, and benefiting people’s livelihoods is in order. In Kashi, the industrial structure has changed significantly, among which the organization-driven model of “leading enterprises + cooperatives + farmers” has been actively promoted, and agricultural production has been greatly developed. In 2016, the pulling effect of investment output, economic structure, and policy support on the water footprints of the Hami, Bortala, Bayingolin, Aksu, Hotan, and Ili regions was apparent. However, all of these regions showed individual convergence, indicating that the positive push effect of policy investment and support on the water footprint of Xinjiang was short-lived, while the generated economic benefits were long-lived, which is generally consistent with the findings of Zhang Pei et al. [46]. Additionally, the conclusions of this study are generally consistent with the previous findings that agricultural water use is a breakthrough for water conservation in Xinjiang [10] and that improving water use efficiency will significantly inhibit the growth of the water footprint [11].
Although the policy support effect was expressed as a positive factor influencing water footprint growth, its impact was short-lived and will not affect the inertial trend of regional water footprint evolution. Therefore, it is important to fully leverage the key role of investment and fully realize its positive social benefits. The Xinjiang government has prioritized the regional water footprint as a focal point, focusing on the southern border to promote the construction of water conservancy facilities such as pivot projects, water diversion and transfer, river improvement, and large and medium-sized irrigation areas. The government is also actively expanding effective investment, harnessing the leading and amplifying effect of government investment, and encouraging and attracting more private capital to participate in the construction of major projects and projects to address shortcomings. These endeavors aim to promote the construction of water conservancy infrastructure, accelerate the implementation of many major projects to address shortcomings, strengthen functions, benefits people’s livelihoods, and achieve high-quality development in the region.

4. Conclusions

This paper identified the basic condition of water resources in regions of Xinjiang using water footprints and analyzed the driving factors from six dimensions: population size, policy support, investment output, economic structure, water use efficiency, and water use structure using the LMDI decomposition method. Finally, it determined the trajectory of the regional water footprint through individual stochastic convergence tests, conducted a policy effectiveness test, and drew the following conclusions:
  • The water footprint of the Xinjiang region showed the evolutionary characteristics of fluctuation and increase, and the total water footprint varied significantly between regions. From the perspective of water footprint composition, most regions were dominated by the agricultural water footprint. Regarding spatial distribution, the regional water footprint displayed a high trend in the south and a low trend in the north.
  • Among the driving effects of the water footprint, the policy support effect, population scale effect, and water use structure effect showed an incremental trend, while the water use efficiency effect, economic structure effect, and investment output effect were decremental. Among them, the policy support effect had the most significant positive driving effect, while the water use efficiency effect promoted the water-saving process to a greater extent. The optimal allocation and efficient use of water resources in Xinjiang should focus on strengthening agricultural water conservation technology and water conservation management as well as industrial structure adjustment.
  • Most regions in Xinjiang exhibit individual stochastic convergence trends, indicating that these regions converge to their respective compensating differential equilibrium levels. The stochastic convergence around structural breakpoints implies that policies dedicated to changing equilibrium differences and growth paths across regions and cities rather than nationally may be more effective. The timing of the emergence of structural breakpoints corresponded to regional historical events.

Author Contributions

Conceptualization, S.W. and X.G.; methodology, S.W.; software, S.W.; validation, S.W. and X.G.; formal analysis, S.W. and X.G.; investigation, X.G.; resources, X.L.; data curation, S.W. and X.G.; writing—original draft preparation, S.W.; writing—review and editing, X.L. and X.G.; visualization, X.G.; supervision, X.L.; project administration, X.L. and X.G.; funding acquisition, X.L. All authors have read and agreed to the published version of the manuscript.

Funding

This research was supported by the National Natural Science Foundation of China (grant number: 42071286) and the Third Xinjiang Scientific Expedition Program (grant number: 2021XJKK0406).

Data Availability Statement

Not applicable.

Conflicts of Interest

The authors declare no conflict of interest.

References

  1. Zhao, X.; Gao, Z.; Ma, Y.; Chen, H.; Xue, B. Spatio-temporal Coupling between Rural Water Poverty and Agricultural Modernization in China from 2005 to 2014. Sci. Geogr. Sin. 2018, 38, 717–726. [Google Scholar]
  2. Chen, Y.; Yang, Q.; Luo, Y.; Shen, Y.; Pan, X.; Li, L.; Li, Z. Ponder on the issues of water resources in the arid region of northwest China. Arid Land Geogr. 2012, 35, 1–9. [Google Scholar]
  3. Hoekstra, A.Y.; Gerbens-leenes, W.; van der Meer, T.H. Reply to Jongschaap et al.: The water footprint of Jatropha curcas under poor growing conditions. Proc. Natl. Acad. Sci. USA 2009, 106, E119. [Google Scholar] [CrossRef] [PubMed]
  4. Hoekstra, A.Y.; Hung, P.Q. Virtual Water Trade: A Quantification of Virtual Water Flows between Nations in Relation to International Crop Trade; IHE Delft: Delft, The Netherlands, 2002; pp. 203–209. [Google Scholar]
  5. Nie, Y.; Li, X.; Jiang, W.; Liu, N. Planting structure optimization of three main grain crops in 10 northern China provinces based on water footprint method. Resour. Sci. 2022, 44, 2315–2329. [Google Scholar] [CrossRef]
  6. Zhang, L.; Deng, X.; Long, A.; Gao, H.; Ren, C.; Li, Z. Spatial-temporal assessment of water resource security based on the agricultural water footprint: A case in the Hotan Prefecture of Xinjiang. Arid Zone Res. 2022, 39, 436–447. [Google Scholar]
  7. Huang, L.N.; Zhang, W.X.; Jiang, C.L.; Fan, X.Q. Ecological footprint method in water resources assessment. Acta Ecol. Sin. 2008, 28, 1279–1286. [Google Scholar]
  8. Jiang, Q.; Li, X.; Wang, Z.; Zhang, Y.; Cao, L. Research progress and prospects of water footprint and its driving force. Ecol. Sci. 2021, 40, 192–199. [Google Scholar]
  9. Ang, B.W.; Zhang, F.Q.; Choi, K.-H. Factorizing changes in energy and environmental indicators through decomposition. Energy 1998, 23, 489–495. [Google Scholar] [CrossRef]
  10. Xie, W.-B.; Tong, C.; Liu, G.Y. Decoupling Relationship and Effect Decomposition of Agricultural Water Resources Utilization and Economic Growth in Xinjiang, China. Water Sav. Irrig. 2018, 4, 69–72+77. [Google Scholar]
  11. Lei, B.; Su, T. Estimation of Water-saving Potential of Agricultural Irrigation in Main Grain Producing Areas of China. Water Sav. Irrig. 2019, 8, 130–133. [Google Scholar]
  12. Yang, Y.; Yang, J.; Xu, Y.; Zhao, X. Industrial water use change in Xinjiang based on LMDI method. Arid. Land Geogr. 2016, 39, 67–76. [Google Scholar]
  13. Guo, B.; Tang, L.; Zhang, H. Regional Differences and Influencing Factors of Water Resources Utilization Efficiency in Eight Comprehensive Economic Zones of China. Ecol. Econ. 2022, 38, 153–161. [Google Scholar]
  14. Lu, W.N.; Liu, J.Y.; Zhao, M.J. Dynamic Evolution and Convergence of Agricultural Water Use Efficiency in the Yellow River Basin from the Perspective of Green Development. J. Northwest A&F Univ. (Soc. Sci. Ed.) 2022, 22, 123–134. [Google Scholar]
  15. Zang, Z.; Zou, X.; Xi, X.; Zhang, Y.; Zheng, D.; Sun, C. Quantitative characterization and comprehensive evaluation of regional water resources using the Three Red Lines method. J. Geogr. Sci. 2016, 26, 397–414. [Google Scholar] [CrossRef] [Green Version]
  16. Payne, J.E.; Apergis, N. Convergence of per capita carbon dioxide emissions among developing countries: Evidence from stochastic and club convergence tests. Environ. Sci. Pollut. Res. 2020, 28, 33751–33763. [Google Scholar] [CrossRef]
  17. Huang, J.; Liu, C.; Chen, S.; Huang, X.; Hao, Y. The convergence characteristics of China’s carbon intensity: Evidence from a dynamic spatial panel approach. Sci. Total Environ. 2019, 668, 685–695. [Google Scholar] [CrossRef]
  18. Solarin, S.A. Convergence in CO2 emissions, carbon footprint and ecological footprint: Evidence from OECD countries. Environ. Sci. Pollut. Res. 2019, 26, 6167–6181. [Google Scholar] [CrossRef]
  19. Alataş, S.; Karakaya, E.; Sarı, E. The potential of material productivity alongside energy productivity in climate mitigation: Evidence from convergence tests in the EU28. Resour. Conserv. Recycl. 2021, 167, 105322. [Google Scholar] [CrossRef]
  20. Solarin, S.A.; Erdogan, S.; Okumus, I. Wavelet and Fourier augmented convergence analysis of methane emissions in more than two centuries: Implications for environmental management in OECD countries. Environ. Sci. Pollut. Res. 2022, 29, 54518–54530. [Google Scholar] [CrossRef]
  21. Bilgili, F.; Ulucak, R. Is there deterministic, stochastic, and/or club convergence in ecological footprint indicator among G20 countries? Environ. Sci. Pollut. Res. 2018, 25, 35404–35419. [Google Scholar] [CrossRef]
  22. Dong, W.; Yang, Y.; Zhang, X. Spatio-temporal Variation of Urban Development and Water Resource Benefit in Oasis Cities of Xinjiang. J. Desert Res. 2012, 32, 1463–1471. [Google Scholar]
  23. Zhang, Z.; Sun, H.; Su, Y.; He, Z. Water Use Efficiency and Its Influencing Factors in Arid Areas of Northwest China. J. Ecol. Rural Environ. 2017, 33, 961–967. [Google Scholar]
  24. Yao, J.; Zhao, Y.; Chen, Y.; Yu, X.; Zhang, R. Multi-scale assessments of droughts: A case study in Xinjiang, China. Sci. Total Environ. 2018, 630, 444–452. [Google Scholar] [CrossRef] [PubMed]
  25. Yin, L.; Zhang, J.; Jiang, J.; Zhang, P.; Gu, X.; Dong, J.; Guo, P.; Yang, B.; Li, Y. Issues and countermeasures on water resources in the Southern Xinjiang. Geol. China 2023, 50, 1–12. [Google Scholar]
  26. Egan, M. The Water Footprint Assessment Manual. Setting the Global Standard. Soc. Environ. Account. J. 2011, 31, 181–182. [Google Scholar] [CrossRef]
  27. Wu, P.; Sun, S.; Wang, Y.; Li, X.; Zhao, X. Research on the quantification methods for water footprint of crop production. J. Hydraul. Eng. 2017, 48, 651–660. [Google Scholar]
  28. Hoekstra, A.Y.; Chapagain, A.K. Water footprints of nations: Water use by people as a function of their consumption pattern. Water Resour. Manag. 2007, 21, 35–48. [Google Scholar] [CrossRef]
  29. Jing, M.A.; Wang, D.X.; Lai, H.L.; Wang, Y. Water Footprint—An Application in Water Resources Research. Resour. Sci. 2005, 5, 96–100. [Google Scholar]
  30. Xu, Z.; Long, A.; Zhang, Z. Virtual Water Consumption Calculation and Analysis of Gansu Province in 2000. Acta Geogr. Sin. 2003, 58, 861–869. [Google Scholar]
  31. Liu, N.; Li, H.; Bian, Z.; Liu, X. Influence factors of water footprint based on spatial panel STIRPAT Model: A case study of Shandong Province. Acta Ecol. Sin. 2022, 42, 9335–9347. [Google Scholar]
  32. Ang, B.W. LMDI decomposition approach: A guide for implementation. Energy Policy 2015, 86, 233–238. [Google Scholar] [CrossRef]
  33. Li, R.; Bai, Y.; Zhou, Y.; Huang, S.; Yan, Z.; Li, Y.; Zhao, H. Decoupling and decomposition of driving factors of water resources utilization and economic growth in the Yellow River Basin. Sci. Geogr. Sin. 2023, 43, 110–118. [Google Scholar]
  34. Wu, X.-Y.; Ren, J.-L.; Cheng, Y. Analysis on effect of industrial economic growth on water resources and spatial-temporal evolution in Shandong province. J. Nat. Sci. Hunan Norm. Univ. 2015, 38, 7–12. [Google Scholar]
  35. Zhang, S.; Su, X.; Singh, V.; Ayantobo, O.O.; Xie, J. Logarithmic Mean Divisia Index (LMDI) decomposition analysis of changes in agricultural water use: A case study of the middle reaches of the Heihe River basin, China. Agric. Water Manag. 2018, 208, 422–430. [Google Scholar] [CrossRef]
  36. Yang, J.; Chen, X.H. Quantification of the Driving Factors of Water Use in the Productive Sector Change Using Various Decomposition Methods. Water Resour. Manag. 2019, 33, 4105–4121. [Google Scholar] [CrossRef]
  37. Perron, P. The Great Crash, the Oil Price Shock, and the Unit Root Hypothesis. Econometrica 1989, 57, 1361–1401. [Google Scholar] [CrossRef] [Green Version]
  38. Nelson, C.R.; Plosser, C.I. Trends and Random Walks in Macroeconmic Time Series: Some Evidence and Implications. J. Monet. Econ. 1982, 10, 139–162. [Google Scholar] [CrossRef]
  39. Zivot, E.; Andrews, D.W.K. Further Evidence on the Great Crash, the Oil-Price Shock, and the Unit-Root Hypothesis. J. Bus. Econ. Stat. 1992, 10, 251–270. [Google Scholar]
  40. Zhang, Y.; Long, A.; Lv, T.; Deng, X.; Wang, Y.; Pang, N.; Lai, X.; Gu, X. Trends, Cycles, and Spatial Distribution of the Precipitation, Potential Evapotranspiration and Aridity Index in Xinjiang, China. Water 2023, 15, 62. [Google Scholar] [CrossRef]
  41. Perron, P.; Vogelsang, T. Nonstationarity and Level Shifts with an Application to Purchasing Power Parity. J. Bus. Econ. Stat. 1992, 10, 301–320. [Google Scholar]
  42. Liu, X.; Guo, P.; Qi, J.; Du, W.; Zhang, R.; Zhang, K. Spatio-temporal changes and driving forces in the ecological environment of Altay City determined using an MRSEI model. Arid Zone Res. 2023, 40, 1014–1026. [Google Scholar]
  43. Bu, X.; Zhang, Y.; Zhao, Y.; Li, Y. Analysis of land use change and driving forces in resource-based cities: A case study of Karamay City. J. Tianjin Norm. Univ. (Nat. Sci. Ed.) 2023, 43, 65–73. [Google Scholar]
  44. Tang, H.; Huang, F.; Ran, R.; Liu, Y. Mutual optimization of industrial structure and water utilization structure in the arid oasis city. J. Arid. Land Resour. Environ. 2017, 31, 26–31. [Google Scholar]
  45. Wu, B.; Du, M.; Mu, Z.; Gao, F.; Shen, R. Analysis on the variation of groundwater resources and influencing factors in Xinjiang plain area from 1956 to 2016. Adv. Water Sci. 2021, 32, 659–669. [Google Scholar]
  46. Zhang, P.; Long, A.; Hai, Y.; Deng, X.; Wang, H.; Liu, J.; Li, Y. Spatiotemporal variations and driving forces of agricultural water consumption in Xinjiang during 1988-2015: Based on statistical analysis of crop water footprint. J. Glaciol. Geocryol. 2021, 43, 242–253. [Google Scholar]
  47. Pang, N.; Deng, X.; Long, A.; Zhang, L.; Gu, X. Evaluation of the Resilience of the Socio-Hydrological System of the Tarim River Basin in China and Analysis of the Degree of Barriers. Sustainability 2022, 14, 7571. [Google Scholar] [CrossRef]
  48. Altai Municipal Government Work Report. 2010-06-13. Available online: http://alt.gov.cn/govxxgk/001001/2011-03-18/8592f937-c9b2-43b4-aee7-def1f42940a1.html (accessed on 1 June 2023).
Figure 1. Overview of the study area.
Systems 11 00349 g001
Figure 2. Research framework diagram.
Systems 11 00349 g002
Figure 3. Evolutionary trends in regions of Xinjiang. Note: (a) represents Urumqi, (b) represents Karamay, (c) represents Turpan, (d) representsHami, (e) represents Changji, (f) represents Ili, (g) represents Tacheng, (h) represents Altay, (i) represents Bortala, (j) represents Bayingolin, (k) represents Aksu, (l) represents Kizilsu, (m) represents Kashi, and (n) represents Hotan.
Systems 11 00349 g003
Figure 4. Spatial distribution of water footprints in Xinjiang.
Systems 11 00349 g004
Figure 5. Composition of water footprint impact drivers in Xinjiang.Note: (a) represents Urumqi, (b) represents Karamay, (c) represents Turpan, (d) represents Hami, (e) represents Changji, (f) represents Ili, (g) represents Tacheng, (h) represents Altay, (i) represents Bortala, (j) represents Bayingolin, (k) represents Aksu, (l) represents Kizilsu, (m) represents Kashi, and (n) represents Hotan.
Systems 11 00349 g005
Figure 6. Cumulative effect of the decomposition effect of water footprint in Xinjiang.
Systems 11 00349 g006
Table 1. Description of the decomposition effect.
EffectSourceDecompositionSymbol
Population scale effectPopulation size denotes the scale effect of population increase P i t P i t
Policy support effectConsider regional differences in investment amounts, expressed as per capita investment amounts to enhance comparability F i t P i t F P i t
Investment output effectThe ratio of GDP to the amount of investment, indicating the economic output generated by the amount of investment G i t F i t G P i t
Economic structure effectRatio of primary sector value added to GDP, indicating the structure of the economy V i t G i t S i t
Water use efficiency effectRatio of water use in primary production to value added in primary production, indicating water use efficiency C i t V i t W I i t
Water use structure effectThe inverse of the proportion of water used in primary production, indicating the structure of water use W i t C i t W S i t
Note: i represents a city in Xinjiang; t represents the year.
Table 2. Description of the decomposition effect.
Region W F a g r WFind W F e c o WFpeoTotal
CropLivestockTotal
Urumqi16.730.0516.7836.9311.6531.7797.13
Karamay8.070.018.0718.2724.734.3755.44
Turpan31.540.0531.599.767.914.4253.68
Hami66.470.0466.5111.488.586.1592.72
Changji432.960.31433.2731.6110.5712.44487.89
Ili614.070.56614.6326.9812.3123.19677.10
Tacheng284.980.17285.1511.0215.908.48320.56
Altay87.240.1387.365.73106.244.25203.58
Bortala79.230.0379.263.662.734.0089.65
Bayingolin374.140.11374.2521.7852.3312.14460.50
Aksu573.770.19573.9724.436.4714.59619.45
Kizilsu55.610.0755.682.443.213.9665.30
Kashi766.860.34767.2114.5921.8324.25827.89
Hotan230.300.11230.415.8236.6610.09282.98
Table 3. Decomposition effect of water footprint drivers in Xinjiang, 2000–2020 (108 m3).
Year Δ W Δ P Δ F P Δ G P Δ S Δ W I Δ W S
2000–2001−45.11−1.5524.05−2.79−10.85−8.86−45.11
2001–2002−2.262.9814.39−2.99−1.53−12.85−2.27
2002–20034.512.3228.69−5.11−4.54−21.374.52
2003–20040.622.9414.289.54−12.20−14.540.60
2004–20051.462.926.9920.51−5.68−24.781.50
2005–200615.722.9438.76−12.80−13.43−15.3715.63
2006–2007−4.490.7928.62−0.87−0.05−24.98−8.00
2007–200825.423.3825.8810.25−13.72−22.0221.66
2008–20097.943.7136.86−38.3326.82−27.466.33
2009–201010.133.9647.04−4.31−0.64−44.758.82
2010–2011−0.963.9770.16−30.47−16.85−28.600.83
2011–20123.492.2762.79−33.941.15−15.61−13.17
2012–20135.293.9654.98−32.86−1.42−8.87−10.49
2013–201463.885.8145.98−28.16−9.69−17.0566.98
2014–2015−15.67−0.4127.52−21.717.89−16.97−11.98
2015–2016−72.72−1.26−4.08−5.3714.80−4.09−72.72
2016–201779.58−2.2042.31−14.82−38.54−0.8393.65
2017–2018−36.12−0.7638.44−7.56−2.83−39.54−23.87
2018–2019−1.74−0.7031.22−22.78−37.0439.59−12.03
2019–20200.14−0.7027.68−23.4422.48−16.18−9.69
Total39.1240.75702.93−233.28−109.60−368.416.73
Table 4. ZA test results of various cities in Xinjiang.
RegionLagBreakpointstResult
InterceptTrendBoth
Urumqi02014−6.070 ***−3.841−5.662 **stable
Karamay02016−3.684−3.774−3.971unstable
Turpan02017−3.265−2.713−3.021unstable
Hami02016−5.116 **−3.601−5.919 ***stable
Changji02013−4.398−4.449 **−4.617stable
Ili02017−3.701−4.807 **−4.628stable
Tacheng02016−4.481−3.744−4.461unstable
Altay02011−4.898 **−3.290−10.903 ***stable
Bortala02016−5.059 **−4.516 **−5.854 ***stable
Bayingolin12016−5.818 ***−4.459 **−8.539 ***stable
Aksu02016−4.720 *−4.445 **−5.764 ***stable
Kizilsu02009−3.438−4.727 **−4.653stable
Kashi02014−5.366 ***−4.097−5.064 *stable
Hotan02015−4.876 **−3.800−4.700stable
Note: The selection of the lag period was performed using the BIC criterion; * represents it’s significant at the 10% level; ** represents it’s significant at the 5% level; *** represents it’s significant at the 1% level.
Table 5. CMR test results in various cities of Xinjiang.
RegionBreakpointstResult
d1d2
Turpan20132015−11.798 **Stable
Tacheng20112014−6.457 **Stable
Karamay20082012−4.040Unstable
Note: Critical value t = −5.490 at a 5% confidence level, ** indicates significance at a 5% confidence level.
Disclaimer/Publisher’s Note: The statements, opinions and data contained in all publications are solely those of the individual author(s) and contributor(s) and not of MDPI and/or the editor(s). MDPI and/or the editor(s) disclaim responsibility for any injury to people or property resulting from any ideas, methods, instructions or products referred to in the content.

