Article

Do Environmental Taxes Affect Carbon Dioxide Emissions in OECD Countries? Evidence from the Dynamic Panel Threshold Model

1
School of Business, King Faisal University, Al Ahsa 31982, Saudi Arabia
2
College of Business Administration, Northern Border University, Arar 91411, Saudi Arabia
3
Central Bank of Tunisia, Tunis 1080, Tunisia
*
Author to whom correspondence should be addressed.
Systems 2023, 11(6), 307; https://doi.org/10.3390/systems11060307
Submission received: 10 May 2023 / Revised: 7 June 2023 / Accepted: 12 June 2023 / Published: 14 June 2023

Abstract

:
The latest decades have been marked by rapid climate change and global warming due to the release of greenhouse gas emissions into the atmosphere. Environmental taxes have emerged as a cost-effective way to tackle environmental degradation. However, the effectiveness of environmental taxes in reducing pollution remains a topic of ongoing debate. The purpose of this paper is to examine empirically the effects of various environmental tax categories (energy, pollution, resource and transport) on CO2 emissions in 34 OECD countries between 1995 and 2019. The dynamic panel threshold regression developed by Seo and Shin (2016) is implemented to assess whether the impact of environmental taxes on CO2 emissions depends on a given threshold level. The locally weighted scatterplot smoothing analysis provides evidence for a nonlinear association between environmental taxes and CO2 emissions. The analysis indicates the existence of one significant threshold and two regimes (lower and upper) for all environmental tax categories. The dynamic panel threshold regression reveals that the total environmental tax, energy tax and pollution tax reduce CO2 emissions in the upper regime, i.e., once a given threshold level is reached. The threshold levels are 3.002% of GDP for the total environmental tax, 1.991% for the energy tax and 0.377% for the pollution tax. Furthermore, implementing taxes on resource utilization may be effective but with limited environmental effects. Based on the research results, it is recommended that countries in the OECD implement specific environmental taxes to reduce greenhouse gas emissions.

1. Introduction

The importance of sustainable development has been increasingly recognized in light of the growing environmental challenges and their implications for humanity. The concerns about global warming have been particularly heightened during recent decades due to the deterioration of climatic indicators. Indeed, ref. [1] has recently emphasized that 2015–2022 were the warmest years on record. The report projected that by the end of 2022, the global mean temperature would be 1.15 °C higher than the pre-industrial mean. The previous few decades have also been marked by a tremendous increase in sea levels. Ref. [2] revealed that rising sea levels globally occur at rates that have never been seen in the past 2500 years. Another record has been noted for carbon dioxide (CO2) concentration in the atmosphere, which was 417.2 parts per million in 2022, more than 50% over pre-industrial levels [3]. Furthermore, statistics of ref. [4] indicated that greenhouse gas emissions increased from 32,523.58 in 1990 to 49,758.23 megatons of carbon dioxide equivalent per year in 2019. Even though CO2 emissions made up nearly two-thirds of all greenhouse gas emissions in 2021, other gases, including methane, are also destructive and are increasing their contribution to global warming. With the rapid global warming and biodiversity loss, the international community has recognized the need to establish an economic model that can provide the needs of humans without damaging the planet. Scholars have long concentrated on analyzing policies and measures to help reduce environmental degradation and mitigate climate change and global warming. Some studies focused on the role of energy transition [5,6,7], financial development [8,9,10], human capital [11,12,13], economic openness [14,15,16], and innovation [17,18,19].
Environmental taxes have emerged as a potential option that could curb environmental degradation. As reported by [20], only a few countries implemented environmental taxes unilaterally in the 1990s. The situation has continuously changed, with environmental taxes playing a more significant role in climate change mitigation efforts. For example, total environmental tax revenue in the European Union represented 2.2% of the Gross Domestic Product (GDP) in 2020 [21]. Environmental taxes can be implemented in various forms, including taxes on energy, transport, resources, etc. Taxes on energy products, such as fossil fuels and electricity, are particularly important in lowering energy demand and reducing greenhouse gas emissions. This statement may be easily observed in Figure 1, which depicts the evolution of environmental tax revenues as a share of GDP among Organisation for Economic Cooperation and Development (OECD) members between 1995 and 2019. The environmental tax revenue was mainly dominated by energy tax, which represented about two-thirds of environmental tax revenue. The figure also shows that the transport tax is the second most important environmental tax, representing about 0.4% of GDP, while the contributions of the pollution tax and resource tax were relatively weak.
The literature on the impact of taxes on environmental sustainability is relatively recent. Most panel data studies concentrated on developed countries due to data availability. In addition, developed countries are most likely to have implemented environmental taxes. For instance, ref. [23] examined the impact of environmental taxes on CO2 emissions in the Group of Seven (G7) between 1994 and 2014 using cointegration and causality techniques. However, there has been a shortage of research examining the effectiveness of environmental taxes in mitigating climate change and preserving the ecology [24,25].
The main objective of this study is to empirically examine the impact of environmental taxes on CO2 emissions in 34 OECD countries from 1995 to 2019. The empirical analysis considers the effects of total environmental taxes on CO2 emissions. Then, it sheds light on different environmental tax categories, namely taxes on energy, taxes on pollution, taxes on transport, and taxes on resources. Such disaggregation will allow identifying the impact of each tax on the environment and, consequently, the design of suitable environmental policies that may help reduce environmental degradation in OECD countries. The selection of OECD countries is motivated by many considerations. On the one hand, OCED countries exhibit high pollution levels, positioning them among the top polluting countries globally. According to data from ref. [26], approximately 35% of worldwide carbon dioxide emissions in 2019 were generated by OECD countries. On the other hand, OECD countries implemented a wide range of environmental taxes, including transport, energy and pollution taxes. Consequently, conducting an analysis to determine whether various tax categories have different effects on CO2 emissions in this group of countries would be of importance. The selection of OECD countries is finally dictated by the availability of data for those countries over a long period, which is mandatory for carrying out the empirical analysis. The study period is also dictated by data availability.
This study contributes to the existing literature in many ways. First and foremost, the study investigates whether environmental taxes have a nonlinear impact on the environment and whether their effectiveness only becomes significant once a certain threshold is exceeded. To this end, the study performs a panel data threshold analysis utilizing the first-differenced generalized method of moments (GMM) estimate of the dynamic panel threshold model developed by ref. [27] and detailed by ref. [28]. According to ref. [29], the dynamic panel threshold model developed by ref. [27] has many advantages compared to previous models. On the one hand, the model allows for solving the endogeneity problem as it is based on the GMM estimator. On the other hand, the model includes the lagged dependent variable among the explanatory variables, which allows testing the dynamic feature of the environmental adjustment process. It is, therefore, possible to assess whether environmental quality in year t depends on environmental quality in year t − 1. The endogeneity problem due to the inclusion of the lagged dependent variable is also resolved using the GMM-based estimator. Finally, the used dynamic panel threshold model outperforms the previous threshold models by allowing both the threshold variable and the regressors to be endogenous [27]. Different from the few empirical studies implementing the threshold analysis to examine the impact of environmental taxes on the environment, such as refs. [30,31,32], the used threshold model allows for estimating the impact of all explanatory variables (environmental taxes and control variables) for the different regimes. The econometric techniques employed by the studies above allowed for estimating the effect of environmental taxes for the different regimes, while the impact of control variables is common to both regimes. As emphasized by [33], the dynamic panel threshold model proposed by ref. [27] provides robust and efficient estimates in the presence of endogeneity, heteroscedasticity, and simultaneity. By doing so, the dynamic panel threshold model developed by ref. [27] will improve the estimation output and allows a better understanding of the impact of taxation on the environment. Second, the present research assesses not only the effects of total environmental taxes on the environment but also various environmental tax categories: energy, pollution, transport, and resources. This analysis is crucial because it allows identifying which tax permits lowering emissions and protecting the environment. Such conclusions are crucial for the design of policy recommendations on the environmental taxation policy in OECD countries. It is worth noting that few studies, including ref. [31], conducted a disaggregate analysis when examining the effects of taxes on the environment.
The remainder of this research is structured as follows. Section 2 summarizes the related literature, while Section 3 and Section 4 present the methodology and data, respectively. The empirical findings are discussed in Section 5. Finally, Section 6 concludes the research and provides policy recommendations and limitations.

2. Literature Review

Environmental taxes have emerged as a cost-effective way to reduce pollution and environmental degradation. Environmental taxes are a class of Pigouvian tax, which is defined by ref. [34] as “taxation used to control an externality-generating activity”. According to ref. [35], an externality occurs when a market transaction impacts someone other than the buyer and the seller. In the case of environmental taxation, the negative externality consists of pollution. According to ref. [36], imposing a tax on the externality-generating good can correct the externality. Environmental taxes may affect the environment via two main channels. First, environmental taxes raise government revenues and stimulate environmental technology innovation [37]. Both factors will speed up the transition to an economy with net-zero emissions. Second, imposing a fossil fuel energy tax causes energy prices to rise and demand to fall [23]. The fall in fossil fuel energy demand leads to reduced greenhouse gas emissions and improved environmental quality. Another strand of the literature highlights that environmental regulation, particularly taxes, can be counterproductive and adversely affect the ecology. Partisans of the so-called “Green Paradox” indicated that environmental taxes result in a rise in fossil fuel energy and are therefore targeting the demand side of fossil fuel [38]. Because there is a time lag between environmental policy and its implementation, there will be fear on behalf of fossil fuel suppliers, which will accelerate their extraction activities, leading to higher energy demand and environmental degradation [24].
A recent uptick in empirical studies has been conducted to complement the theoretical literature on the role of environmental taxes in lowering greenhouse gas emissions and improving the environment. Most studies attempted to assess the effects of the total environmental tax on CO2 emissions using cointegration and causality techniques. For example, [23] analyzed the long-run impact of environmental taxes on CO2 emissions in G7 using the Pedroni cointegration test and fully-modified ordinary least squares (FMOLS) technique. The empirical findings indicated that environmental taxes cut CO2 emissions, and enterprises will shift to cleaner production processes if strict environmental tax regulations are implemented. The same sample of countries has been studied by ref. [39], who used a battery of econometric techniques: panel cointegration, panel causality and the Method of Moment Quantile Regression (MMQR). The findings corroborate ref. [23], as higher environmental taxes are associated with low carob dioxide emissions. Moreover, the MMQR reveals that the impact of environmental taxes on CO2 emissions increases when the level of CO2 emissions increases. In addition, ref. [40] analyzed the impact of the total environmental tax on CO2 emissions in a sample of emerging countries (Brazil, India, Indonesia, Mexico, China, Russia, and Turkey) between 1995 and 2018. The Augmented Mean Group results are similar to ref. [24] since imposing environmental tax reduces CO2 emissions. The conclusions have been further confirmed by the cross-sectionally augmented autoregressive distributed lag (CS-ARDL) and Common Correlated Effects Mean Group estimators. Ref. [41] also investigated the role of environmental tax in reducing fine particulate matter (PM2.5) in selected Asian countries using the CS-ARDL and concluded the existence of a negative association between them in both the short and long-run. Ref. [42] investigated the effects of environmental taxes on environmental quality, as measured by CO2 emissions and the ecological footprint, in Turkey from 1994 to 2019. The findings indicate that enacting an environmental tax does not significantly affect the environmental quality over the long-run. Ref. [43] analyzed the effects of environmental taxes on CO2 emissions in E7 countries (Brazil, China, India, Indonesia, Mexico, Russia, and Turkey) from 2000 to 2020. The findings of the Driscoll-Kraay and quantile-on-quantile techniques show that environmental taxes reduce CO2 emissions. Finally, ref. [44] explored the impact of environmental regulations on environmental quality in a sample of 10 OECD countries between 1990 and 2015. The analysis confirms that environmental regulations play a significant long-run role in protecting the ecology. Based on the theoretical discussion, one could formulate the following hypothesis:
H1: 
Environmental taxes allow reducing CO2 emissions in OECD countries.
Another strand in the literature has instead focused on the effect of different environmental tax categories on environmental quality. Ref. [45] analyzed the effects of car registration tax and transport tax on CO2 emissions in a sample of north Mediterranean countries between 2008 and 2018. The FMOLS and DOLS suggest that both taxes play an important role in curbing emissions, particularly in the long-run. Ref. [24] explored the effects of total environmental tax and energy tax on CO2 emissions in selected emerging economies (Czech Republic, Greece, Hungary, Korea, Poland, South Africa, and Turkey) between 1994 and 2015 using the Augmented Mean Group, FMOLS and causality analyses. The findings suggest that total environmental and energy taxes reduce CO2 emissions. Furthermore, ref. [46] analyzed the impact of environmental taxes and stringent policies on CO2 emissions in 20 European countries between 1995 and 2012. The findings are similar to those of [24], as higher revenues from the total environmental tax, energy tax and transport tax are associated with lower CO2 emissions. Ref. [47] investigated the response of CO2 emissions to fuel tax in Turkey during the period 1985–2018 based on the asymmetric nonlinear cointegration test developed by ref. [48]. The results show no statistically significant environmental impact of fuel tax in both the short- and long-run. Ref. [49] analyzed the effects of transport tax on the ecological footprint in G7 between 1994 and 2016. The empirical analysis derived from second-generation panel data techniques confirms that transport tax improves environmental quality only in the long-run. The short-run effects of transport tax are found to be statistically not significant. The following hypothesis can be derived from the previous literature review:
H2: 
The impacts of environmental taxes on CO2 emissions in OECD countries depend on the tax category.
The previous literature review suggests that most studies are based on cointegration-based techniques. They implicitly assume that the impact of environmental taxes on air pollution is monotonic, whatever the level of environmental tax. Nevertheless, few studies highlighted that taxes reduce environmental degradation once they reach a given threshold. For instance, [30] used the Panel Smooth Threshold Regression (PSTR) to analyze the effect of total environmental taxes on CO2 emissions in 26 OECD countries. The study confirms the nonlinear relationship between taxes and CO2 emissions. Moreover, the empirical analysis suggested that environmental taxes cut CO2 emissions below the threshold of 2.67%, above which they raise emissions. These findings have been confirmed by ref. [50] for BRICS countries (Brazil, Russia, India, China and South Africa) using the PSTR. The authors concluded that environmental taxes increase CO2 emissions when taxes are below the threshold. Both studies explained the empirical results by the validity of the green paradox. Ref. [32] also analyzed the nonlinear effects of environmental taxes on the ecology in EU-15 countries (Belgium, Denmark, Germany, Finland, France, Greece, Ireland, Italy, Luxembourg, Netherlands, Austria, Portugal, Spain, the United Kingdom and Sweden) using the PSTR. The findings show that environmental taxes reduce ecological deficits after reaching a specific threshold. Ref. [31] also examined the impact of taxes on environmental degradation in the same sample of countries using the dynamic panel threshold regression model developed by ref. [51]. This study has the particularity of considering the effects of total environmental taxes and different categories of taxes. The analysis confirms that total environmental tax reduces CO2 emissions when tax exceeds a given threshold. The same conclusion holds for energy, pollution, and resource taxes, while transport tax has no significant effects. While this study is the closest to ours, it only concentrated on a limited number of countries and employed the threshold model of ref. [51], which does not account for endogeneity, heteroscedasticity, and simultaneity. Based on the discussion above, one could develop the following hypothesis:
H3: 
The impact of environmental taxes on CO2 emissions in OECD countries becomes significant after exceeding a specific tax threshold.
The above literature review may give rise to two primary points. First, most studies conducted an aggregate analysis where the impact of the total environmental tax on environmental quality is estimated. Few empirical investigations have examined the potential environmental impacts of specific taxation policies, such as those on energy and transportation. Second, it is commonly assumed in various studies that the effect of environmental taxes on the environment is uniform and does not exhibit any variation across different levels of environmental tax. The present study accounts for these issues and aims to analyze the impact of environmental taxes on CO2 emissions by extending the sample to include all OECD countries for which data are available, considering different categories of environmental taxes. Moreover, we employ a better estimation methodology based on the first-differenced GMM estimate of the dynamic panel threshold model recently developed by refs. [27]. This estimation technique provides estimates for all coefficients, including control variables, in both the lower and higher regimes while taking endogeneity, heteroscedasticity, and simultaneity into account.

3. Methodology

To assess the effects of taxes on environmental degradation, the present study is based on the well-known STochastic Impacts by Regression on Population, Affluence, and Technology (STIRPAT) model. The STIRPAT model can be expressed in the following form:
I t = α P t θ A t ϑ T t σ ϵ t
where I stands for the environmental quality indicator, P population, A affluence and T technology. In logarithmic form, an alternative representation of Equation (1) may be written as follows:
ln I t = α + θ ln P t + ϑ ln A t + σ ln T t + ϵ t
In Equation (2), I is CO2 emissions, P is urbanization, A is GDP per capita, and T is energy intensity. The model in Equation (2) is also augmented by two additional control variables: GDP per capita squared to verify the validity of the Environmental Kuznets Curve (EKC) hypothesis and patents on environmental technologies to assess the importunate of innovation in curbing climate change [52]. Additionally, we introduce a variable measuring the environmental tax. Equation (2) may be therefore written as follows:
ln C O 2 t = α + θ ln u r b t + ϑ ln g d p t + δ ln g d p t 2 + σ ln i n t s t + ρ ln p a t i , t + τ ln t a x t + ϵ t
where u r b , g d p , g d p 2 , i n s t , p a t and t a x represent the urbanization rate, GDP per capita, GDP per capita squared, energy intensity, patents on environmental technologies and environmental taxes, respectively. Following many recent studies, including refs. [53,54], the present study considers the potential dynamics between the variables, which allows for capturing the country’s heterogeneity and addressing the endogeneity issue, among others [55]. Considering the dynamic nature of the relationship and the panel data structure, the model in Equation (3) is transformed and may be written as follows:
ln C O 2 i , t = α + φ ln C O 2 i , t 1 + ϑ ln g d p i , t + δ ln g d p i , t 2 + θ ln u r b i , t + σ ln i n t s i , t + ρ ln p a t i , t + τ ln t a x i , t + ϵ i , t
where C O 2 i t 1 represents lagged CO2 emissions, and i represents countries under consideration.
Finally, the model in Equation (4) is transformed to account for the possible threshold effects when estimating the impact of environmental taxes on CO2 emissions. As discussed previously, the present study employs the dynamic panel threshold model proposed by ref. [27], which is estimated by the first-differenced GMM technique. Accordingly, the dynamic panel threshold regression approach is implemented to assess whether the impact of environmental taxes on CO2 emissions depends on a given threshold level γ (that will be calculated). Such an analysis enables estimating the effects of environmental taxes on CO2 emissions before and after a specific threshold point of taxation. Taking into account the threshold level γ for environmental tax, Equation (4) may be written as follows:
Lower regime
ln C O 2 i , t = α i + φ 11 ln C O 2 i , t 1 + ϑ 11 ln g d p i , t + δ 11 ln g d p i , t 2 + θ 11 ln u r b i , t + σ 11 ln i n t s i , t + ρ 11 ln p a t i , t + τ 11 ln t a x i , t + ϵ i , t i f   t a x i , t γ
Upper regime
ln C O 2 i , t = α i + φ 21 ln C O 2 i , t 1 + ϑ 21 ln g d p i , t + δ 21 ln g d p i , t 2 + θ 21 ln u r b i , t + σ 21 ln i n t s i , t + ρ 21 ln p a t i , t + τ 21 ln t a x i , t + ω i , t i f   t a x i , t > γ
Equations (5) and (6) represent two different regimes that will be distinguished according to the tax threshold variable determined endogenously. For a regime below or above the threshold level γ , the effects of not only environmental tax on CO2 emissions will be estimated, but also those of control variables.

4. Data

The present study aims to estimate the effects of environmental taxes on environmental quality in 34 OECD countries from 1995 to 2019. The selection of countries and the study period have been dictated by data availability. The list and classification of countries included in the empirical analysis are reported in Table 1.
Environmental quality is measured by CO2 emissions from the U.S. Energy Information Administration. Despite the existence of other environmental indicators, the CO2 emissions indicator is preferred because it is available for all countries under consideration. Concerning environmental tax, we follow many previous studies, such as [31,46], by employing environmental tax revenue as a share of GDP. As mentioned previously, one of the contributions of the present study is to consider different environmental tax categories. More specifically, the analysis considers total environmental tax revenue, energy tax revenue, resource tax revenue, pollution tax revenue and transport tax revenue. All these variables are taken as a share of GDP. Table 2 reports the definition of the different environmental taxes.
In order to assess the implementation of environmental taxes among the countries being examined, a Tukey’s test is employed. Tukey’s pairwise comparison test is performed to identify the country-specific pairwise differences of disaggregated environmental taxes between countries. Figure 2 reports the different plots.
Panel I of Figure 2 suggests that the mean average CO2 emissions are higher for the United States than other countries, while Estonia has the lowest mean CO2 emission during the studied period. According to Panel II, Denmark exhibits the highest mean average total environmental tax revenue compared to all other countries, while Colombia reports the lowest mean total environmental tax revenue. In Panel III, we report Tukey’s pairwise comparison test for the energy tax revenue. Slovenia has a comparatively higher mean average energy tax revenue than other countries, while the United States reports the lowest mean value. Panel IV shows that the mean average pollution tax revenue in France is higher than in other countries, while Chili, Turkey, Costa Rica, and Luxembourg report the lowest mean revenue. In Panel V, the mean average resource tax revenue for the Netherlands is higher than other countries. Finally, Panel VI indicates that the mean average transport tax revenue for Denmark is higher than all other countries, while the lowest is recorded for Colombia. In summary, Tukey’s pairwise comparison test suggests significant differences between countries with respect to the implementation of environmental taxes.
In addition to environmental taxes, the specification includes several control variables selected based on the STIRPAT model previously discussed. GDP per capita is included in the specification as a potential determinant of environmental degradation. Moreover, the square of GDP per capita is also included to assess the validity of the Environmental Kuznets Curve hypothesis. In addition, the urban population is also incorporated as a proxy of P in the STIRPAT model. It is expected that a highly urbanized population will result in a rise in energy consumption, thereby amplifying the emission of greenhouse gases and causing a decline in environmental quality. On the contrary, urbanization can result in more efficient transportation and energy consumption, thereby enhancing the environment. Additionally, the model incorporates energy intensity as a proxy of T in the STIRPAT model, computed as the amount of energy consumption to GDP and extracted from the U.S. Energy Information Administration. Finally, we also include a variable measuring the number of environmental patents. Indeed, patents on environmental technologies enhance the use of renewable energy sources and improve environmental quality [52]. Table 3 provides more details on variables used in the empirical investigation.

5. Results and Discussion

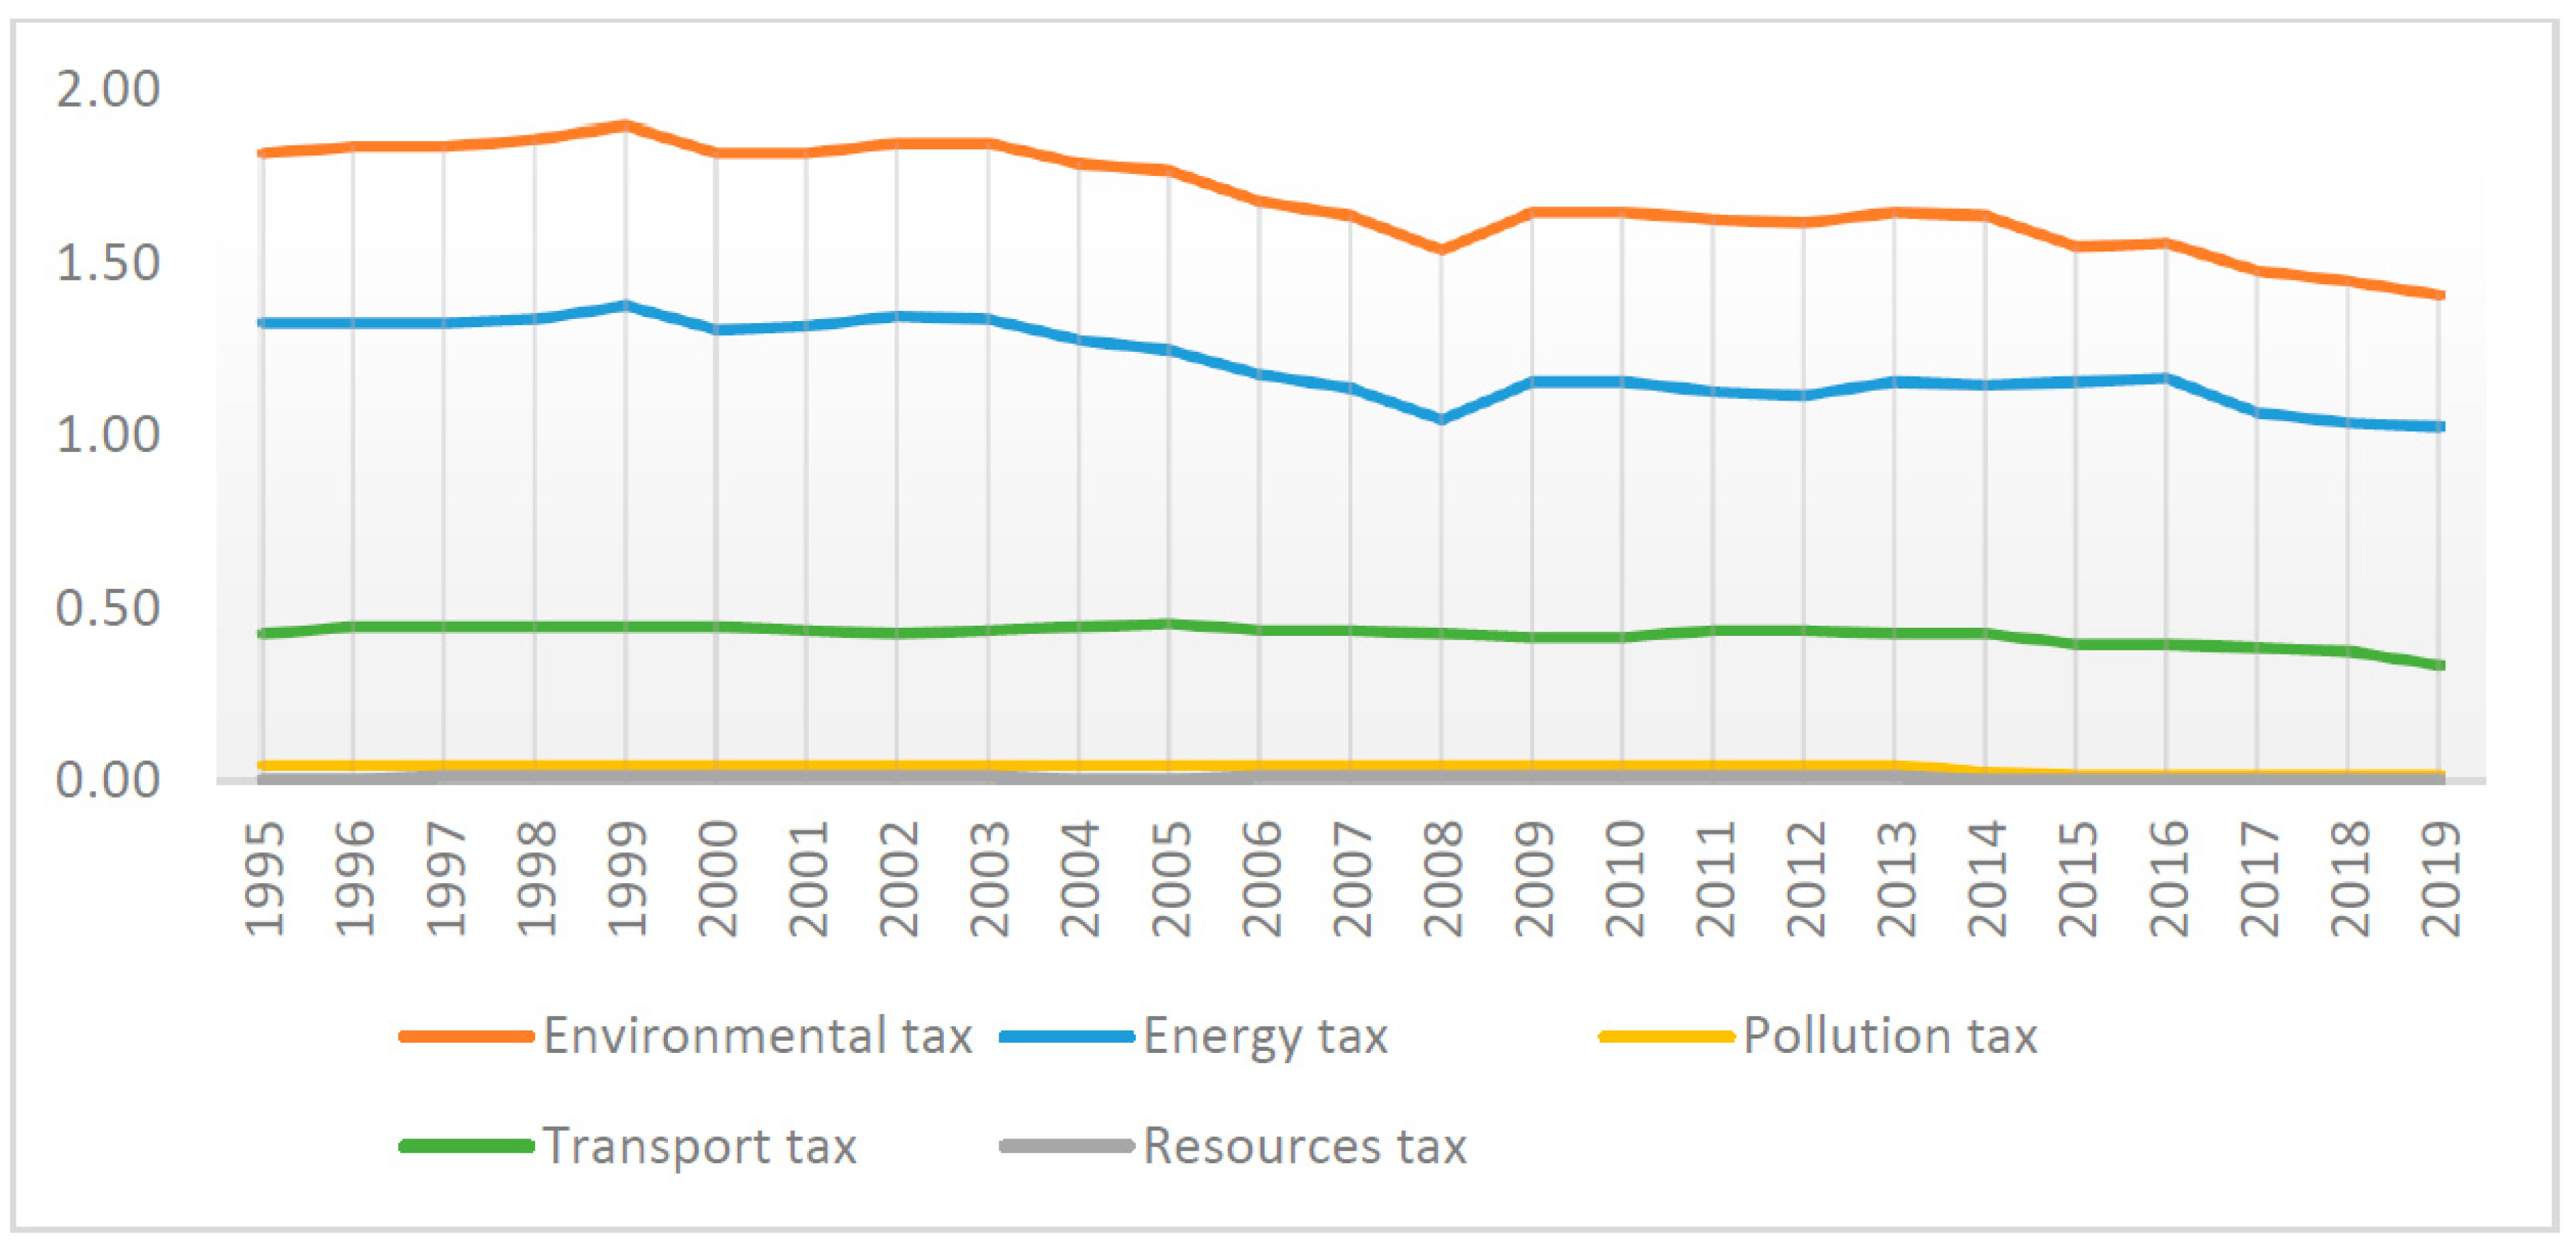
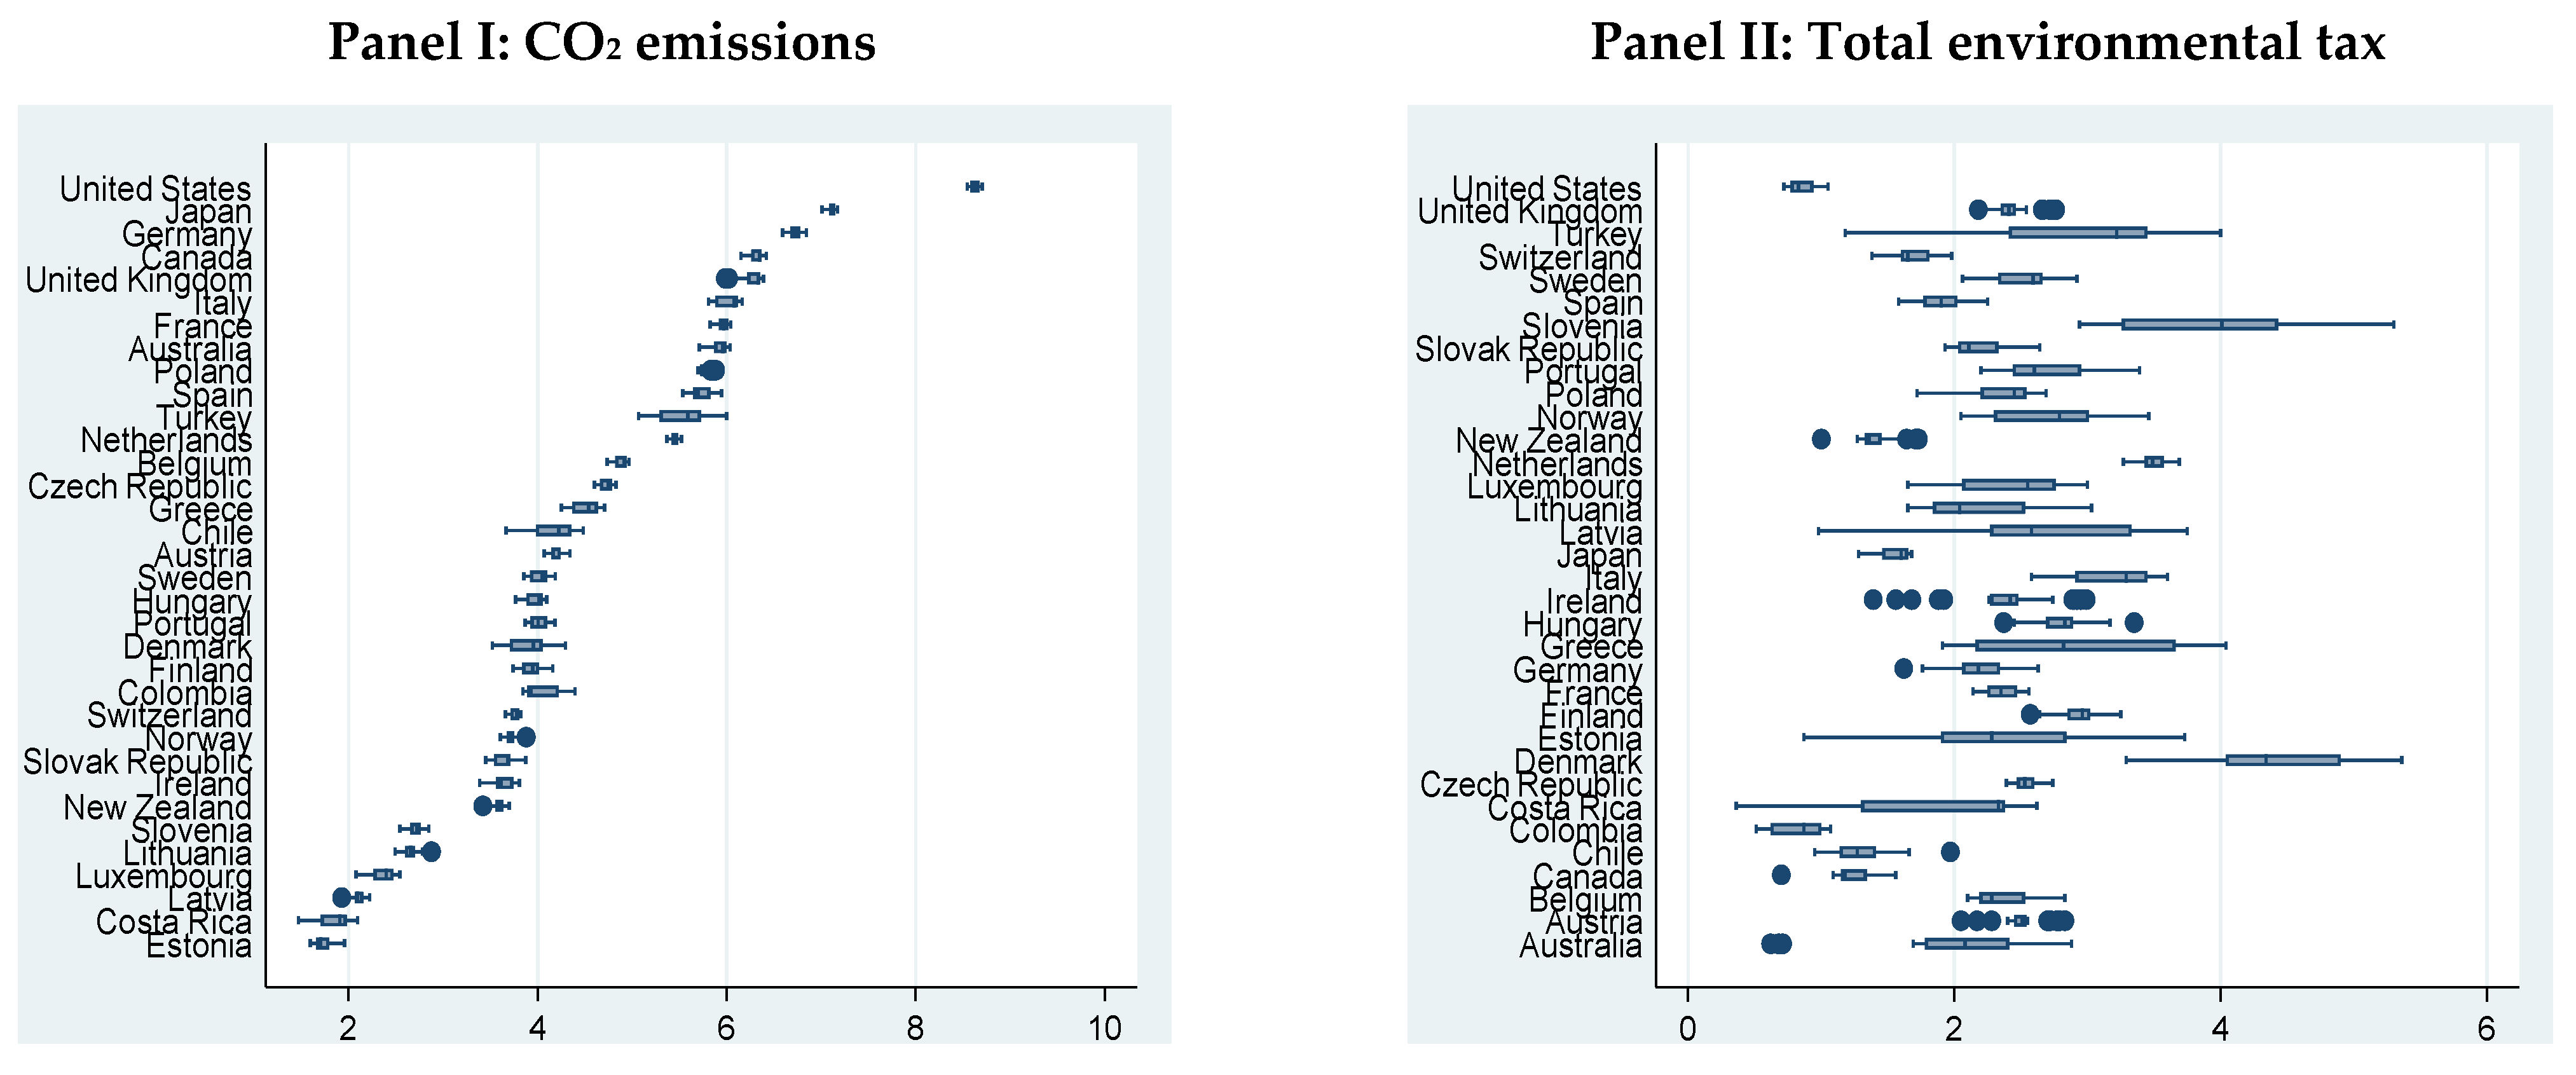
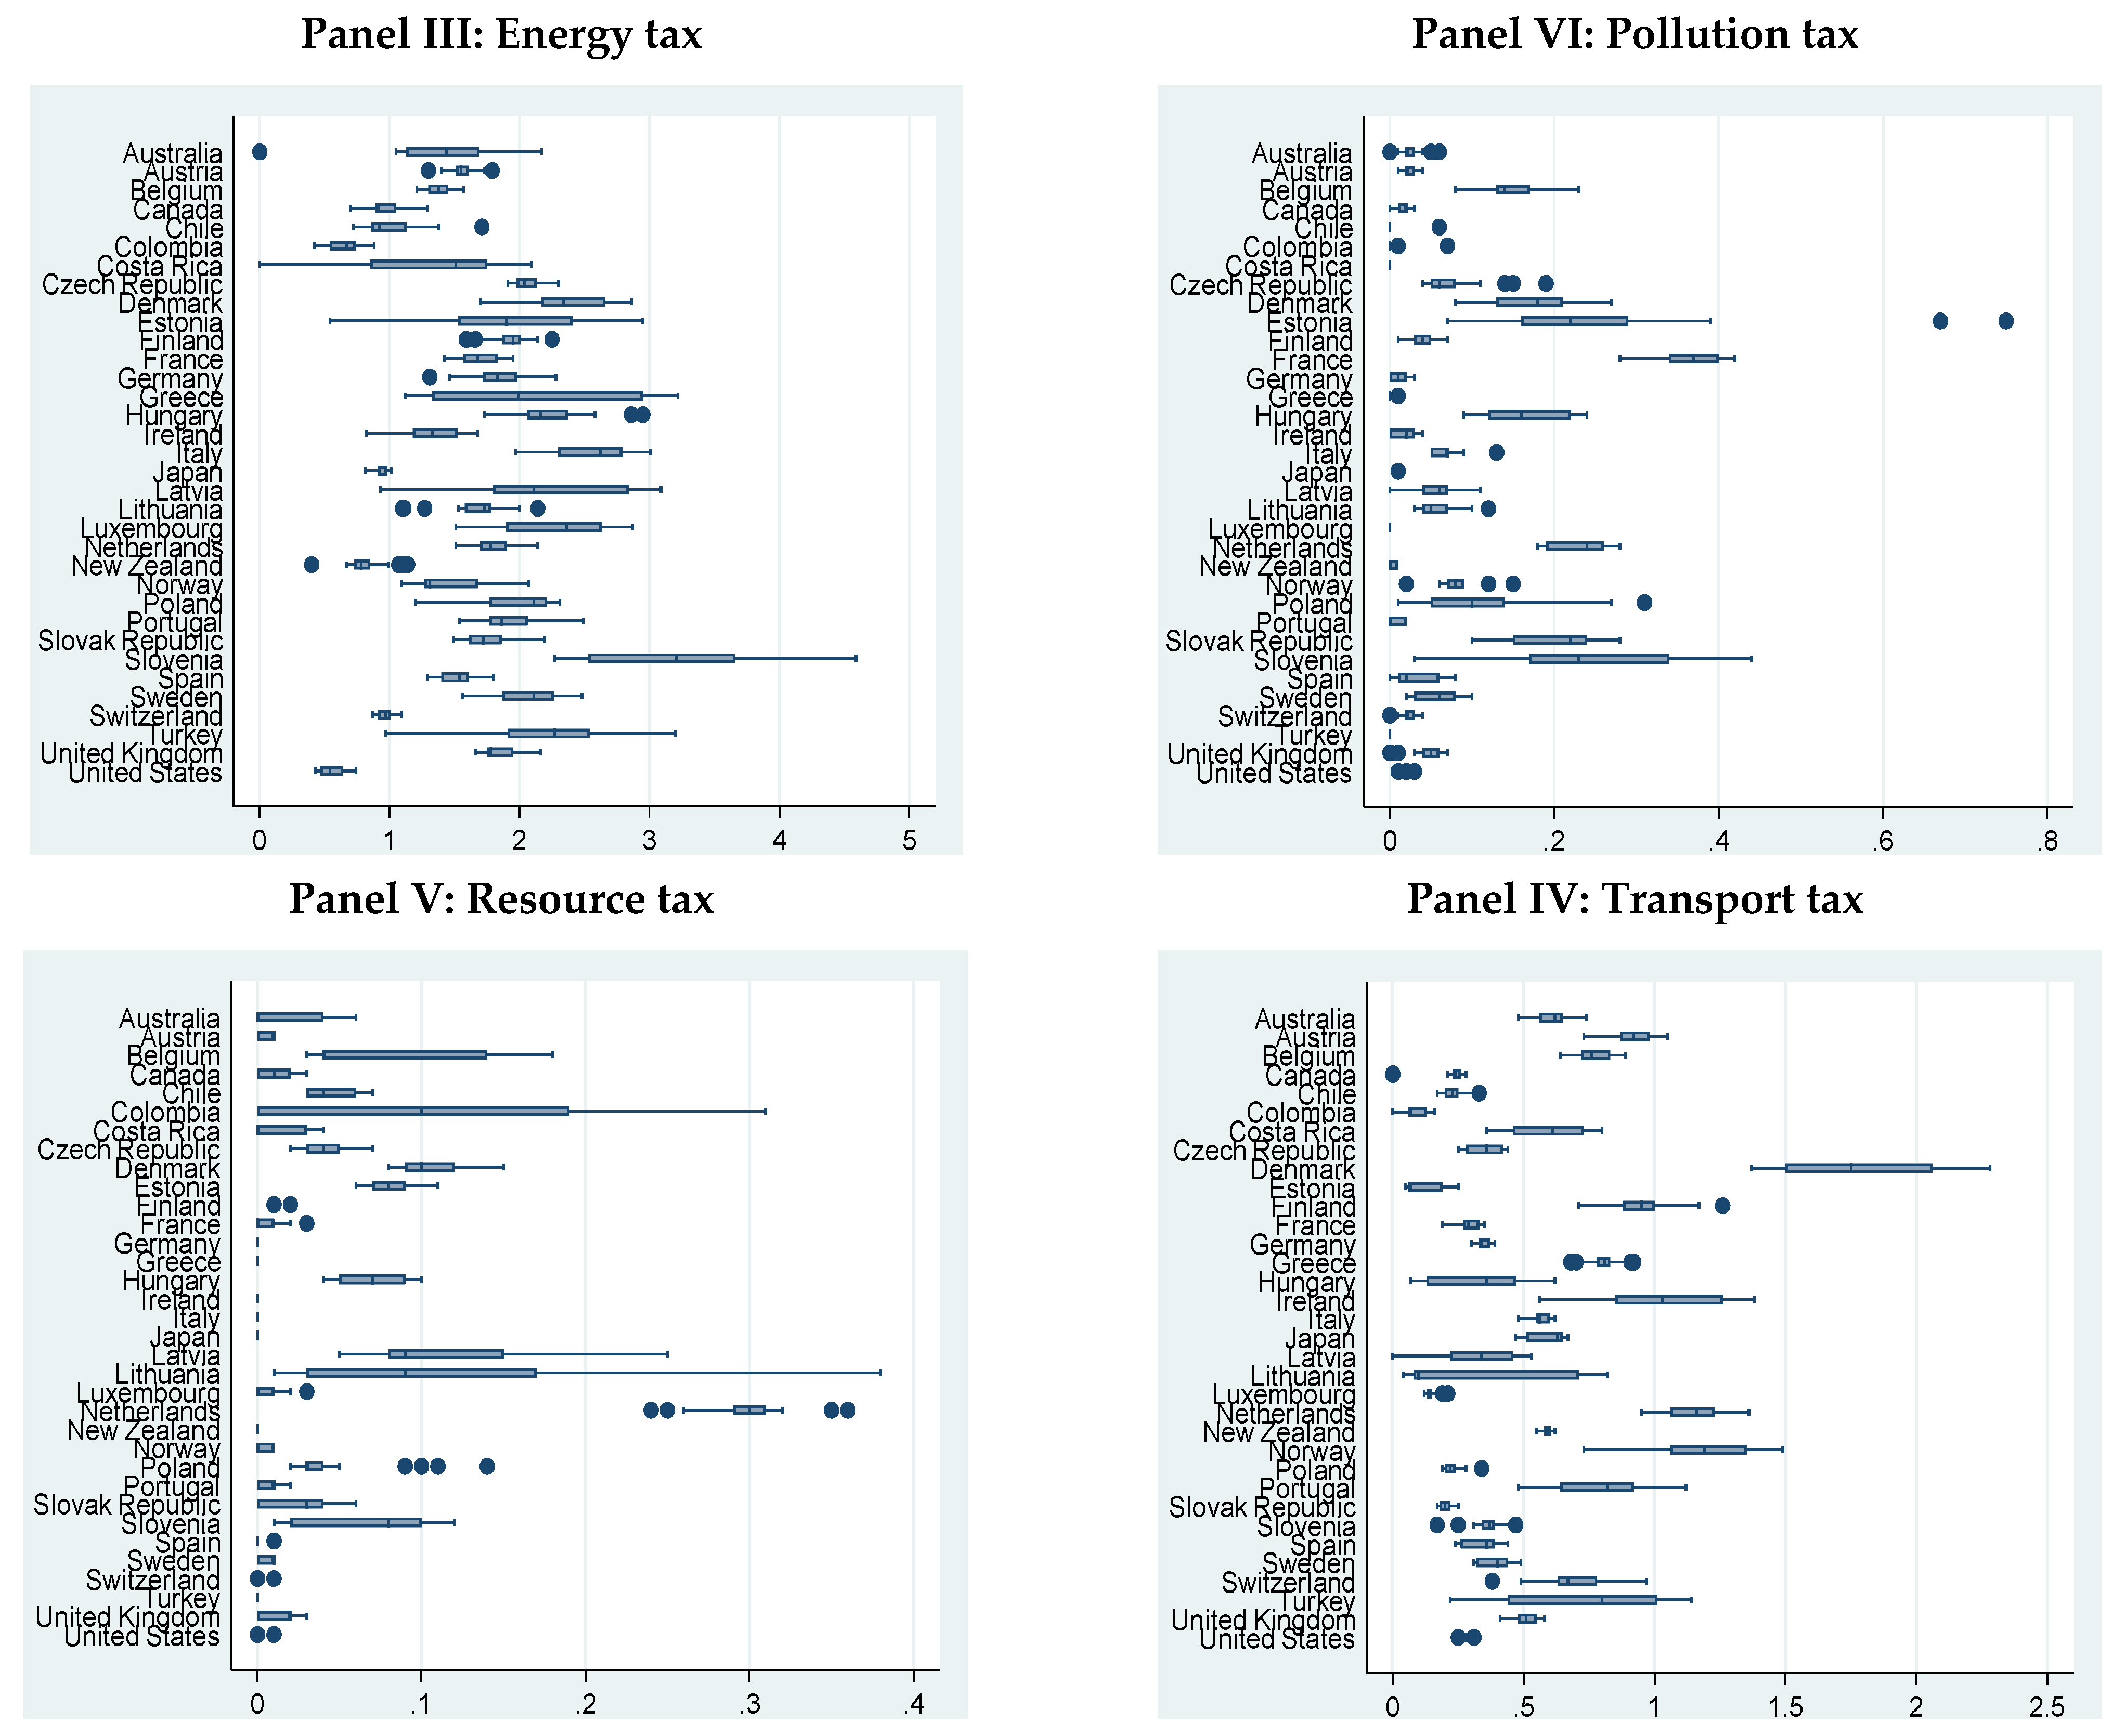
5.1. Preliminary Analysis

Table 4 summarizes the descriptive statistics of the variables under consideration. The average total environmental tax revenue is about 2.355% of GDP and varies between a minimum of 0.36% and a maximum of 5.36%. When comparing the various environmental tax categories, it is evident that the energy tax predominates, with an average tax revenue of 1.688% of GDP. The transport tax is the second highest environmental tax, with an average share of 0.553% of GDP. The minimum environmental tax is zero, which means that some countries in our sample have no revenues from some of the four considered tax categories and the presence of heterogeneity regarding the adoption of environmental taxes.
We report in Table 5 the correlation matrix between the dependent variable, CO2 emissions, and the different explanatory variables. As shown, CO2 emissions have a negative and significant correlation with all environmental taxes, except transport tax. The correlation between total environmental tax and CO2 is found to be −0.23. For the different categories of environmental taxes, one could note that energy tax has the highest correlation (−0.25) with CO2 emissions, while pollution tax has the lowest correlation (−0.10). Regarding the control variables, patents on environmental technologies have a negative and significant correlation with CO2 emissions, which implies that more patents are associated with fewer CO2 emissions. On the contrary, the correlations between CO2 emissions, on the one hand, and urbanization, energy intensity and GDP per capita, on the other hand, are 0.29, 0.26, and 0.26, respectively. This means increased urbanization, energy intensity and GDP per capita are associated with higher CO2 emissions.

5.2. Unit Root Analysis

Before conducting the stationarity analysis, one should check the existence of cross-sectional dependence for the different variables. To do that, we implemented the CD test developed by ref. [58]. Results are reported in Table 6.
As shown, the null hypothesis is rejected at the 1% statistical level for most variables. We, therefore, conclude that all variables are cross-sectionally dependent. Accordingly, one should use second-generation panel unit root tests. Given the cross-section dependence test results, we employ the Cross-sectionally augmented Im-Pesaran-Shin (CIPS) panel unit root test developed by ref. [59]. The test is conducted for variables at levels and first differences, including a constant or a constant and a time trend. The findings are summarized in Table 7. Regarding the variables at levels, the results show that the null hypothesis of a unit root cannot be rejected for all of them, except for transport tax, when a constant and a time trend are introduced. The same conclusion holds when only a constant is introduced, except for patents on environmental technologies, which are found to be stationary at levels. The first-difference of all variables is found to be stationary for models with a constant and with a constant/time trend. Henceforth, both dependent and independent variables are stationary at the first-difference. It is important to note here that the empirical investigation is based on the first-differenced GMM estimate of the dynamic panel threshold model, which introduces variables in the first-difference. The introduction of first-difference stationary variables avoids fallacious regression problems.

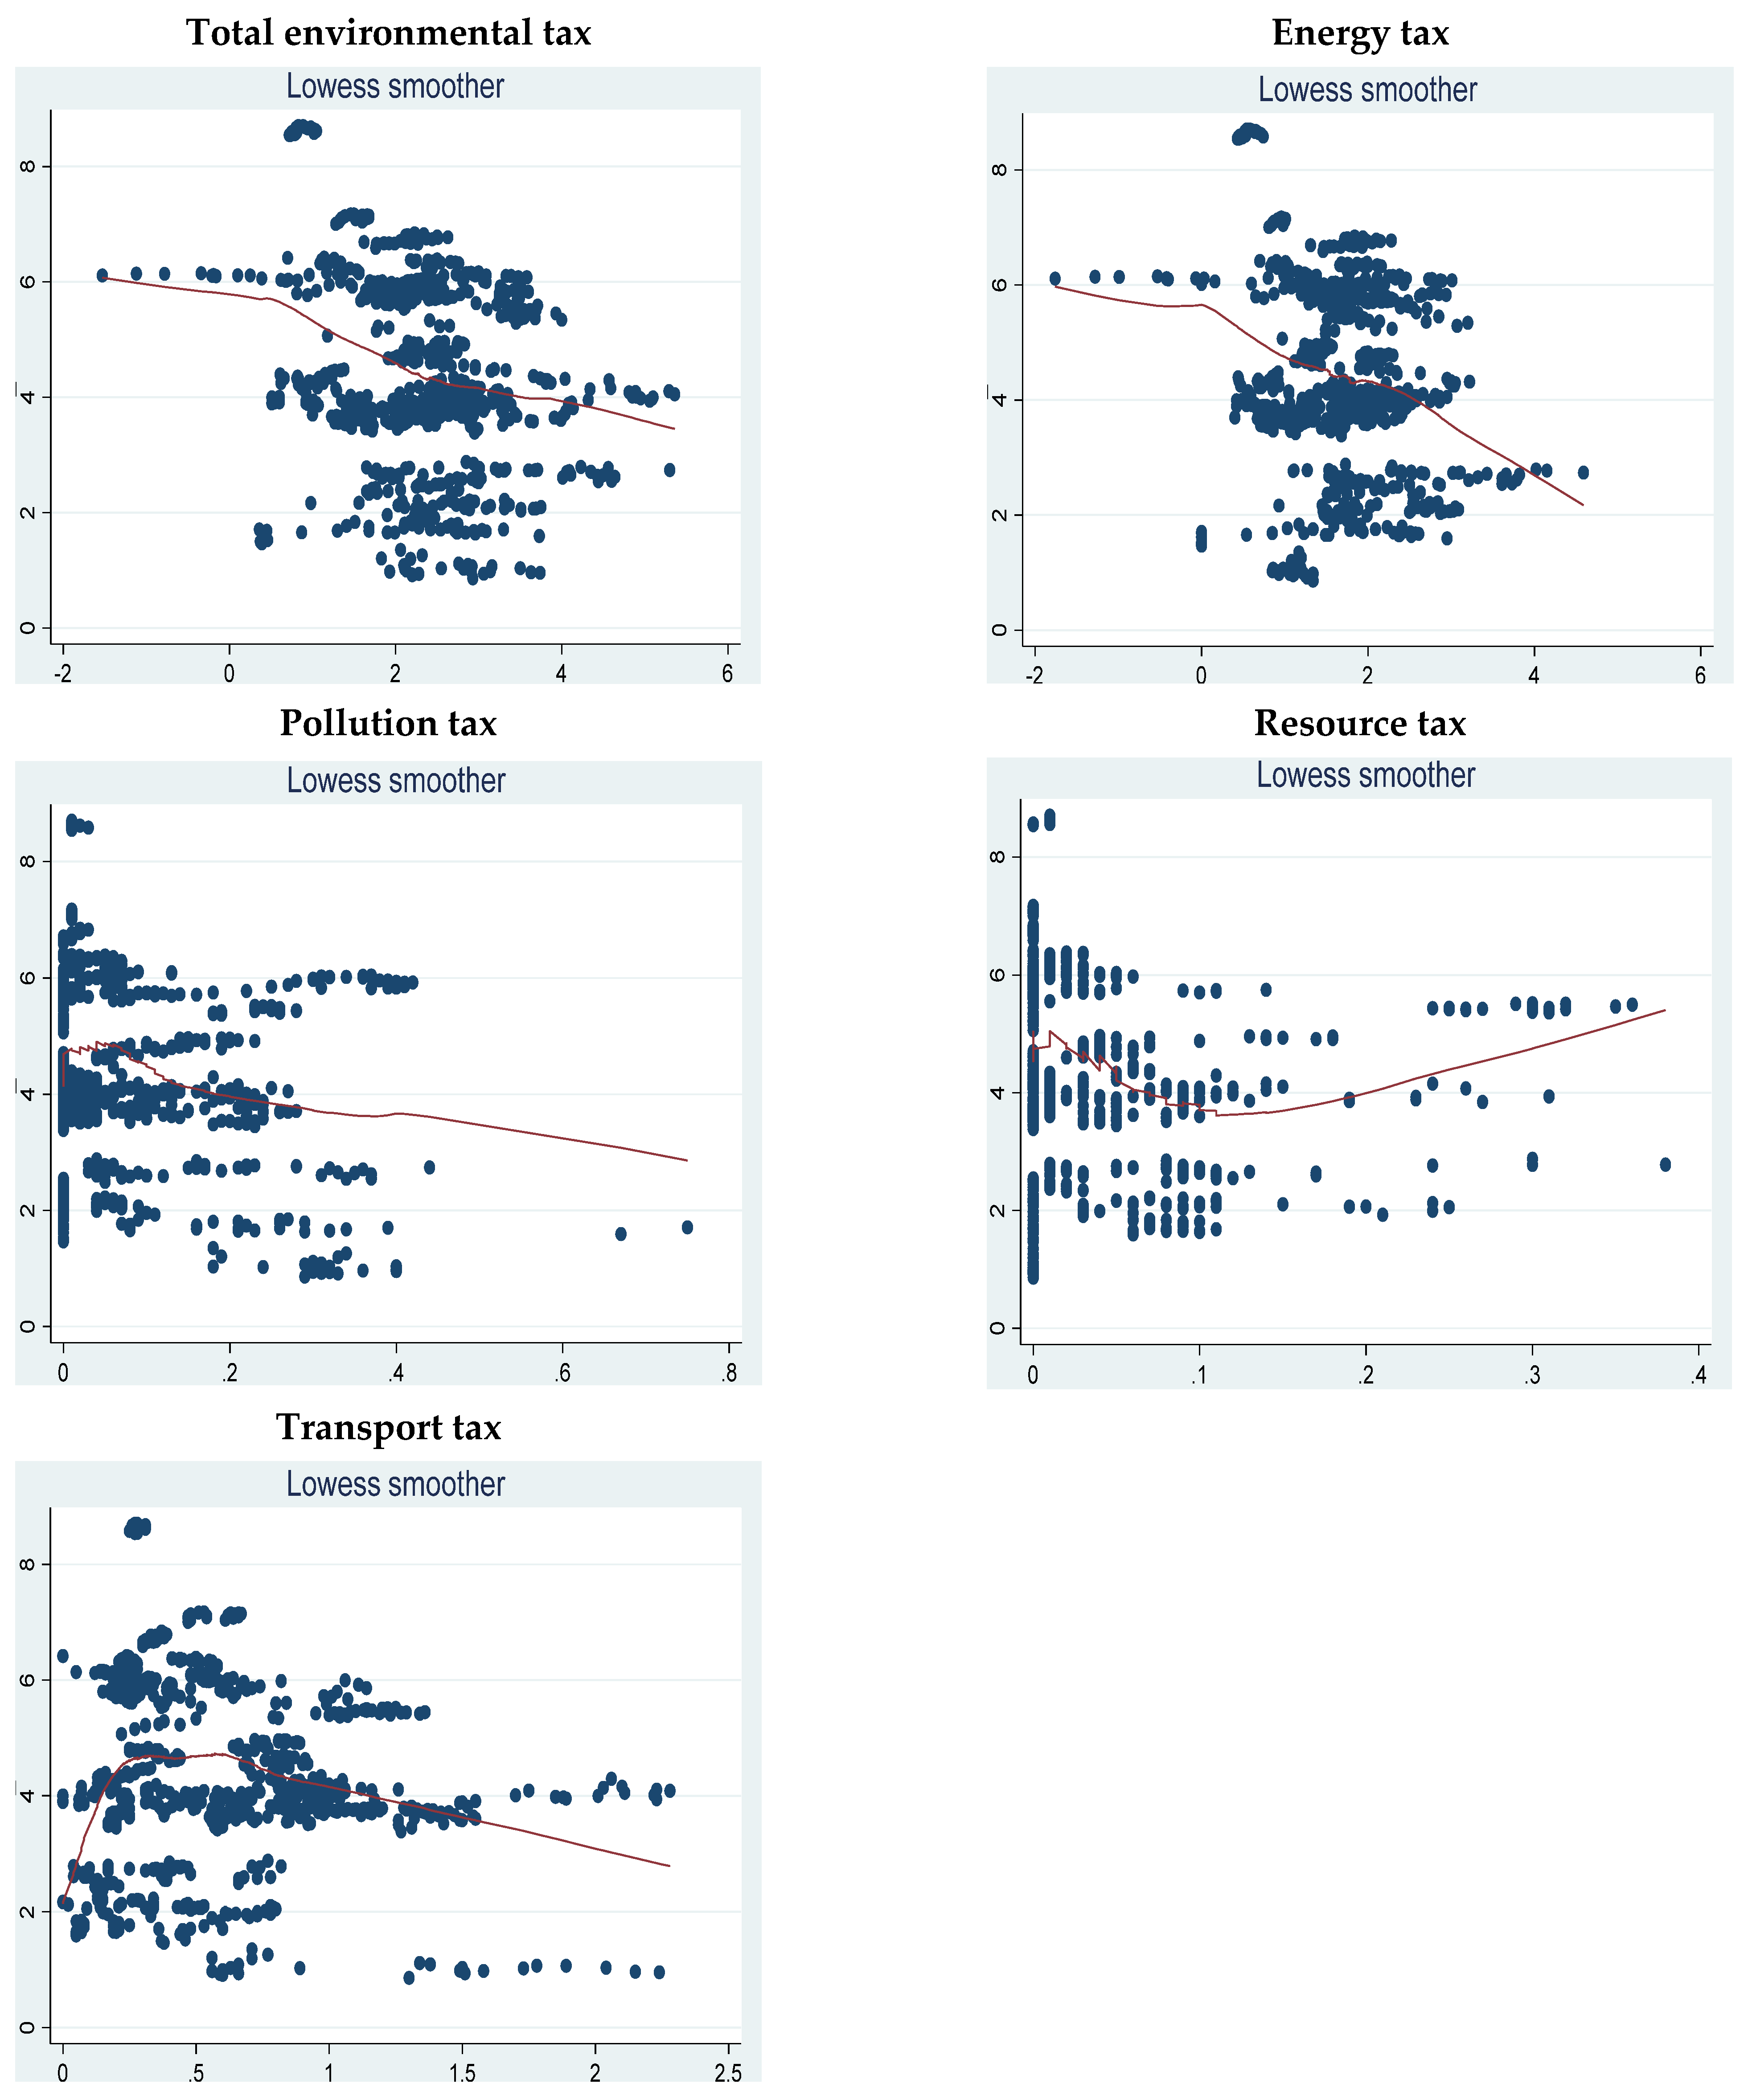
5.3. Locally Weighted Scatterplot Smoothing Analysis

Before estimating the threshold model, we perform the locally weighted scatterplot smoothing (LOWESS) analysis for CO2 emission on environmental taxes. LOWESS is a non-parametric regression technique that makes no assumption about the form of the relationship between two variables and enables an initial assessment regarding the existence of a nonlinear relationship [60]. Figure 3 provides the LOWESS between CO2 emissions and the different categories of environmental taxes. The graphs show that the effects of the different environmental taxes on CO2 emissions almost change signs according to different tax levels. This leads us to think about the existence of a nonlinear relationship between environmental taxes and CO2 emissions. Implementing the nonlinear threshold model to estimate the threshold level would be advantageous.

5.4. Conventional Dynamic Panel Regression Analysis

We move to estimate the effects of environmental taxes on CO2 emissions using the conventional dynamic panel regression. We employ two GMM estimator variants for robustness checks: the first-difference GMM estimator developed by ref. [61] and the system GMM estimator developed by [62,63]. The findings, reported in Table 8, suggest the suitability of the dynamic specification given the statistical significance of the lagged dependent variable (CO2 emissions) in all specifications. Indeed, whether the first-difference or system GMM is performed, the obtained coefficients are statistically significant at the 1% level. This means that CO2 emissions in year t are dependent on CO2 emissions during the previous year t − 1. The control variables also have the expected signs in most cases. GDP per capita is positive and statistically significant, particularly when using the system GMM estimator. Therefore, economic growth induced more CO2 emissions in OECD countries and degraded the environment during the period under consideration. Hence, economic growth in OECD countries has led to a rise in carbon dioxide emissions and a decline in environmental quality. Regarding GDP per capita squared, the table shows that it is negative and significant in most cases, which confirms the validity of the EKC hypothesis. The countries under consideration have attained a certain level of development, allowing them to improve the environment while producing more.
The findings also confirm the contribution of energy intensity in deteriorating the environment. Indeed, all coefficients obtained using the first-difference and system GMM are positive and statistically significant. These results imply that more energy consumption to produce goods and services is associated with more CO2 emissions and environmental degradation. These findings are in line with the previous related literature, including ref. [64], who concluded that higher energy intensity harms the environment in the United States. Urbanization is also found to have a detrimental impact on environmental quality, particularly when employing the first-difference estimator. Therefore, a higher urbanized population increases energy consumption, amplifying CO2 emissions and deteriorating environmental indicators. On the other hand, the coefficients associated with patents on environmental technologies are negative and statistically significant, mainly for results obtained from the system GMM estimator. These results confirm the effectiveness of environmental patents in boosting innovation in clean energies, increasing the demand for clean energy sources and reducing CO2 emissions. These results are consistent with the research conducted by ref. [65], which concluded the significance of various technological innovation indicators in mitigating carbon dioxide emissions.
We move now to the impact of environmental taxes on CO2 emissions using the first-difference and system GMM estimators. The table suggests that the coefficients of total environmental tax are negative and statistically significant at 1% (first-difference GMM) and 10% (system GMM). The coefficient equals −0.031 when using the first-difference GMM and −0.024 when using the system GMM. The results suggest that an increase of 1% in the total revenue generated from environmental taxes is associated with a reduction in CO2 emissions ranging from −0.024% to −0.031%. Next, we estimate the effects of the different environmental tax categories on CO2 emissions. The table suggests that coefficients associated with the energy tax are negative and statistically significant in both cases. Therefore, implementing an energy tax can potentially mitigate the emission of greenhouse gases and enhance environmental indicators. These results are robust as they are still valid whether we employ the first-difference and the system GMM estimator. However, this is not the case for the three other environmental taxes, namely pollution, resources, and transport. Indeed, the first-difference GMM estimator shows that coefficients associated with pollution tax and transport tax are negative and statistically significant, while the one on resource tax is positive but insignificant. On the contrary, the system GMM estimator reveals that only the coefficient of resource tax is negative and statistically significant. It is noteworthy that prior literature has emphasized the superiority of the system GMM estimator over the first-difference GMM estimator. Refs. [62,63] highlighted the weakness of instruments used in the first-difference GMM estimator. However, the system GMM estimator overcomes this limitation by employing an equation in first-differences and an equation in levels to increase the number of instruments. Based on the previous discussion, one could confirm the robustness of the system GMM estimator and the importance of taxes on resources, including taxes on water extraction, hunting and fishing activities, mining royalties, and excavation activities, in reducing CO2 emissions and mitigating climate change in OECD countries. The validity of the first-difference and system GMM results is confirmed by two mandatory tests: the validity of instruments using the Sargan test of over-identifying restrictions and the serial correlation of the error structure using the Arellano-Bond test for autocorrelation. The results of these two tests, reported at the bottom of Table 8, confirm the validity of the instruments and the absence of second-order correlation. These findings confirm the validity of the conventional dynamic panel regression analysis.
In summary, the GMM estimator confirms the role played by the total environmental tax and energy tax in reducing CO2 emissions in OECD countries. The impact of pollution tax, resource tax and transport tax are mixed. While these findings provide some evidence of the significance of environmental taxes in reducing greenhouse gas emissions in the OECD, they do not take into account the potential threshold level that must be reached for environmental taxes to be effective.

5.5. Dynamic Panel Threshold Regression Analysis

The present subsection aims to assess whether the effects of environmental taxes on CO2 emissions depend on a given threshold level using the estimator developed by refs. [27]. It is worth noting that the procedure of refs. [27] suggests the existence of a single significant threshold and two different regimes (lower and upper). As done previously, we estimate the impacts of aggregate environmental tax (column 1) and then the different categories of environmental taxes (columns 2–5). The results associated with the two regimes are reported in Table 9. As shown in the lower section of the table, there is evidence of a nonlinear association between the different variables, affirming the adoption of the threshold model for evaluating the impacts of environmental taxes on CO2 emissions. The dynamic panel threshold regression findings indicate that the lagged dependent variable exhibits statistical significance in some cases, thereby providing some support for adopting the dynamic specification. These findings are in line with those of the GMM estimator and are valid for both regimes. It can also be observed that the coefficient associated with GDP per capita is positive and statistically significant in the majority of cases, thereby confirming the contribution of economic activity to the deterioration of the environment in OECD countries.
In addition, a negative association exists between GDP per capita squared and CO2 emissions in four of the six cases where the coefficient of GDP per capita squared is statistically significant. The energy intensity has the expected positive sign, particularly in the lower regime, during which all coefficients are statistically significant. In the upper regime, the coefficient of energy intensity is statistically significant only when variables relative to total environmental tax and transport tax are introduced. Furthermore, the effect of energy intensity is higher in the lower regime as compared to the upper regime. The findings suggest that the implementation of environmental taxes can effectively mitigate the harmful effects of energy intensity on CO2 emissions. In addition, the mitigating effect of patents on environmental technologies on the environment is relatively confirmed in both regimes, as supported by the GMM estimation results. In both tax regimes, the impact of patents is negative and statistically significant for specifications which include total environmental tax, energy tax and resources tax. However, the impact is higher in the upper regime. Finally, results indicate that the environmental consequences of urbanization are mixed, as it has the potential to either raise or shrink carbon dioxide emissions in both regimes.
Table 9 presents some novel insights into the environmental repercussions of environmental taxes. First, the findings reported at the bottom of the table suggest that all environmental taxes have statistically significant threshold levels. The analysis suggests that the threshold level for total environmental tax revenue is about 3.002% of GDP. In the lower regime, defined as having a total environmental tax revenue level below 3.002%, the coefficient associated with taxes exhibits a negative sign, albeit lacking statistical significance. Once the environmental tax revenue reaches the threshold level of 3.002% (upper regime), the coefficient becomes negative and statistically significant at 1%. The coefficient is found to be −0.204, which implies that an increase in total environmental tax revenue by 1% induces a fall in CO2 emissions by 0.204% when tax revenue exceeds 3.002% of GDP. These results indicate the effectiveness of environmental tax policy in the upper tax regime. Subsequently, an examination is conducted on the effects of different categories of environmental taxes on carbon dioxide emissions within the two regimes. The table suggests the presence of statistically significant threshold levels for all environmental tax categories. The threshold levels endogenously determined are 1.991% for the energy tax, 0.377% for the pollution tax, 0.170% for the resource tax and 0.434% for the transport tax. The findings indicate that only the resource tax has a negative and statistically significant coefficient under the lower regime, which suggests that although resource tax revenue is less than 0.170% of GDP, resource tax still enables CO2 emission reduction and environmental protection. On the other hand, energy tax, pollution tax and transport tax have no significant effects on CO2 emissions during the lower regime. When moving to the upper regime, the threshold model yields different results regarding the significance of coefficients. First, the table indicates that energy tax and pollution tax have negative and significant coefficients. However, coefficients associated with the resource tax and transport tax are not statistically significant. The coefficient attributed to the pollution tax is −0.293, whereas the coefficient associated with the energy tax is −0.107. These findings imply that a 1% increase in pollution tax leads to a fall in CO2 emissions by 0.293%, whereas an equivalent increase in energy tax results in a decrease of only 0.107% in CO2 emissions. Therefore, the use of threshold regression analysis enables the identification of the specific environmental taxes that effectively mitigate CO2 emissions, as well as the threshold level at which they become effective. The impact of pollution tax appears to be the most effective among all other environmental taxes in terms of environmental pollution.

6. Conclusions and Policy Recommendations

The effectiveness of environmental taxes in protecting the environment remains a subject of ongoing academic debate. This research belongs to the growing trend in the literature investigating whether environmental taxes affect the environment. More specifically, the objective of this study is to empirically explore the effects of different environmental tax categories on CO2 emissions in 34 OECD countries between 1995 and 2019. The contribution of the study is that it assesses whether the impact of environmental taxes on CO2 emissions depends upon (i) the environmental tax category; and (ii) a specific threshold level for taxation. To this end, the dynamic panel threshold regression recently proposed by ref. [27] is implemented. The study considers different environmental tax categories: total environmental tax, energy tax, pollution tax, resource tax, and transport tax.
The findings of the GMM estimator indicate that total and energy environmental taxes reduce CO2 emissions, while mixed results concerning the effects of pollution, resource and transport taxes are reached. The dynamic panel threshold procedure suggests the existence of one significant threshold and two regimes (lower and upper). The analysis reveals that the threshold level for total environmental tax revenue is about 3.002% of GDP. Below this level (lower regime), the total environmental tax has no significant impact on CO2 emissions. However, once this level is exceeded, the tax allows for curbing CO2 emissions. The threshold regression also shows that the threshold levels are 1.991% for the energy tax, 0.377% for the pollution tax, 0.170% for the resource tax and 0.434% for the transport tax and are statistically significant. The empirical evidence confirms that introducing resource taxes results in a decrease in emissions during the lower regime, while energy tax and pollution tax allow reducing CO2 emissions only when the threshold level is exceeded (upper regime). Finally, transport tax is proven not to impact CO2 emissions.
The results of the present research may serve for the design of environmental policies in OECD countries. Indeed, our findings suggest that not all environmental taxes reduce CO2 emissions, even though estimating the dynamic panel threshold regression. The resource tax is found to be effective in reducing CO2 emissions even when the level of tax revenue is relatively low. However, the environmental impact of resource tax is relatively weak. Consequently, OECD countries may implement taxes on resource utilization, a measure that may be effective but with limited environmental effects. The results also show that energy tax and pollution tax are the most influential environmental taxes. Although transport taxes may generate revenue for the government, they are ineffective in addressing environmental degradation. These findings imply that policymakers in OECD countries should focus on specific environmental tax categories to achieve the dual goal of funding the government budget and curbing greenhouse gas emissions. Furthermore, the results show that the energy tax becomes effective starting from a threshold of 1.991% of revenue, while the pollution tax has a threshold of 0.377%. When comparing the environmental effects of energy tax and pollution tax in the upper regime, results suggest that a 1% increase in energy tax leads to a fall in CO2 emissions only by 0.107%, whereas an equivalent increase in pollution tax results in a decrease of 0.293% in CO2 emissions. Therefore, the pollution tax threshold is reached quicker and in a shorter time frame. In addition, the pollution tax is more effective than the energy tax in reducing CO2 emissions. It is therefore recommended that the pollution tax be established as the primary environmental tax in OECD countries, with the possibility of implementing an energy tax. Energy tax should be particularly implemented with caution, given the importance of energy for all economic sectors. Indeed, implementing an energy tax will increase the prices of almost all goods and services, which may adversely affect economic activity, despite its effectiveness in reducing CO2 emissions.
Although the current study presents novel insights regarding the effectiveness of environmental taxes in protecting the environment, it is not without limitations. First, the study does not account for the potential asymmetry in environmental taxes. Future studies may conduct an asymmetric analysis to distinguish between the environmental effects of increases and decreases in environmental taxes. This could be important for the formulation of environmental tax-related policies. Second, the study considers a limited number of countries due to the lack of data on environmental taxes. Further analysis considering large samples is required in order to generalize the empirical findings. The availability of large datasets will allow considering different sub-samples of countries classified by income level, for example, and comparing the environmental repercussions of environmental taxes in different groups of countries.

Author Contributions

Conceptualization, A.S.A.S., A.B., O.B.-S. and Z.J.; methodology, O.B.-S. and Z.J.; software, Z.J.; validation, A.S.A.S., A.B. and O.B.-S.; data curation, O.B.-S.; writing—original draft preparation, A.S.A.S., A.B., O.B.-S. and Z.J.; writing—review and editing, A.B., O.B.-S.; supervision, A.S.A.S.; project administration, A.S.A.S. All authors have read and agreed to the published version of the manuscript.

Funding

The authors extend their appreciation to the Deputyship for Research & Innovation, Ministry of Education in Saudi Arabia for funding this research work through the project number INST203.

Institutional Review Board Statement

Not applicable.

Informed Consent Statement

Not applicable.

Data Availability Statement

The data are available from the corresponding author.

Acknowledgments

The authors extend their appreciation to the Deputyship for Research & Innovation, Ministry of Education in Saudi Arabia for funding this research work through the project number INST203.

Conflicts of Interest

The authors declare no conflict of interest.

References

  1. World Meteorological Organization. WMO Provisional State of the Global Climate 2022. 2022. Available online: https://library.wmo.int/doc_num.php?explnum_id=11359 (accessed on 1 December 2022).
  2. Goddard Space Flight Center. Vital Signs. 2022. Available online: https://climate.nasa.gov/vital-signs/sea-level (accessed on 15 November 2022).
  3. Friedlingstein, P.; O’sullivan, M.; Jones, M.W.; Andrew, R.M.; Hauck, J.; Olsen, A.; Peters, G.P.; Peters, W.; Pongratz, J.; Sitch, S.; et al. Global carbon budget 2022. Earth Syst. Sci. Data 2022, 14, 4811–4900. [Google Scholar] [CrossRef]
  4. Climate Watch. Historical GHG Emissions. 2022. Available online: https://www.climatewatchdata.org/ghg-emissions (accessed on 15 November 2022).
  5. Bilgili, F.; Koçak, E.; Bulut, Ü. The dynamic impact of renewable energy consumption on CO2 emissions: A revisited Environmental Kuznets Curve approach. Renew. Sustain. Energy Rev. 2016, 54, 838–845. [Google Scholar] [CrossRef]
  6. Baloch, M.A.; Mahmood, N.; Zhang, J.W. Effect of natural resources, renewable energy and economic development on CO2 emissions in BRICS countries. Sci. Total Environ. 2019, 678, 632–638. [Google Scholar]
  7. Khan, I.; Zakari, A.; Ahmad, M.; Irfan, M.; Hou, F. Linking energy transitions, energy consumption, and environmental sustainability in OECD countries. Gondwana Res. 2022, 103, 445–457. [Google Scholar] [CrossRef]
  8. Lv, Z.; Li, S. How financial development affects CO2 emissions: A spatial econometric analysis. J. Environ. Manag. 2021, 277, 111397. [Google Scholar] [CrossRef]
  9. Khan, M.; Ozturk, I. Examining the direct and indirect effects of financial development on CO2 emissions for 88 developing countries. J. Environ. Manag. 2021, 293, 112812. [Google Scholar] [CrossRef]
  10. Brown, L.; McFarlane, A.; Das, A.; Campbell, K. The impact of financial development on carbon dioxide emissions in Jamaica. Environ. Sci. Pollut. Res. 2022, 29, 25902–25915. [Google Scholar] [CrossRef] [PubMed]
  11. Yao, Y.; Ivanovski, K.; Inekwe, J.; Smyth, R. Human capital and CO2 emissions in the long run. Energy Econ. 2020, 91, 104907. [Google Scholar] [CrossRef]
  12. Khan, M. CO2 emissions and sustainable economic development: New evidence on the role of human capital. Sustain. Dev. 2020, 28, 1279–1288. [Google Scholar] [CrossRef]
  13. Li, X.; Ullah, S. Caring for the environment: How CO2 emissions respond to human capital in BRICS economies? Environ. Sci. Pollut. Res. 2022, 29, 18036–18046. [Google Scholar] [CrossRef]
  14. Managi, S.; Hibiki, A.; Tsurumi, T. Does trade openness improve environmental quality? J. Environ. Econ. Manag. 2009, 58, 346–363. [Google Scholar] [CrossRef]
  15. Mutascu, M. A time-frequency analysis of trade openness and CO2 emissions in France. Energy Policy 2018, 115, 443–455. [Google Scholar] [CrossRef]
  16. Zmami, M.; Ben-Salha, O. An empirical analysis of the determinants of CO2 emissions in GCC countries. Int. J. Sustain. Dev. World Ecol. 2020, 27, 469–480. [Google Scholar] [CrossRef]
  17. Iqbal, N.; Abbasi, K.R.; Shinwari, R.; Guangcai, W.; Ahmad, M.; Tang, K. Does exports diversification and environmental innovation achieve carbon neutrality target of OECD economies? J. Environ. Manag. 2021, 291, 112648. [Google Scholar] [CrossRef]
  18. Dauda, L.; Long, X.; Mensah, C.N.; Salman, M.; Boamah, K.B.; Ampon-Wireko, S.; Dogbe, C.S.K. Innovation, trade openness and CO2 emissions in selected countries in Africa. J. Clean. Prod. 2021, 281, 125143. [Google Scholar] [CrossRef]
  19. Mongo, M.; Belaïd, F.; Ramdani, B. The effects of environmental innovations on CO2 emissions: Empirical evidence from Europe. Environ. Sci. Policy 2021, 118, 1–9. [Google Scholar] [CrossRef]
  20. Vehmas, J.; Kaivo-Oja, J.; Luukkanen, J.; Malaska, P. Environmental taxes on fuels and electricity—Some experiences from the Nordic countries. Energy Policy 1999, 27, 343–355. [Google Scholar] [CrossRef]
  21. Eurostat. Environmental Tax Statistics. 2023. Available online: https://ec.europa.eu/eurostat/statistics-explained/index.php?title=Environmental_tax_statistics (accessed on 12 February 2023).
  22. OECD. Environmental Policy Instruments, OECD (Database); OECD: Paris, France, 2022. [Google Scholar] [CrossRef]
  23. Doğan, B.; Chu, L.K.; Ghosh, S.; Truong HH, D.; Balsalobre-Lorente, D. How environmental taxes and carbon emissions are related in the G7 economies? Renew. Energy 2022, 187, 645–656. [Google Scholar] [CrossRef]
  24. Wolde-Rufael, Y.; Mulat-Weldemeskel, E. Do environmental taxes and environmental stringency policies reduce CO2 emissions? Evidence from 7 emerging economies. Environ. Sci. Pollut. Res. 2021, 28, 22392–22408. [Google Scholar] [CrossRef] [PubMed]
  25. Sezgin, F.H.; Bayar, Y.; Herta, L.; Gavriletea, M.D. Do environmental stringency policies and human development reduce CO2 emissions? Evidence from G7 and BRICS economies. Int. J. Environ. Res. Public Health 2021, 18, 6727. [Google Scholar] [CrossRef]
  26. U.S. Energy Information Administration. International. 2023. Available online: https://www.eia.gov/international/overview/world (accessed on 12 March 2023).
  27. Seo, M.H.; Shin, Y. Dynamic panels with threshold effect and endogeneity. J. Econ. 2016, 195, 169–186. [Google Scholar] [CrossRef] [Green Version]
  28. Seo, M.H.; Kim, S.; Kim, Y.J. Estimation of dynamic panel threshold model using Stata. Stata J. 2019, 19, 685–697. [Google Scholar] [CrossRef]
  29. Lee, C.C.; Xing, W.; Lee, C.C. The impact of energy security on income inequality: The key role of economic development. Energy 2022, 248, 123564. [Google Scholar] [CrossRef]
  30. Zaghdoudi, T.; Maktouf, S. Threshold effect in the relationship between environmental taxes and CO2 emissions: A PSTR specification. Econ. Bull. 2017, 37, 2086–2094. [Google Scholar]
  31. Aydin, C.; Esen, Ö. Reducing CO2 emissions in the EU member states: Do environmental taxes work? J. Environ. Plan. Manag. 2018, 61, 2396–2420. [Google Scholar] [CrossRef]
  32. Esen, Ö.; Yıldırım, D.Ç.; Yıldırım, S. Pollute less or tax more? Asymmetries in the EU environmental taxes–Ecological balance nexus. Environ. Impact Assess. Rev. 2021, 91, 106662. [Google Scholar] [CrossRef]
  33. Bolarinwa, S.T.; Akinlo, A.E. Is there a nonlinear relationship between financial development and income inequality in Africa? Evidence from dynamic panel threshold. J. Econ. Asymmetries 2021, 24, e00226. [Google Scholar] [CrossRef]
  34. Polinsky, A.M.; Shavell, S. Pigouvian taxation with administrative costs. J. Public Econ. 1982, 19, 385–394. [Google Scholar] [CrossRef] [Green Version]
  35. Roach, B.; Lennox, E.; Codur, A.M. Microeconomics and the Environment; Global Development and Environment Institute, Tufts University: Medford, OR, USA, 2019. [Google Scholar]
  36. Williams, R.C., III. Environmental taxation. In Working Paper No. 22303; National Bureau of Economic Research: Cambridge, MA, USA, 2016. [Google Scholar]
  37. Guo, L.; Wang, Y. How does government environmental regulation “unlock” carbon emission effect?—Evidence from China. Chin. J. Popul. Resour. Environ. 2018, 16, 232–241. [Google Scholar] [CrossRef]
  38. Sinn, H.W. Introductory comment–the green paradox: A supply-side view of the climate problem. Rev. Environ. Econ. Policy 2015, 9, 239–245. [Google Scholar] [CrossRef] [Green Version]
  39. Xie, P.; Jamaani, F. Does green innovation, energy productivity and environmental taxes limit carbon emissions in developed economies: Implications for sustainable development. Struct. Chang. Econ. Dyn. 2022, 63, 66–78. [Google Scholar] [CrossRef]
  40. Tao, R.; Umar, M.; Naseer, A.; Razi, U. The dynamic effect of eco-innovation and environmental taxes on carbon neutrality target in emerging seven (E7) economies. J. Environ. Manag. 2021, 299, 113525. [Google Scholar] [CrossRef] [PubMed]
  41. Chien, F.; Sadiq, M.; Nawaz, M.A.; Hussain, M.S.; Tran, T.D.; Le Thanh, T. A step toward reducing air pollution in top Asian economies: The role of green energy, eco-innovation, and environmental taxes. J. Environ. Manag. 2021, 297, 113420. [Google Scholar] [CrossRef] [PubMed]
  42. Telatar, O.M.; Birinci, N. The effects of environmental tax on Ecological Footprint and Carbon dioxide emissions: A nonlinear cointegration analysis on Turkey. Environ. Sci. Pollut. Res. 2022, 29, 44335–44347. [Google Scholar] [CrossRef] [PubMed]
  43. Sarpong, K.A.; Xu, W.; Gyamfi, B.A.; Ofori, E.K. Can environmental taxes and green-energy offer carbon-free E7 economies? An empirical analysis in the framework of COP-26. Environ. Sci. Pollut. Res. 2023, 30, 51726–51739. [Google Scholar] [CrossRef]
  44. Ahmad, M.; Satrovic, E. Modeling combined role of renewable electricity output, environmental regulations, and coal consumption in ecological sustainability. Ecol. Inform. 2023, 75, 102121. [Google Scholar] [CrossRef]
  45. Meireles, M.; Robaina, M.; Magueta, D. The effectiveness of environmental taxes in reducing CO2 emissions in passenger vehicles: The case of Mediterranean countries. Int. J. Environ. Res. Public Health 2021, 18, 5442. [Google Scholar] [CrossRef]
  46. Wolde-Rufael, Y.; Mulat-Weldemeskel, E. Effectiveness of environmental taxes and environmental stringent policies on CO2 emissions: The European experience. Environ. Dev. Sustain. 2022, 25, 5211–5239. [Google Scholar] [CrossRef]
  47. Akkaya, Ş.; Hepsag, A. Does fuel tax decrease carbon dioxide emissions in Turkey? Evidence from an asymmetric nonlinear cointegration test and error correction model. Environ. Sci. Pollut. Res. 2021, 28, 35094–35101. [Google Scholar] [CrossRef]
  48. Hepsag, A. Testing for cointegration in nonlinear asymmetric smooth transition error correction models. Commun. Stat.-Simul. Comput. 2021, 50, 400–412. [Google Scholar] [CrossRef]
  49. Ahmad, M.; Satrovic, E. How do transportation-based environmental taxation and globalization contribute to ecological sustainability? Ecol. Inform. 2023, 74, 102009. [Google Scholar] [CrossRef]
  50. Ulucak, R.; Kassouri, Y. An assessment of the environmental sustainability corridor: Investigating the nonlinear effects of environmental taxation on CO2 emissions. Sustain. Dev. 2020, 28, 1010–1018. [Google Scholar] [CrossRef]
  51. Kremer, S.; Bick, A.; Nautz, D. Inflation and growth: New evidence from a dynamic panel threshold analysis. Empir. Econ. 2013, 44, 861–878. [Google Scholar] [CrossRef] [Green Version]
  52. Ben-Salha, O.; Hakimi, A.; Zaghdoudi, T.; Soltani, H.; Nsaibi, M. Assessing the Impact of Fossil Fuel Prices on Renewable Energy in China Using the Novel Dynamic ARDL Simulations Approach. Sustainability 2022, 14, 10439. [Google Scholar] [CrossRef]
  53. Nepal, R.; Musibau, H.O.; Jamasb, T. Energy consumption as an indicator of energy efficiency and emissions in the European Union: A GMM based quantile regression approach. Energy Policy 2021, 158, 112572. [Google Scholar] [CrossRef]
  54. Voumik, L.C.; Islam, M.A.; Rahaman, A.; Rahman, M.M. Emissions of carbon dioxide from electricity production in ASEAN countries: GMM and quantile regression analysis. SN Bus. Econ. 2022, 2, 133. [Google Scholar] [CrossRef]
  55. Bakhsh, S.; Yin, H.; Shabir, M. Foreign investment and CO2 emissions: Do technological innovation and institutional quality matter? Evidence from system GMM approach. Environ. Sci. Pollut. Res. 2021, 28, 19424–19438. [Google Scholar] [CrossRef] [PubMed]
  56. United Nations. World Economic Situation and Prospects (WESP) 2022; United Nations: New York, NY, USA, 2022. [Google Scholar]
  57. OECD. Revenue Statistics 2019; OECD Publishing: Paris, France, 2019. [Google Scholar]
  58. Pesaran, M.H. General diagnostic tests for cross-sectional dependence in panels. Empir. Econ. 2021, 60, 13–50. [Google Scholar] [CrossRef]
  59. Pesaran, M.H. A simple panel unit root test in the presence of cross-section dependence. J. Appl. Econ. 2007, 22, 265–312. [Google Scholar] [CrossRef] [Green Version]
  60. Bentum-Ennin, I. International reserves accumulation and economic growth in the West African Monetary Zone. Int. Res. J. Mark. Econ. 2014, 1, 31–56. [Google Scholar]
  61. Arellano, M.; Bond, S. Some tests of specification for panel data: Monte Carlo evidence and an application to employment equations. Rev. Econ. Stud. 1991, 58, 277–297. [Google Scholar] [CrossRef] [Green Version]
  62. Arellano, M.; Bover, O. Another look at the instrumental variable estimation of error-components models. J. Econ. 1995, 68, 29–51. [Google Scholar] [CrossRef] [Green Version]
  63. Blundell, R.; Bond, S. Initial conditions and moment restrictions in dynamic panel data models. J. Econ. 1998, 87, 115–143. [Google Scholar] [CrossRef] [Green Version]
  64. Danish; Ulucak, R.; Khan, S.-U.-D. Relationship between energy intensity and CO2 emissions: Does economic policy matter? Sustain. Dev. 2020, 28, 1457–1464. [Google Scholar]
  65. Satrovic, E.; Cetindas, A.; Akben, I.; Damrah, S. Do natural resource dependence, economic growth and transport energy consumption accelerate ecological footprint in the most innovative countries? The moderating role of technological innovation. Gondwana Res. 2023, in press. [CrossRef]
Figure 1. The evolution of average environmental tax revenue (% GDP) in the OECD. Source: The authors, based on data from ref. [22].
Systems 11 00307 g001
Figure 2. Tukey’s pairwise comparison test using box plots for CO2 emissions and environmental taxes.
Systems 11 00307 g002aSystems 11 00307 g002b
Figure 3. LOWESS smoothing of CO2 emission on environmental taxes.
Systems 11 00307 g003
Table 1. List and classification of countries.
#CountryDevelopedDeveloping#CountryDevelopedDeveloping
1AustraliaX 18JapanX
2AustriaX 19LatviaX
3BelgiumX 20LithuaniaX
4CanadaX 21LuxembourgX
5Chile X22NetherlandsX
6Colombia X23New ZealandX
7Costa Rica X24NorwayX
8Czech RepublicX 25PolandX
9DenmarkX 26PortugalX
10EstoniaX 27Slovak RepublicX
11FinlandX 28SloveniaX
12FranceX 29SpainX
13GermanyX 30SwedenX
14GreeceX 31SwitzerlandX
15HungaryX 32Turkey X
16IrelandX 33United KingdomX
17ItalyX 34United StatesX
The classification of countries is based on ref. [56].
Table 2. Definition of the different environmental tax categories.
Tax CategoryDefinition
Total environmental taxThe sum of the four tax-base categories.
Energy taxIncludes taxes on energy products (fossil fuels and electricity), including those used in transportation, such as petrol and diesel.
Resource taxIncludes taxes on water extraction, forest products, hunting and fishing, mining royalties, and excavation taxes.
Pollution taxIncludes Sulphur Oxides (SOx) and Nitrogen Oxides (NOx) emission taxes, taxes on ozone-depleting substances such as chlorofluorocarbons, carbon tetrachloride and chlorofluoromethanes, taxes on wastewater discharge, taxes on the packaging, final disposal of solid waste, and other taxes.
Transport taxIncludes one-off import or sales taxes on transport equipment, recurrent taxes on ownership, registration or use of motor vehicles, and other transport-related taxes. Excise taxes on automotive fuels are not included.
Source: Ref. [57].
Table 3. Definitions and sources of variables.
AbbreviationVariable Source
e m i s s i o n s CO2 emissions (in MMtonnes)U.S. Energy Information Administration
g d p GDP per capita (in constant 2015 US$)World Development Indicators
i n t s Energy intensity, measured as energy consumption per GDP (in Btu/2015$ GDP PPP)U.S. Energy Information Administration
u r b Share of urban populationWorld Development Indicators
p a t Patents on environmental technologiesOrganisation for Economic Cooperation and Development
env_taxTotal environmental tax revenue (% GDP)Organisation for Economic Cooperation and Development
ener_taxEnergy tax revenue (% GDP)Organisation for Economic Cooperation and Development
res_taxResource tax revenue (% GDP)Organisation for Economic Cooperation and Development
pol_taxPollution tax revenue (% GDP)Organisation for Economic Cooperation and Development
tra_taxTransport tax revenue (% GDP)Organisation for Economic Cooperation and Development
Table 4. Descriptive statistics.
MeanStandard DeviationMinMaxMedian
e m i s s i o n s 355.072948.2644.3416015.53862.645
env_tax2.3550.8610.365.362.385
ener_tax1.6880.67104.591.71
pol_tax0.0750.10100.750.03
res_tax0.0390.06700.380.01
tra_tax0.5530.38902.280.47
u r b 74.71510.950.62298.04176.022
p a t 10.6934.5640.9233.5310.08
g d p 32,708.50222,054.543911.573112,417.8832,332.101
i n t s 4675.3191796.8011561.27912,285.0784273.083
Table 5. Pearson correlation matrix.
Variables e m i s s i o n s env_taxener_taxpol_taxres_taxtra_tax u r b p a t g d p g d p 2 2 i n t s
e m i s s i o n s 1.000
env_tax−0.23 ***1.000
ener_tax−0.25 ***0.87 ***1.000
pol_tax−0.10 ***0.42 ***0.34 ***1.000
res_tax−0.17 ***0.26 ***0.09 ***0.36 ***1.000
tra_tax−0.010.54 ***0.10 ***0.0110.14 ***1.000
u r b 0.29 ***−0.18 ***−0.30 ***−0.13 ***0.07 **0.145 ***1.000
p a t −0.14 ***−0.11 ***−0.10 ***−0.07 **0.07 **−0.074 **0.060 *1.000
g d p 0.26 ***0.09 ***−0.08 **−0.033−0.20 ***0.388 ***0.446 ***−0.12 ***1.000
g d p 2 2 0.25 ***0.08 **−0.09 ***−0.042−0.20 ***0.383 ***0.451 ***−0.12 ***0.99 ***1.000
i n t s 0.26 ***−0.07 **−0.07 **0.07 **0.04−0.06 **0.16 ***−0.12 ***0.0450.0401.000
***, ** and * indicate the statistical significance at 1%, 5% and 10%, respectively.
Table 6. Cross-section dependence test results.
VariableStatisticp-Value
e m i s s i o n s 21.050 ***0.000
g d p 102.080 ***0.000
i n t s 105.780 ***0.000
u r b 47.510 ***0.000
p a t 43.310 ***0.000
env_tax13.140 ***0.000
ener_tax12.440 ***0.000
res_tax2.260 **0.024
pol_tax14.050 ***0.000
tra_tax1.990 **0.046
*** and ** denote the rejection of the null hypothesis of no cross-section dependence at the 1 and 5% statistical levels, respectively.
Table 7. CIPS panel unit root test results.
VariableConstantConstant and Trend
Statisticp-ValueStatisticp-Value
Level
e m i s s i o n s 0.8860.812−0.4130.430
g d p 0.4580.6840.040.484
i n t s −0.3660.3570.5940.724
u r b 9.6891.0009.7061.000
p a t −1.488 *0.068−1.1610.123
env_tax0.7480.7732.3630.991
ener_tax1.4280.9232.7280.997
res_tax7.7511.0006.7211.000
pol_tax2.7060.9971.4840.931
tra_tax0.6160.731−1.402 *0.080
First difference
Δ e m i s s i o n s −17.498 ***0.000−15.687 ***0.000
Δ g d p −4.857 ***0.000−5.122 ***0.000
Δ i n t s −7.486 ***0.000−5.166 ***0.000
Δ u r b −7.857 ***0.000−7.723 ***0.000
Δ p a t −21.931 ***0.000−20.191 ***0.000
Δenv_tax−14.963 ***0.000−13.596 ***0.000
Δener_tax−14.538 ***0.000−13.429 ***0.000
Δres_tax−7.283 ***0.000−5.871 ***0.000
Δpol_tax−12.299 ***0.000−10.841 ***0.000
Δra_tax−16.863 ***0.000−14.298 ***0.000
*** and * denote the rejection of the null hypothesis of a unit root at the 1 and 10% levels, respectively.
Table 8. Environmental tax and CO2 emissions- GMM estimation results.
First-Difference GMMSystem GMM
env_taxener_taxpol_taxres_taxtra_taxenv_taxener_taxpol_taxres_taxtra_tax
e m i s s i o n s t 1 0.400 ***
(0.031)
0.350 ***
(0.034)
0.415 ***
(0.035)
0.444 ***
(0.034)
0.337 ***
(0.025)
0.913 ***
(0.018)
0.943 ***
(0.027)
0.981 ***
(0.008)
0.968 ***
(0.009)
0.928 ***
(0.015)
g d p 0.312
(0.241)
0.735 **
(0.304)
0.056
(0.197)
0.060
(0.217)
0.340
(0.270)
1.062
(1.118)
2.587 **
(1.025)
1.679 ***
(0.486)
1.233 **
(0.558)
0.087
(0.590)
g d p 2 0.019
(0.012)
−0.003
(0.017)
−0.039 ***
(0.010)
−0.037 ***
(0.012)
−0.027 **
(0.013)
−0.052
(0.056)
−0.130 **
(0.051)
−0.084 ***
(0.024)
−0.061 **
(0.028)
−0.004
(0.029)
i n t s 0.729 ***
(0.039)
0.734 ***
(0.051)
0.749 ***
(0.046)
0.711 ***
(0.047)
0.914 ***
(0.043)
0.098 ***
(0.026)
0.078 **
(0.031)
0.035 ***
(0.010)
0.051 ***
(0.014)
0.051 *
(0.028)
p a t −0.0007 **
(0.000)
−0.0005 *
(0.000)
−0.0002
(0.000)
−0.0001
(0.000)
−0.0000
(0.001)
−0.0017 *
(0.001)
−0.004 ***
(0.001)
−0.001 ***
(0.000)
−0.001 ***
(0.000)
−0.002 ***
(0.001)
u r b 0.004 ***
(0.001)
0.005 ***
(0.001)
0.003 ***
(0.001)
0.003 ***
(0.001)
0.001
(0.002)
0.001 **
(0.001)
−0.001
(0.001)
0.00002
(0.000)
0.0006
(0.000)
0.001 *
(0.001)
env_tax−0.024 ***
(0.006)
----−0.031 *
(0.019)
----
ener_tax-−0.036 ***
(0.008)
----−0.090 *
(0.050)
---
pol_tax--−0.126 ***
(0.026)
--- −0.023
(0.043)
--
res_tax---0.011
(0.040)
----−0.169 **
(0.082)
-
tra_tax----−0.142 ***
(0.030)
----0.012
(0.032)
c o n s t a n t -----−5.837
(5.693)
12.682 **
(5.117)
8.123 **
(2.478)
5.814 **
(2.845)
−0.616
(3.026)
1st order serial correlation (p-value)0.0000.0000.0000.0000.0000.0000.0000.0000.0000.000
2nd order serial correlation (p-value)0.1220.0890.1430.1620.05400.7400.9000.8360.7210.915
Sargan test (p-value)0.2270.3480.3360.1830.9630.1150.6990.0910.1500.007
Number of countries34343434343434343434
***, ** and * denote the statistical significance at the 1%, 5% and 10% levels, respectively. Standard errors are under parentheses.
Table 9. Environmental tax and CO2 emissions—Panel threshold model results.
env_taxener_taxpol_taxres_taxtra_tax
Lower regime γ 3.002 % γ 1.991 % γ 0.377 % γ 0.170 % γ 0.434 %
e m i s s i o n s t 1 −0.143 **
(0.060)
0.067
(0.072)
0.053
(0.057)
0.173 ***
(0.054)
−0.048
(0.082)
g d p 5.180 ***
(1.947)
3.685 ***
(1.424)
2.099
(4.370)
−3.944 *
(2.377)
−2.091 **
(1.009)
g d p 2 2 −0.217 **
(0.099)
−0.154 **
(0.071)
−0.040
(0.212)
0.247 **
0.121)
0.165 ***
(0.048)
i n t s 0.918 ***
(0.104)
0.816 ***
(0.099)
1.252 ***
(0.270)
0.844 ***
(0.134)
1.316 ***
(0.103)
p a t −0.001 *
(0.000)
−0.003 ***
(0.001)
−0.002
(0.003)
−0.002 ***
(0.000)
0.0006
(0.001)
u r b 0.013
(0.011)
0.025 ***
(0.007)
0.011
(0.017)
−0.020
(0.016)
−0.024 *
(0.014)
env_tax−0.023
(0.038)
----
ener_tax-0.015
(0.043)
---
pol_tax--−0.034
(0.046)
--
res_tax---−0.022 ***
(0.008)
-
tra_tax----0.137
(0.205)
Upper regime γ > 3.002 % γ > 1.991 % γ > 0.377 % γ > 0.170 % γ > 0.434 %
e m i s s i o n s t 1 0.038
(0.027)
0.0216
(0.030)
0.210 **
(0.087)
0.064
(0.625)
0.050 **
(0.020)
g d p −2.333
(2.266)
−0.463
(0.972)
4.205
(4.989)
29.347 **
(14.750)
3.779 ***
(0.983)
g d p 2 2 0.108
(0.115)
0.033
(0.050)
−0.203
(0.248)
−1.650 **
(0.815)
−0.197 ***
(0.048)
i n t s 0.503 ***
(0.158)
−0.178
(0.125)
0.243
(0.290)
−0.038
(0.516)
0.586 ***
(0.164)
p a t −0.010 ***
(0.003)
−0.006 **
(0.002)
0.007
(0.006)
−0.019 *
(0.011)
0.002
(0.002)
u r b 0.004
(0.004)
−0.017 ***
(0.005)
0.015 *
(0.009)
0.180 **
(0.090)
0.019 *
(0.010)
env_tax−0.204 ***
(0.068)
----
ener_tax-−0.107 *
(0.057)
---
pol_tax--−0.293 ***
(0.098)
--
res_tax---−0.477
(0.574)
-
tra_tax----−0.109
(0.252)
Threshold level (p-value)3.002 *** (0.000) 1.991 *** (0.000)0.377 *** (0.000)0.170 *** (0.000)0.434 ** (0.013)
95% confidence interval2.453–3.551%1.431–2.551%0.196–0.557%0.159–0.180%0.091–0.776%
Linearity test (p-value)0.000 ***0.000 ***0.000 ***0.000 ***0.000 ***
No. of countries3434343434
***, ** and * denote the statistical significance at the 1%, 5% and 10% levels, respectively. Standard errors are under parentheses. γ is the threshold level to be determined.
Disclaimer/Publisher’s Note: The statements, opinions and data contained in all publications are solely those of the individual author(s) and contributor(s) and not of MDPI and/or the editor(s). MDPI and/or the editor(s) disclaim responsibility for any injury to people or property resulting from any ideas, methods, instructions or products referred to in the content.

