Article

How Explainable Machine Learning Enhances Intelligence in Explaining Consumer Purchase Behavior: A Random Forest Model with Anchoring Effects

School of Management, Guangdong University of Technology, Guangzhou 510520, China
*
Author to whom correspondence should be addressed.
Systems 2023, 11(6), 312; https://doi.org/10.3390/systems11060312
Submission received: 23 May 2023 / Revised: 14 June 2023 / Accepted: 16 June 2023 / Published: 19 June 2023

Abstract

:
This study proposes a random forest model to address the limited explanation of consumer purchase behavior in search advertising, considering the influence of anchoring effects on rational consumer behavior. The model comprises two components: prediction and explanation. The prediction part employs various algorithms, including logistic regression (LR), adaptive boosting (ADA), extreme gradient boosting (XGB), multilayer perceptron (MLP), naive bayes (NB), and random forest (RF), for optimal prediction. The explanation part utilizes the SHAP explainable framework to identify significant indicators and reveal key factors influencing consumer purchase behavior and their relative importance. Our results show that (1) the explainable machine learning model based on the random forest algorithm performed optimally (F1 = 0.8586), making it suitable for analyzing and predicting consumer purchase behavior. (2) The dimension of product information is the most crucial attribute influencing consumer purchase behavior, with features such as sales level, display priority, granularity, and price significantly influencing consumer perceptions. These attributes can be considered by merchants to develop appropriate tactics for improving the user experience. (3) Consumers’ purchase intentions vary based on the presented anchor point. Specifically, high anchor information related to product quality ratings increases the likelihood of purchase, while price anchors prompted consumers to compare similar products and opt for the most economical option. Our findings provide guidance for optimizing marketing strategies and improving user experience while also contributing to a deeper understanding of the decision−making mechanisms and pathways in online consumer purchase behavior.

1. Introduction

The thriving digital economy in China has led to a flourishing internet industry. With the integration of digital media into consumers’ daily routines, digital advertising is rapidly gaining popularity. Search advertising, an emerging communication channel and media form, integrates the resources of the internet platform, allowing advertisers to place ads precisely. The Chinese market allocated 57% of its total advertising budget to search advertising in 2021 [1], reflecting its remarkable commercial and research advantages. Thus, it has become an essential means for consumers to obtain information about products and services.
Compared to traditional offline advertising, search advertising has the ability to accurately record online behaviors, including the search queries, browsing habits, and purchase activities of each clicked user, thus offering great potential for consumer purchase behavior analysis [2]. However, current studies mainly concentrate on improving the click−through rate of ads and may lack in−depth analysis of consumers’ purchase behavior related to search advertising from a clickstream perspective. These studies primarily focus on areas including keyword management [3], location effects [4], pricing mechanisms [5], algorithmic analysis, and other factors that affect the attractiveness of search ads to consumers. Although these studies have improved marketing strategies and user experience in search advertising, they do not consider the essential psychological factors that influence consumers’ purchase decisions. Consumers’ purchase decisions are influenced not only by marketing, but also by various psychological factors. One example is the anchoring effect, which is a relatively common psychological phenomenon in which people use initial information or experiences to evaluate and determine the outcome when making decisions [6,7]. When using search engines, users tend to browse the initial pages, believing that these search results are of superior quality, while subsequent pages are often of relatively lower quality. This can lead users to stop browsing. Although machine learning is frequently regarded as a critical technology for identifying and extracting massive amounts of data, its opaque nature is an obstacle to making high−quality decisions and judgments. Considering the anchoring effect and the black−box problem of machine learning models, it is essential to explore the role of consumer psychological state and purchase decision factors in search advertising scenarios. The adoption of explainable machine learning techniques facilitates the understanding of established laws and properties of models, while improving our ability to predict and explain consumer behavior. The correlation between behavioral patterns, purchase decisions, and recommended ads in advertisements can be illuminated by the use of explainable machine learning techniques. This technique improves our ability to understand the behavioral patterns of potential consumers. Scholars in the field have used explainable machine learning algorithms in recommendation systems to study the behavioral characteristics and associated explanations of consumer purchase behavior in search advertising scenarios [8], thereby expanding our knowledge of consumer purchase behavior.
This paper aims to use explainable machine learning models based on the anchoring effect to analyze consumer purchase behavior in search advertising scenarios. The analysis provides insights into the underlying motivations, providing better explanations for managing consumer purchase behavior in specific consumption scenarios. This methodology can help platforms and merchants adjust their marketing strategies and improve conversion rates. The remainder of this study is organized as follows: in Section 2, we review the current research status. In Section 3, we construct an explanatory model of consumer purchase behavior. Section 4 presents a descriptive analysis of the data and empirical results of the study. In Section 5, we explore the theoretical and managerial implications of this study. Finally, Section 6 outlines the conclusions and future research directions.

2. Literature Review

2.1. Anchoring Effect of Consumer Decision

Consumer decisions are often influenced by various factors, including emotions, cognition, and society. This psychological phenomenon, referred to as the “anchoring effect” in the field of psychology, can cause biases in consumers’ purchase behavior and is emerging as a new research topic [6,7]. Previous research shows that the influence of the anchoring effect on consumers’ purchase behavior depends on their level of familiarity with products [6]. Consequently, consumers who are less familiar with products are more susceptible to the influence of advertising and other promotional methods on their purchase decisions [9]. Promotional scenarios can influence the perception of the intrinsic value of the product, thereby stimulating further purchase behavior [10]. Consumers’ professional background and knowledge can also influence their expectations of a product’s or service’s quality, which, in turn, affects their decisions. For example, investors with stock market expertise can reduce behavioral biases and increase investment returns [11]. Historical reference prices can significantly influence consumers’ online purchase intentions. Similarly, low anchor prices have been found to increase consumer acceptance and willingness to purchase organic foods [12]. Current research on consumer behavior primarily examines consumers’ cognitive processes and the factors that influence their purchase decisions, focusing on their bounded rational behavior. When consumers are influenced by product pricing factors, like historical prices [11] and reference prices [13], they exhibit bounded rationality. However, this overlooks the essential role of product information in purchase decisions. Research in the field of consumer behavior indicates that consumers are influenced by factors other than price anchoring, including product reviews, sales volume, search rankings, and store information [14]. The emergence of the digital business environment has significantly altered the power dynamics between merchants and consumers. Unlike in the past, consumers no longer passively accept information from sellers. Instead, they actively seek product information and continuously expand their knowledge. This has led to increased consumer empowerment in the decision−making process, as they revise their perceptions of various attributes such as product quality, utility, and service in order to make informed purchasing decisions. Thus, future research in the area of consumer behavior will focus on how consumers acquire, process, and evaluate product information, as well as how these processes influence their purchase behavior. In particular, it is worthwhile to study the cognition and purchase behavior of bounded rationality consumers.

2.2. Research on Explainable Machine Learning Models

Machine learning has become a prevalent method in decision support because of its efficient learning algorithms, remarkable data fitting performance, and robust computational power. Among the various algorithms available, the random forest algorithm is particularly well−suited for studying consumer purchase behavior. Specifically, it is suitable for diverse data characteristics and consumer behavior in the advertising field, and can process large−scale advertising clicks and consumer characteristic information, enabling highly accurate prediction and interpretation capabilities [15]. By integrating multiple decision trees for prediction, the random forest algorithm can effectively reduce the risk of overfitting that may occur with a single decision tree, thus improving the overall prediction accuracy [16]. This feature is of great importance in accurately predicting consumer purchase behavior and achieving precision in advertising placement. Compared with traditional algorithms (such as logistic regression or the decision tree), the random forest algorithm exhibits greater flexibility and adaptability to better handle complex tasks, especially when dealing with high−dimensional, non−linear, and interactive features [17]. It can effectively deal with these complex situations and provide more accurate prediction and interpretation capabilities through mechanisms such as feature selection, ensemble learning, and random sampling of samples [18]. The training process of the algorithm is relatively efficient and can handle large−scale datasets to meet real−time requirements [19].
However, with the increasing complexity of machine learning models, there is a growing need to balance their applicability and explainability in real−world settings. Traditional black−box models focus solely on output results with little regard for their internal mechanisms [20]. In contrast, explainable machine learning emphasizes improving users’ communication and trust by providing explanations for the internal mechanisms of the model. Feature importance analysis is a critical component of explainable machine learning. It identifies the most influential features in predicting target variables by analyzing the relationship between features and target variables, and removing irrelevant factors to improve prediction accuracy and model explanatory power. The study of feature importance analysis is gaining importance, and many scholars are focusing on its methods and applications. Some studies focused on evaluating the importance of each feature based on factors such as frequency and correlation by using tree−based models like random forest and the gradient boosting tree [21]. Other studies explored the causal relationship between features and target variables by utilizing methods like causal inference and variable screening [22]. Additionally, some proposed a neural−network−based approach that employs activation values or gradient information in the network to analyze feature importance [23]. Secondly, traditional machine learning models (e.g., linear regression and logistic regression) primarily focus on linear relationships between input features. The limitations of linear modeling include the inability to capture higher−order or non−linear data relationships, which limits its applicability in complex scenarios. To address this issue, some new methods have been proposed, one of which is the explanation method based on attribution analysis [24]. This method maps high−dimensional feature spaces to lower dimensions, which facilitates the modeling of non−linear relationships. Shapley additive explanation (SHAP) is one of the outstanding representatives of the attributional analysis explanation methods. It is based on the concept of Shapley values in game theory. By considering the reasonable contribution of all feature subsets, it quantifies the impact of input features on the model’s predicted output [25]. The SHAP explanation method not only incorporates the information provided by logistic regression, but also possesses both local and global explanatory power, which makes it more suitable for explaining complex behaviors than traditional research methods. The SHAP explanation method has been successfully applied in many fields such as finance, medicine, natural language processing, and more. For example, Demajo et al. used the SHAP explanation method to evaluate a credit−scoring method based on machine learning [26]. Hakkoum et al. investigated the black box problem in drug screening models using the SHAP explanation method [27]. Similarly, Lampridis et al. applied the SHAP explanation method to analyze the decision process in sentiment classification [28].
In e−commerce scenarios, consumer purchase behavior is influenced by both external factors (e.g., product price and quality) and internal factors (e.g., personal preferences, historical purchases, and reviews). To better understand and predict consumer behavior, interpretable machine learning can offer critical support [29]. The SHAP explainable framework has shown remarkable advantages in explaining the mechanisms of consumer purchase decision behavior in search advertising. Compared with traditional local interpretation methods, the SHAP explainable framework has a global nature, which allows it to comprehensively consider the effects of all features in the model and provide an accurate explanation of feature importance [30]. Using Shapley values, the framework quantifies the contribution of each feature to the prediction, allowing a deeper understanding of the mechanism behind the formation of the prediction results [25]. In search advertising, a multitude of factors, such as ad text, product ranking, and relevance, influence consumers’ purchase decisions. The SHAP explainable framework has proven to be an effective tool for dealing with this multimodal data to provide detailed explanations for each factor. This framework can help achieve a comprehensive understanding of the dynamic characteristics of consumer purchase behavior [31]. Applying the SHAP explainable framework to explain consumer purchase behavior in search advertising can help in comprehensively understanding the driving factors, reveal the importance, and decipher the predictive mechanism of complex models. Our study is innovative in explaining complex models and processing multimodal data, providing new methods and perspectives for consumer behavior research.

3. Explainable Modeling of Consumer Purchase Behavior

3.1. Characteristics of Product Information

Product information refers to the knowledge that consumers need to know about production, distribution, and services of goods. Search ads provide rich product information, including price, sales volume, brand, etc. Although search ads reduce the cost of obtaining product information, consumers may perceive the information differently because they are influenced by the initial information presented to them. Even the same product can lead to different decision outcomes over time. In this paper, product information is categorized into two groups based on whether it requires a progressive establishment. The specific definition is as follows:
G j = G S j , G C j , G D j k × 3
M j = M P j , M D j , M G j k × 3
G j and M j are three−dimensional vectors representing cumulative and non−cumulative product information, respectively. Specifically, G S j , G C j , G D j , M P j , M D j , and M G j correspond to sales level, favorite level, display frequency, price, display priority, and product display granularity.
Sales levels are categorized into 17 levels based on the average sales volume of ad products, with higher levels indicating increased sales volume. Similarly, favorite levels are divided into 18 levels based on the cumulative number of times that an ad product has been collected. Higher levels indicate a greater number of collections. Display frequency refers to the total number of times that a product appears in ads and is divided into 22 levels. Higher values indicate a higher frequency of product display. Similarly, price is divided into 12 levels according to price points, with higher values indicating a higher price. Display priority refers to the order in which an advertised product appears on a display page, with a lower number indicating a higher display position. Product display granularity, which describes the organization of product category attribute lists in search ads, is divided into 105 categories based on text length characteristics. Higher category values indicate that the product has more detailed and informative information. Assume that attribute l of product j is represented as B j b , with the corresponding text description length b j l . Therefore, the product display granularity M G j is represented as:
M G j = l = 1 m j b j l
The variable m j in the formula represents the number of attribute descriptions for the product j .

3.2. Characteristics of Merchant Information

Merchant information, such as on e−commerce platforms or for physical stores, is an important reference for information on marketing activities. It reflects signals of the long−term accumulated store image, including brand reputation, service characteristics, and store ratings. For instance, positive word−of−mouth information can increase customer loyalty [32]. Merchant information S j is defined as follows:
S j = S S j , S R j , S N j , S L j , S A j , S D j k × 6
S S j , S R j , S N j , S L j , S A j , and S D j indicate store star rating, store positive rating, number of reviews rating, logistics service rating attitude, service attitude rating, and description rating, respectively.
Store star rating is determined based on its level of operation and is divided into 21 different levels. A higher rating value indicates a superior service quality. The number of reviews rating is divided into 25 levels based on the cumulative number of product reviews. A higher value indicates a larger number of reviews. Store rating, logistics service attitude, service attitude, and description rating all reflect the store’s service capability, with a value range of 0 , 1 . The higher the value, the higher the rating, indicating the store’s better service capability.

3.3. User Characteristics of Consumers

Consumer heterogeneity is a common occurrence in marketing, where individual consumers exhibit different behaviors toward the same product. To better understand how consumer heterogeneity affects the primary variables of this study, we use consumer basic information as a control variable. Consumer basic information U i is defined as follows:
U i = U S i , U A i , U G i k × 3
The three variables, U S i , U A i , and U G i , represent the user’s star rating, age, and gender, respectively.
Star ratings can help assess the level of user engagement with the platform [33]. For the purpose of this study, users’ star ratings on the platform are divided into 11 levels based on their activity level. The higher the activity level of a user, the higher their star rating. Additionally, users’ age is divided into 8 levels, with each level representing an age increment. Gender is defined as follows:
U G i = 1 , male 0 , female

3.4. SHAP Explanation Method

When browsing products online, consumers often face unobservability and uncertainty about the quality of products and services, leading to an information asymmetry [34]. Advertising is one of the ways to bridge this knowledge gap between merchants and potential customers. Through advertising, both buyers and sellers can access essential information about the quality of products and services, leading to a better information equilibrium and more informed decisions [35]. Consumers use a variety of factors, such as product information, merchant information, and other relevant details, to make comprehensive decisions when clicking on advertisements. For merchants (advertisers), increased product conversion means higher revenue and a higher probability that consumers will purchase their desired products. This paper assumes that consumers’ final purchase decisions are influenced by multiple pieces of advertising information. Particularly, consumers view advertising information as anchor points during their product browsing and use them as decision criteria. The specific implication is that the consumer’s purchase decision process for a single product is influenced by the display of product information, merchant information, and basic user information in the current search ad, which influence the willingness to click and purchase.
Therefore, this paper defines the consumer i ’s willingness to buy a product j with different advertising information W through single click behavior c as follows:
W i c = W G j , M j , S j , U i
where W   i c is a vector with d * × 1 dimensions, d * represents the behavioral type of consumer purchase decision, G j represents the cumulative information of products, M j represents the non−cumulative information of products, S j represents the merchant information, and U i represents the basic information of consumers. According to the principle of maximizing consumer utility, we define the purchase decision D i c when consumers have the strongest intention to purchase as follows:
D i c = f W i c d = arg max W i c d
The value of d indicates the status of purchase decision, where d = 0 means that the consumers abandon the purchase, and d = 1 means that the consumers complete the transaction.
P D i c = d | G j , M j , S j , U i = F d G j , M j , S j , U i
where the input characteristics of the consumer i form a mapping function F with the probability of their purchase decision behavior, and F d represents the probability of D i c = d .
Machine learning offers advantages over traditional econometric methods for analyzing large datasets with high−dimensional and complex relationships among variables. It outperforms traditional methods in terms of model fit and predictive accuracy. However, the increasing complexity of machine learning models can lead to a weakness in explainability, which can reduce their practical utility. To address the problem of explainability of machine learning models, this paper proposes the SHAP explainable framework. This framework uses both data−driven analysis and theory−driven reasoning to achieve a better understand of mechanisms behind consumer purchase decisions in search advertising.
Let Z G , M , S , A = G j , M j , S j , U i , then the logarithm of P D i c = d | Z G j , M j , S j , U i is L d Z .
L d Z = ln P D i c = d | Z G , M , S , U = ln F d Z G , M , S , U
According to the idea of SHAP, the model’s predicted values are interpreted as the sum of the attribute feature values attributed to each input feature, namely the Shapley values [25]. Given a sample e , model F yields a predicted probability log value L d Z e when the probability of purchase behavior is D i c = d . The predicted value Φ of model F is expressible as:
Φ = ϕ e , 0 d + ϕ e , G d + ϕ e , M d + ϕ e , S d + ϕ e , U d
where ϕ e , 0 d is predicted mean value of all samples, while ϕ e , G d , ϕ e , M d , ϕ e , S d , and ϕ e , S d represent cumulative product, non−cumulative product, merchant, and consumer basic information of Shapley values, respectively. Equation (12) shows the Shapley values of the model’s characteristic variables.
ϕ e , x d r e = T T ! N T 1 ! N ! r T e r T
where N represents total number of features, T is subset of features that excludes factor r e , T represents number of subset elements, r T represents model predicted value of features in T , and r T r e represents sum of model predicted value of features in T and feature r e .
The local contribution value of each feature variable is defined as follows:
ϕ e , x ( d ) = ϕ e , G ( d ) = E L d ( Z ) | Z G = G j ϕ e , 0 ( d ) ϕ e , M ( d ) = E L d ( Z ) | Z ( G , M ) = [ G j , M j ] E L d ( Z ) | Z G = G j ϕ e , S ( d ) = E L d ( Z ) | Z ( G , M , S ) = [ G j , M j , S j ] E L d ( Z ) | Z ( G , M ) = [ G j , M j ] ϕ e , U ( d ) = L d ( Z e ) E L d ( Z ) | Z ( G , M , S ) = [ G j , M j , S j ]   = L d ( Z e | Z ( G , M , S , U ) = [ G j , M j , S j , U i ] ) E L d ( Z ) | Z ( G , M , S ) = [ G j , M j , S j ]
where E L d ( Z ) | Z G = G j denotes the logarithm of the expected probability prediction for the cumulative product information, and so on.

4. Empirical Study

This study was carried out in three parts: model stability testing, behavioral modeling using machine learning algorithms, and explainable modeling of consumer purchase behavior. In our study, we encountered the problem of class imbalance, where female consumers were more active on the Taobao platform, leading to an imbalance in the male–female ratio. To address this problem, we used the BalancedBaggingClassifier algorithm to balance the data. This algorithm is an ensemble model that offers various advantages, including the ability to effectively handle samples with different feature weights, mitigate overfitting, and exhibit strong adaptiveness to unbalanced datasets. In using the BalancedBaggingClassifier algorithm, we were able to significantly reduce the bias caused by data imbalance in the dataset, resulting in the improved accuracy and robustness of our model. Subsequently, we combined variable significance and robustness testing to cross−validate and compare multiple algorithmic models to achieve the optimal predictive model. Finally, the explainable machine learning SHAP algorithm was used to analyze the explanatory power of the model results.

4.1. Descriptive Analysis of Data

In our study, we selected real search advertising click data from the Taobao shopping platform as the research object, and extracted key characteristics from the levels of products, merchants, and users to gain a deeper understanding of consumer behavior and product characteristics. At the product level, we selected characteristics such as product price, display priority, sales level, favorite level, and display frequency, which effectively describe the attributes of the product characteristics and consumer behavior and help analyze factors such as price distribution, product exposure, and popularity. Specifically, product price reflects market competition and consumer purchase decisions, display priority and display frequency reflect advertising strategies and product exposure level, whereas sales and favorite level reflect product popularity and user preference. At the merchant level, we selected features such as store rating, service attitude, logistics service, and description matching score. These features were selected because they can indicate the service quality and product quality of the store, therefore influencing consumers’ loyalty and purchase behavior toward the store. For example, store rating and service attitude reflect consumers’ satisfaction with the store, while logistics service and description matching score indicate consumers’ evaluation of logistics efficiency and product description accuracy, respectively. At the user level, we mainly studied three characteristics: age, gender, and user rating, to describe factors such as consumers’ personal characteristics and consumption habits. Among them, age and gender are the basic characteristics of consumers and they have a significant impact on consumer behavior. The user star rating reflects the credibility and participation of consumers on the Taobao shopping platform. These characteristics allow us to better understand the differences and preferences in shopping behavior among consumers of different ages and genders, as well as the purchasing behavior and participation of high−star−rated users.
After pre−processing procedures, including the filtering out of missing and incomplete data, a total of 6,224,279 records were obtained, with 2,532,380 real consumers, 20,007 stores, and 69,063 products. Table 1 shows the results of the descriptive statistics conducted on the three levels of the dataset, namely the user, merchant, and product information. The statistical analysis shows that the product prices were typically average, while the display priority was relatively high. It is noteworthy that sales level, collection level, and display frequency were above average. These results suggest that promotional products generate significant profitability. The store’s positive rating, service attitude, logistics service, and description rating tended to be 1, indicating that most stores have generally high service ratings. Similarly, the user star ratings, store star ratings, and number of comments all fell in the upper−middle range, indicating that consumers with high star ratings were actively engaged with the platform, and that stores with high ratings were relatively popular. Finally, the primary consumer group was females between the ages of 20 and 50, with those in their thirties representing the dominant age category.

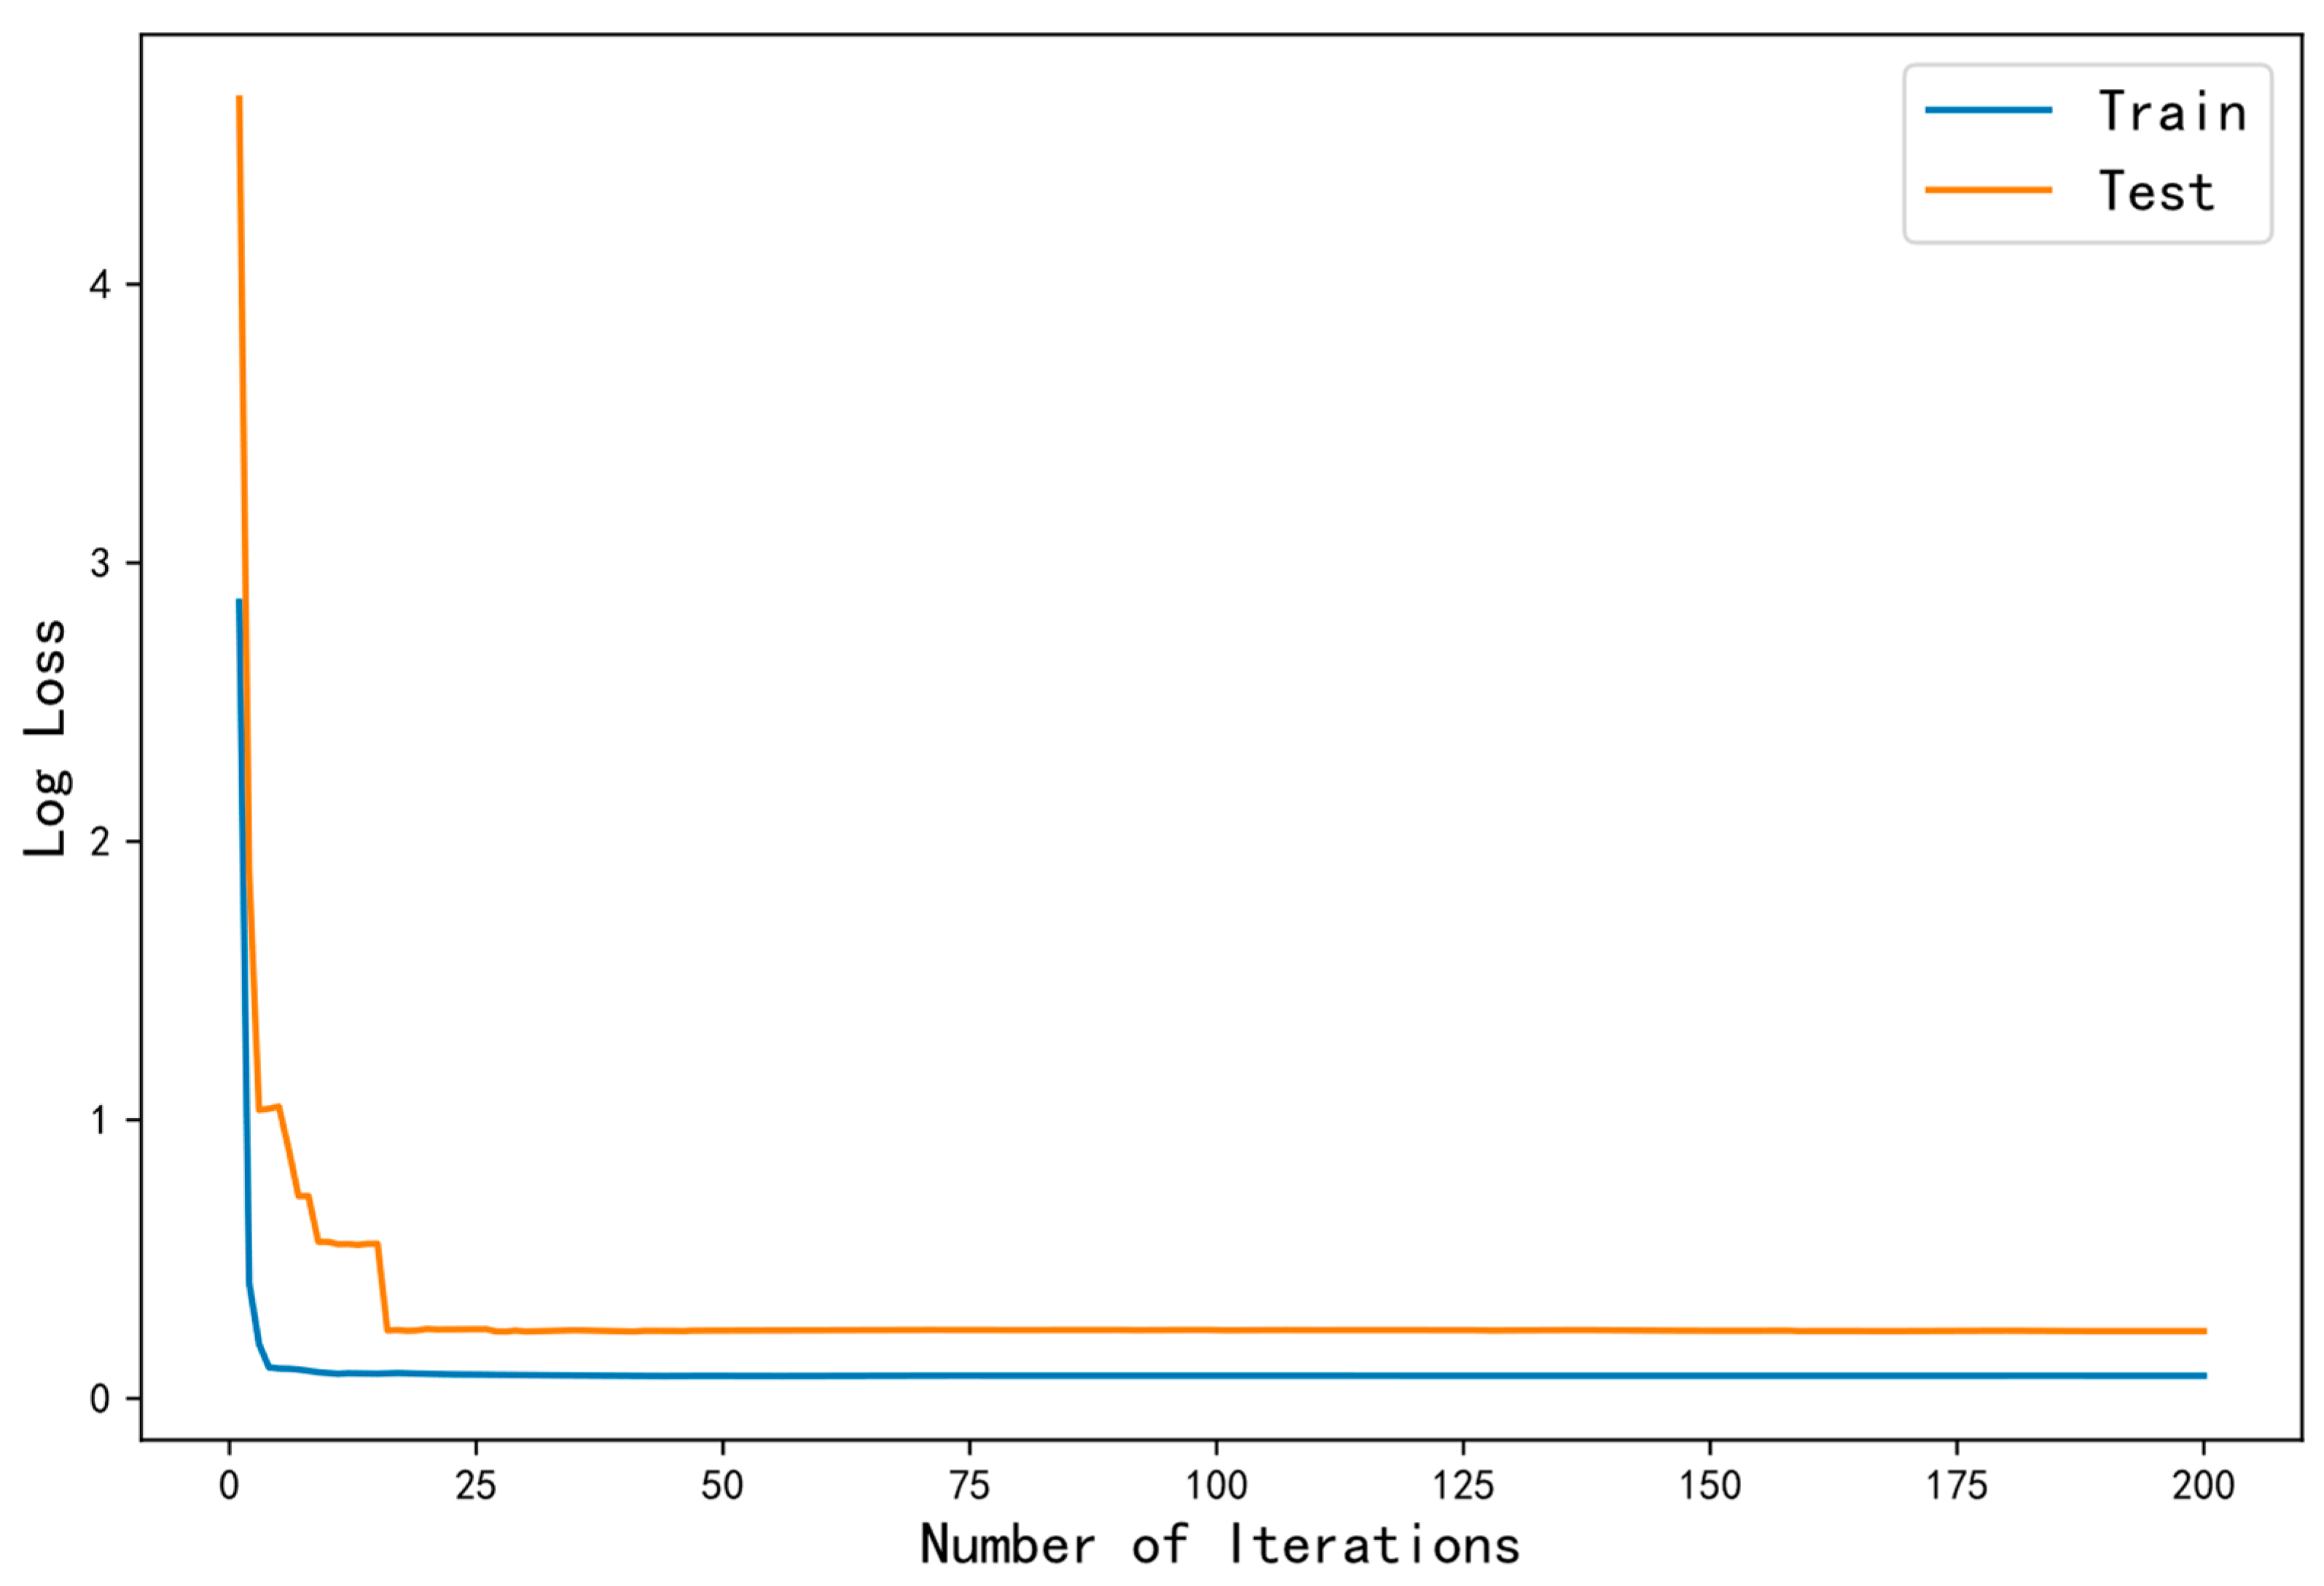
4.2. Model Stability Test

To ensure the stability and validity of the prediction model, stability and multicollinearity analyses were conducted before modeling consumer behavior. Specifically, the prediction model was optimized by gradually including variable factors such as user information (age and gender, and user star rating), merchant information (store star rating, number of reviews, positive rating, service attitude rating, logistics service rating, and description rating), and product information (product display granularity, price level, sales level, favorite level, display priority, and display frequency) to improve the accuracy of the prediction model. Table 2 shows the results of the chi−square and likelihood−ratio tests. The log−likelihood value of the model increased from −581,930 to −539,530, with a p−value of less than 0.000. These results indicate that the variables used in this study have a significant impact on consumers’ purchase behavior.
To ensure the robustness of our prediction model, the dataset was split into a training and test set at a ratio of 2:1. Additionally, a five−fold cross−validation was performed to assess the reliability of the mode 4. Table 3 shows that the prediction model exhibited significance in both training and test sets, with results consistent with those in Table 2. These results indicate that the prediction model constructed in this study is strong and suitable. Based on its validity and stability, a multicollinearity analysis of the model’s feature variables was conducted, which is presented in Table 4. As per Table 4, the absence of multicollinearity among variables is supported by the variance inflation factors of less than 3.9 for all variables.

4.3. Machine−Learning−Based Consumer Purchase Behavior Model

The purpose of this section is to determine the optimal predictive model for consumers’ purchase behavior. The sample dataset was divided into a training set and a test set with an 8:2 ratio, using logistic regression (LR), adaptive boosting (ADA), extreme gradient boosting (XGB), multilayer perceptron (MLP), naive bayes (NB) and random forest (RF), and other predictive modeling algorithms to analyze consumer purchase behavior. To evaluate the performance of each model, this study adopted a hierarchical five−fold cross−validation technique that utilized standard metrics such as average accuracy, precision rate, and F1 score. By comparing the experimental results of various different algorithms under the same conditions, it can be seen that the random forest shows the best classification ability and generalization performance compared to other algorithms. Table 5 shows that the random forest algorithm performed best in cross−validation on the training set (F1 = 0.8590), and Table 6 shows that it also achieved the best prediction performance in the test set (F1 = 0.8586). This indicates its strong ability to capture the causal relationship between consumer purchase behavior and independent variables with a good model fit. Therefore, the random forest model can serve as a reliable prediction model for predicting consumer purchase behavior. To observe the changes in model loss more intuitively, we have plotted the logarithmic loss of the random forest model on the training set and test set, respectively. Figure 1 shows that, as the number of iterations increased, both curves showed a gradual decrease that tended to stabilize over time. At the start of the training process, the loss was relatively high for both sets, but as the model training progressed, the loss decreased and eventually stabilized. Additionally, the narrowing gap between the loss curves of the training and the test sets indicates that the model performs well in both training and generalization, promising a high−quality performance in real−world applications.

4.4. Explainable Analysis of Consumer Purchase Behavior

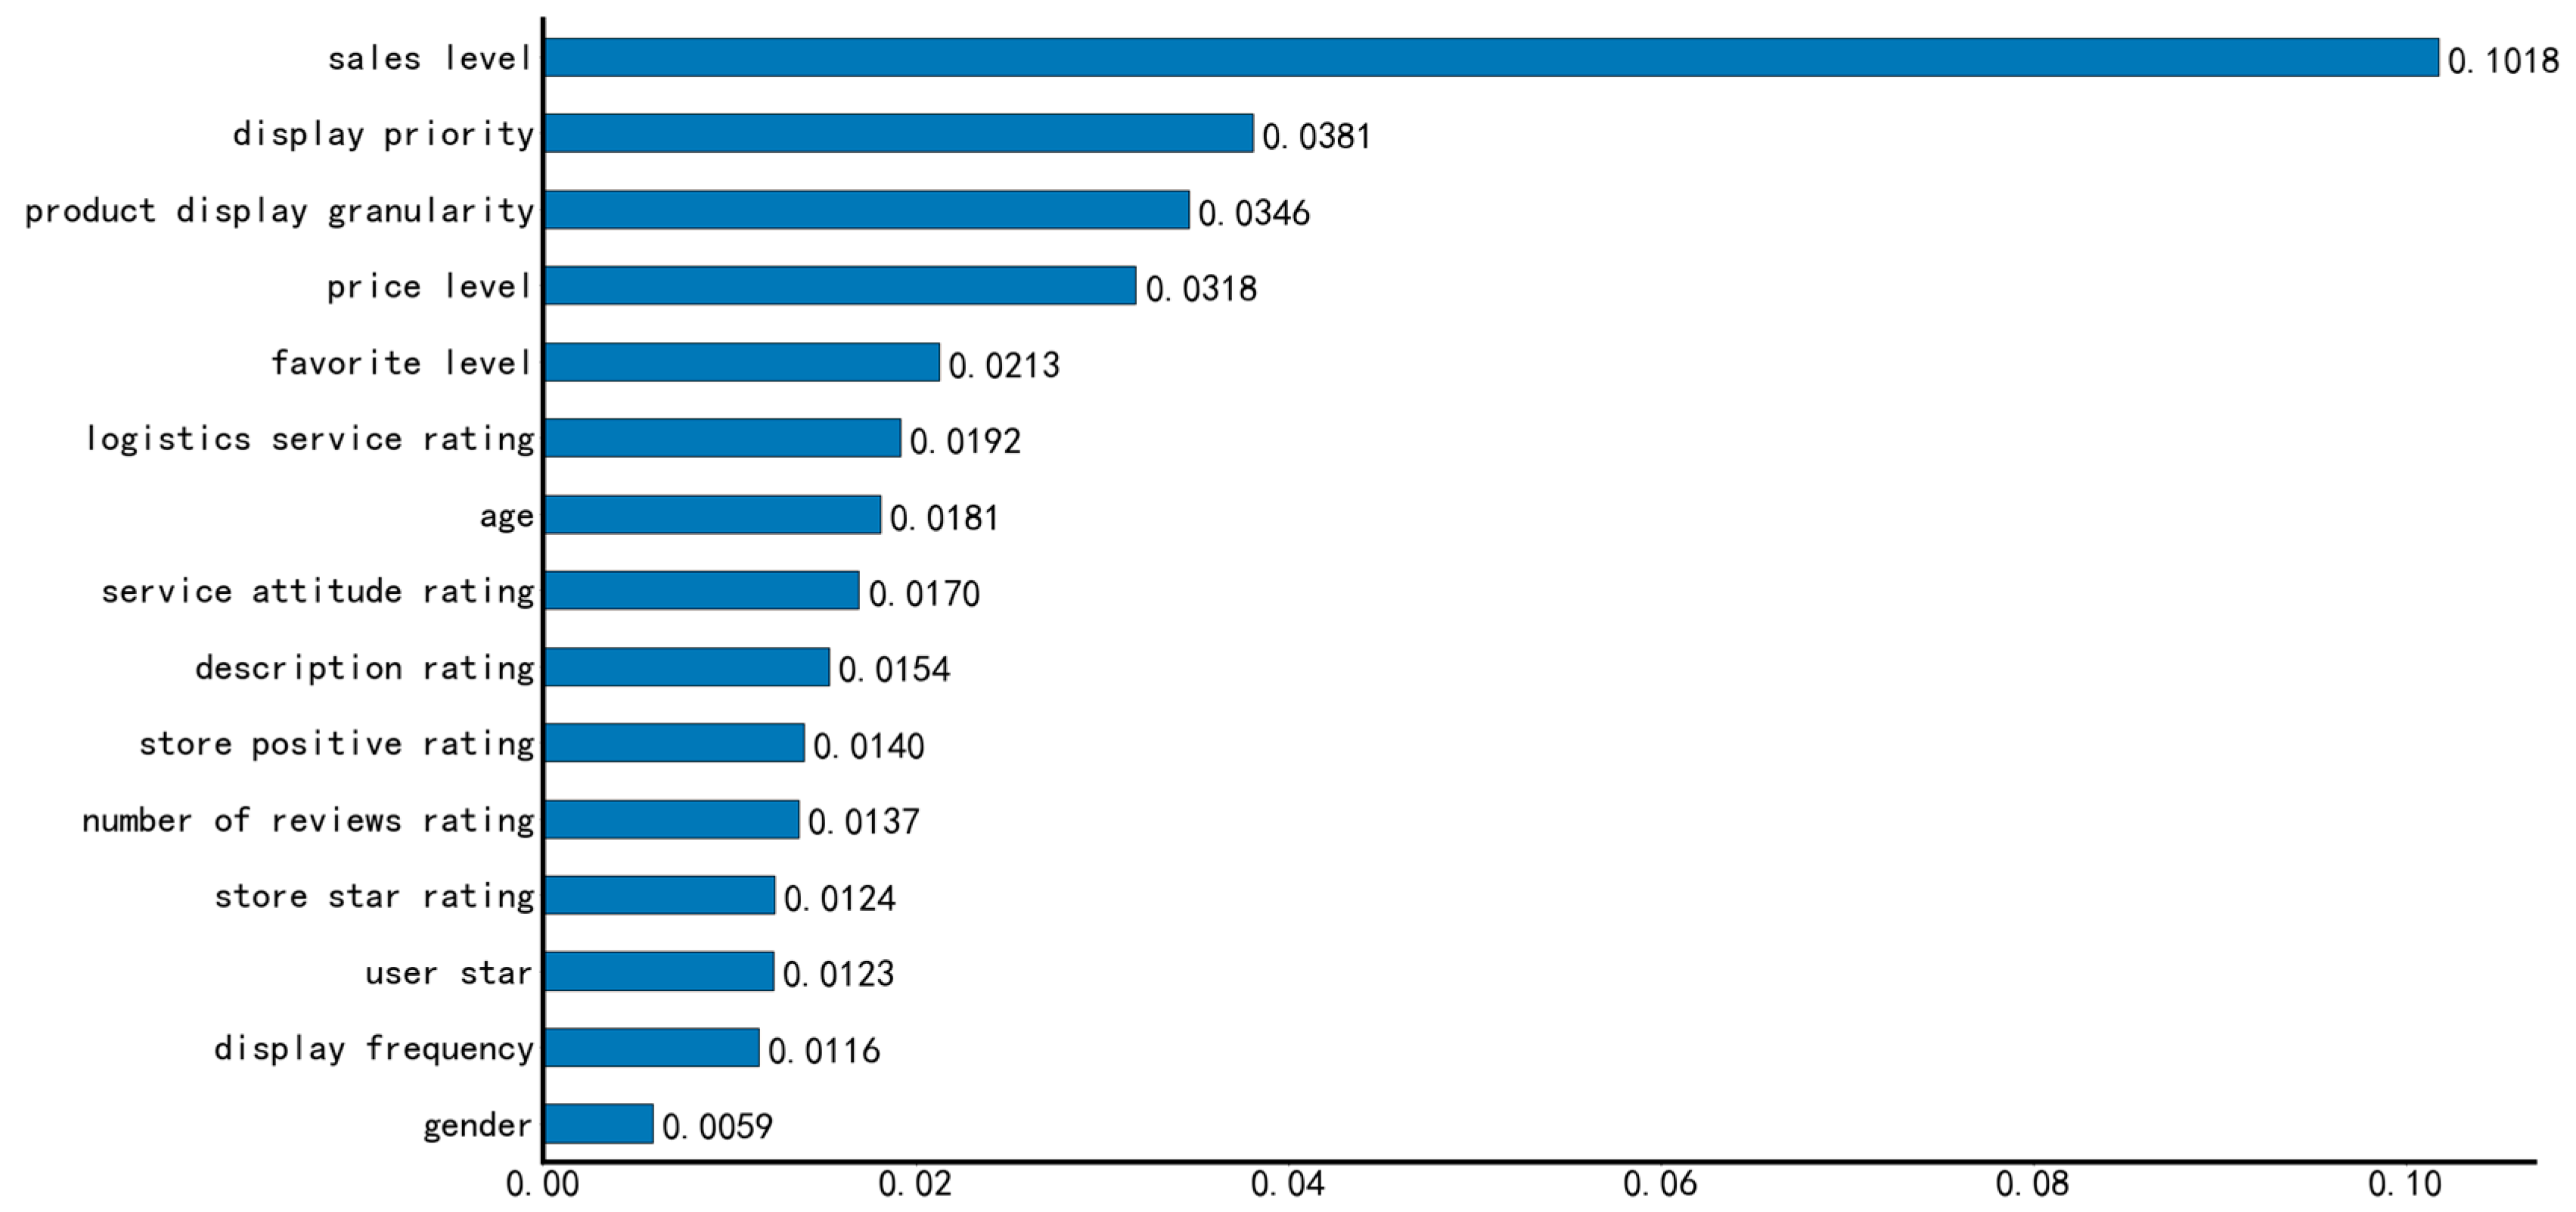
4.4.1. Importance of Model Features

This study characterized the impact of each feature on consumer purchase behavior by calculating its mean absolute SHAP value. Figure 2 shows the ranking results for the overall importance of the features in the model, highlighting that different types of information exerted different influences on consumer purchase behavior. Sales level had the greatest impact on consumer purchase behavior, followed by display priority and product display granularity. In contrast, user gender had the least impact. Regarding the information dimension, product information (i.e., product display granularity, price level, sales level, favorite level, display priority, and display frequency) had the greatest impact on consumer purchase behavior, followed by merchant information (i.e., store star rating, number of reviews, positive rating, service attitude rating, logistics service rating, and description rating), while user information (i.e., age and gender, and user star rating) had relatively less impact.

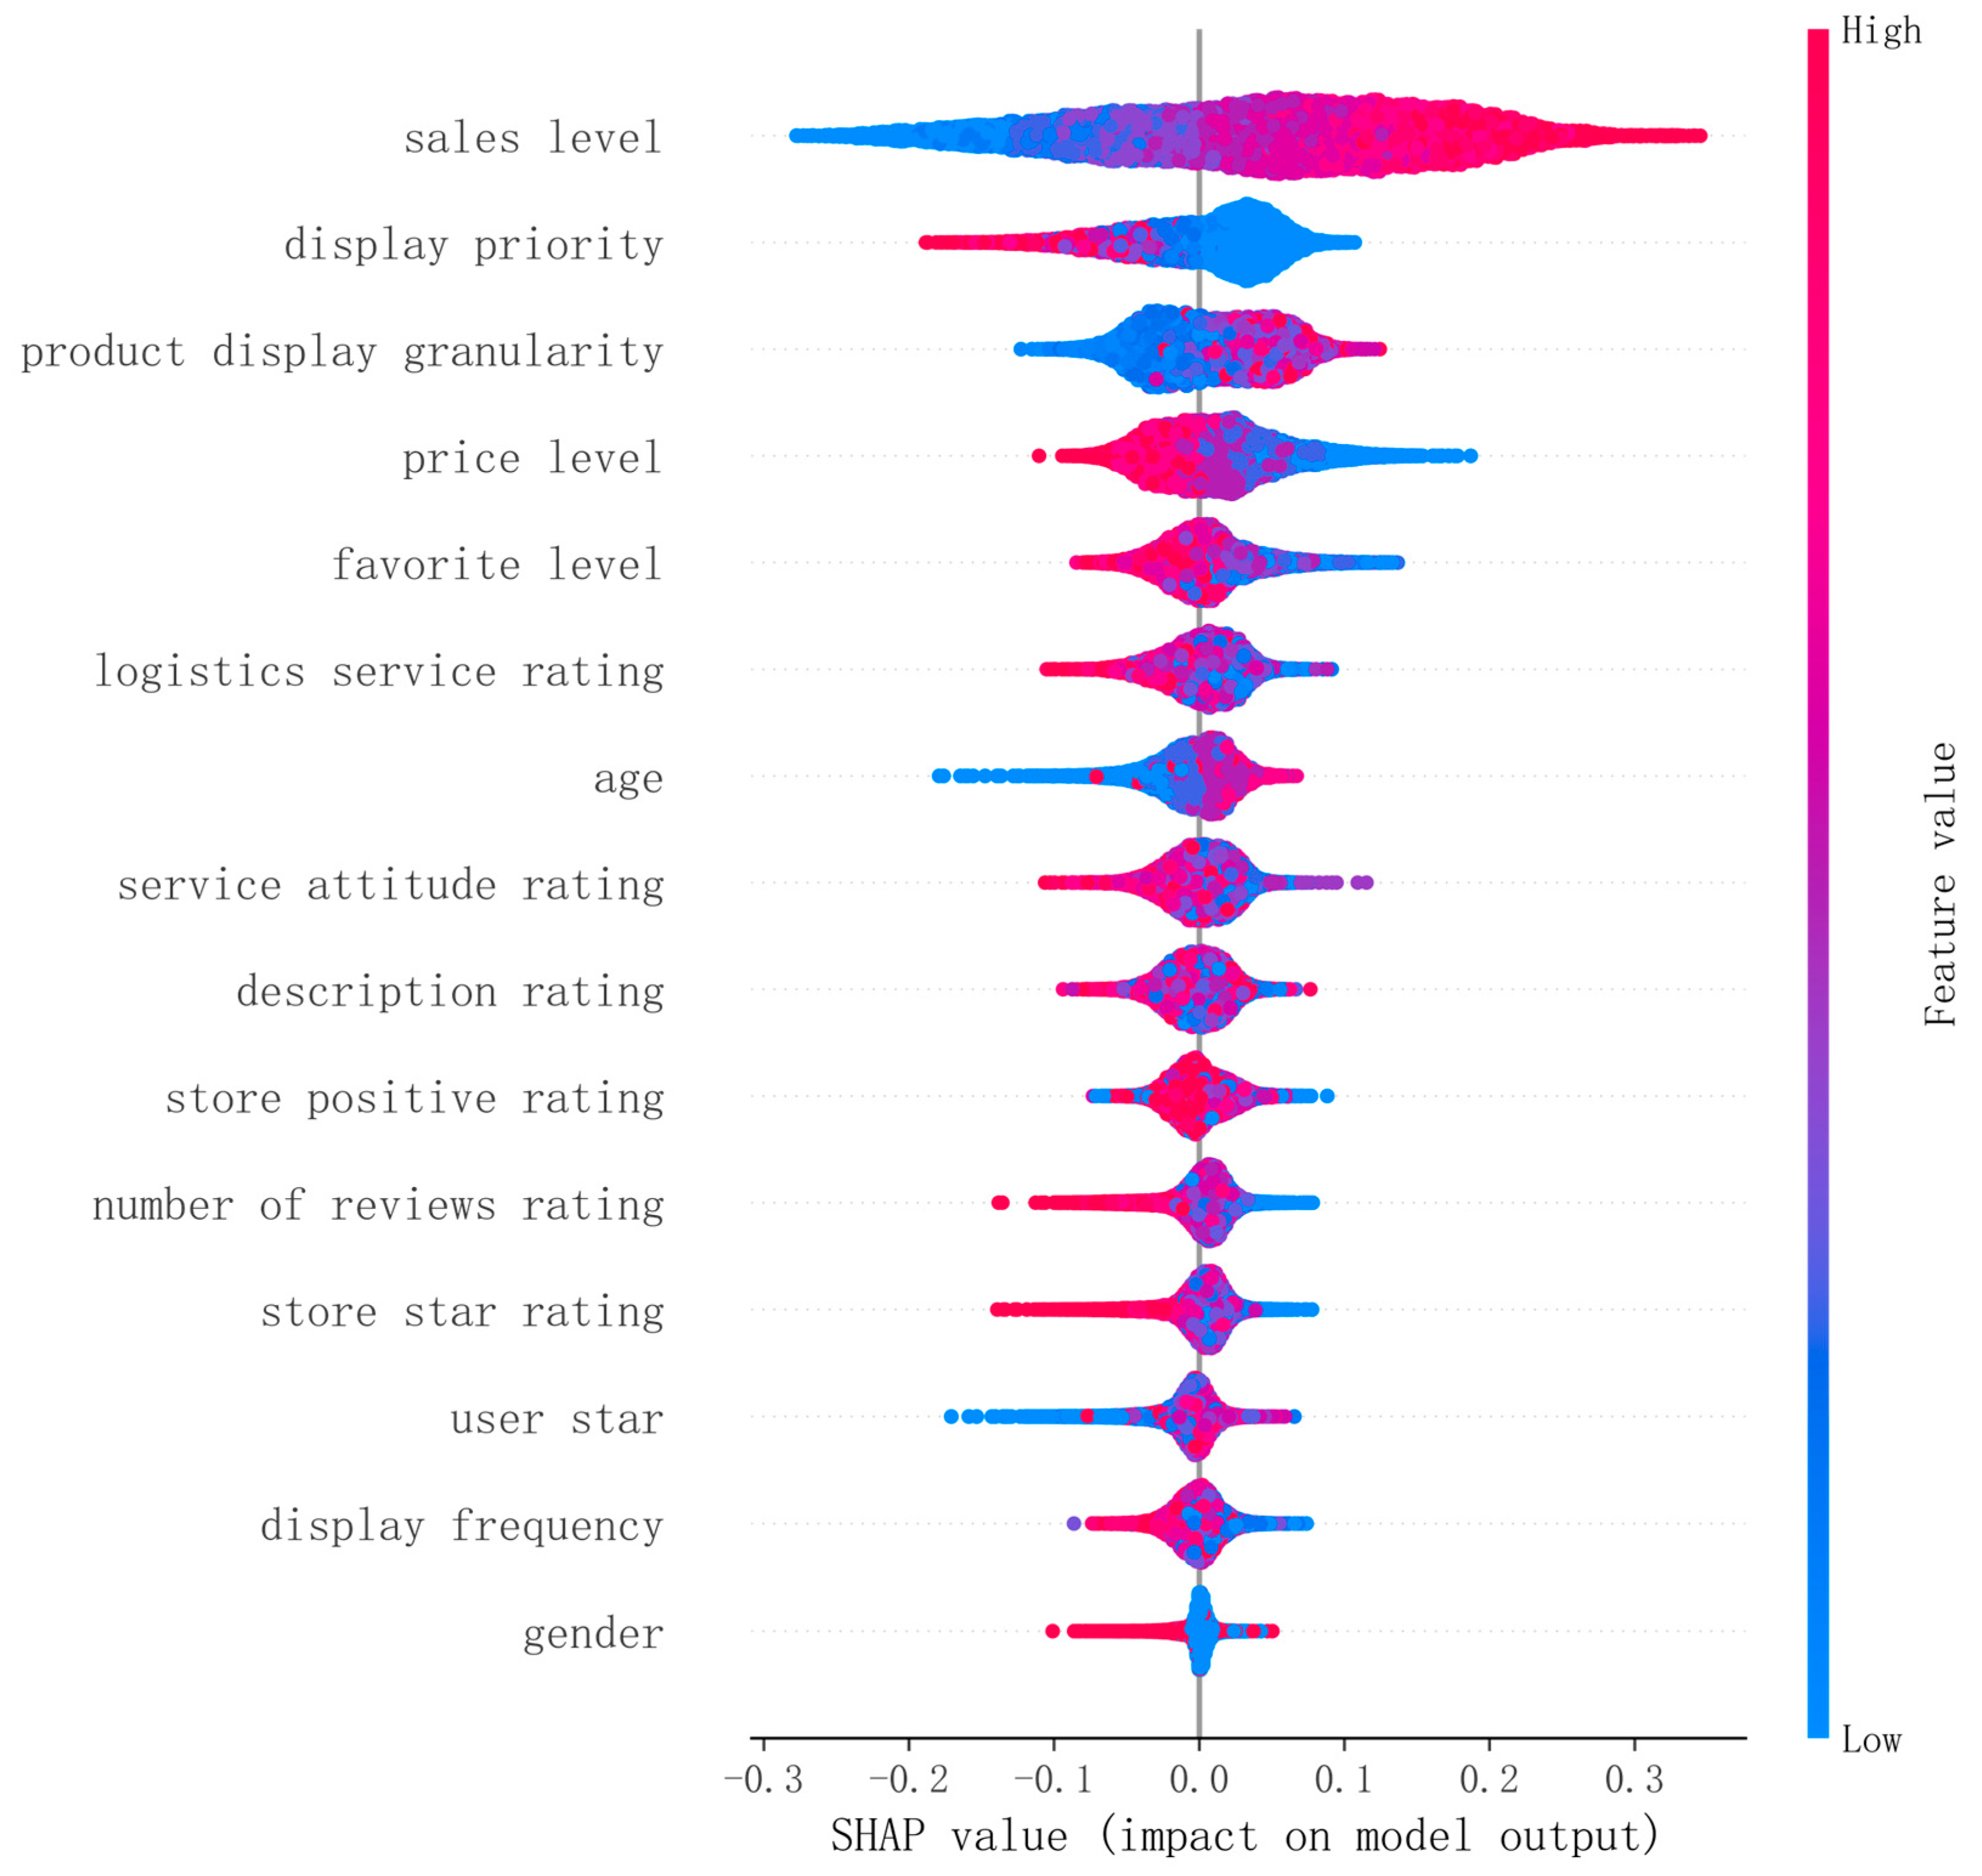
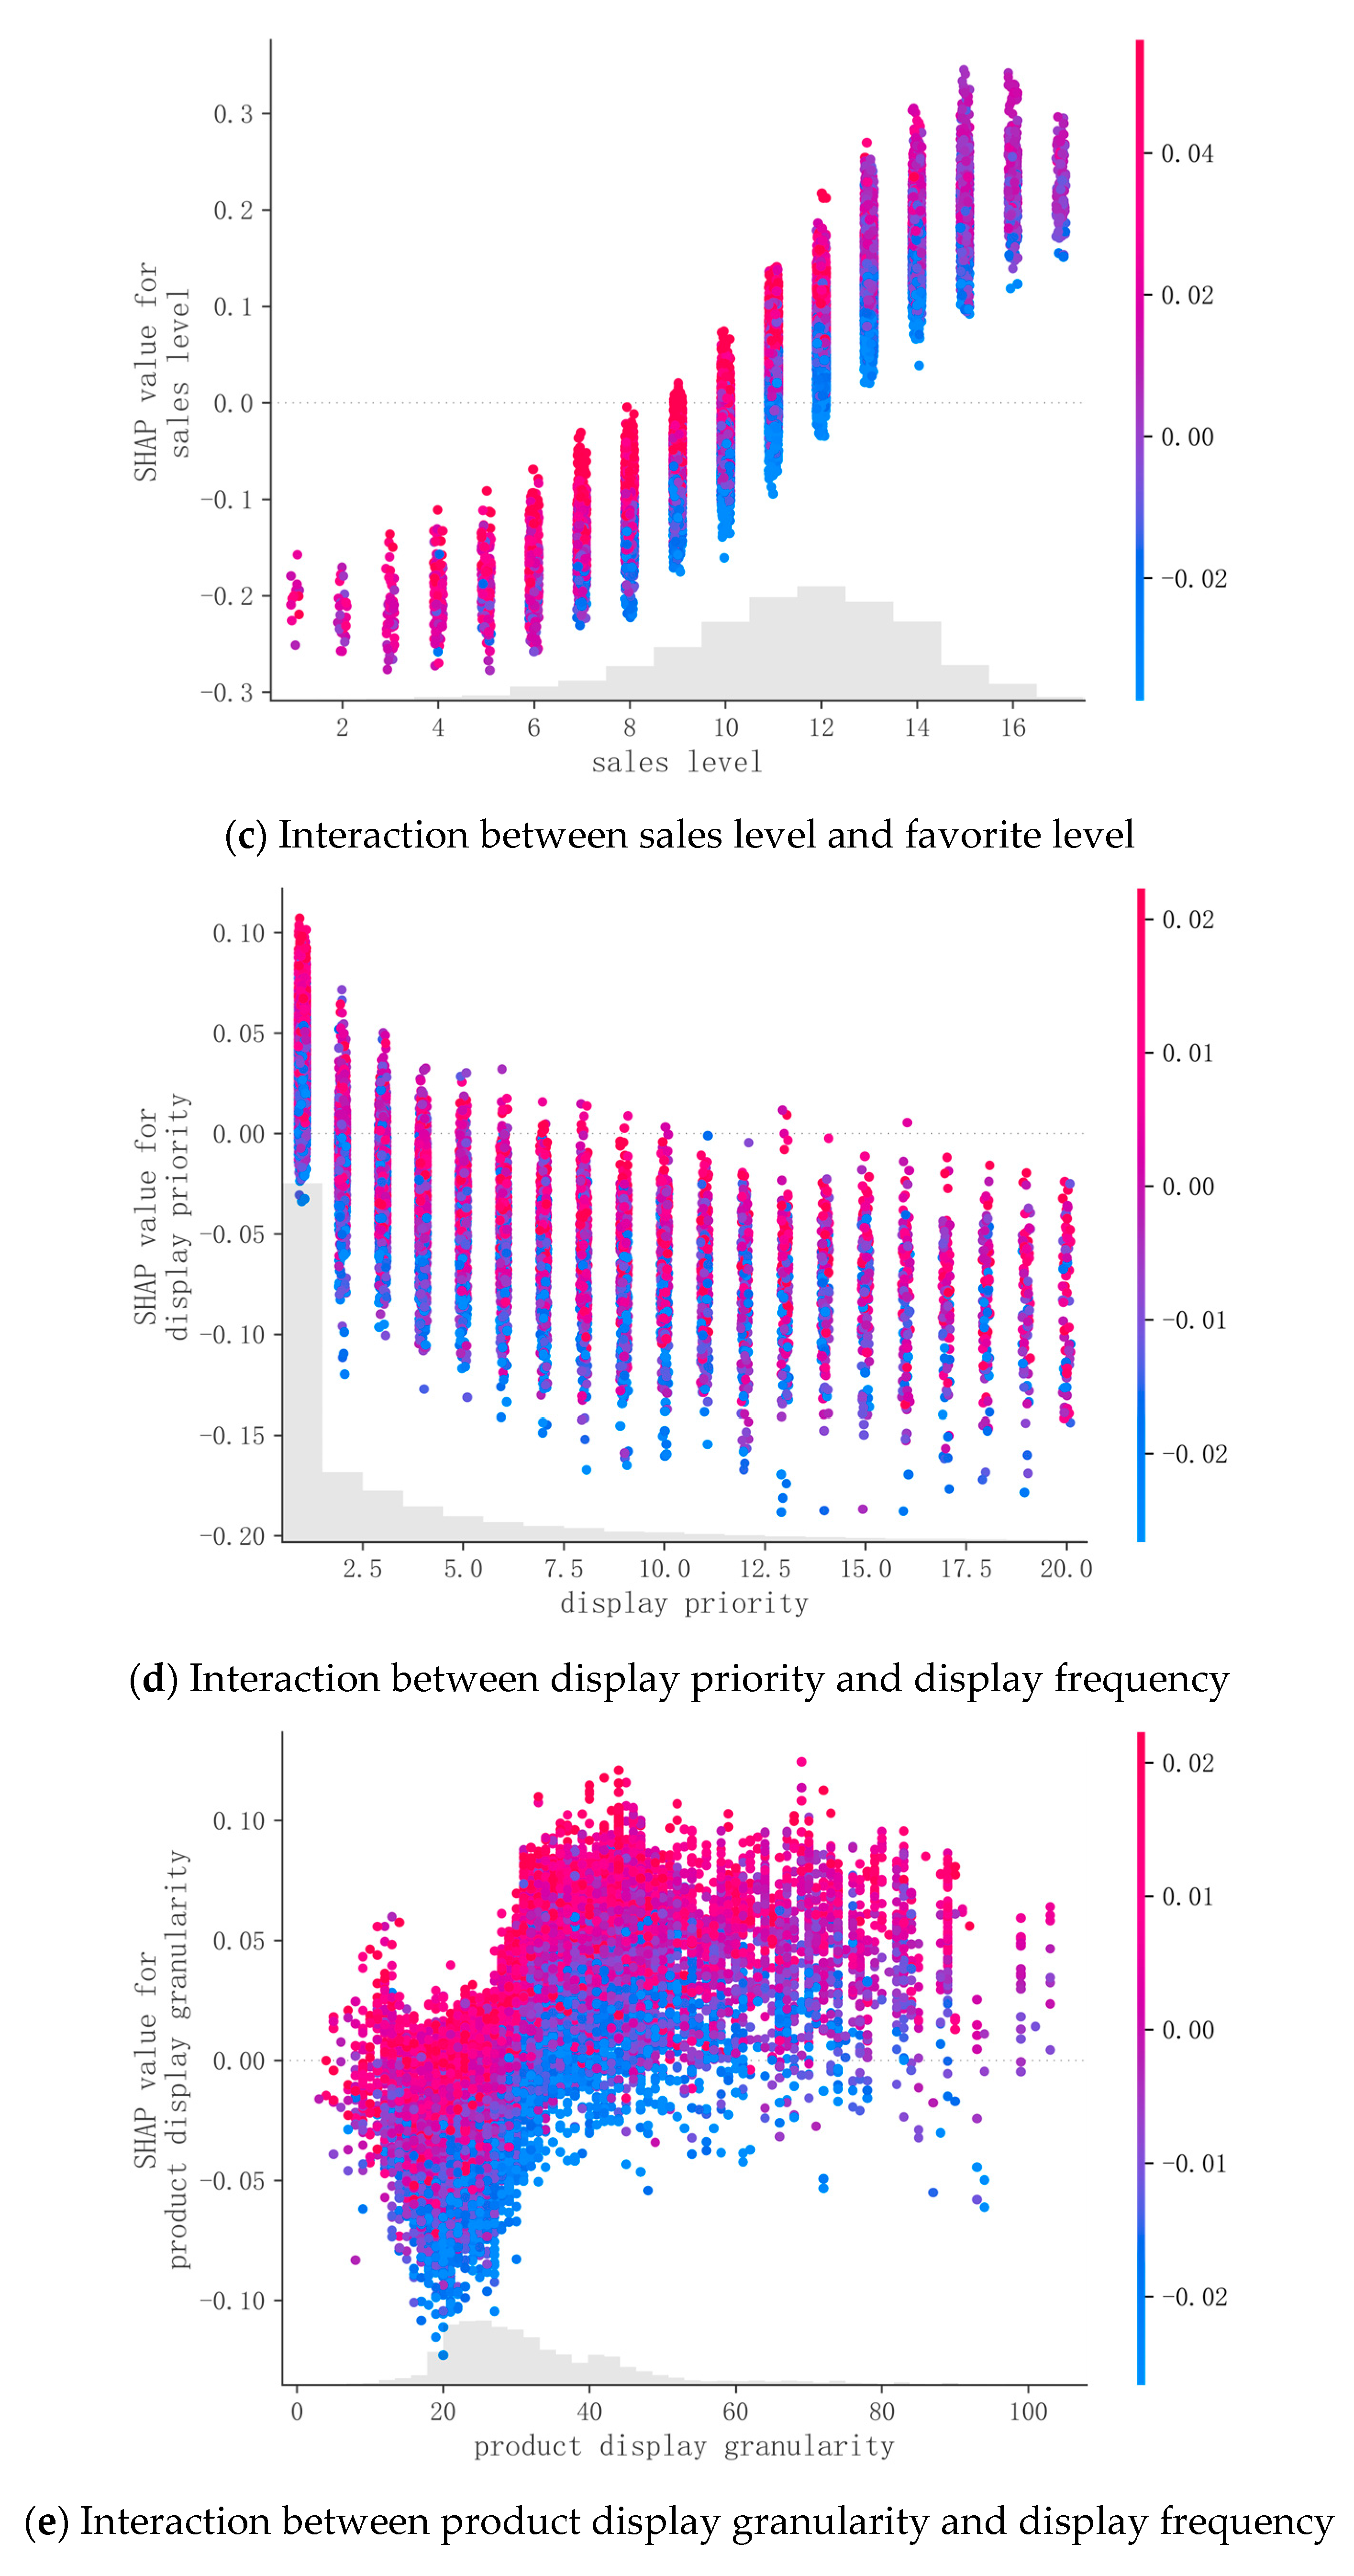
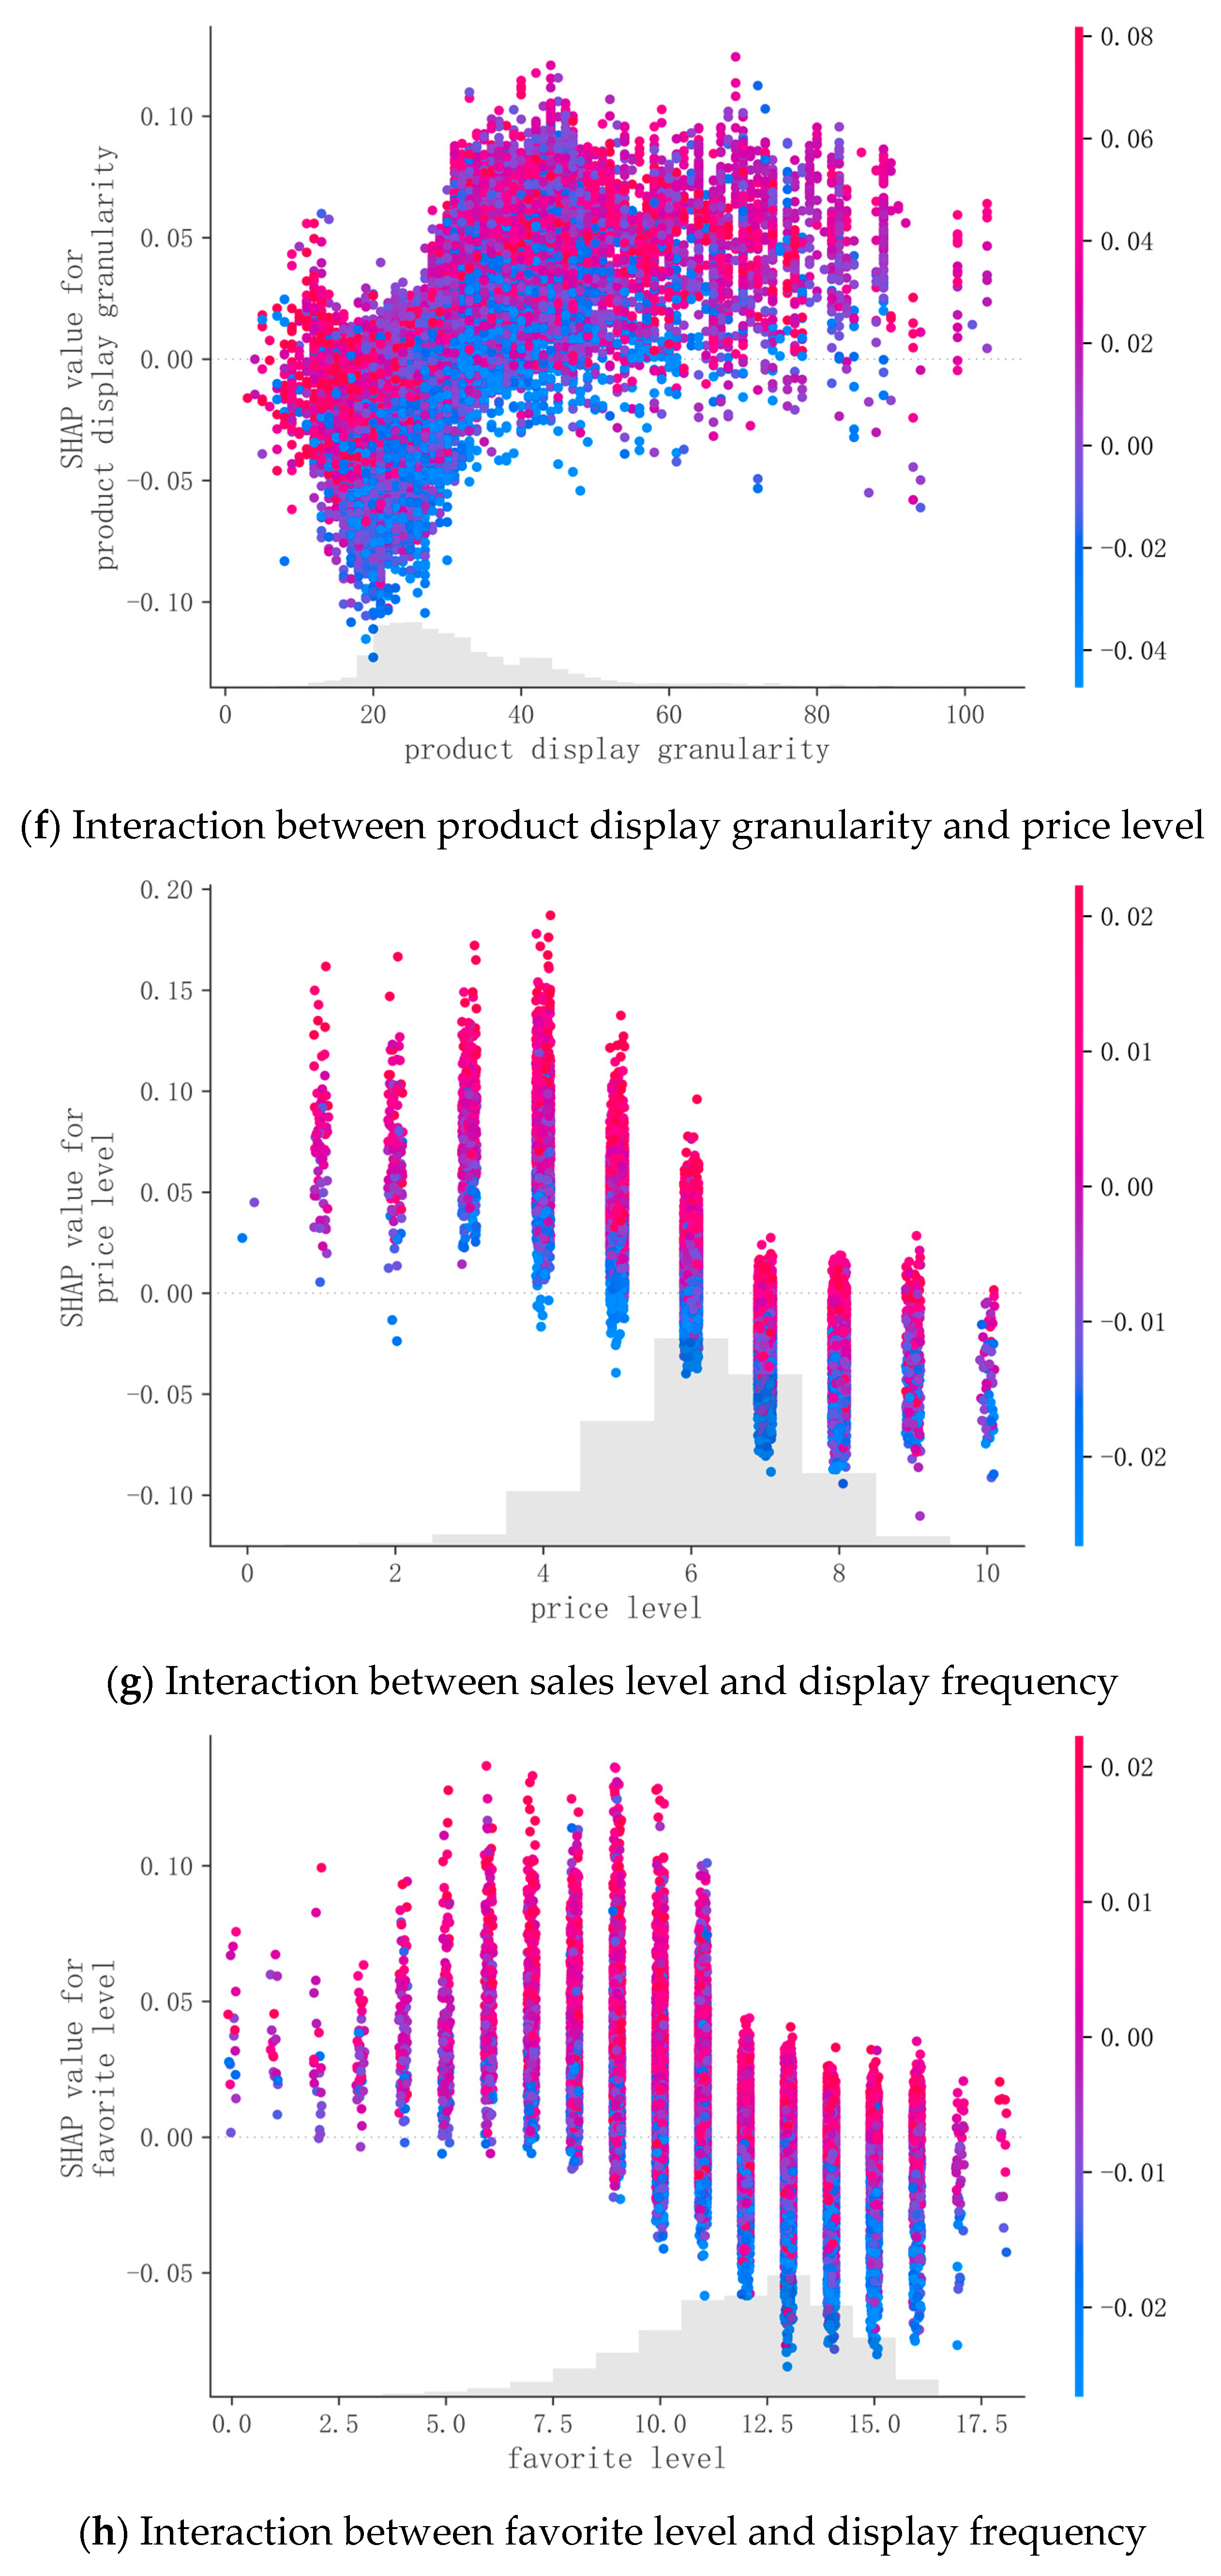
4.4.2. Specific Effects of Features on Consumer Purchase Behavior

This study examined the impact of each feature on consumer purchase behavior by calculating its mean absolute SHAP value. Figure 3 shows the overall importance of these features and highlights how different types of information influenced consumer purchase behavior. Certain factors, such as sales level, product display granularity, age, and user star rating, influenced consumers’ purchase behavior after clicking on an ad. As the amount of information available to consumers increased, they were more likely to make a purchase after clicking an ad. Sales level had the greatest impact on consumer purchase behavior, followed by display priority and product display granularity. In contrast, user gender had the least impact. In terms of information dimension, product information (which includes product display granularity, price level, sales level, favorite level, display priority, and display frequency) had the greatest impact on consumer purchase behavior, followed by merchant information (which includes store star rating, number of reviews, positive rating, service attitude rating, logistics service rating, and description rating), while user information (which includes age and gender, and user star rating) had relatively less impact, but had a dual effect of inhibiting or encouraging behavior in different situations.

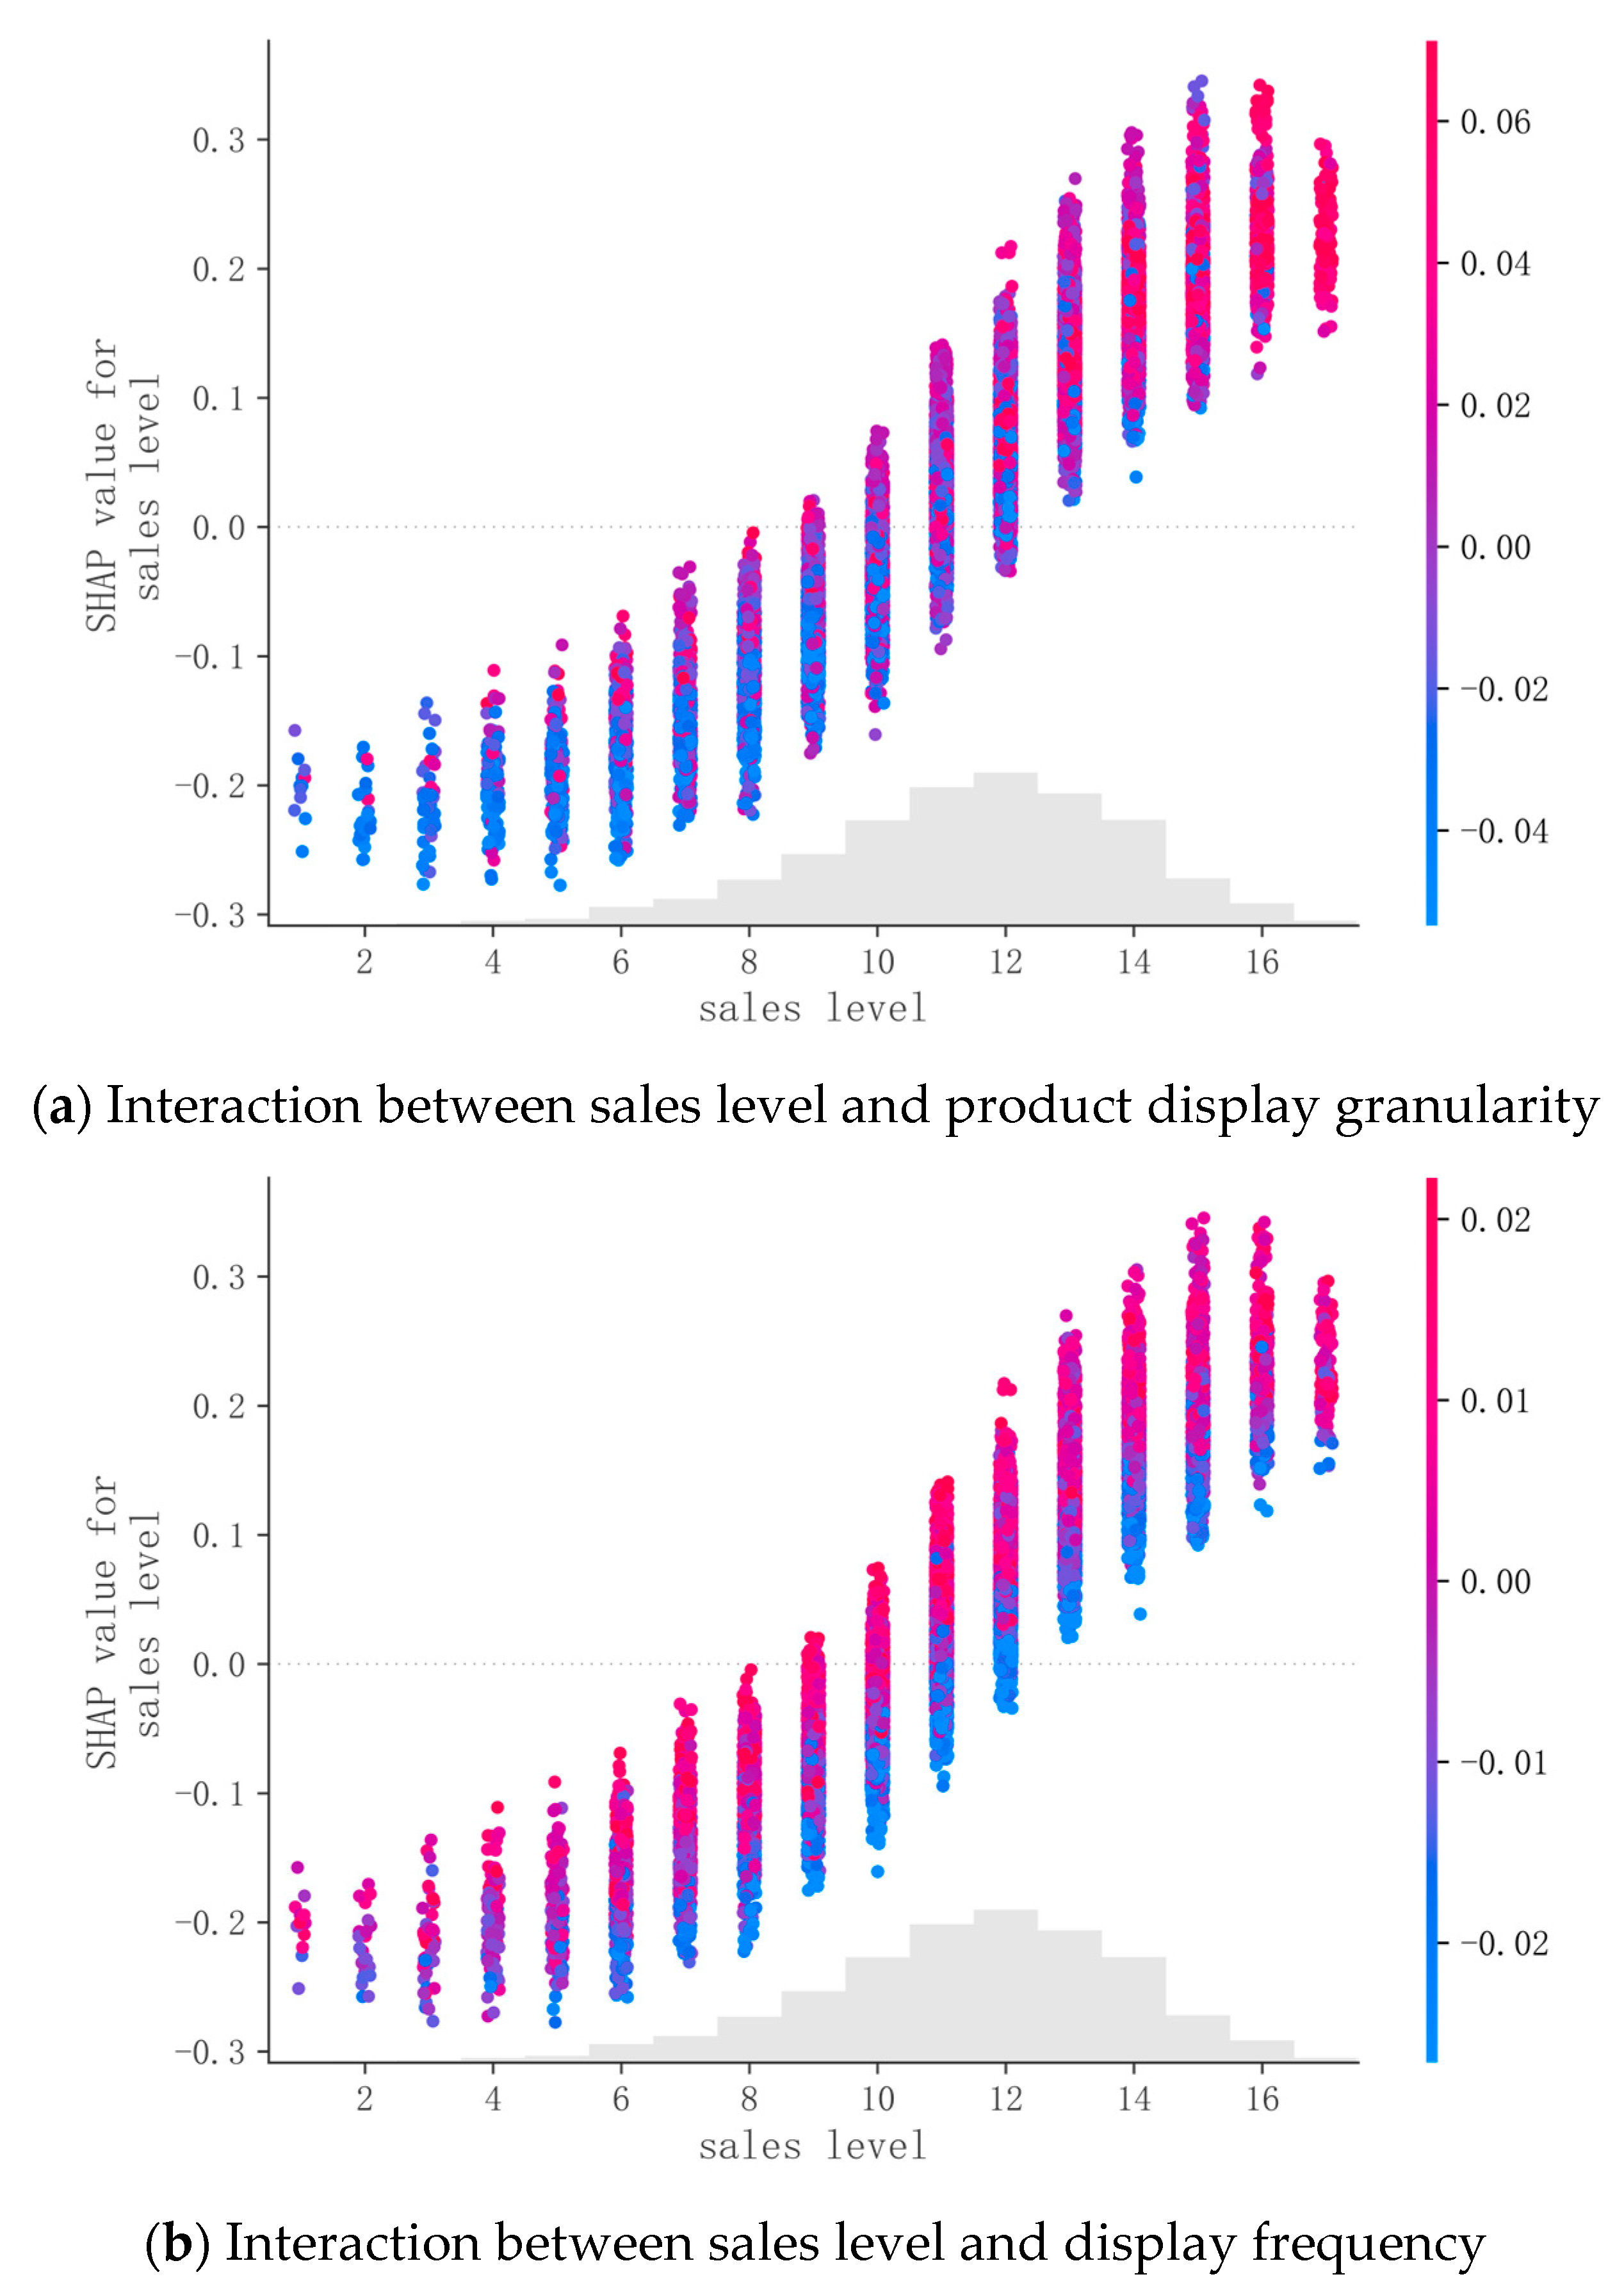
4.4.3. Explainable Analysis of Consumer Purchase Behavior

The SHAP values shown in Figure 1 indicate that product information was a key factor in consumers’ post−click ad decisions. Within this dimension, variables such as product sales, display priority, product display granularity, price, and favorite level had significant effects on consumers’ purchase behavior, as evidenced by Figure 3. To gain deeper insight into interactions of internal variables that affect consumer purchase behavior in this dimension, our study employed explainable interaction analysis through the use of SHAP, focusing specifically on product information variables.
Sales levels serve as indicators that reflect the popularity and core competitiveness of products among consumer groups and similar competing products in the same market [36]. Empirical studies have found that consumers use past sales as an anchor to judge popularity and tend to prefer top−selling products. Figure 4a shows that the anchoring effect increases consumers’ perceptions of quality for products with high sales volumes. Moreover, having a detailed display of the product makes it easier for consumers to judge its quality and make purchase decisions. Specifically, products with previously high sales volume and detailed display signal a high perceived quality, thus motivating more consumers to purchase. Similarly, as shown in Figure 4b, product sales and display frequency synergistically promote consumer purchase behavior. As sales levels increased, products with high display frequency were more likely to be purchased by consumers. This indicates that products with high display frequency were more effective in promoting purchase behavior than those with low display frequency. The results presented are similar to those in Figure 4a, further highlighting the critical importance of the anchoring effect on consumer purchase decisions. The results suggest that merchants can adjust product positioning and display frequency. This can have a direct impact on their sales levels and thus can drive consumer purchase behavior. Consumers’ collecting behavior reflects their product preferences to some extent [37]. As shown in Figure 4c, the likelihood of purchasing increases with sales levels, indicating the positive impact of higher anchor values on consumer purchase behavior. However, the likelihood of purchasing decreases as the number of products collected increases. This is because collecting behavior only indicates consumers’ preferences and intentions toward the products, rather than their actual purchase behavior. To a certain extent, adding products to favorites can divert consumers’ purchase behavior. Products with high favorite levels tend to attract more consumer attention and are more likely to be purchased than products with low favorites levels in the same sales situation. Therefore, it is recommended that consumers consider both the sales level and display situation of a product when making purchase decisions, rather than relying solely on collecting behavior as the only criterion. Products with high sales levels and moderate favorite levels will receive more attention than those with high sales levels and high favorite levels.
Figure 4d illustrates that the promotional effect of display frequency on consumer purchase behavior increased as the display priority of the product on the recommendation page increased. This suggests that display priority and frequency have synergistic promotional effects on consumer behavior. Even when the display priority is the same, consumers are more likely to be anchored to products with higher display frequency and encouraged to make transactions. This finding supports the theory of the anchoring effect. Therefore, when formulating product display strategies, merchants and platforms should prioritize products with the highest net profit on recommendation pages with higher display priority. It is advisable to increase the display frequency and exposure rate in order to establish high−quality anchor information, which will ultimately increase purchase conversion rates for shoppers. This, in turn, can increase overall platform revenues.
Figure 4e shows that the effectiveness of product information conveyed to consumers increased with the detail level of product display. Moreover, products displayed more frequently were more likely to be purchased by consumers. The anchoring effect suggests that frequently displayed products have higher anchoring values, resulting in a more stable consumer impact. Therefore, in order to optimize marketing investments, merchants and e−commerce platforms should prioritize high−display−frequency products with detailed displays. This strategy ensures better profitability and cost−effectiveness of product marketing investment conversions. Therefore, when creating detailed product−introduction pages, the focus should be on products with high display frequency. The results in Figure 4f suggest that products with more detailed displays had a stronger impact on driving consumer purchase intent for low−priced products when compared to higher−priced products. Conversely, higher−priced products were less effective in driving consumer purchase intent than lower−priced products, despite having the same level of display priority. This is because customers tend to consider higher−priced products as a reference point and attribute price increases to merchant profits, creating a sense of unfairness and discouraging the purchase of higher−priced products. Therefore, when considering both the level of product display and pricing holistically, a marketing strategy that combines low prices with detailed displays should be prioritized. This approach increases purchase intent and helps merchants identify potential best−selling products.
According to the anchoring effect theory, consumers’ prior experiences and knowledge of product anchors can influence their perceptions of prices and purchasing decisions. Figure 4g shows that a combination of affordable and frequently displayed products can encourage consumers to purchase. However, as prices increase, the anchoring effect becomes more pronounced, hindering consumers’ purchase decisions. As such, displaying products more frequently can effectively attract consumers’ attention, and those products with reasonable prices and frequent displays are more likely to be purchased by consumers under similar price conditions. The findings suggest that incorporating anchoring effects into pricing strategies can enhance product exposure and branding, while also providing competitive pricing advantages, ultimately leading to improved sales conversion rates and overall product competitiveness.
Figure 4h shows that products with high−frequency displays are more accessible than those with low−frequency displays. This strong anchoring effect remains consistent across product favorite level, indicating that consumers respond positively to the perceived anchor of display frequency. Merchants can leverage these findings to increase sales by optimizing product display frequency and increasing brand awareness to improve product exposure and sales conversion rates. It is important to note that favorability levels can have a dual effect on consumer purchase behavior, similar to the effect of sales levels on favorite levels. As a result, merchants need to comprehensively consider various factors when developing sales strategies, rather than relying solely on favorite level to predict sales.

5. Discussion

5.1. Theoretical Implications and Contributions

This paper aimed to investigate consumer purchase behavior in search advertising scenarios by constructing an explainable machine learning framework based on clickstream data. More specifically, we systematically explored the interaction effects of product information variables, such as product sales, display priority, product display granularity, price, and favorite level, on consumer purchase behavior. Our study provides theoretical insights and sheds light on the key factors influencing consumer behavior in search advertising.
Firstly, we developed a clickstream data−driven model of consumer purchase behavior using explainable machine learning algorithms. Our comparative analysis of different machine learning algorithms shows that the random forest algorithm has the highest level of suitability (F1 = 0.8586) for explainable machine learning modeling. We used this algorithm to analyze and predict consumer purchase behavior in the context of search advertising. Our study incorporated the SHAP explainable framework to account for consumers’ bounded rationality cognition. We quantified and attributed the importance of product, merchant, and user information, and ranked the factors that influence consumer purchase decisions as follows: product information > merchant information > user information. These findings are critical in understanding the key drivers of consumer purchase behavior.
Secondly, this study examined the effect of different anchors used in search ads on consumers’ purchase intentions. Our research shows that consumers rely heavily on word−of−mouth to judge the popularity and quality of products. They are more likely to purchase when presented with high−anchor information that characterizes quality judgments (e.g., sales ratings, product display granularity, etc.). Conversely, when faced with price anchors, consumers tend to make cost−effective choices by comparing the prices of competing products. The results suggest that lower−priced products are more likely to be purchased. Therefore, merchants need to consider the suitability of different anchor points in different product categories and provide consumers with a reliable basis for making informed decisions. This will enable consumers to make informed choices and minimize the information gap and costs associated with their decisions. These findings provide valuable guidance for merchants in developing effective sales strategies.

5.2. Practical Implications

The study provides valuable management insights for search advertisers and e−commerce merchants in developing product marketing strategies and ad recommendations.
Firstly, consumers typically use historical sales as an anchor point to measure the popularity of products and tend to purchase the best−selling products. Furthermore, a more detailed product display can improve consumers’ perceptions of product quality. Therefore, when designing product display strategies, merchants should prioritize products with high historical sales, display highly rated products more prominently on the recommendation page, and increase display frequency and exposure rates to improve consumer purchase conversion rates and platform revenues.
Secondly, a product’s historical sales level more accurately reflects the likelihood of it being purchased than its favorite level. Products with high sales but moderate popularity levels are more likely to be purchased than those with high popularity levels. A higher favorite level does not necessarily guarantee higher sales. Instead, high sales more accurately reflect product marketability. Therefore, merchants cannot rely solely on a product’s favorite level to predict its likelihood of purchase. Instead, they must comprehensively analyze the sales history and relevant market factors of products in order to develop more effective sales strategies.
Thirdly, implementing product display and pricing strategies based on anchoring effects can help improve the sales conversion rate and competitiveness of products. When considering factors such as product display and pricing, merchants should prioritize a marketing strategy that combines low prices with detailed product display pages to help identify potential best−selling products. In practice, merchants can skillfully combine information such as product sales and favorite levels to develop more effective product display and pricing strategies. Examples of this include displaying the original retail price, price range or average price on the display pages, or enhancing a product’s appeal through package design or gift certificates that showcase its unique features (e.g., style, quality and function, etc.).
We argue that search advertising platforms and merchants should consider the psychological aspects that influence consumer the purchase decisions. This can be achieved through the use of explainable machine learning techniques that explore and understand purchase behavior, especially with regard to factors such as sales and price levels that significantly influence consumer sensibility. This research provides insights to improve marketing strategies and enhance the user experience for search advertising, and has practical applications for e−commerce platforms and merchant decisions.

6. Conclusions

This study presents an explainable model, which integrates the random forest algorithm, to explore rational consumption behavior based on the anchoring effect. Using actual clickstream data from a large e−commerce platform, our study investigated the prioritization of crucial factors influencing consumers’ online purchase behavior and their mechanisms of action. To ensure reliable results, we conducted both multicollinearity analysis and a stability analysis separately in constructing a predictive model of the customers’ purchase intentions. Several important conclusions can be drawn from the study.
Firstly, explainable machine learning models incorporating SHAP technology open up new research directions for predicting and understanding consumers’ online purchasing behavior. In this study, we propose an explainable model that integrates random forest. The model clearly represents the contribution of each factor to the predicted outcomes and takes into account the interaction between multiple factors. Therefore, it provides both a deeper and more comprehensive understanding of the factors that influence consumers’ purchase behavior online. Compared to traditional single−variable analysis methods, our proposed model visually and clearly illustrates the influence relationship between influencing variables and distinguishes their positive or negative effects on the results.
Secondly, in the model explainability section, we used Shapley values to differentiate the feature importance of influencing factors. Our results show that product information has a higher impact on consumer purchase behavior than merchant or user information does. This implies that consumers consider product information such as sales level, display priority, display granularity, and price level when making purchase decisions. Such product information is the foremost consideration for consumers and represents key directions in which merchants should focus on improving the user experience.
Finally, multiple factors of product information can influence consumers’ online purchase behavior through the anchoring effects. Both high−anchor (e.g., high sales, high display frequency) and low−anchor (e.g., low price) factors can shape consumers’ perceptions and purchase decisions. Cognitive anchors (e.g., granularity and detail of displayed products) contribute to consumer purchase intention and perceived quality. Furthermore, the prioritization of product display and pricing strategies can also facilitate consumer purchase behavior.
This study has both theoretical and practical implications, and several issues remain unexplored. Firstly, we did not conduct in−depth research on other consumer behaviors in search ads, such as browsing and cart abandonment. Secondly, we only examined the effect of multiple variables on consumer behavior within a single aspect of product information. Future research is needed to examine the interaction effects among different dimensions, such as product−merchant and product−user characteristics. The following issues should be considered in future research: (1) how to better utilize the other shopping behavior characteristics of consumers in order to improve the marketing effectiveness of search ads, and (2) how to strengthen research on the interaction effects among different dimensions, such as product information, merchant information, and user characteristics, in order to gain a comprehensive understanding of the decision mechanisms and paths of consumers’ online shopping behavior. In addition, SHAP technology has unique interpretability and flexibility, which greatly improves the interpretability of predictive models and has been widely used in multiple fields. In the future, we need to further expand the application scenarios of SHAP, such as in image recognition and video analysis. At the same time, we can also improve the computational efficiency and reduce complexity by using more optimized algorithms and adding support for distributed computing.

Author Contributions

Conceptualization, Y.C. and H.L.; methodology, Y.C.; software, W.L.; validation, Y.C. and H.L.; formal analysis, Z.W.; data curation, W.L.; writing—original draft preparation, Y.C.; writing—review and editing, H.L. and Z.W.; funding acquisition, Z.W. All authors have read and agreed to the published version of the manuscript.

Funding

This research was funded by National Education Science Planning Youth Project of the Ministry of Education (Grant No.: EIA210424).

Institutional Review Board Statement

Not applicable.

Informed Consent Statement

Not applicable.

Data Availability Statement

Not applicable.

Conflicts of Interest

The authors declare no conflict of interest.

References

  1. Brands, M. The Blossoming of global advertisement market compared to before epidemic the prediction of global advertisement by MAGNA. China Advert. 2022, 2, 83–88. [Google Scholar]
  2. Bucklin, R.E.; Sismeiro, C. Click here for Internet insight: Advances in clickstream data analysis in marketing. J. Interact. Mark. 2009, 23, 35–48. [Google Scholar] [CrossRef]
  3. Gong, J.; Abhishek, V.; Li, B. Examining the impact of keyword ambiguity on search advertising performance: A topic model approach. MIS Q. Manag. Inf. Syst. 2018, 42, 805–829. [Google Scholar] [CrossRef]
  4. Chan, T.Y.; Park, Y. Consumer search activities and the value of ad positions in sponsored search advertising. Mark. Sci. 2015, 34, 606–623. [Google Scholar] [CrossRef] [Green Version]
  5. Yuan, Y.; Wang, F.; Zeng, D. Competitive analysis of bidding behavior on sponsored search advertising markets. IEEE Trans. Comput. Soc. Syst. 2017, 4, 179–190. [Google Scholar] [CrossRef]
  6. Simon, H.A. A behavioral model of rational choice. Q. J. Econ. 1955, 69, 99–118. [Google Scholar] [CrossRef]
  7. Tversky, A.; Kahneman, D. Judgment under Uncertainty: Heuristics and Biases: Biases in judgments reveal some heuristics of thinking under uncertainty. Science 1974, 185, 1124–1131. [Google Scholar] [CrossRef]
  8. Lee, J.; Jung, O.; Lee, Y.; Kim, O.; Park, C. A Comparison and Interpretation of Machine Learning Algorithm for the Prediction of Online Purchase Conversion. J. Theor. Appl. Electron. Commer. Res. 2021, 16, 1472–1491. [Google Scholar] [CrossRef]
  9. Kaustia, M.; Alho, E.; Puttonen, V. How much does expertise reduce behavioral biases? The case of anchoring effects in stock return estimates. Financ. Manag. 2008, 37, 391–412. [Google Scholar] [CrossRef]
  10. Hardesty, D.M.; Suter, T.A. E-tail and retail reference price effects. J. Prod. Brand Manag. 2005, 14, 129–136. [Google Scholar] [CrossRef]
  11. Zhang, J.; Chiang, W.K. Durable goods pricing with reference price effects. Omega 2020, 91, 102018. [Google Scholar] [CrossRef]
  12. Chen, K.; Zha, Y.; Alwan, L.C.; Zhang, L. Dynamic pricing in the presence of reference price effect and consumer strategic behaviour. Int. J. Prod. Res. 2019, 58, 546–561. [Google Scholar] [CrossRef]
  13. Leonidou, L.C.; Eteokleous, P.P.; Christofi, A.-M.; Korfiatis, N. Drivers, outcomes, and moderators of consumer intention to buy organic goods: Meta-analysis, implications, and future agenda. J. Bus. Res. 2022, 151, 339–354. [Google Scholar] [CrossRef]
  14. Ye, Q.; Fang, B. Learning from other buyers: The effect of purchase history records in online marketplaces. Decis. Support Syst. 2013, 56, 502–512. [Google Scholar] [CrossRef]
  15. Chaudhary, K.; Alam, M.; Al-Rakhami, M.S.; Gumaei, A. Machine learning-based mathematical modelling for prediction of social media consumer behavior using big data analytics. J. Big Data 2021, 8, 1–20. [Google Scholar] [CrossRef]
  16. Xiahou, X.; Harada, Y. B2C E-commerce customer churn prediction based on K-means and SVM. J. Theor. Appl. Electron. Commer. Res. 2022, 17, 458–475. [Google Scholar] [CrossRef]
  17. Shrirame, V.; Sabade, J.; Soneta, H.; Vijayalakshmi, M. Consumer Behavior Analytics using Machine Learning Algorithms. In Proceedings of the 2020 IEEE International Conference on Electronics, Computing and Communication Technologies (CONECCT), Bangalore, India, 2–4 July 2020. [Google Scholar] [CrossRef]
  18. Ping, Y.; Buoye, A.; Vakil, A. Enhanced review facilitation service for C2C support: Machine learning approaches. J. Serv. Mark. 2023, 37, 620–635. [Google Scholar] [CrossRef]
  19. Baati, K.; Mohsil, M. Real-Time prediction of online shoppers’ purchasing intention using random forest. In Artificial Intelligence Applications and Innovations, Proceedings of the 16th IFIP WG 12.5 International Conference, AIAI 2020, Neos Marmaras, Greece, 5–7 June 2020; Springer International Publishing: Cham, Switzerland, 2020. [Google Scholar]
  20. Doornenbal, B.M.; Spisak, B.R.; van der Laken, P.A. Opening the black box: Uncovering the leader trait paradigm through machine learning. Leadersh. Q. 2022, 33, 101515. [Google Scholar] [CrossRef]
  21. Chen, T.; Guestrin, C. XGBoost: A scalable tree boosting system: KDD’16. In Proceedings of the 22nd ACM SIGKDD International Conference on Knowledge Discovery and Data Mining, New York, NY, USA, 13–17 August 2016. [Google Scholar]
  22. Athey, S.; Imbens, G. Recursive partitioning for heterogeneous causal effects. Proc. Natl. Acad. Sci. USA 2016, 113, 7353–7360. [Google Scholar] [CrossRef] [Green Version]
  23. Shrikumar, A.; Greenside, P.; Kundaje, A. Learning important features through propagating activation differences. arXiv 2017, arXiv:1704.02685. [Google Scholar] [CrossRef]
  24. Gunning, D.; Aha, D. DARPA’s explainable artificial intelligence (XAI) program. AI Mag. 2019, 40, 44–58. [Google Scholar] [CrossRef]
  25. Lundberg, S.M.; Lee, S. A unified approach to interpreting model predictions. arXiv 2017, arXiv:1705.07874. [Google Scholar] [CrossRef]
  26. Demajo, L.M.; Vella, V.; Dingli, A. Explainable ai for interpretable credit scoring. arXiv 2020, arXiv:2012.03749. [Google Scholar] [CrossRef]
  27. Hakkoum, H.; Abnane, I.; Idri, A. Interpretability in the medical field: A systematic mapping and review study. Appl. Soft Comput. 2022, 117, 108391. [Google Scholar] [CrossRef]
  28. Lampridis, O.; Guidotti, R.; Ruggieri, S. Explaining sentiment classification with synthetic exemplars and Counter-Exemplars. In Discovery Science, Proceedings of the 23rd International Conference, DS 2020, Thessaloniki, Greece, 19–21 October 2020; Springer International Publishing: Cham, Switzerland, 2020. [Google Scholar]
  29. Haque, A.K.M.B.; Islam, N.; Mikalef, P. Notion of Explainable Artificial Intelligence—An Empirical Investigation from a User’s Perspective. In Proceedings of the European Conference on Information Systems (ECIS), Kristiansand, Norway, 5–8 June 2023. [Google Scholar]
  30. Ullah, I.; Liu, K.; Yamamoto, T.; Zahid, M.; Jamal, A. Modeling of machine learning with SHAP approach for electric vehicle charging station choice behavior prediction. Travel Behav. Soc. 2023, 31, 78–92. [Google Scholar] [CrossRef]
  31. Oldenburg, F.; Han, Q.; Kaiser, M. Interpretable deep learning for forecasting online advertising costs: Insights from the competitive bidding landscape. arXiv 2023, arXiv:2302.05762. [Google Scholar] [CrossRef]
  32. An, J.; Do, D.K.X.; Ngo, L.V.; Quan, T.H.M. Turning brand credibility into positive word-of-mouth: Integrating the signaling and social identity perspectives. J. Brand Manag. 2019, 26, 157–175. [Google Scholar] [CrossRef]
  33. Biswas, M.; Tania, M.H.; Kaiser, M.S.; Kabir, R.; Mahmud, M.; Kemal, A.A. ACCU3RATE: A mobile health application rating scale based on user reviews. PLoS ONE 2021, 16, e0258050. [Google Scholar] [CrossRef]
  34. Bergh, D.D.; Ketchen, J.D.J.; Orlandi, I.; Heugens, P.P.M.A.R.; Boyd, B.K. Information asymmetry in management research: Past Accomplishments and future opportunities. J. Manag. 2019, 45, 122–158. [Google Scholar] [CrossRef]
  35. Bagwell, K. The economic analysis of advertising. Handb. Ind. Organ. 2007, 3, 1701–1844. [Google Scholar] [CrossRef]
  36. Li, H.; Wu, Y.J.; Chen, Y. Time is money: Dynamic-model-based time series data-mining for correlation analysis of commodity sales. J. Comput. Appl. Math. 2020, 370, 112659. [Google Scholar] [CrossRef]
  37. Wang, Y.; Shang, W.; Li, Z. The application of factorization machines in user behavior prediction. In Proceedings of the 2016 IEEE/ACIS 15th International Conference on Computer and Information Science (ICIS), Okayama, Japan, 26–29 June 2016. [Google Scholar] [CrossRef]
Figure 1. Log loss convergence graph of random forest model.
Systems 11 00312 g001
Figure 2. Feature importance based on SHAP values.
Systems 11 00312 g002
Figure 3. Summary diagram of characteristic SHAP values.
Systems 11 00312 g003
Figure 4. Interaction among internal characteristics within the product information dimension.
Systems 11 00312 g004aSystems 11 00312 g004bSystems 11 00312 g004c
Table 1. Descriptive statistics of consumer data sets.
Advertising InformationVariableMean ValueStandard
Deviation
Minimum
Value
25%
Quantile
Median75%
Quantile
Maximum Value
Product
Information
Product display granularity28.589411.032611222632105
Price level6.55881.2590067712
Sales level9.78372.678518101217
Favorite level11.22602.5328010121318
Display priority4.21784.4625112620
Display frequency16.33012.1694115171822
Merchant InformationStore star rating14.52103.0033113151621
Number of
reviews rating
16.15433.2826114161825
Store positive
rating
0.99440.00840.75000.99160.997811
Service attitude rating0.97280.00970.36000.96660.97330.97911
Logistics service rating0.97230.00980.52000.96590.97280.97961
Description rating0.97350.01250.36000.96550.97590.98271
User
Information
Gender0.21970.414100001
Age4.53281.234314458
User star5.47332.1349146711
Table 2. Model stability test.
Model Verification 1Model Verification 2Model Verification 3Model Verification 4
Constant of preference for variety0 ***0 ***0 ***0 ***
Product
Information
Product display
granularity
//0 ***0 ***
Price level//0 ***0 ***
Sales level//0 ***0 ***
Favorite level//0 ***0 ***
Display priority//0 ***0 ***
Display frequency//0 ***0 ***
Merchant
Information
Store star rating/0 ***/0 ***
Number of reviews rating/0 ***/0 ***
Store positive rating/0 ***/0 ***
Service attitude
rating
/0 ***/0 ***
Logistics service
rating
/0 ***/0.01 *
Description rating/0.042/0.01 *
User
Information
Gender0 ***0 ***0 ***0 ***
Age0 ***0 ***0 ***0 ***
User star0 ***0.0190 ***0 ***
Log−Likelihood−581,930−578,610−544,850−539,530
LL−Null−582,720
LLR p−value0000
Note: * p < 0.05 indicates statistical significance at the 5% level (95% confidence). *** p < 0.001 indicates extremely high statistical significance at the 0.1% level (99.9% confidence).
Table 3. Cross−validation significance test of model variables.
Model 4−cv1Model 4−cv2Model 4−cv3Model 4−cv4Model 4−cv5
Constant of preference for variety0 ***0 ***0 ***0 ***0 ***
Product
Information
Product display granularity0 ***0 ***0 ***0 ***0 ***
Price level0 ***0 ***0 ***0 ***0 ***
Sales level0 ***0 ***0 ***0 ***0 ***
Favorite level0 ***0 ***0 ***0 ***0 ***
Display priority0 ***0 ***0 ***0 ***0 ***
Display frequency0 ***0 ***0 ***0 ***0 ***
Merchant
Information
Store star rating0 ***0 ***0 ***0 ***0 ***
Number of reviews rating0 ***0 ***0 ***0 ***0 ***
Store positive rating0 ***0 ***0 ***0 ***0 ***
Service attitude
rating
0 ***0 ***0 ***0 ***0 ***
Logistics service
rating
0.0610.028 *0.02 *0.03 *0.009 **
Description rating0.018 *0.036 *0.014 *0.015 *0.012 *
User
Information
Gender0 ***0 ***0 ***0 ***0 ***
Age0 ***0 ***0 ***0 ***0 ***
User star0 ***0 ***0 ***0 ***0 ***
Log−Likelihood−431,110−431,280−431,100−432,560−432,050
LL−Null−465,420−465,870−465,850−467,000−466,740
LLR p−value00000
Note: * p < 0.05 indicates statistical significance at the 5% level (95% confidence). ** p < 0.01 indicates highly statistical significance at the 1% level (99% confidence). *** p < 0.001 indicates extremely high statistical significance at the 0.1% level (99.9% confidence).
Table 4. Multicollinearity test.
DimensionVariablesVIF
Product
Information
Product display granularity1.2057
Price level1.4919
Sales level3.5342
Favorite level3.0699
Display priority1.0119
Display frequency1.8554
Merchant
Information
Store star rating1.4020
Number of reviews rating1.0868
Store positive rating1.5322
Service attitude rating3.8984
Logistics service rating3.7150
Description rating2.1626
User
Information
Gender1.0111
Age1.0363
User star1.0347
Table 5. Cross−validation results of model training set.
LRADAXGBMLPNBRF
Accuracy0.65750.66760.66050.66250.61050.7783
Precision0.97300.97300.97350.97350.97060.9725
F1_score0.77650.78380.77870.78000.74140.8590
Roc_auc0.73620.74100.75030.75020.65990.7730
Table 6. Prediction effect of model test set.
LRADAXGBMLPNBRF
Accuracy0.65810.66630.65930.65650.61120.7777
Precision0.97300.97300.97350.97370.97060.9727
F1_score0.77690.78290.77780.77570.74190.8586
Roc_auc0.73590.73940.74950.75130.66000.7748
Disclaimer/Publisher’s Note: The statements, opinions and data contained in all publications are solely those of the individual author(s) and contributor(s) and not of MDPI and/or the editor(s). MDPI and/or the editor(s) disclaim responsibility for any injury to people or property resulting from any ideas, methods, instructions or products referred to in the content.

