1. Introduction
The outbreak of COVID-19 caused huge disasters and heavy losses worldwide, which also triggered people’s reflection and attention on the prevention and control of major epidemics and material support [
1]. The issue of how to allocate scarce emergency materials reasonably has become a key concern for ensuring patient safety and reducing losses. Researchers [
2,
3,
4,
5] have addressed this issue from a variety of perspectives, primarily studying how to optimize the allocation of scarce emergency materials to reduce delivery times, reduce costs, and maximize demand satisfaction. The current research on emergency management material allocations still has limitations, as most models only focus on single-period allocations. However, for major public health events, as an epidemic develops, the demand for emergency materials will accordingly change dynamically [
6]. Therefore, this study considered the demand characteristics of different periods of epidemic disasters and established a dynamic multi-period model to optimize material allocation.
During the outbreak of major epidemics, the supply of emergency materials often cannot meet the demand, and there is a serious of shortages of medical equipment, protective equipment, and daily necessities. The shortage of medical materials will lead to an increase in the spread of the epidemic. Therefore, this study took the shortage of materials as the optimization goal, aiming to improve the satisfaction rate of patients and further ensure their health.
Among the many shortages of emergency materials, different categories of materials have different demand characteristics. For example, consumables need to be delivered regularly to meet the needs of each person multiple times, but materials with high durability usually need to be delivered only once to each person [
7]. Nevertheless, a low distribution efficiency will not only delay the delivery of emergency materials and increase the suffering of people affected, but for patients who rely on specific emergency materials, a shortage will directly endanger their lives, thus creating a greater social security risk [
8]. However, research on the emergency material allocation of major public health events ignores the patients’ subjective feelings. In this case, this study considered both the objective characteristics of scarce materials and the subjective urgency of patients’ demand for materials and constructed an emergency material demand urgency index system to quantify and distinguish the urgency of different emergency materials.
To minimize casualties and property damage in disaster areas and to distribute emergency materials in the shortest time, emergency relief must simultaneously achieve the goal of efficiently, accurately, and equitably meeting the demand for emergency materials. Therefore, based on the proposed urgency of demand, this study designed a material shortage adjustment coefficient to adjust the amount of material shortage, reflecting not the traditional quantity of shortage, but taking into account the importance of materials, which is more in line with practical needs and achieving fair distribution.
Above all, this study took dynamic changes in emergency materials demand and differences in the urgency of emergency materials demand for various types of materials into consideration, to construct an index system indicating the urgency of emergency materials. Furthermore, this adjusted the goal of minimizing material shortage via the material shortage adjustment coefficient to develop a dynamic optimization model for emergency logistics with multi-period and multi-frequency distribution. This model ensured that high-importance emergency materials are distributed priority and that emergency materials are distributed fairly to improve emergency rescue.
This paper makes the following contributions:
- (1)
This paper proposes a dynamic optimization model for emergency logistics that takes multiple periods, frequencies, and types into account, in contrast to traditional emergency logistics, which only consider a single type of emergency material and a single period.
- (2)
Compared to the lack of research on patients’ subjective feelings in the existing literature, this paper considers both the subjective feelings of patients towards the shortage of emergency materials, and the differences in the importance of different emergency materials, and establishes a demand urgency index system and numerical calculation method.
- (3)
Compared to existing models that focus on delivery time and cost as optimization objectives, the objective function of minimizing the total material shortage is improved by the material shortage adjustment coefficient, which is more in line with the fair distribution goal of balancing actual demand and material importance in reality.
The rest of this study is as follows.
Section 2 presents the literature review.
Section 3 introduces the assessment method of emergency material demand urgency.
Section 4 constructs a dynamic distribution model of emergency materials that considers demand urgency.
Section 5 presents an example analysis of two cities, Wuhan and Shanghai, at different stages of epidemic development.
Section 6 presents the research conclusions and future research directions.
2. Literature Review
Generally, most researchers have studied emergency materials distribution by developing models and algorithms to provide decision-makers with solutions. Some researchers have focused on the improvement of emergency material distribution speed for vehicle routing problems. Xue et al. developed a multi-objective optimization model under capacity-constrained conditions, minimizing the shortest average waiting time for rescue at the affected point with access constraints [
2]. Wang et al. proposed a scenario-specific emergency material distribution model with time windows to minimize emergency material loading and unloading time and distribution time [
3]. Wang et al. developed a dual-objective mixed-integer programming model based on state–space–time networks with the minimum cost and the maximum emergency response speed to meet demands [
9]. Wu et al. presented an emergency material dispatching model with a time window to satisfy the objective of minimum vehicle cost [
10]. The above research shows that vehicle routing optimization is relatively rich for traditional emergency logistics in natural disasters.
Furthermore, to meet emergency relief needs more quickly, many researchers have studied the location problem of pre-disaster emergency facilities and post-disaster emergency facilities, as well as that of the emergency medical center. Boonmee and Kasemset proposed a decision model for locating, stocking, and distributing pre-disaster materials, which minimized response time as well as budget costs [
4]. Ghasemi and Khalili-Damghani proposed a robust simulation optimization method to optimize the selection of emergency facility locations and material inventory during the planning stage [
11]. Zhang et al. proposed a scenario-based stochastic planning method that integrated decisions on facility location, material inventory, and material distribution under different scenarios [
12]. However, most of the models outlined above are single-period allocation models, which cannot be applied to the multi-period problem, where the demand amount changes dynamically over time. Only a few studies have explored multi-period models. Yang et al. proposed a robust optimization model, with a static pre-disaster phase and a dynamic post-disaster phase, for prepositioning the distribution of emergency supplies over multiple periods [
13]. Wang et al. developed an optimization decision model for the dynamic distribution of emergency materials under fuzzy information conditions to minimize system loss and delay time [
14]. While most of these studies focused on developing multi-period emergency logistics optimization under natural disasters, it was difficult to find emergency logistics studies that took into account how material demand changes with the spread of epidemics. Therefore, this paper focuses on the multi-period and multi-frequency allocation problem of emergency materials for major epidemics.
The main goal of the above studies was to design emergency logistics optimization strategies to improve the speed of material distribution and the efficiency of the allocation of relief facilities. However, it is also important to focus on the subjective perceptions of affected people regarding the effectiveness of humanitarian emergency relief, in addition to ensuring the efficiency of rescue [
15]. Wang et al. designed a distress function to portray affected people’s perceived distress costs using a numerical rating scale (NRS) and incorporated these factors into decision-making for the total costs of emergency response [
16]. Zhu et al. measured psychological distress as an economic loss and developed a mathematical model to minimize total cost [
17]. Sakiani et al. developed a mathematical model to minimize deprivation costs, fleet operation costs, and decision costs, solving a two-stage inventory routing problem [
7]. Song et al. proposed an optimization model for the fair distribution of emergency supplies, which considered differentiated disaster classification, and aimed to minimize dispatching time and maximize fairness in emergency supplies distribution [
18]. Zhan et al. designed a loss cost function to quantify the psychological tolerance of patients in case of a shortage of personal protective equipment; they then developed a location–allocation optimization model for emergency material distribution centers with the dual objective of minimizing loss cost and logistics cost [
19]. According to the above research, the subjective feelings of disaster victims are usually quantified as costs to be modeled, but the internal connection between different materials shortages and the feelings of disaster victims is not taken into account, nor is the degree to which the materials affect their feelings.
Material allocation accuracy and fairness in emergency logistics optimization have been extensively studied [
20,
21,
22]. When the pandemic occurs, the COVID-19 spreads very quickly. Accordingly, some scholars have introduced the concept of demand urgency to reduce the impact of different demand amounts on the fair distribution among different demand points. Hu et al. proposed a dynamic distribution model of emergency medical materials based on the demand urgency of materials, with the maximization of the weighted demand satisfaction rate as the main goal [
5]. Zhao et al. constructed an evaluation index system for demand urgency and then developed a dual-objective model that minimizes distribution costs and prioritizes the distribution of demand points with the higher demand urgency [
23]. Wang et al. developed a multi-objective optimization model that maximizes the satisfaction of affected people, minimizes the cost, and distributes fairly based on the demand urgency [
24]. Liu et al. improved the index system for evaluating demand urgency and constructed a multi-objective model that maximizes both demand urgency and full load rate while minimizing the total cost of vehicle distribution [
25]. Li et al. introduced the time penalty cost function to characterize the urgency of emergency material demand and proposed an uncertain location–allocation model for the emergency facility that minimizes time penalty cost, distribution cost, and carbon dioxide emissions [
26]. Most studies suggest that introducing emergency material demand urgency can effectively improve material allocation fairness and accuracy. However, the urgency considerations for emergency material demand are not comprehensive. Therefore, this paper further improves the demand urgency indicator system.
The existing studies have laid a solid foundation for the research on the emergency material allocation problem. However, existing studies still have several gaps:
- (1)
There has been a lack of consideration for the dynamic change of emergency material demand during major epidemics. Currently, most research focuses on single-period material allocation models, which cannot be applied to the multi-period emergency material allocation problem.
- (2)
The relationship between the shortage of different types of materials and patients’ pain perception was not fully considered in the modeling. It is not practical that regarding different types of materials as equally important.
- (3)
Current research on the urgency of emergency materials demand during major epidemics is not sufficient. In addition, the evaluation factors of demand urgency are not comprehensive.
The following contributions have been made to bridge the above research gap:
- (1)
Based on patients’ subjective feelings towards different emergency materials and the differences in the importance of emergency materials, a more comprehensive demand urgency evaluation system was developed and the calculation of demand urgency was proposed accordingly.
- (2)
Integrating the urgency of material demand into dynamic emergency material allocation, a dynamic optimization model for emergency logistics was established, which minimizes the total amount of emergency material shortage over multi-period and multi-frequency distributions.
- (3)
Based on the demand urgency, the concept of material shortage adjustment coefficient was proposed for major epidemic emergency logistics. The objective of minimizing the total material shortage was adjusted by the material shortage adjustment coefficient to enhance the fairness of material allocation.
3. Demand Urgency Assessment of Emergency Material
In the context of emergency supply, demand urgency refers to the priority of satisfaction after the occurrence of demand. In the existing research, the demand urgency mainly has two connotations. The first connotation focuses on the categorization of the affected degree of the disaster areas, giving weights to different areas according to the severity of the disaster, such as increasing the priority of areas with greater weight and reducing the priority of areas with a smaller weight. The second connotation is to categorize the importance of different emergency materials, giving weights to different materials based on the importance of material; for example, increasing the priority of materials with high importance. The urgency of demand in this paper is consistent with the second connotation.
3.1. Index Selection and Description
During the outbreak of epidemics, on the demand side, the greater the rate of emergency material consumption, the greater the need for such materials in the same period, and the corresponding urgency [
5,
27]. On the supply side, the smaller the reproduction rate, the easier it is to increase the shortage of materials for the same demand, and therefore, the greater the urgency [
23,
27,
28]. The sooner durable emergency materials arrive, the better the chances are of reducing the risk of delays in emergency rescue and improving emergency rescue efficiency [
29]. If life-threatening or irreplaceable emergency supplies are not provided in a timely manner, it will increase the threat to the safety of the personnel [
30]. Based on the above theoretical analysis and literature review, this paper summarizes the five main factors that affect the urgency of emergency material demand, as shown in
Table 1.
The two indicators of Material consumption rate and Material reproduction rate are exact real numbers; that is, they measure the real situation of material use and supply. Durability means that the material can be repeatedly used. This variable is a binary variable, which is 1 when the material is durable and 0 otherwise. The Degree of danger to life and Degree of irreplaceability are fuzzy numerical variables that need to rely on subjective judgment. The two indicators are divided into five levels, and each level is scored 1–5, from low to high. The higher the score, the higher the importance of emergency material.
The above five indexes constitute the index system for measuring the urgency of different emergency materials.
3.2. Measurement of Demand Urgency
In order to ensure the objectivity of the calculation results, and that the weight of each factor is between 0 and 1 and the sum of the weights is equal to 1, this paper uses the entropy weight method to calculate the demand urgency. The entropy weight method is more objective than the Analytic Hierarchy Process (AHP) for the research problems in this paper. This is because the AHP quantifies the weight of the index according to the subjective analysis of the evaluator, but the entropy weight method determines weight using the discrete degree of the index value, which avoids human factors interfering with the weight calculation and is more objective. Furthermore, it is simpler and easier to understand than the TOPSIS method. In addition, many related studies [
30,
34,
36] have also used the entropy weight method.
From the above description, there are
types of materials and scores for each indicator. The score for a certain material on a certain indicator can be expressed as
, wherein,
is the index of the indicator,
is the index of materials, and a two-dimensional list is formed by the scores for different materials on the above five indicators, which are expressed in the form of a matrix as follows:
However, since the initial data for each index are inconsistent in dimension and unit, there is no comparability among the indexes, and the data cannot be directly compared. Therefore, the data need to be standardized. The specific formula is shown in Formula (2):
Thus, a normalized matrix is obtained . In this matrix, for the th indicator, the greater the difference in the value , the greater the role of program evaluation, and the greater the weight of the index will be.
The normalized matrix is then normalized, and the specific formula is as shown in Formula (3):
Finally, the normalized matrix is obtained .
Based on the calculation of information entropy using the formula below, the entropy value of the
th index can be calculated:
If , then define .
Therefore, according to the calculated entropy value of each index, the weight of each index can be obtained by Formula (5):
After the weight of each index is calculated in Step 2, the general weighted summation method is used to determine the calculation method of the comprehensive score of the demand urgency, as shown in Formula (6):
3.3. Material Gap Adjustment Function
In the process of emergency rescue, the importance of different materials is also different. Therefore, when the infected population needs different materials at the same time, due to the limitations of distribution time and transportation capacity, it is necessary to give priority to the distribution of materials with higher importance. When considering the shortage degree of different materials in demand areas, it is not enough to measure the actual shortage of materials; the shortage of materials with different importance needs to be enlarged and narrowed according to the demand urgency score. When two emergency materials with different demand urgency have the same degree of shortage, due to the different importance, the material with high demand urgency will have a more severe impact on the epidemic.
Therefore, in order to achieve the goal of minimizing the total material shortage, it is necessary to adjust the shortage of different materials through certain methods, so that the higher the urgency of demand, the higher the priority of allocation. Based on the above discussion, this paper proposes the adjustment function of material shortage.
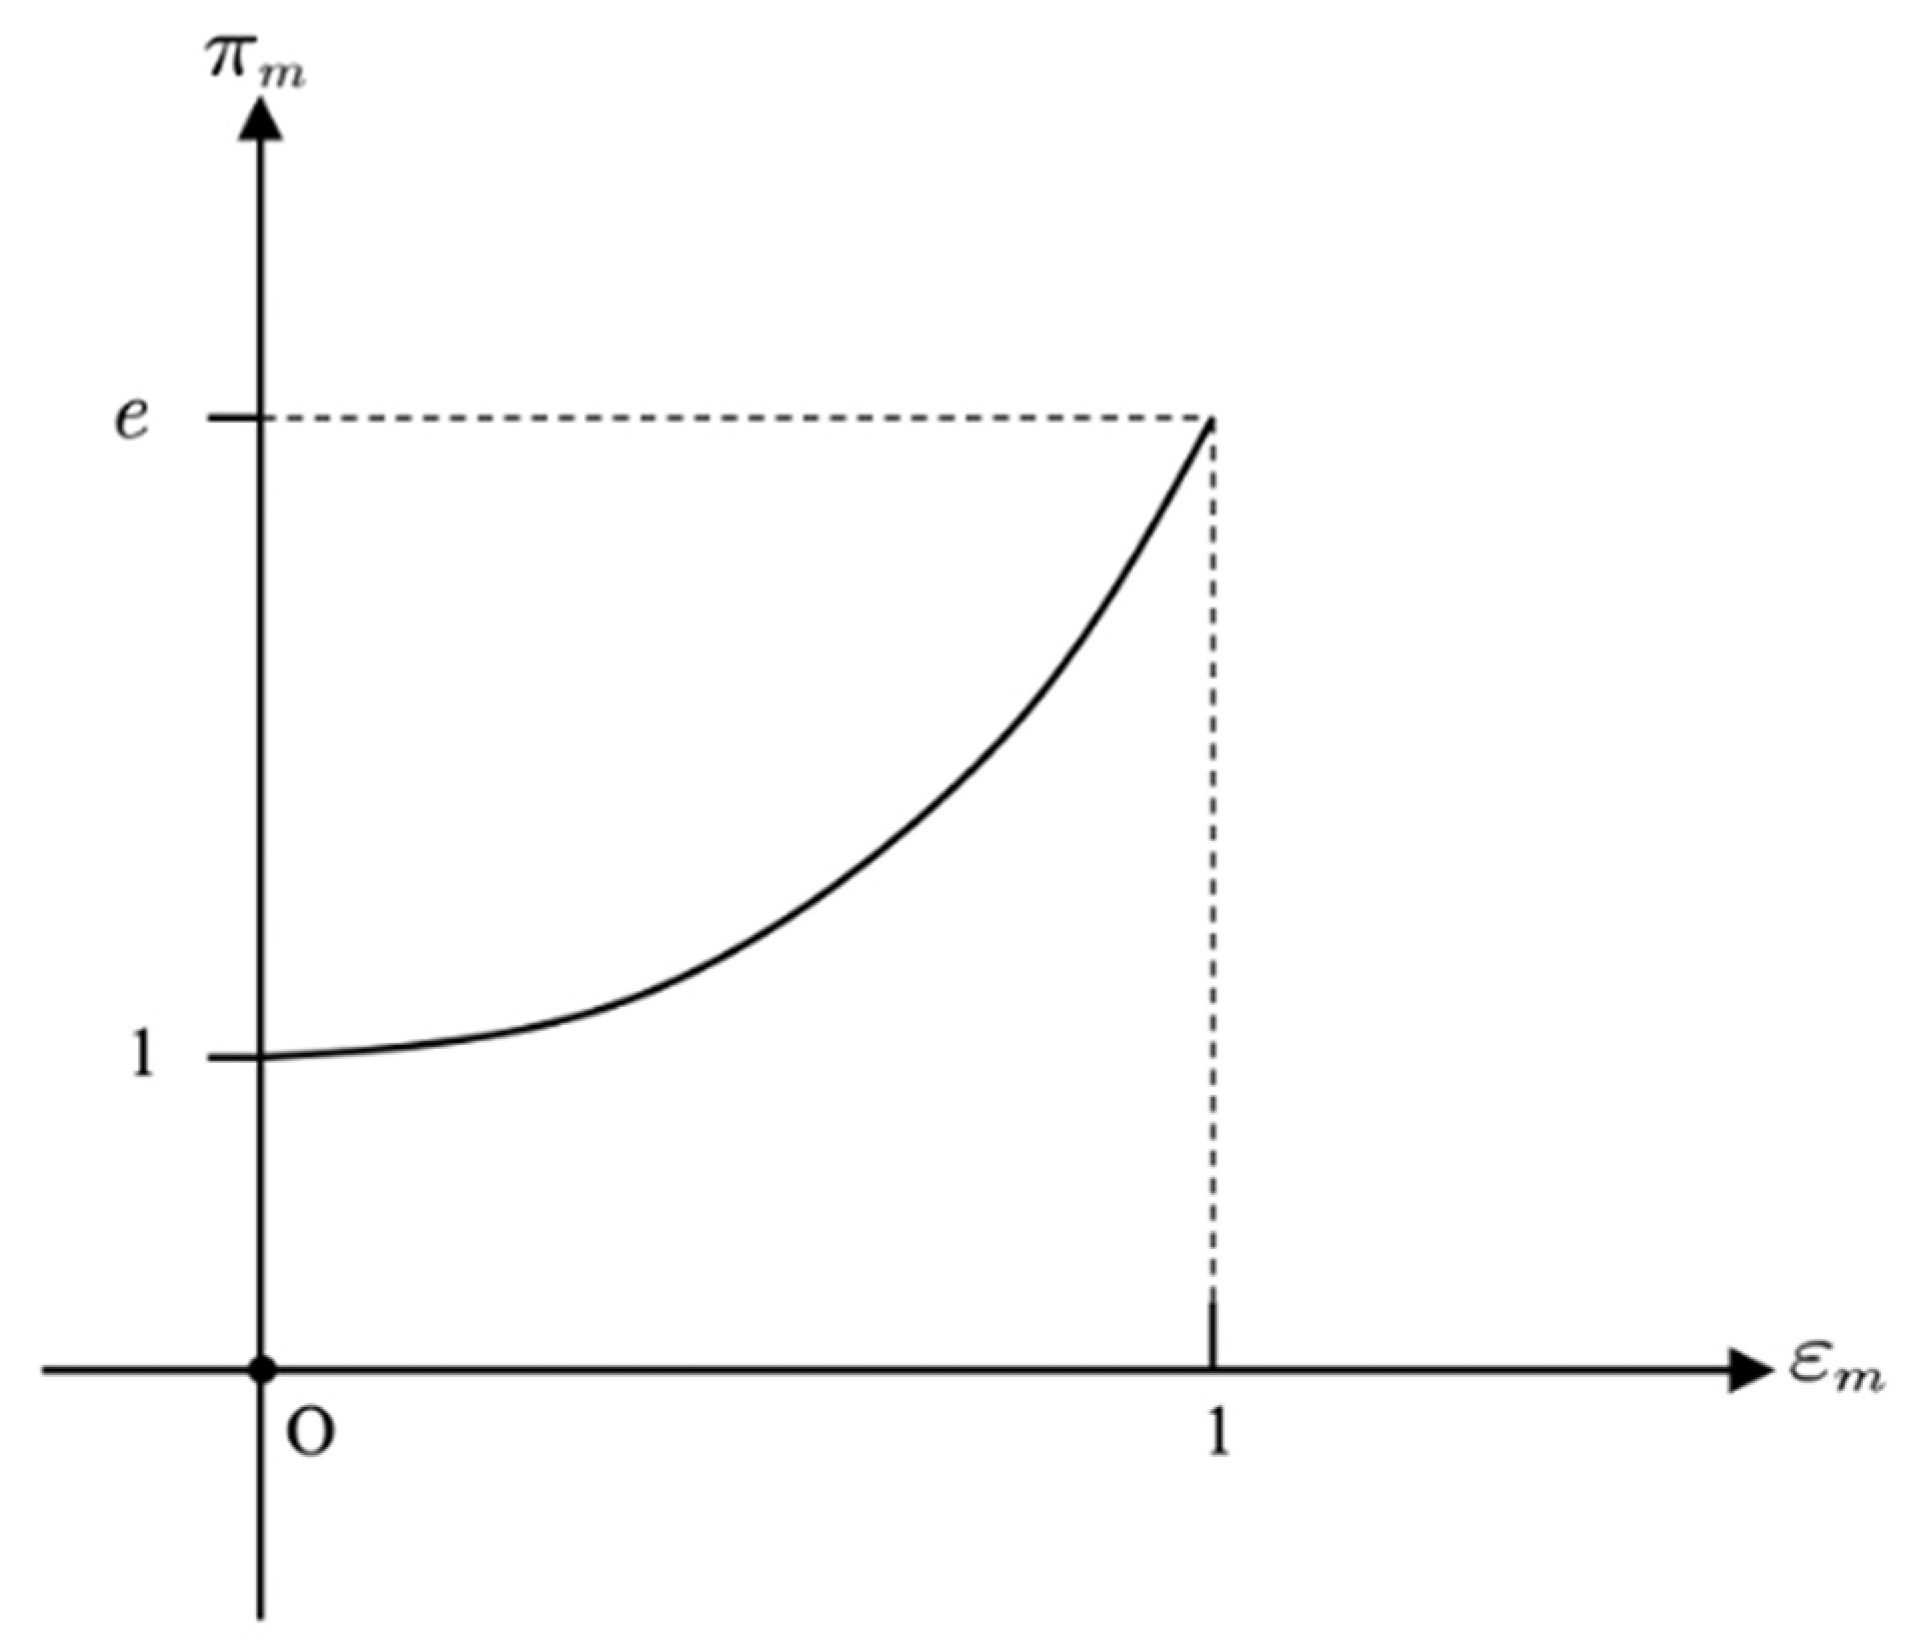
According to the demand urgency calculated above, the material shortage adjustment function is expressed in the following form:
where
is the shortage coefficient of emergency material
. Since the weight of each index is within 0–1, and the normalized value of each index is also within 0–1, the comprehensive score of demand urgency calculated by Formula (7) is also within 0–1. The relationship between the material shortage adjustment coefficient and the material demand urgency is shown in
Figure 1.
If the demand urgency calculated by the method in
Section 3.2 is 0, it is considered that the importance of the material is 0, so it is calculated by its actual shortage amount without adjustment; if the demand urgency is greater than 0, it is considered that the material has a certain importance, and its material shortage cannot be measured only by the actual amount, but it needs to be enlarged accordingly. When the demand urgency is greater than 0, the greater the value is, the more severe the impact of materials on epidemics and the higher the amplification ratio of the shortage, and the amplification trend becomes faster with the increase of the urgency value.
4. Dynamic Distribution Model of Emergency Materials Considering Demand Urgency
4.1. Problem Description and Model Assumptions
At the beginning of an outbreak, the virus spreads rapidly in a certain area, the number of infected people increases exponentially, and the emergency materials in stock in the area are consumed rapidly. In order to control the epidemic as soon as possible, the government will introduce strict quarantine measures and designate some medical institutions in the area as rescue centers. In order to meet the material needs of the rescue centers, it is necessary to transport materials from other areas to supplement the shortage. These transported materials are then stored in different temporary distribution centers, and the distribution centers accurately deliver the materials to the rescue centers according to demand. At the same time, considering the continuous development of the epidemic and in order to make distribution more accurate, the duration of the epidemic is divided into several equal periods, and distribution needs to be arranged according to the materials demand in each period
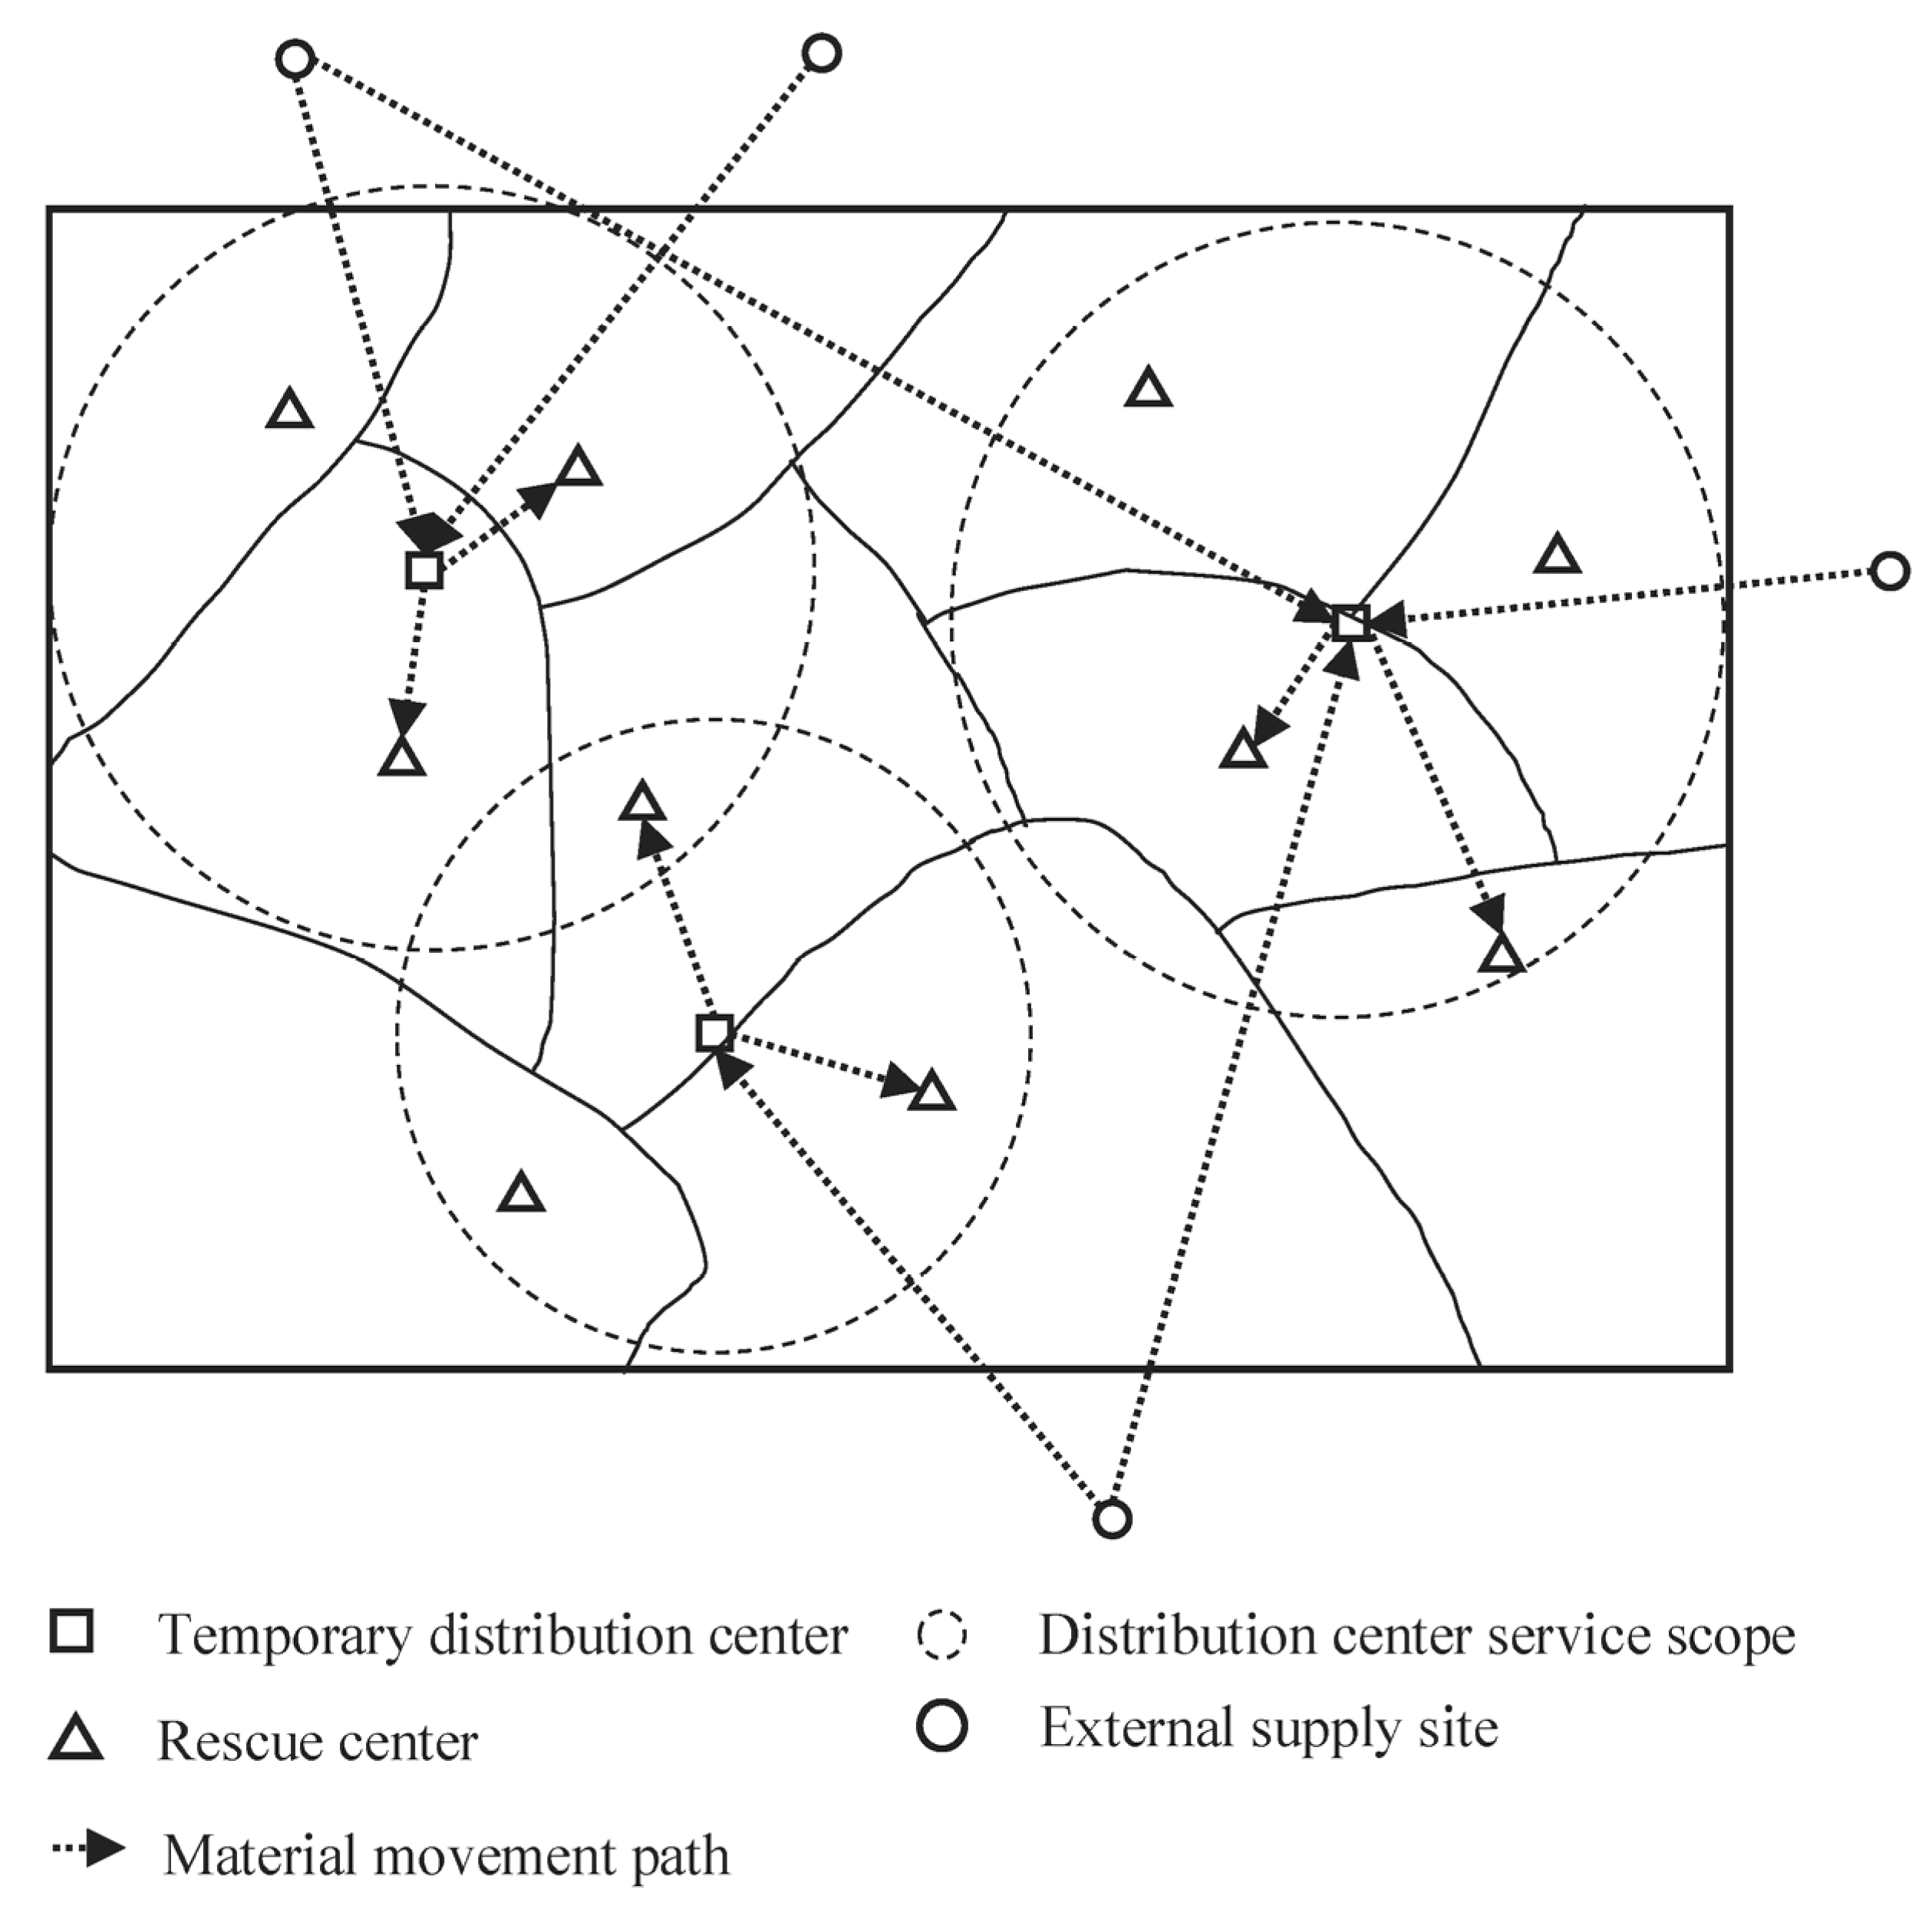
Figure 2 illustrates the problem graphically. In
Figure 2, the large rectangle represents the area where the materials need to be distributed, and several irregular curves divide it into several independent areas with different shapes and sizes. Each region has a rescue center (represented by a small triangle), which is responsible for the treatment of infected patients in that area. There are also several distribution centers (represented by small squares) in the region, each with its own service area (represented by a dotted circle). Supplies are delivered from external areas (represented by solid circles) to temporary distribution centers, and then distributed from the temporary distribution centers to the rescue centers within the scope, according to their demands.
Some assumptions of this system are made as follows:
- (1)
Each rescue center is responsible for the treatment of infected patients in a certain scope, and there is no overlapping of the scopes of the rescue centers. Once the infected person is diagnosed, they will be sent to the nearest rescue center.
- (2)
The external supply sites are a kind of virtual node, which essentially have several possible channels for materials to enter the area. External emergency supply sites have no actual coordinates, but there are parameters such as supply volume, price, and so on. Accordingly, only the distribution of materials within the affected area is considered while the distribution of materials outside the affected area and the distance factor are not considered.
- (3)
The materials for each rescue center in one delivery can be provided by multiple distribution centers, and one distribution center can provide materials for different rescue centers in one delivery.
- (4)
Only the purchase cost of external material input (from the supply site to the distribution center) is considered, and the transportation cost of internal and external material (from the distribution center to the rescue center) and the storage cost in the distribution center are not considered.
- (5)
The volume difference is not considered, different materials can be loaded together, and the damage to road facilities and the limitations of road conditions are ignored.
4.2. Symbol Definition
- (1)
Sets
M: Set of emergency materials m = 1, 2, ..., M
T: Set of rescue periods t = 1, 2, ..., T
W: Set of emergency supply sites w = 1, 2, ..., W
J: Set of temporary distribution centers j = 1, 2, ..., J
K: Set of rescue centers k = 1, 2, ..., K
- (2)
Parameters
: The volume of material demanded by the temporary distribution center and rescue center in Period , respectively.
: The volume of the material supplied from emergency supply site in Period .
: The price of the material supplied from emergency supply site in Period .
: Total budget during the epidemic.
: The volume of material supplied by temporary distribution center in Period .
: The inventory of material of temporary distribution center in Period .
: The initial inventory of material of temporary distribution center .
: The maximal inventory volume of material of temporary distribution center .
: The safety inventory volume of material of temporary distribution center .
: The total inventory capacity of temporary distribution center .
: The shortage volume of material of rescue center in Period .
: The shortage adjustment coefficient of material .
4.3. Model Construction
The decision variables of the dynamic distribution model are:
: The volume of material transported from emergency supply site to temporary distribution center in Period .
: The volume of material transported from temporary distribution center to rescue center in Period .
: Whether there is any material transported from temporary distribution center to rescue center in Period .
: Whether there is any material transported from emergency supply point to temporary distribution center in Period .
In which, and are 0-1 variables, and when the event occurs, the variable is 1, otherwise 0.
Considering the importance of different materials, the total material shortage is characterized as an adjusted weighted shortage based on the material shortage adjustment coefficient. Taking the minimum total material shortage as the objective of the model, the corresponding integer linear programming model was established as follows:
s.t.
In the above Formulas (8)–(19), Formula (8) is the objective function of the model, which minimizes the material shortage after adjustment. Formula (9) reflects that during the rapid development of the epidemic, emergency materials are in short supply, so the total volume of supplies received by a single rescue center from the temporary distribution center in each period may not be able to meet all the needs, resulting in a certain material shortage.
Formulas (10) and (11) show that the goods shipped from a single distribution center are equal to the sum of the materials distributed to all the rescue centers and are less than the current inventory of the material. Formula (12) shows that the inventory of a certain material at the end of the current cycle is equal to the inventory at the end of the previous period minus the volume of materials transported in the current period plus those transported from the emergency supply site in the current period. Formulas (13)–(15) show that the demand of the temporary distribution center for a certain material is equal to the difference between the maximum storage capacity of the temporary distribution center and the current inventory, and is the same as the demand of the treatment center. The materials volume transported from the emergency supply site may not be able to meet the needs of the temporary distribution center, but it must not be larger than the total materials volume supplied by the supply site. Formulas (16)–(18) show that the inventory of materials should be less than the inventory capacity and greater than the safety inventory. Formula (19) defines the calculation method of the material shortage quantity of a single period in a certain rescue center.
5. Example Analysis
In order to verify the effectiveness of the model, this paper presents an example analysis of Wuhan and Shanghai under the background of city-wide lockdown and control at different stages of epidemic development. The computing environment was based on a personal computer (Intel Core I5 10210U 1.6 GHz CPU, 16 GB RAM, Windows 11 operating system), and Lingo 16 ExS was applied as the computing software. The parameters involved in the model were then adjusted, sensitivity analysis was carried out, and the impact of different parameter settings on the model results was compared. The details are as follows:
5.1. Relevant Background
At the end of 2019, the COVID-19 virus began to spread in Wuhan. In order to cut off the transmission of the virus and control the epidemic in a smaller range, Wuhan announced the “Lockdown” on 23 January 2020. In March 2022, the mutant strain of COVID-19, Omikron, began to break out in Shanghai, and the Shanghai Municipal Government executed the measure of “static management” on 1 April 2022.
5.2. Data Preparation
There are 13 and 16 administrative districts respectively in Wuhan and Shanghai, which are greatly different from each other. In order to improve the comparability of the solution results, the two cities were divided into five regions, respectively, according to the area and geographical location, as shown in
Table 2.
According to the existing literature, during the rapid development of the epidemic, Hubei Province designated five logistics parks as temporary transit stations for emergency materials, three of which were in Wuhan, located in Dongxihu District, Huangpi District, and Hannan District. In addition, according to the public data on the official website of the Hubei Provincial Health and Health Commission, during the epidemic period, all districts in Wuhan designated one or more hospitals to treat infected people. Therefore, after the re-division of the city, each region contained at least one designated rescue center. Shanghai has not released the information on the designated distribution centers.
This paper assumes that there were three different distribution centers () in the two cities and two emergency supply sites (, which represented various ways for materials to enter the affected area. At the same time, each region had a corresponding rescue center, represented by ().
All kinds of materials used during the epidemic can be divided into medical materials, protective materials, and living materials, according to the use classification. In addition, they can be divided into consumptive materials and durable materials, according to the consumption classification. In reality, during the outbreak of the epidemic in Wuhan, people paid more attention to the distribution of medical and protective materials, while in Shanghai, the distribution of living materials was a more important topic. Therefore, this study selected medicine, medical alcohol, ventilator, and pork as representative materials. Of these, medicines, medical alcohol, and pork are consumptive materials, and ventilators are durable materials. The time period unit in this study was days. Indeed, according to the actual situation, the time period can be taken from any other unit.
Based on the population density data in
Table 2, according to epidemic development law, the material demand data for the two cities in the first 10 periods were set as shown in
Table 3 and
Table 4 respectively.
The data for various urgency indexes of the given emergency materials are shown in
Table 5.
5.3. Calculation and Result Analysis
According to the methods of calculating demand urgency and adjusting material shortage introduced in
Section 3.3, the demand urgency and shortage adjustment coefficient of each material was obtained as shown in
Table 6.
After obtaining the shortage adjustment coefficient of each material, the solution for the model was obtained based on Lingo 16 software. The results of the materials accumulated in the first 10 periods from Wuhan emergency supply sites to temporary distribution centers are shown in
Table 7, and those from Wuhan temporary distribution centers to various rescue centers are shown in
Table 8. The results of the materials accumulated in the first 10 periods from Shanghai emergency supply sites to temporary distribution centers are shown in
Table 9, and those from Shanghai temporary distribution centers to various rescue centers are shown in
Table 10. Based on the model results, it was found that:
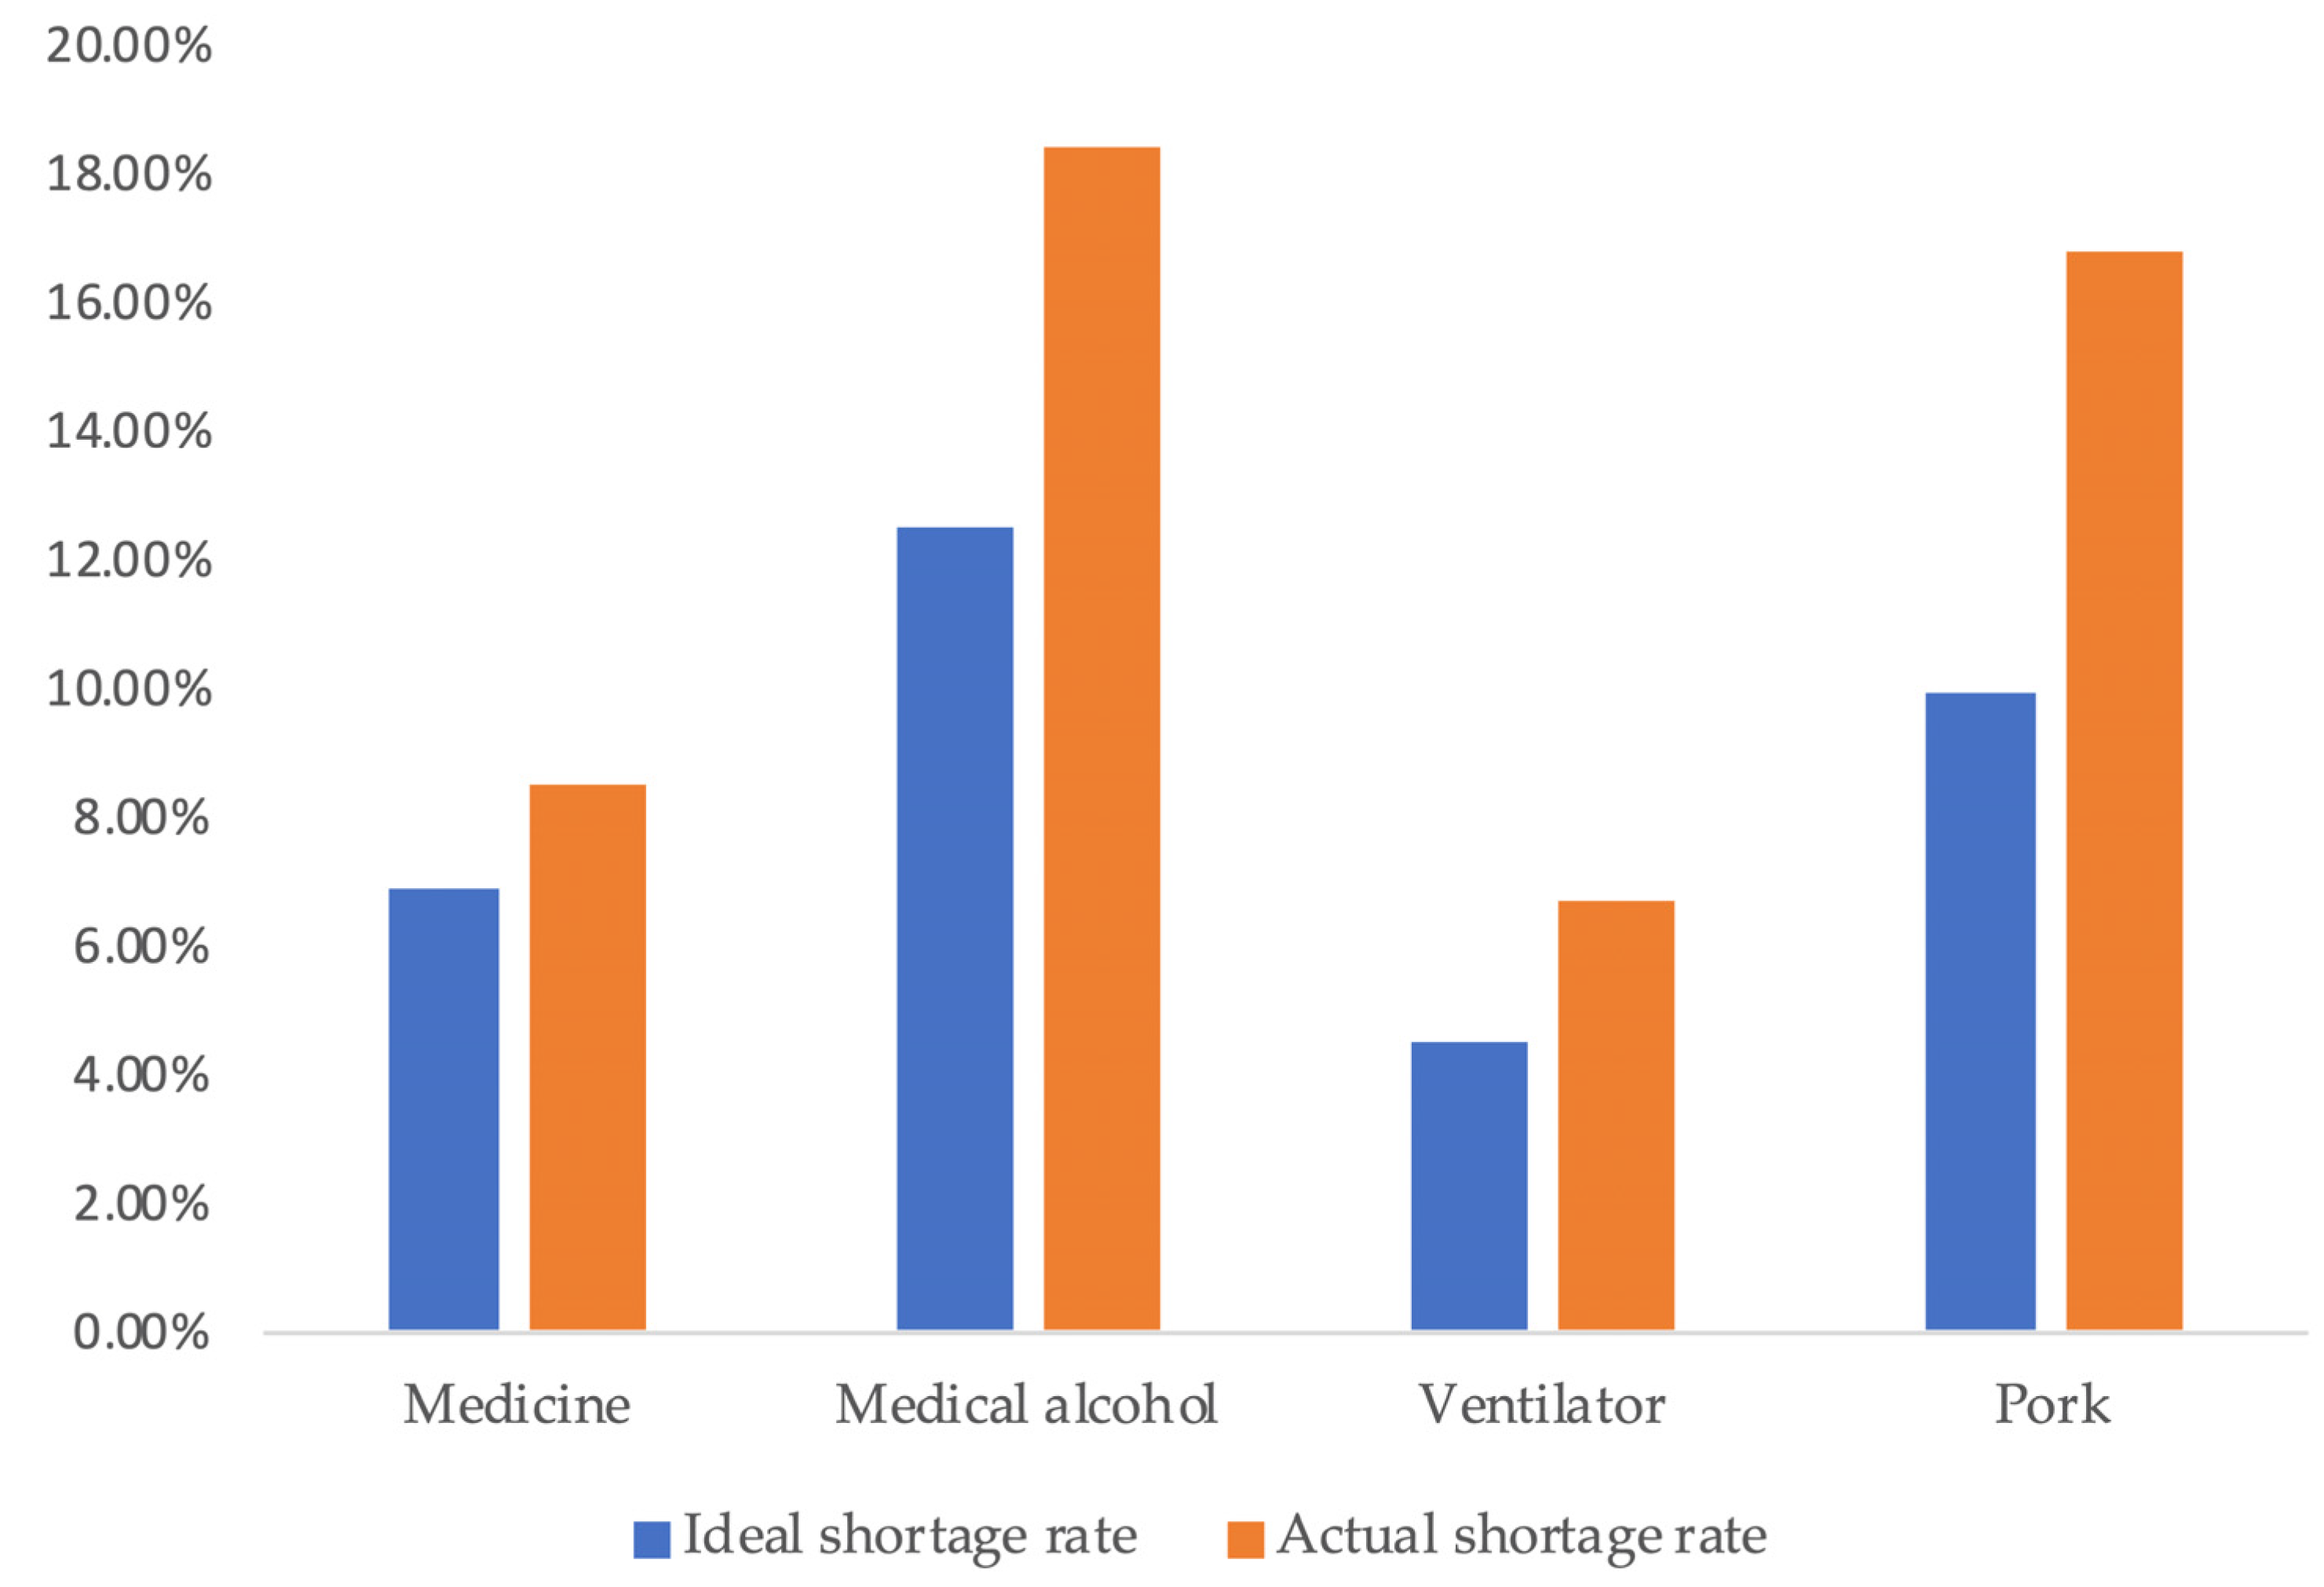
Based on the Shanghai data, the optimal value of the model was 111,794.9, and the transferred actual shortage was 88,636 pieces; therefore, the overall shortage rate was 10.18%. The specific shortage of different materials varies, and the specific shortage of each type of material is shown in
Figure 3.
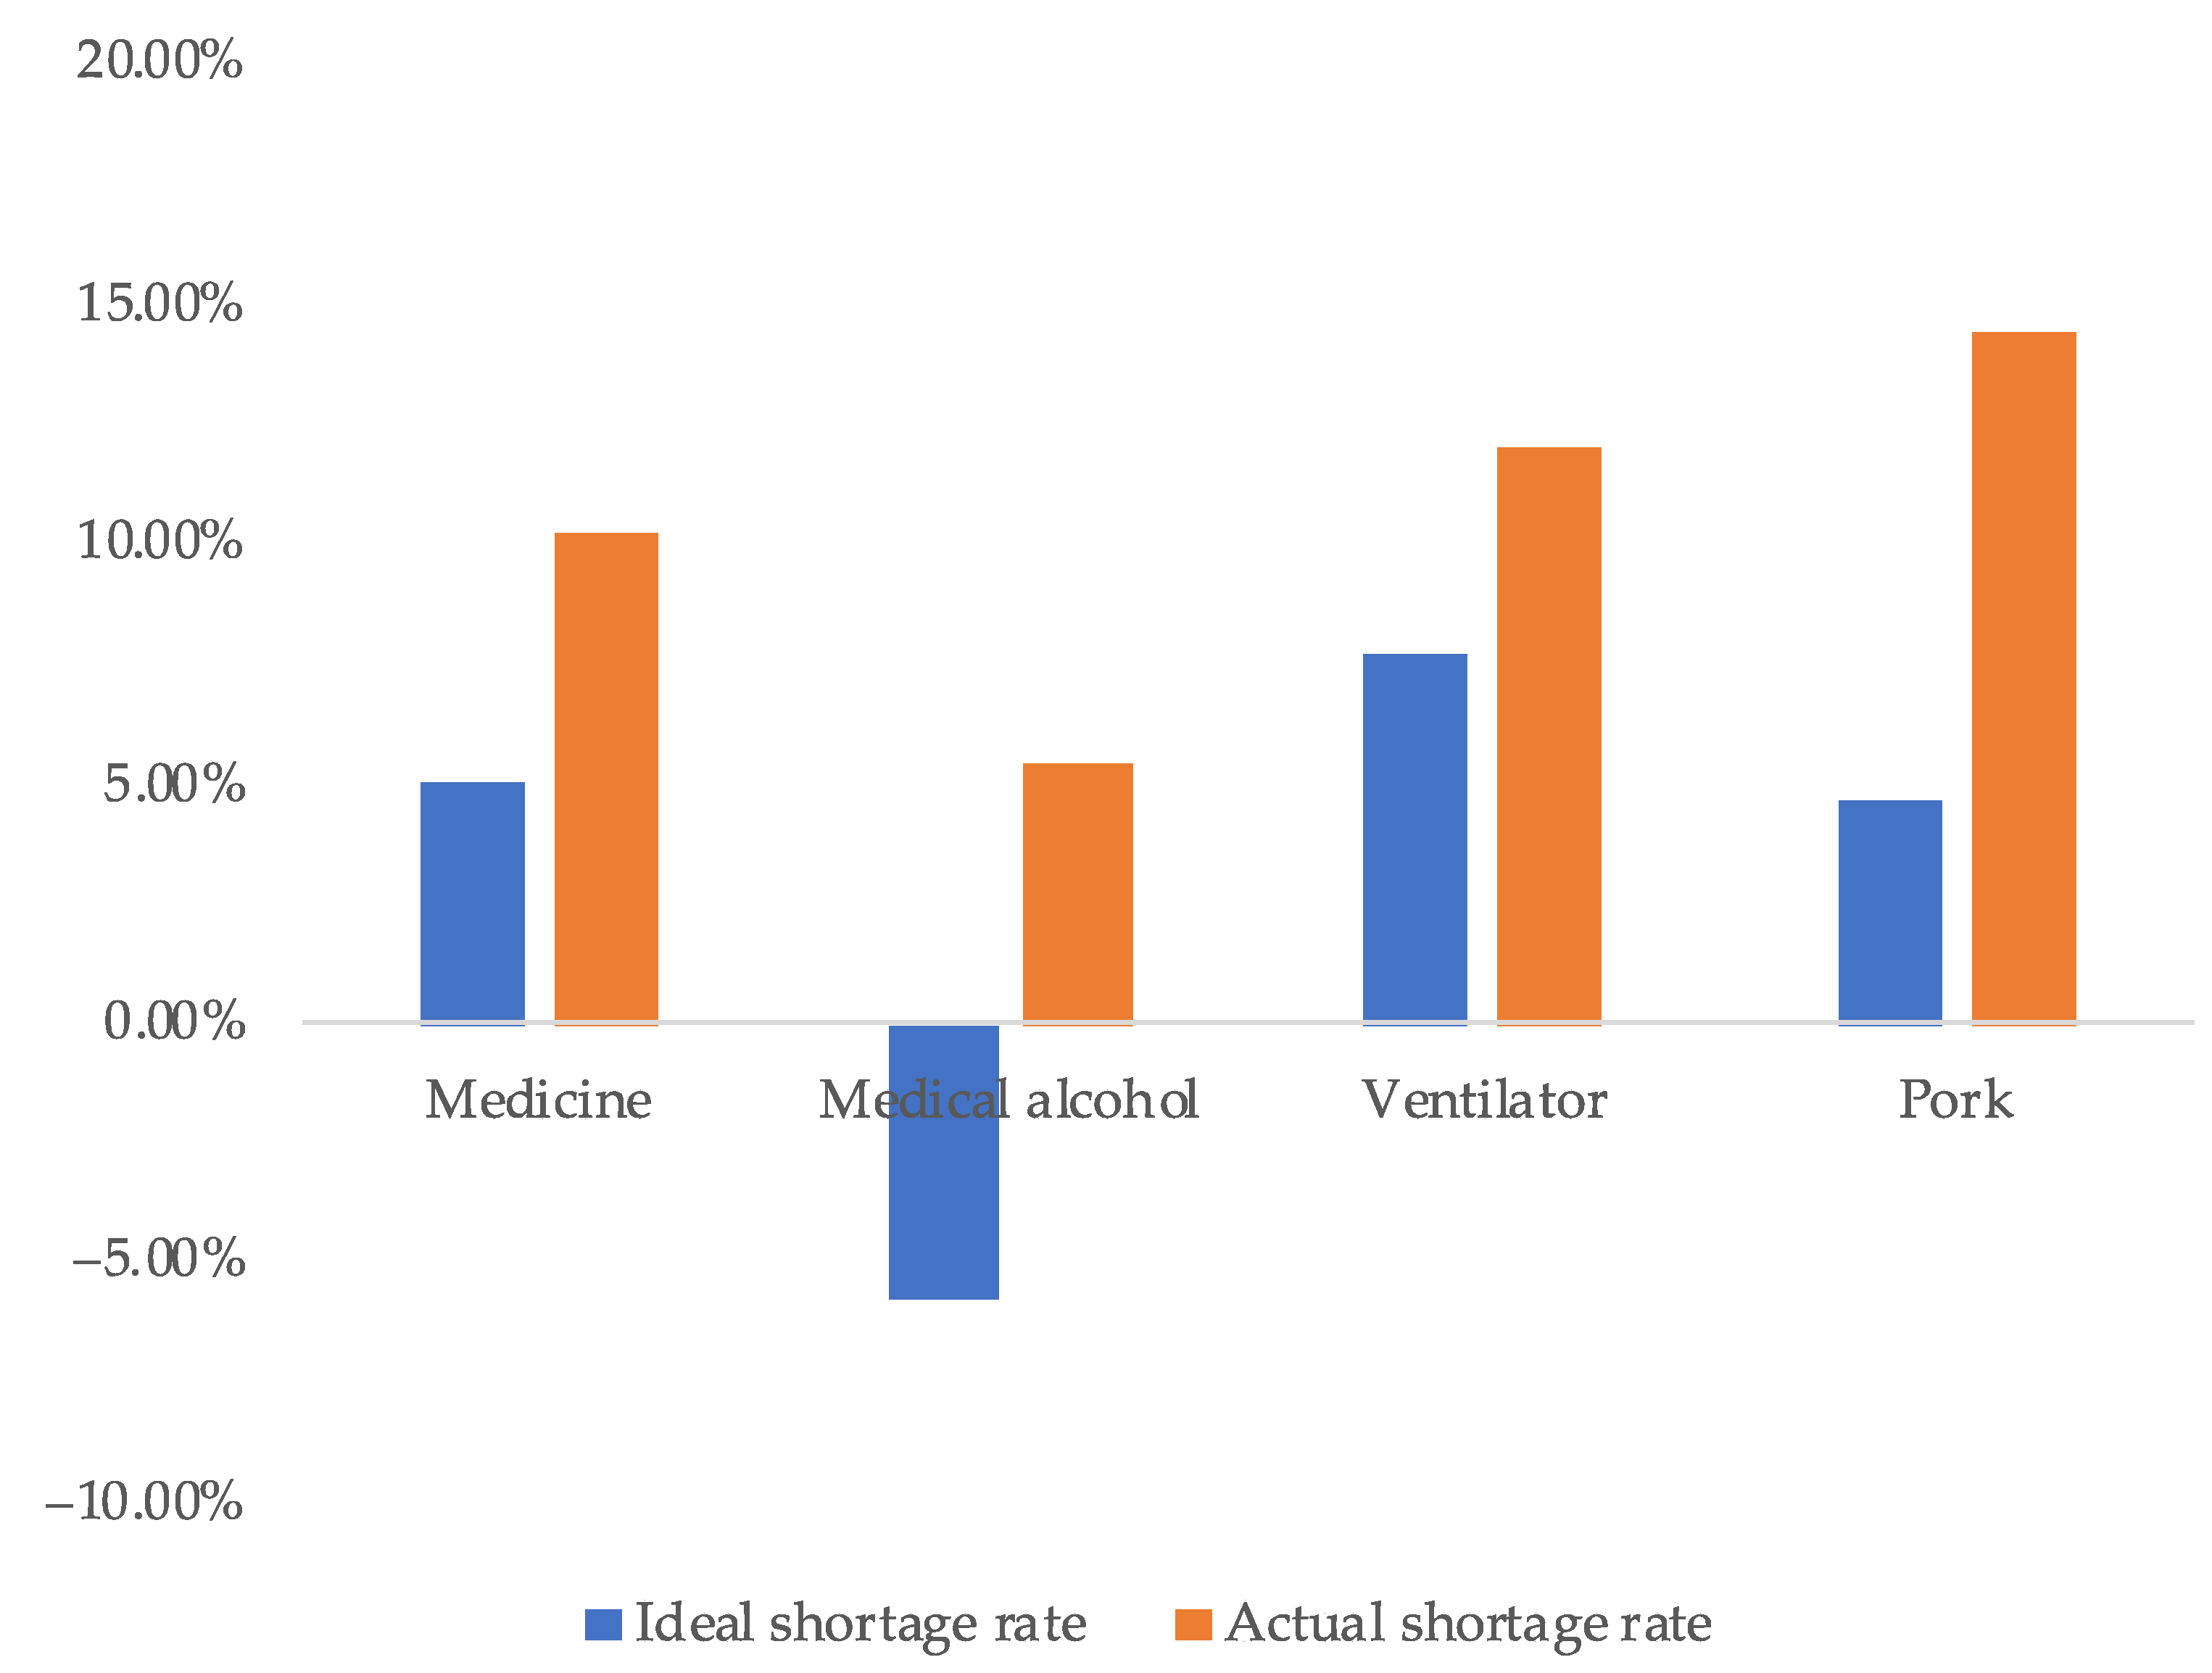
Based on the Wuhan data, the results of the model show that the optimal value of the objective was 10,532.15, and the transferred actual average shortage of materials was 7805 pieces; therefore, the actual average shortage rate of materials was 10.84%. The shortage of different types of materials is shown in
Figure 4.
In
Figure 3 and
Figure 4, the blue rectangles represent the ideal shortage rates, that is, the shortage rate when all materials are used, while the orange rectangles represent the actual shortage rates, which is the result optimized by the model. It can be seen that although there was a significant difference in the absolute amount of material shortage between Shanghai and Wuhan, the overall shortage level was similar, as well as the shortage of each material, which indicates that the situation in the two cities is comparable.
According to the demand urgency score for each material listed in
Table 6, it can be seen that among the four materials, the importance of medicines and ventilators is higher, while the importance of the other two items is relatively lower.
Figure 3 and
Figure 4 show that the actual shortage rate of medicines and ventilators was closer to the ideal shortage rate than the other two materials. These results show that the model established in this paper obviously adjusted the material distribution with higher importance, so the satisfaction of the more important materials reached a more ideal state. For the two kinds of materials, medicines belong to consumptive materials, while ventilators belong to durable materials. For the two types of materials, there was no significant difference in the optimization process.
5.4. Impact of Budget Funds
Based on the effective model established above, this section examines the impact of budget funds.
In reality, whether it is commercial logistics or emergency logistics, funds are always limited. Even for the emergency logistics led by the government, it is necessary to consider cutting costs and use limited funds as much as possible. The government needs to respond to emergency material demands in case of a shortage. Some of these materials are donated by society, while the majority come from government procurement. Government procurement is not unlimited, and the cost of purchasing emergency materials needs to be within a budget. This means that there is the following budget constraint in the model:
where
is the price of the material, and
is the government budget.
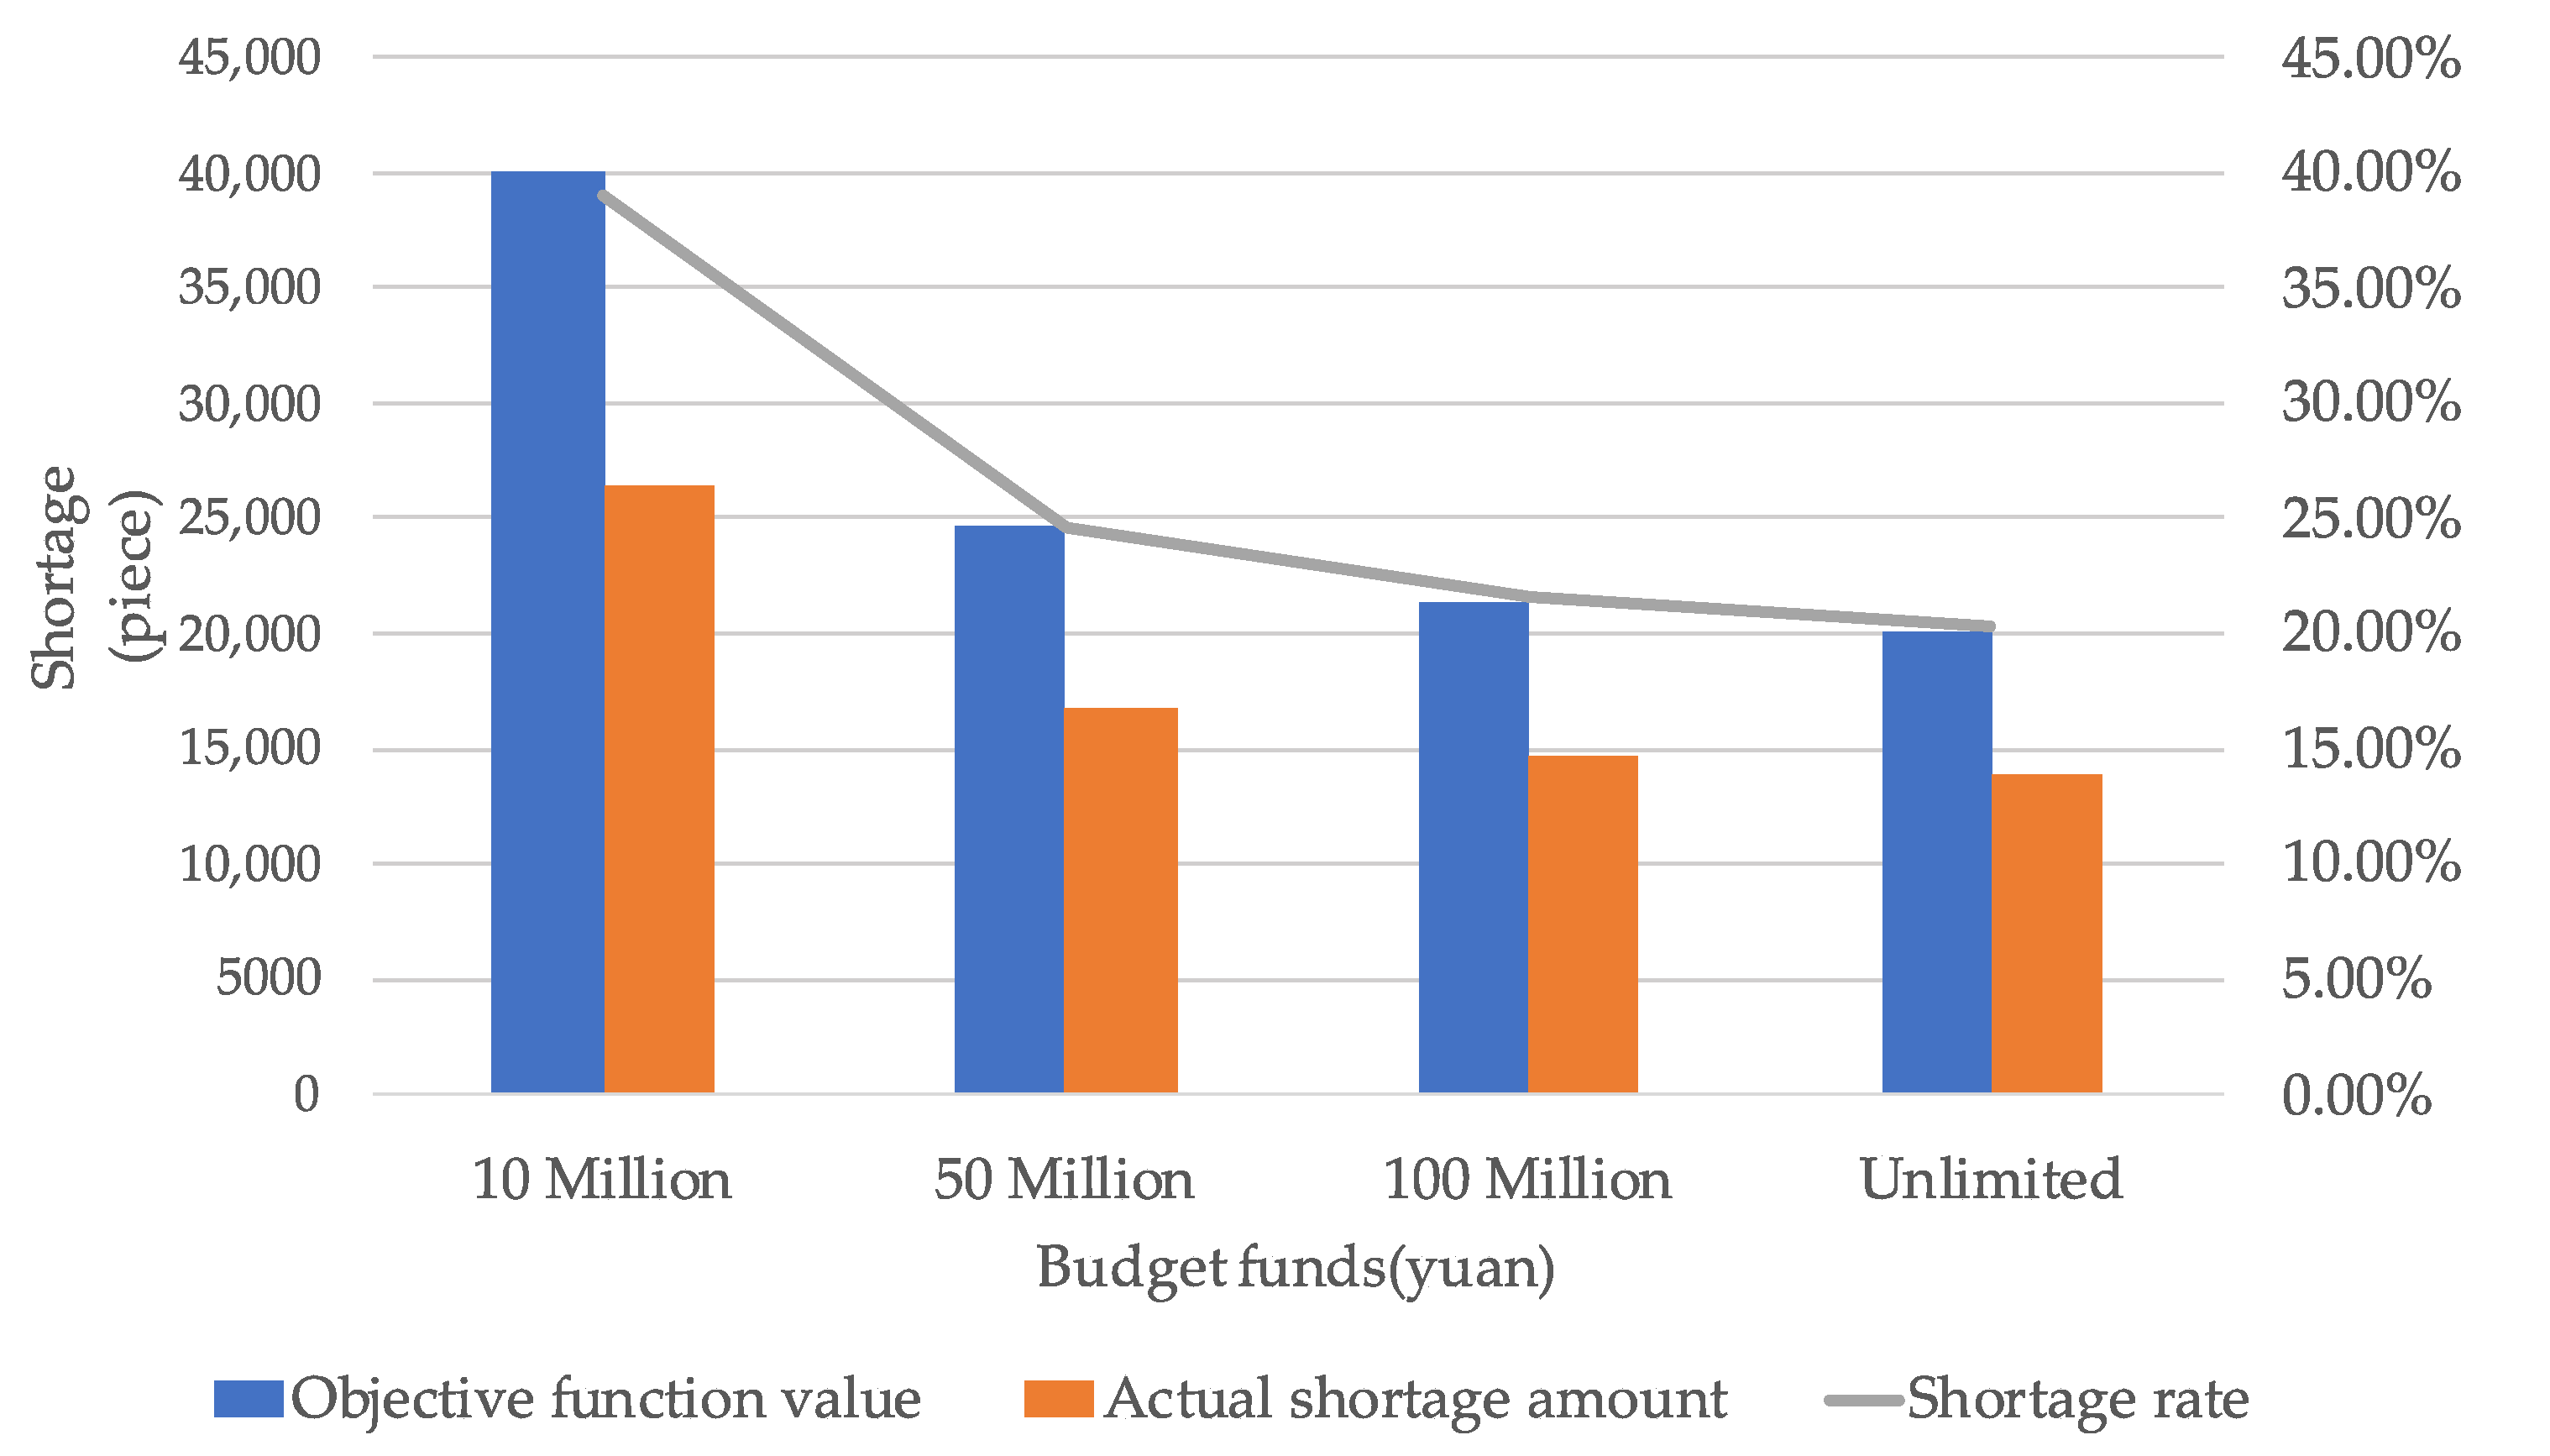
In Formula (20), the cost of emergency logistics is defined as the cost incurred in purchasing materials from suppliers, which must not be over budget. This paper divides budget funds into three grades: 10 million yuan, 50 million yuan, and 100 million yuan, which were substituted into the model, respectively, for a solution. The final results were analyzed based on the single objective solution without budget constraints, as shown in
Table 11 and
Figure 5.
As illustrated by
Table 11 and
Figure 5, when the budget funds were only 10 million yuan, the actual shortage of materials was 26,466 pieces, with a shortage rate of materials of up to 38.95%. With the increase of budget funds and the loosening of financial constraints, the shortage rate of materials gradually decreased. When the budget funds were 50 million yuan, the decrease in the shortage rate was the largest, with a decrease of over 14 percentage. This fully demonstrates that funds play an important role in the entire logistics, and if insufficient funds are invested, emergency logistics will not have a significant effect.
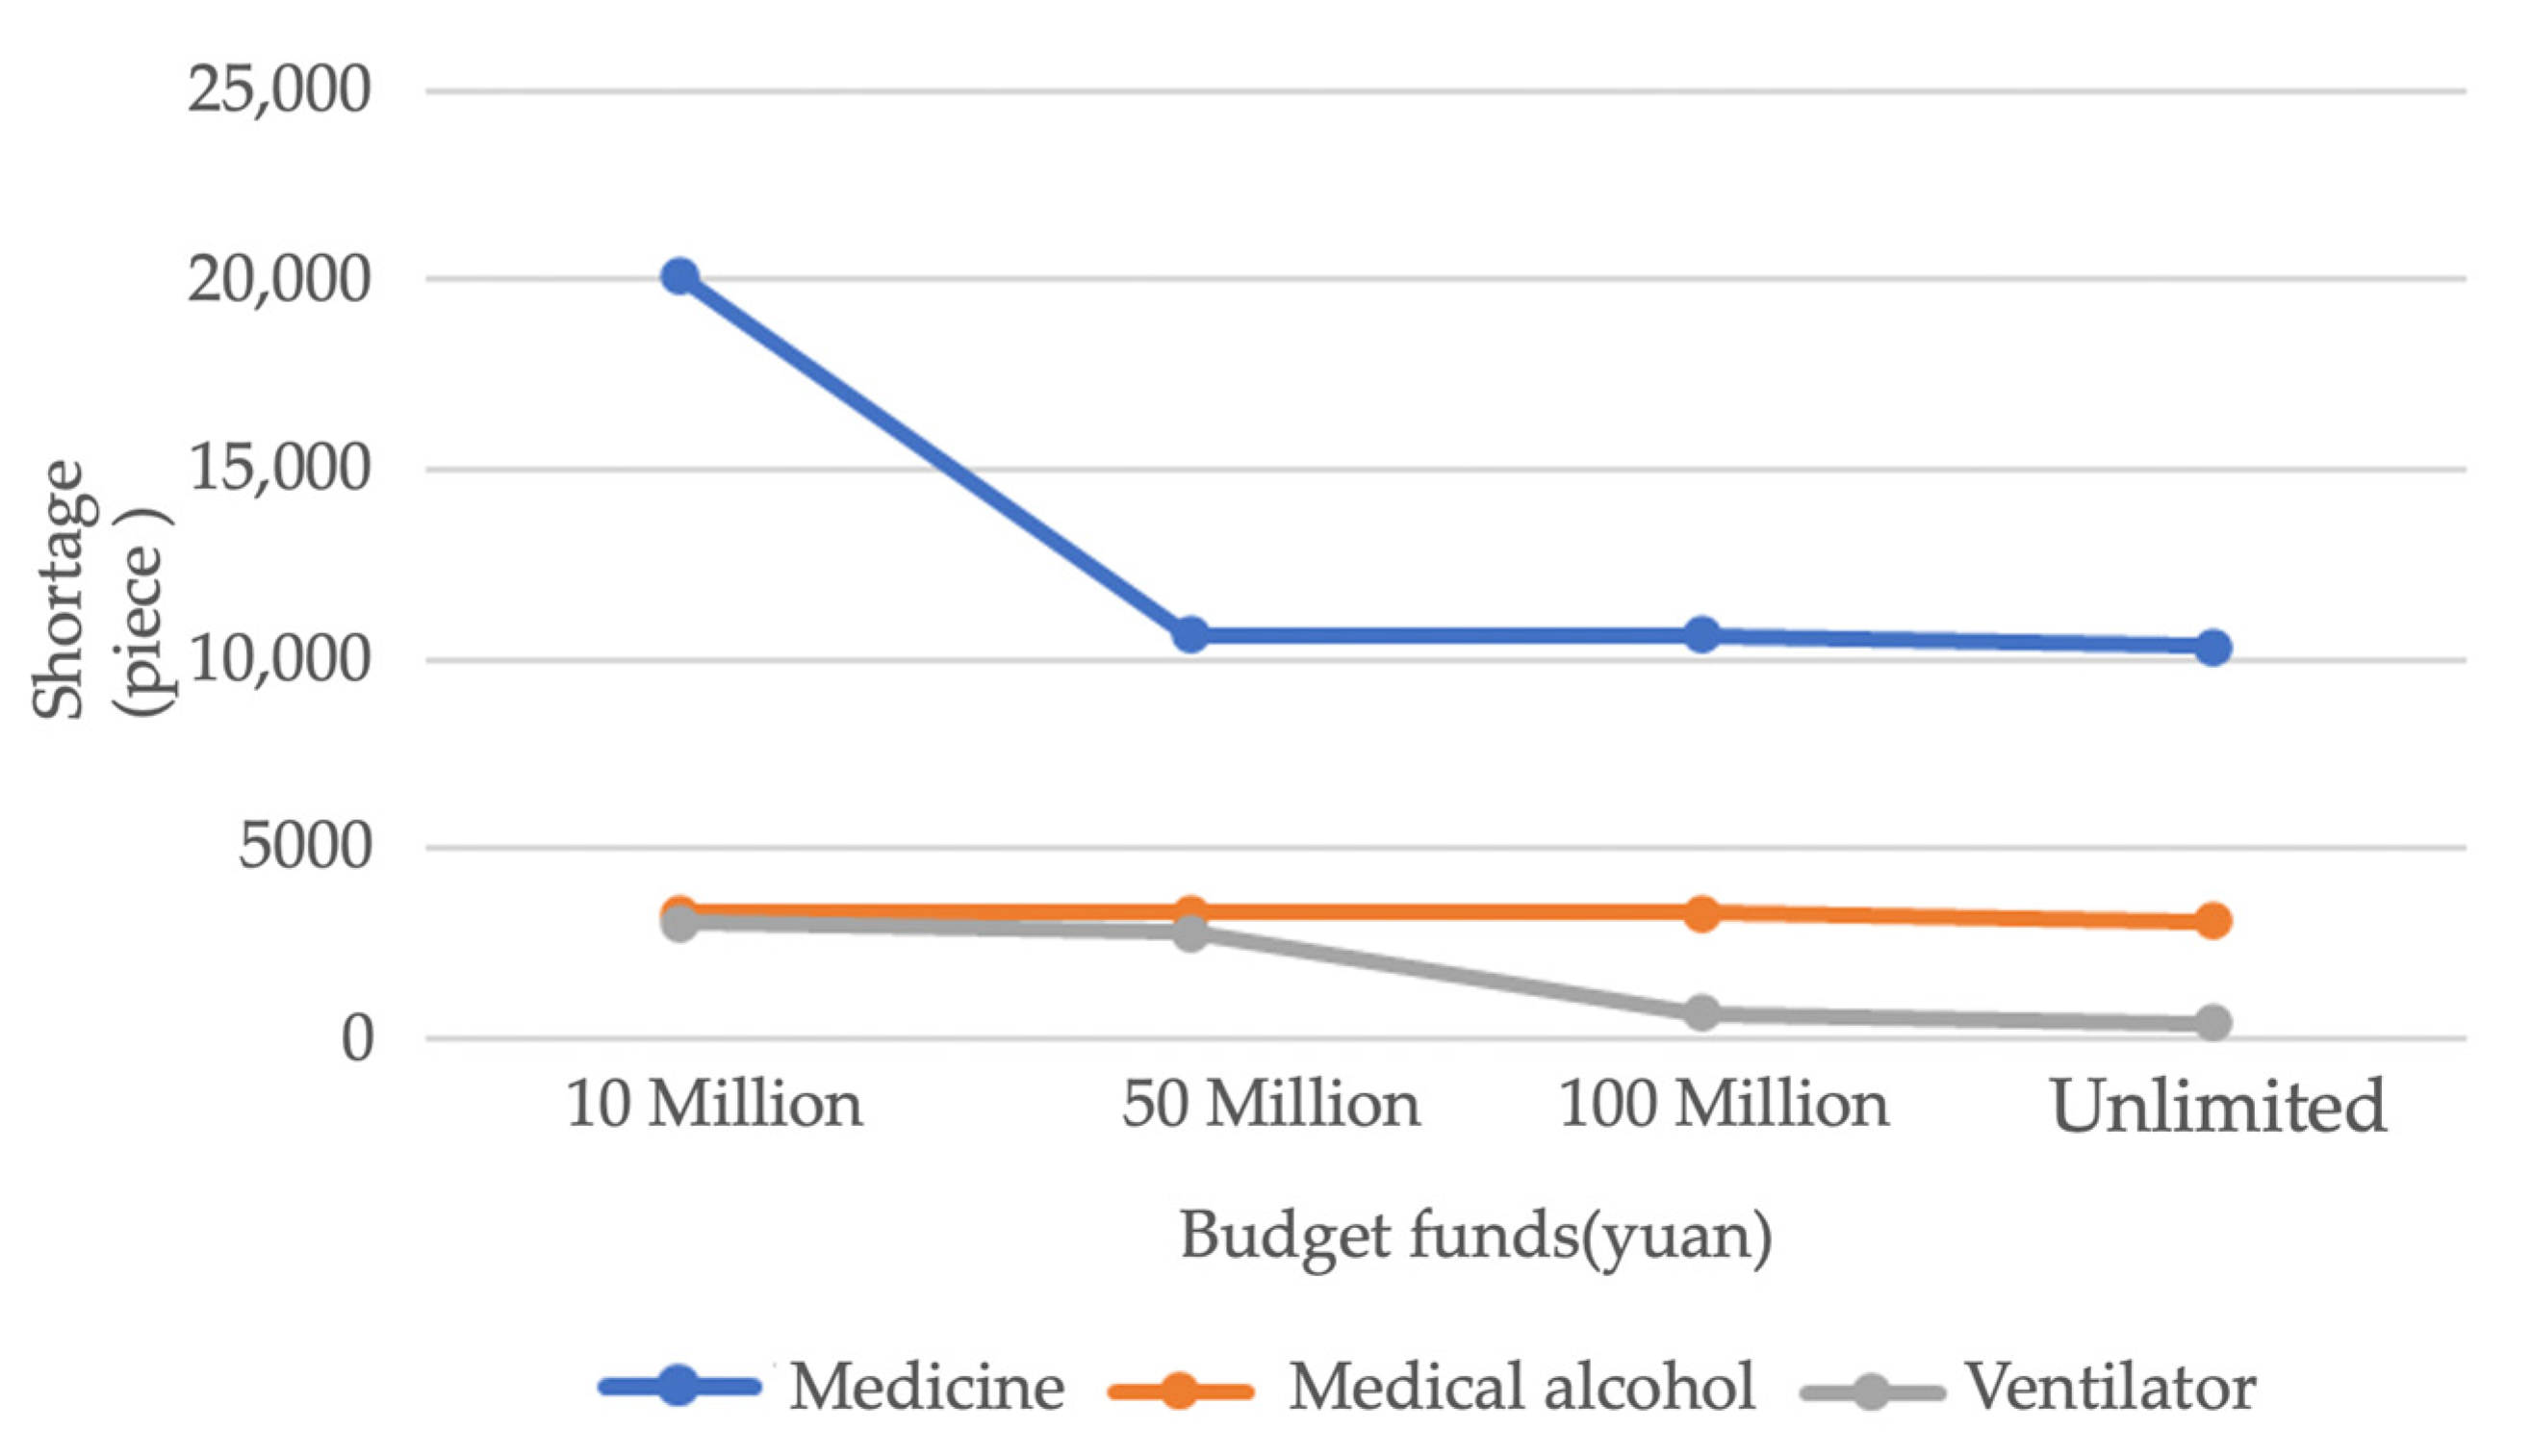
The shortage of three types of medical materials is shown in
Figure 6. When the budget was between 10 million yuan and 50 million yuan, the shortage of medicines decreased the most significantly. However, when the budget was between 50 million yuan and 100 million yuan, the shortage of ventilators saw the biggest drop, while the shortage of medical alcohol remained at the same level. There are several possible reasons for this situation:
The demand for medicines was the highest. When the funding was only 10 million yuan, the shortage of medicines was much larger compared to the other two types of materials. Therefore, when the budget increased slightly, a large number of medicines were purchased to reduce the shortage.
The demand for ventilators was the lowest, but ventilators were the most expensive. When the financial constraint was tight, the limited funds were not used to purchase ventilators but first met the other two lower-priced and greater-demand materials. However, when the budget funds were sufficient, the importance of ventilators began to show, and more funds were used to purchase ventilators to meet the demand and reduce the shortage of this more important material.
6. Conclusions
In the process of epidemic prevention and control, a perfect emergency logistics system is expected to be one the critical support to quickly control the epidemic and minimize casualties and losses. Emergency logistics not only needs to achieve the fastest distribution of materials, but it also needs to consider the accuracy and fairness of meeting the demand for materials in distribution. Therefore, in the context of the COVID-19 pandemic, this paper established a distribution model of emergency materials. In this model, the concept of demand urgency is introduced, and the importance of each material is measured through the demand urgency index system, to calculate the shortage adjustment coefficient of each material; furthermore, the shortage of the material is enlarged accordingly in the objective function, so that the material with higher importance is distributed more preferentially. Finally, the model was applied to study the cases of Wuhan and Shanghai, and it was found that, although there were differences in material demand volume and material demand structure between Shanghai and Wuhan, there were similar results for the two cities, indicating that the model can be applied to the emergency material distribution of major epidemics in a variety of situations.
Furthermore, there are some managerial implications:
- (1)
Medicines and ventilators were the two materials with higher demand urgency in this example, and the actual shortage rate was closer to the ideal state, which reflects the effectiveness of the model to some extent. Therefore, this proves that the shortage adjustment coefficient based on the demand urgency (material classification) had a more obvious adjustment effect on the distribution of more important materials.
- (2)
The effectiveness of emergency logistics increased with the increase of budget funds. When the budget funds were very limited, it resulted in a great shortage of emergency materials and a high shortage rate, regardless of the demand urgency. On the other hand, with the increase in budget funds, the demand urgency was clearly reflected in the allocation of funds. The more urgent materials received a larger share of finance, which means that increasing funds appropriately and conducting scientific allocation is an important strategy to improve the effectiveness of emergency rescue.
The considerations for follow-up studies are as follows:
- (1)
Although this paper considered multi-period emergency logistics dynamic planning, it simply divided the time into several equal small periods and gave a reasonable explanation for how to divide the periods. Therefore, in a follow-up study, we could carry out corresponding research on the reasonable division of the period, such as whether it is necessary to change the period into a random length, or the relationship between the division of the period and the development of the epidemic.
- (2)
In this paper, materials are divided into durable and consumable materials, but this division was too general to distinguish the differences between hundreds of materials in emergency logistics. Therefore, it is necessary to continue to study the division of emergency materials.


