


Iot-Based Privacy-Preserving Anomaly Detection Model for Smart Agriculture

Abstract
:1. Introduction
Motivation
- Contributions:
- The first step in building the model is to collect data from IoT devices deployed in the smart agriculture system. These devices can include sensors for measuring environmental parameters, crop health, soil conditions, weather data, etc. The collected data form the basis for anomaly detection.
- Preserving the privacy of sensitive data is crucial in any IoT-based system. Privacy-preserving techniques such as data anonymization, encryption, or differential privacy can be employed to protect personal and confidential information while ensuring that data retain their utility for anomaly detection. These techniques can help in compliance with privacy regulations and prevent unauthorized access.
- Data are changed into a new encoded format using the sparse capsule-auto encoder approach to make them more resistant to attacks.
- The AGRU neural network model is utilized for detecting anomalies in the privacy-preserved data. An AGRU extends the capabilities of the traditional GRU model by incorporating an attention mechanism. The attention process allows the model to focus on important features or time steps, effectively capturing temporal dependencies and identifying abnormal patterns in the data. The AGRU model is trained on labeled data, distinguishing between normal and anomalous instances.
- The trained AGRU model is evaluated using appropriate performance metrics such as accuracy, precision, recall, and F1-score. The model’s performance is assessed on both training and testing datasets to ensure its generalization ability. If necessary, the model can be refined via hyper parameter tuning or employing ensemble techniques to further improve its anomaly detection capabilities.
2. Related Works
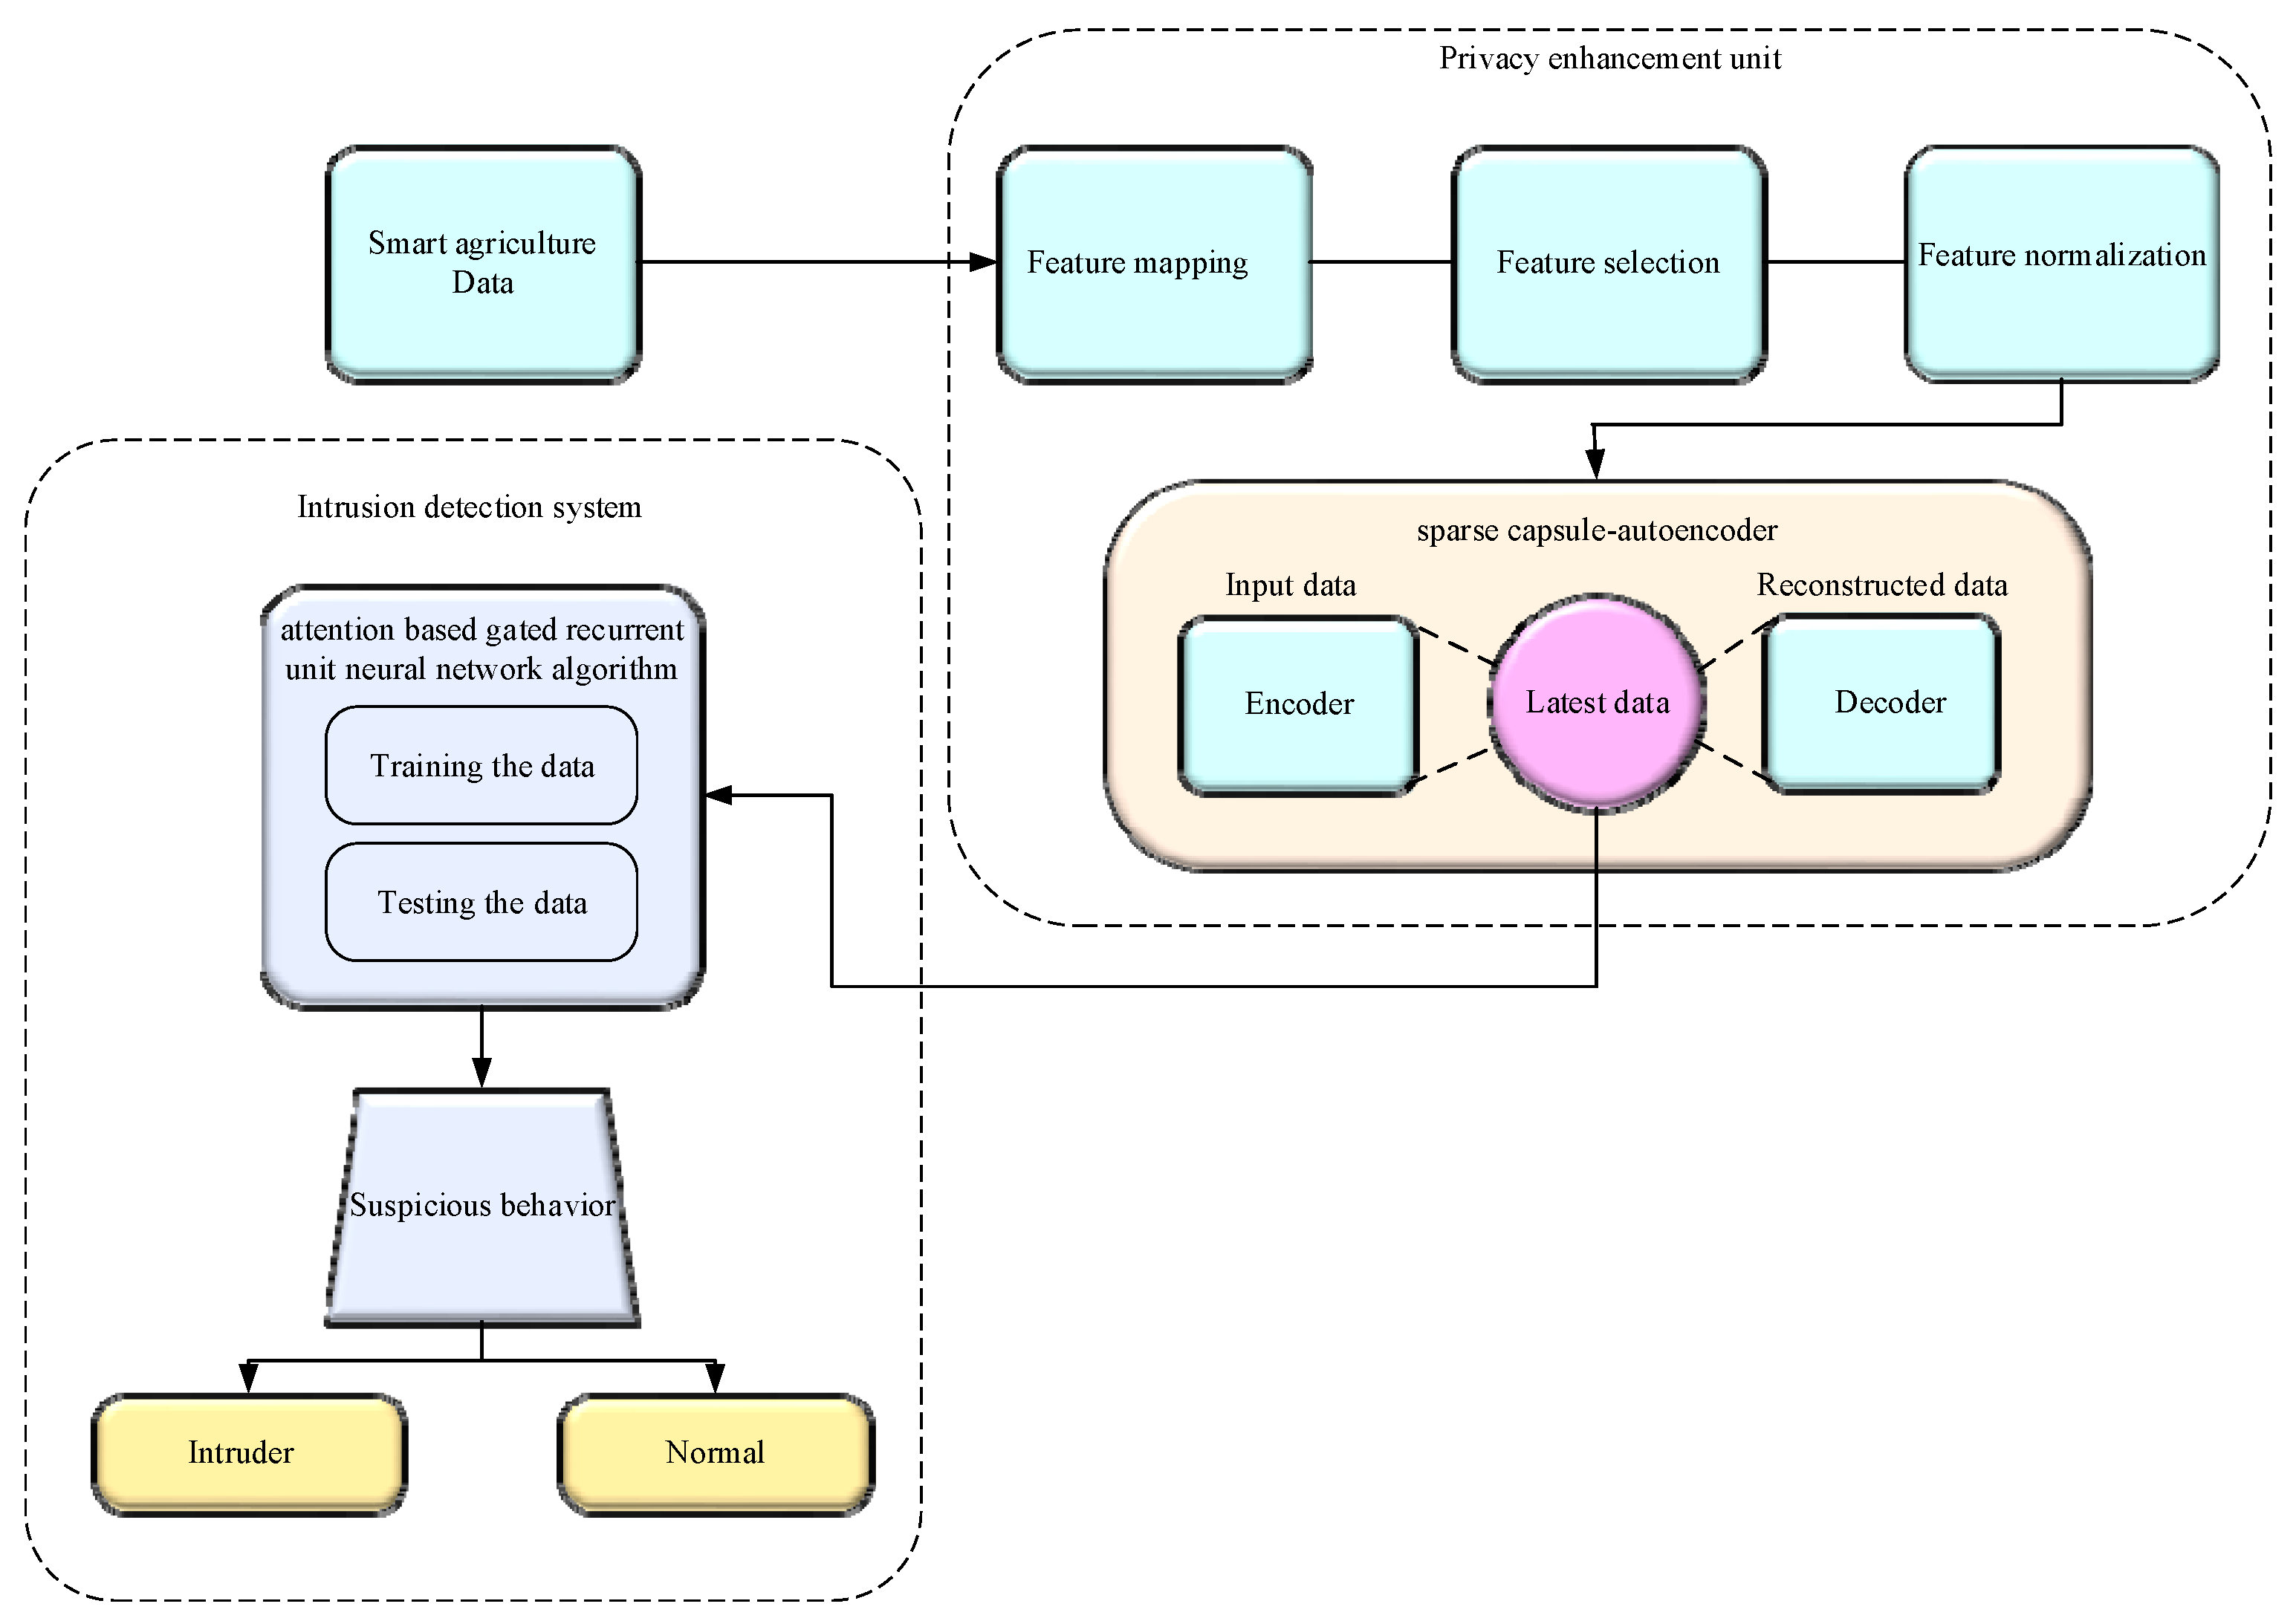
3. Proposed Methodology
3.1. Strategies for Detecting Intrusions
3.2. Feature Mapping
3.3. Feature Selection
3.4. Feature Normalization
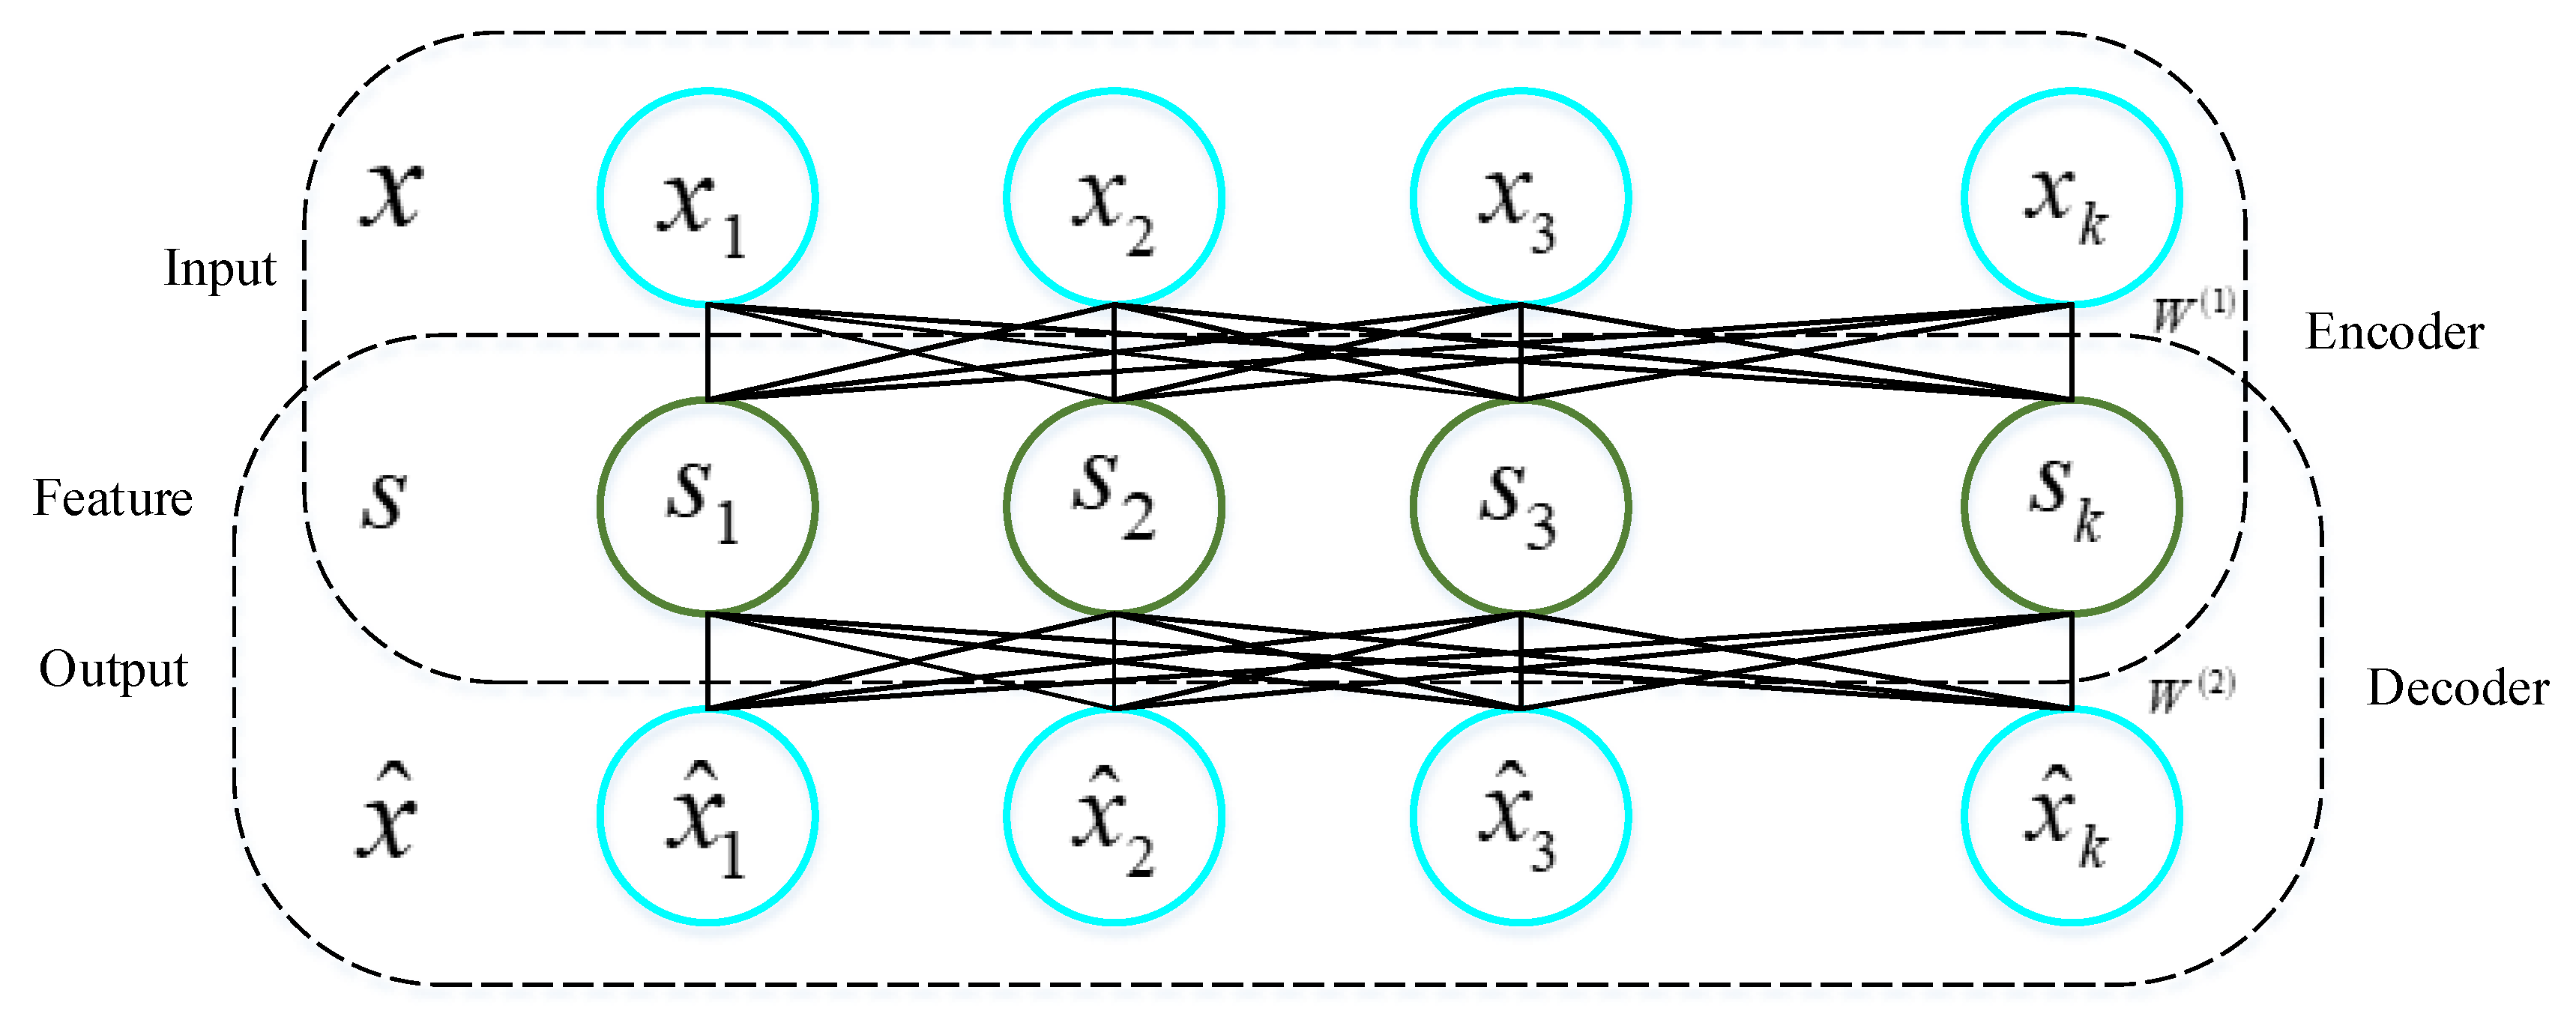
3.5. Feature Encoding
3.5.1. Auto Encoder (AE)
3.5.2. Capsule Auto Encoder
3.5.3. Sparse Capsule-Auto Encoder (SCAE)
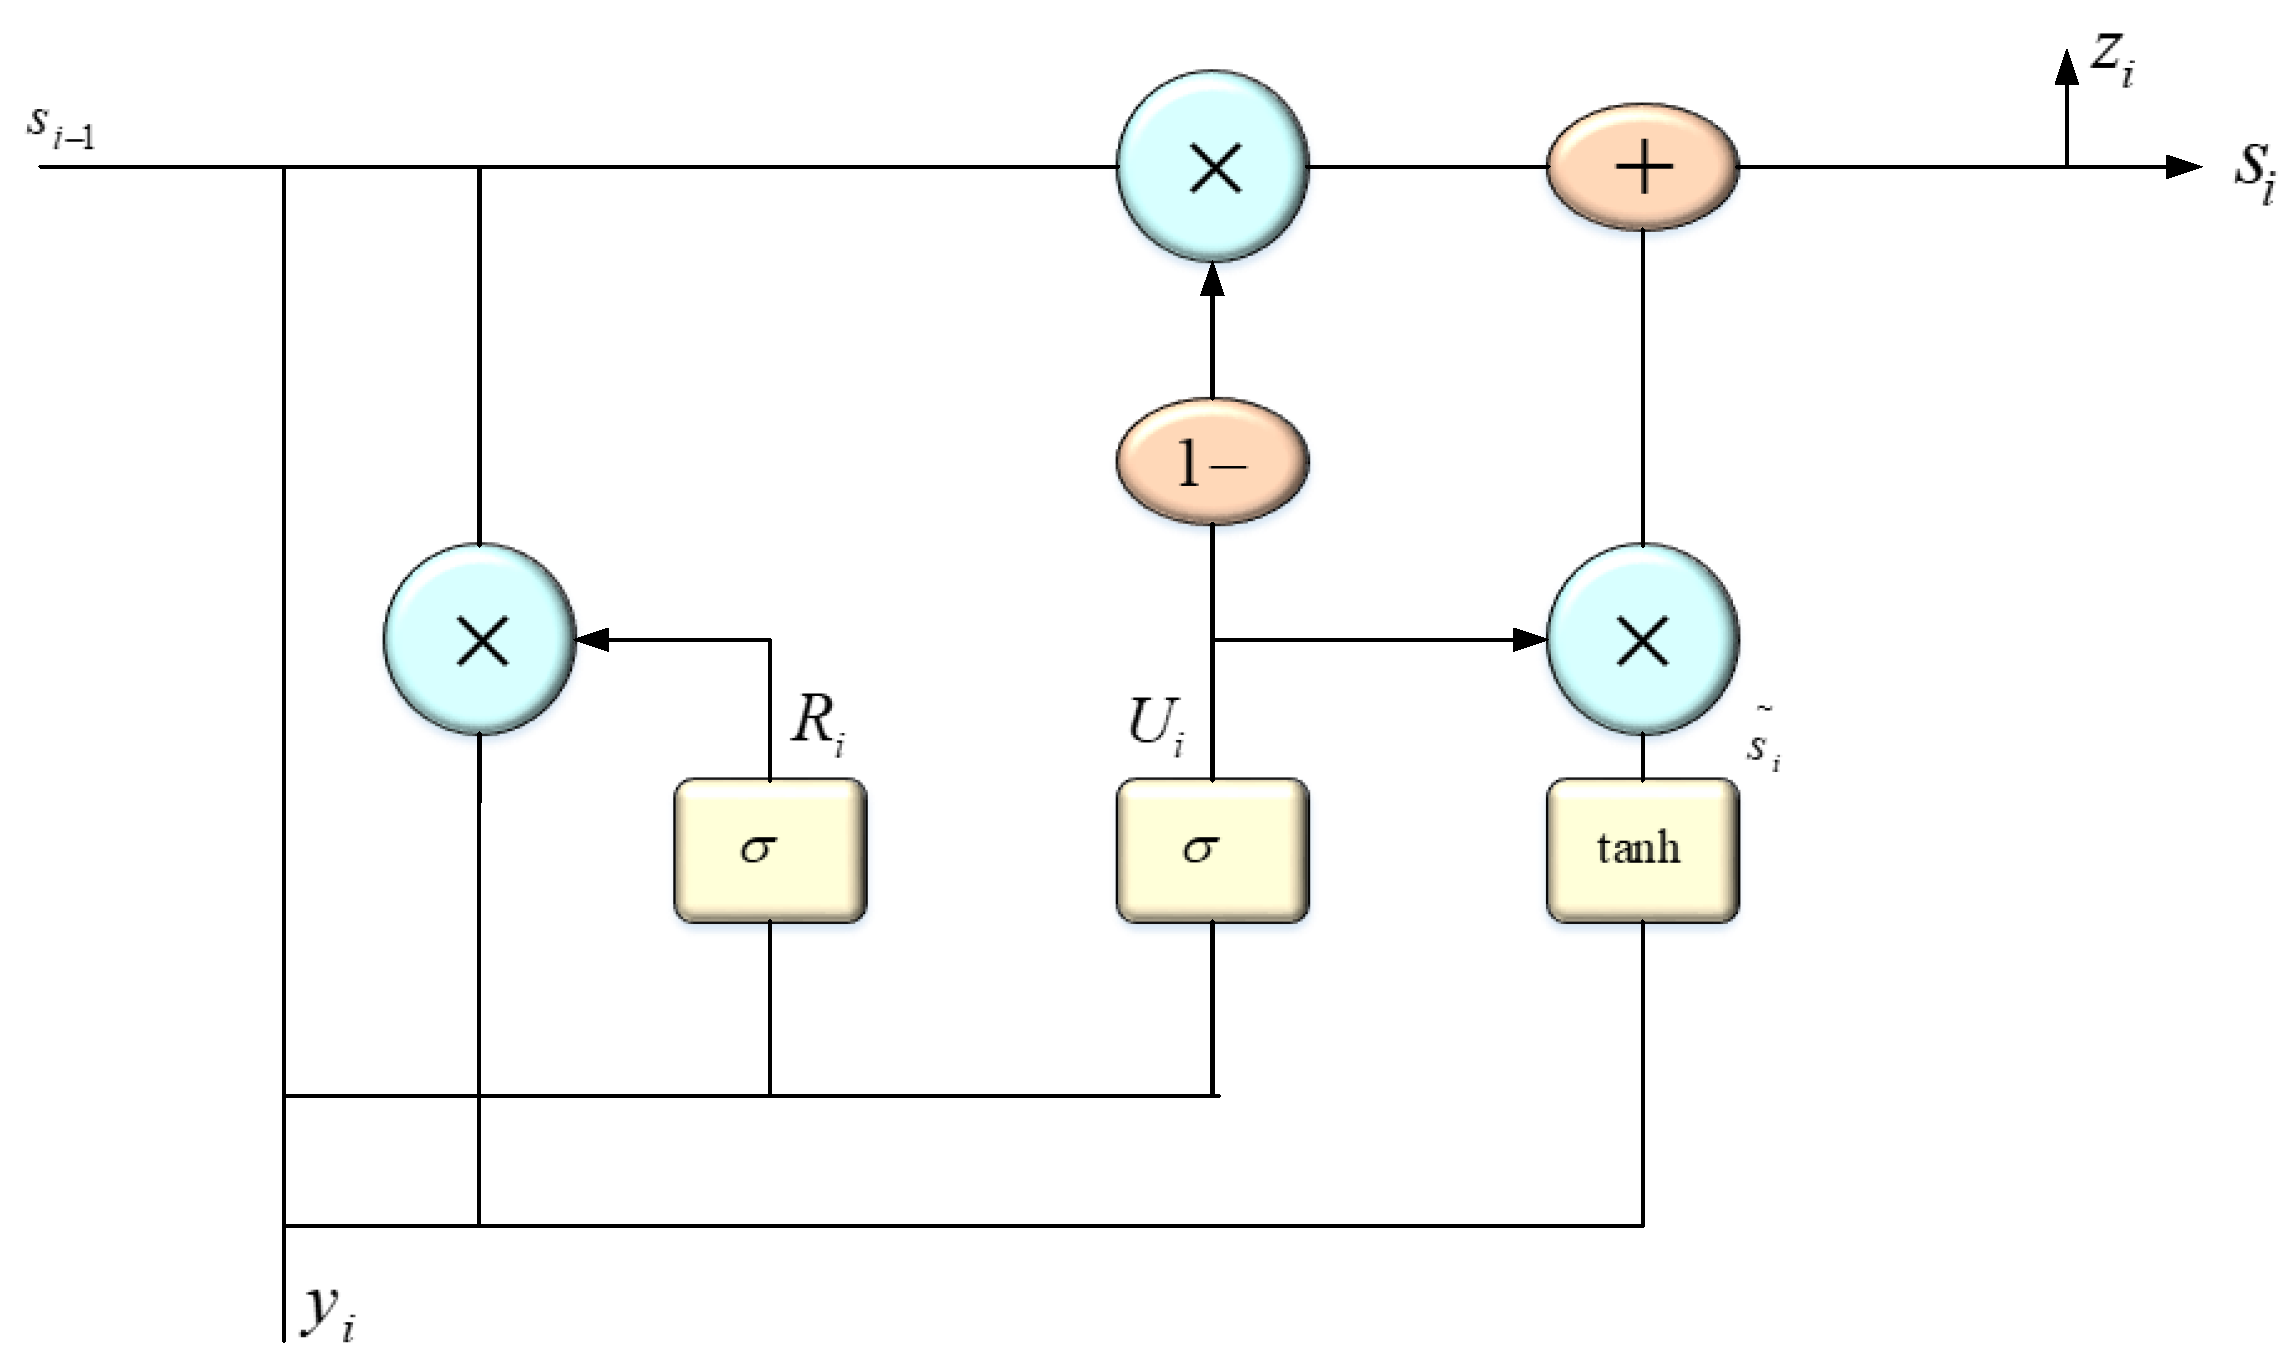
3.6. Intrusion Detection Using AGRU
Attention-Based Gated Recurrent Unit Neural Network Algorithm (AGRU)
| Algorithm 1: AGRU |
| Reset gate and update gate are given as follows: |
| (17) |
| (18) |
| The reset gate, which controls a GRU’s candidate set, operates according to the following formula: |
| (19) |
| Third, the GRU updates using the following formula during the update memory phase: |
| (20) |
| The forward propagation’s final result is which can be calculated using the following formula: |
4. Results and Discussion
4.1. Datasets Used to Assess the Efficiency of the PEDL Structure
4.2. Description of Evaluation Metrics
4.3. Evaluation of Intrusion Detection System
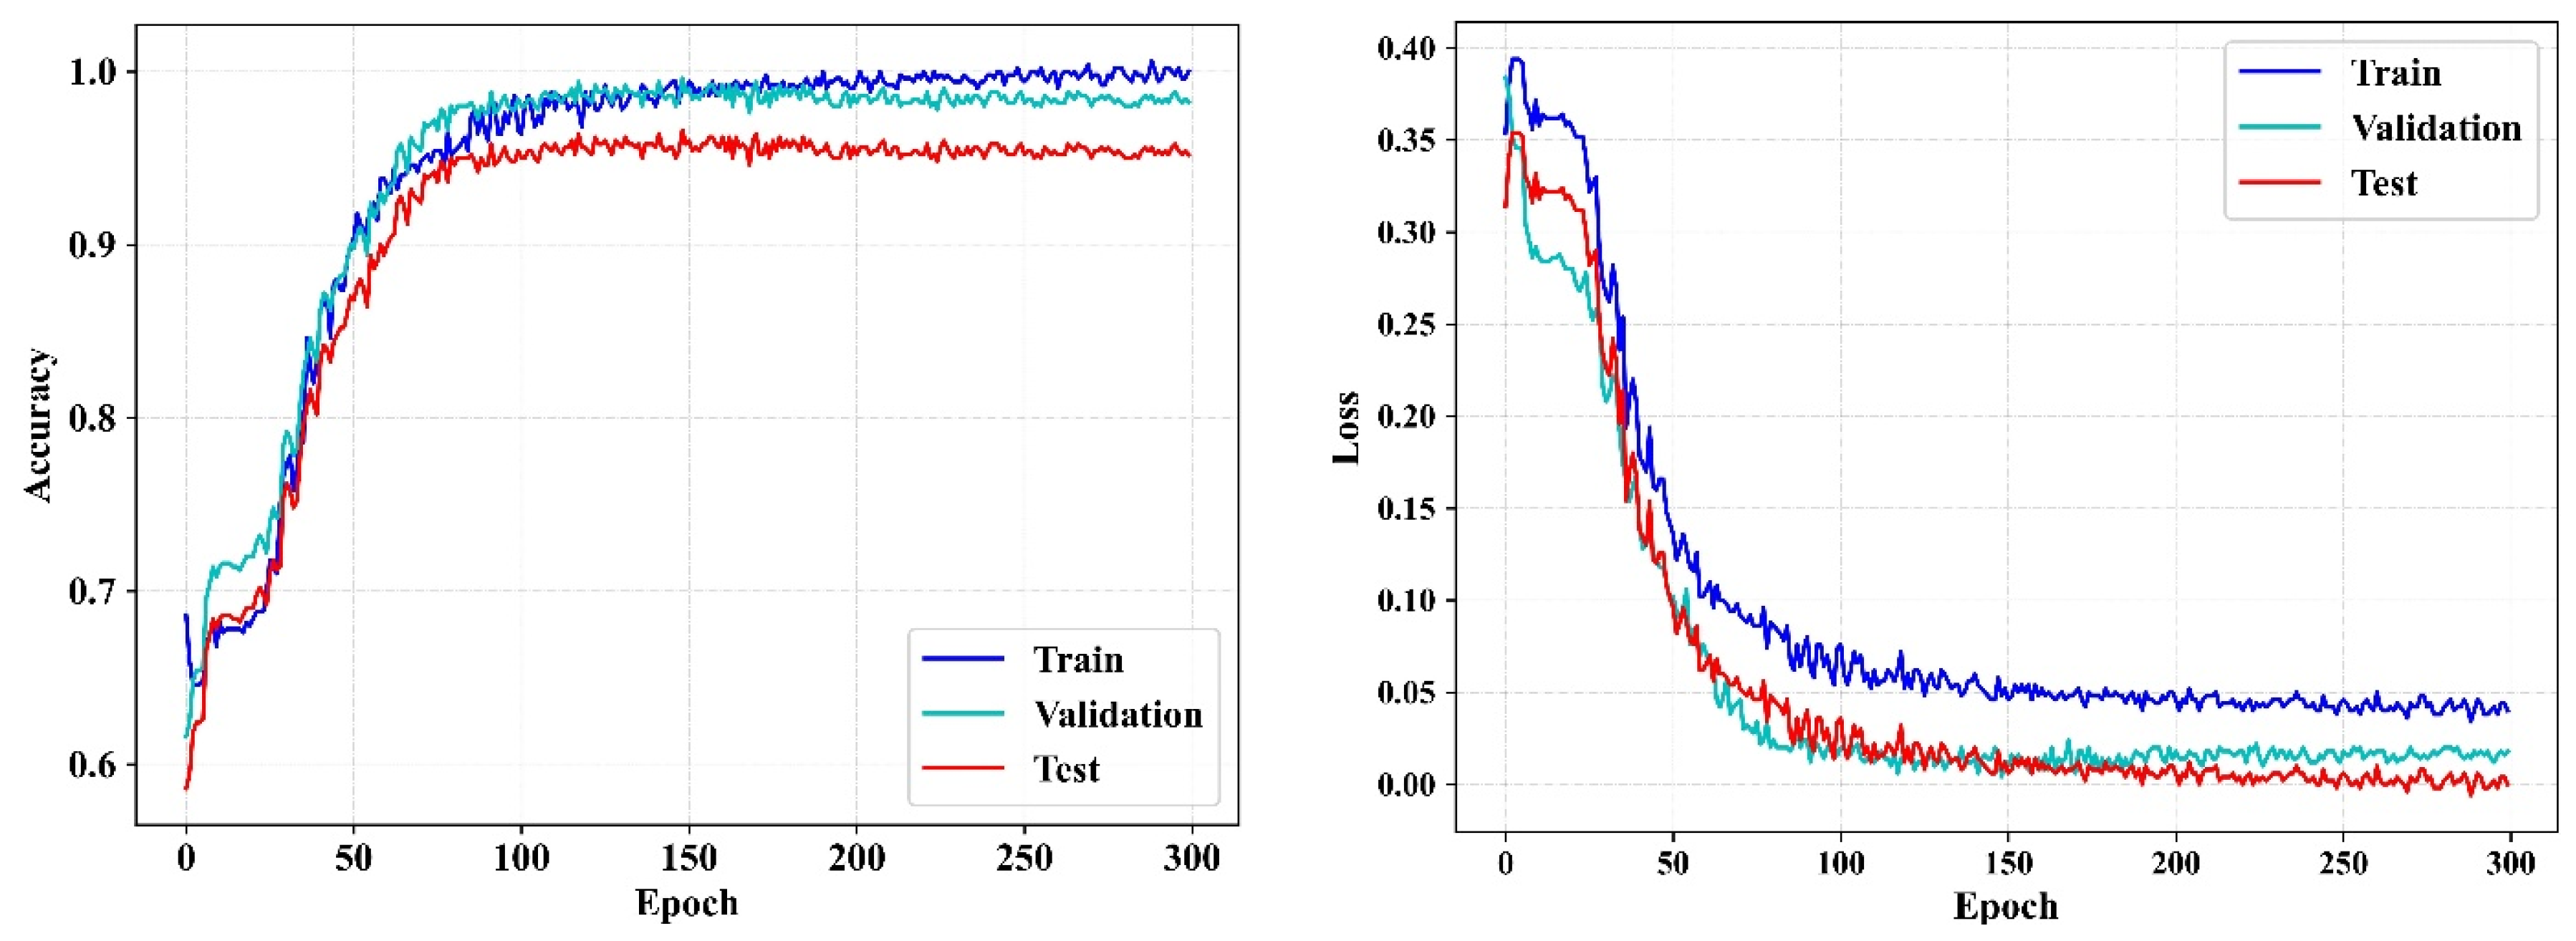
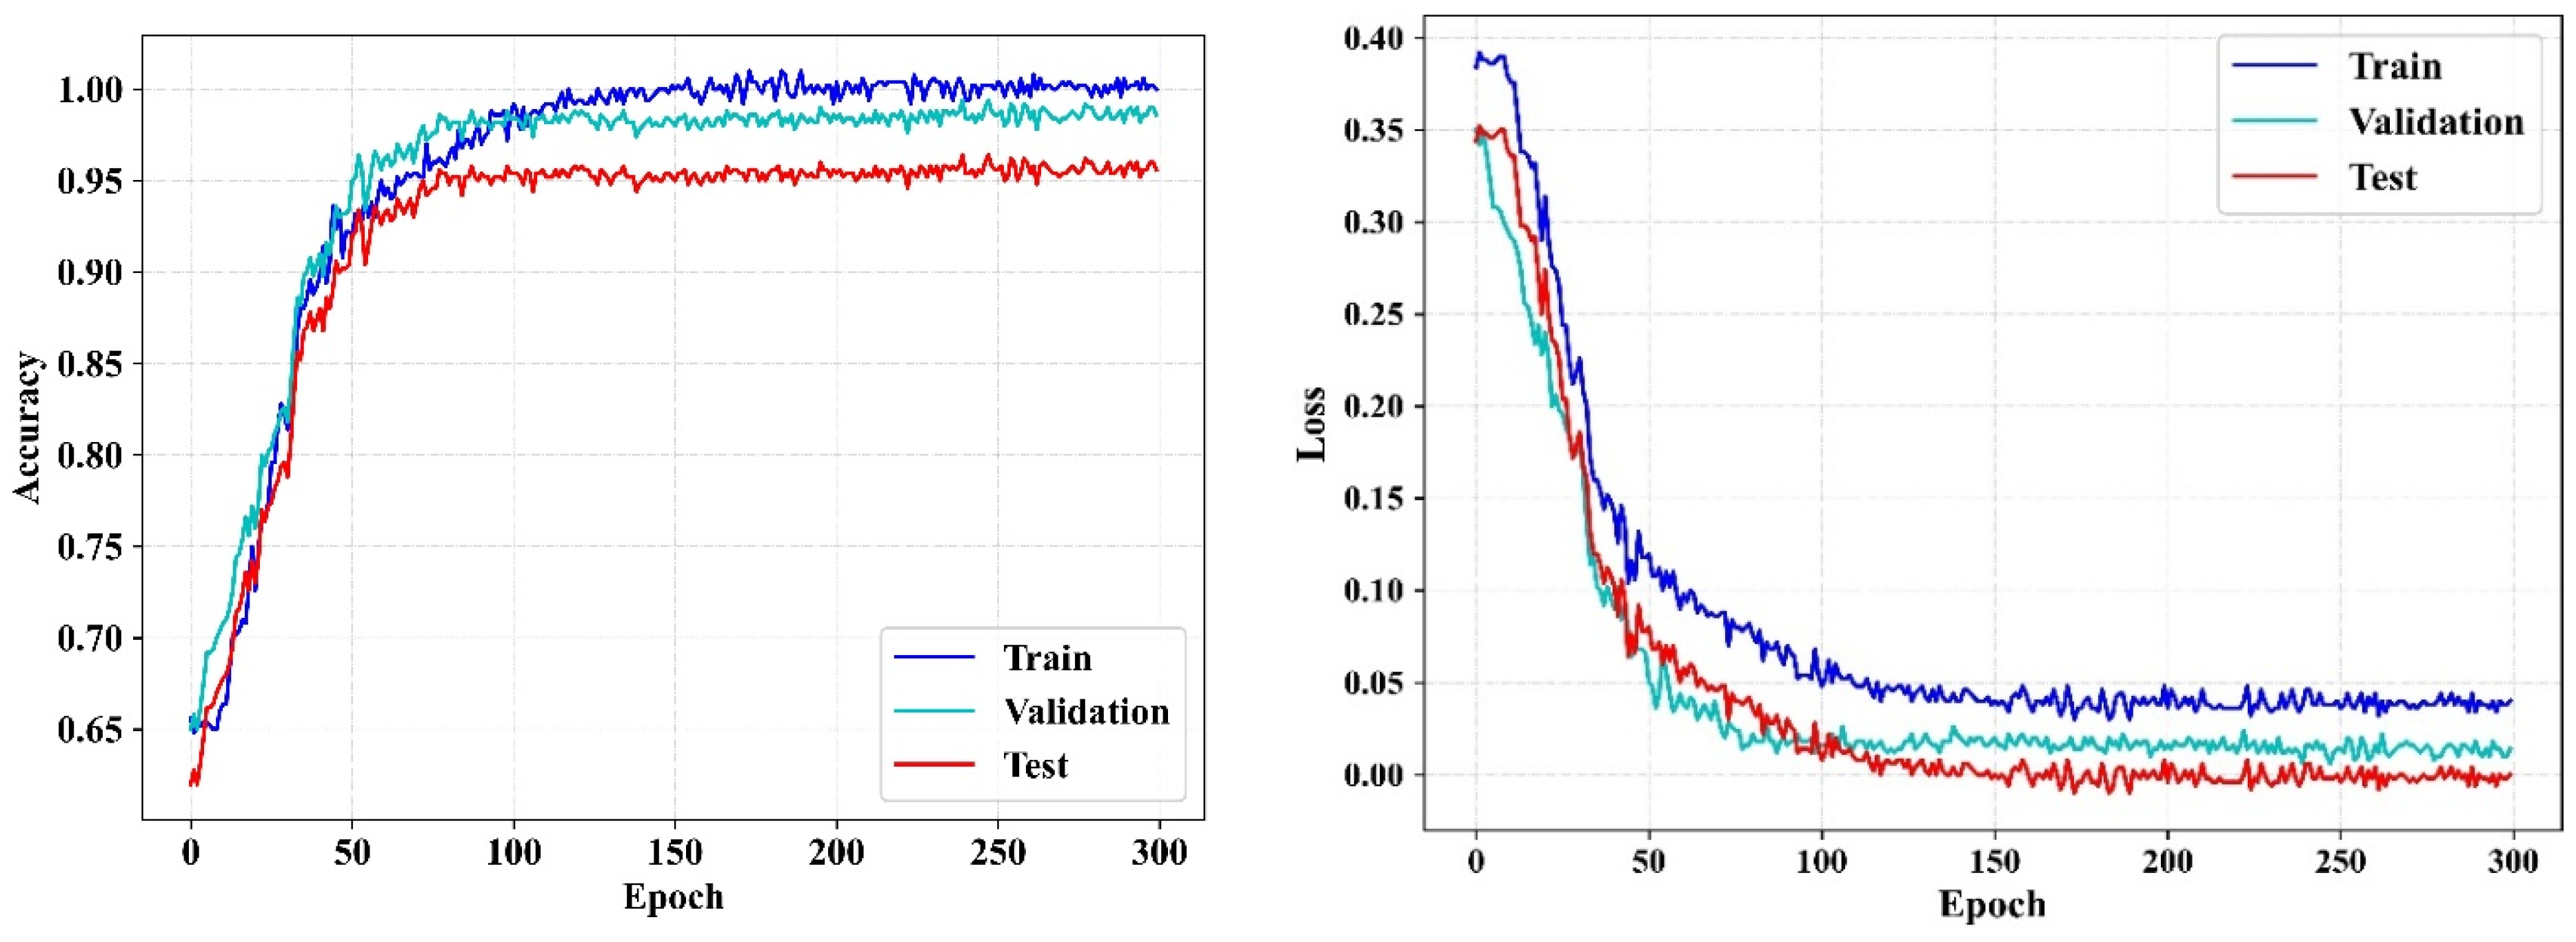
4.4. Accuracy and Loss Curve Analysis
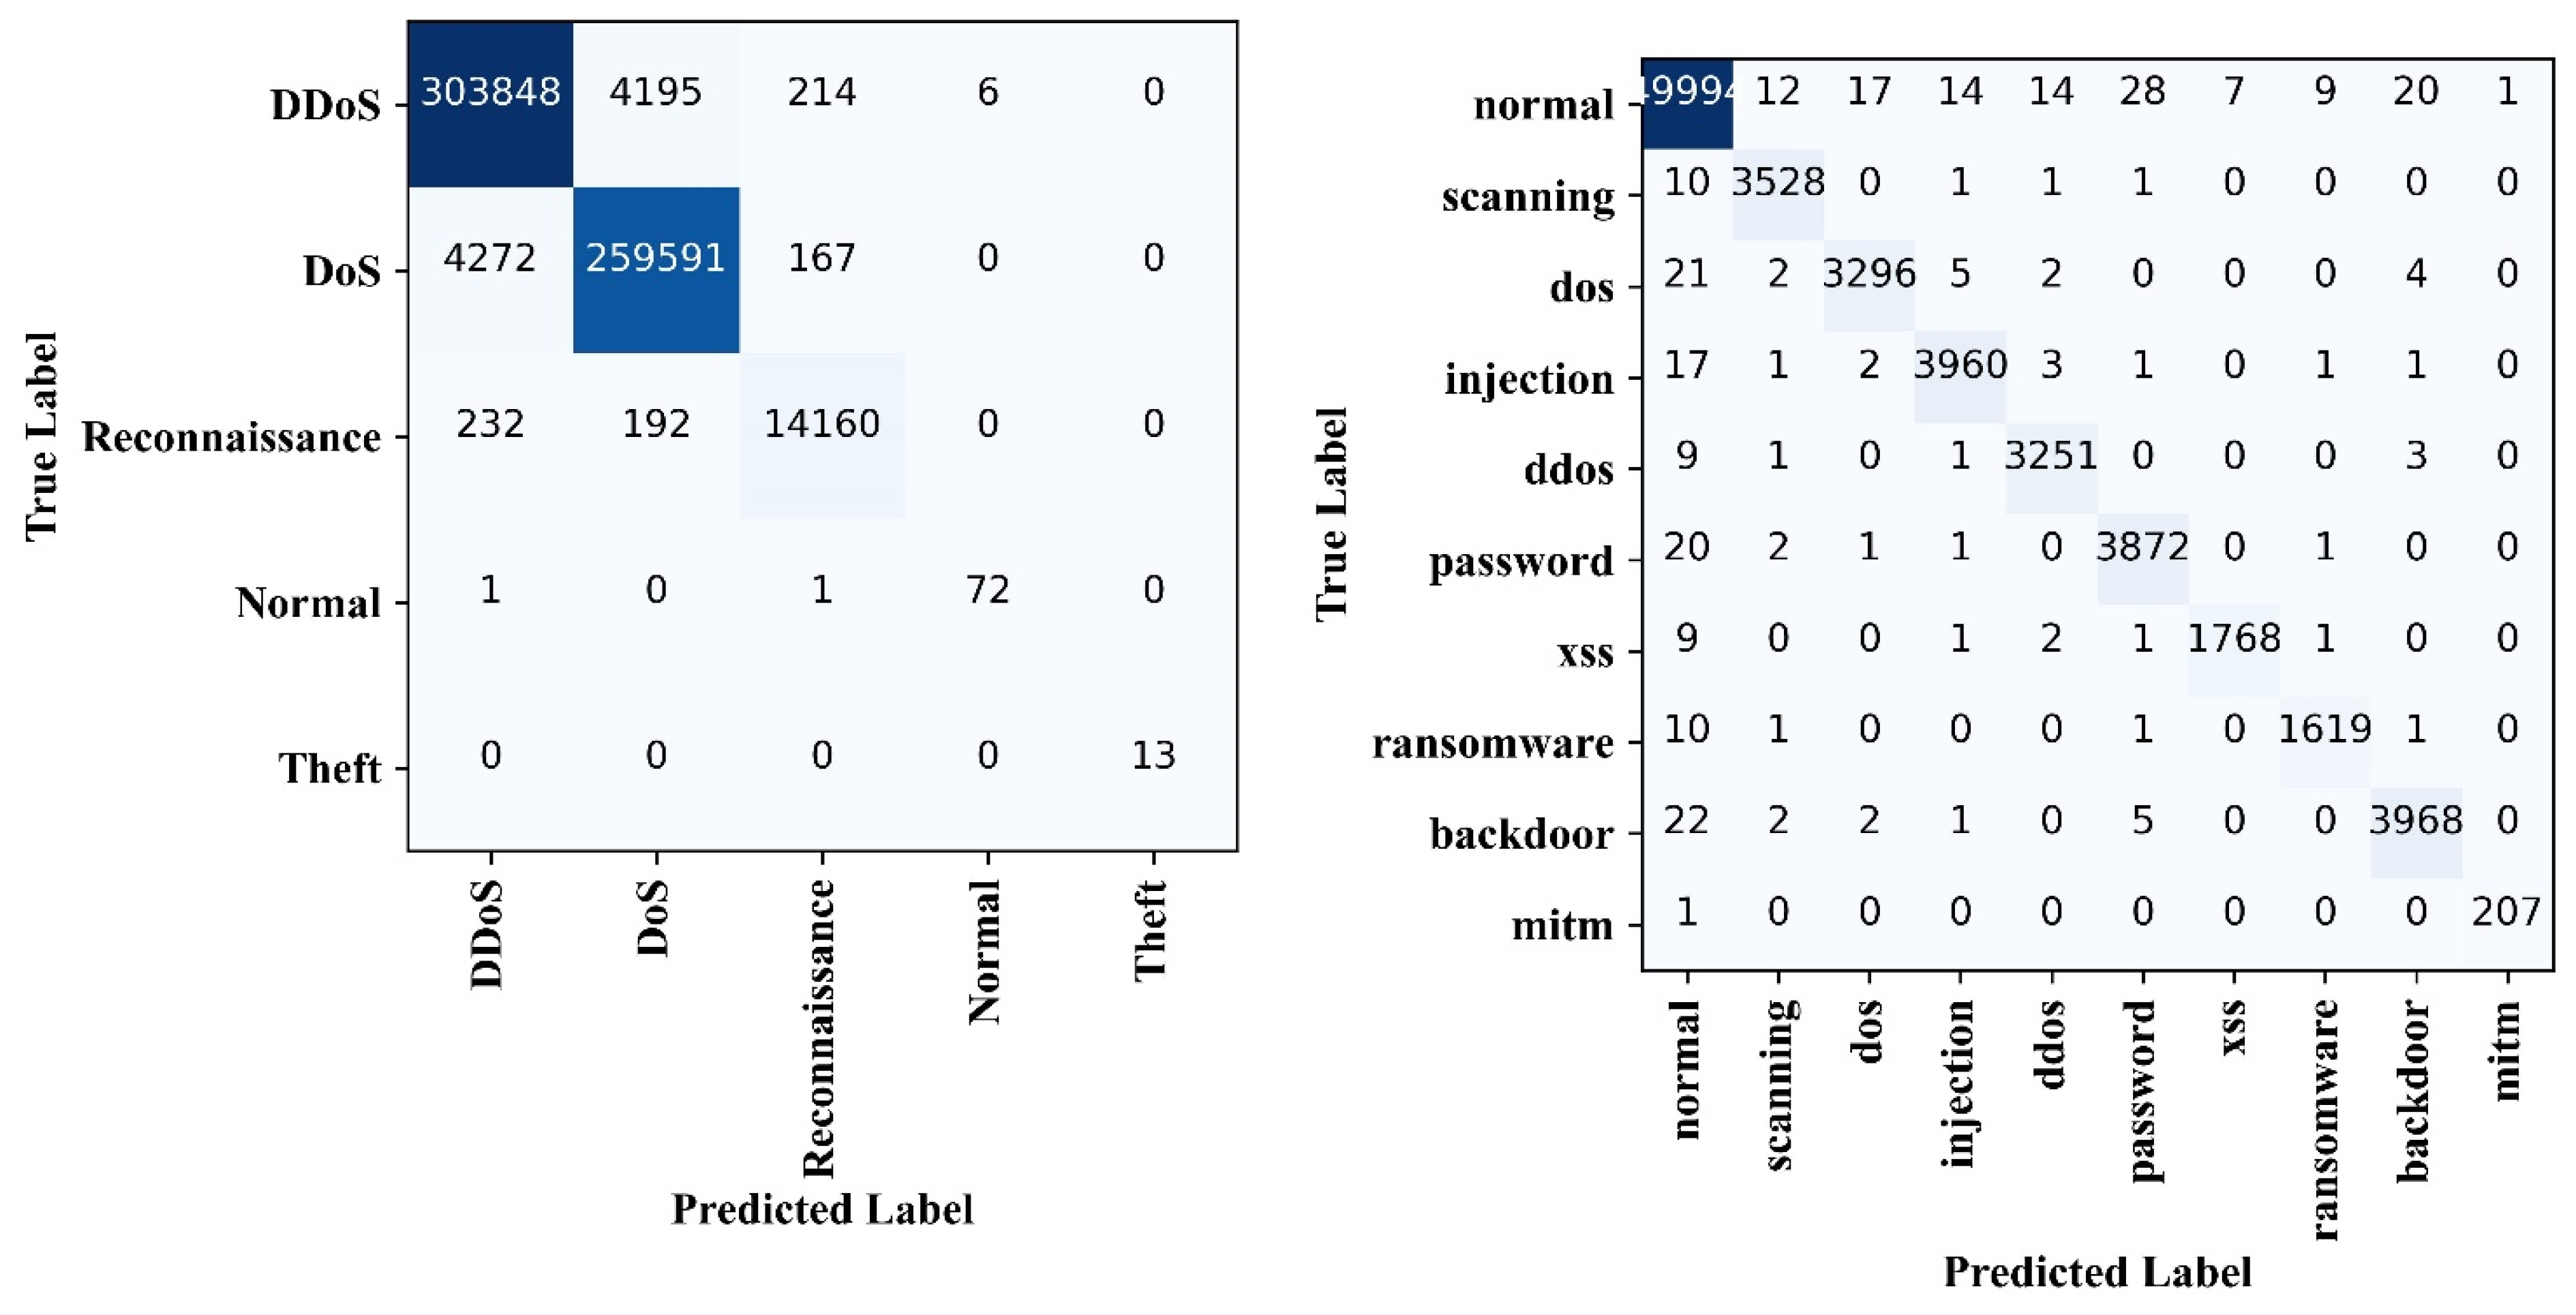
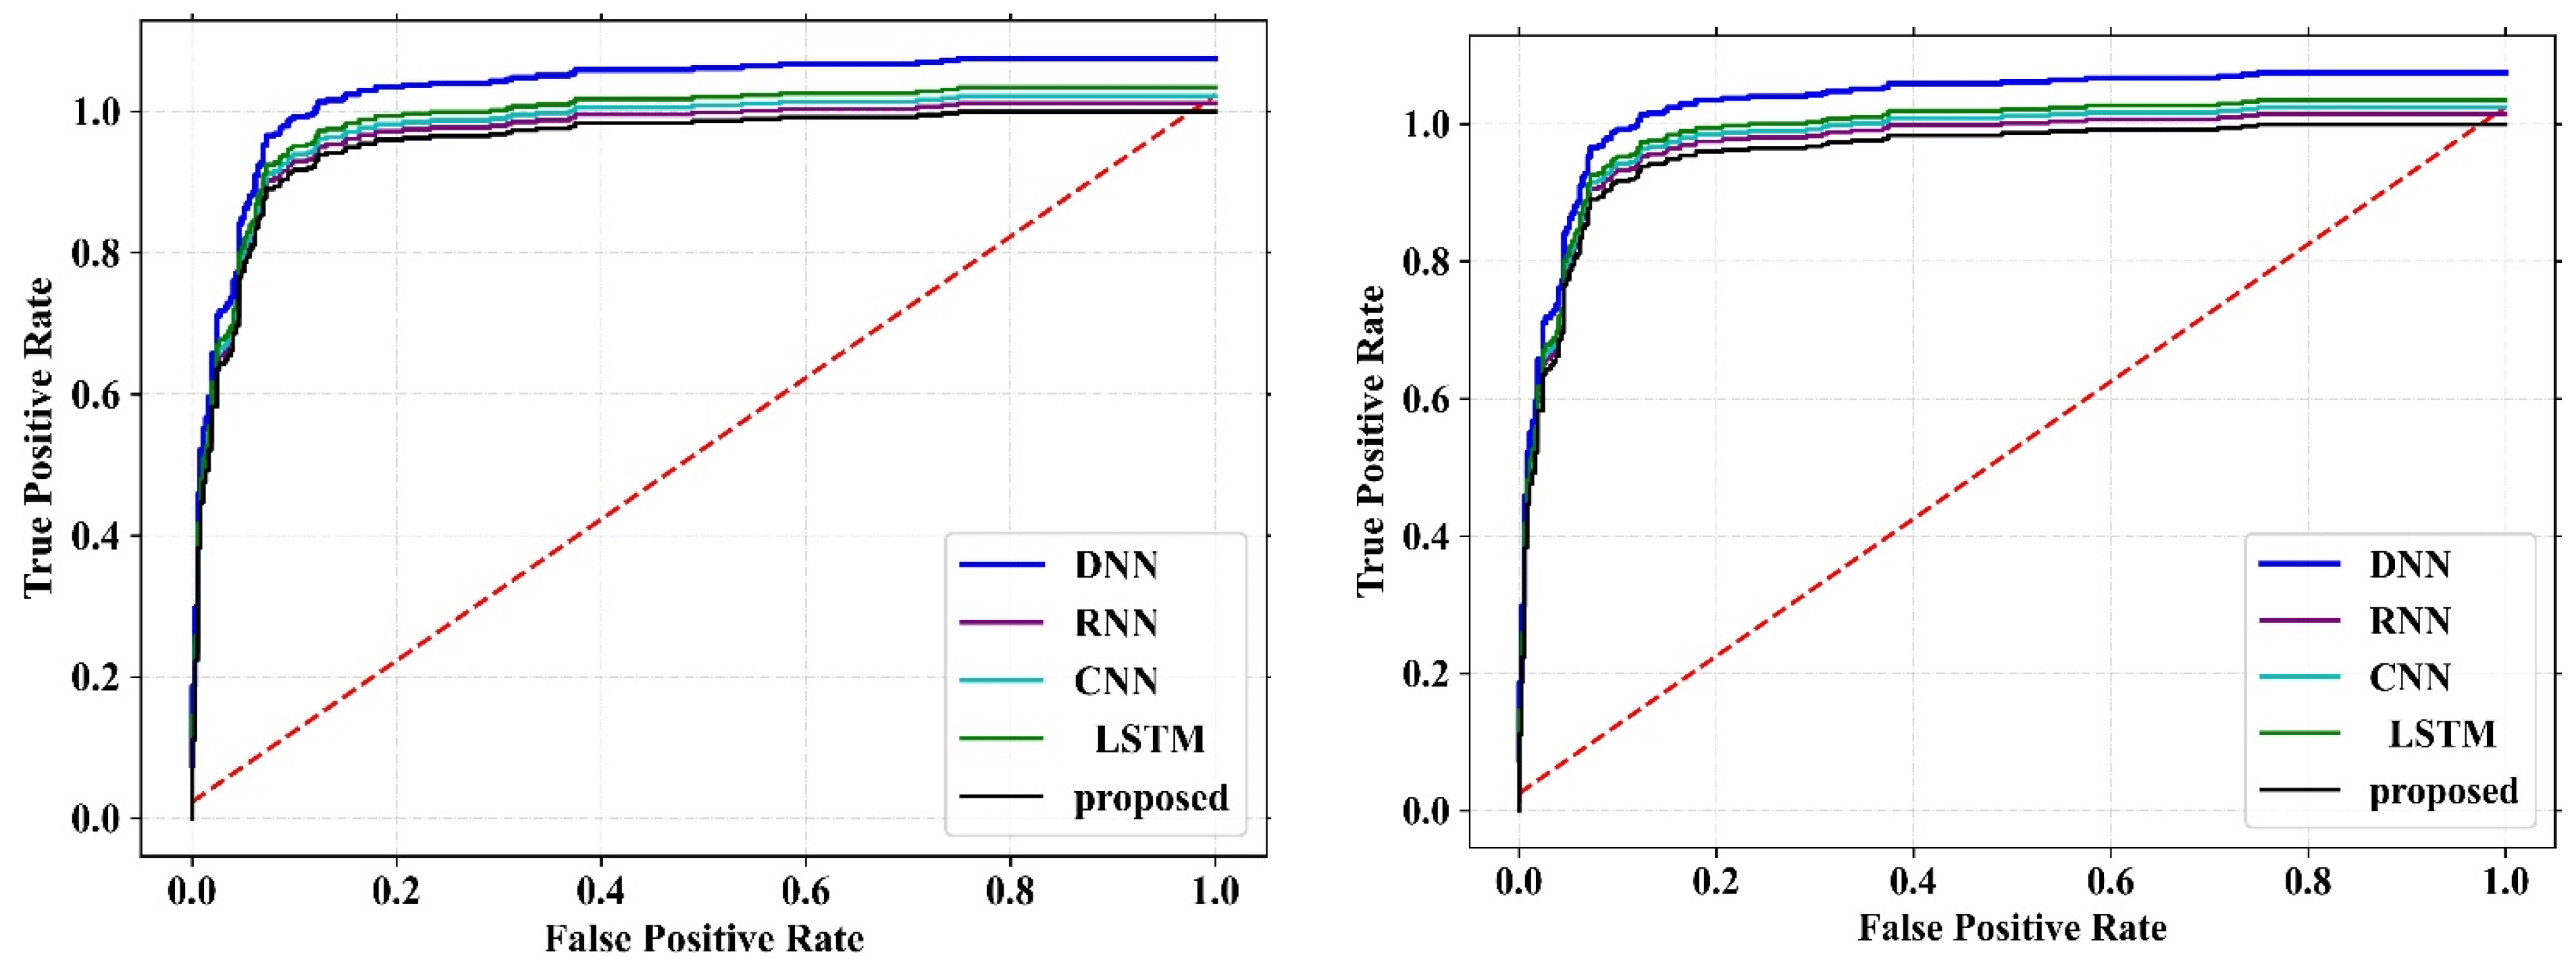
4.5. Confusion Matrix and ROC Analysis
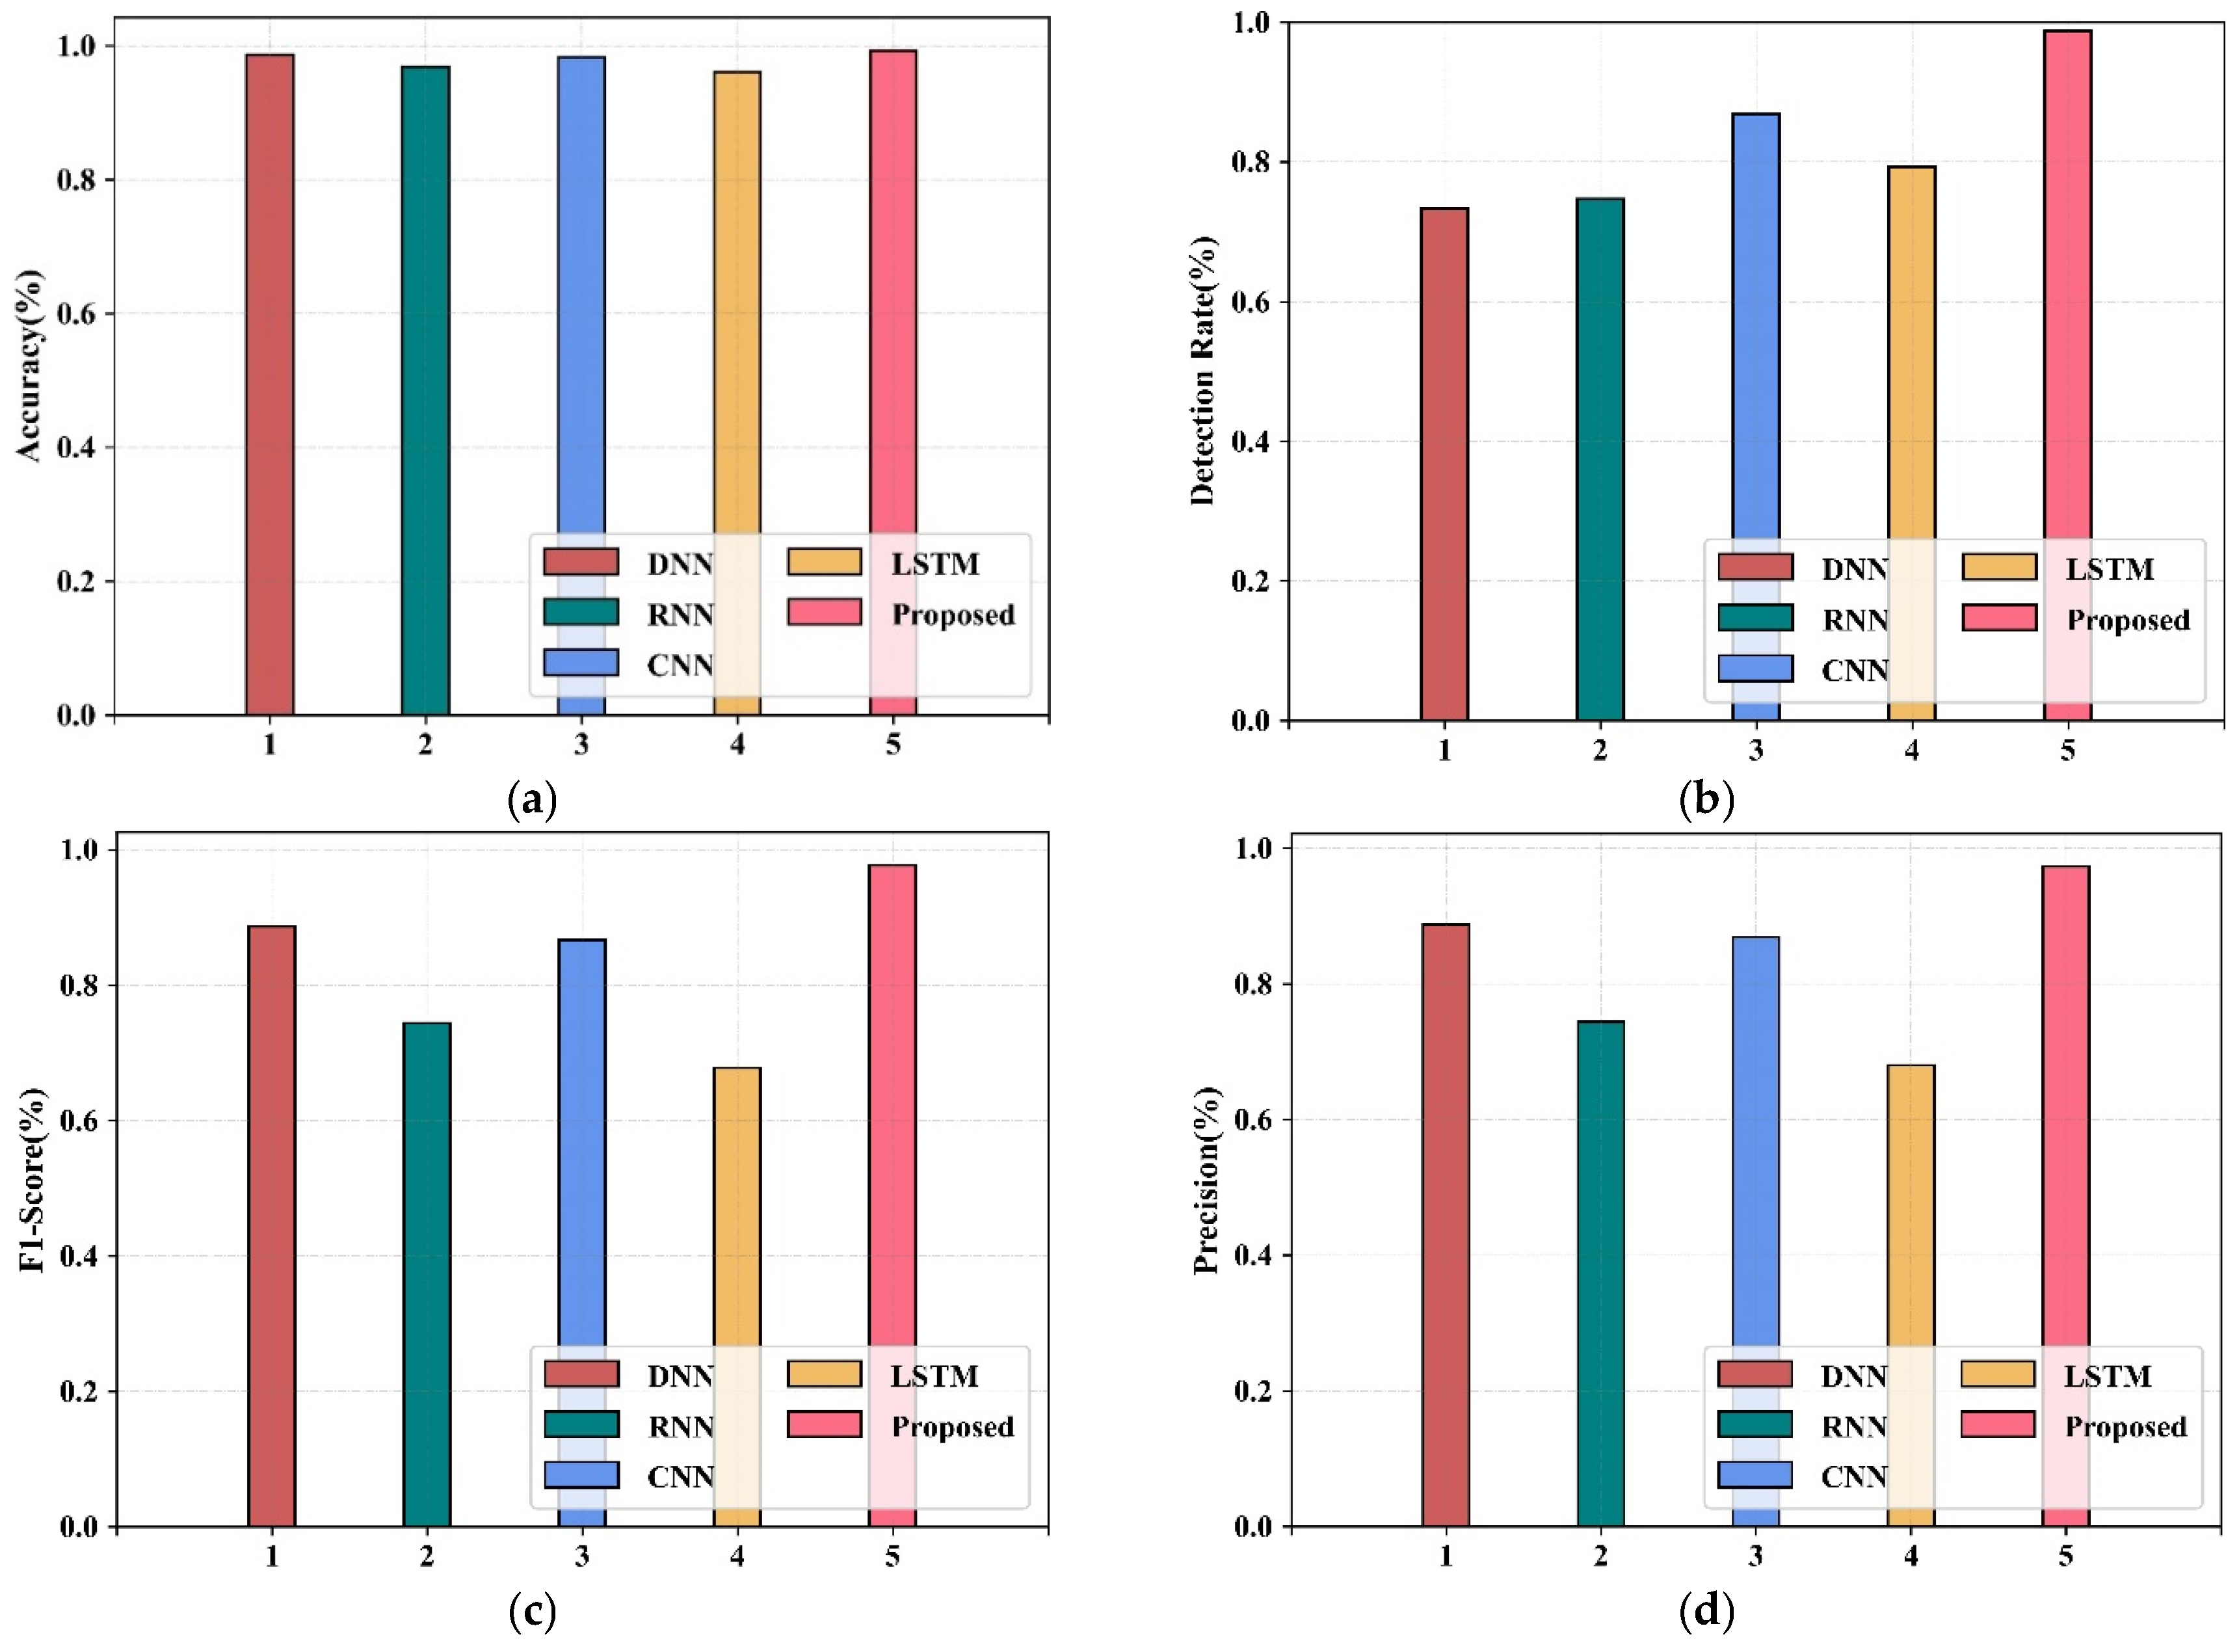
4.6. Comparisons with Existing Detection Models
5. Conclusions
Author Contributions
Funding
Data Availability Statement
Acknowledgments
Conflicts of Interest
References
- Rezk, N.G.; Hemdan, E.E.D.; Attia, A.F.; El-Sayed, A.; El-Rashidy, M.A. An efficient IoT based smart farming system using machine learning algorithms. Multimed. Tools Appl. 2021, 80, 773–797. [Google Scholar] [CrossRef]
- Varghese, R.; Sharma, S. Affordable smart farming using IoT and machine learning. In Proceedings of the 2018 Second International Conference on Intelligent Computing and Control Systems (ICICCS), Madurai, India, 14–15 June 2018; IEEE: Piscataway, NJ, USA, 2018; pp. 645–650. [Google Scholar]
- Popa, M.; Prostean, O.; Popa, A.S. Machine Learning Approach for Agricultural IoT in Proc. Int. J. Recent Technol. Eng. 2019, 22–29. [Google Scholar]
- Vij, A.; Vijendra, S.; Jain, A.; Bajaj, S.; Bassi, A.; Sharma, A. IoT and machine learning approaches for automation of farm irrigation system. Procedia Comput. Sci. 2020, 167, 1250–1257. [Google Scholar] [CrossRef]
- Ouafiq, E.M.; Saadane, R.; Chehri, A. Data Management and Integration of Low Power Consumption Embedded Devices IoT for Transforming Smart Agriculture into Actionable Knowledge. Agriculture 2022, 12, 329. [Google Scholar] [CrossRef]
- Reddy, K.S.P.; Roopa, Y.M.; LN, K.R.; Nandan, N.S. IoT based smart agriculture using machine learning. In Proceedings of the 2020 Second International Conference on Inventive Research in Computing Applications (ICIRCA), Coimbatore, India, 15–17 July 2020; IEEE: Piscataway, NJ, USA, 2020; pp. 130–134. [Google Scholar]
- Maduranga, M.W.P.; Abeysekera, R. Machine learning applications in IoT based agriculture and smart farming: A review. Int. J. Eng. Appl. Sci. Technol. 2020, 4, 24–27. [Google Scholar] [CrossRef]
- Muniasamy, A. Machine learning for smart farming: A focus on desert agriculture. In Proceedings of the 2020 International Conference on Computing and Information Technology (ICCIT-1441), Tabuk, Saudi Arabia, 9–10 September 2020; IEEE: Piscataway, NJ, USA, 2020; pp. 1–5. [Google Scholar]
- Rehman, A.; Liu, J.; Keqiu, L.; Mateen, A.; Yasin, M.Q. Machine learning prediction analysis using IoT for smart farming. Int. J. 2020, 8, 6482–6487. [Google Scholar]
- Xu, D. Agricultural climate change based on remote sensing image and emergency material supply management of agriculture, rural areas and farmers. Arab. J. Geosci. 2021, 14, 894. [Google Scholar] [CrossRef]
- Bhanu, K.N.; Jasmine, H.J.; Mahadevaswamy, H.S. Machine learning implementation in IoT based intelligent system for agriculture. In Proceedings of the 2020 International Conference for Emerging Technology (INCET), Belgaum, India, 5–7 June 2020; IEEE: Piscataway, NJ, USA, 2020; pp. 1–5. [Google Scholar]
- Sarangdhar, A.A.; Pawar, V.R. Machine learning regression technique for cotton leaf disease detection and controlling using IoT. In Proceedings of the 2017 International conference of Electronics, Communication and Aerospace Technology (ICECA), Coimbatore, India, 20–22 April 2017; IEEE: Piscataway, NJ, USA, 2017; Volume 2, pp. 449–454. [Google Scholar]
- Ramesh, S.; Vydeki, D. Rice blast disease detection and classification using machine learning algorithm. In Proceedings of the 2018 2nd International Conference on Micro-Electronics and Telecommunication Engineering (ICMETE), Ghaziabad, India, 20–21 September 2018; IEEE: Piscataway, NJ, USA, 2018; pp. 255–259. [Google Scholar]
- Kundu, N.; Rani, G.; Dhaka, V.S.; Gupta, K.; Nayak, S.C.; Verma, S.; Ijaz, M.F.; Woźniak, M. IoT and interpretable machine learning based framework for disease prediction in pearl millet. Sensors 2021, 21, 5386. [Google Scholar] [CrossRef]
- Jaisakthi, S.M.; Mirunalini, P.; Thenmozhi, D. Grape leaf disease identification using machine learning techniques. In Proceedings of the 2019 International Conference on Computational Intelligence in Data Science (ICCIDS), Chennai, India, 21–23 February 2019; IEEE: Piscataway, NJ, USA, 2019; pp. 1–6. [Google Scholar]
- Rumy, S.S.H.; Hossain, M.I.A.; Jahan, F.; Tanvin, T. An IoT based System with Edge Intelligence for Rice Leaf Disease Detection using Machine Learning. In Proceedings of the 2021 IEEE International IOT, Electronics and Mechatronics Conference (IEMTRONICS), Toronto, ON, Canada, 21–24 April 2021; IEEE: Piscataway, NJ, USA, 2021; pp. 1–6. [Google Scholar]
- Nawaz, M.A.; Rasool, R.M.; Kausar, M.; Usman, A.; Bukht, T.F.N.; Ahmad, R.; Jaleel, A. Plant disease detection using internet of thing (IoT). Int. J. Adv. Comput. Sci. Appl. 2020, 11, 505–509. [Google Scholar] [CrossRef] [Green Version]
- Garg, S.; Pundir, P.; Jindal, H.; Saini, H.; Garg, S. Towards a multimodal system for precision agriculture using IoT and machine learning. In Proceedings of the 2021 12th International Conference on Computing Communication and Networking Technologies (ICCCNT), Kharagpur, India, 6–8 July 2021; IEEE: Piscataway, NJ, USA, 2021; pp. 1–7. [Google Scholar]
- Vasavi, P.; Punitha, A.; Rao, T.V.N. Crop leaf disease detection and classification using machine learning and deep learning algorithms by visual symptoms: A review. Int. J. Electr. Comput. Eng. 2022, 12, 2079. [Google Scholar] [CrossRef]
- Aggarwal, S.; Suchithra, M.; Chandramouli, N.; Sarada, M.; Verma, A.; Vetrithangam, D.; Pant, B.; Ambachew Adugna, B. Rice Disease Detection Using Artificial Intelligence and Machine Learning Techniques to Improvise Agro-Business. Sci. Program. 2022, 2022, 1757888. [Google Scholar] [CrossRef]
- Visconti, P.; Giannoccaro, N.I.; de Fazio, R.; Strazzella, S.; Cafagna, D. IoT-oriented software platform applied to sensors-based farming facility with smartphone farmer app. Bull. Electr. Eng. Inform. 2020, 9, 1095–1105. [Google Scholar] [CrossRef]
- Anand, R.; Sethi, D.; Sharma, K.; Gambhir, P. Soil moisture and atmosphere components detection system using IoT and machine learning. In Proceedings of the 2019 International Conference on Smart Systems and Inventive Technology (ICSSIT), Tirunelveli, India, 27–29 November 2019; IEEE: Piscataway, NJ, USA, 2019; pp. 842–847. [Google Scholar]
- Vincent, D.R.; Deepa, N.; Elavarasan, D.; Srinivasan, K.; Chauhdary, S.H.; Iwendi, C. Sensors driven AI-based agriculture recommendation model for assessing land suitability. Sensors 2019, 19, 3667. [Google Scholar] [CrossRef] [Green Version]
- Mahmoudzadeh, H.; Matinfar, H.R.; Taghizadeh-Mehrjardi, R.; Kerry, R. Spatial prediction of soil organic carbon using machine learning techniques in western Iran. Geoderma Reg. 2020, 21, e00260. [Google Scholar] [CrossRef]
- Angin, P.; Anisi, M.H.; Göksel, F.; Gürsoy, C.; Büyükgülcü, A. AgriLoRa: A digital twin framework for smart agriculture. J. Wirel. Mob. Netw. Ubiquitous Comput. Dependable Appl. 2020, 11, 77–96. [Google Scholar]
- Ali, M.; Kanwal, N.; Hussain, A.; Samiullah, F.; Iftikhar, A.; Qamar, M. IoT based smart garden monitoring system using NodeMCU microcontroller. Int. J. Adv. Appl. Sci. 2020, 7, 117–124. [Google Scholar]
- Ali, R.; Pal, A.K.; Kumari, S.; Karuppiah, M.; Conti, M. A secure user authentication and key-agreement scheme using wireless sensor networks for agriculture monitoring. Future Gener. Comput. Syst. 2018, 84, 200–215. [Google Scholar] [CrossRef]
- Bothe, A.; Bauer, J.; Aschenbruck, N. RFID-assisted continuous user authentication for IoT-based smart farming. In Proceedings of the 2019 IEEE international conference on RFID technology and applications (RFID-TA), Pisa, Italy, 25–27 September 2019; IEEE: Piscataway, NJ, USA, 2019; pp. 505–510. [Google Scholar]
- Di Mauro, M.; Galatro, G.; Liotta, A. Experimental review of neural-based approaches for network intrusion management. IEEE Trans. Netw. Serv. Manag. 2020, 17, 2480–2495. [Google Scholar] [CrossRef]
- Dong, S.; Xia, Y.; Peng, T. Network abnormal traffic detection model based on semi-supervised deep reinforcement learning. IEEE Trans. Netw. Serv. Manag. 2021, 18, 4197–4212. [Google Scholar] [CrossRef]
- Pelletier, C.; Webb, G.I.; Petitjean, F. Deep learning for the classification of Sentinel-2 image time series. In Proceedings of the IGARSS 2019–2019 IEEE International Geoscience and Remote Sensing Symposium, Yokohama, Japan, 28 July–2 August 2019; IEEE: Piscataway, NJ, USA, 2019; pp. 461–464. [Google Scholar]
- Rangwani, D.; Sadhukhan, D.; Ray, S.; Khan, M.K.; Dasgupta, M. An improved privacy preserving remote user authentication scheme for agricultural wireless sensor network. Trans. Emerg. Telecommun. Technol. 2021, 32, e4218. [Google Scholar] [CrossRef]
- Vangala, A.; Das, A.K.; Lee, J.H. Provably secure signature-based anonymous user authentication protocol in an Internet of Things-enabled intelligent precision agricultural environment. Concurr. Comput. Pract. Exp. 2021, e6187. [Google Scholar] [CrossRef]
- Vidyashree, L.; Suresha, B.M. Methodology to secure agricultural data in IoT. In Emerging Technologies in Data Mining and Information Security; Springer: Singapore, 2019; pp. 129–139. [Google Scholar]
- Chen, M.; Lee, T.F.; Pan, J.I. An enhanced lightweight dynamic pseudonym identity based authentication and key agreement scheme using wireless sensor networks for agriculture monitoring. Sensors 2019, 19, 1146. [Google Scholar] [CrossRef] [Green Version]
- Gupta, A.; Nahar, P. Classification and yield prediction in smart agriculture system using IoT. J. Ambient. Intell. Humaniz. Comput. 2022, 1–10. [Google Scholar] [CrossRef]
- Bakthavatchalam, K.; Karthik, B.; Thiruvengadam, V.; Muthal, S.; Jose, D.; Kotecha, K.; Varadarajan, V. IoT framework for measurement and precision agriculture: Predicting the crop using machine learning algorithms. Technologies 2022, 10, 13. [Google Scholar] [CrossRef]
- Colombo-Mendoza, L.O.; Paredes-Valverde, M.A.; Salas-Zárate, M.D.P.; Valencia-García, R. Internet of Things-driven data mining for smart crop production prediction in the peasant farming domain. Appl. Sci. 2022, 12, 1940. [Google Scholar] [CrossRef]
- Murugamani, C.; Shitharth, S.; Hemalatha, S.; Kshirsagar, P.R.; Riyazuddin, K.; Naveed, Q.N.; Islam, S.; Ali, S.P.M.; Batu, A. Machine Learning Technique for Precision Agriculture Applications in 5G-Based Internet of Things. Wirel. Commun. Mob. Comput. 2022, 2022, 6534238. [Google Scholar] [CrossRef]
- Raghuvanshi, A.; Singh, U.K.; Sajja, G.S.; Pallathadka, H.; Asenso, E.; Kamal, M.; Singh, A.; Phasinam, K. Intrusion detection using machine learning for risk mitigation in IoT-enabled smart irrigation in smart farming. J. Food Qual. 2022, 2022, 3955514. [Google Scholar] [CrossRef]
- Kumar, S.D.; Esakkirajan, S.; Bama, S.; Keerthiveena, B. A microcontroller based machine vision approach for tomato grading and sorting using SVM classifier. Microprocess. Microsyst. 2020, 76, 103090. [Google Scholar]
- Vatti, R.; Vatti, N.; Mahender, K.; Vatti, P.L.; Krishnaveni, B. Solar energy harvesting for smart farming using nanomaterial and machine learning. In IOP Conference Series: Materials Science and Engineering; IOP Publishing: Tokyo, Japan, 2020; Volume 981, p. 032009. [Google Scholar]
- Patel, B.; Sharaff, A. Rice crop disease prediction using machine learning technique. Int. J. Agric. Environ. Inf. Syst. 2021, 12, 1–15. [Google Scholar] [CrossRef]


| Author and Year | Aim | Merits | Demerits |
|---|---|---|---|
| Mendoza et al., 2022 [21] | IoT-driven data mining for smart prediction of crops in the domain of peasant farming | It uses cheaper IoT sensors, data analytical services, and popular data storage devices | The system needs periodic service |
| Murugamani et al., 2022 [22] | ML-based approach for precise agriculture in 5G-based IoT | Affordable | In sandy soil, the accuracy is lower due to the presence of large particles |
| Raghuvanshi et al., 2022 [23] | Detection and classification of intrusions into IoT networks utilized in agriculture | It ensures security in IoT network | Classification accuracy is low |
| Kethineni et al., 2023 [24] | Powerful intrusion detection system for smart agriculture DDoS attack detection | Accurate detection | Only some IoT attacks are detected |
| Ferrag et al., 2021 [25] | For cyber-security in agriculture 4.0 | Examined for both binary and multi-class classifications | Complexity while using |
| Cheng et al., 2022 [26] | Multiple-dimensional time series data produced using smart agricultural Internet of Things | GAN because time series data have a temporal dependence and there may be potential correlation between multiple variables | Even if the time window is extended, the model’s performance is going to decrease |
| Zhang et al., 2022 [27] | A flexible and systematic hybrid model | Identifying smart contract vulnerabilities, the model demonstrated excellent performance gains | Technique struggles to detect integer overflow vulnerabilities |
| Zhang et al., 2022 [28] | Identifying smart contract vulnerabilities | Its great scalability and support for simultaneous vulnerability detection; it does not require separate models to be trained for different types of vulnerabilities | The system may be complex in nature |
| Di Mauro et al., 2020 [29] | Experimental review of neural-based approaches for network intrusion management | Depends on time complexity and the feed-forward incremental learning activated in WiSARD | Neural networks require large amounts of labeled data to be trained effectively |
| Dong, S et al., 2021 [30] | Network abnormal traffic detection model depends on semi-supervised deep reinforcement learning | Improved efficiency | Difficulty with adversarial attacks and limited interpretability |
| Pelletier, C. et al., 2019 [31] | Categorization of Sentinel-2 image time series | High accuracy in image classification and improved generalization | Requires significant computational resources to be trained and operated, which can be expensive and time-consuming |
| Hyper Parameters | |
|---|---|
| No. of hidden layers | 10 |
| No. of hidden nodes | 60 |
| Dropout rate | 0.2 |
| Optimizer | adam |
| Activation | relu |
| No. of epoch | 20 |
| Batch size | 121 |
| Loss | Mean square error |
| System Configuration | |
|---|---|
| Device name | SST003 |
| Processor | Intel(R) Core(TM) i5-3570 CPU @ 3.40 GHz 3.40 GHz |
| Installed RAM | 8.00 GB (7.89 GB usable) |
| Device ID | 330431F3-8552-4664-BCAD-E0108D59137B |
| Product ID | 00330-80000-00000-AA440 |
| System type | 64-bit operating system, x64-based processor |
| Pen and touch | No pen or touch input is available for this display |
| Edition | Windows 10 Pro |
| Version | 21H2 |
| OS build | 19044.2728 |
| Dataset | Partition of Class | Entire Occurrences | Rate of Class Frequency (%) |
|---|---|---|---|
| ToN-IoT training set | Backdoor (0) | 14,135 | 4.35 |
| DDoS (1) | 13,971 | 4.32 | |
| DoS (2) | 13,913 | 4.33 | |
| Injection (3) | 14,071 | 4.34 | |
| MITM (4) | 727 | 0.21 | |
| Normal (5) | 209,792 | 65.06 | |
| Password (6) | 14,017 | 4.37 | |
| Ransomware (7) | 13,992 | 4.32 | |
| Scanning (8) | 14,100 | 4.29 | |
| XSS (9) | 14,012 | 4.36 | |
| ToN-IoT testing set | Backdoor (0) | 5865 | 4.29 |
| DDoS (1) | 6029 | 4.36 | |
| DoS (2) | 6087 | 4.33 | |
| Injection (3) | 5929 | 4.31 | |
| MITM (4) | 316 | 0.25 | |
| Normal (5) | 90,208 | 65.07 | |
| Password (6) | 5983 | 4.26 | |
| Ransomware (7) | 6008 | 4.36 | |
| Scanning (8) | 5900 | 4.44 | |
| XSS (9) | 5988 | 4.28 | |
| IoT Botnet training set | DDoS (0) | 455,786 | 33.56 |
| DoS (1) | 445,578 | 32.80 | |
| Reconnaissance (2) | 388,508 | 28.60% | |
| Normal (3) | 68,038 | 5.01% | |
| Theft (4) | 364 | 0.03% | |
| IoT Botnet testing set | DDoS (0) | 73,602 | 33.59% |
| DoS (1) | 71,971 | 32.85% | |
| Reconnaissance (2) | 62,477 | 28.51% | |
| Normal (3) | 11,015 | 5.03% | |
| Theft (4) | 48 | 0.02% |
| Dataset | Selected Features | Overall Features Selected |
|---|---|---|
| ToN IoT | 20 | F1, F2, F5, F8, F10, F13, F14, F16, F19, F24, F29, F30, F33, F36, F37, F39, F41, F43, F46, F47 |
| IoT Botnet | 20 | F1, F3, F6, F9, F11, F15, F17, F21, F23, F26, F27, F28, F31, F33, F38, F45, F49, F68, F75, F84 |
| TON-IOT Dataset | ||||
|---|---|---|---|---|
| Class | Precision | Detection Rate | F1-Score | Accuracy |
| normal | 99.7% | 99.7% | 99.7% | 99.6% |
| scanning | 99.4% | 99.2% | 99.3% | 99.9% |
| dos | 99.1% | 99.2% | 99.1% | 99.9% |
| injection | 99.3% | 99.3% | 99.3% | 99.9% |
| ddos | 99.4% | 99.4% | 99.4% | 99.9% |
| password | 99.2% | 99.3% | 99.3% | 99.9% |
| xss | 99.2% | 99.1% | 99.2% | 99.9% |
| ransomware | 99% | 99.3% | 99.2% | 99.9% |
| backdoor | 99.3% | 99.4% | 99.4% | 99.9% |
| mitm | 99.5% | 99.5% | 99.5% | 99.9% |
| IOT-Botnet Dataset | ||||
|---|---|---|---|---|
| Class | Precision | Detection Rate | F1-Score | Accuracy |
| DDoS | 98.5% | 98.5% | 98.5% | 98.5% |
| DoS | 98.3% | 98.3% | 98.3% | 98.5% |
| Reconnaissance | 97.2% | 97.1% | 97.1% | 99.8% |
| Normal | 95.8% | 94.5% | 95.2% | 99.9% |
| Theft | 1 | 1 | 1 | 1 |
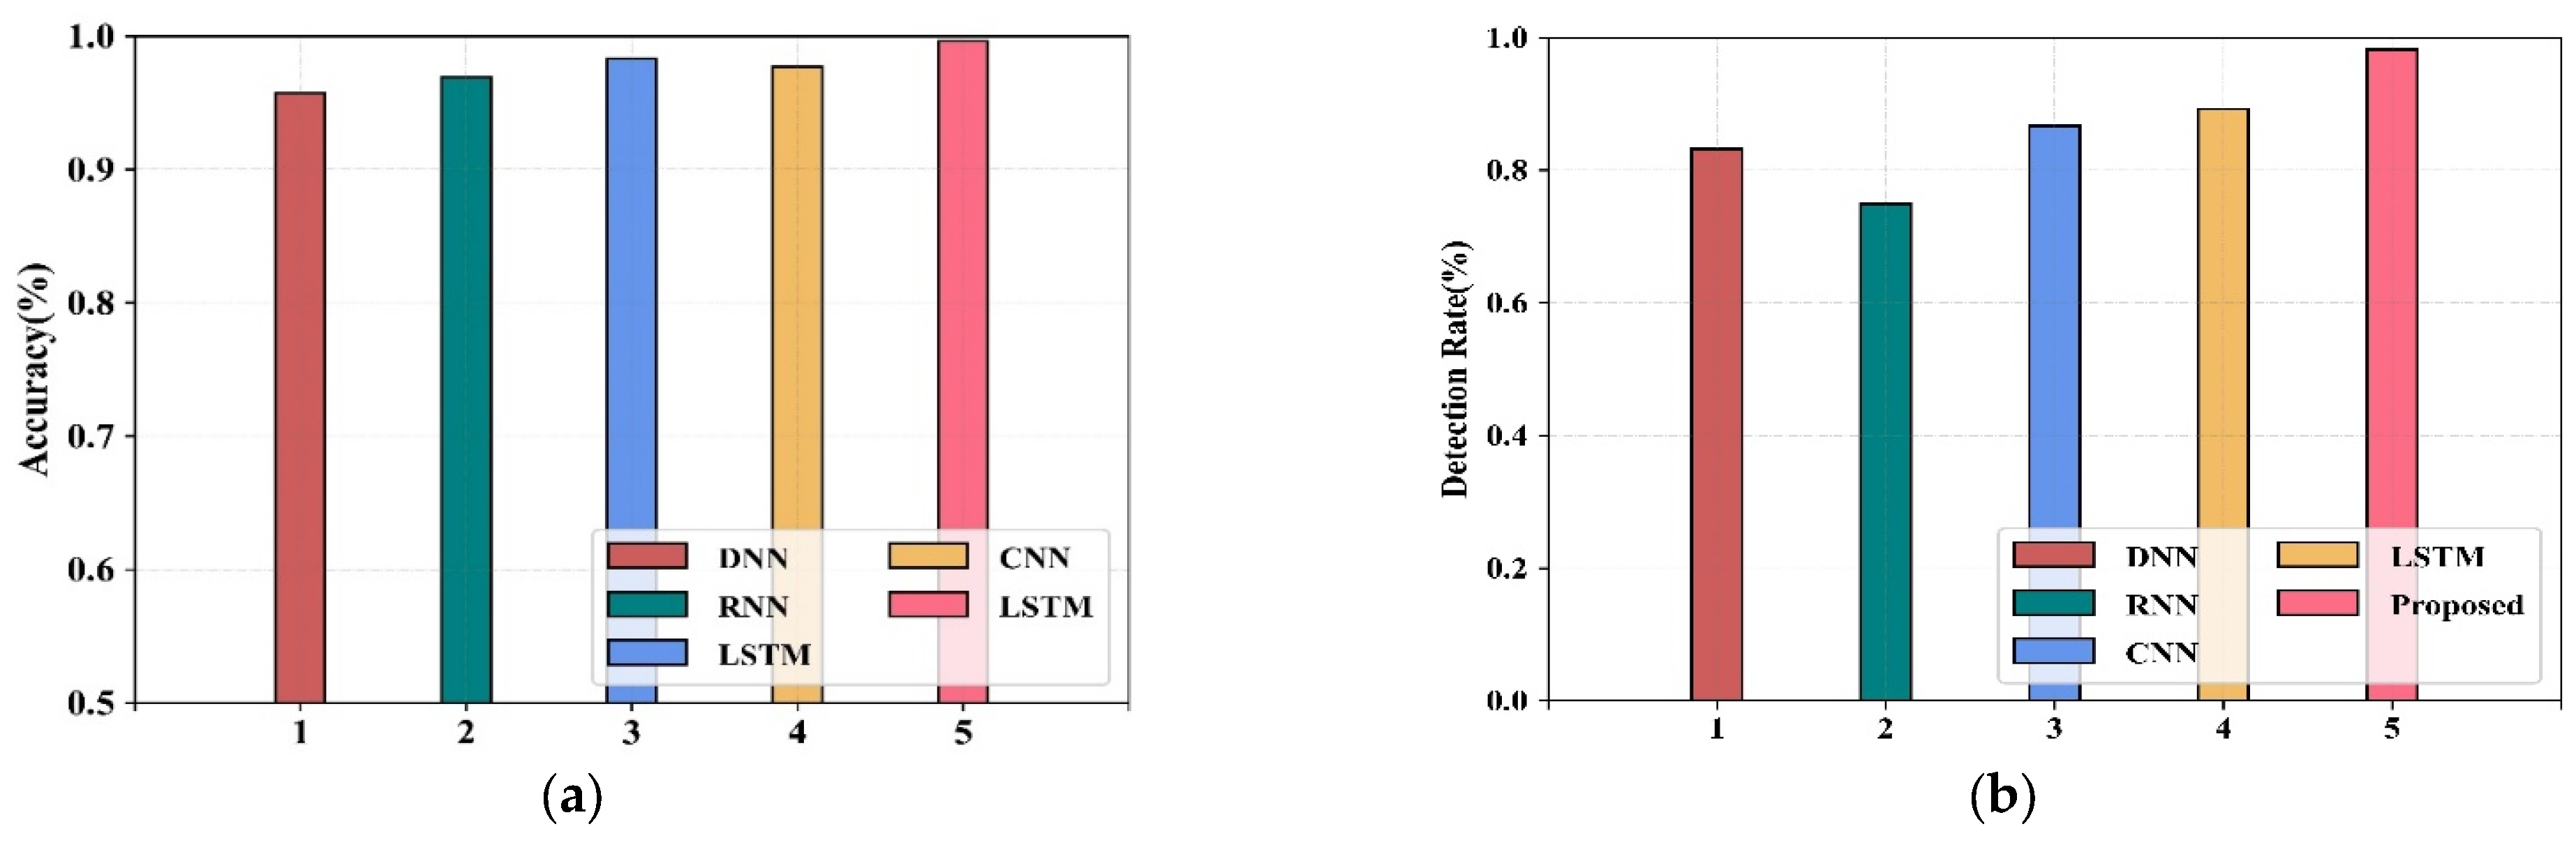
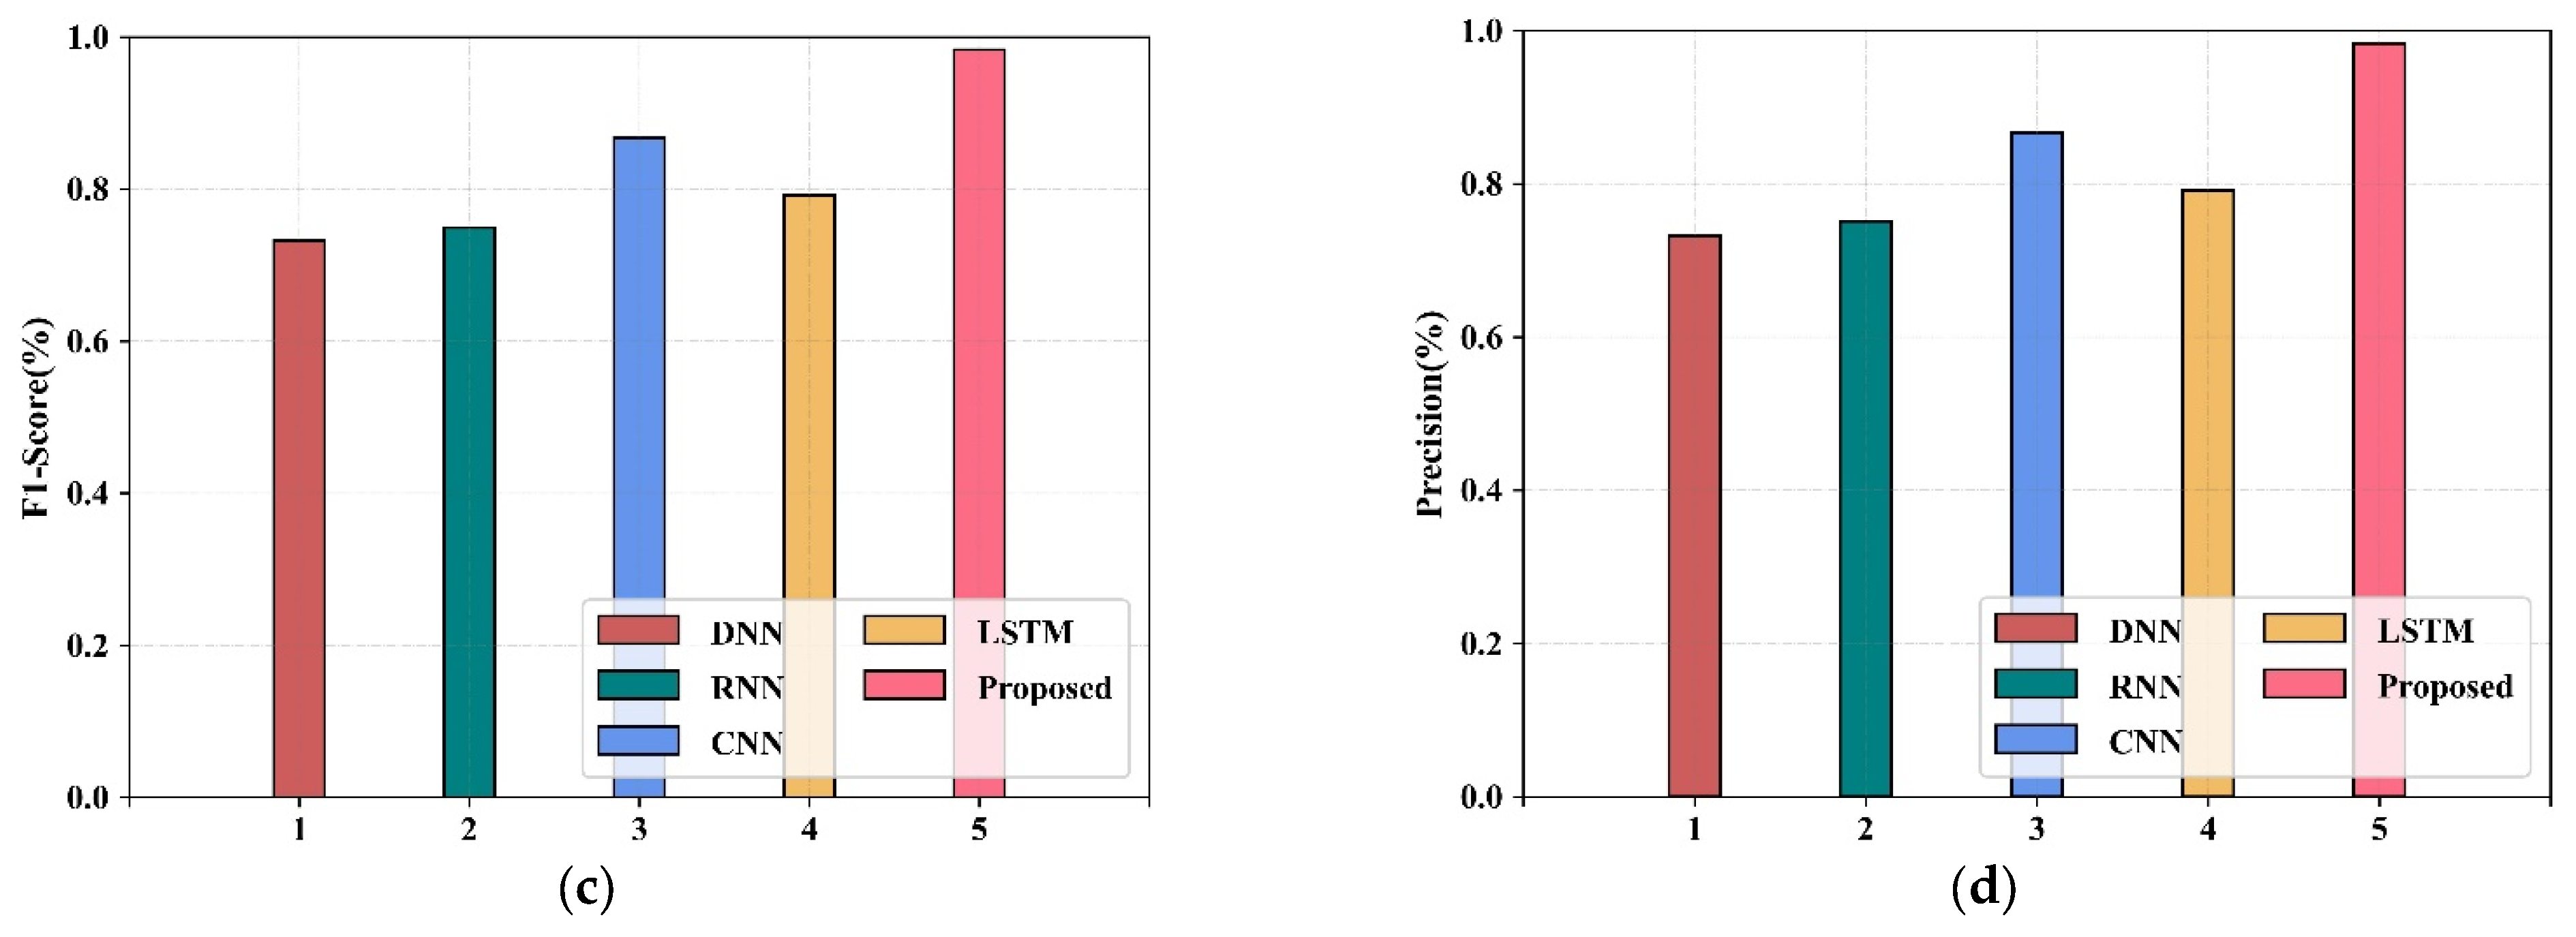
| Methods | F1-Score (%) | Recall (%) | Precision (%) |
|---|---|---|---|
| AGRU (Proposed) | 98.2 for IoT Botnet, 99.1 for ToN-IoT | 99.3 for IoT Botnet, 99.8 for ToN-IoT | 98.2 for IoT Botnet, 99.1 for ToN-IoT |
| Generative Adversarial Networks (GAN) | 94.82 | 95.55 | 92.37 |
| Auto Encoder (AE) | 72.38 | 75.26 | 69.48 |
| MAD-GAN | 87.54 | 89.23 | 85.41 |
| Tad-GAN | 93.48 | 94.13 | 91.08 |
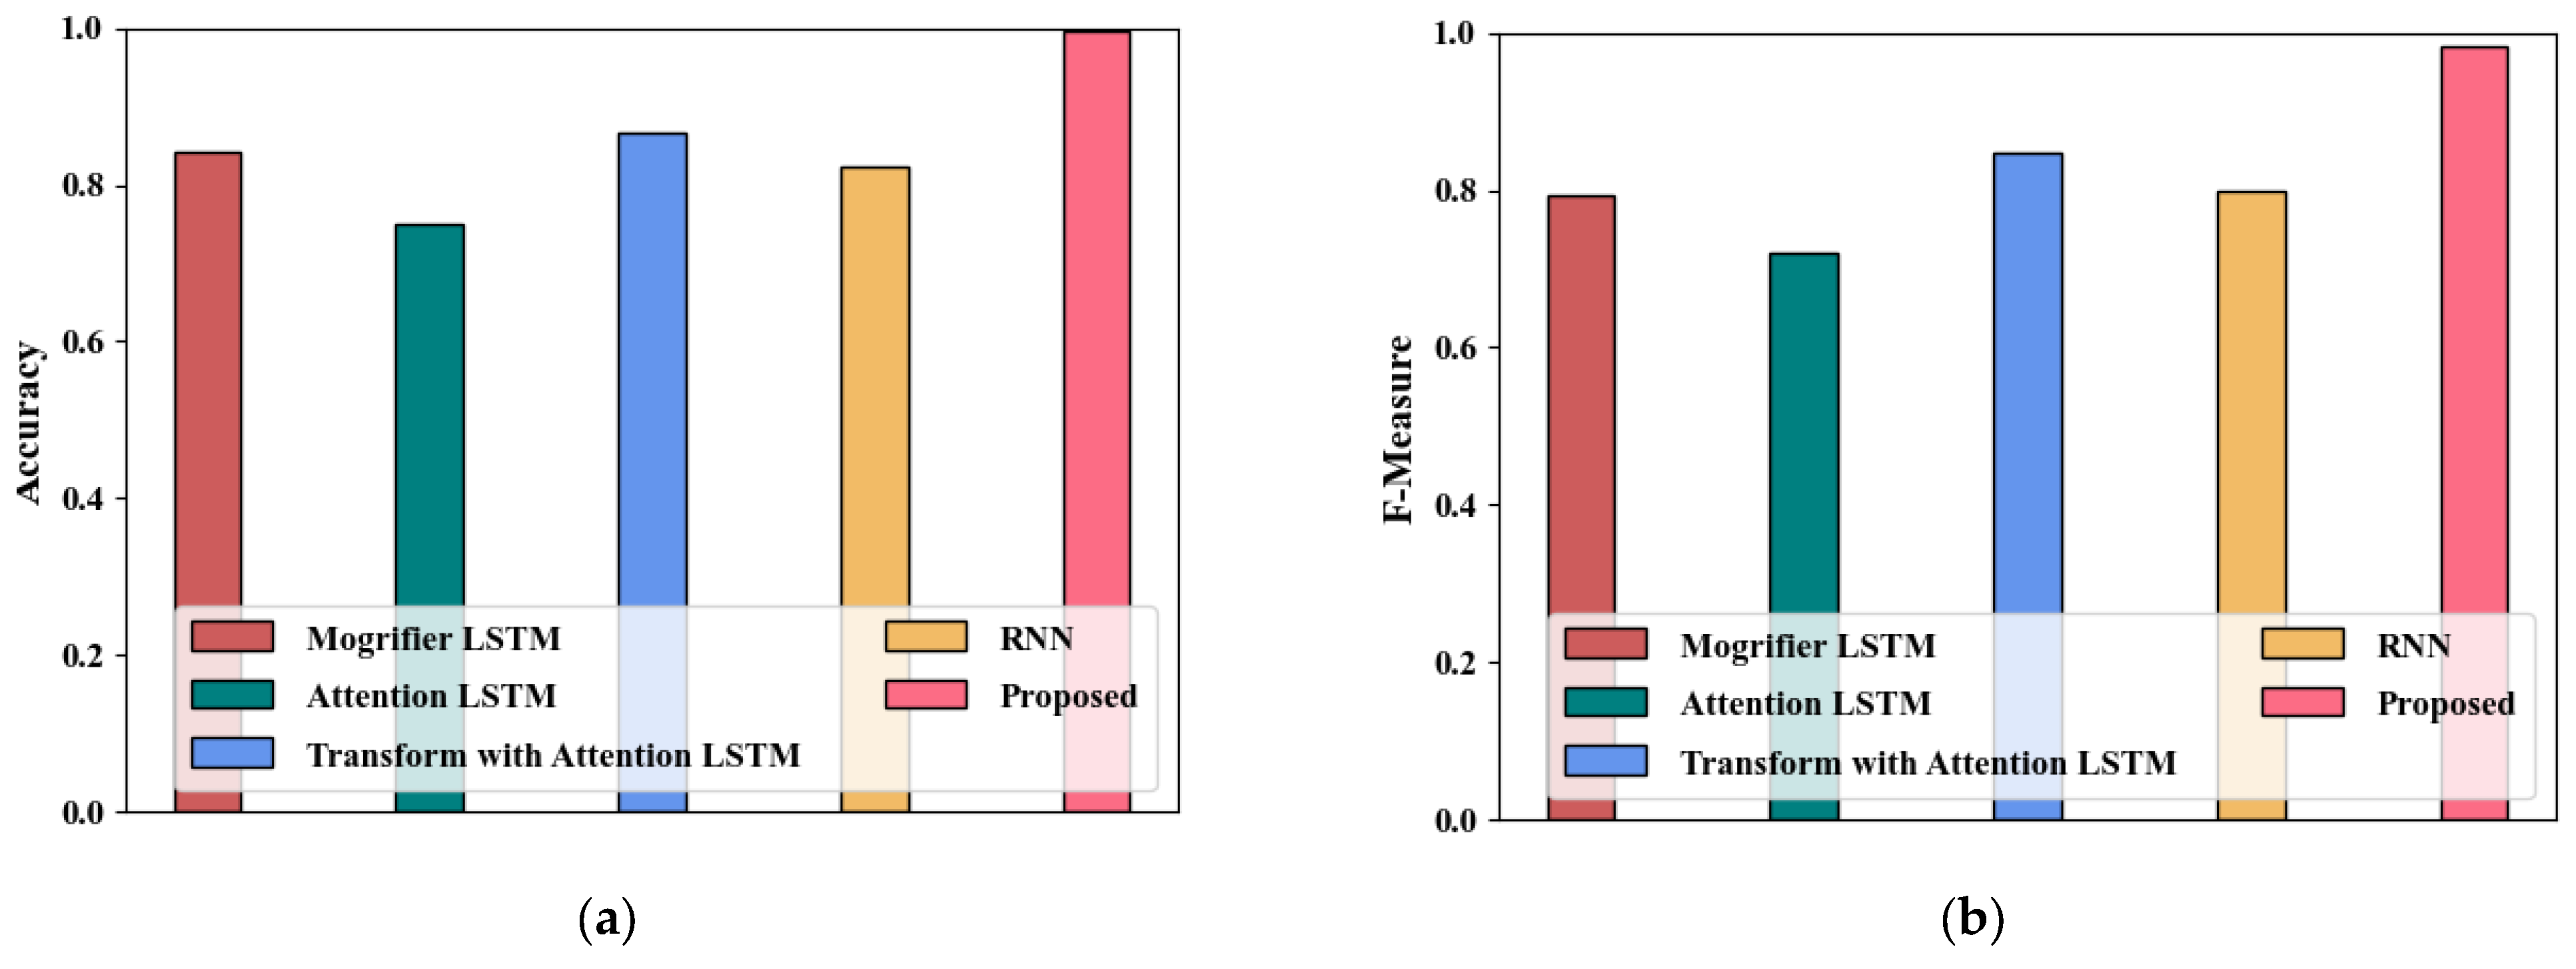
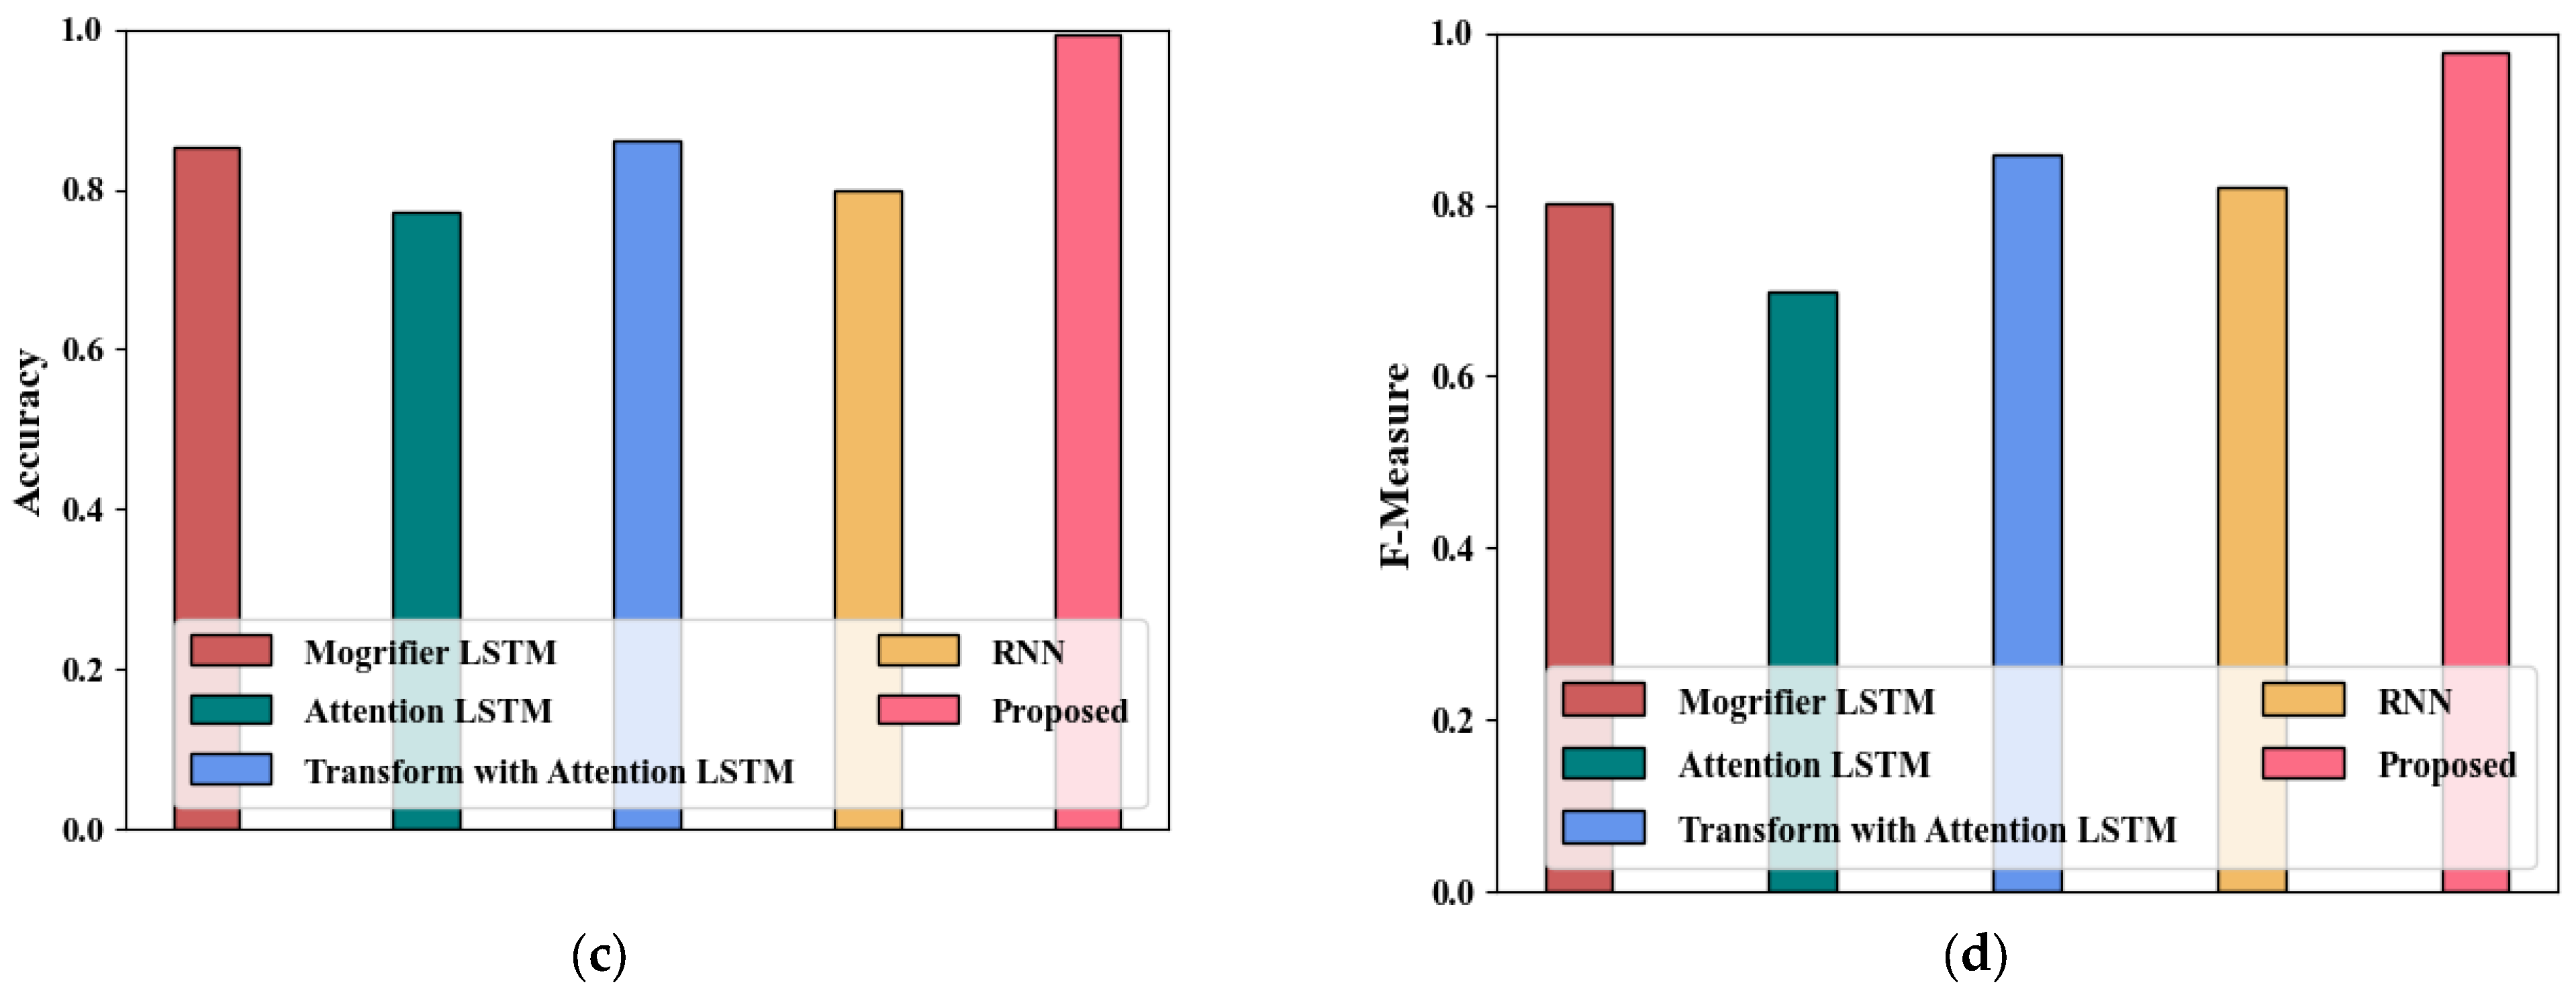
| Classification | Dataset-1 | Dataset-2 | ||
|---|---|---|---|---|
| Methods | Accuracy | F-Measure | Accuracy | F-Measure |
| Proposed | 0.996 | 0.983 | 0.993 | 0.977 |
| Mogrifier LSTM | 0.842 | 0.792 | 0.852 | 0.802 |
| Attention LSTM | 0.749 | 0.719 | 0.772 | 0.699 |
| Transform with attention LSTM | 0.867 | 0.847 | 0.861 | 0.857 |
| RNN | 0.822 | 0.8 | 0.8 | 0.82 |
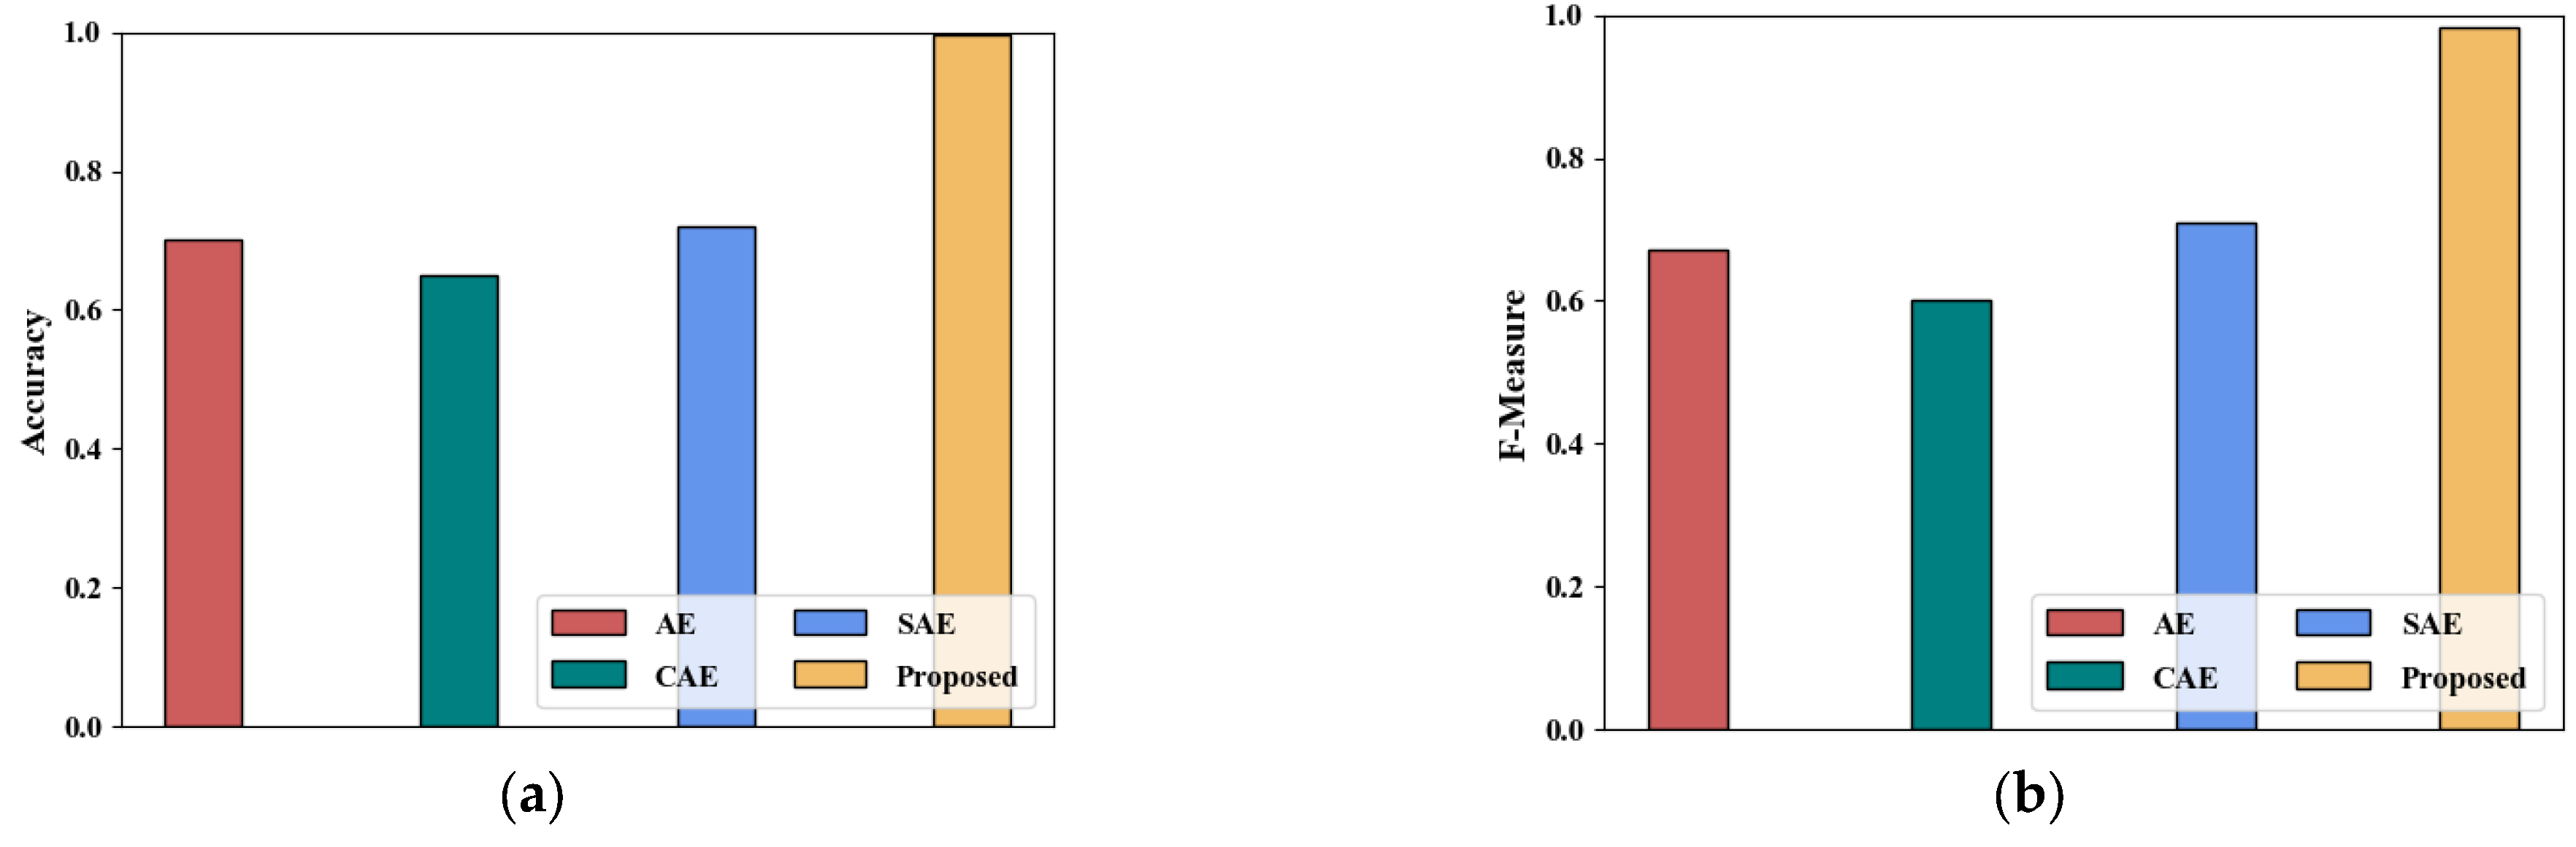
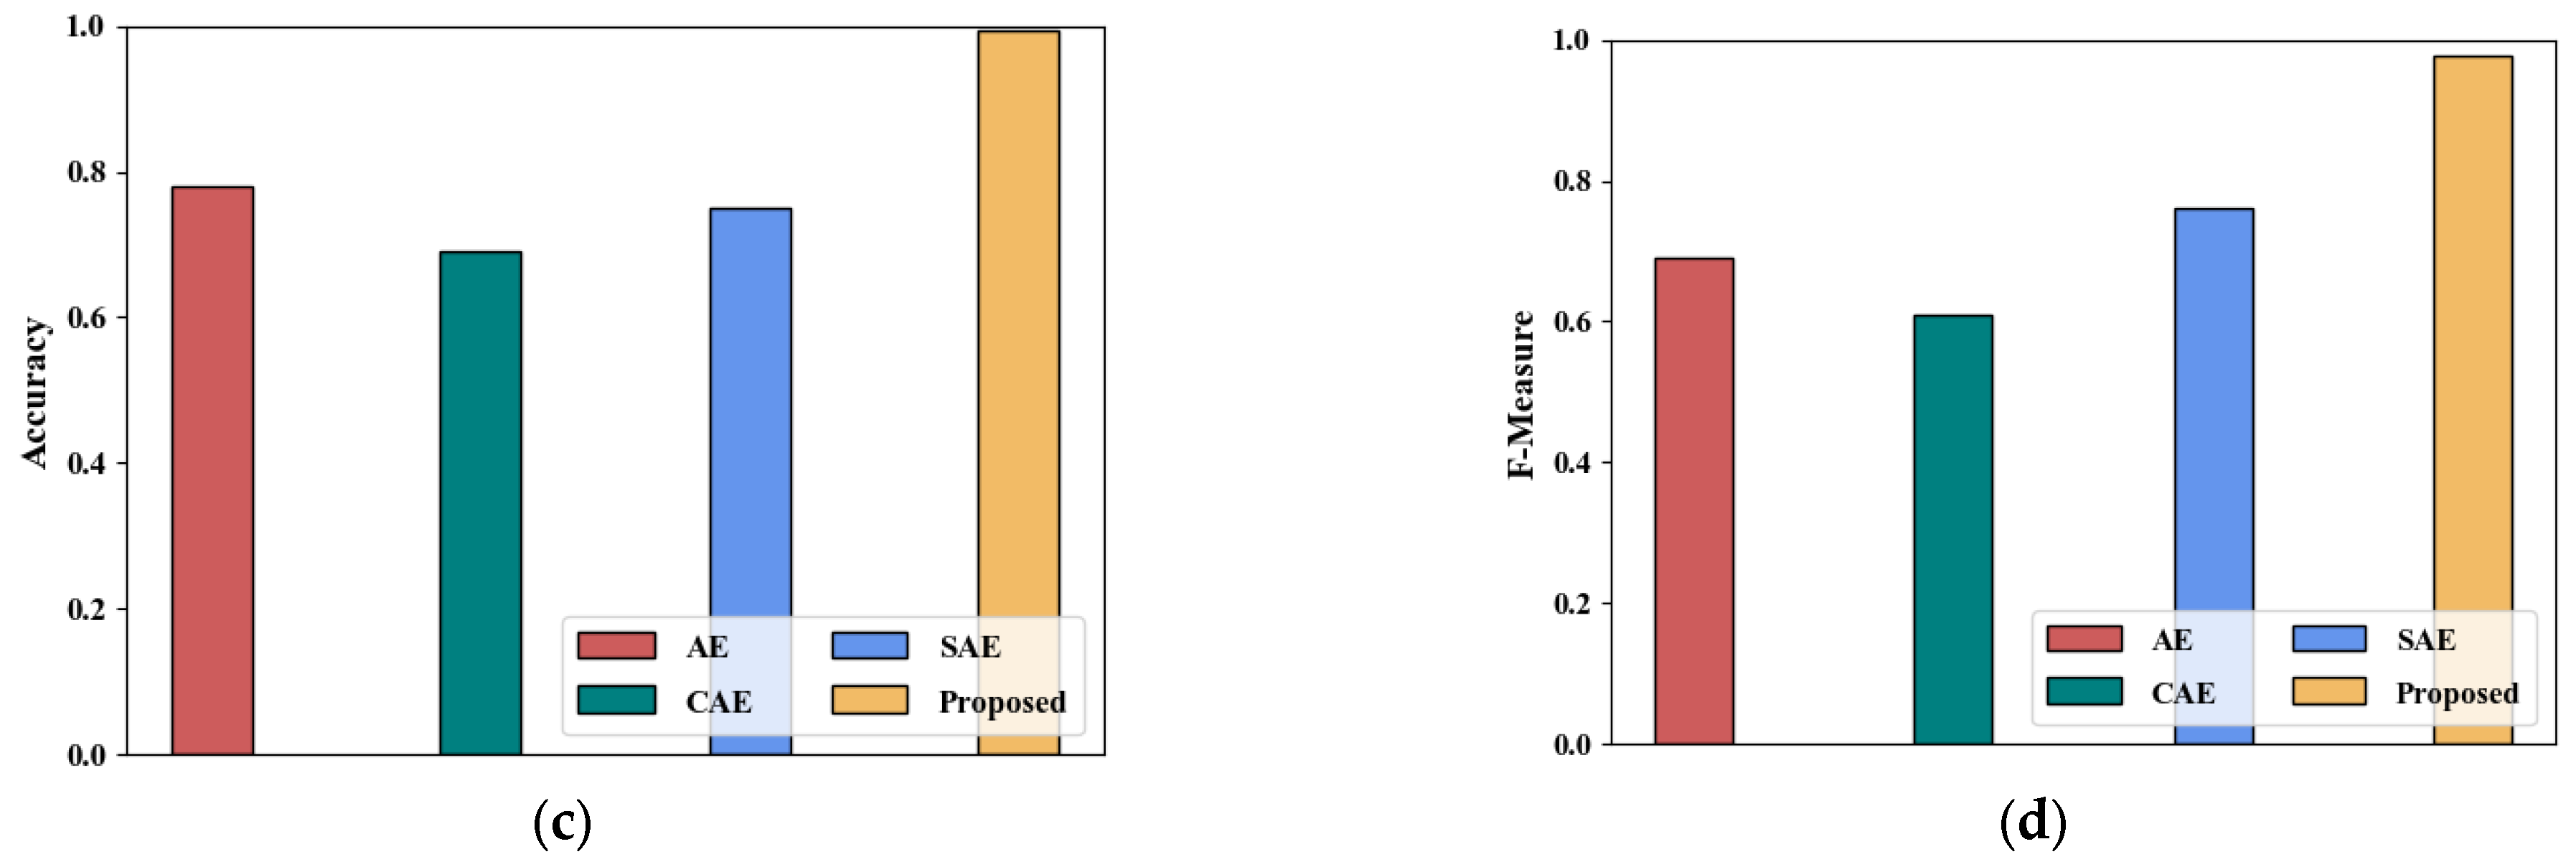
| Methods | Dataset 1 | Dataset 2 | ||
|---|---|---|---|---|
| Proposed | 0.996 | 0.983 | 0.993 | 0.977 |
| AE | 0.702 | 0.672 | 0.78 | 0.69 |
| CAE | 0.65 | 0.6 | 0.69 | 0.61 |
| SAE | 0.72 | 0.71 | 0.75 | 0.76 |
Disclaimer/Publisher’s Note: The statements, opinions and data contained in all publications are solely those of the individual author(s) and contributor(s) and not of MDPI and/or the editor(s). MDPI and/or the editor(s) disclaim responsibility for any injury to people or property resulting from any ideas, methods, instructions or products referred to in the content. |
© 2023 by the authors. Licensee MDPI, Basel, Switzerland. This article is an open access article distributed under the terms and conditions of the Creative Commons Attribution (CC BY) license (https://creativecommons.org/licenses/by/4.0/).
Share and Cite
Kethineni, K.; Gera, P. Iot-Based Privacy-Preserving Anomaly Detection Model for Smart Agriculture. Systems 2023, 11, 304. https://doi.org/10.3390/systems11060304
Kethineni K, Gera P. Iot-Based Privacy-Preserving Anomaly Detection Model for Smart Agriculture. Systems. 2023; 11(6):304. https://doi.org/10.3390/systems11060304
Chicago/Turabian StyleKethineni, Keerthi, and Pradeepini Gera. 2023. "Iot-Based Privacy-Preserving Anomaly Detection Model for Smart Agriculture" Systems 11, no. 6: 304. https://doi.org/10.3390/systems11060304