1. Introduction
In the 21st century, knowledge resources have emerged as a crucial driving force behind the development of the new normal economy [
1]. Within this context, venture capital’s role in promoting the growth of high-tech industries has garnered significant attention in economic development [
2]. Venture capital is an investment activity closely related to entrepreneurship, innovation, and technology that provides financing potential and challenges for the creation and development of entrepreneurial enterprises [
3]. The establishment of the American Research and Development Company in 1946 marked the beginning of the venture capital industry. This was followed by the development of the venture capital industry in France, Germany, Canada, the United Kingdom, and other countries. This wave of venture capital has had a global impact, making venture capital a crucial link between high-tech industries and capital markets.
While venture capital has experienced significant growth globally, the development of the venture capital industry in China has been a remarkable phenomenon. The venture capital industry in China began to develop gradually in the 1980s and gained increasing attention following the issuance of the “Proposals on Developing Risk Investment in China” in 1998. Supported by national policies, the venture capital industry in China has experienced rapid growth in both the number of cases and the total amount of venture capital. As a result, China has become the second largest venture capital market in the world, behind only the United States. As of 31 December 2020, there were a total of 27,089 registered venture capital institutions operating within China and investing in 86,860 cases. In 2021, China’s venture capital investment reached a new record of $130.6 billion, representing an increase of approximately 50% from the previous year.
China’s venture capital market boasts a significant scale and experiences intense competition. Nevertheless, venture capital investments are characterized by information asymmetry and a high degree of uncertainty. As a result, joint venture capital strategies have become a popular choice among venture capital institutions. Joint venture capital, also known as venture capital syndication, refers to the behavior of multiple venture capital institutions investing in the same company in the same round of financing. It is an important investment form of venture capital [
4]. This typically occurs in cases where there are uncertain risks associated with the investment opportunity. Joint venture capital can actively control investment risk and make up for the deficiencies of individual venture capital in terms of fund scale and value-added services [
5,
6]. This type of venture capital is becoming increasingly important in China, with data from the Qingke Group Private Equity Database showing that joint investment events made up 70.62% of the total 9284 venture capital events in the country in 2020. Joint venture capital, as a key strategy of venture capital, has become a driving force in the marketization of scientific research results and the industrialization of high-tech industries in China. By expanding the social networks between enterprises, joint venture capital allows for more investment opportunities. When firms form a joint venture capital alliance, a network effect emerges among venture capital and a joint venture capital network begins to form [
7,
8]. As China undergoes economic transformation, upgrading, and the deep development of innovation, entrepreneurship, and creation, researching joint venture capital networks is important for mitigating investment risk and supporting economic growth.
As the venture capital industry has grown, joint venture capital has received increasing attention from scholars both within and outside of China. Researchers have investigated the origins, functions, and factors that influence joint venture capital networks. For instance, Antonio studies the evolution of employee growth before and after joint venture capital and finds that joint venture capital activities are important signals about enterprise quality [
1]. Bygrave was the first to apply social network analysis to joint venture capital, suggesting that the number of venture capital networks may be determined by the level of uncertainty associated with investments [
9]. Joint venture capital is a significant indicator of a company’s quality. And venture capital firms can use it to strengthen relationships with other enterprises and participate in more projects when resources are limited [
10,
11,
12,
13]. It can provide value-added services, improve investment performance, and form social networks based on trust and mutual benefit [
14,
15]. The network positions and roles of companies within the joint venture capital network can also affect investment efficiency. Different network locations and roles of enterprises have different impacts on investment efficiency [
16,
17,
18]. Companies in more favorable network positions tend to have higher-quality joint venture capital [
19]. Factors such as the heterogeneity of joint venture capital, the reputation of joint partners, and the roles of network members can significantly influence network position [
20,
21]. The degree of cohesion in cooperation relationships between companies can also affect the occurrence of joint venture capital “huddling” [
22,
23]. In terms of the evolution of the joint venture capital network, Bruce analyzed the data of joint venture capital cases in the United States in the past 159 years, analyzed the law of network evolution, and found that venture capital companies are more inclined to follow conservative rules and make joint investments with known partners [
24]. Zhao used IPO data sets to explain the evolution of the venture capital industry related to institutional and cultural backgrounds, with activities highly concentrated in cities such as Beijing, Shanghai, and Shenzhen [
25]. In terms of the evolution of joint venture capital networks, changes in these networks have a positive impact on the efficiency of IPO exits and internal returns [
26,
27]. The ability of institutions to transfer information within the network tends to remain relatively stable over time. Institutions with lower network positions within the network are more likely to form joint investments with original partners as their network position rises [
28,
29].
Overall, the research on joint venture capital is comprehensive, but there is still room for expansion. Most studies have primarily conducted static analyses from a single perspective, which has resulted in a limited exploration of the dynamic evolution trends of joint venture capital networks. The processes of network structure evolution and trend analysis of joint venture capital have received inadequate attention. Additionally, there has been a scarcity of studies examining the robustness of these networks, analyzing the impact of node exits, and considering the influence of different crises and events on joint venture capital behavior. Furthermore, the majority of research on joint venture capital networks has been focused on foreign developed economies, such as the United States and the United Kingdom [
30], neglecting the unique circumstances surrounding joint venture capital development in China’s emerging economy. In developed economies such as the United States, most venture capital markets benefit from a robust financial system and a well-established venture capital ecosystem. It is crucial to acknowledge that the development of joint venture capital networks in China cannot rely solely on foreign experiences, as the Chinese market is still evolving and may lack certain experiences commonly found in more mature markets [
31]. Therefore, this paper takes all joint venture capital cases of listed companies in China from 2011 to 2020 as its research object. We use social network analysis methods and complex network theory to construct a joint venture capital network, measure and decompose it, depict the structural attributes of internal enterprises from a dynamic perspective, explore the evolution trend of joint venture capital associations, and investigate the robustness of joint venture capital cooperation. This will provide better decision support for network participants, optimize venture capital performance, and promote the healthy development of multi-level markets.
2. Data and Methodology
2.1. Data Sources
To construct the joint venture capital network in China, we adopt a narrow definition of joint venture capital, where a connection is established between two companies if they are both invested by the same two venture capital institutions in the same investment round. The extent of a company’s involvement in joint venture capital activities determines the closeness of its connections with other companies and its centrality within the network. However, due to the lag in joint venture capital activities, we rely on data spanning 2011 to 2020, encompassing all 3510 rounds of joint venture capital cases among listed companies. This enables us to comprehensively and systematically reflect the structural characteristics of the joint venture capital network and effectively analyze its evolutionary trends. The base data for our research is sourced from the Qingke Group Private Equity Database, with the exclusion of single venture capital events and incomplete data. We also exclude joint venture capital events for listed companies not included in the database. In this network, listed companies serve as nodes, and company-to-company joint venture capital relationships are represented as edges. Since the connection between two venture capital institutions does not have a defined sender or receiver, the joint venture capital network is an undirected network.
The contribution of our study mainly lies in the following aspects: The first is to optimize the venture capital environment. This paper studies the network attributes of joint venture capital from a dynamic perspective, identifies the dynamic evolution characteristics of communities, and provides a feasible path for optimizing China’s venture capital environment and realizing the complementary advantages of resource sharing. The second is to improve the robustness of venture capital cooperation. We analyze the robustness of the joint venture capital network from the perspective of network structure dynamics, test the vulnerability of the network, introduce two different attack types of random attacks and deliberate attacks to measure the ability of the whole network to resist risks, realize community optimization, and provide strong support for improving the resilience of joint venture capital cooperation among enterprises.
2.2. Methodology
As an interdisciplinary analytical method, complex networks have gained widespread usage in various fields, including physics, transportation, and economics. The topological structure of a network can be illuminated through the application of complex network analysis, allowing for the examination of structural characteristics at both an individual and overall level of analysis for joint venture capital networks. Community structure is a crucial attribute of complex networks, as it can be utilized to identify joint venture capital partnerships and detect network clusters. Therefore, this paper employs complex network theory to construct a joint venture capital network, whereby the structural attributes of enterprises within the network are analyzed using network indicators. Furthermore, the dynamic evolution process of network communities is also examined. Additionally, to investigate the cooperative resilience of joint venture capital, two different attack strategies, namely random attack and deliberate attack, are introduced via the robustness index of the network.
2.2.1. Network Attribute Analysis
Centrality is a commonly used metric for describing the structural properties of a network. Network centrality measures the prominence of a node’s relationships within the whole network. The more central a node is, the more frequently it communicates with other nodes, which can affect the evolution of the network. Network centrality is typically measured in terms of degree centrality, closeness centrality, and betweenness centrality. We use Freeman’s definition of centrality to measure the changes in the network positions of listed companies in the joint venture capital network from three different angles [
32].
Degree centrality: degree centrality reflects the degree of connection of an individual company with other companies in the joint venture capital network, with a higher value indicating a greater level of power in the network. The degree centrality of node i, n is the number of network nodes, and the number of edges between node
i and node
j.
Di is defined as
Closeness Centrality: it characterizes a company’s ability to be “uncontrolled by other nodes” in the process of joint venture capital, and the higher the closeness centrality of the company, the stronger the correlation with other companies. The closeness centrality of node
i, where is the shortest path between nodes.
Ci is defined as
Betweenness Centrality: it can play a “bridge” and “intermediary” role, and can reflect the control ability of the company for the entire joint investment network. The betweenness centrality of node
i, represents the number of nodes
i in the shortest path from
s to
t.
Bi is defined as
2.2.2. Community Partition
Other than that, the level of correlation among nodes in a joint venture capital network can be assessed using cohesion and prominence measures, such as network density and average clustering coefficient. Additionally, the network is typically composed of multiple communities with particularly strong links, where the internal connections are relatively dense and the connections between communities are sparse. The differences between these communities can reveal the preferences of internal enterprises in joint investment behavior. Furthermore, investigating the robustness of the joint venture capital network can enhance the quality of venture capital investment decisions and reduce the risk of joint investment, thereby enabling better opportunities for investment and providing a stable driving force for the economic growth of joint venture capital.
Density: the density of the joint venture capital network can be used to reflect the intensity of the connections between the nodes in the network. A higher value of density indicates that the connections between the nodes are closer [
33]. Suppose
L is the actual number of relations,
n is the number of nodes,
D is defined as
Average Clustering Coefficient: the clustering of companies can be represented by the clustering coefficient, and the average clustering coefficient of all nodes in the network measures the convergence of the entire joint venture capital network [
34]. The larger the clustering coefficient is, the higher the degree of aggregation between venture capital institutions in the network, and the stronger the cohesion of the network. The average clustering coefficient assumes that
C represents the actual number of edges, which is the number of nodes in the network,
CCu is defined as
Community detection: in the joint venture capital network, groups of closely connected members are commonly referred to as “communities.” The strength of connections within and between communities can be assessed through the use of modularity measures. A larger modularity
Q value indicates a more clearly defined community structure and higher accuracy in dividing the network into distinct communities [
35]. Suppose that
k is the node degree and m is the number of all edges in the joint venture capital network. When two nodes belong to the same community, there is. The modularity of each community is defined as
2.2.3. Network Resilience Analysis
Network robustness, also known as invulnerability, is a measure of the transmission efficiency and resilience of a joint venture capital network when it undergoes an attack [
36]. The attack methods used to test network robustness include random and deliberate attacks, which simulate the withdrawal of certain enterprises from the joint venture capital network and evaluate the overall resilience and robustness of the network [
37]. Network efficiency is a commonly used measure of connectivity that evaluates the connectivity and utility of the joint venture capital network from a global perspective after an attack. When a small number of nodes fail but the overall efficiency does not change significantly, this suggests that the network has high connectivity and strong invulnerability. The smaller the efficiency value and the higher the degree of enterprise isolation, the worse the network connectivity. When the efficiency is 0, it shows that any two enterprises in the network are isolated, and the network connectivity is the worst. The calculation formula is:
At the same time, in order to further analyze the robustness of the joint venture capital network and explore the cooperation resilience between enterprises, two indicators, the relative largest cluster size and the average isolated cluster size, are selected to attack the enterprises and links in the network, and simulate the impact of enterprises’ withdrawal from joint venture capital on the network [
38]. Let the ratio of the number of enterprise nodes in the largest subgroup to the total number of nodes in the network be the relative largest cluster size
S,
| Gk,o | denote the number of nodes contained in the subgroup. The formula is:
When both the network nodes and the associated edges are removed, the joint venture capital network will be split into many different subgroups. The average size of the isolated clusters represents the average number of nodes contained in the isolated clusters after removing the largest subgroup. Let
<s> be the average size of the isolated subgroups, and
M represents the number of subgroups after the network is split, and its calculation formula is:
3. Results
3.1. Whole Network Structure
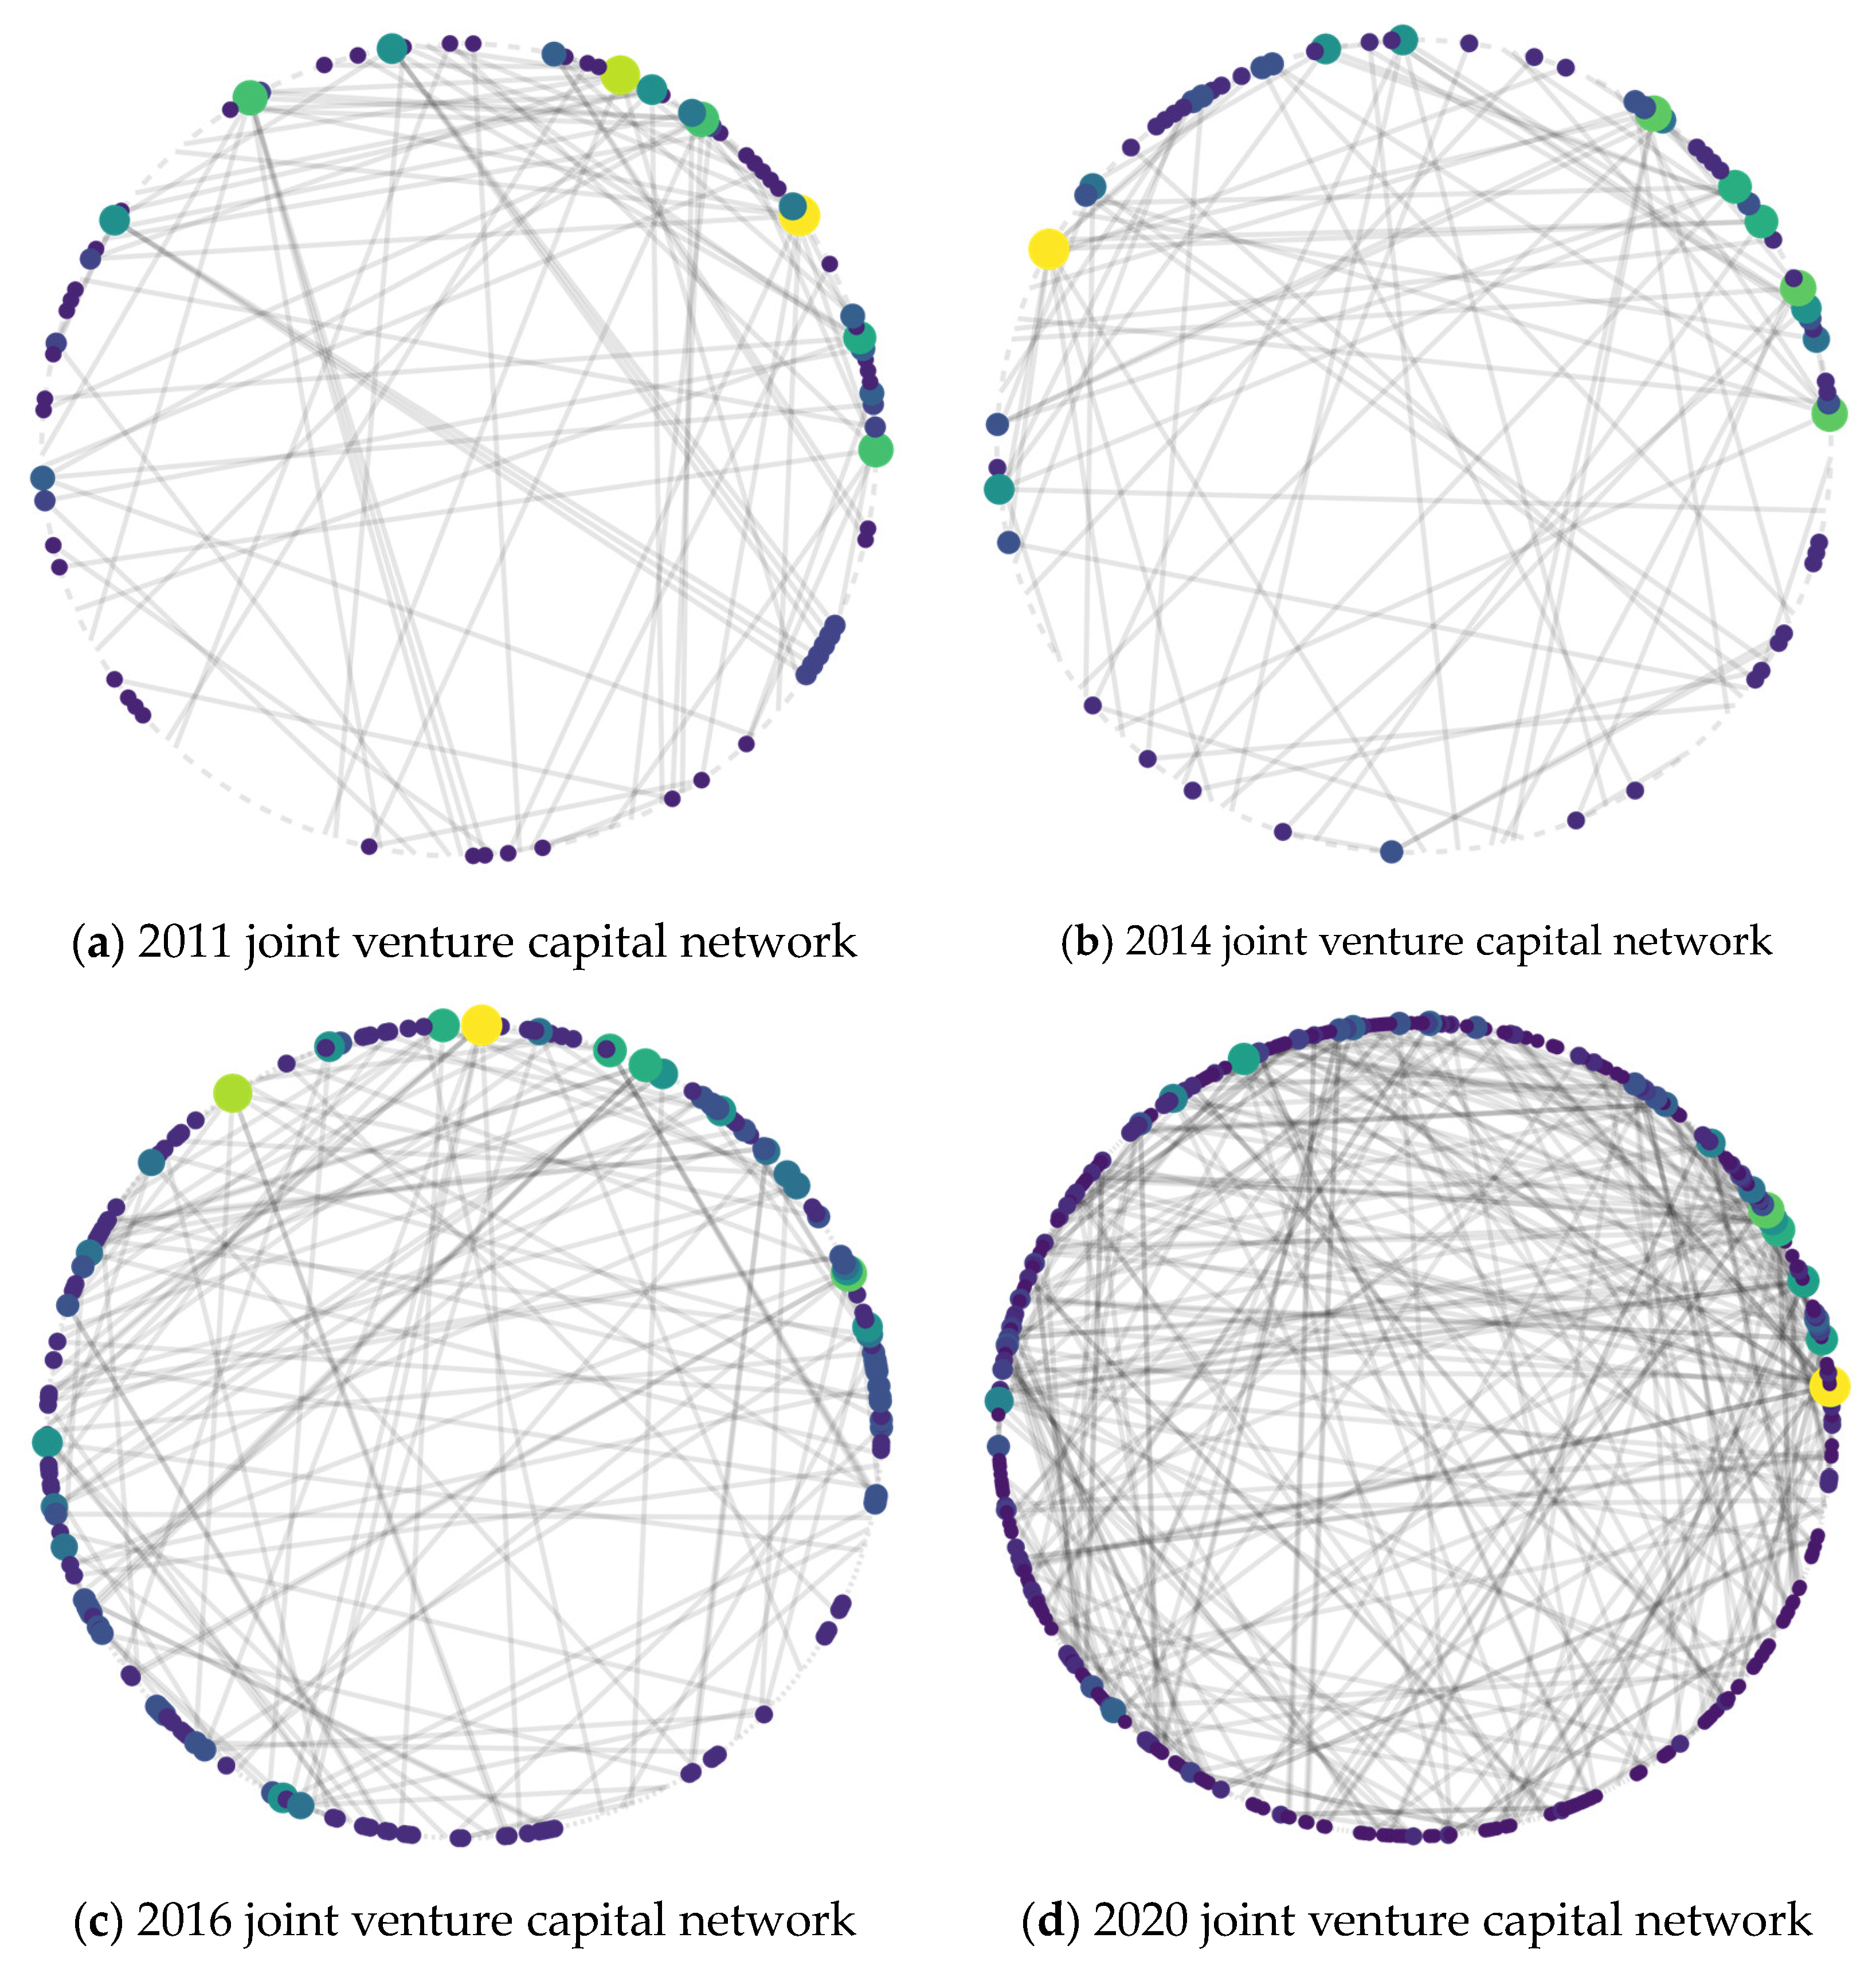
Based on the network construction model, we establish a spatial association network for the development of joint venture capital in China. We then utilize this model to generate spatial association network diagrams for the years 2011, 2014, 2016, and 2020. These diagrams are useful for visually tracking the dynamic trend of the network’s development over time. In
Figure 1, the size of the nodes in the network corresponds to the degree level of each node, while the density of the connecting lines indicates the frequency of joint venture capital behavior. This approach allows us to gain a better understanding of the structure and behavior of the joint venture capital network in China and to identify patterns and trends that may have important implications for investment decision-making and risk management.
From an analysis of the overall development trend of the joint venture capital network across different periods, it is evident that the number of joint venture capital entities in China has steadily increased from 2011 to 2020. Furthermore, the core position of the network has gradually expanded outward, and joint venture capital activity has significantly increased. In the joint venture capital network, entities of varying sizes and resource endowments occupy different positions. Enterprises with lower network positions tend to have weaker information acquisition capabilities. Conversely, enterprises with higher node degrees possess greater access to information as their network positions improve, enabling them to exercise more autonomy in investment decisions and achieve higher network value.
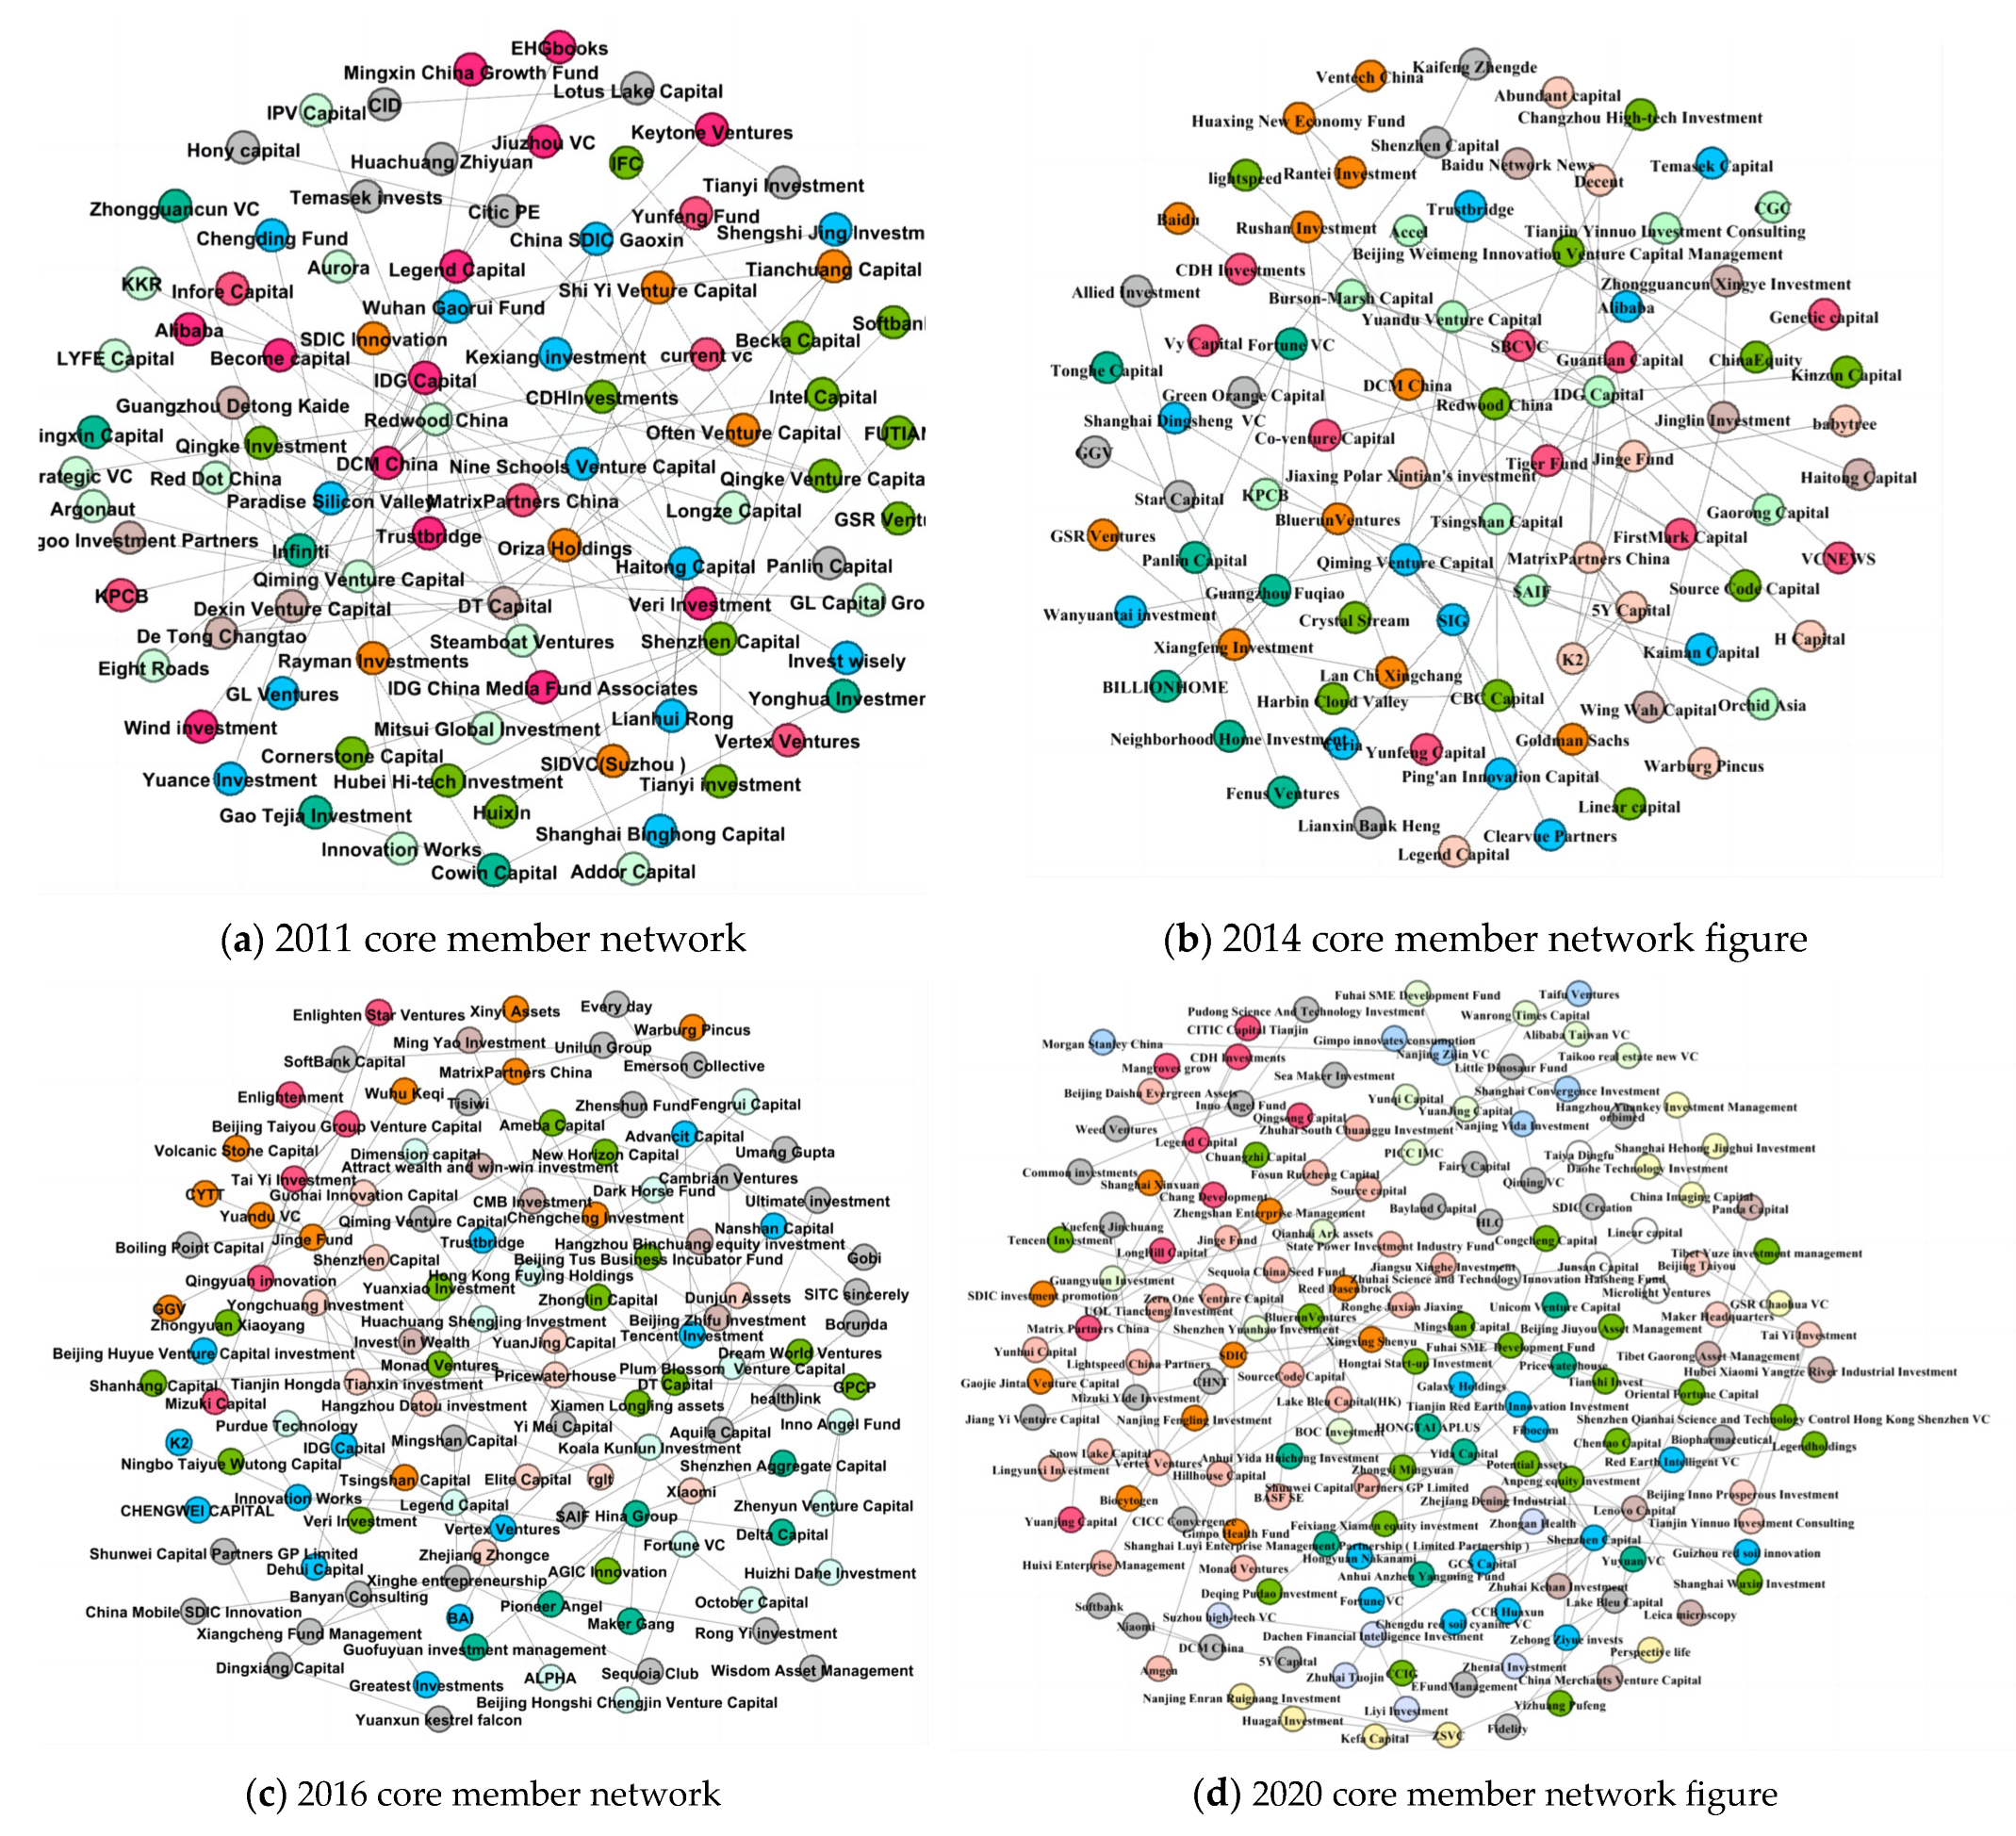
To clearly show the number of network nodes and improve research intuitiveness, this study extracts node members from the core position of the network for the years 2011, 2014, 2016, and 2020. We used the Gephi to visualize the subgraph and explore the dynamic evolution trend of the core members. As shown in
Figure 2, the edges of the members at the core of the network are denser, and the nodes are larger. Shenzhen Capital, Source Code Capital, Vision plus Capital, Hillhouse Capital, Lake Bleu Capital, China Investment Corporation, Orient Fortune, Legend Capital, and Jinge Fund tend to consistently maintain their core positions in the joint venture capital network, influencing the investment behavior of other members and playing an important leading role in the development of the industry. Some enterprises, such as Matrix Partners China, E Fund, Qiming Venture Capital, and Yield Capital, saw a decline in their core degree in the network in 2020 and had a lower frequency of joint venture capital behavior with other enterprises that year, but still maintained a core position in the network. The network position core degree of some enterprises, such as DT Capital, 5Y Capital, Addor Capital, and Lenovo Capital, has significantly increased, and they have entered the core position of the network.
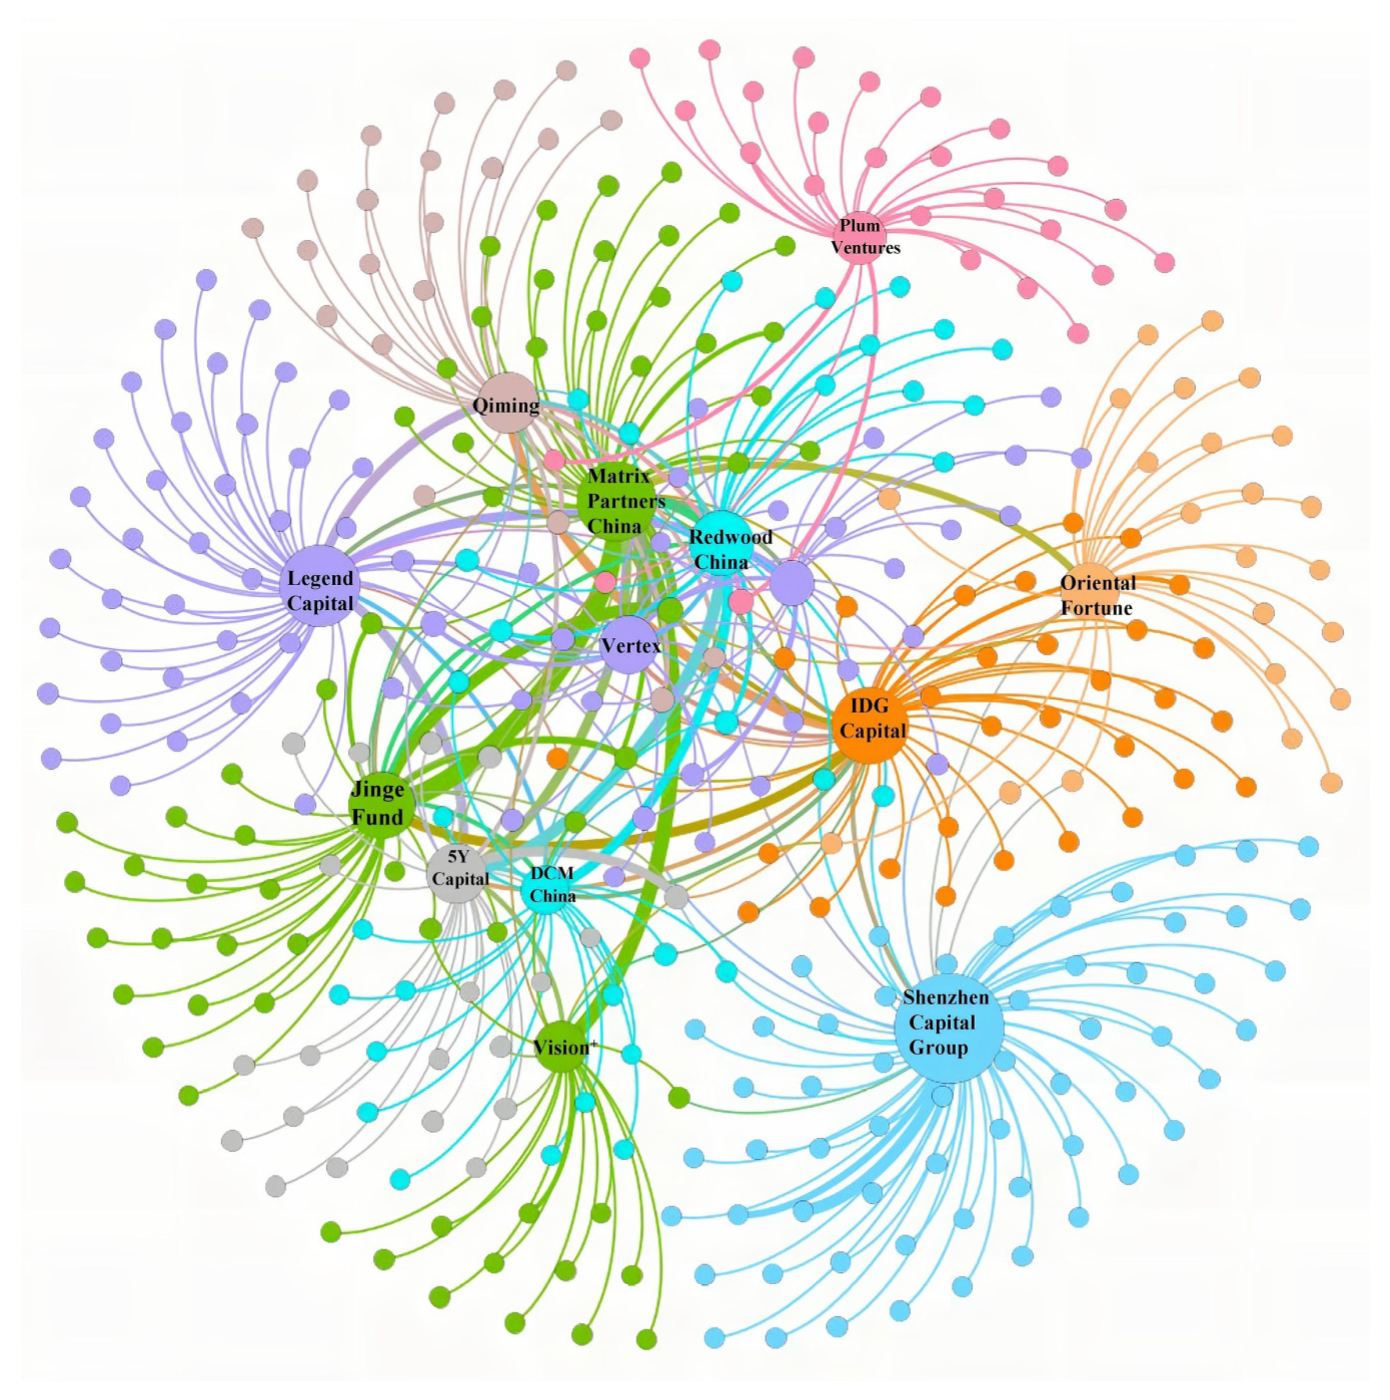
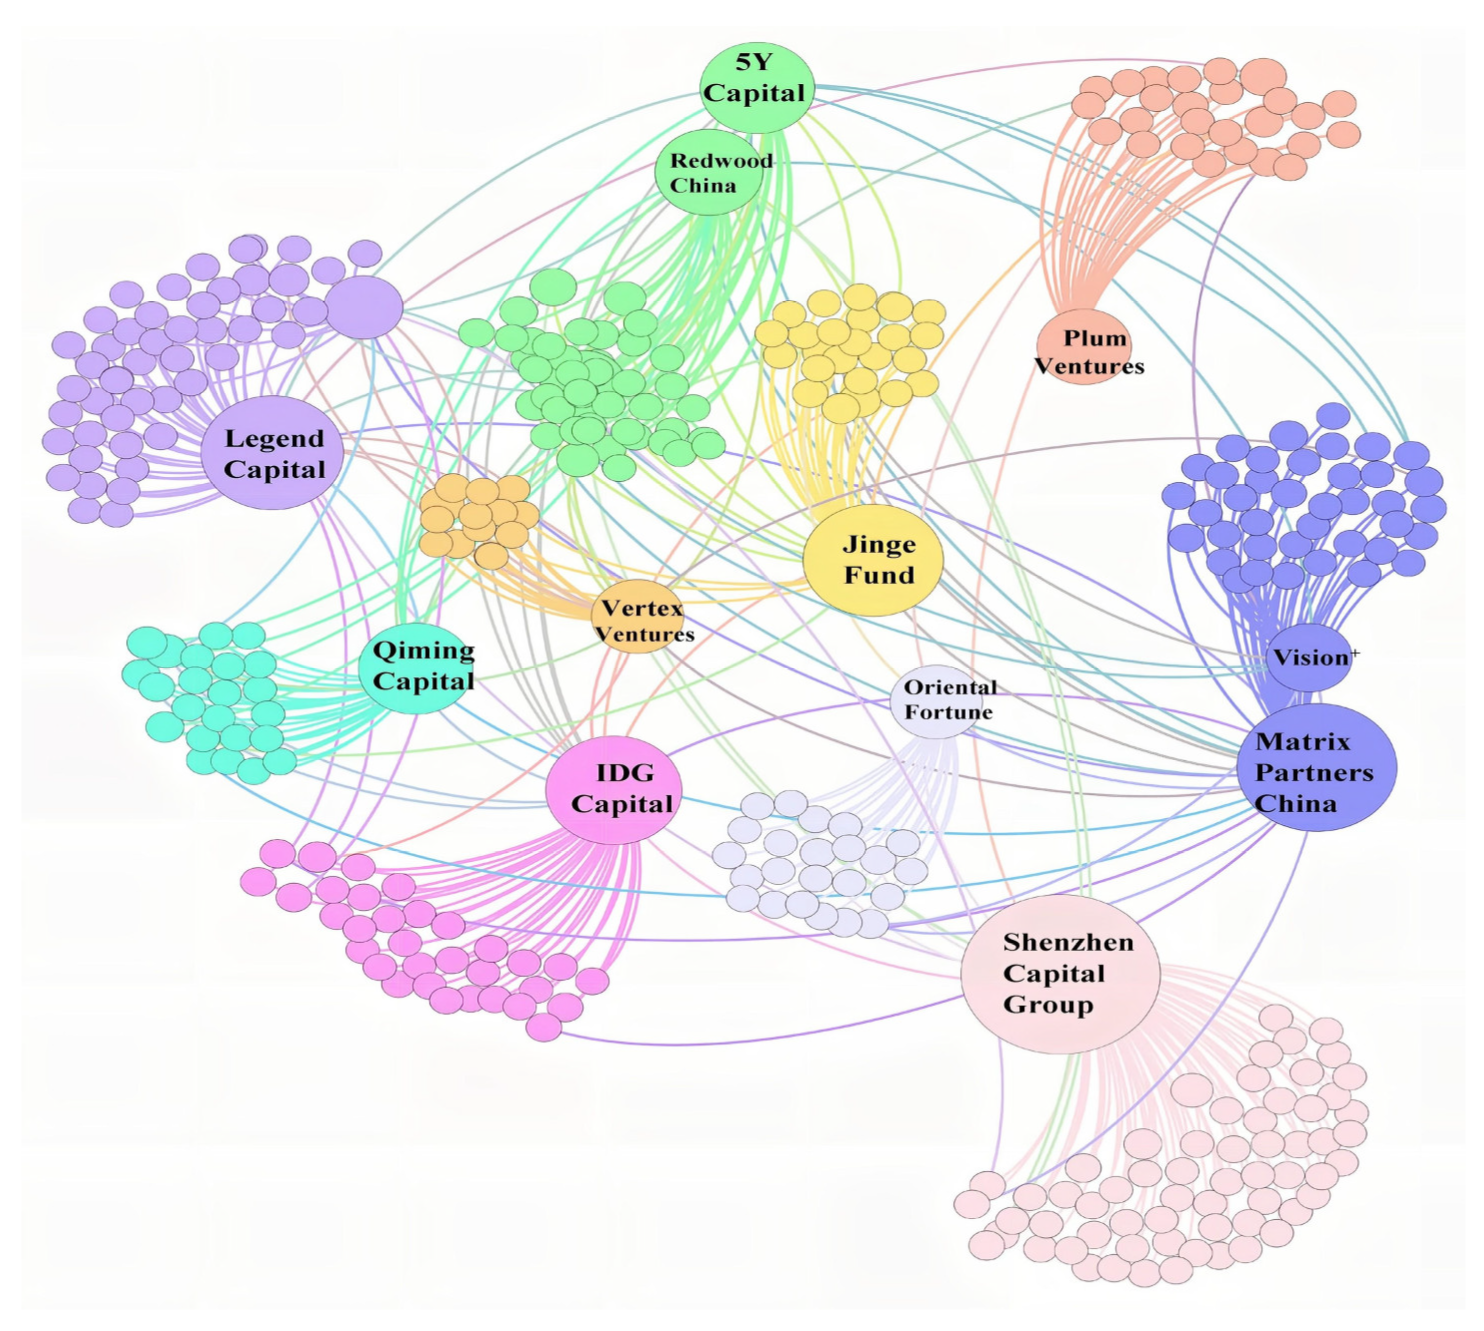
During the period from 2011 to 2020, there were some cases where network members with core positions had less joint venture capital in a certain year. In order to explore the status of core members in the overall joint venture capital network from 2011 to 2020 more clearly, this paper extracts all joint venture capital events that occurred at the core nodes of the network from 2011 to 2020 and draws the overall network structure diagram. As shown in
Figure 3, it can be found that Shenzhen Capital, Legend Capital, IDG Capital, Orient Fortune, Jinge Fund, DCM China, Vertex Ventures, MatrixPartners China, and Qiming Venture Capital have the highest core degree in the network, have the most connections with other members in the network, have high network power, and are the most important joint venture risk investors in the network.
Figure 3.
Overall network of core members from 2011 to 2020.
Figure 3.
Overall network of core members from 2011 to 2020.
3.2. Network Relationship Attributes
Centrality measures the extent to which enterprises perform at the center of the joint venture capital network. A higher level of centrality indicates that enterprises possess stronger capabilities and greater opportunities to access significant external information and resources, thereby exerting greater influence within the industry. In the calculation of centrality, different centrality indices have different focuses and should not be measured in a single aspect. Considering that the number of network nodes is too large, this paper uses the average, standard deviation, and maximum of the above three types of centrality indices as a comprehensive index for analysis.
As shown in
Table 1, from the analysis of the network centrality, it can be seen that the centrality indices of all enterprises have obvious fluctuations between 2011 and 2020, with a weaker degree of spatial association. In 2011, all centrality indices were at relatively good levels, indicating a close connection between enterprises that engaged in joint venture capital behaviors in that year. In terms of degree centrality, the mean value was at a high level between 2011 and 2014 and showed a declining trend from 2015 to 2020. This indicates that the enterprises had close connections with other enterprises during this period, but as the number of joint venture capital events steadily increased, the network power among members began to disperse. In comparison to degree centrality, the mean value of betweenness centrality showed significant differences, reaching a peak in 2016 and then sharply declining. The betweenness centrality of the network in each year was not balanced, with the betweenness centrality in 2016 being 8.3 times that of 2020. As the intermediation and supervision capabilities of joint investment enterprises become more diverse, the differences in intermediation capabilities increase, and the connection with other enterprises becomes unstable. In terms of closeness centrality, the maximum value was 14.56 and the minimum was 1.56. Closeness centrality increased rapidly at the beginning of network development, reached a peak in 2012, and then sharply decreased, with a slight rebound from 2014 to 2020, indicating a large overall fluctuation in the tightness of the network. This shows the degree of closeness between enterprises.
Table 2,
Table 3 and
Table 4 show the top ten enterprises in terms of centrality indices and their corresponding index values at different times. As can be seen from the data, the ranking of closeness centrality and betweenness centrality of the top ten enterprises in the centrality indices between 2011 and 2020 is generally consistent, showing both similarity and difference. There are significant differences in the ranking of centrality indices in different years, mainly due to the different competitiveness levels and roles played by enterprises in different positions in the joint venture capital network. Enterprises in central positions in the network usually have a higher ranking in centrality indices, and a few core enterprises can control the development of the entire network. The network structure in the core area is more complex than that in the edge area, and the centrality indices of some enterprises in the edge area have also increased, indicating that the distribution structure of the joint venture capital network shows the characteristic of “highly concentrated power and scattered edge distribution”. As the years increase, the gap between the degree centrality and closeness centrality indices of core enterprises decreases. The betweenness and centrality indices of core enterprises such as Redwood China, Vision Plus Capital, Legend Capital, and Hillhouse Capital have significantly increased with the passing of years, indicating a strong control ability over the entire joint venture capital network and the role of “core intermediaries” in the network, which depends on the enterprises’ good reputation and strong investment strength.
3.3. Network Structure Attributes
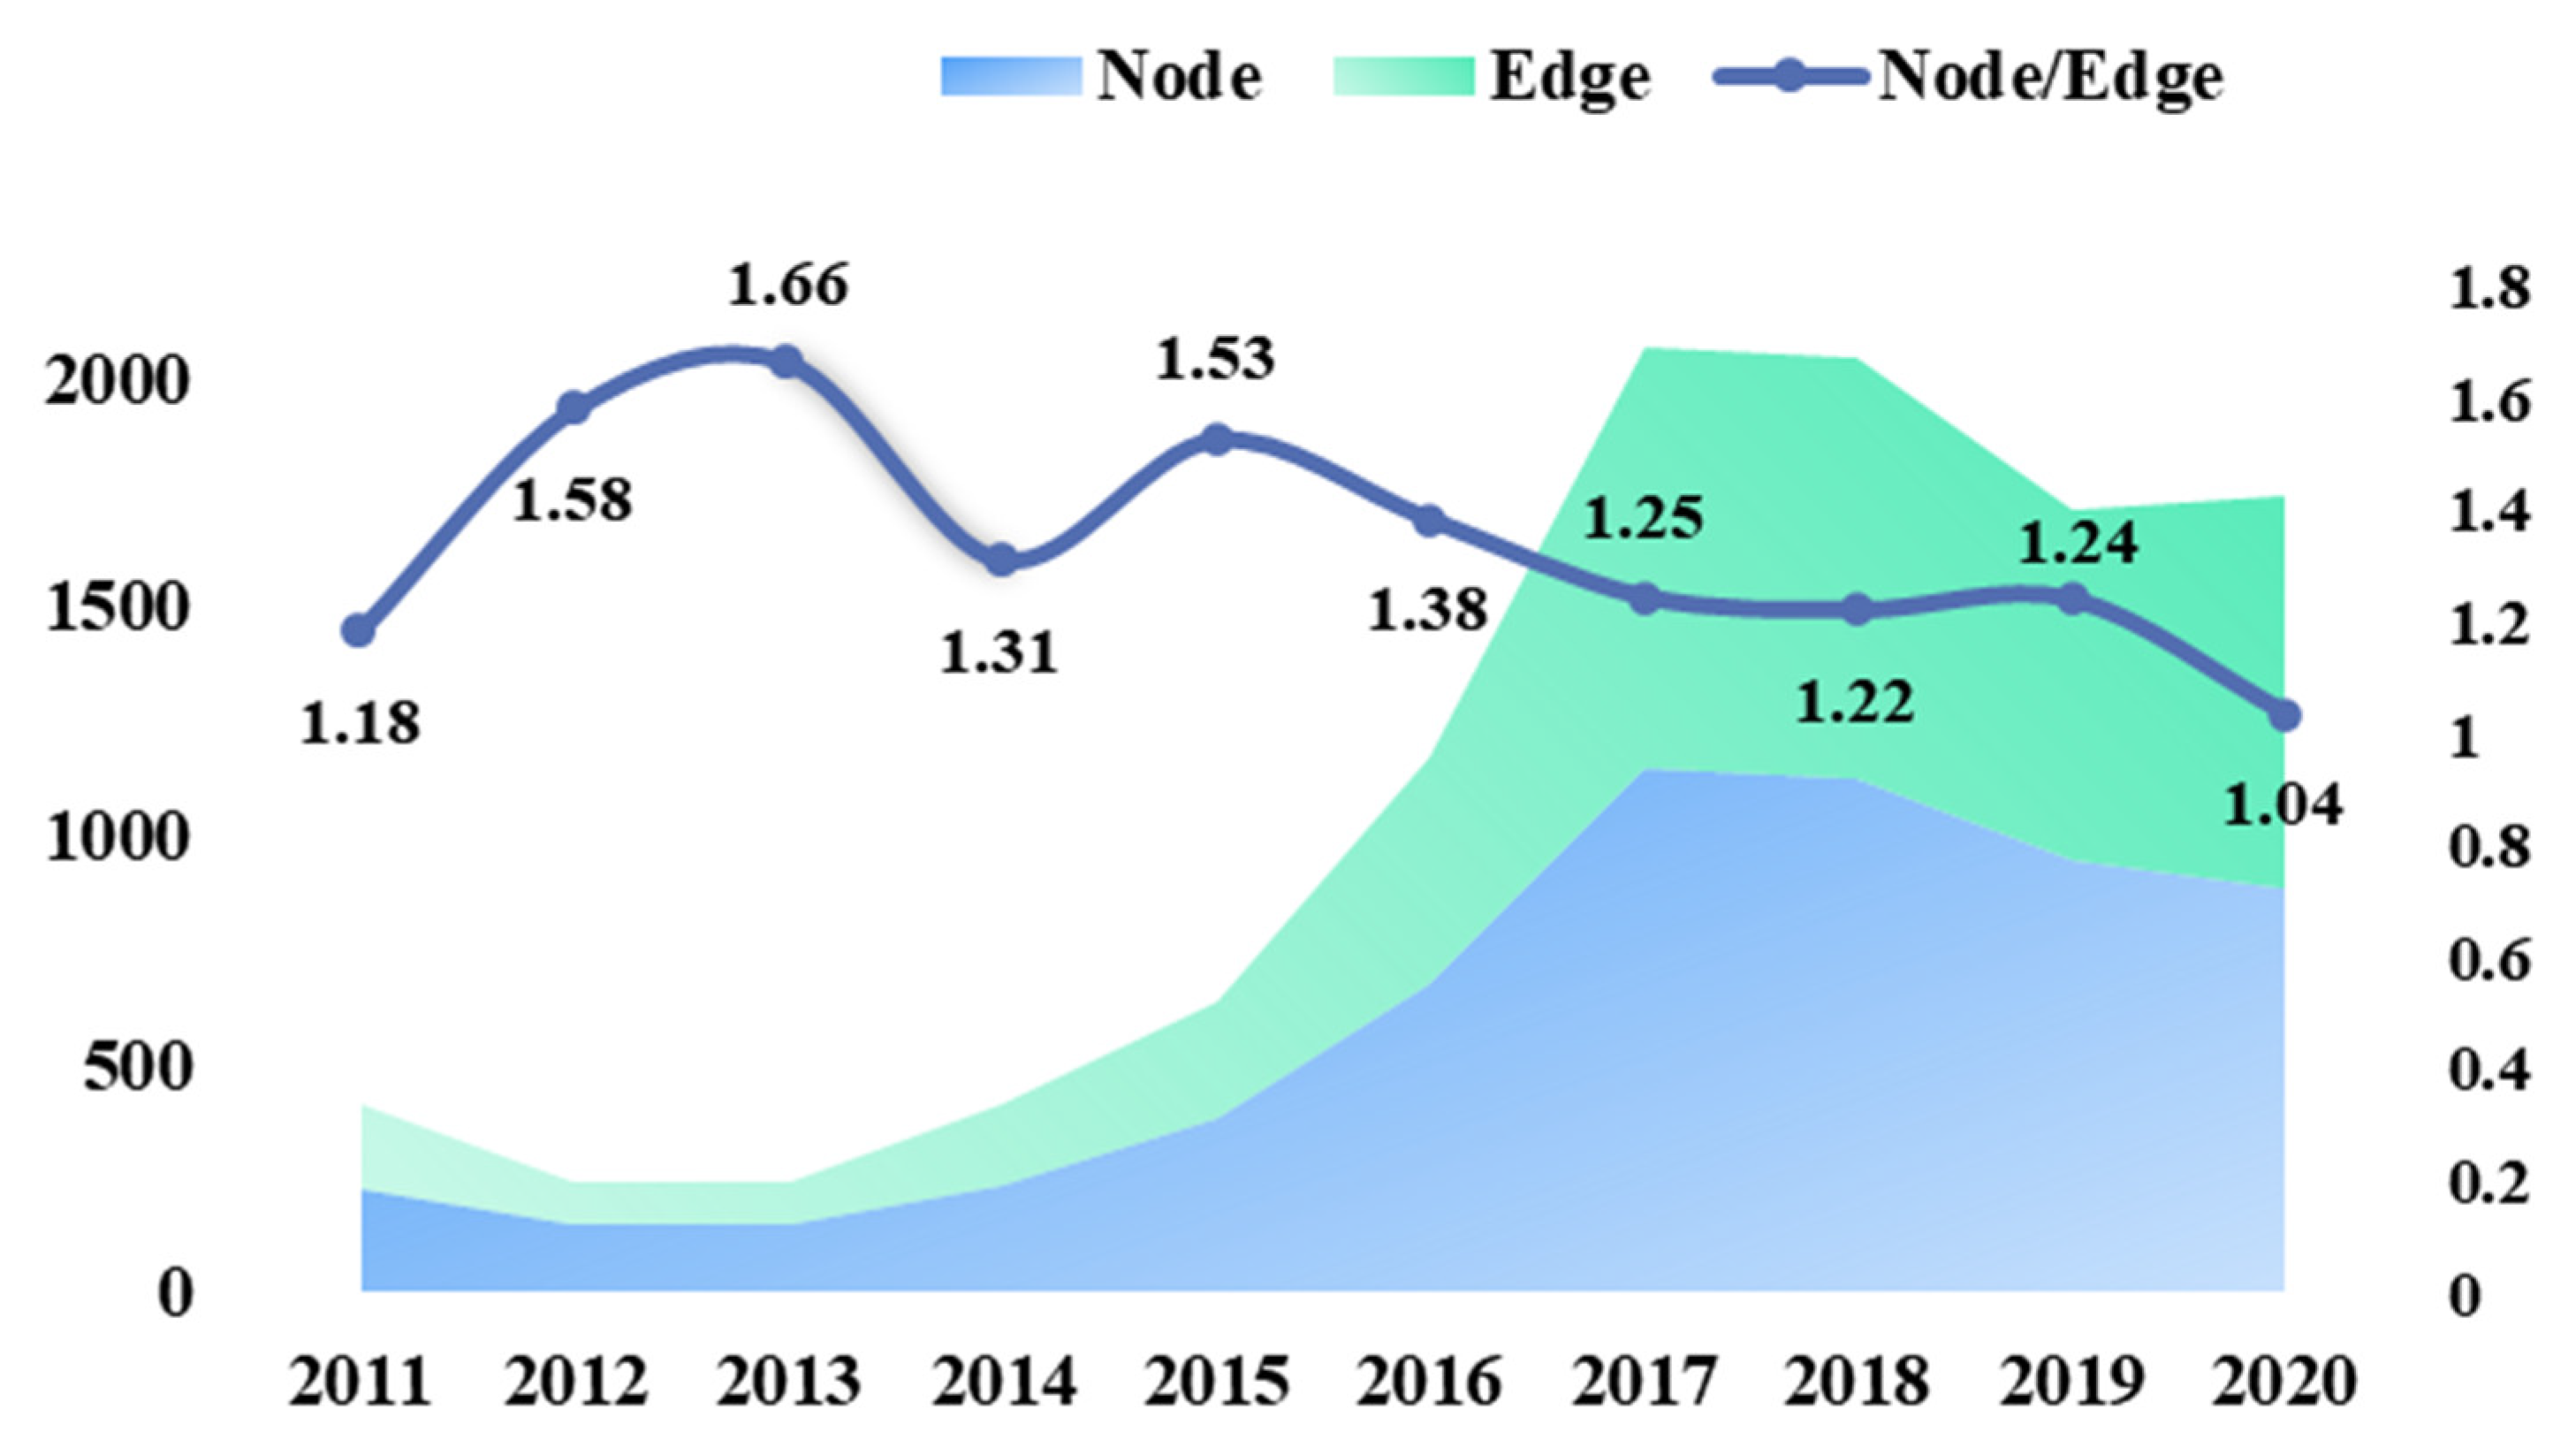
The scale and tightness of the joint venture capital network can also be reflected by the number of nodes and edges in the network. As shown in
Figure 4, the number of nodes in the joint venture capital network was 150 in 2012 and increased to 1125 in 2018. From 2012 to 2020, the number of nodes and edges in the network showed an upward trend, with the number of joint venture capital subjects and joint investment cooperation relationships increasing rapidly. The growth trend of the number of nodes and edges was higher in 2017 and 2018 than in other years and significantly declined in 2019 and 2020. The proportion of the number of nodes and edges was highest in 2013, indicating a closer joint venture capital cooperation relationship among enterprises in that year. On the other hand, the joint investment relationship among enterprises was the loosest in 2020, and the COVID-19 pandemic, which broke out in 2020, had a huge impact on trade, production, consumption, and economic development in China and the world, and the risk investment industry was also obviously affected by the pandemic stage, which is an important reason for the shrinkage of the network scale in that year.
For joint venture capital networks, the stability of the network is closely related to the frequency of joint investment behaviors among its members. Based on the measurement of centrality indices of network nodes, the evolution trend of network structural properties was further analyzed from the perspectives of network density and average clustering coefficient.
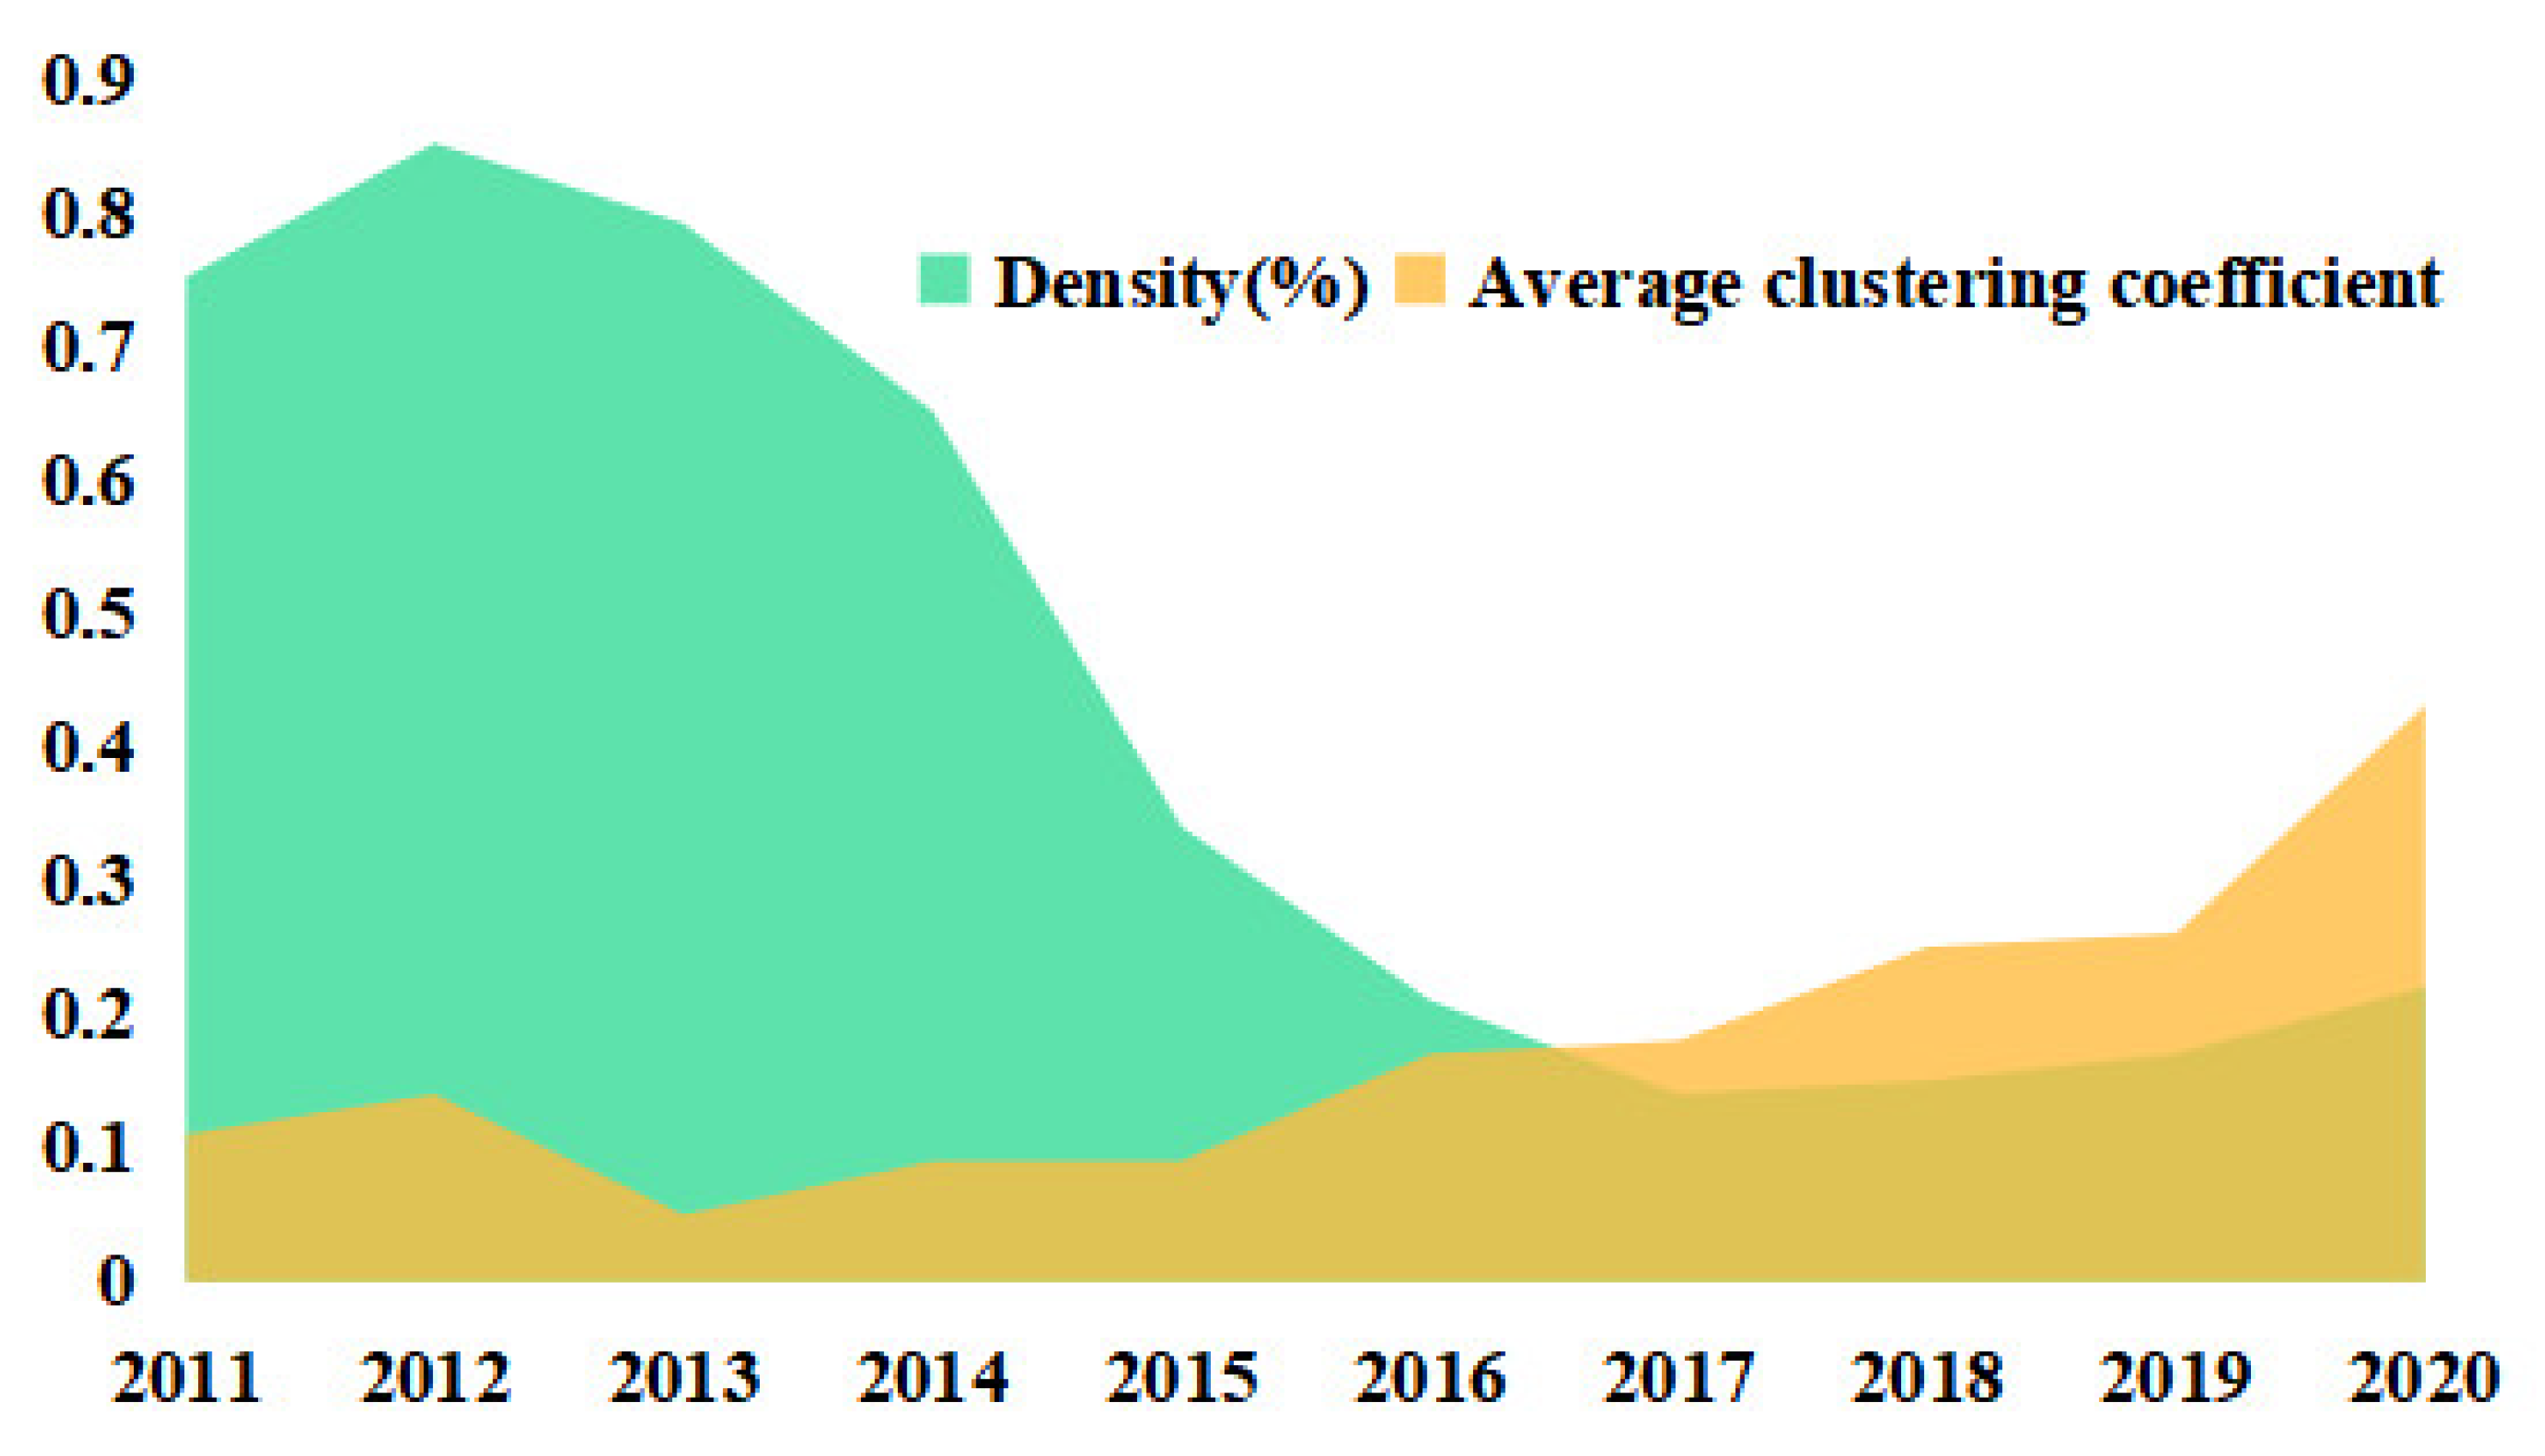
As shown in
Figure 5, the stability of the joint venture capital network is closely related to the frequency of joint investment activities among its members. Based on the calculation of the centrality indices of the network nodes, the evolution trend of the structural properties of the joint venture capital network was further analyzed from the perspectives of network density and average clustering coefficient, as shown in
Figure 5. In terms of network density, there was a significant change in the density of China’s joint venture capital network from 2011 to 2020, with an overall fluctuating downward trend. In 2012, the overall density of the network’s spatial structure was 0.85, indicating a high level of interaction among enterprises in joint venture risk investment. However, in 2017, the network density was 0.14, indicating a lower level of development in the network structure. This suggests that new members are constantly engaging in joint venture capital activities in the network, and the degree of closeness among members has relatively decreased, meaning that the network has not yet formed a closely connected core structure. In comparison to network density, the average clustering coefficient has been at a relatively low level from 2011 to 2015 and has increased every year since 2015, reaching its highest level of 0.43 in 2020. This value is still relatively low, indicating that the “small world” network characteristics of the overall joint venture capital network are not obvious. The growth rate of the degree of cooperation and closeness among the risk investment enterprises in the network does not match the expansion rate of the network scale, resulting in weak stability of the network structure and a “fragmented” characteristic.
3.4. Community Detection
The community structure of the core members in the joint venture capital network from 2011 to 2020 is significant, although the ‘small world’ characteristics of the entire network are not evident. The modularity evaluation function proposed by Newman can be utilized to divide the network into different community structures and assess the quality of the community [
26]. The Fast Newman algorithm is employed to detect and divide the community of the joint venture capital network. As shown in
Figure 6 and
Table 5, the optimal modularity of the network is 0.59, indicating that the overall core network has a significant community structure. A total of 10 communities are identified, with Community 1 and Community 2 having the largest scale, consisting of 63 and 50 node enterprises, respectively, and accounting for 32.38% of the core enterprises. The smallest community only accounts for 4.3% of the core enterprises, indicating considerable differences in the scale of communities. Each clique contained at least one investment enterprise that ranked within the top 20 in terms of degree value, demonstrating leading behavior characteristics.
Table 5.
Joint venture capital core network community division table.
Table 5.
Joint venture capital core network community division table.
| Number | Membership | Representative Enterprise |
|---|
| 1 | 63 | Shenzhen Capital Group, Lime Capital |
| 2 | 50 | Legend Capital, Tencent Investment |
| 3 | 46 | 5Y Capital, Redwood China |
| 4 | 41 | MatrixPartners China, Vision plus Capital |
| 5 | 33 | IDG Capital, Alibaba |
| 6 | 27 | Fortune VC, Plum Ventures |
| 7 | 26 | Jinge Fund, K2 VC |
| 8 | 24 | Hongyuan Nakanami, Oriental Fortune Capital |
| 9 | 24 | Qiming Venture Capital, Trustbridge Partners |
| 10 | 15 | Vertex Ventures, Yunhui Capital |
Figure 6.
Schematic diagram of core network community division of joint venture capital.
Figure 6.
Schematic diagram of core network community division of joint venture capital.
3.5. Robustness Analysis
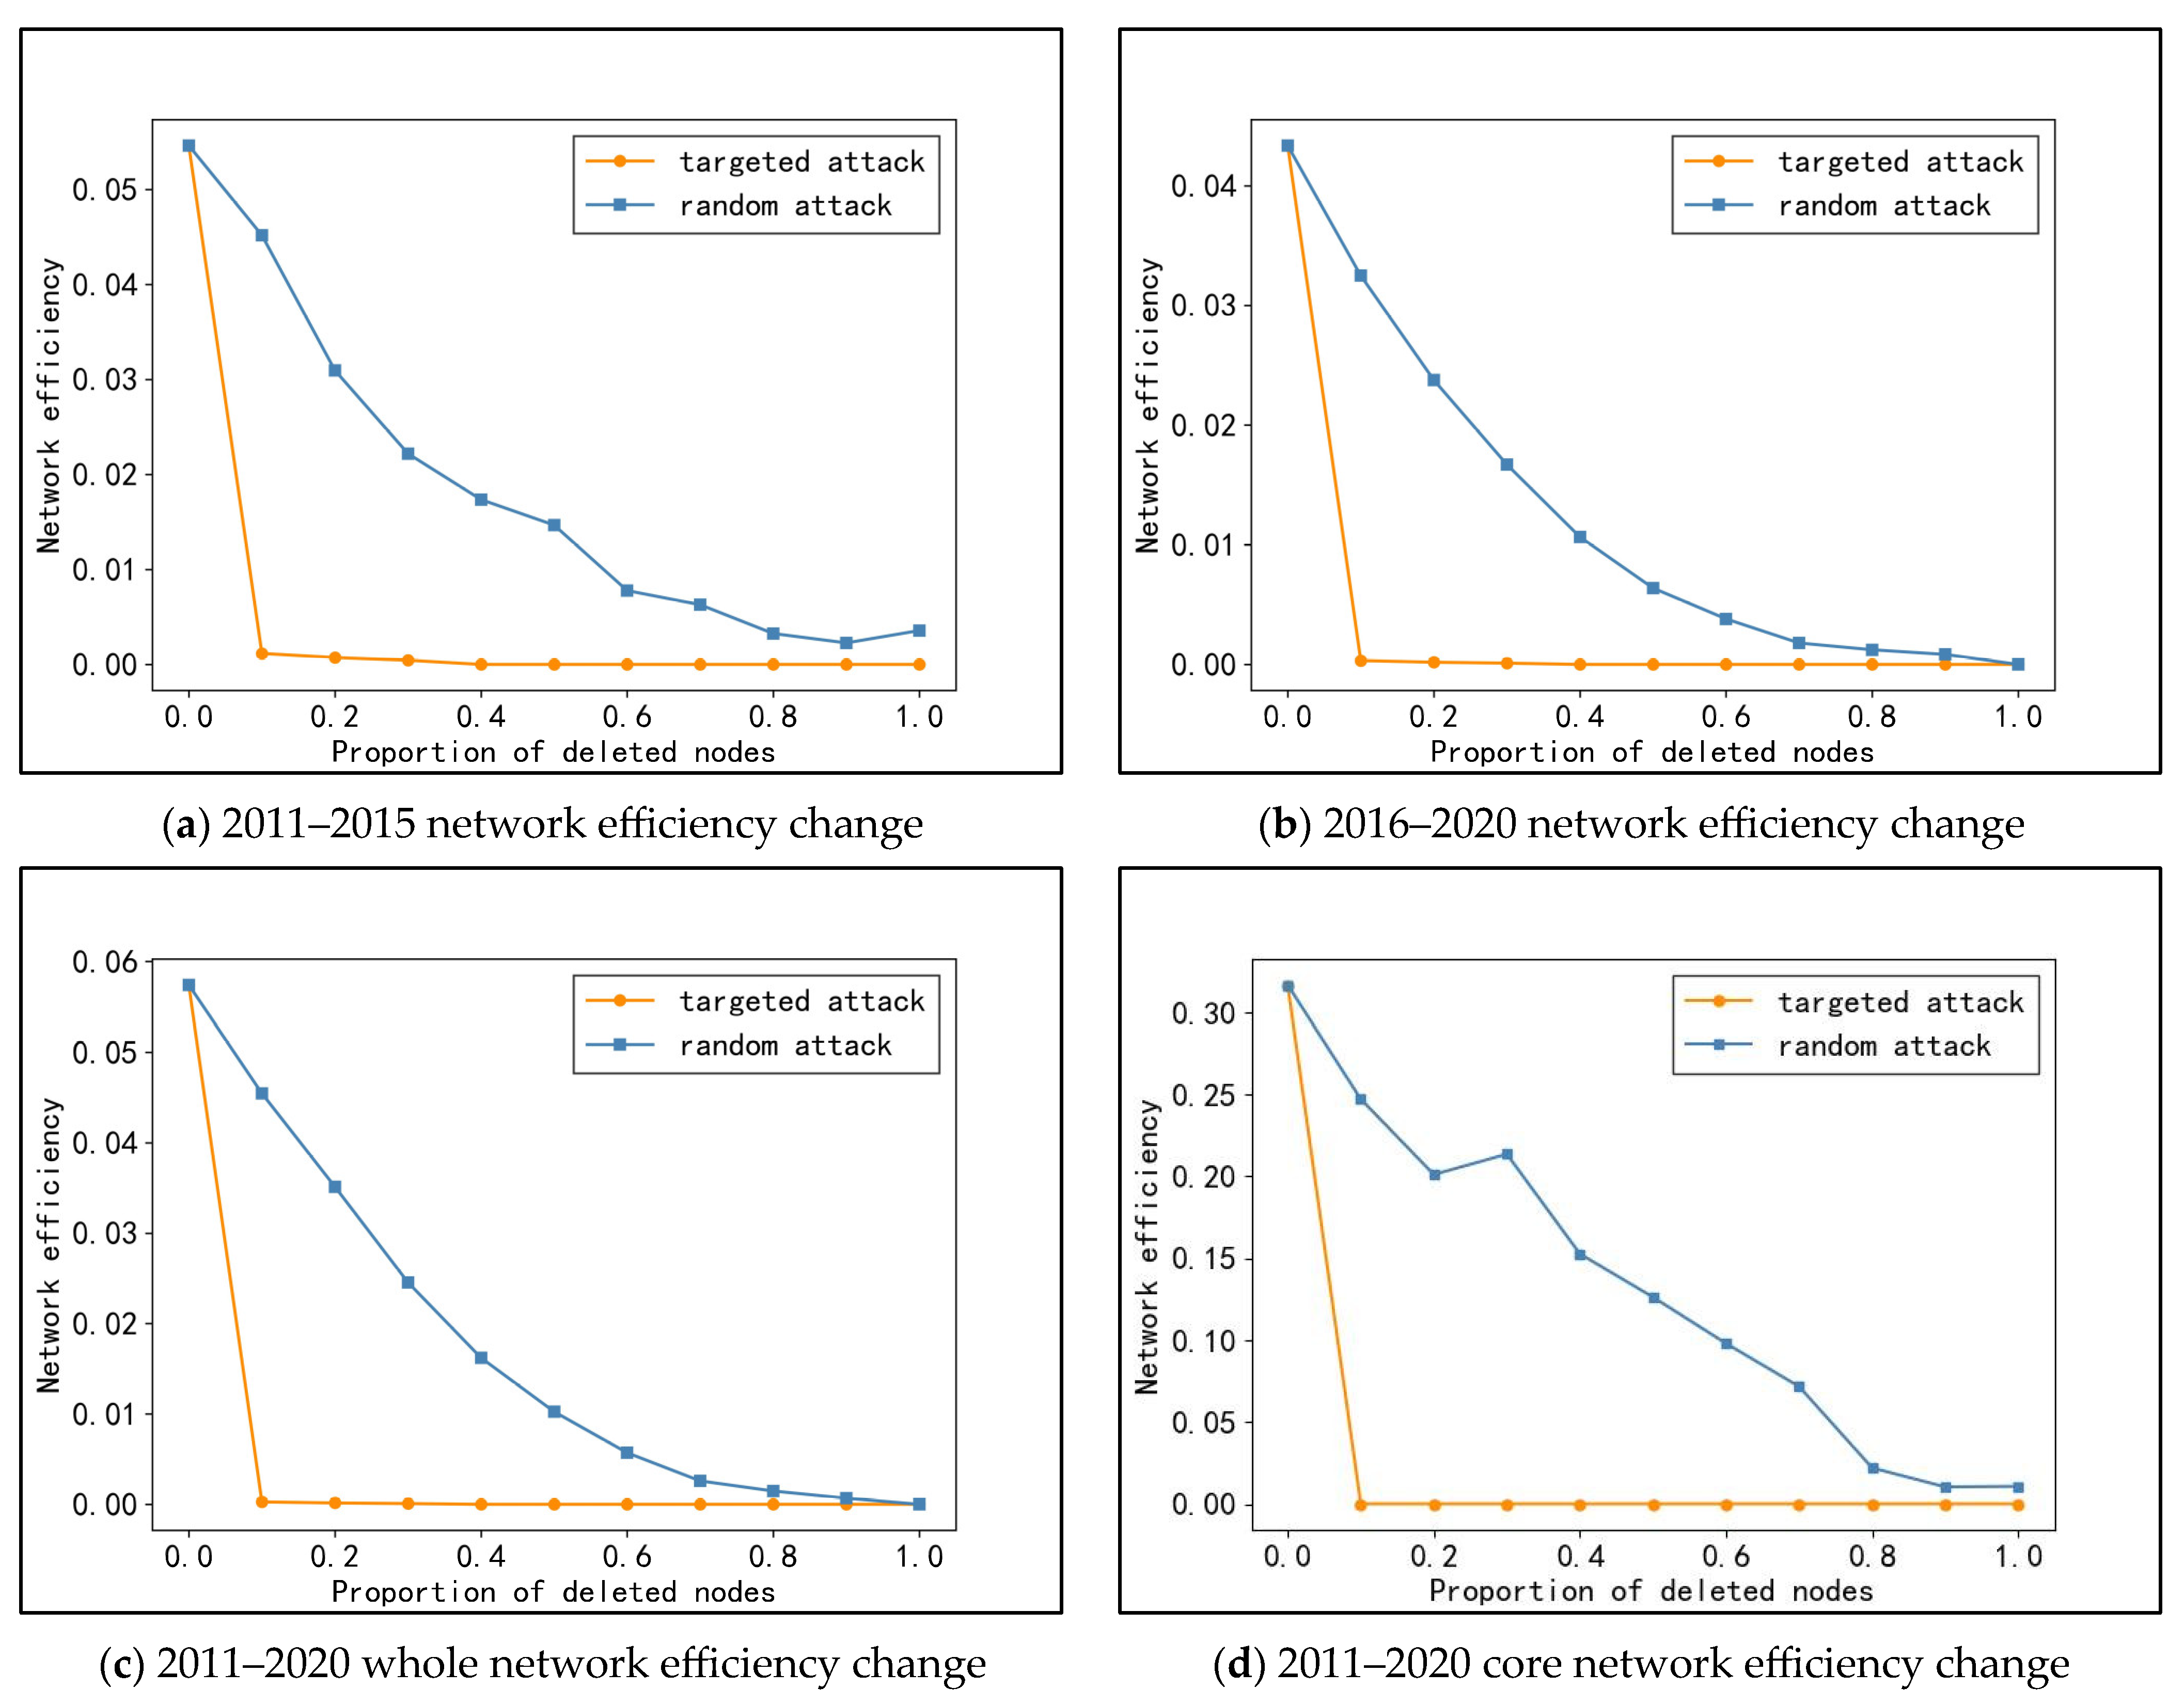
To better capture the changes in network structure after the removal of certain nodes at different time periods, this study adopts a 5-year time window to identify key enterprise nodes. The study randomly deletes nodes and systematically deletes nodes or key target nodes with the highest degree value to draw the core network and the overall network efficiency under random and deliberate attacks. The changes in network efficiency with node failure are measured to further assess the vulnerability of the entire network, as illustrated in
Figure 7.
The results obtained from the analysis of the joint venture capital network in China suggest that the core network of the joint venture capital network has the highest global efficiency and best connectivity among all periods from 2011 to 2020. The establishment of close ties among the core members of the network has improved its robustness of the network. However, with the increase in the proportion of removed nodes, the network efficiency gradually declines. Specifically, the network efficiency under deliberate attack shows a sharp decline in a linear trend, while the efficiency decline under random attack is relatively uniform with small fluctuations. The results suggest that random attacks have less impact on the network and show certain robustness compared with deliberate attacks. Moreover, the study identifies that the core enterprises in the network play an essential role in maintaining the results of the joint venture capital network in each period. The degree of dependence of the other members of the network on the core enterprises is relatively high, as deleting the core nodes with higher degree values under deliberate attack leads to a rapid decrease in network efficiency in four periods. These findings indicate that the identification and maintenance of core enterprises are crucial for the stable development of the joint venture capital network in China. Overall, the analysis of the joint venture capital network in China conducted in this study provides insights into the dynamic evolution and robustness of the network structure, contributing to the optimization of venture capital performance and the promotion of the healthy development of multi-level markets.
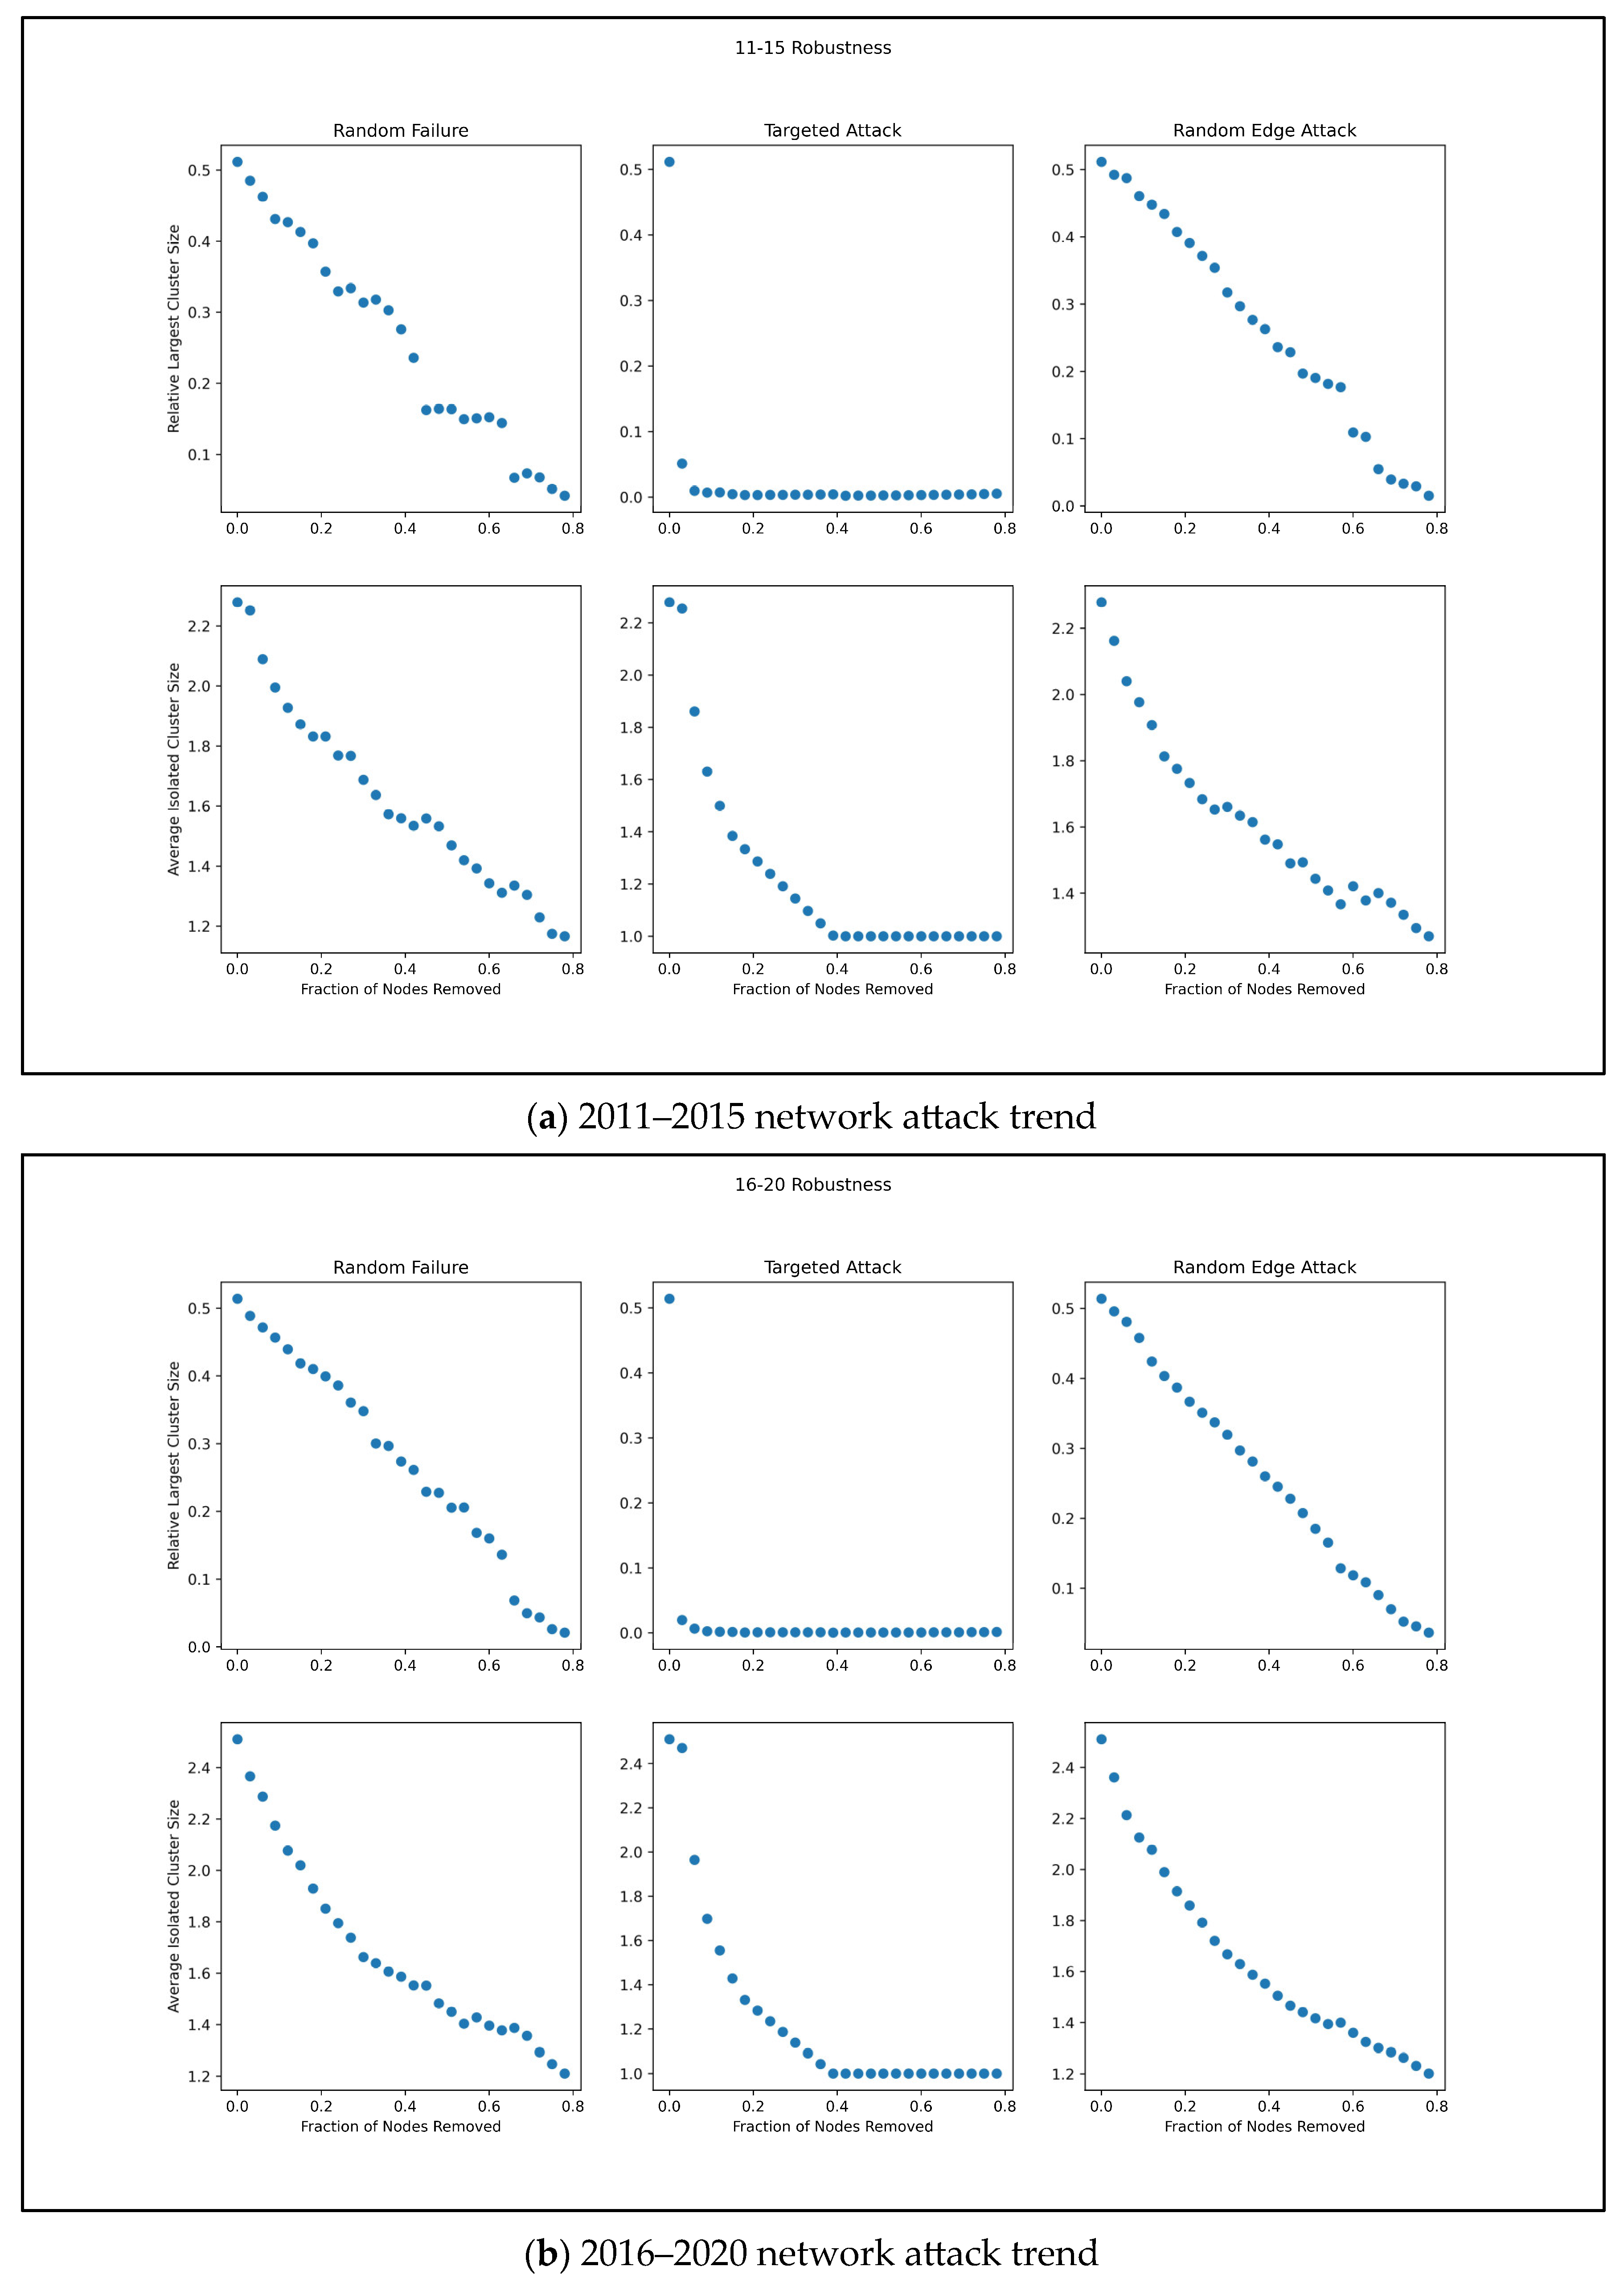
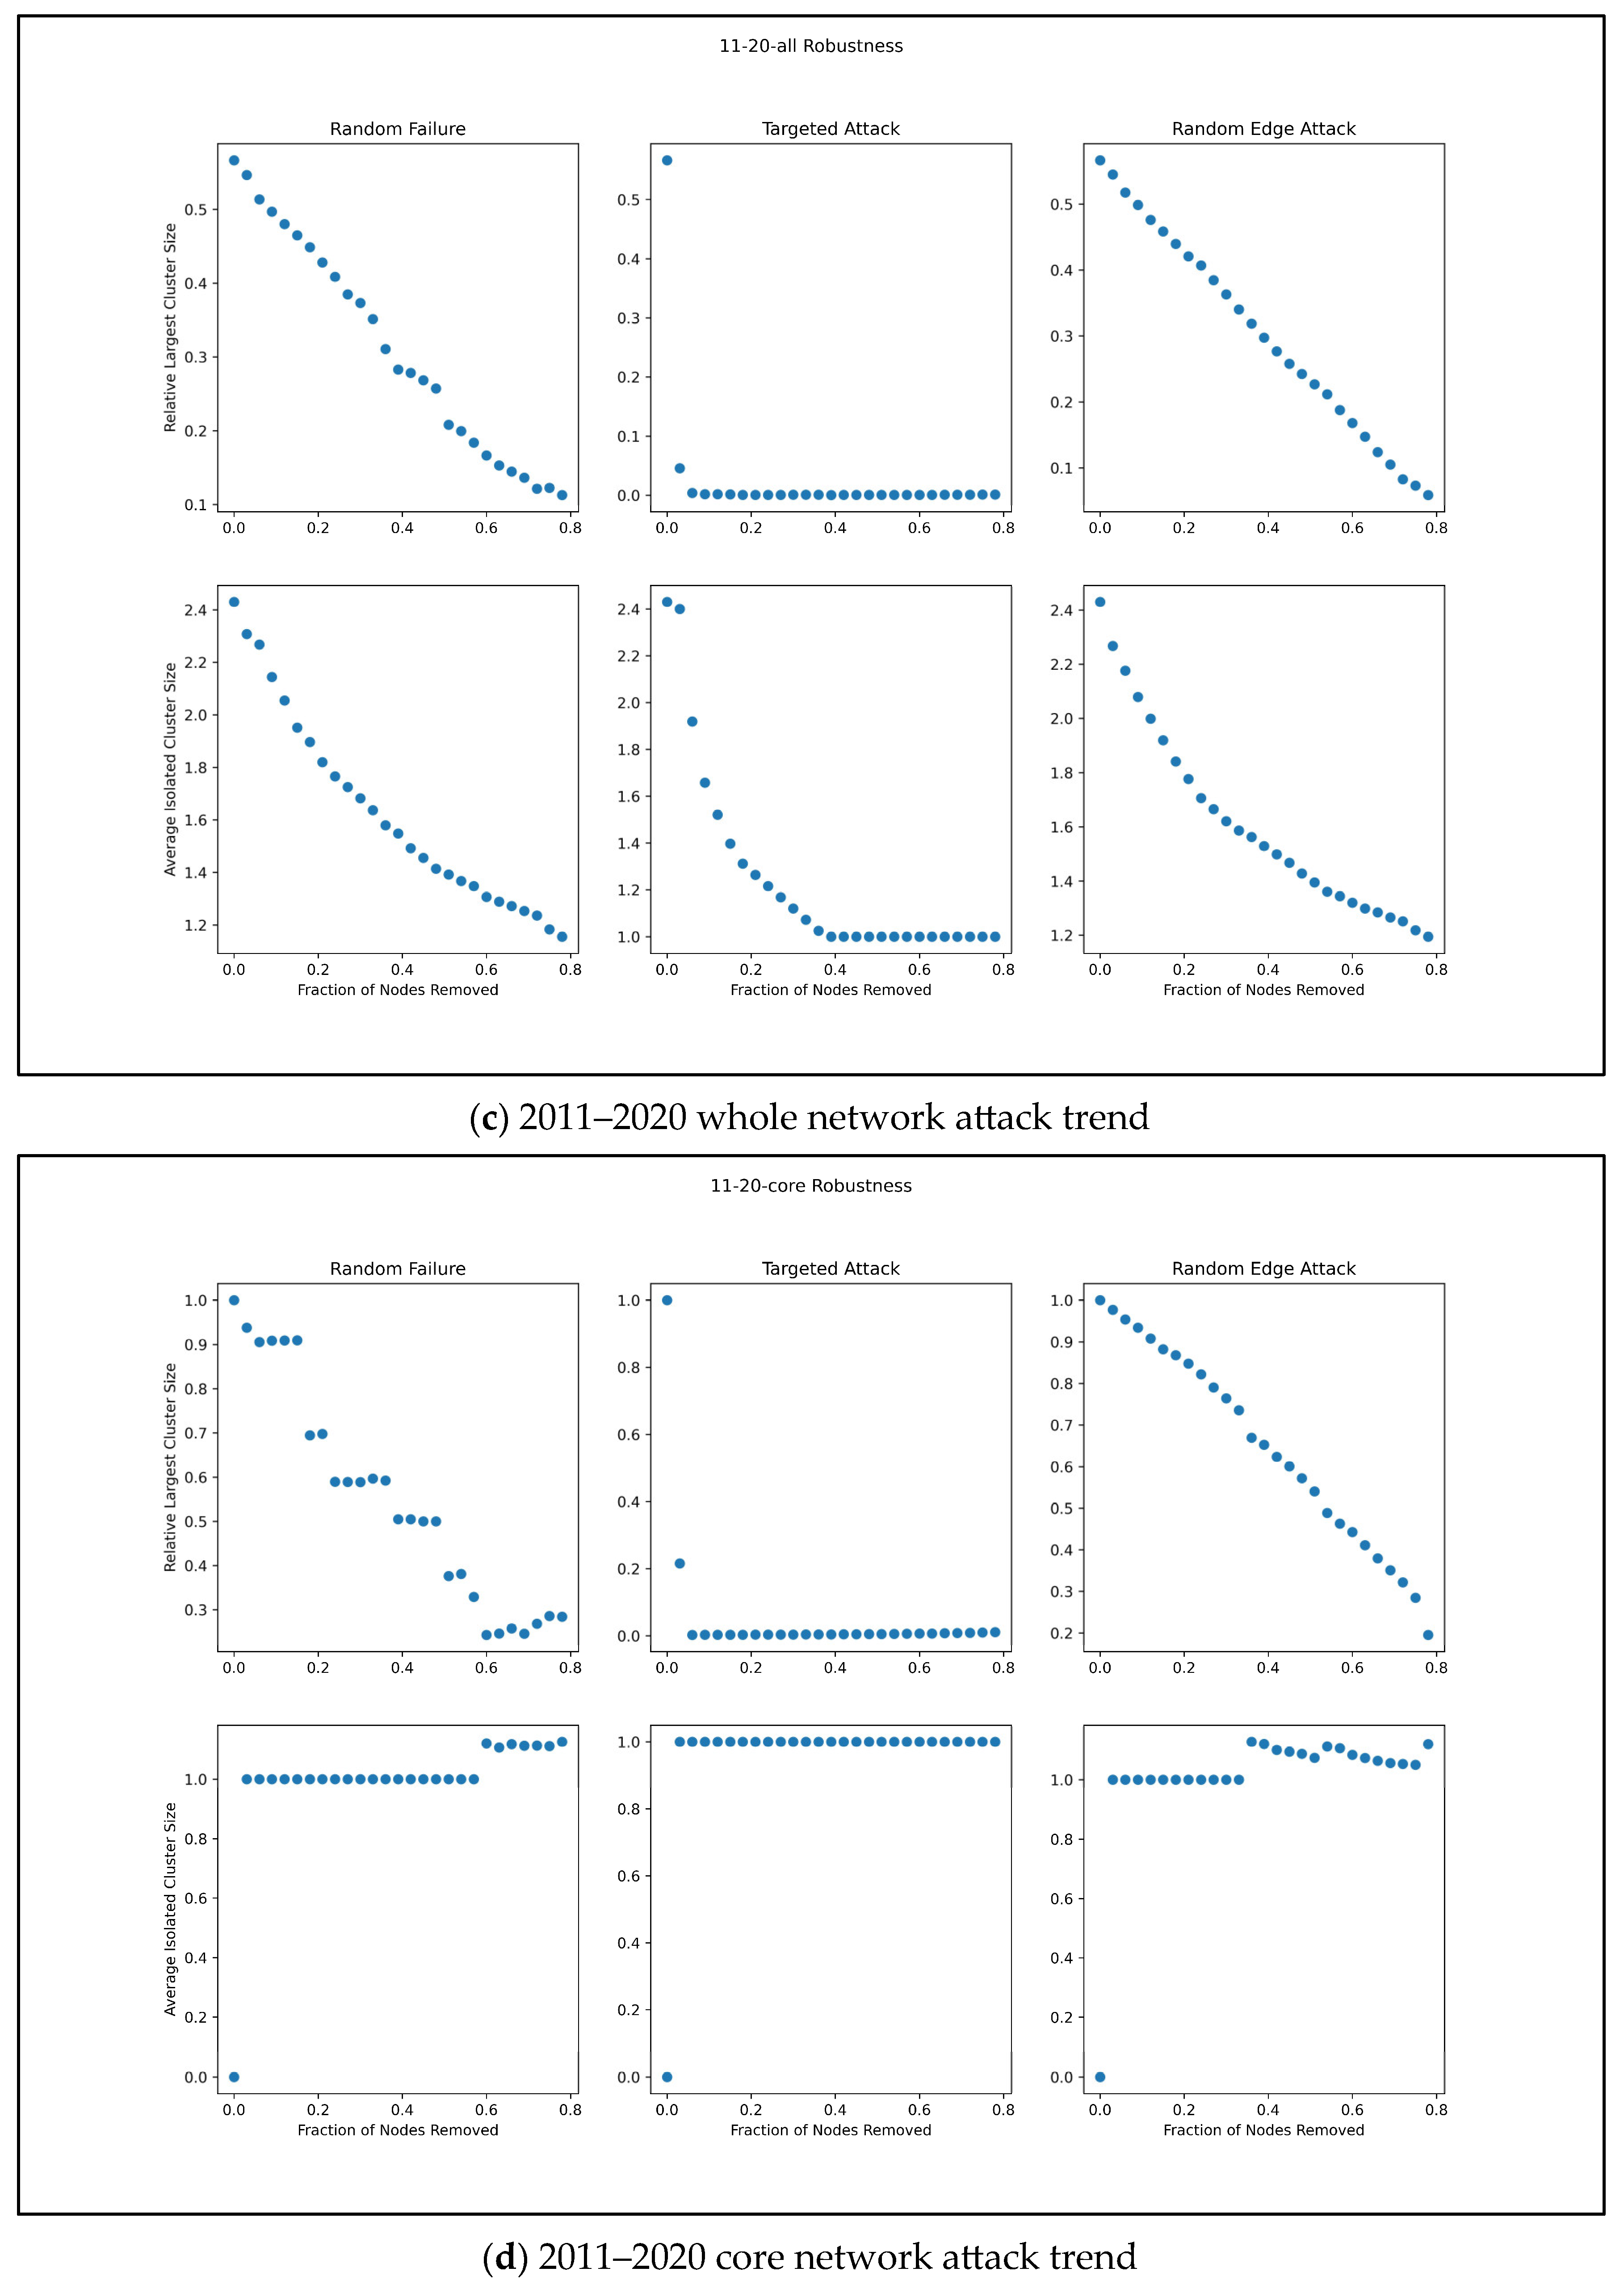
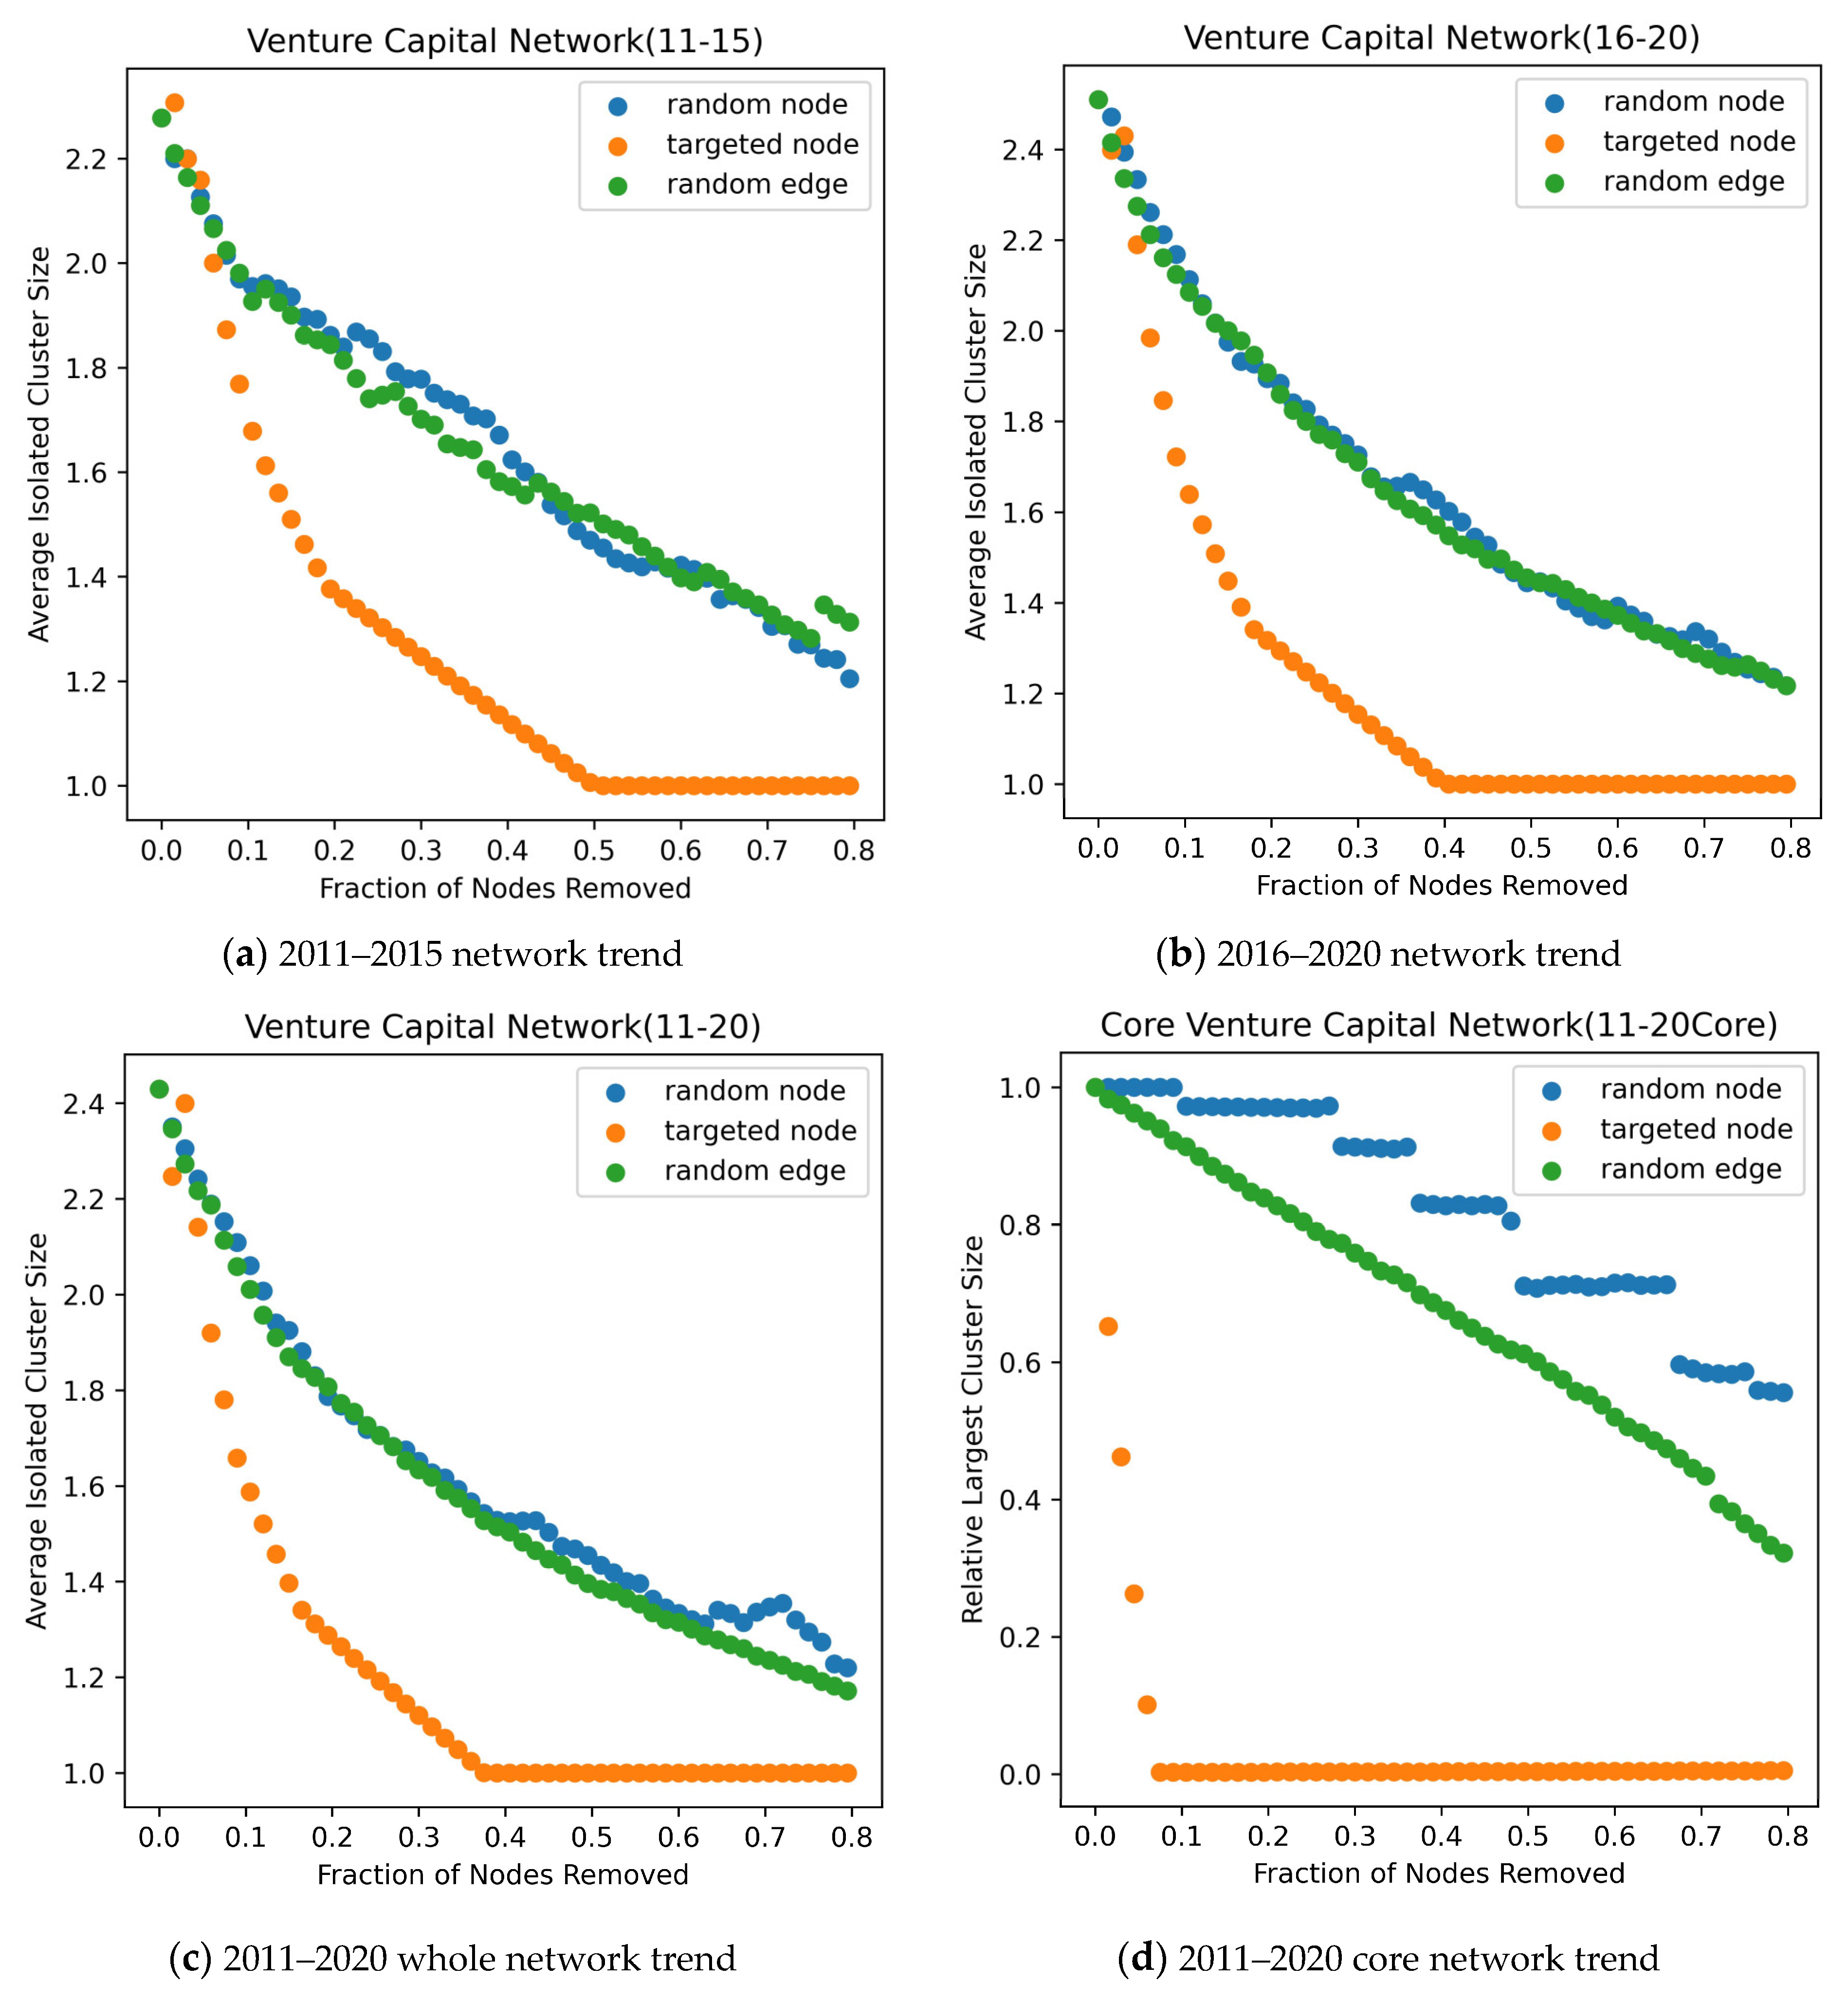
In order to compare the impact of different attack methods on network robustness and further understand the dynamic evolution process of network topology characteristics, this study selected two indicators, namely the relative largest cluster size and the average isolated cluster size. The network was subjected to ‘attacks’ through simulation, using three different attack strategies: random node attack, random edge attack, and deliberate node attack, to observe the consequences and determine whether the network is still connected after the attack. The change trend of average isolated cluster size was used to observe the impact of the three attack methods on the network.
Figure 8 and
Figure 9 depict the results.
On the whole, the largest subgroup’s relative size experiences a faster collapse compared with the average size of isolated subgroups during deliberate network attacks. For the 2010–2015, 2016–2020, and 2011–2020 overall networks, the average size of isolated subgroups and the relative largest cluster size under both random node and random edge attack strategies exhibit a high degree of correspondence, displaying a gentle linear downward trend. The removal of nodes and edges at random does not significantly impair the network’s robustness. However, for the core network in 2011–2020, the random attack strategies differ significantly: the average size of isolated subgroups exhibits a linear decreasing trend after random edge attack, while it displays a stepwise decreasing trend under random node attack. This discrepancy is primarily due to the fact that a majority of nodes and edges in the overall network of joint venture capital are non-critical, and the outcomes of randomly selected attacks are difficult to predict, resulting in a minor impact differentiation. Conversely, in the core network, the degree value of each enterprise member is high, and even the deletion of nodes at random may disrupt the connectivity state, leading to a breakdown of network connectivity. This underscores the joint venture capital network’s heightened sensitivity to targeted attacks. The removal of key node enterprises has a greater impact on the entire network, while non-key enterprises’ impact on the network possesses a degree of elasticity. Different from the random attack strategy, the network displays a heightened sensitivity to the systematic deletion of nodes during deliberate attacks. The relative largest cluster size in different periods experiences a sharp decline to 0 at the attack’s outset, and the network’s connectivity is visibly disrupted. In the core network of 2011–2020, the scale of average isolated cluster size increases significantly after the attack. This phenomenon primarily stems from the fact that deliberate attacks on the closely connected node enterprises of the core network tend to disperse the nodes in the joint venture capital network. Consequently, the maximum subgroup may be destroyed and bifurcate into multiple isolated clusters, thereby expanding the scale of isolated cluster evaluation. Combined with the network efficiency’s operational results, it further underscores the joint venture capital network’s poor invulnerability to deliberate attack strategies. Key nodes with large overall network structure dependence are susceptible to destabilizing the network structure if several key enterprises withdraw from joint venture capital behavior, resulting in rapid network paralysis.
4. Conclusions
Based on the data of all joint venture capital cases of listed companies in China from 2011 to 2020, this paper constructs a joint venture capital network, depicts node attributes from the perspective of network structure, explores the dynamic evolution trend of the joint venture capital community network, measures the risk resistance ability of the whole network, and analyzes the robustness of the network. The main findings are as follows:
Firstly, the scale of China’s joint venture capital network has shown a trend of increasing year by year, with an increase in the frequency of cooperation between enterprises. As the scale of joint venture capital trade continues to grow, new members are constantly joining the joint venture capital network, and the structure of the network becomes increasingly complex with a diverse range of joint investment industries. As risk-investment enterprises approach the network subjects, they can obtain more information and knowledge through the joint venture capital network. At the same time, the centrality of some enterprises has decreased, while Shenzhen Capital, Source Code Capital, Vision Plus Capital, Hillhouse Capital, Lake Bleu Capital, China Investment Corporation, Oriental Fortune, Legend Capital, and Jinge Fund are among the enterprises that are at the core of the network and play a crucial leading role in the development of the joint venture capital industry.
Next, the joint venture capital network exhibits weak stability with strong dependence on core enterprises. Links between venture capital enterprises in the network are relatively loose, and the fragmentation phenomenon is more pronounced than group formation. The core members of the network exhibit significant community characteristics, with communities displaying notable scale differences. The core area of the network presents a more complex structure than its edge area. The distribution structure of the joint venture capital network showcases the characteristics of high concentration of power and loose distribution of the edge. The overall density of the network exhibits a downward trend, with no core structure of close connections among network members. As the intermediary and supervisory abilities of joint investment enterprises become increasingly diverse, the intermediary abilities of node members in the network become significantly different. Several core enterprises exhibit strong control over the entire joint venture capital network, possess greater power within the network, and maintain unstable links with other enterprises. The development of China’s joint venture capital network remains in an unbalanced state.
Thirdly, the joint venture capital network shows weak robustness and a poor ability to resist external interference. Compared with deliberate attacks, random interference has less impact on the network and shows certain robustness. The exit of the network to non-key enterprises has a certain elasticity of interference with the network. There is a lack of close interconnection between enterprises, and network accessibility is poor. It shows strong invulnerability under a random attack strategy, and the overall network structure does not change greatly after a random attack. The exit of key node enterprises has a great impact on the joint venture investment behavior of many other enterprises. Even random deletion of nodes may lead to the destruction of network connectivity, and the importance of central nodes in maintaining the robustness of network structure has significantly improved. The network is sensitive to targeted attacks. Deliberate attacks, in descending order of degree, are extremely destructive to the network and can cause rapid network collapse.
5. Discussions
China has achieved new achievements in high-quality development and provided global capital appreciation opportunities with its rapid economic growth. The changing global economic environment has brought both opportunities and challenges to the development of China’s joint venture capital industry. Currently, the quality of China’s joint venture capital network still needs to be strengthened. The existence of the joint venture capital network can optimize the market process of the risk investment industry and provide more meaningful assistance for underdeveloped enterprises and relevant departments. In recent years, the joint venture capital industry has flourished with direct policy support from the government, but there is still room for improvement in indirect support. Based on this, the following recommendations are made from the government and risk investment agency perspectives:
For the relevant administrative departments, in order to create a healthy environment for joint venture capital investment, relevant government departments need to take effective measures to promote the development of the capital market and improve policy stability. Despite the significant growth in the size of the joint venture capital network over the past 40 years, the current development of the venture capital market still faces many challenges, such as the inadequacy of the capital market and the need to improve policy stability. Therefore, it is crucial for the government to play a decisive role in ensuring a favorable environment for joint venture capital investment. Without stable policy support, the healthy development of joint venture capital investment will undoubtedly face obstacles. In addition, with the increasing activity of international economic and trade activities, it is essential to establish an effective platform for communication between domestic and foreign capital, strengthen investment quality, and effectively mobilize the enthusiasm of foreign venture capital institutions. This will help to create a favorable environment for joint venture capital investment, effectively enhance the overall connectivity and stability of the network, and further improve the quality and status of China’s joint venture capital network. Moreover, relevant government departments should also provide a level playing field for all venture capital enterprises, regardless of size or status, to ensure fair competition and eliminate any potential barriers to investment. In addition, it is necessary to establish a sound legal framework and regulatory system to protect the legitimate rights and interests of investors and promote the standardization and transparency of the venture capital industry. This will not only enhance the credibility and integrity of the industry but also promote the healthy development of joint venture capital investment. Furthermore, it is essential to strengthen communication and cooperation between government departments and venture capital enterprises and provide timely and effective policy guidance and support to promote the healthy and sustainable development of the industry. By working together, we can create a favorable environment for joint venture capital investment, enhance the competitiveness of the industry, and promote the growth and development of innovative enterprises.
To promote the development of a joint venture capital network, it is important for the network members to leverage their strengths and constantly enhance their influence within the network. The core enterprises can seize more investment opportunities and network resources and establish close cooperative relationships with good joint venture capital partners by playing the role of “leader” within the network. This can enhance the quality of risk investment decision-making, reduce investment risks, and attract more venture capital partners to participate in joint venture capital, which can improve the overall robustness of the network and optimize the joint venture capital environment. Furthermore, it is important to break down the investment barriers between venture capital enterprises. When a small number of enterprises hold a large number of high-quality investment resources, it can lead to opportunistic behavior among investors, reduce the trust and reciprocity of joint investment, and weaken the stability of the network, thereby hindering the emergence of joint venture capital behavior. Therefore, it is important to eliminate investment barriers between joint venture capital, establish trust and commitment among enterprises, strengthen the flow of information among investors, reduce redundancy of information and resources, and enhance the efficiency and quality of information dissemination. This can promote the healthy development of investment enterprises and invested enterprises and ultimately lead to a more stable and robust joint venture capital network.
Compared with other venture capital networks, improving network quality, enhancing resilience, and reducing risk are important goals of China’s joint venture capital network optimization, but they are still of great significance. For policy makers, they can carefully review the existing laws and regulatory frameworks and make necessary reforms and adjustments to foster the development of joint venture capital cooperation and enhance market efficiency and transparency. Investors can strive to accurately assess the potential and risks associated with investment opportunities and adopt measures to diversify investment risks and reduce excessive reliance on individual enterprises within the network. Similarly, entrepreneurs should better understand the market environment and find better partners and opportunities so as to improve the competitiveness and innovation abilities of enterprises.
However, there are still some deficiencies in this study that are worth further discussion. Firstly, joint venture capital relationships encompass more than just financial investment, often involving knowledge sharing, technology transfer, and market access. This paper does not classify all investors, overlooking the contributions of different types of investors in these dimensions. Secondly, geographical distribution characteristics can reveal the level of entrepreneurial ecosystems and innovation activities in different regions. But this paper places less emphasis on cross-regional joint venture capital behavior and overlooks the geographical differences among enterprises. In future research, it would be valuable to analyze the varying roles of different types of investors in investment decision-making, resource allocation, and risk management. Additionally, exploring the geographical distribution characteristics of joint venture capital networks and examining the cooperation models and influencing factors between different regions can offer insights to policymakers and entrepreneurs, enabling them to better plan and promote regional economic development. Moreover, it can facilitate enhanced cooperation and exchanges between different regions, fostering accelerated innovation and economic development.


