
Measuring Patent Similarity Based on Text Mining and Image Recognition


Abstract
:1. Introduction
2. Literature Review
2.1. Patent Similarity
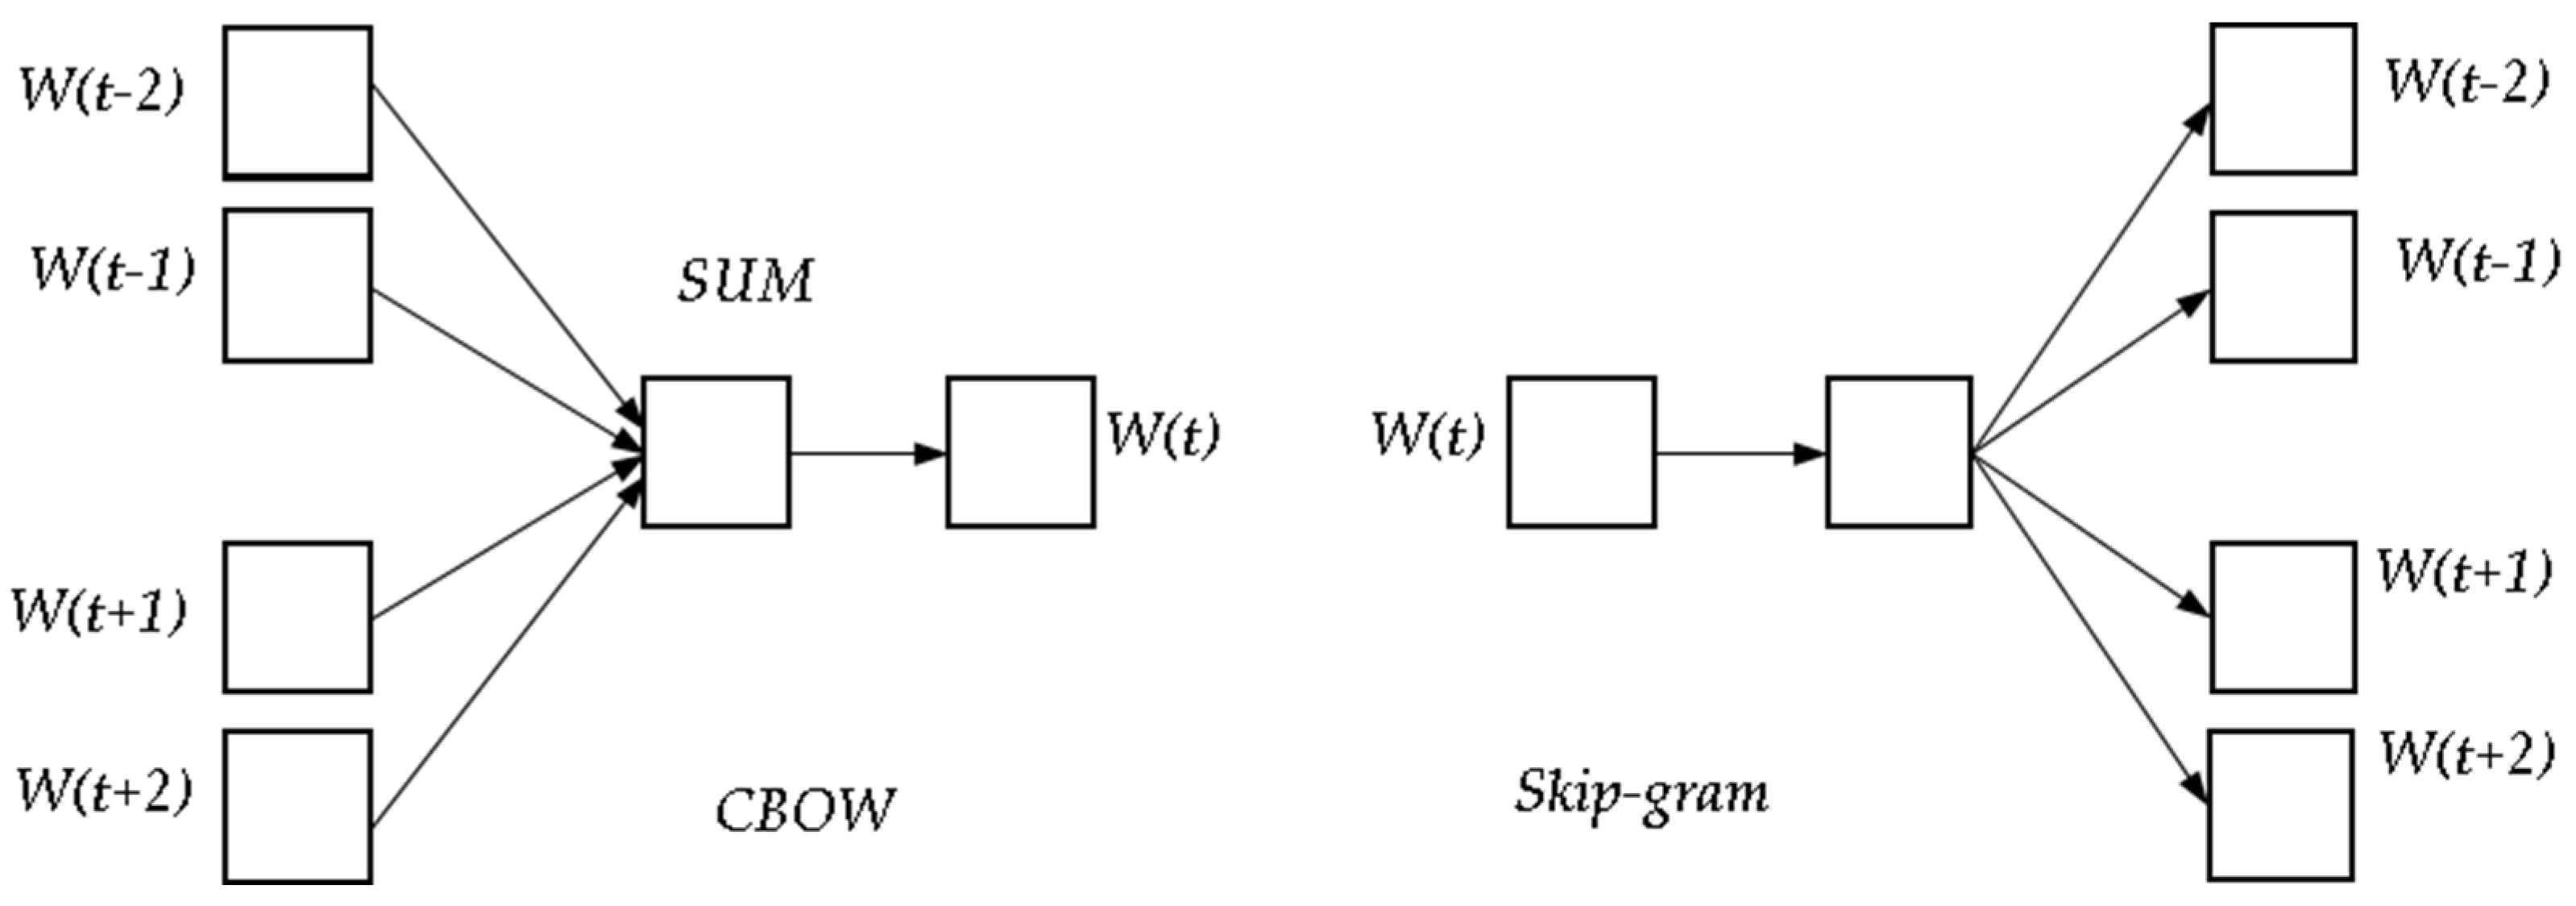
2.2. SAO Semantic Analysis
2.3. Contour Detection
3. Data Collection
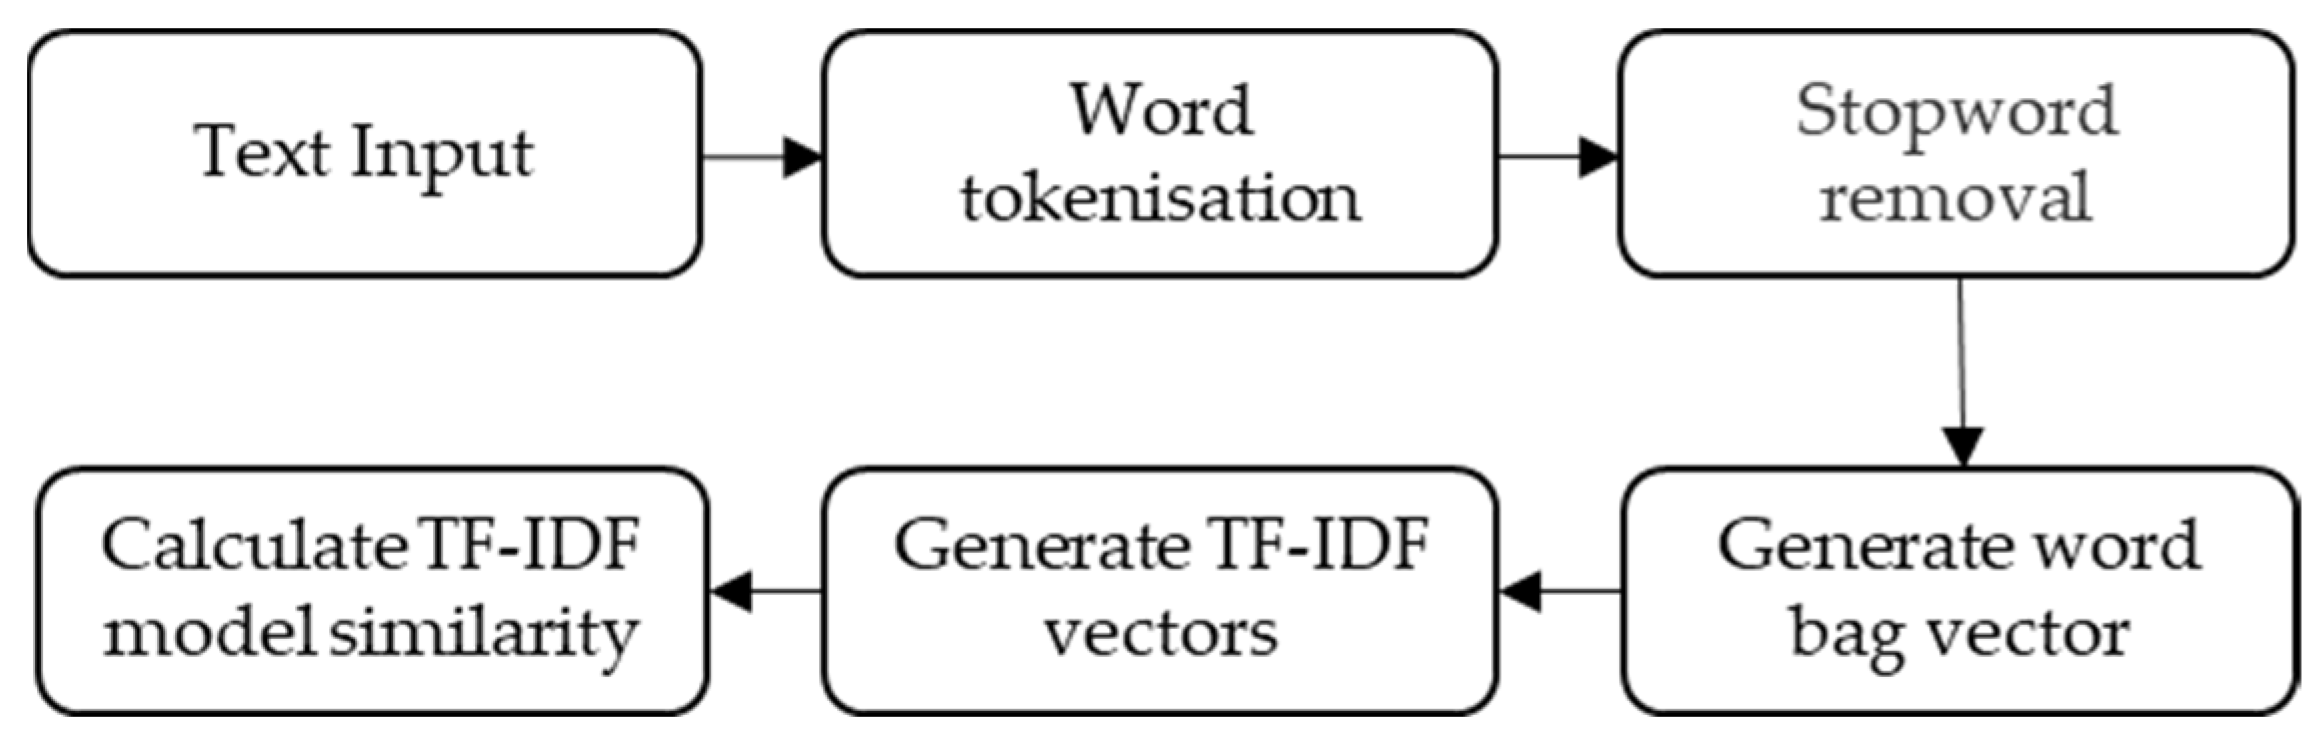
4. TF-IDF
- Calculate word frequency: Word frequency is the number of times a word appears in this article. To make it easier to compare articles of different lengths, word frequency is normalized by dividing the number of occurrences by the total number of words in the article.
- 2.
- Calculate the inverse document frequency: A corpus is a collection of all articles that simulate the language environment. The more frequent a single word is, the larger the denominator becomes, and the closer the inverse document frequency is to zero. The denominator is added by 1 to prevent the denominator value from being 0 (i.e., all documents do not contain the word); lg means to take the logarithm of the obtained value.
- 3.
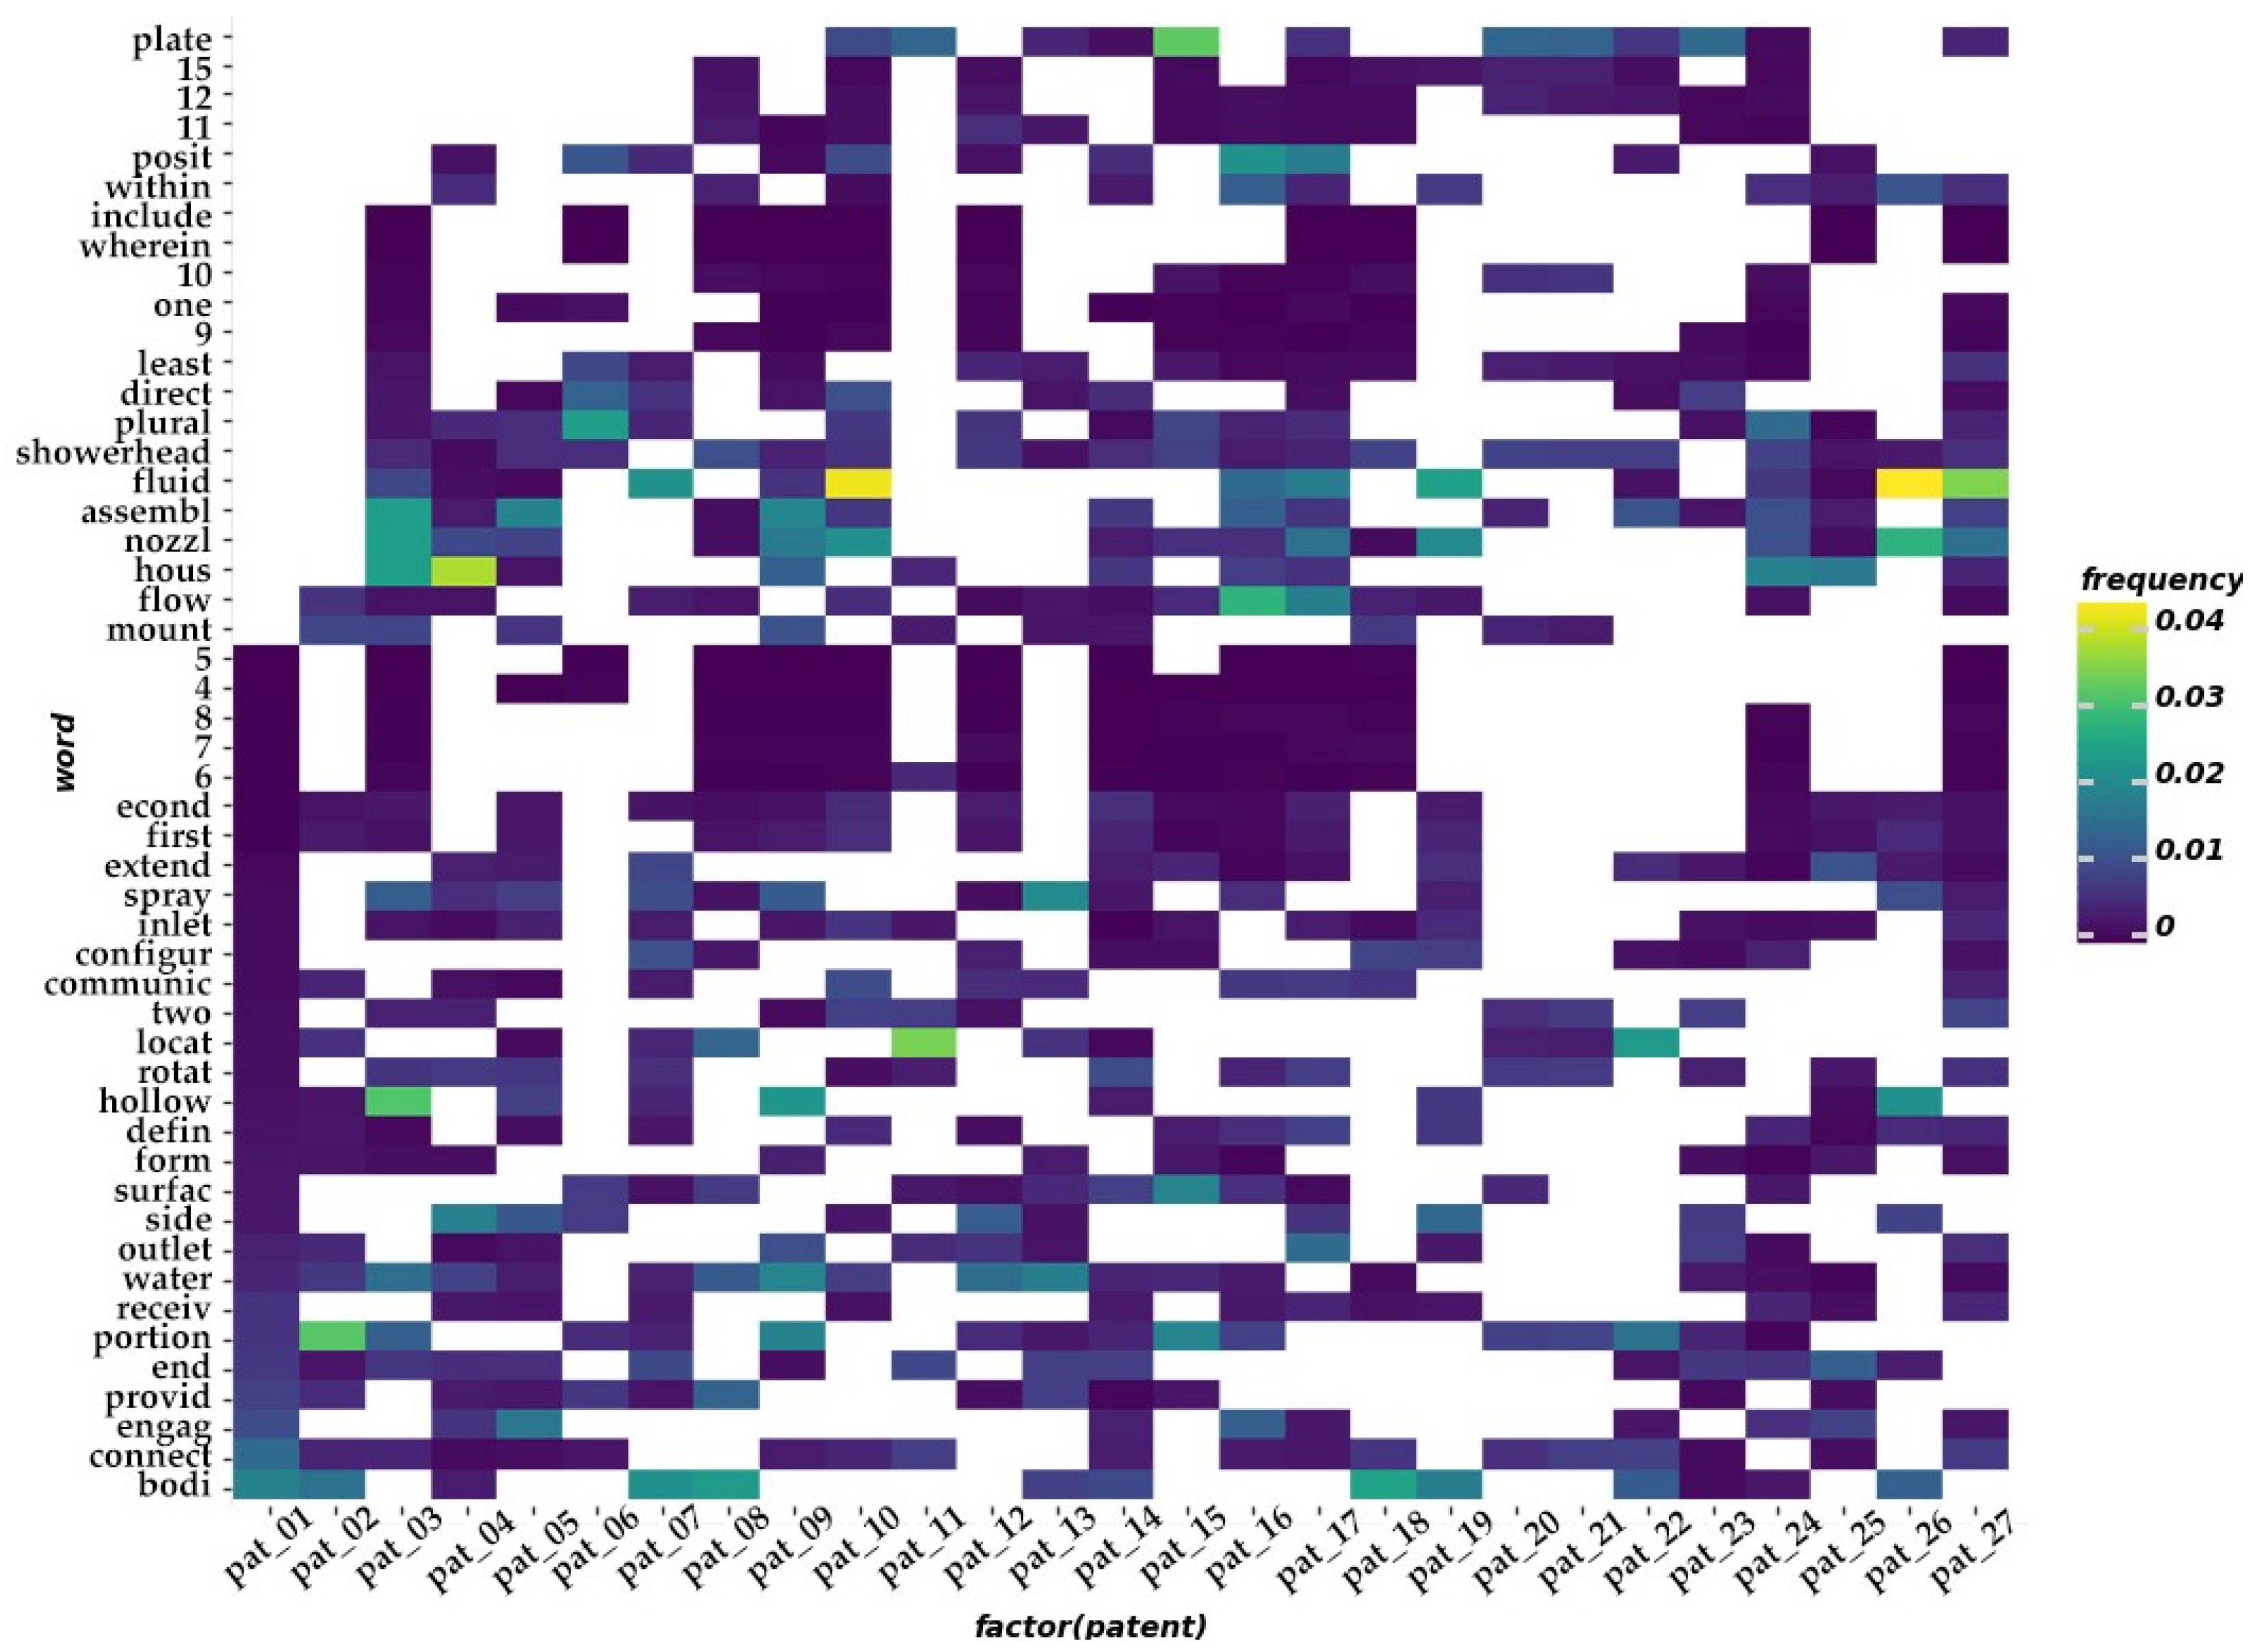
- Calculation of the TF-IDF: As you can see, TF-IDF is proportional to the number of occurrences of a word in the document and is inversely proportional to the number of occurrences of that word in the entire corpus. So, the algorithm for automatic keyword extraction is clear: the TF-IDF value is calculated for each word in the document, and then the top 100 words are taken in descending order. For visualization, words are sorted by TF-IDF value and the top 50 words are captured. Figure 3 shows a heat map of TF-IDF values for these words in some patents.
- 4.
- Build a word frequency list: Build a word frequency matrix; the length of the matrix is the number of texts, the width of the matrix is the number of words, and each group of vectors represents the frequency of words contained in each text.
- 5.
- Calculating the Cosine Similarity: Given two attribute vectors, A and B, the cosine similarity is given by the dot product and the vector length, as shown in Equation (4).
5. SAO Structure
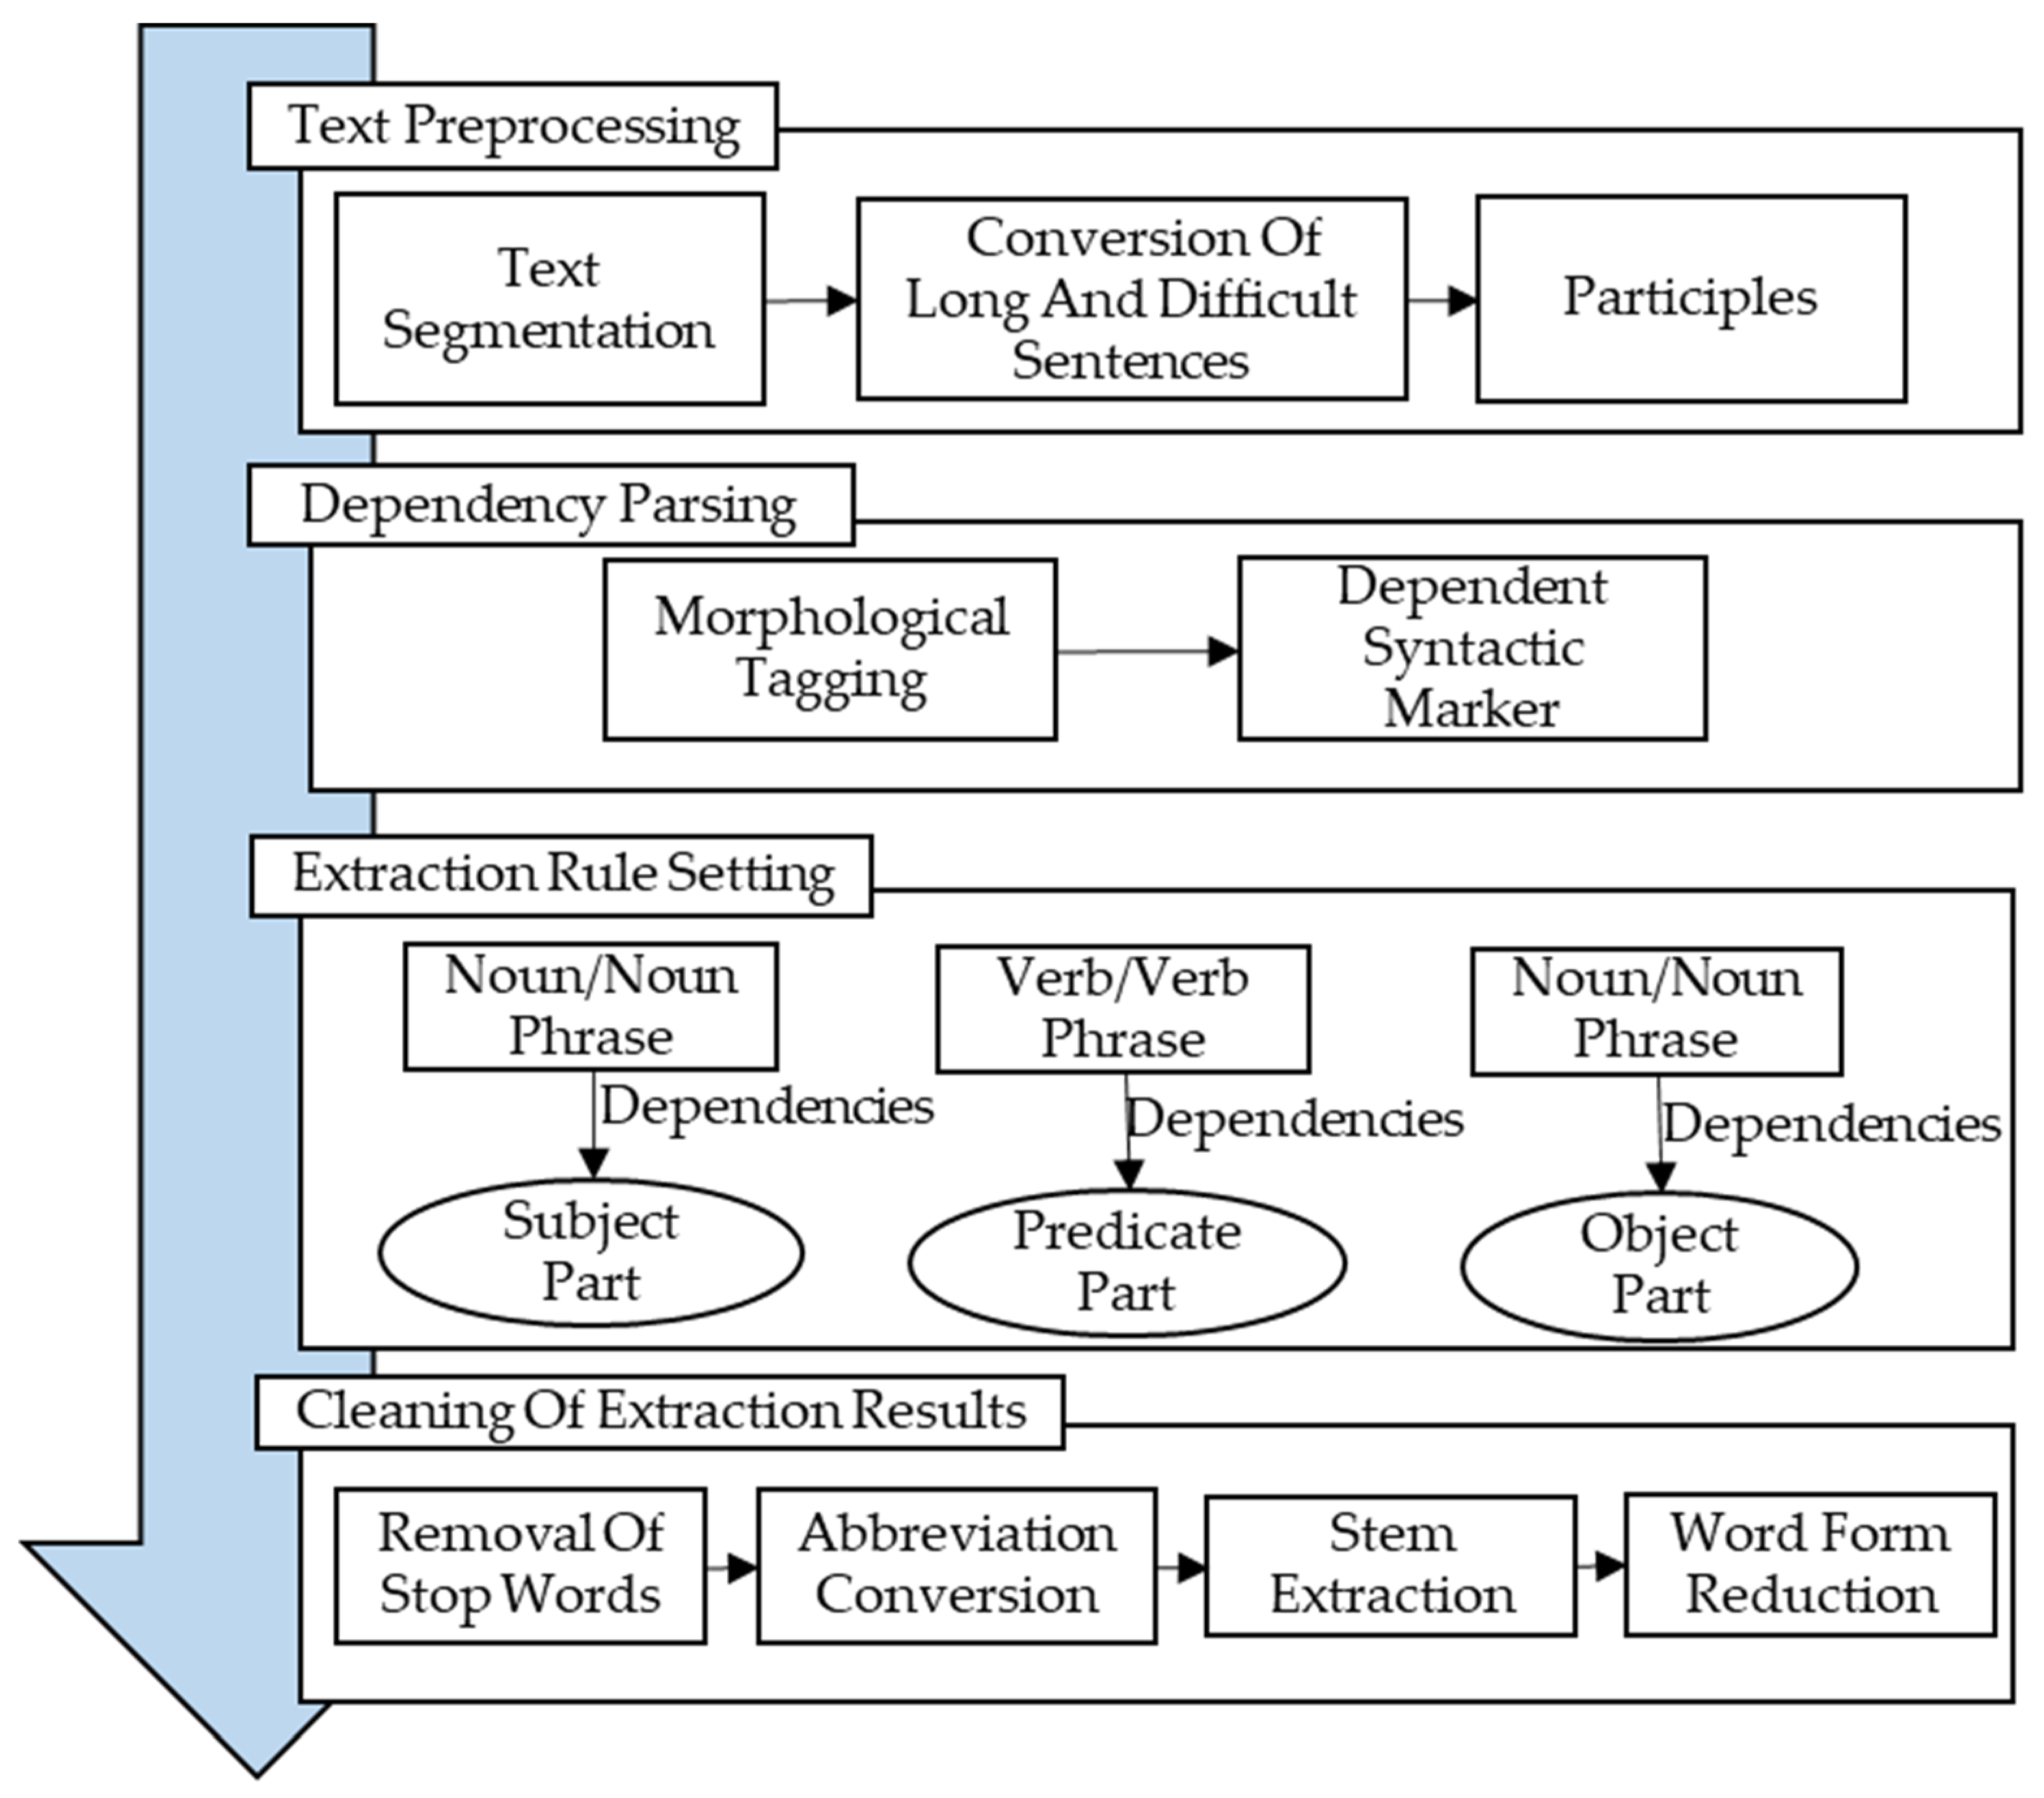
5.1. SAO Structure Extraction and Cleaning
- Segmenting the text into independent sentences.
- Dependent syntactic analysis of the sentences.
- Extraction of all SAO structures.
- Clean up the SAO structure and remove the meaningless SAO structure.
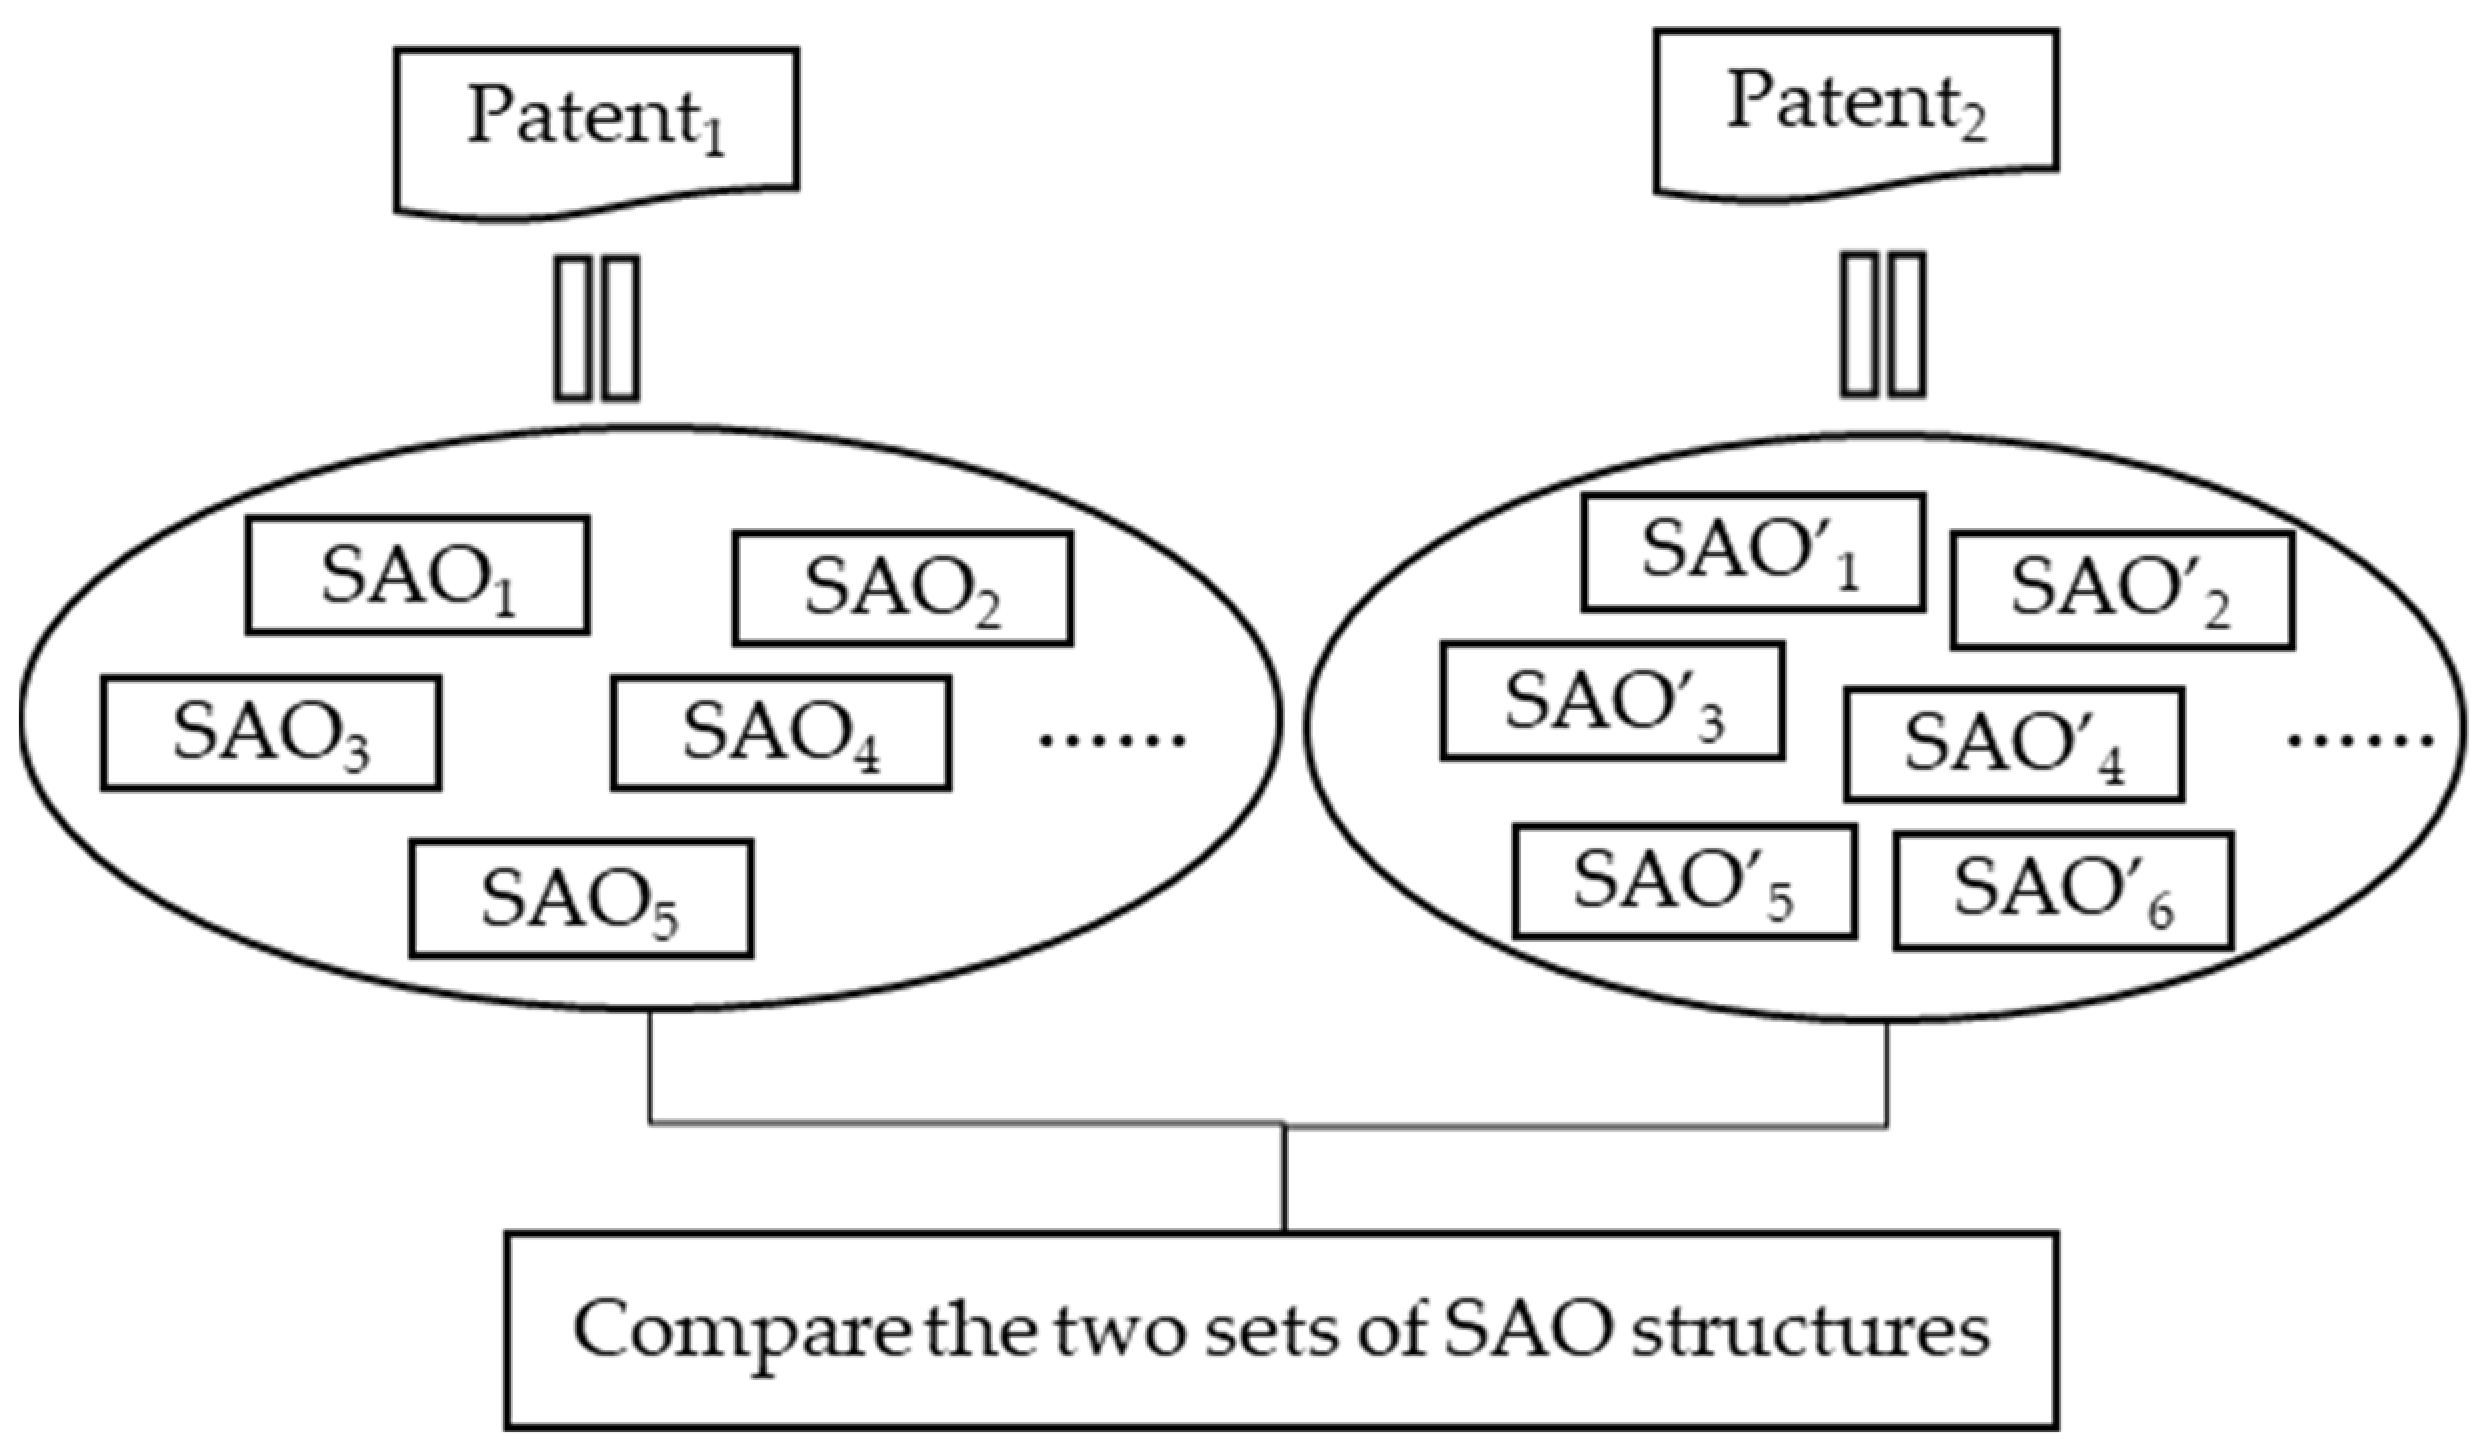
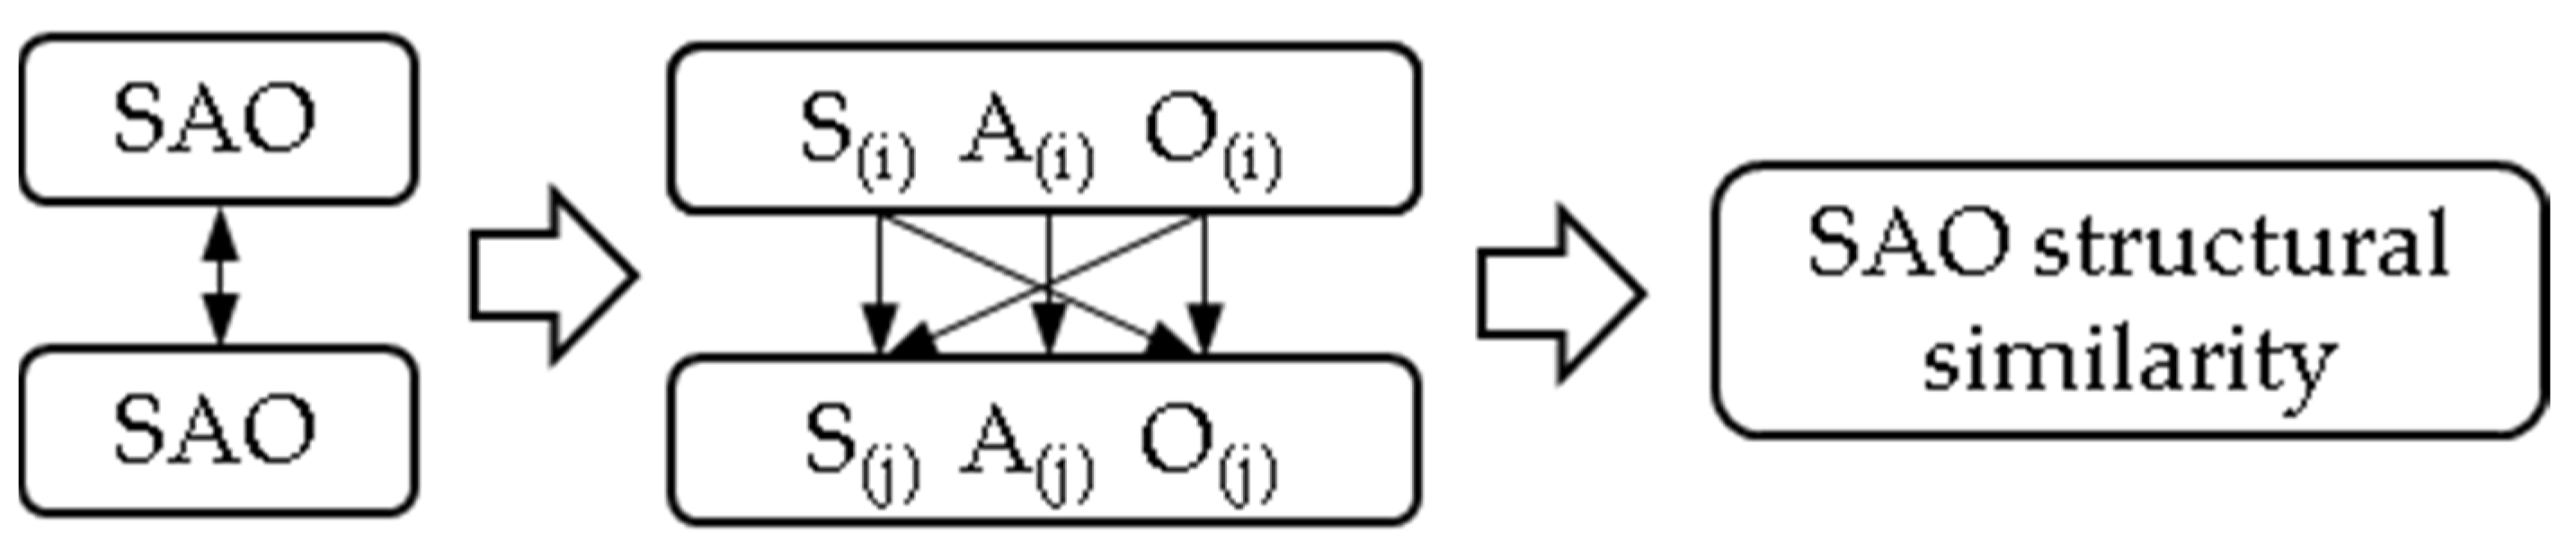
5.2. SAO Structure Semantic Similarity Calculation
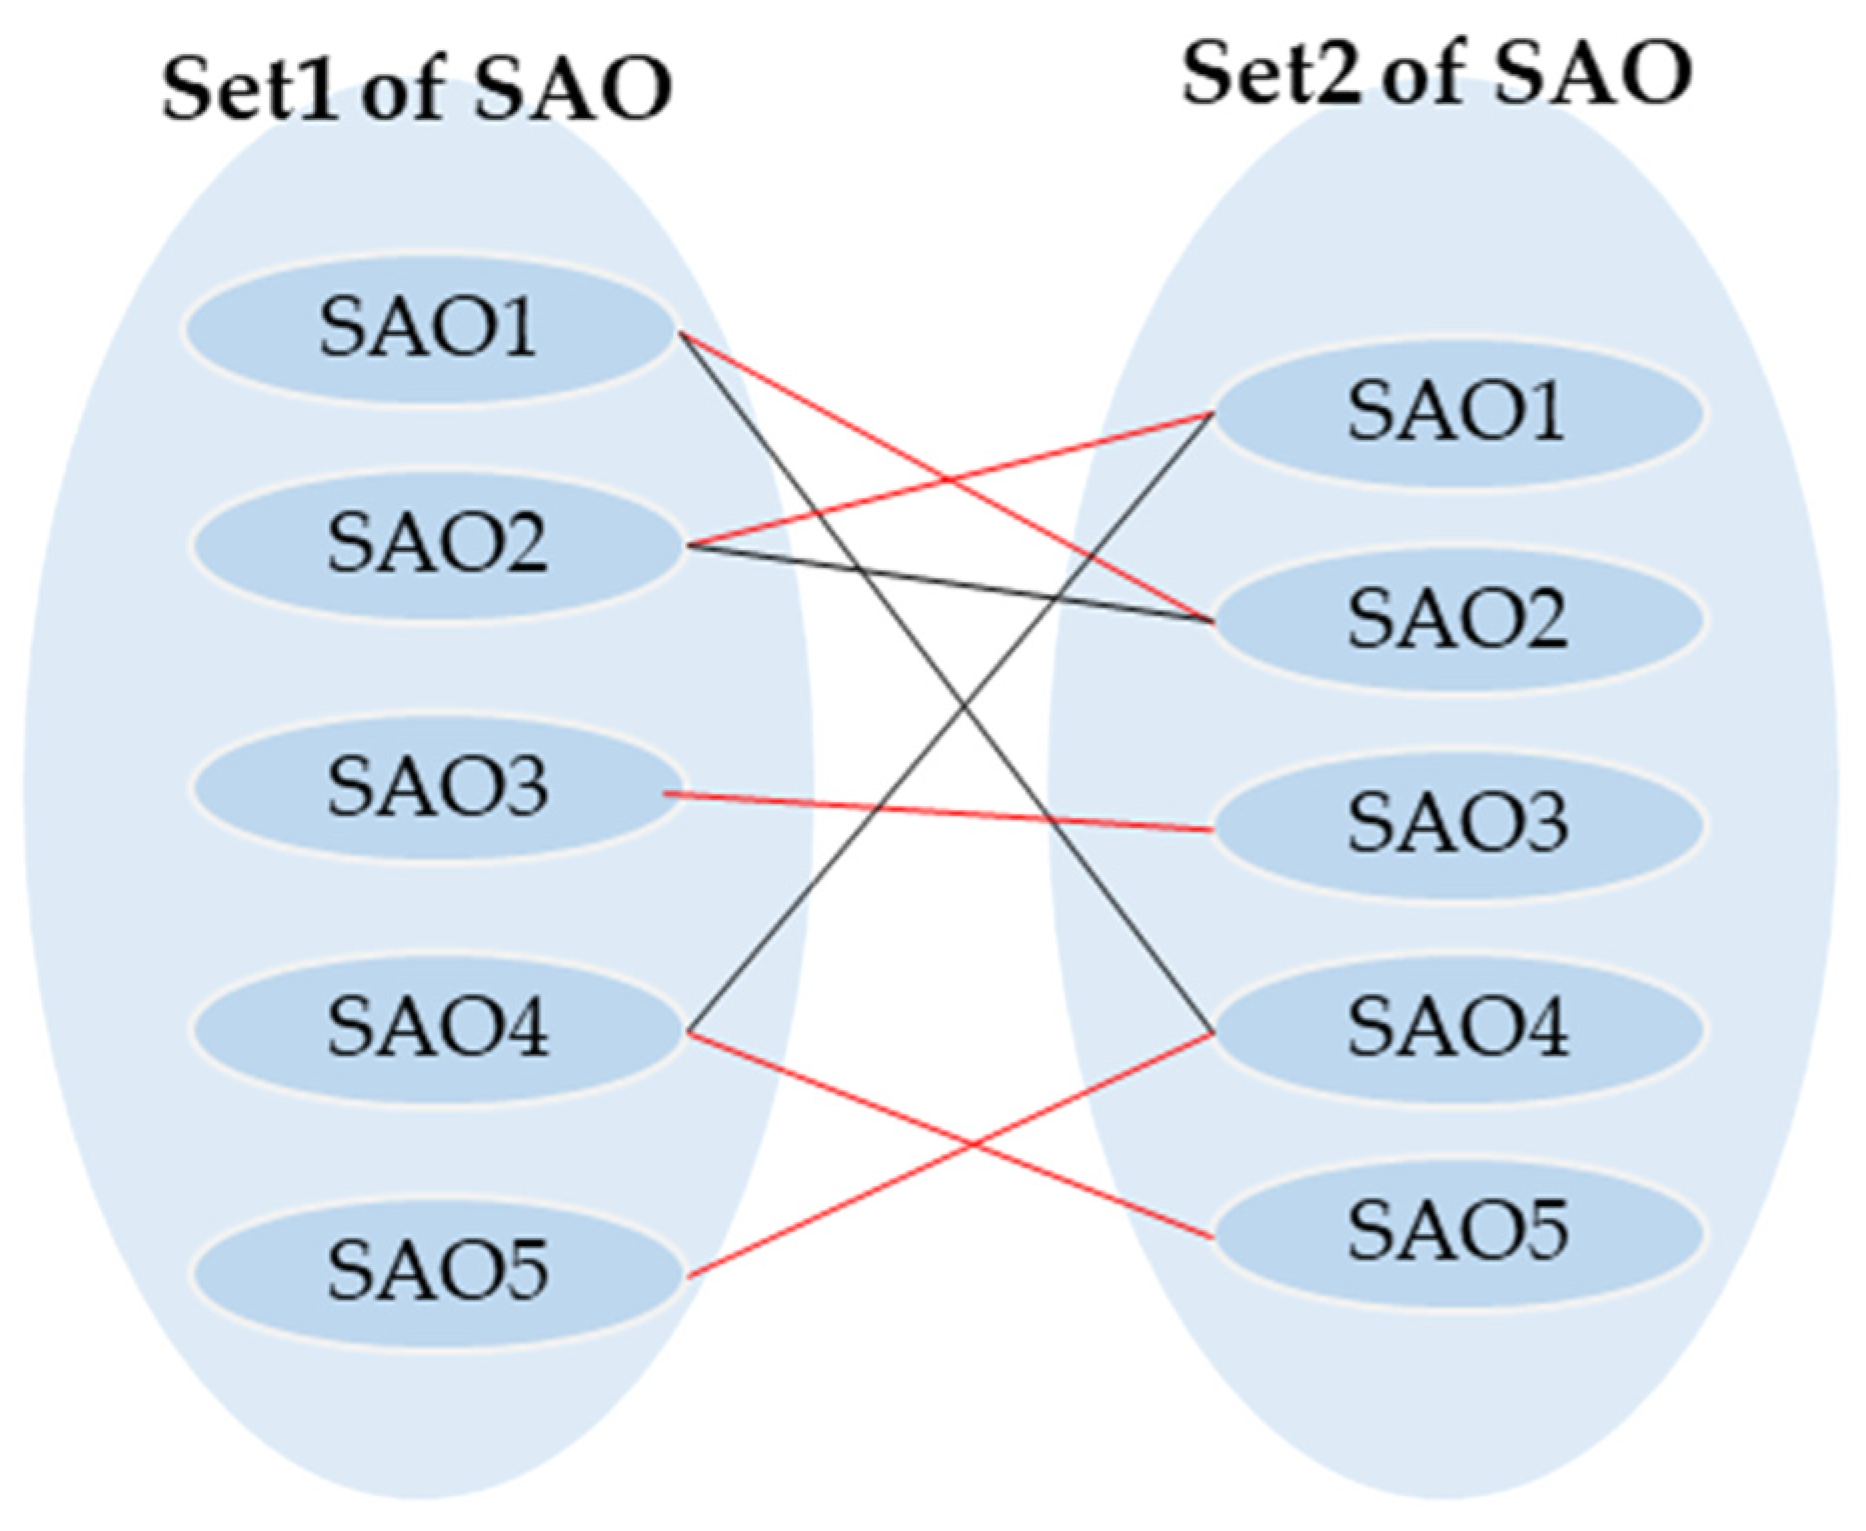
5.3. Patent Similarity Calculations
- (1)
- The match is the set of edges.
- (2)
- In this set, any two edges cannot have a common vertex.
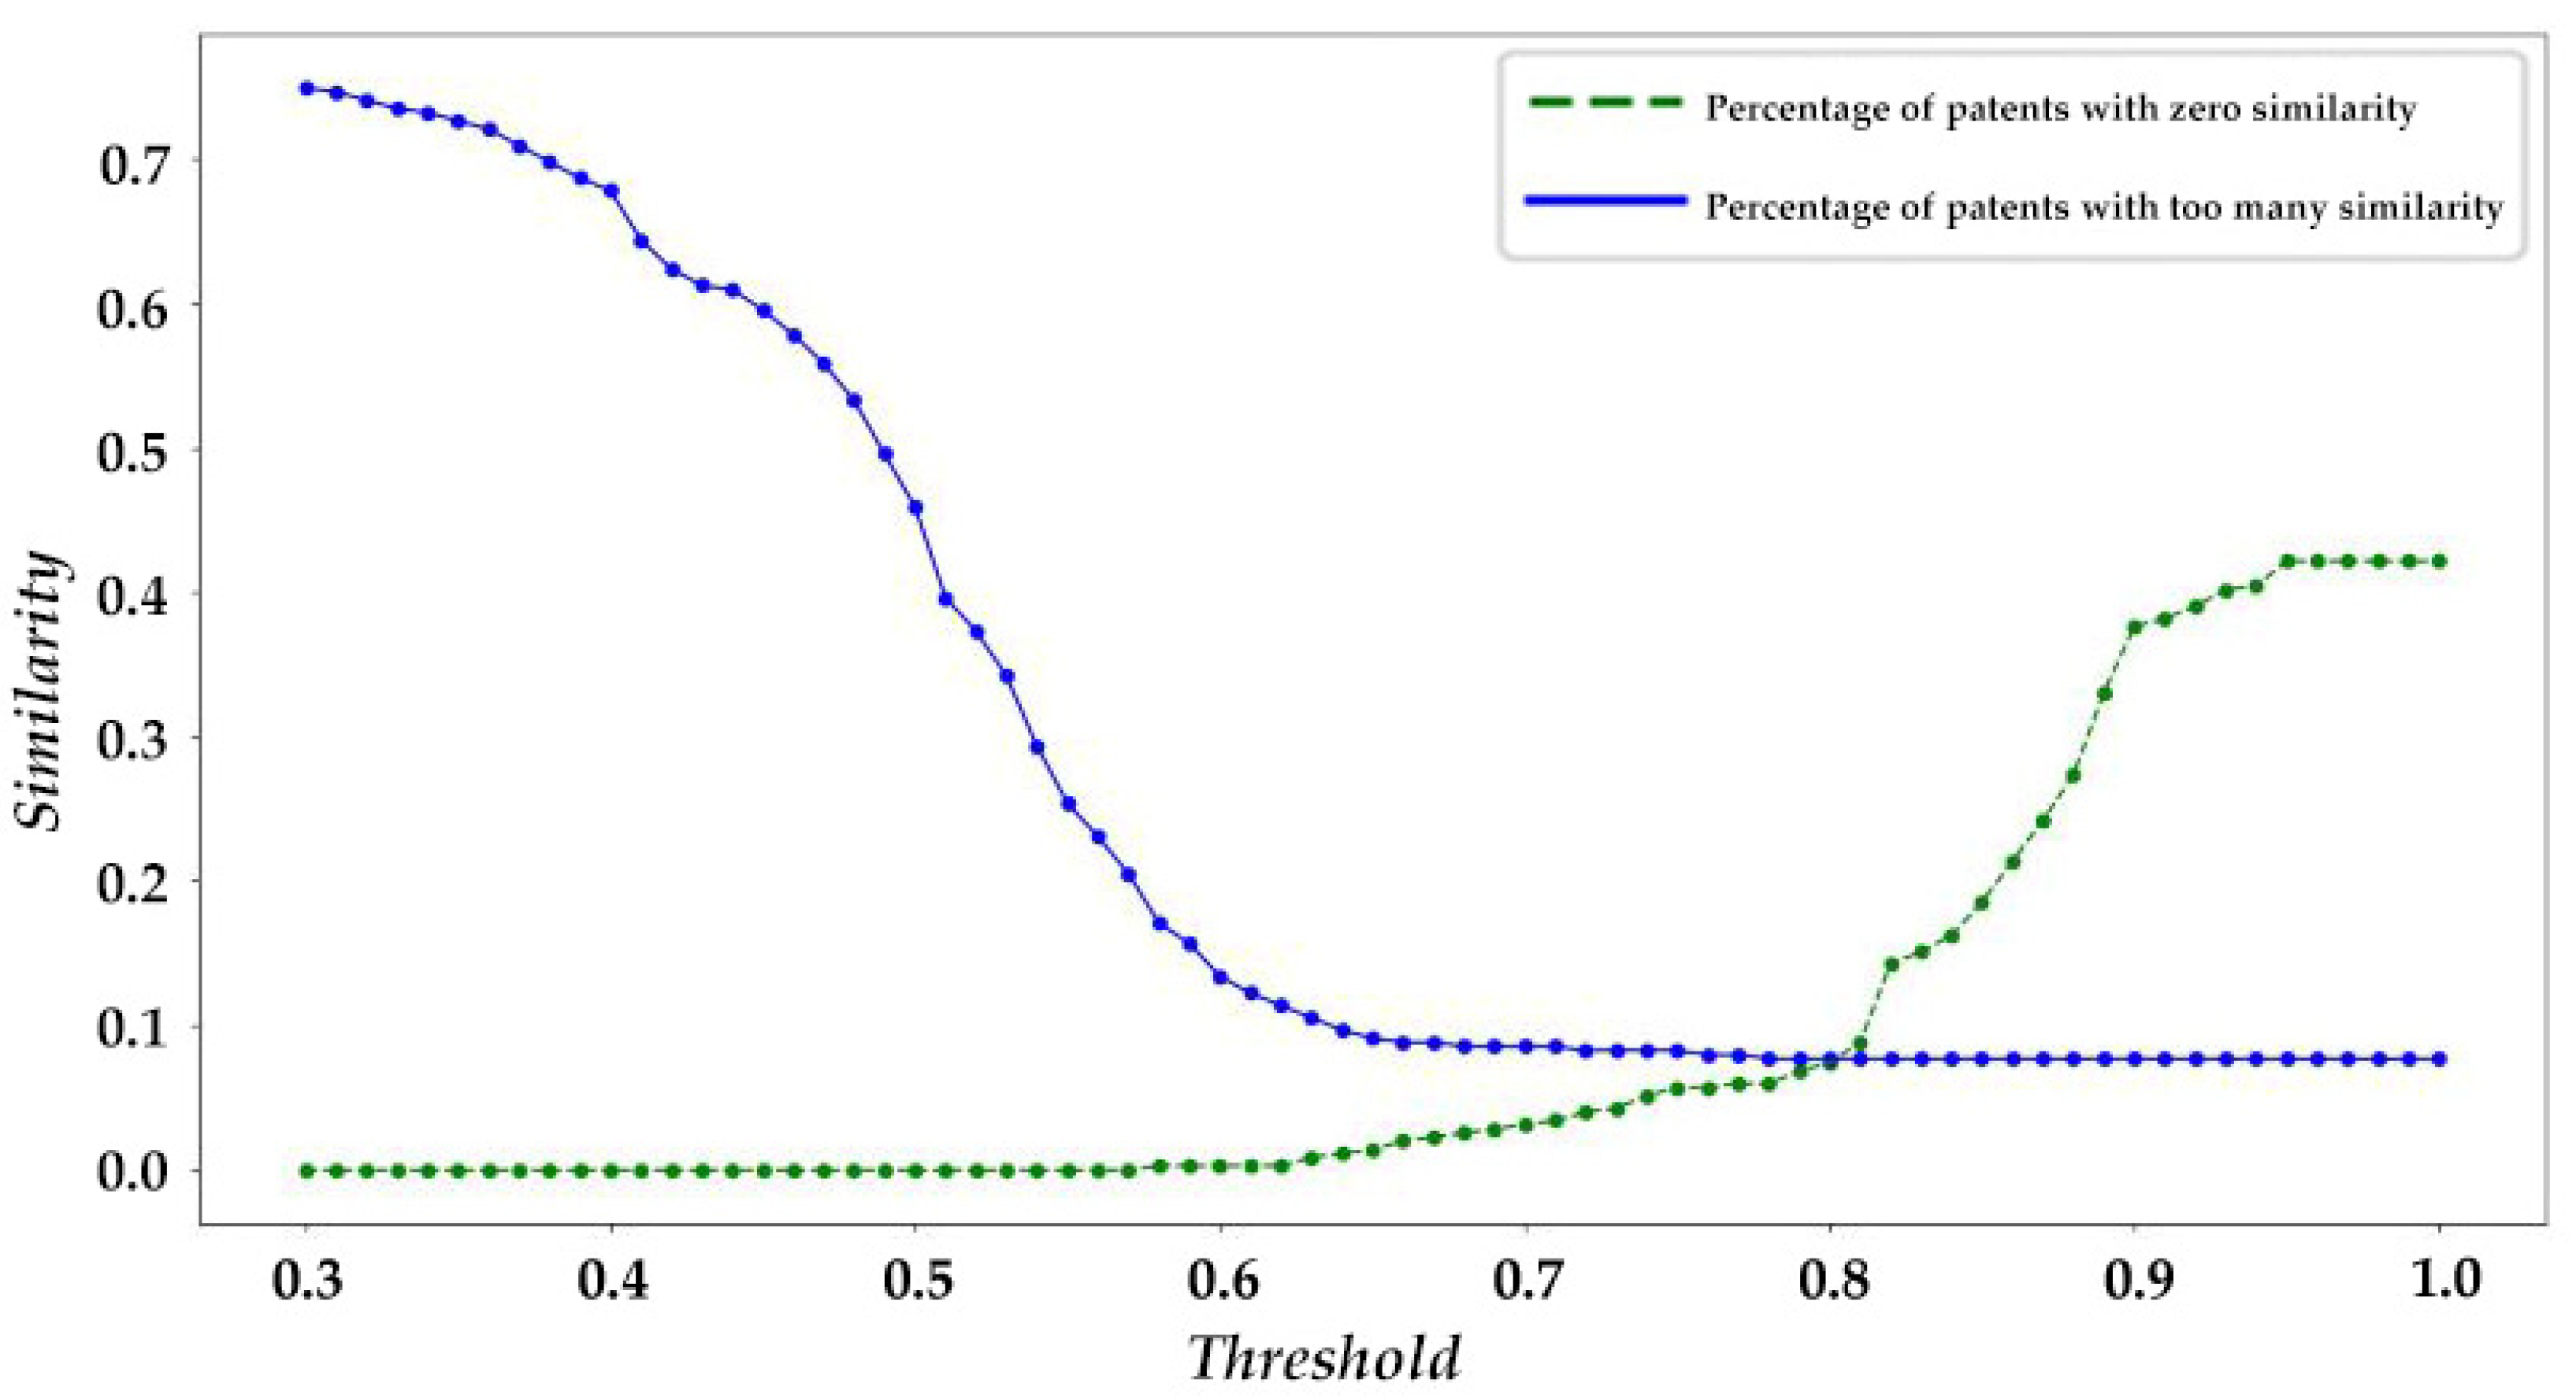
5.4. Determining the Optimal Threshold
5.5. Patent Similarity between Target Patents and Related Patents
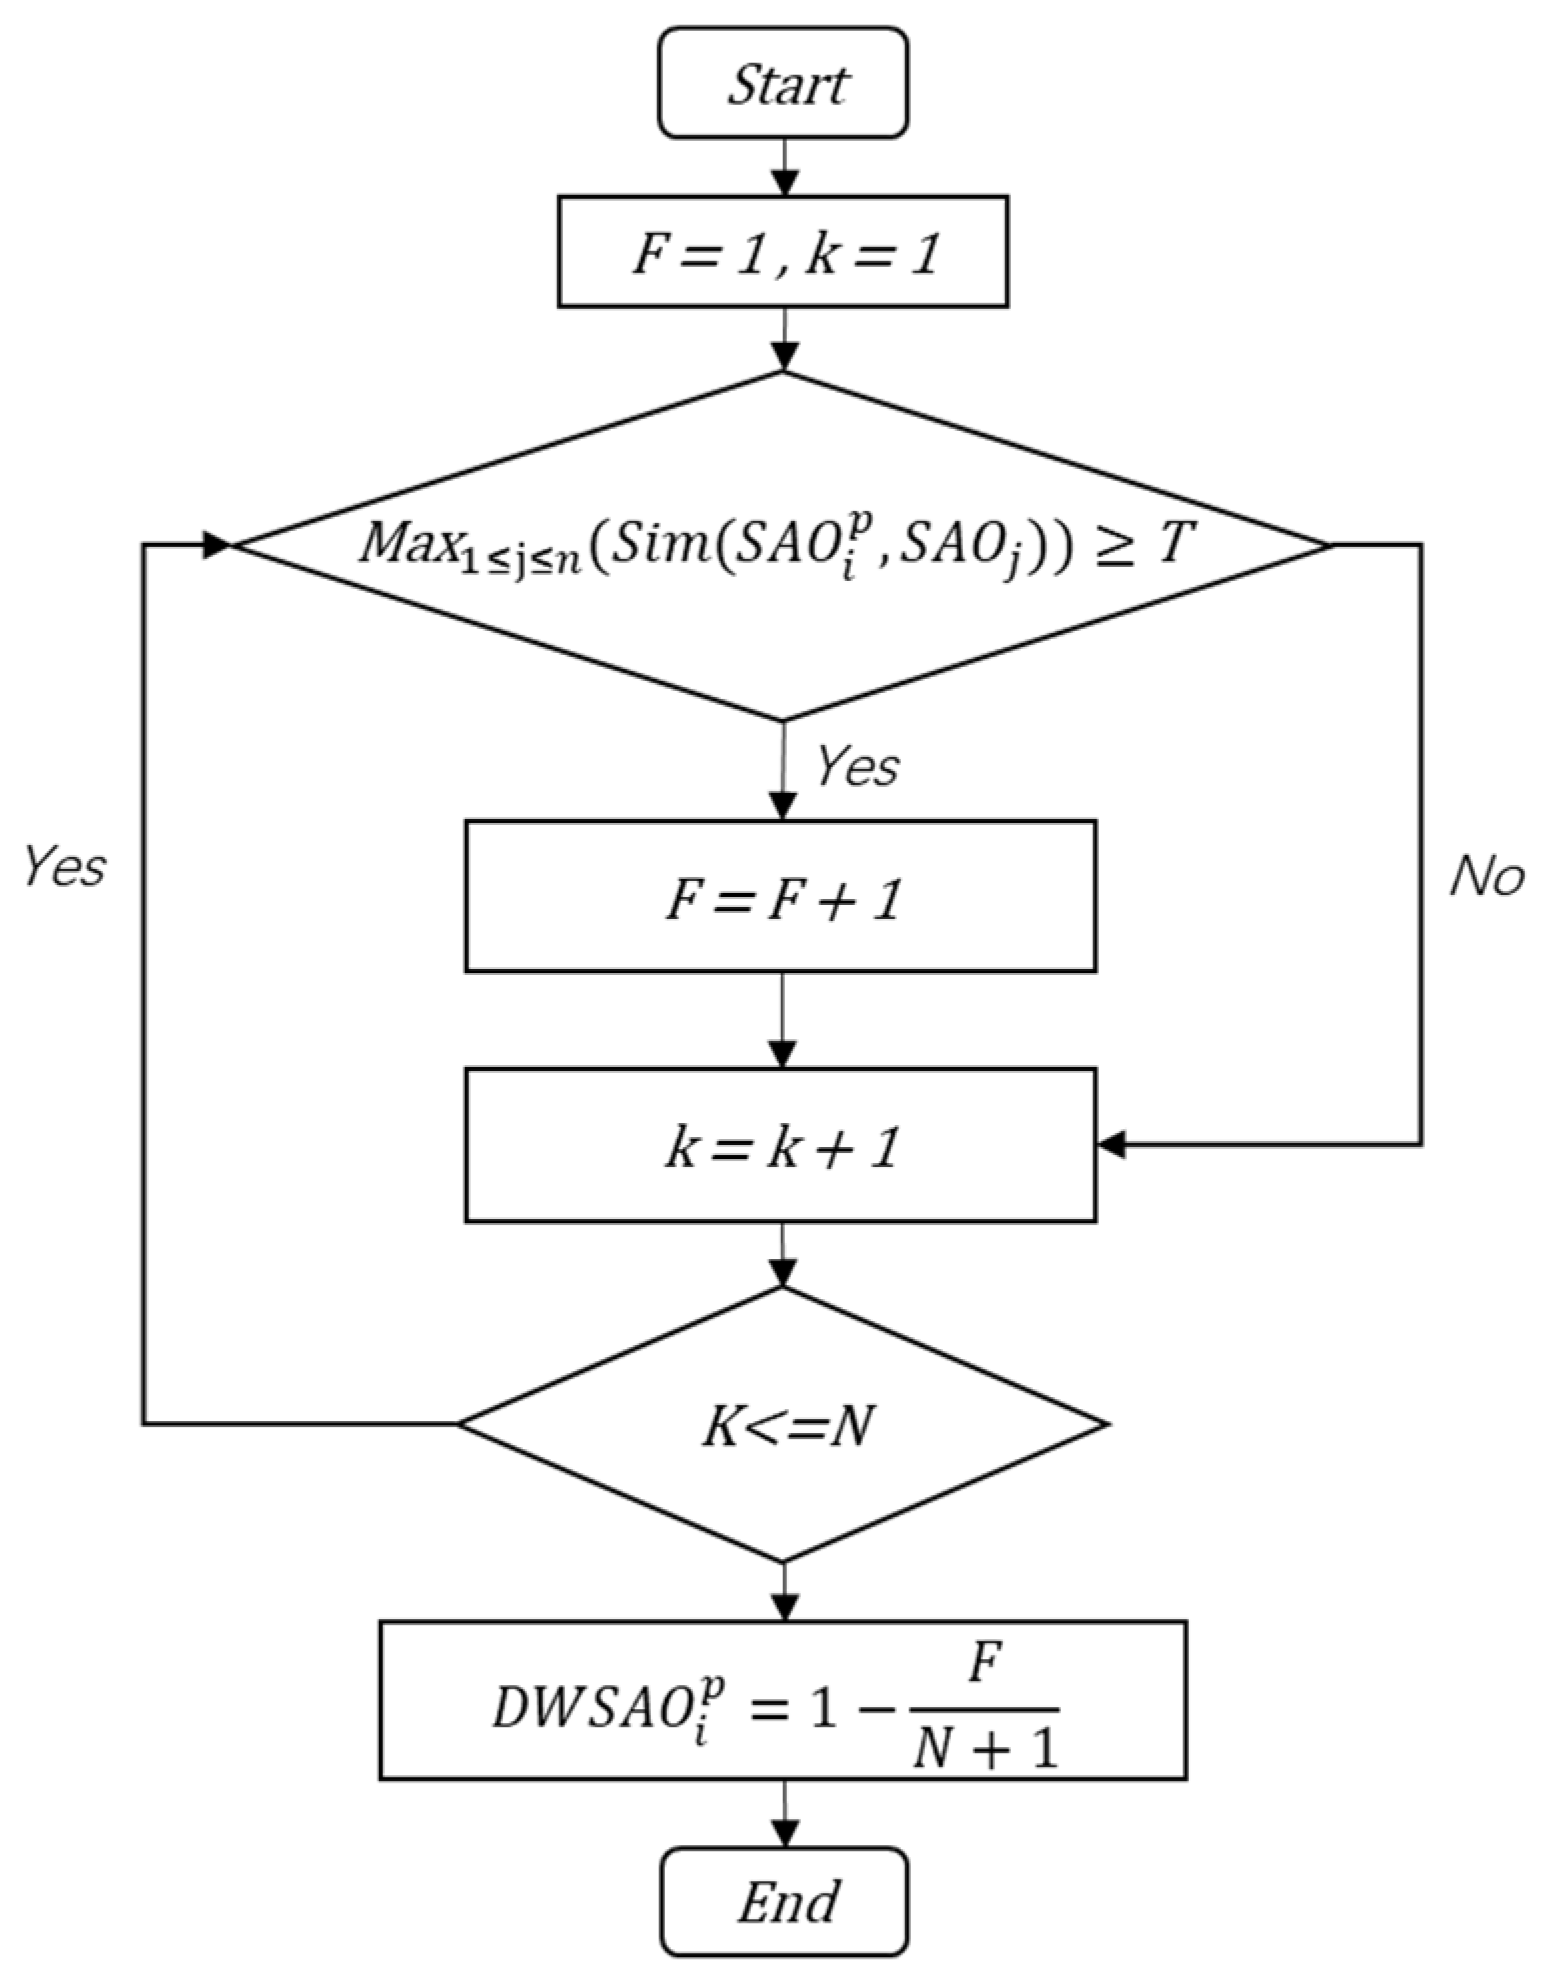
5.6. Weighted SAO structure
6. Multimodal Patent Similarity Analysis
6.1. Proof of Patent Similarity
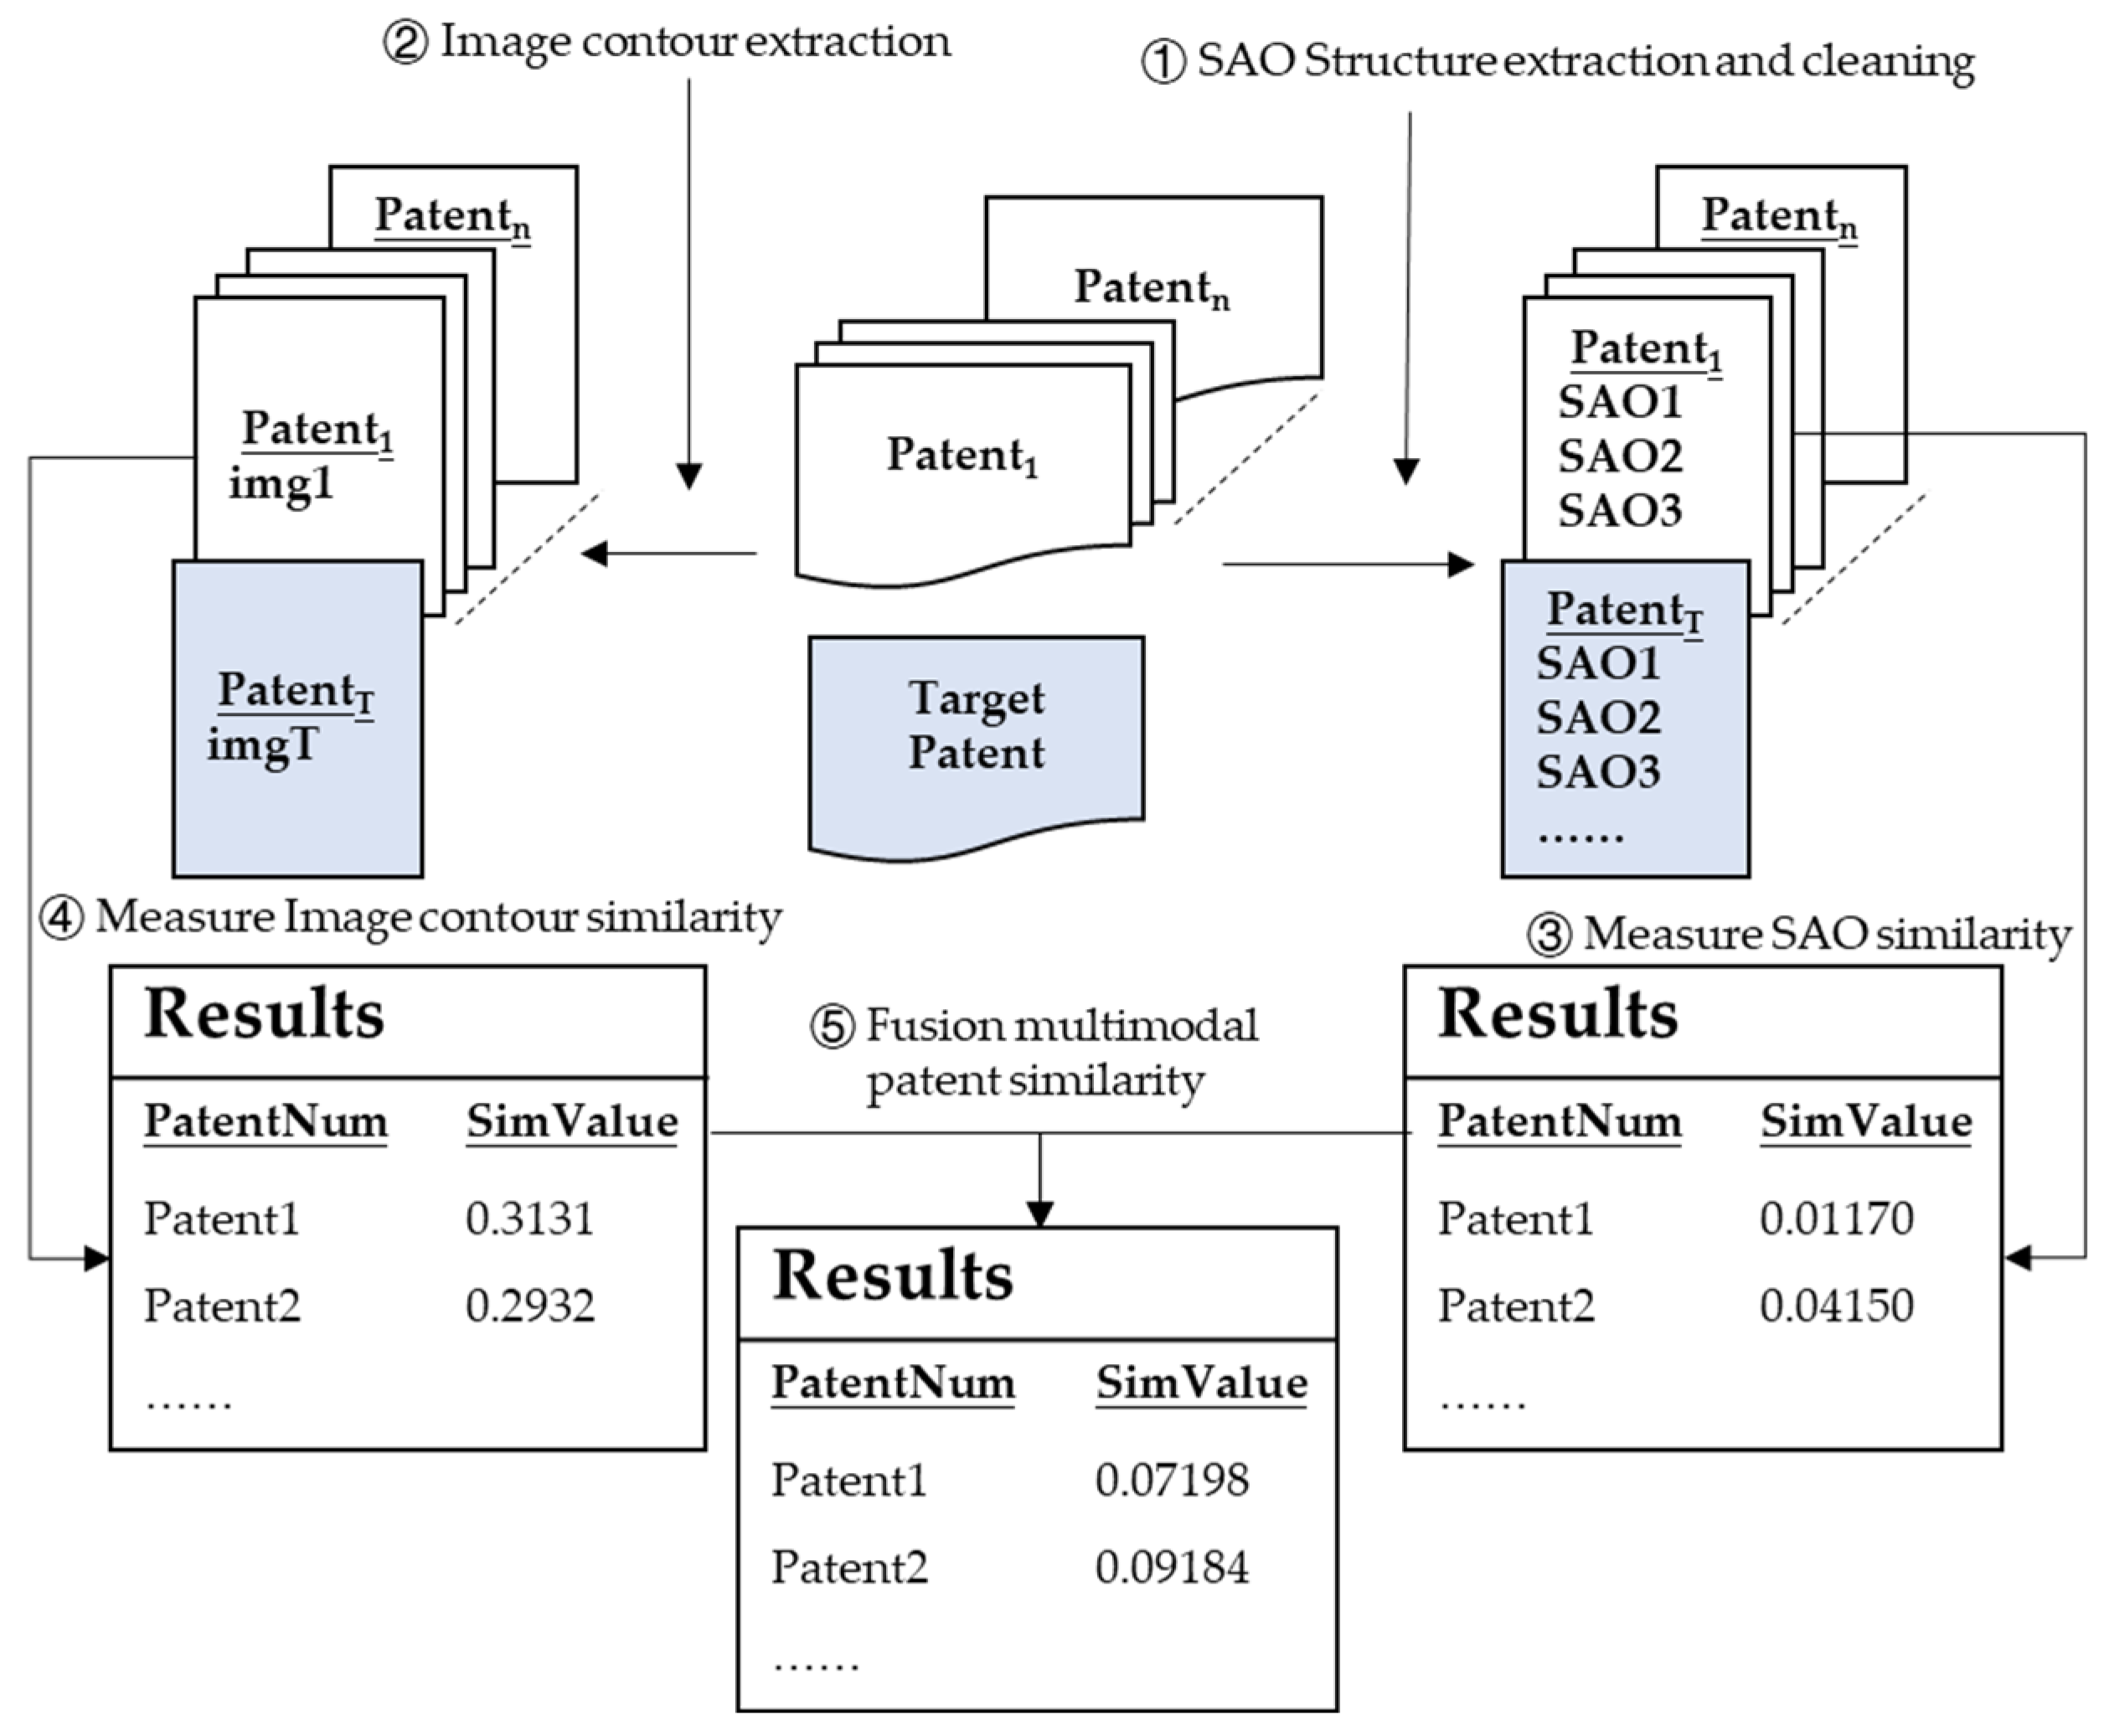
- First, the SAO structure in the patent is extracted, and the resulting SAO structure is preprocessed using standard preprocessing. Second, the patent contour is extracted from the drawings attached to the abstract in the patent to preserve internal information. At the end of the process, each patent corresponds to an SAO set and a processed patent image.
- Based on semantic information, the SAO structure similarity and the similarity between the related patents containing the SAO structure set and the target patent are calculated. Each patent contains an SAO structure set, and the similarity of the SAO set is obtained to indicate the similarity of the patent, and the Hungarian algorithm is applied to obtain the corresponding similarity of the SAO structure set.
- Calculate the similarity of image features between related patents and target patents, detect the contour of the patent image, reconstruct the contour map using Fourier descriptors, retain the image within the contour, and calculate image similarity using the mutual information method. Finally, combine the weighting of patent text similarity to obtain the overall patent similarity.
- The TF-IDF method, the SAO structure method, the DWSAO method, and the Sentence Bidirectional Encoder Representations from Transformers (SBERT) method are used to calculate patent similarity between the target patent and related patents and to compare the accuracy of different methods.
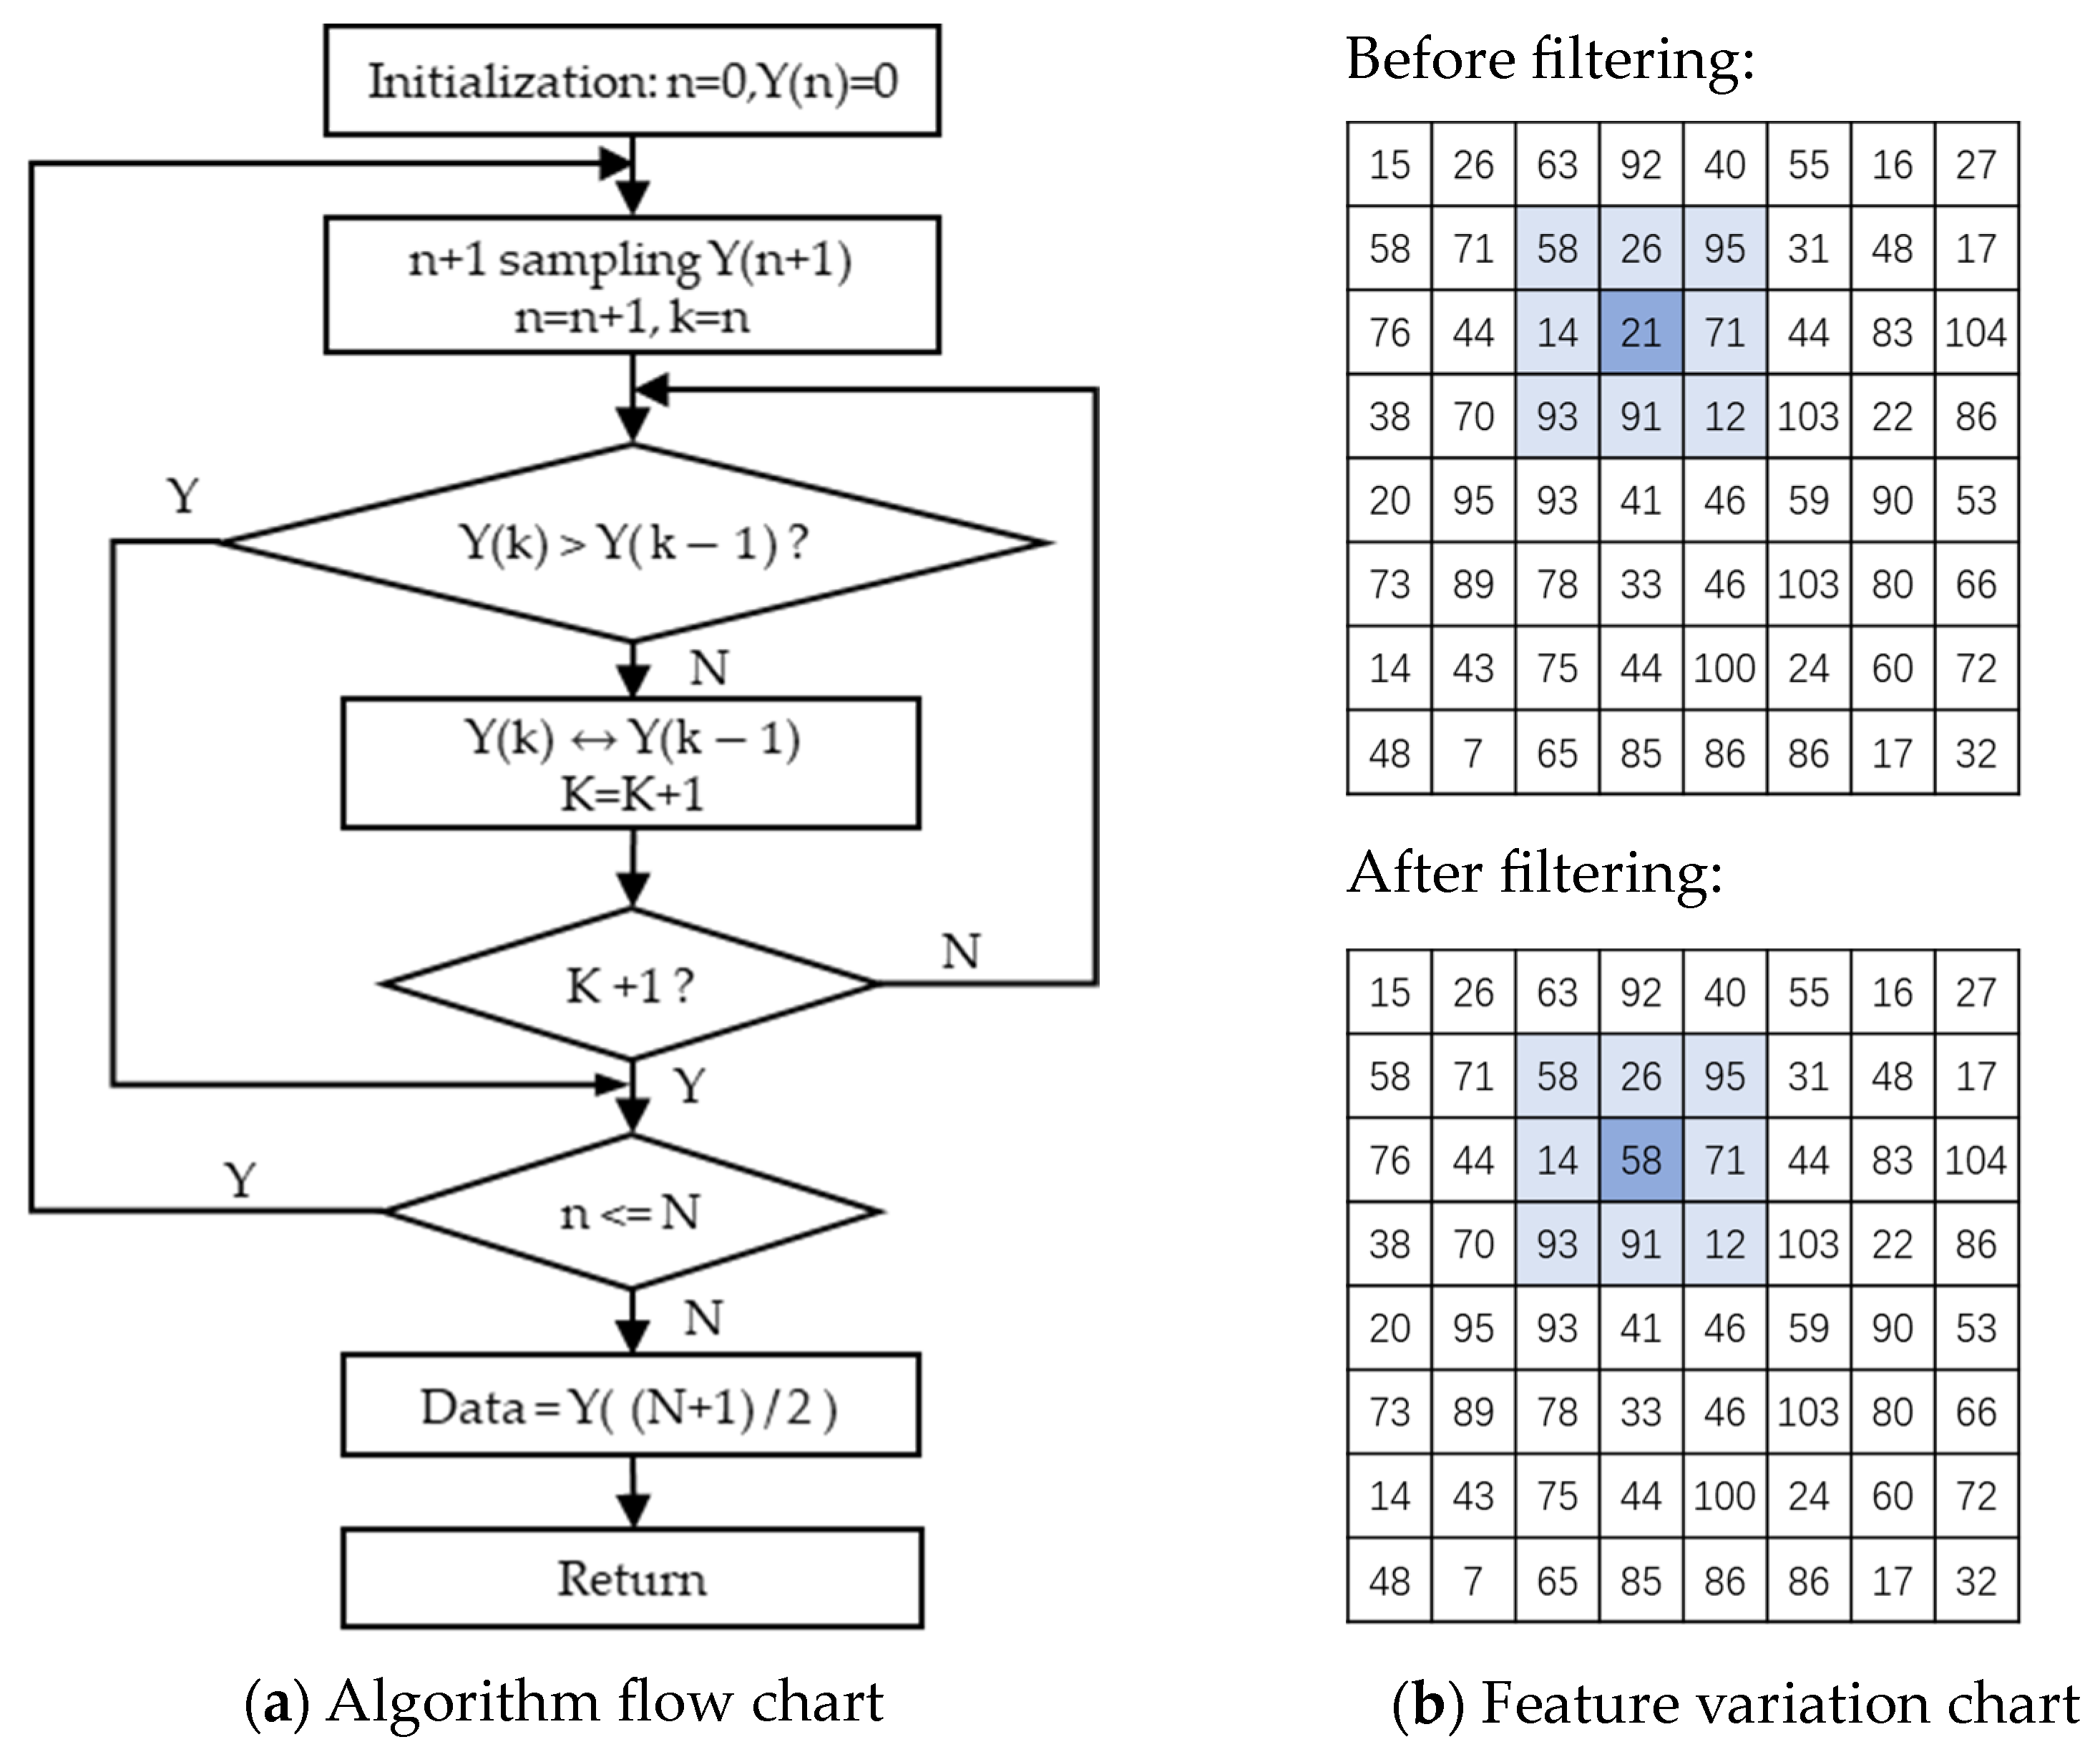
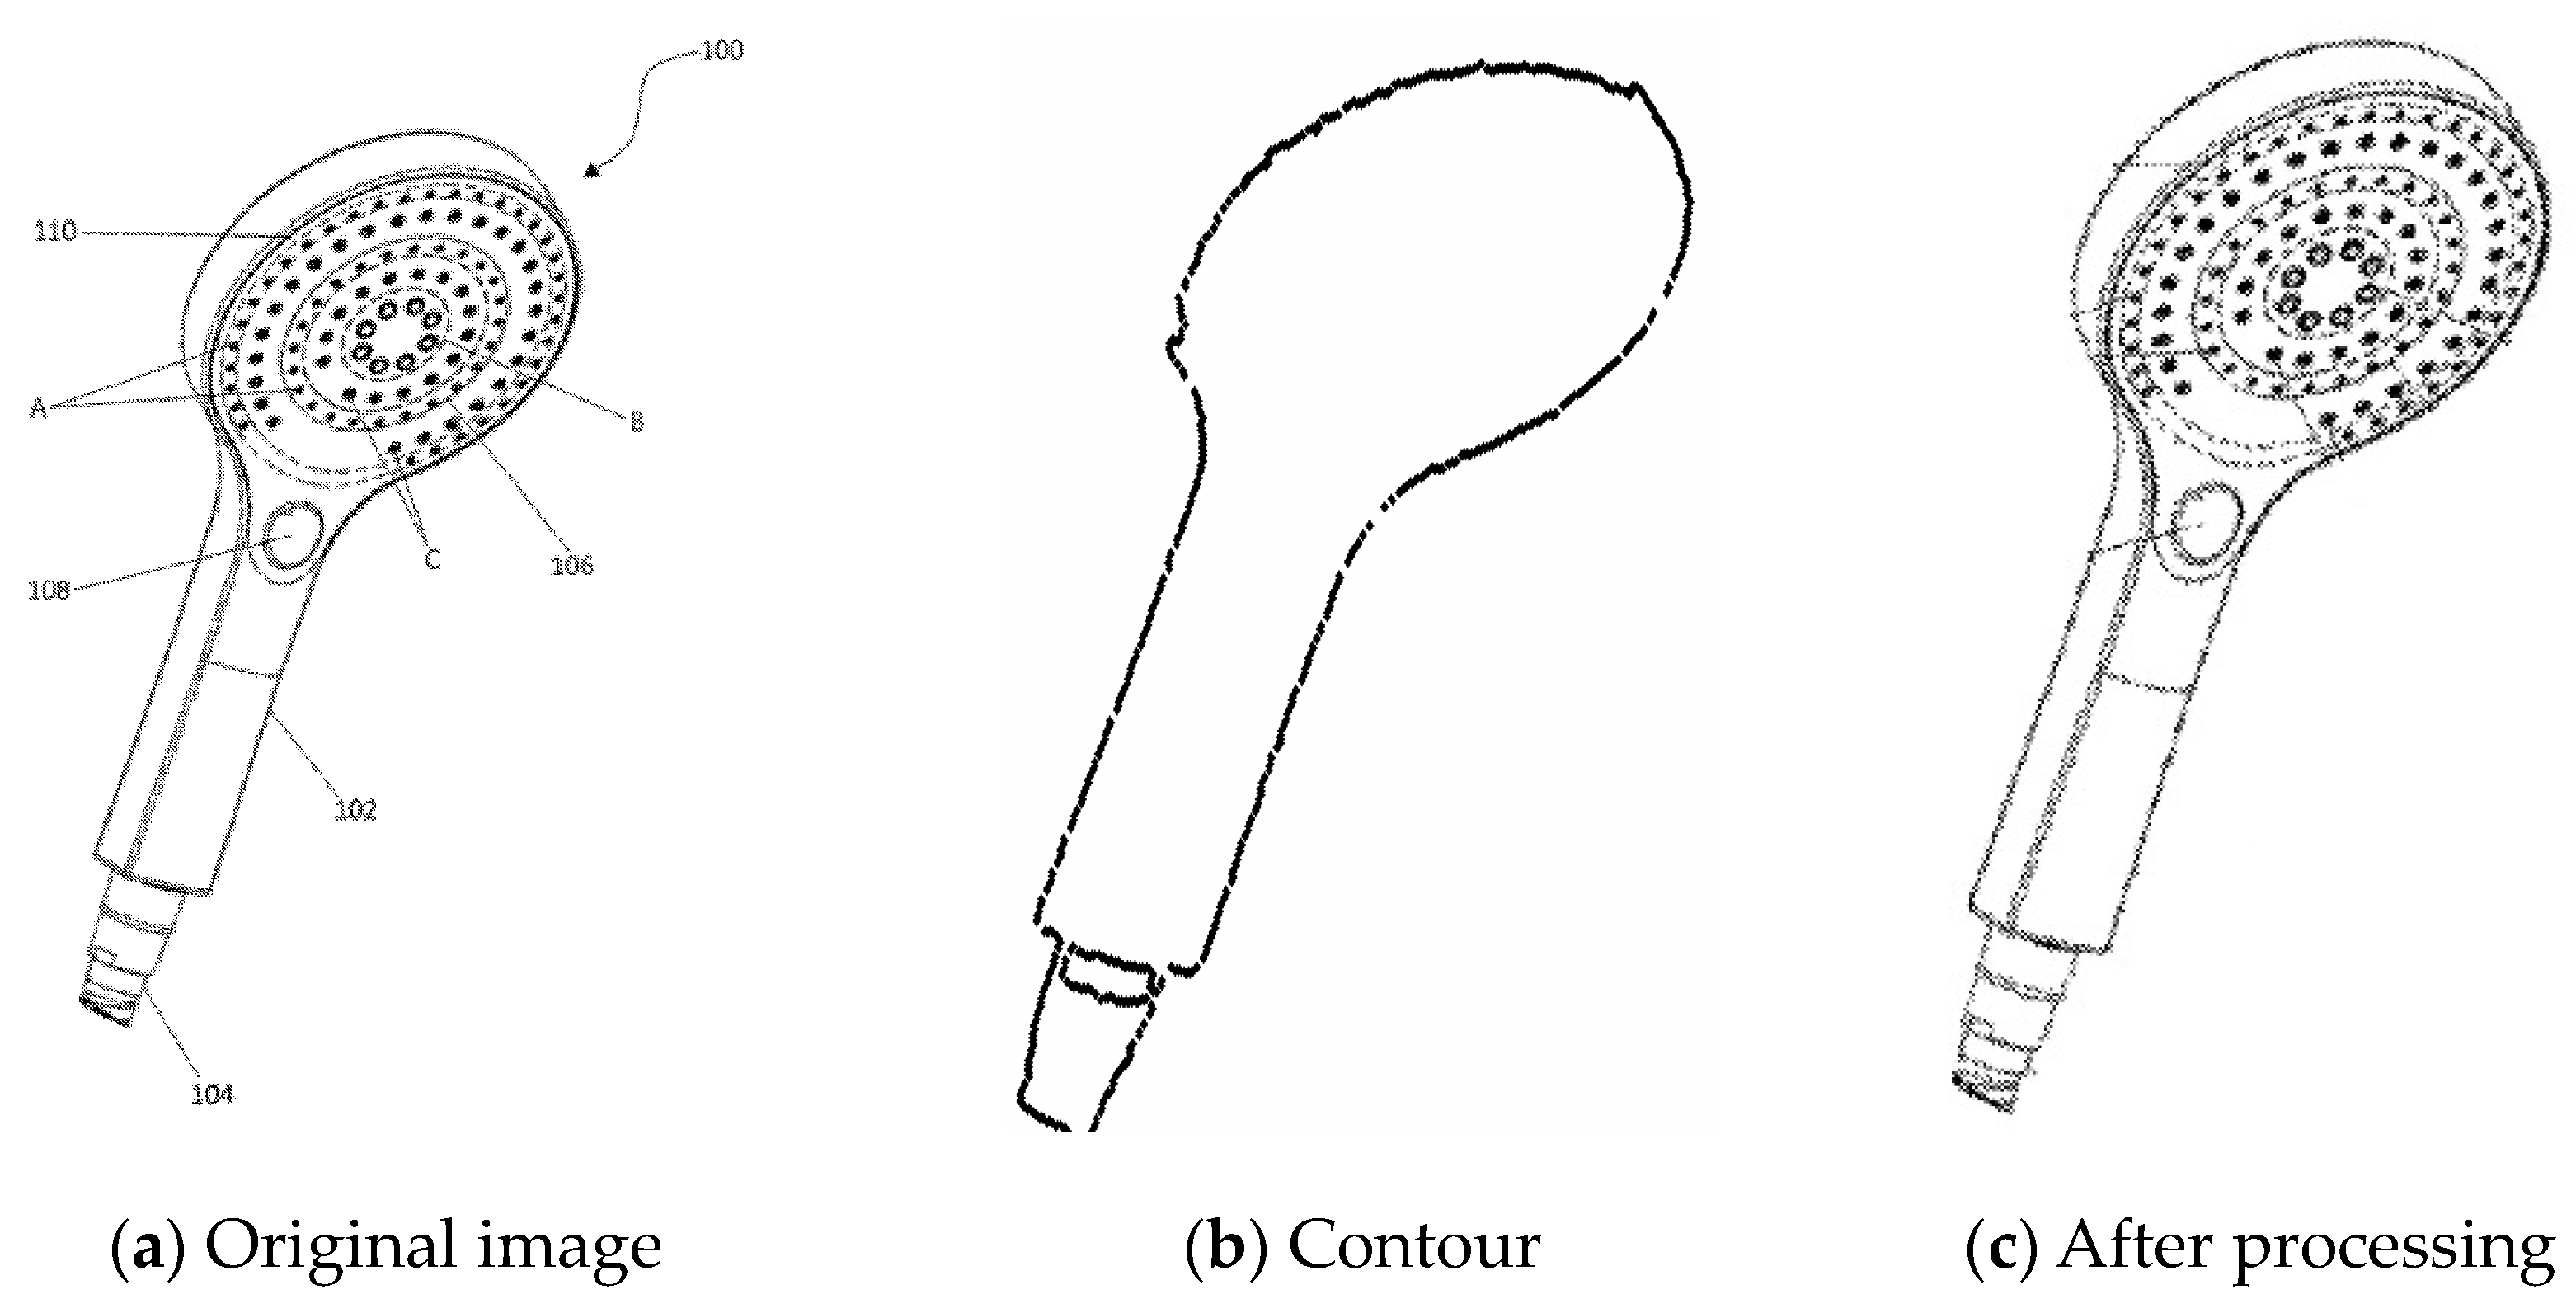
6.2. Contour Extraction
6.3. Threshold Selected
6.4. Patent Similarity between Target Patents and Related Patents
7. Analysis and Validation of Results
8. Discussion and Conclusions
Author Contributions
Funding
Data Availability Statement
Conflicts of Interest
References
- Asche, G.E. “80% of technical information found only in patents”—Is there proof of this? World Pat. Inf. 2017, 48, 16–28. [Google Scholar] [CrossRef]
- Zhai, C.Y.; Du, D.B.; Shi, W.T. Spatiotemporal Evolution and Determinants of the Geography of Chinese Patents Abroad: A Case Study of Strategic Emerging Industries. Systems 2023, 11, 33. [Google Scholar] [CrossRef]
- Ma, H.K. The Dynamics of China’s Collaborative Innovation Network in Agricultural Biotechnology: A Spatial-Topological Perspective. Systems 2023, 11, 73. [Google Scholar] [CrossRef]
- International Patent Applications Defy 2022 Challenges, Continue Upward Trend. Available online: https://www.wipo.int/pressroom/en/articles/2023/article_0002.html (accessed on 14 May 2023).
- Global Innovation Index 2022. Available online: https://www.wipo.int/global_innovation_index/en/2022/ (accessed on 7 March 2023).
- WIPO: China’s Global Ranking in Innovation Steadily Improves. Available online: https://baijiahao.baidu.com/s?id=1745312150286743555&wfr=spider&for=pc (accessed on 20 March 2023).
- Arts, S.; Cassiman, B.; Gomez, J.C. Text matching to measure patent similarity. Strat. Manag. J. 2018, 39, 62–84. [Google Scholar] [CrossRef] [Green Version]
- Jeong, C.; Kim, K. Creating patents on the new technology using analogy-based patent mining. Expert Syst. Appl. 2014, 41, 3605–3614. [Google Scholar] [CrossRef]
- Zhu, D.M. Bibliometric analysis of patent infringement retrieval model based on self-organizing map neural network algorithm. Libr. Hi Tech 2020, 38, 479–491. [Google Scholar] [CrossRef]
- Lee, S.; Yoon, B.; Park, Y. An approach to discovering new technology opportunities: Keyword-based patent map approach. Technovation 2009, 29, 481–497. [Google Scholar] [CrossRef]
- Yoon, B.; Yoon, C.; Park, Y. On the development and application of a self-organizing feature map-based patent map. R&D Manag. 2002, 32, 291–300. [Google Scholar]
- Kuei-Kuei, L.; Shiao-Jun, W. Using the patent co-citation approach to establish a new patent classification system. Inform. Process. Manag. 2005, 41, 313–330. [Google Scholar]
- Magerman, T.; Van Looy, B.; Song, X. Exploring the feasibility and accuracy of Latent Semantic Analysis based text mining techniques to detect similarity between patent documents and scientific publications. Scientometrics 2010, 82, 289–306. [Google Scholar] [CrossRef]
- Yoon, B.; Kim, S.; Kim, S.; Seol, H. Doc2vec-based link prediction approach using SAO structures: Application to patent network. Scientometrics 2022, 127, 5385–5414. [Google Scholar] [CrossRef]
- Le, Q.; Mikolov, T. Distributed representations of sentences and documents. In Proceedings of the 31st International Conference on International Conference on Machine Learning (PMLR), Beijing, China, 21 June 2014. [Google Scholar]
- Mikolov, T.; Chen, K.; Corrado, G.; Dean, J. Efficient Estimation of Word Representations in Vector Space. In Proceedings of the International Conference on Learning Representations (ICLR), Scottsdale, AZ, USA, 2–4 May 2013. [Google Scholar]
- Kim, S.; Yoon, B. Patent infringement analysis using a text mining technique based on SAO structure. Comput. Ind. 2021, 125, 103379. [Google Scholar] [CrossRef]
- Jang, H.J.; Park, S.J.; Yoon, B. Exploring Technology Opportunities Based on User Needs: Application of Opinion Mining and SAO Analysis. Eng. Manag. J. 2022, 1–14. [Google Scholar] [CrossRef]
- Park, H.; Yoon, J.; Kim, K. Identifying patent infringement using SAO based semantic technological similarities. Scientometrics 2012, 90, 515–529. [Google Scholar] [CrossRef]
- Li, X.M.; Wang, C.; Zhang, X.F.; Sun, W. Generic SAO Similarity Measure via Extended Sorensen-Dice Index. IEEE Access 2020, 8, 66538–66552. [Google Scholar] [CrossRef]
- Dice, L.R. Measures of the Amount of Ecologic Association Between Species. Ecology 1945, 26, 297–302. [Google Scholar] [CrossRef]
- Sørensen, T.A. A method of establishing groups of equal amplitude in plant sociology based on similarity of species and its application to analyses of the vegetation on Danish commons. Biol. Skr. 1948, 5, 1–34. [Google Scholar]
- Yoon, J.; Park, H.; Kim, K. Identifying technological competition trends for R&D planning using dynamic patent maps: SAO-based content analysis. Scientometrics 2013, 94, 313–331. [Google Scholar]
- Yoon, J.; Kim, K. Identifying rapidly evolving technological trends for R&D planning using SAO-based semantic patent networks. Scientometrics 2011, 88, 213–228. [Google Scholar]
- Park, I.; Yoon, B. A semantic analysis approach for identifying patent infringement based on a product–patent map. Technol. Anal. Strat. Manag. 2014, 26, 855–874. [Google Scholar] [CrossRef]
- Lu, Y.; Xiong, X.; Zhang, W.; Liu, J.; Zhao, R. Research on classification and similarity of patent citation based on deep learning. Scientometrics 2020, 123, 813–839. [Google Scholar] [CrossRef]
- Ma, C.; Zhao, T.; Li, H. A Method for Calculating Patent Similarity Using Patent Model Tree Based on Neural Network. In Proceedings of the 9th International Conference on Brain Inspired Cognitive System (BICS), Xi’an, China, 7–8 July 2018. [Google Scholar]
- Mueller, J.; Thyagarajan, A. Siamese Recurrent Architectures for Learning Sentence Similarity. In Proceedings of the Thirtieth AAAI Conference on Artificial Intelligence, Phoenix, AZ, USA, 12–17 February 2016. [Google Scholar]
- Neculoiu, P.; Versteegh, M.; Rotaru, M. Learning text similarity with siamese recurrent networks. In Proceedings of the 1st Workshop on Representation Learning for NLP (RepL4NLP), Berlin, Germany, 7–12 August 2016. [Google Scholar]
- Zhang, Y.; Shang, L.; Huang, L.; Porter, A.L.; Zhang, G.; Lu, J.; Zhu, D. A hybrid similarity measure method for patent portfolio analysis. J. Inf. 2016, 10, 1108–1130. [Google Scholar] [CrossRef] [Green Version]
- Fujii, A.; Ishikawa, T. Document Structure Analysis for the NTCIR-5 Patent Retrieval Task. In Proceedings of the NTCIR-5 Workshop Meeting (NTCIR), Tokyo, Japan, 6–9 December 2005. [Google Scholar]
- Robertson, S.E.; Walker, S. Some simple effective approximations to the 2-poisson model for probabilistic weighted retrieval. In Proceedings of the 17th Annual International ACM-SIGIR Conference on Research and Development in Information Retrieval (SIGIR), Dublin, Ireland, 3–6 July 1994. [Google Scholar]
- Kim, B.T.; Hyun, E. Mapping the Landscape of Blockchain Technology Knowledge: A Patent Co-Citation and Semantic Similarity Approach. Systems 2023, 11, 111. [Google Scholar] [CrossRef]
- Lee, C.; Cho, Y.; Seol, H.; Park, Y. A stochastic patent citation analysis approach to assessing future technological impacts. Technol. Forecast. Soc. Chang. 2012, 79, 16–29. [Google Scholar] [CrossRef]
- Rodriguez, A.; Kim, B.; Turkoz, M.; Lee, J.; Coh, B.; Jeong, M.K. New multi-stage similarity measure for calculation of pairwise patent similarity in a patent citation network. Scientometrics 2015, 103, 565–581. [Google Scholar] [CrossRef]
- Klavans, R.; Boyack, K.W. Which Type of Citation Analysis Generates the Most Accurate Taxonomy of Scientific and Technical Knowledge? J. Am. Soc. Inf. Sci Technol. 2017, 68, 984–998. [Google Scholar] [CrossRef]
- Wu, H.; Chen, H.; Lee, K.; Liu, Y. A method for assessing patent similarity using direct and indirect citation links. In Proceedings of the 2010 IEEE International Conference on Industrial Engineering and Engineering Management, Macao, China, 7–10 December 2010. [Google Scholar]
- Cheng, T.; Wang, M. The Patent-Classification Technology/Function Matrix—A Systematic Method for Design around. JIPR 2013, 18, 158–167. [Google Scholar]
- Keselman, A.; Rosemblat, G.; Kilicoglu, H.; Fiszman, M.; Jin, H.; Shin, D.; Rindflesch, T.C. Adapting semantic natural language processing technology to address information overload in influenza epidemic management. J. Am. Soc. Inf. Sci. Technol. 2010, 61, 2531–2543. [Google Scholar] [CrossRef]
- Wang, X.; Ren, H.; Chen, Y.; Liu, Y.; Qiao, Y.; Huang, Y. Measuring patent similarity with SAO semantic analysis. Scientometrics 2019, 121, 1–23. [Google Scholar] [CrossRef]
- Kim, K.; Park, K.; Lee, S. Investigating technology opportunities: The use of SAOx analysis. Scientometrics 2019, 118, 45–70. [Google Scholar] [CrossRef]
- Miao, H.; Wang, Y.; Li, X.; Wu, F. Integrating Technology-Relationship-Technology Semantic Analysis and Technology Roadmapping Method: A Case of Elderly Smart Wear Technology. IEEE Trans. Eng. Manag. 2022, 69, 262–278. [Google Scholar] [CrossRef]
- He, X.; Meng, X.; Dong, Y.; Wu, Y. Demand identification model of potential technology based on SAO structure semantic analysis: The case of new energy and energy saving fields. Technol. Soc. 2019, 58, 101–116. [Google Scholar] [CrossRef]
- Li, R.; Wang, X.; Liu, Y.; Zhang, S. Improved Technology Similarity Measurement in the Medical Field based on Subject-Action-Object Semantic Structure: A Case Study of Alzheimer’s Disease. IEEE Trans. Eng. Manag. 2023, 70, 280–293. [Google Scholar] [CrossRef]
- Lin, W.; Liu, X.; Xiao, R. Research on Product Core Component Acquisition Based on Patent Semantic Network. Entropy 2022, 24, 549. [Google Scholar] [CrossRef]
- Gong, X.; Su, H.; Xu, D.; Zhang, Z.; Shen, F.; Yang, H. An Overview of Contour Detection Approaches. Int. J. Autom. Comput. 2018, 15, 656–672. [Google Scholar] [CrossRef]
- Wang, X. Laplacian operator-based edge detectors. IEEE Trans Pattern Anal. Mach. Intell. 2007, 29, 886–890. [Google Scholar] [CrossRef] [PubMed]
- Nixon, M.S.; Aguado, A.S. Feature Extraction & Image Processing for Computer Vision, 3rd ed.; Elsevier: Amsterdam, The Netherlands, 2012; pp. 143–154. [Google Scholar]
- Canny, J. A computational approach to edge detection. IEEE Trans. Pattern Anal. Mach. Intell. 1986, 8, 679–698. [Google Scholar] [CrossRef]
- Martin, D.R.; Fowlkes, C.C.; Malik, J. Learning to detect natural image boundaries using local brightness, color, and texture cues. IEEE Trans. Pattern Anal. Mach. Intell. 2004, 26, 530–549. [Google Scholar] [CrossRef]
- Cox, I.J.; Rehg, J.M.; Hingorani, S. A Bayesian multiple-hypothesis approach to edge grouping and contour segmentation. Int. J. Comput. Vis. 1993, 11, 5–24. [Google Scholar] [CrossRef]
- Amir, A.; Lindenbaum, M. A generic grouping algorithm and its quantitative analysis. IEEE Trans. Pattern Anal. Mach. Intell. 1998, 20, 168–185. [Google Scholar] [CrossRef]
- Elder, J.H.; Zucker, S.W. Computing Contour Closure. In Proceedings of the 4th European Conference on Computer Vision (ECCV), Cambridge, UK, 15–18 April 1996. [Google Scholar]
- Mahamud, S.; Williams, L.R.; Thornber, K.K.; Xu, K. Segmentation of multiple salient closed contours from real images. IEEE Trans. Pattern Anal. Mach. Intell. 2003, 25, 433–444. [Google Scholar] [CrossRef]
- Arbelaez, P. Boundary Extraction in Natural Images Using Ultrametric Contour Maps. In Proceedings of the 2006 Conference on Computer Vision and Pattern Recognition Workshop (CVPRW), New York, NY, USA, 17–22 June 2006. [Google Scholar]
- Arbelaez, P.; Maire, M.; Fowlkes, C.; Malik, J. From contours to regions: An empirical evaluation. In Proceedings of the 2009 IEEE Conference on Computer Vision and Pattern Recognition, Miami, FL, USA, 20–25 June 2009. [Google Scholar]
- Bengio, Y.; Ducharme, R.; Vincent, P. A neural probabilistic language model. In Proceedings of the Advances in Neural Information Processing Systems (NIPS), Denver, CO, USA, 1 January 2000. [Google Scholar]
- Mnih, A.; Hinton, G. Three new graphical models for statistical language modelling. In Proceedings of the 24th International Conference on Machine Learning (ICML), Corvalis, OR, USA, 20–24 June 2007. [Google Scholar]
- Xiao, R.B.; Feng, Z.H.; Wang, J.H. Collective intelligence: Conception, research progress and application analysis. J. Nanchang Inst. Technol. 2022, 41, 1–21. [Google Scholar]
- Xiao, R.B.; Chen, Z.Z. From swarm intelligence optimization to swarm intelligence evolution. J. Nanchang Inst. Technol. 2023, 42, 1–10. [Google Scholar]
- Xiao, R.B.; Lai, R.S.; Li, R.W. From design for mass customization to design for mass personalization. J. Nanchang Inst. Technol. 2021, 40, 1–12. [Google Scholar]


| No. | SAO Structure | Example |
|---|---|---|
| 1 |  | Wherein the conductive mechanism further comprises a control circuit module;
|
| 2 |  | The first conductive portion and the second conductive portion are electrically coupled with the control circuit module through conductive line;
|
| 3 |  | A direction-adjustable showerhead fixing structure includes a showerhead main body and a connecting seat;
|
| 4 |  | The invention reduces and eliminates the above disadvantages;
|
| 5 |  | The control circuit module is disposed on the mount and is located in the first chamber;
|
| No. | Patent Number | No. | Patent Number |
|---|---|---|---|
| 1 | US20220105526A1 | …… | …… |
| 2 | US20210178409A1 | …… | …… |
| 3 | US20210027988A1 | 124 | US20180257090A1 |
| 4 | US20200384486A1 | 125 | US20180250690A1 |
| 5 | US20190262849A1 | 126 | US20180065131A1 |
| 6 | US20190184316A1 | 127 | US20170297039A1 |
| 7 | US20190143348A1 | 128 | US20170252764A1 |
| 8 | US20180318860A1 | 129 | US20170189918A1 |
| …… | …… | 130 | US20170165682A1 |
| …… | …… | 131 | US20170165684A1 |
| No | S | A | O |
|---|---|---|---|
| 1 | Invention | Provide | Showerhead |
| 2 | Conduit | Taper | Passage |
| 3 | Conduit | Taper | Outlet |
| 4 | Invention | Have | Application |
| 5 | Water | Passing | Showerhead |
| 6 | Configuration | Require | Tolerance |
| …… | …… | …… | …… |
| 128 | Jet | Include | Passage |
| 129 | Jet | Include | Outlet |
| 130 | Passage | Include | Ducting |
| 131 | Passage | Include | Apertures |
| No. | Patent Number | Number of SAO Structure |
|---|---|---|
| 1 | US20220105526A1 | 334 |
| 2 | US20210178409A1 | 611 |
| 3 | US20200384486A1 | 712 |
| 4 | US20190262849A1 | 199 |
| …… | …… | …… |
| 127 | US20170297039A1 | 327 |
| 128 | US20170252764A1 | 116 |
| 129 | US20170189918A1 | 466 |
| 130 | US20170165682A1 | 117 |
| 131 | US20170165684A1 | 84 |
| No | No. Patent | Similarity |
|---|---|---|
| 1 | 7 | 0.0727 |
| 2 | 14 | 0.0712 |
| 3 | 2 | 0.0671 |
| 4 | 17 | 0.0648 |
| 5 | 9 | 0.0643 |
| 6 | 23 | 0.0598 |
| 7 | 8 | 0.0515 |
| 8 | 5 | 0.0488 |
| 9 | 19 | 0.0484 |
| 10 | 20 | 0.0465 |
| No. | No. Patent | Similarity |
|---|---|---|
| 1 | 24 | 0.3932 |
| 2 | 22 | 0.3833 |
| 3 | 26 | 0.3711 |
| 4 | 12 | 0.3675 |
| 5 | 20 | 0.3495 |
| 6 | 9 | 0.3245 |
| 7 | 0 | 0.3215 |
| 8 | 1 | 0.3131 |
| 9 | 4 | 0.2932 |
| 10 | 2 | 0.2856 |
| No. | α | β | Rank Change Value Sum |
|---|---|---|---|
| 1 | 0.5 | 0.5 | 56 |
| 2 | 0.6 | 0.4 | 53 |
| 3 | 0.7 | 0.3 | 53 |
| 4 | 0.8 | 0.2 | 29 |
| 5 | 0.9 | 0.1 | 41 |
| No. | No. Patent | Similarity |
|---|---|---|
| 1 | 9 | 0.11574 |
| 2 | 2 | 0.1084 |
| 3 | 20 | 0.1021 |
| 4 | 12 | 0.0967 |
| 5 | 4 | 0.09376 |
| 6 | 8 | 0.0921 |
| 7 | 1 | 0.09184 |
| 8 | 19 | 0.09048 |
| 9 | 17 | 0.08746 |
| 10 | 24 | 0.08592 |
| No. Patent | Expert Reading | TF-IDF | SBERT | SAO | DWSAO | SAO-img |
|---|---|---|---|---|---|---|
| 9 | 1 | 4 | 2 | 5 | 5 | 1 |
| 4 | 2 | 19 | 18 | 11 | 13 | 5 |
| 8 | 3 | 5 | 14 | 7 | 7 | 6 |
| 2 | 4 | 6 | 13 | 3 | 8 | 2 |
| 1 | 5 | 14 | 12 | 12 | 9 | 7 |
| 23 | 6 | 8 | 8 | 6 | 11 | 12 |
| 7 | 7 | 1 | 7 | 1 | 3 | 11 |
| 17 | 8 | 12 | 10 | 4 | 4 | 9 |
| 3 | 9 | 23 | 17 | 14 | 12 | 14 |
| 16 | 10 | 7 | 5 | 13 | 10 | 13 |
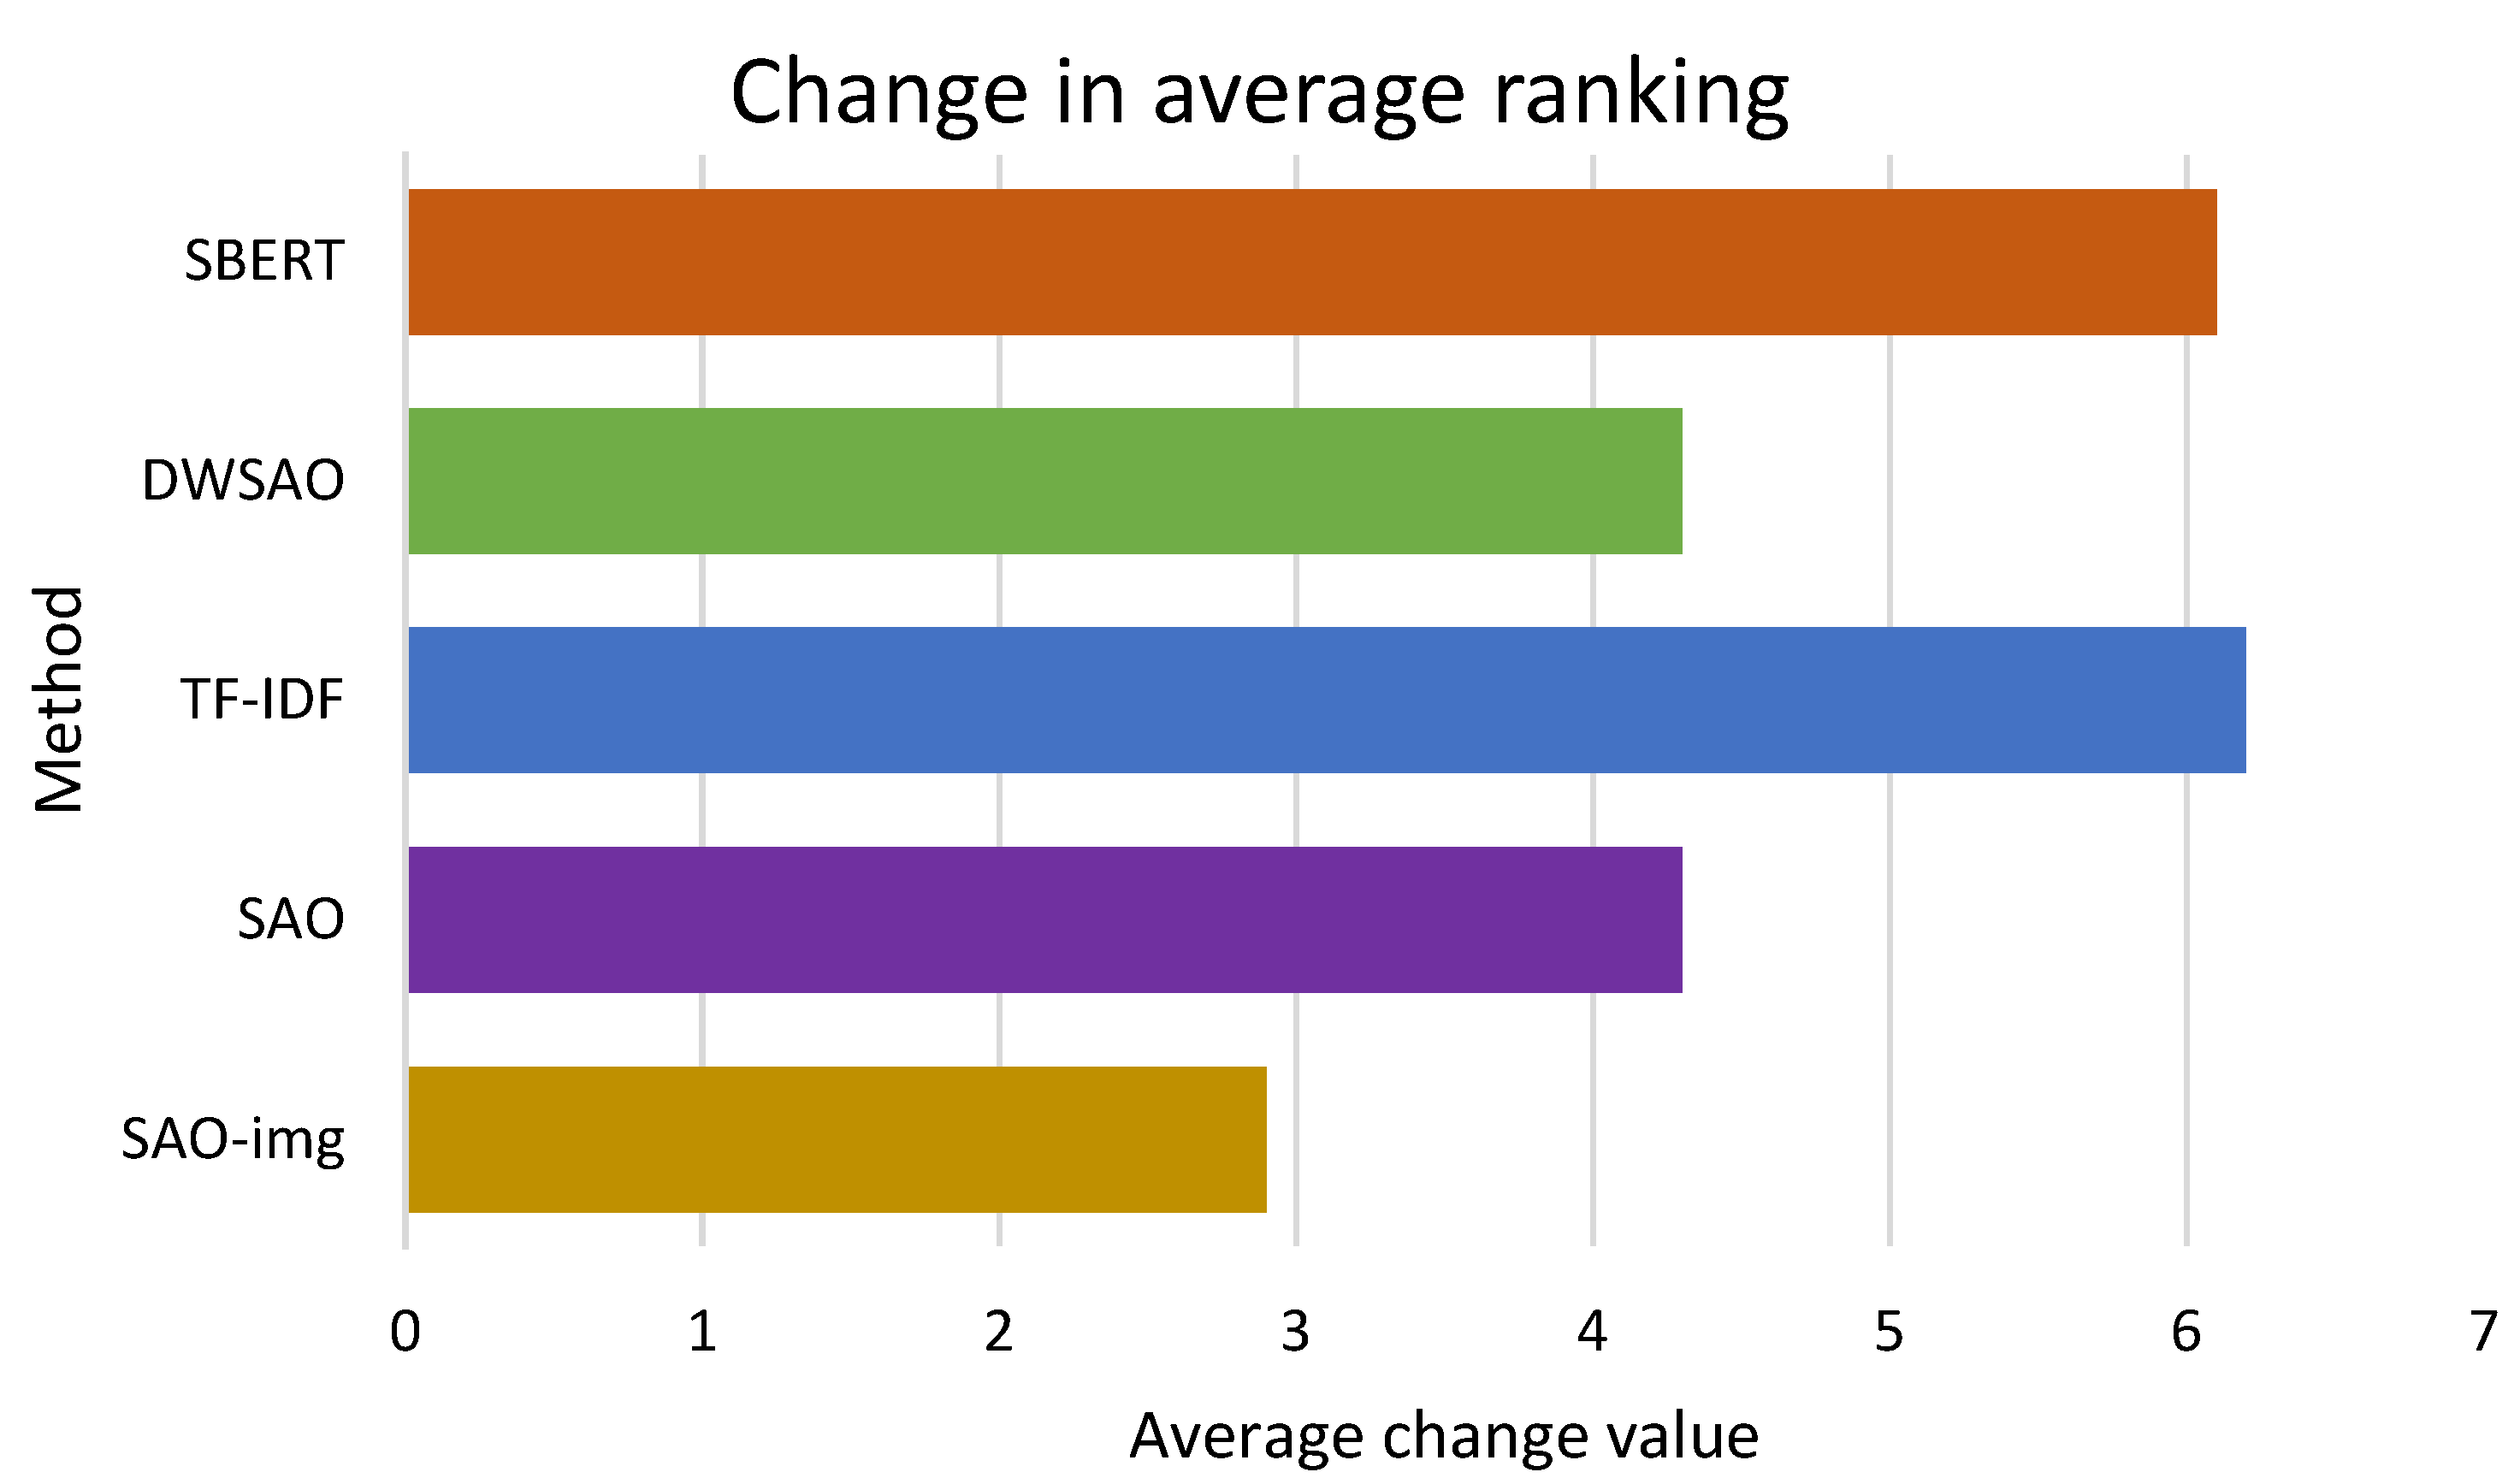
| Rank change value sum | - | 62 | 61 | 43 | 43 | 29 |
| Average ranking change | - | 6.2 | 6.1 | 4.3 | 4.3 | 2.9 |
Disclaimer/Publisher’s Note: The statements, opinions and data contained in all publications are solely those of the individual author(s) and contributor(s) and not of MDPI and/or the editor(s). MDPI and/or the editor(s) disclaim responsibility for any injury to people or property resulting from any ideas, methods, instructions or products referred to in the content. |
© 2023 by the authors. Licensee MDPI, Basel, Switzerland. This article is an open access article distributed under the terms and conditions of the Creative Commons Attribution (CC BY) license (https://creativecommons.org/licenses/by/4.0/).
Share and Cite
Lin, W.; Yu, W.; Xiao, R. Measuring Patent Similarity Based on Text Mining and Image Recognition. Systems 2023, 11, 294. https://doi.org/10.3390/systems11060294
Lin W, Yu W, Xiao R. Measuring Patent Similarity Based on Text Mining and Image Recognition. Systems. 2023; 11(6):294. https://doi.org/10.3390/systems11060294
Chicago/Turabian StyleLin, Wenguang, Wenqiang Yu, and Renbin Xiao. 2023. "Measuring Patent Similarity Based on Text Mining and Image Recognition" Systems 11, no. 6: 294. https://doi.org/10.3390/systems11060294