Article

Addressing Environmental Protection Supplier Selection Issues in a Fuzzy Information Environment Using a Novel Soft Fuzzy AHP–TOPSIS Method

Department of Management Sciences, R.O.C. Military Academy, Kaohsiung 830, Taiwan
*
Author to whom correspondence should be addressed.
Systems 2023, 11(6), 293; https://doi.org/10.3390/systems11060293
Submission received: 4 May 2023 / Revised: 27 May 2023 / Accepted: 6 June 2023 / Published: 7 June 2023

Abstract

:
With the current heightened promotion of environmental awareness, issues related to environmental protection have become a critical component of economic development. The emergence of new environment-friendly materials and simple packaging, and other environmental awareness demands in recent years, have prompted manufacturers to pay more attention to planning greener production and supply processes than before. Many scholars have been urged to investigate the issues related to environmental protection and the sustainable economy of green suppliers. However, many factors needed to be considered, such as the price, cost, benefit, reputation, and quality involved in the process of green supplier selection. These factors require quantitative and qualitative analysis information, making the issue of environmental protection a multi-criteria decision making (MDCM) problem. Traditional research methods are unable to effectively and objectively handle the MCDM problem of green supplier selection due to the problem’s complexity and the method’s inclination towards biased conclusions. To resolve the complicated problem of green supplier selection, this study combined the fuzzy analytic hierarchy process (AHP), the technique for order preference by similarity to ideal solution (TOPSIS), and the 2-tuple fuzzy linguistic model (2-tuple FLM) and corrected the ranking of the possible green suppliers. The computation results were also compared with the typical TOPSIS and AHP–TOPSIS methods. Through the numerical verification of the actual case for the green supplier, the test results suggested that the proposed method could perform an objective evaluation of expert-provided information while also retaining all their valuable insights.

1. Introduction

With modern technological advancements, businesses have started utilizing technological equipment to shorten their production times (from product design to market launch) and enhance their competitive advantage. However, mass production has resulted in environmental destruction, such as in wastewater, gas emissions, and energy consumption. The environmental changes caused by global warming have posed a serious threat to ecological and economic development. As a result, many countries are gradually shifting their attention to environmental protection issues by developing innovative product materials and striving to achieve a balance between environmental protection and business economics. In this regard, the key to environment-friendly processes lies in the manufacturing industry’s upstream supply of raw materials, with the problem of raw material supplier selection being an essential issue in supply chain management. The problem of raw materials supplier selection involves factors such as cost, benefit, reputation, and efficiency, among others. Different suppliers have different backgrounds and advantages, and procurement personnel’s expertise and experiences influence decision-making. Therefore, finding the most suitable supplier is a complicated, multi-criteria decision-making (MCDM) issue. To date, many scholars have applied different algorithms to address the complicated MCDM problem related to supplier selection (such as [1,2,3,4]).
To solve the complicated MCDM problem, academic scholars have devised several research methods in the past few decades. In 1968, Roy suggested the elimination et choice translating reality (ELECTRE) [5], while Charnes et al. [6] introduced the data envelopment analysis (DEA) approach. On the other hand, Saaty [7] proposed the analytical hierarchy process (AHP) method, while Hwang and Yoon [8] initiated the technique for order preference by similarity to an ideal solution (TOPSIS) method, and Yazdani et al. [9] proposed the combined compromise solution (CoCoSo) method. In 1973, the Battelle Memorial Institute of the Geneva Research Center proposed the decision-making trial and evaluation laboratory (DEMATEL) method [10], while Brans and Vincke [11] introduced the preference ranking organization method for enrichment evaluation (PROMETHEE) method and Opricovic [12] proposed the VlseKriterijumska Optimizacija I Kompromisno Resenje (VIKOR) method. These research methods can be used to solve management or decision-making problems in various fields, such as renewable energy sources [13], military simulation training systems [14], occupational safety and health [15], cloud service [16], battery electric vehicles [17], healthcare waste treatment technology [18], contractor selection [19], and vaccine selection [20]. However, each method has its limitations, specificities, and perspectives; hence, no method is perfect or suitable for all problems. To obtain a suitable method and solve problems efficiently, researchers must clearly understand the nature of the problem.
The AHP method is an MCDM approach that was developed by Saaty in 1971 [7]. It is mainly used in MCDM situations involving multiple evaluation criteria and dealing with quantitative and qualitative information. The AHP method systematically and structurally decomposes complex decision-making problems into multiple levels, establishes relationships between the levels, and addresses the issue of available alternatives using multiple criteria. The AHP method focuses primarily on the importance of criteria weights to provide decision-makers with sufficient decision-making information through a survey approach, reducing the risk of decision-making errors. At present, the AHP method is extensively utilized across numerous fields as it can effectively assist scholars and decision-makers in solving complex decision-making problems, such as techno-entrepreneurship [21], renewable energy [22], road selection [23], sewer networks [24], and smart buildings [25].
Evaluating, comparing, and selecting different alternatives are among the most common issues among MCDM problems. In 1981, Hwang and Yoon introduced the TOPSIS method, which is based on the proximity ideal targets between a limited number of evaluated alternatives and ideal targets for ranking. By performing geometric calculations to approach ideal solutions, relative evaluations of the existing alternatives can be conducted. The basic principle of this method is to detect various criteria related to the evaluated alternatives, select the best and worst solutions, and calculate the geometric distances between each alternative for sorting. The evaluated alternative is considered to be the best solution if it is farthest from the worst solution and closest to the ideal solution. This method has the advantage of simple geometric calculations and greater flexibility when using weights. Therefore, this approach has been used extensively across numerous fields, such as medical equipment supplier selection [26,27], failure mode and effects analysis [28], group decision making [29], economic freedom assessment [30], medical treatment selection [31], and performance evaluation [32].
The presentation and processing of data are essential parts of MCDM problems. However, due to the experts’ diverse experiences, backgrounds, and professional knowledge, collected opinions sometimes lack consensus, and cannot be expressed or solved using ordinary positive integers. As a result, the concept of fuzzy numbers emerged. Zadeh [33] proposed a mathematical theory of fuzzy sets, which are extensions of ordinary sets in mathematics. The principle of defuzzification involves providing a span for a single numerical value and forming a range interval where the values within the intervals represent possible results of opinions. This allows experts to express their opinions more precisely and provide better perspectives on events, which is different from the absolute representation of positive integers. Due to the flexibility of fuzzy methods and their alignment with real-world situations, many scholars have adopted and utilized this method in various methods and models, while also applying it in various fields. For example, Faizi et al. [34] used hesitant fuzzy sets to manage uncertain decision problems. Garg and Kumar [35] proposed the concept of a linguistic interval-valued Atanassov intuitionistic fuzzy set to address group decision making problems. Mathew et al. [36] integrated spherical fuzzy set, AHP, and TOPSIS methods to deal with problems in manufacturing systems selection. Wen et al. [37] addressed the risk assessment problem by integrating a hesitant fuzzy linguistic term set and subjective and objective weights. On the other hand, Zadeh [38] proposed linguistic expression variables based on natural language semantics to define the linguistic variables provided by experts more clearly. These expressions convey information through subjective language descriptions. Building on Zadeh’s concept, Herrera and Martinez [39] introduced a method for expressing linguistic transformations, which was called the 2-tuple fuzzy linguistic model (2-tuple FLM). This model establishes a semantic scale (from poor to good) and assigns corresponding fuzzy intervals to convert indicator calculation results into scoring properties. The calculation results are then re-expressed as a 2-tuple based on the semantic scale. The application of the 2-tuple FLM allows for the thorough examination of useful information. For instance, when evaluating product quality, multiple fuzzy language terms such as “very good”, “good”, “fair”, “poor”, and “very poor” can be used. A membership degree value can be used for each fuzzy linguistic term to describe the strength of the product quality. In recent years, the 2-tuple FLM has also been widely applied to address problems in various fields, such as group decision-making [40], personnel selection [41], cloud computing for e-commerce [42], failure mode and effects analysis [43], and the selection of material suppliers [44].
Recently, Utama [45] combined AHP and TOPSIS approaches to manage green supplier selection among color painting and printing enterprises in Indonesia. Utama [45] used eight criteria to select suppliers, and the results revealed that the criteria of quality had the highest importance. However, the said study failed to consider that experts’ diverse backgrounds, experiences, and expertise caused the collected opinions to contain some vague information, leading to certain deviations in the solution results. To address the aforementioned issue, this study combined the fuzzy AHP method, the TOPSIS method, and the 2-tuple FLM to manage the supplier selection problem with uncertain and imprecise information. The proposed method exhibits novelty and several advantages. Firstly, it utilizes the fuzzy AHP approach to determine the weights of different evaluation criteria, taking into account the differences in criterion importance. Secondly, the proposed method employs the TOPSIS approach to consider the Euclidean distance of each alternative from both the optimal and worst solutions. This ensures a comprehensive evaluation of alternatives. Finally, the method integrates the 2-tuple FLM approach, enabling the simultaneous handling of qualitative and quantitative information. This allows for the thorough consideration of all available information.
The remainder of this study is organized as follows. Section 2 discusses the basic concepts and some fundamental definitions related to 2-tuple FLM, the fuzzy AHP method, and the TOPSIS method. Section 3 presents a novel soft fuzzy AHP–TOPSIS model to solve environmental protection supplier selection under a fuzzy environment. Section 4 presents a numerical example of selecting a green supplier, and discusses how the research results compare with other related methods to demonstrate the effectiveness of the proposed novel soft fuzzy AHP–TOPSIS method. Section 5 draws the conclusion and contributions of this study together and highlights suggestions for future researchers.

2. Preliminary

2.1. Fuzzy AHP Method

Saaty introduced the AHP method, which is a research methodology suitable for addressing complex MCDM problems with hierarchical structures, in 1971. This approach systematically and structurally decomposes decision problems into several levels while considering and processing both quantitative and qualitative information, resolving the challenge of comparing multiple solutions [7]. However, the conventional AHP methodology is inadequate when handling the fuzzy information that experts provide. To manage imprecise and uncertain information, Zadeh [33] suggested the concept of fuzzy sets, which can be used to leverage fuzzy logic and address the uncertainty of the decision problem. The fuzzy AHP method combines mathematical theory (fuzzy set) and the MCDM approach (AHP method) to consider both uncertain and imprecision information in its evaluation. The following presents the computation rules related to the triangular fuzzy number (TFN).
Definition 1 
([46]). Considering that two TFN are M 1 = l 1 , m 1 , u 1 and M 2 = l 2 , m 2 , u 2 , the basic operational laws are as follows:
M 1 M 2 = l 1 , m 1 , u 1 l 2 , m 2 , u 2 = l 1 + l 2 , m 1 + m 2 , u 1 + u 2
M 1 M 2 = l 1 , m 1 , u 1 l 2 , m 2 , u 2 = l 1 u 2 , m 1 m 2 , u 1 l 2
l 1 , m 1 , u 1 1 = 1 u 1 , 1 m 1 , 1 l 1
The fuzzy AHP approach procedure is as follows.
  • Step 1. Establish a hierarchy and determine the evaluation criteria.
The hierarchical structure of the problem can be divided into multiple levels (from top to bottom), while the actual level size depends on the problem analysis. Evaluation criteria are determined based on the hierarchical structure, and pairwise comparisons are used to assess the relative importance of the evaluation criteria. A rating scale of 1–9 is employed, with larger numbers indicating greater importance. The evaluation scale is shown in Table 1 [7].
  • Step 2. Perform a questionnaire survey based on a fuzzy scale and make a pairwise comparison.
Convert the evaluation scale of the AHP method to the evaluation scale of the TFN, as shown in Table 2 (adapted from [47]). Then, complete the expert questionnaire. After performing the questionnaire survey, use the semantic scales answered by the experts’ questionnaires to establish matrix A. Let A = a i j n × m be a fuzzy pairwise comparison judgments matrix, M i j = ( l i j , m i j , u i j ) be a TFN, and adopt both to execute pairwise comparisons between the different assessment elements, where a i j is the importance comparison value of the i-th assessment criteria to the j-th assessment criteria, a i j = 1 , i = j , and a j i = 1 a i j , i = 1 , 2 , , n , j = 1 , 2 , , m , as shown in Equation (4).
A = a i j = a 11 a 12 a 1 m a 21 a 22 a 2 m a n 1 a n 2 a n m
  • Step 3. Defuzzify the TFN value.
Use the center of area (COA) method to defuzzify the pairwise comparison matrix in Step 2. Equation (5) illustrates the process of defuzzifying a TFN value D F i j [48].
D F i j = l i j + u i j l i j + m i j l i j 3
  • Step 4. Calculate the consistency ratio (CR) value.
To verify the consistency of expert-provided opinions, examine the aggregated value of the TFN in Step 3. Then, apply the AHP method to calculate the CR and consistency index (CI) value, as shown in Equations (6)–(8). Table 3 shows that λ m a x is the largest eigenvector and n is the size of the fuzzy pairwise comparison matrix A, while the value of random index (RI) is based on the matrix size [7]. It should be noted that the CR value must be less than 0.1 to prove the consistency of expert-provided assessments and opinions.
A w = λ m a x w ,   and   i = 1 n w i = 1
C I = λ m a x n n 1
C R = C I R I
  • Step 5. Calculate the optimal weight and rank the criteria and alternatives.
Once the weight of each evaluation criteria has been determined in Step 5, it is then multiplied by each alternative in the decision-making problem to obtain the weighted score. To select the best alternative, the results of weighted scores are ranked from high to low.

2.2. The TOPSIS Method

Hwang and Yoon developed the TOPSIS method in 1981, which is a widely used technique for multi-criteria decision analysis [8]. The TOPSIS method is primarily used in addressing issues involving solution and combination selection. The method involves comparing the candidate solutions with the positive ideal solution (PIS) and negative ideal solutions (NIS), as well as evaluating the superiority and ranking of each solution by examining their geometric distances from the best and worst solutions. The evaluated solution is considered the best if it is the closest to the best solution and farthest from the worst solution. The steps involved in this method are explained below.
  • Step 1. Construct and compute the normalized decision matrix.
Establish a decision matrix for various criteria of different units, digits, and alternatives. Then, perform the normalization process to obtain the data to be compared using values ( a i j ) of the same sizes and digits. The formula is as follows, where x i j is the evaluation value of ith alternatives with respect to jth criteria.
a i j = x i j i = 1 n x i j 2 , i = 1 , , n , j = 1 , , m
  • Step 2. Compute the weighted normalized decision matrix.
Multiply the normalized values obtained in Step 1 by the corresponding weights to compute the weighted normalized decision matrix ( z i j ). Experts typically determine the weights in the TOPSIS in a subjective manner. It can also be calculated using other research methods to assign weights to the criteria in the normalized matrix. The formula is as follows, where w j is the weight of the jth criteria, and j = 1 m w j = 1 :
z i j = w j a i j , i = 1 , , n , j = 1 , , m
  • Step 3. Select the PIS and the NIS of each alternative.
The PIS and the NIS are the two basic concepts of the TOPSIS method. The PIS refers to the best conceived solution, with all its attribute values reaching the best values among all alternative solutions. On the other hand, the NIS is the worst conceived solution, with all its attribute values reaching the worst values among all alternative solutions. The attributes of the evaluation index should be used in the evaluation of its solution, from which the value that maximizes the benefit and minimizes the cost will be selected.
For the benefit criteria:
z j + = m a x z 1 j , z 2 j , , z n j
z j = m i n z 1 j , z 2 j , , z n j
For the cost criteria:
z j + = m i n z 1 j , z 2 j , , z n j
z j = m a x z 1 j , z 2 j , , z n j
The PIS ( Z + ) and NIS are ( Z ) as follows:
Z + = z 1 + , z 2 + , , z m +
Z = z 1 , z 2 , , z m
  • Step 4. Calculate the Euclidean distance of each alternative from the optimal solution and the worst solution.
After completing the screening of the optimal and the worst solution, the relative distance between the scores of each alternative and the best and worst solutions is calculated. Equation (17) can be summed to obtain the distance between the selected alternative and the best solution ( S i + ), and Equation (18) can be summed to obtain the distance between the selected alternative and the worst solution ( S i ). The formula is as follows.
S i + = j = 1 m z i j Z j + 2 , i = 1 , 2 , , n .
S i = j = 1 m z i j Z j 2 , i = 1 , 2 , , n .
  • Step 5. Compute the closeness coefficient ( C i ) of the alternatives.
The final step is to compare the distance ratio of each alternative with the ideal and the negative ideal solutions. If the distance ratio from the worst solution is the highest (the farthest distance), and the proportion of distance from the optimal solution is the smallest (the distance is the shortest), it is identified as the optimal alternative. The value of C i is used as the basis for ranking the alternative. The greater the value, the farther away from the worst solution obtained, and the better the alternative. The formula is as follows:
C i = S i S i + S i +

2.3. The 2-Tuple FLM

Herrera and Martinez proposed the 2-tuple FLM as an expression semantic conversion method in 2000 [39]. According to the semantic expression variables proposed by Zadeh [38], numerous different expression modes are set, such as good, very good, poor, very poor, and so on. However, each person observes a difference between the expression variables to varying degrees. As a result, the 2-tuple FLM assigns absolutely fixed scoring positions for the abovementioned semantic scales, corresponding to s 1 , s 2 , , s 9 , respectively, where s 1 is absolutely poor, s 3 is fairly poor, s 5 is common, s 7 is fairly good, and s 9 is absolutely good, leading to a fixed distance level between semantic variables.
The 2-tuple FLM is composed of two elements, such as a fuzzy language word (s) and an associated membership value (α), and develops a semantic description in a binary group format, where L = (s, α). The range α of the fuzzy interval is limited within the range of ±0.5, by converting the semantic scale to give the corresponding fuzzy interval. Using 5.25 as an example, it can be expressed as (s5, 0.25). Figure 1 depicts the overall model.
Definition 2 
([39,49]). Assume S = s 1 , s 2 , , s k is a set of linguistic representation and β 0 , k is an operation result of symbolic aggregation, and then the function represents the 2-tuple linguistic as follows:
: S × 0.5 , 0.5 0 , k
β = s i , α ,   w i t h   s i , k = r o u n d ( β ) α = β i , α 0.5 , 0.5
where   s i  is the index closest to  β , α  is the deviation between the actual value and the fuzzy linguistic, and round (.) is the usual round operation.
Definition 3 
([39]). Assume x = s 1 , α 1 , s 2 , α 2 , , s n , α n  is a set of the 2-tuple linguistic representation, and then the calculation of the arithmetic mean  χ e is as follows:
χ e = i = 1 n 1 n 1 s i , α i = 1 n i = 1 n β i
Definition 4 
([39]). Assume s e , α 1  and  s f , α 2  are two 2-tuple linguistic representations, and then their comparison law as is follows.
(i) 
If e > f, then  s e , α 1 > s f , α 2 .
(ii) 
If e = f, then
(A) 
If  α 1 = α 2 , then  s e , α 1  and  s f , α 2  indicate the same information.
(B) 
If  α 1 > α 2 , then  s e , α 1 > s f , α 2 .

3. The Proposed Novel Soft Fuzzy AHP–TOPSIS Method

3.1. The Planning of the Proposed Method

The goal of choosing green suppliers is to reduce the environmental impact of enterprise development, and emphasize the selection of environmentally responsible suppliers for procurement activities. However, selecting green suppliers involves multiple factors, including environmental management system certification, energy and carbon emission reduction, social responsibility, and eco-friendly product production, among others. Hence, green supplier selection is considered to be an MCDM issue. To effectively address this issue, this study integrated the fuzzy AHP method with the TOPSIS method and 2-tuple FLM to evaluate green supplier selection. On the other hand, with the ongoing development of the digital economy, there has been a significant increase in the volume of data being generated. The proposed method is well-suited for environments involving big data. This study first used the AHP approach to determine the weight of the different evaluation criteria, assess the significance of each evaluation criterion, minimize subjective bias, and enhance evaluation precision. Then, the researchers used the TOPSIS method to assist the evaluators in identifying the optimal solution by measuring the geometric distance between the best and worst solutions. During the selection process, experts must evaluate the comprehensiveness of the suppliers’ environmental protection policy and determine if the product promote environmental protection. However, there are often uncertainties and ambiguities in these types of evaluations. Therefore, using the fuzzy logic of fuzzy sets, fuzzy subjective judgments are transformed into numerical values. Meanwhile, the 2-tuple FLM can be used to consider available information fully, improving the accuracy and credibility of green supplier evaluations and selecting suppliers that best meet the enterprises’ environmental protection requirements.

3.2. Steps Involved in the Proposed Method

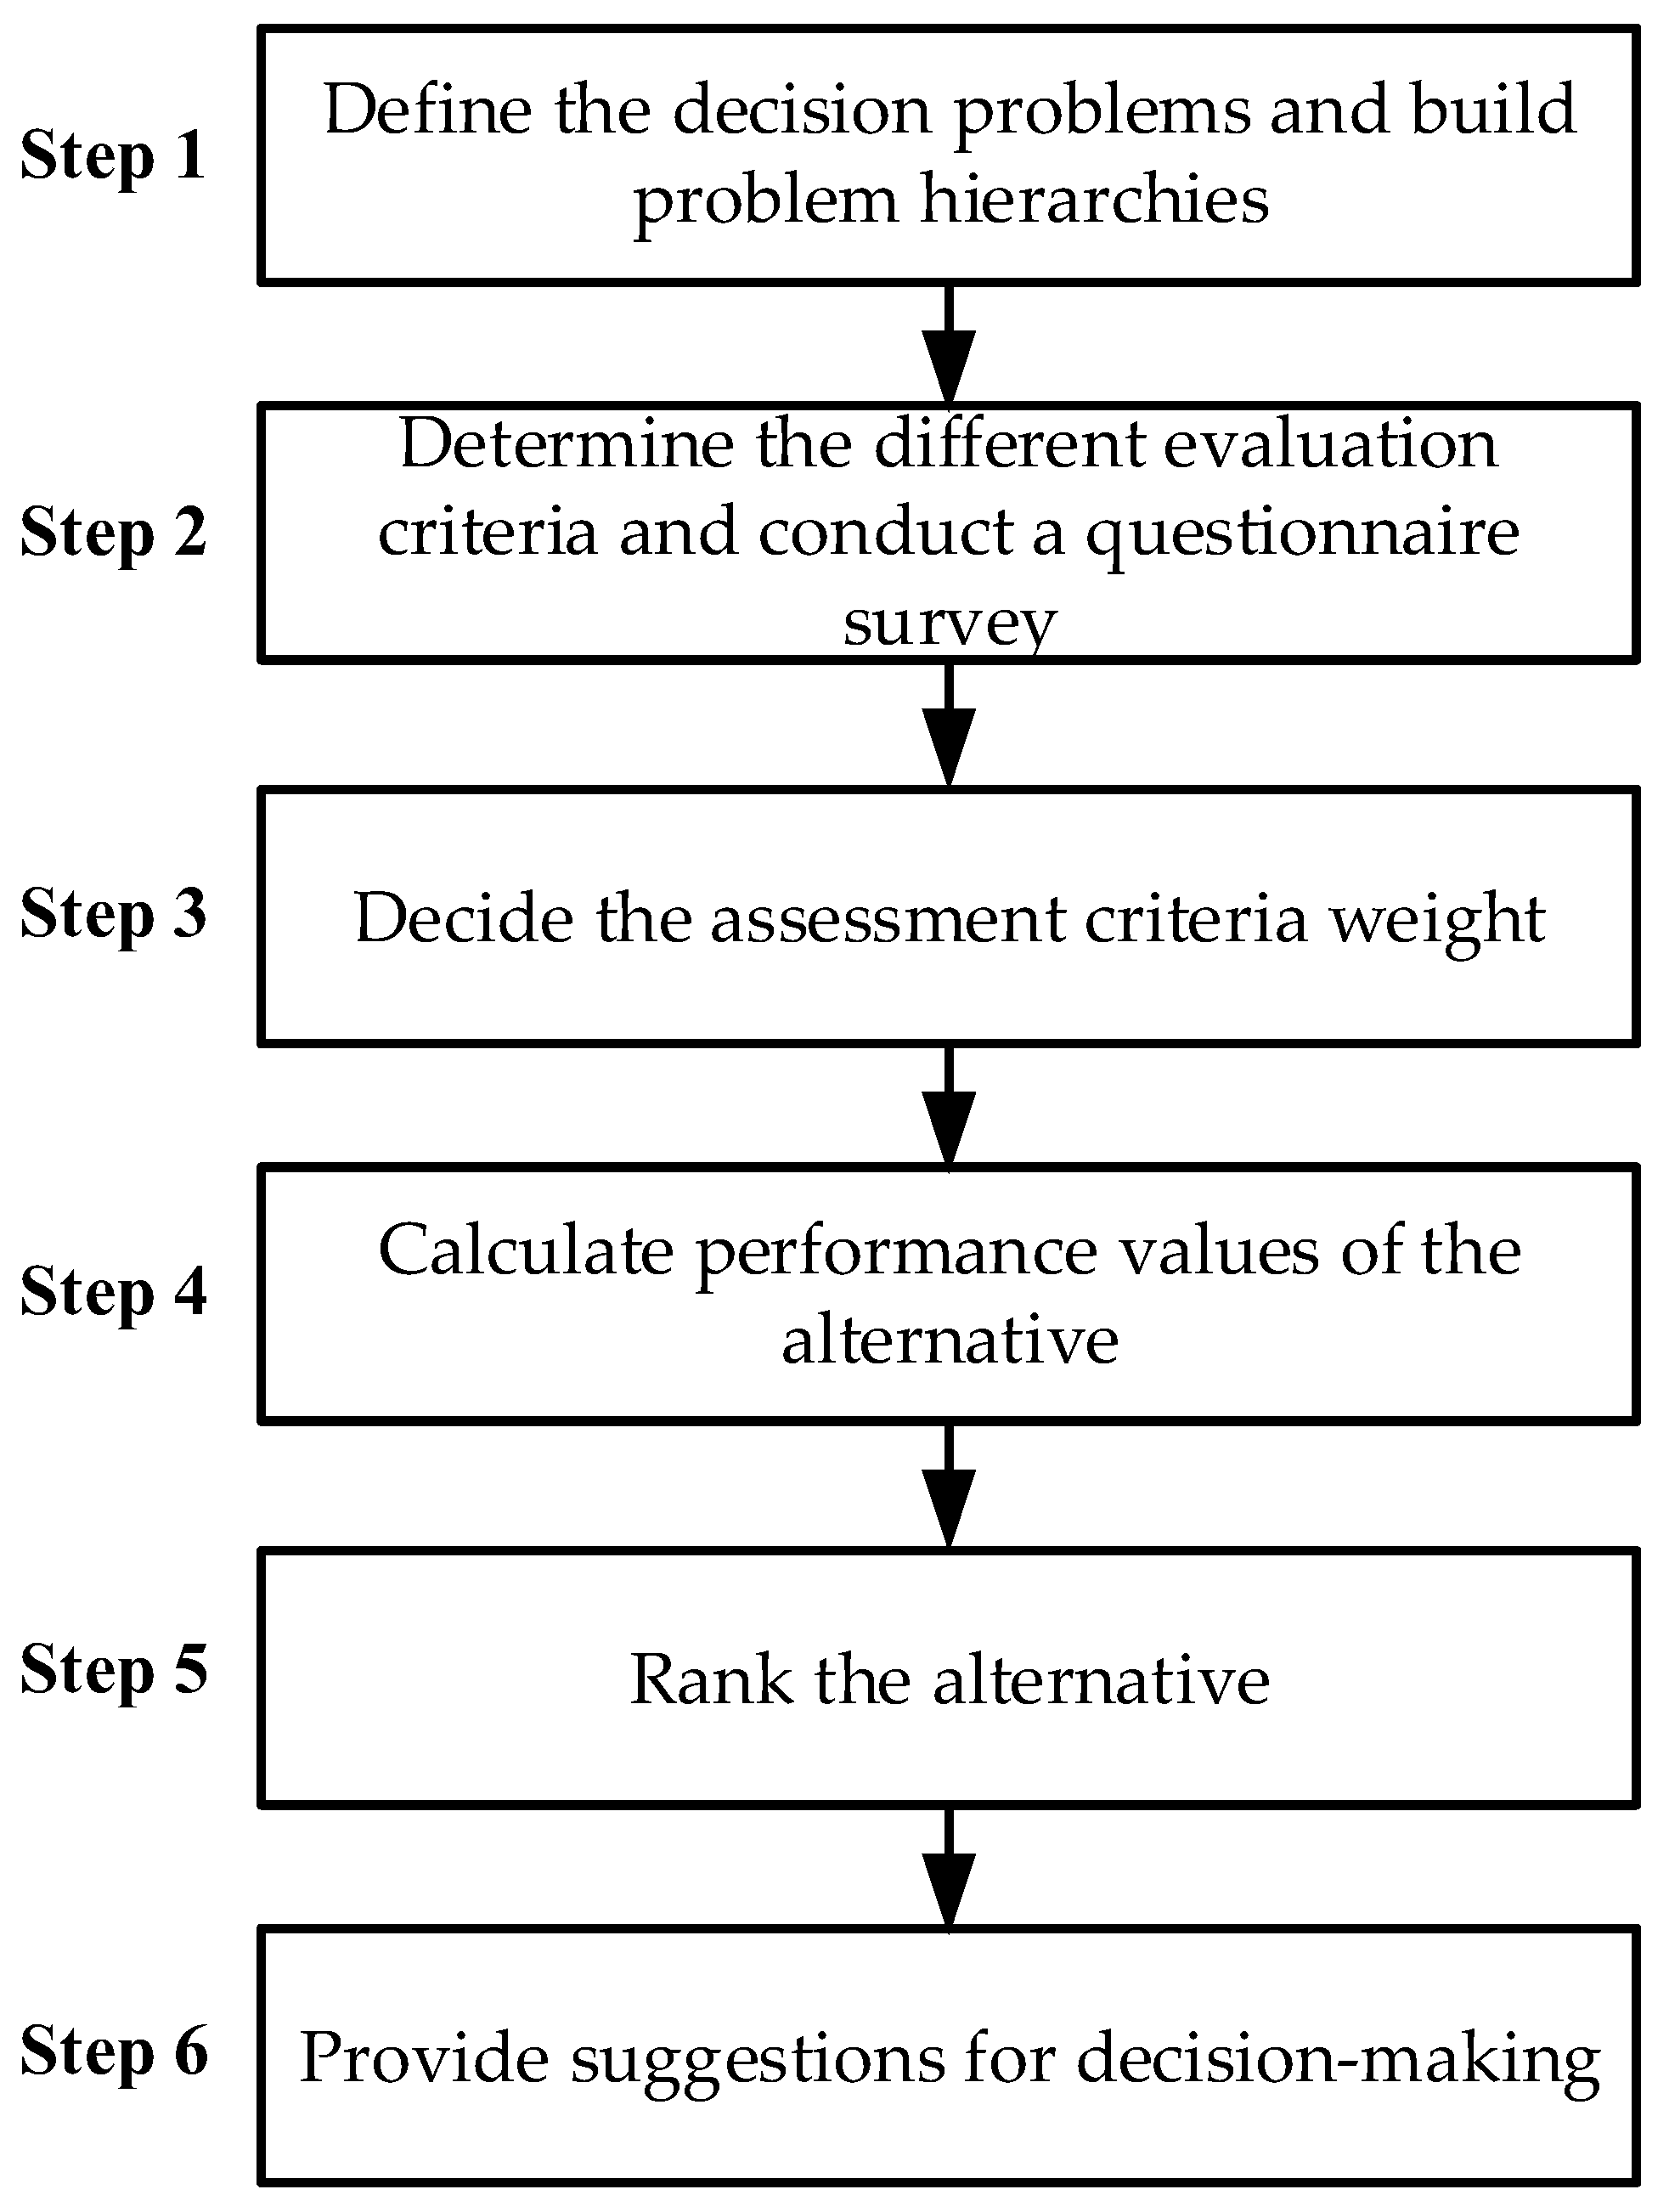
Based on the research plan described in Section 3.1, the implementation techniques of the proposed research method are explained below, and the flowchart of the proposed novel soft fuzzy AHP–TOPSIS method is shown in Figure 2.
  • Step 1. Define the decision problems and build problem hierarchies.
This step involves organizing a decision-making committee to analyze the problem, defining the structure of the MCDM problem, and constructing problem hierarchies (including goal, criteria, and alternative) to aid in understanding the evaluation criteria and identifying potential alternatives.
  • Step 2. Determine the different evaluation criteria and conduct a questionnaire survey.
Experts with professional experience in specialized fields design evaluation criteria based on different evaluation criteria to complete the questionnaire survey. This step involves performing a questionnaire survey with experts using the 1 to 9 rating scale of the AHP method. This approach is beneficial for analyzing the alternatives in the subsequent MCDM problem.
  • Step 3. Decide the assessment criteria weight.
Equation (5) is used to defuzzify the TFN value in the evaluation criteria comparison matrix and convert it into the crisp value. Equations (6)–(8) are then adopted to evaluate the relative priorities of the criteria. The CR value is calculated to confirm that the expert-provided information meets the consistency standard (CR < 0.1) and to determine the criteria weight value.
  • Step 4. Calculate performance values of the alternative.
Based on the original data collected in Step 2, this step uses the 2-tuple FLM for the semantic conversion and calculates the algebraic average to obtain the average performance. The evaluation criterion weight value obtained in Step 3 is then multiplied by the alternative’s average performance value.
  • Step 5. Rank the alternative.
This step involves the ranking of the alternatives in the MCDM problem using Equations (11)–(16) to obtain the input data of the PIS and NIS. After applying Equations (17)–(19) to calculate the values of S + , S , and C i , the alternatives are ranked based on the C i value.
  • Step 6. Provide suggestions for decision-making.
After completing the priorities of the alternatives in Step 5, managers (decision-makers) can make informed decisions based on the ranking from large to small, and provide the best green supplier selection suggestion.

4. Case Study

4.1. Overview

The rising trends in promoting environmental awareness and achieving sustainable economic development goals warrant the consideration of the performance of environmental protection, economic development, and social feedback by each enterprise in their business operations. As reflected in previous studies, scholars examined environmental protection issues and proposed several solutions. This study adapted an example involving the selection of raw material suppliers among color painting and printing companies in Indonesia (adapted from [
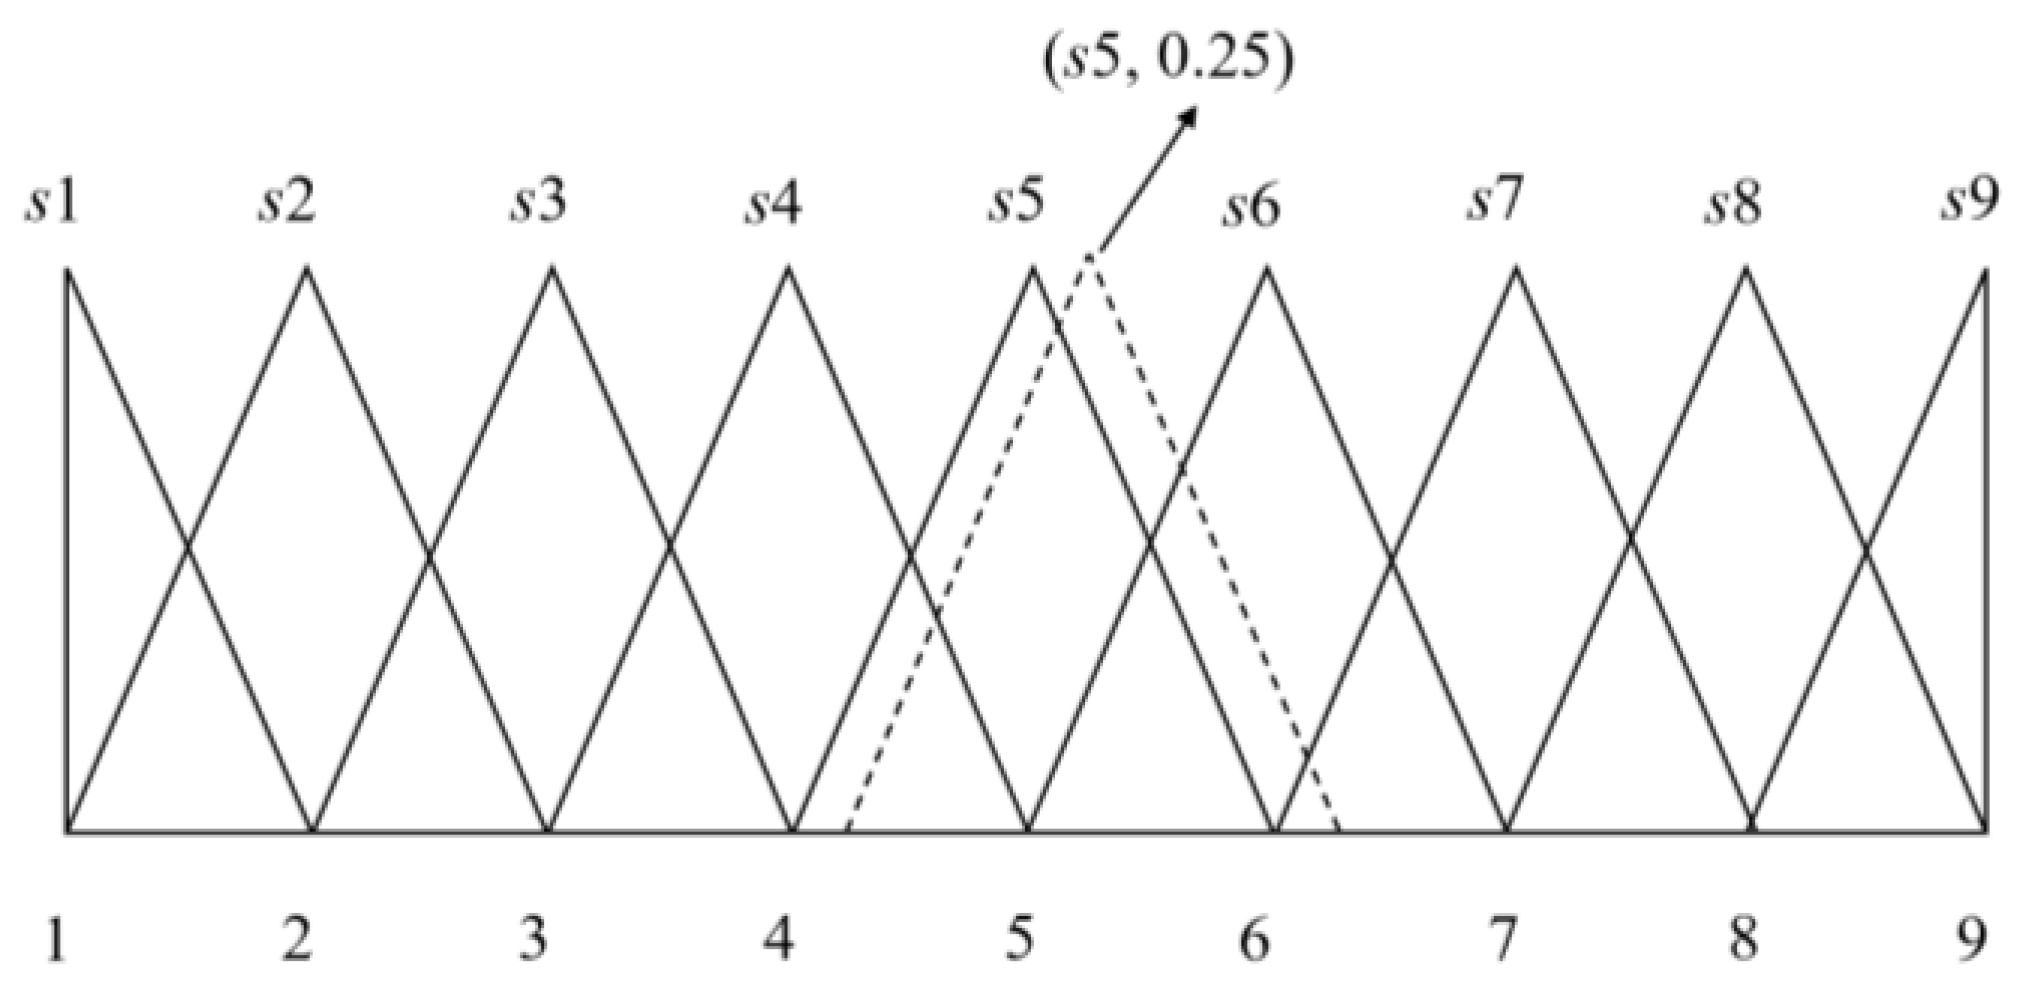
45]), and investigated how to cope with the problem of environmental protection supplier selection. The evaluation criteria distinguished two attributes of benefit and cost, totaling six criteria including quality (QU), environment management system (EM), environmental protection material (EP), eco-package (EC), price (PR), and distance (DI). Experts provided the evaluation scores’ qualitative data for QU, EM, EP, and EC (i.e., s1: normal, s3: slightly good, s5: fairly good, s7: very good, and s9: absolutely good, where s2, s4, s6, and s8 are an intermediate judgment between two adjacent judgments). Meanwhile, the evaluation scores for PR and DI were quantitative data. 
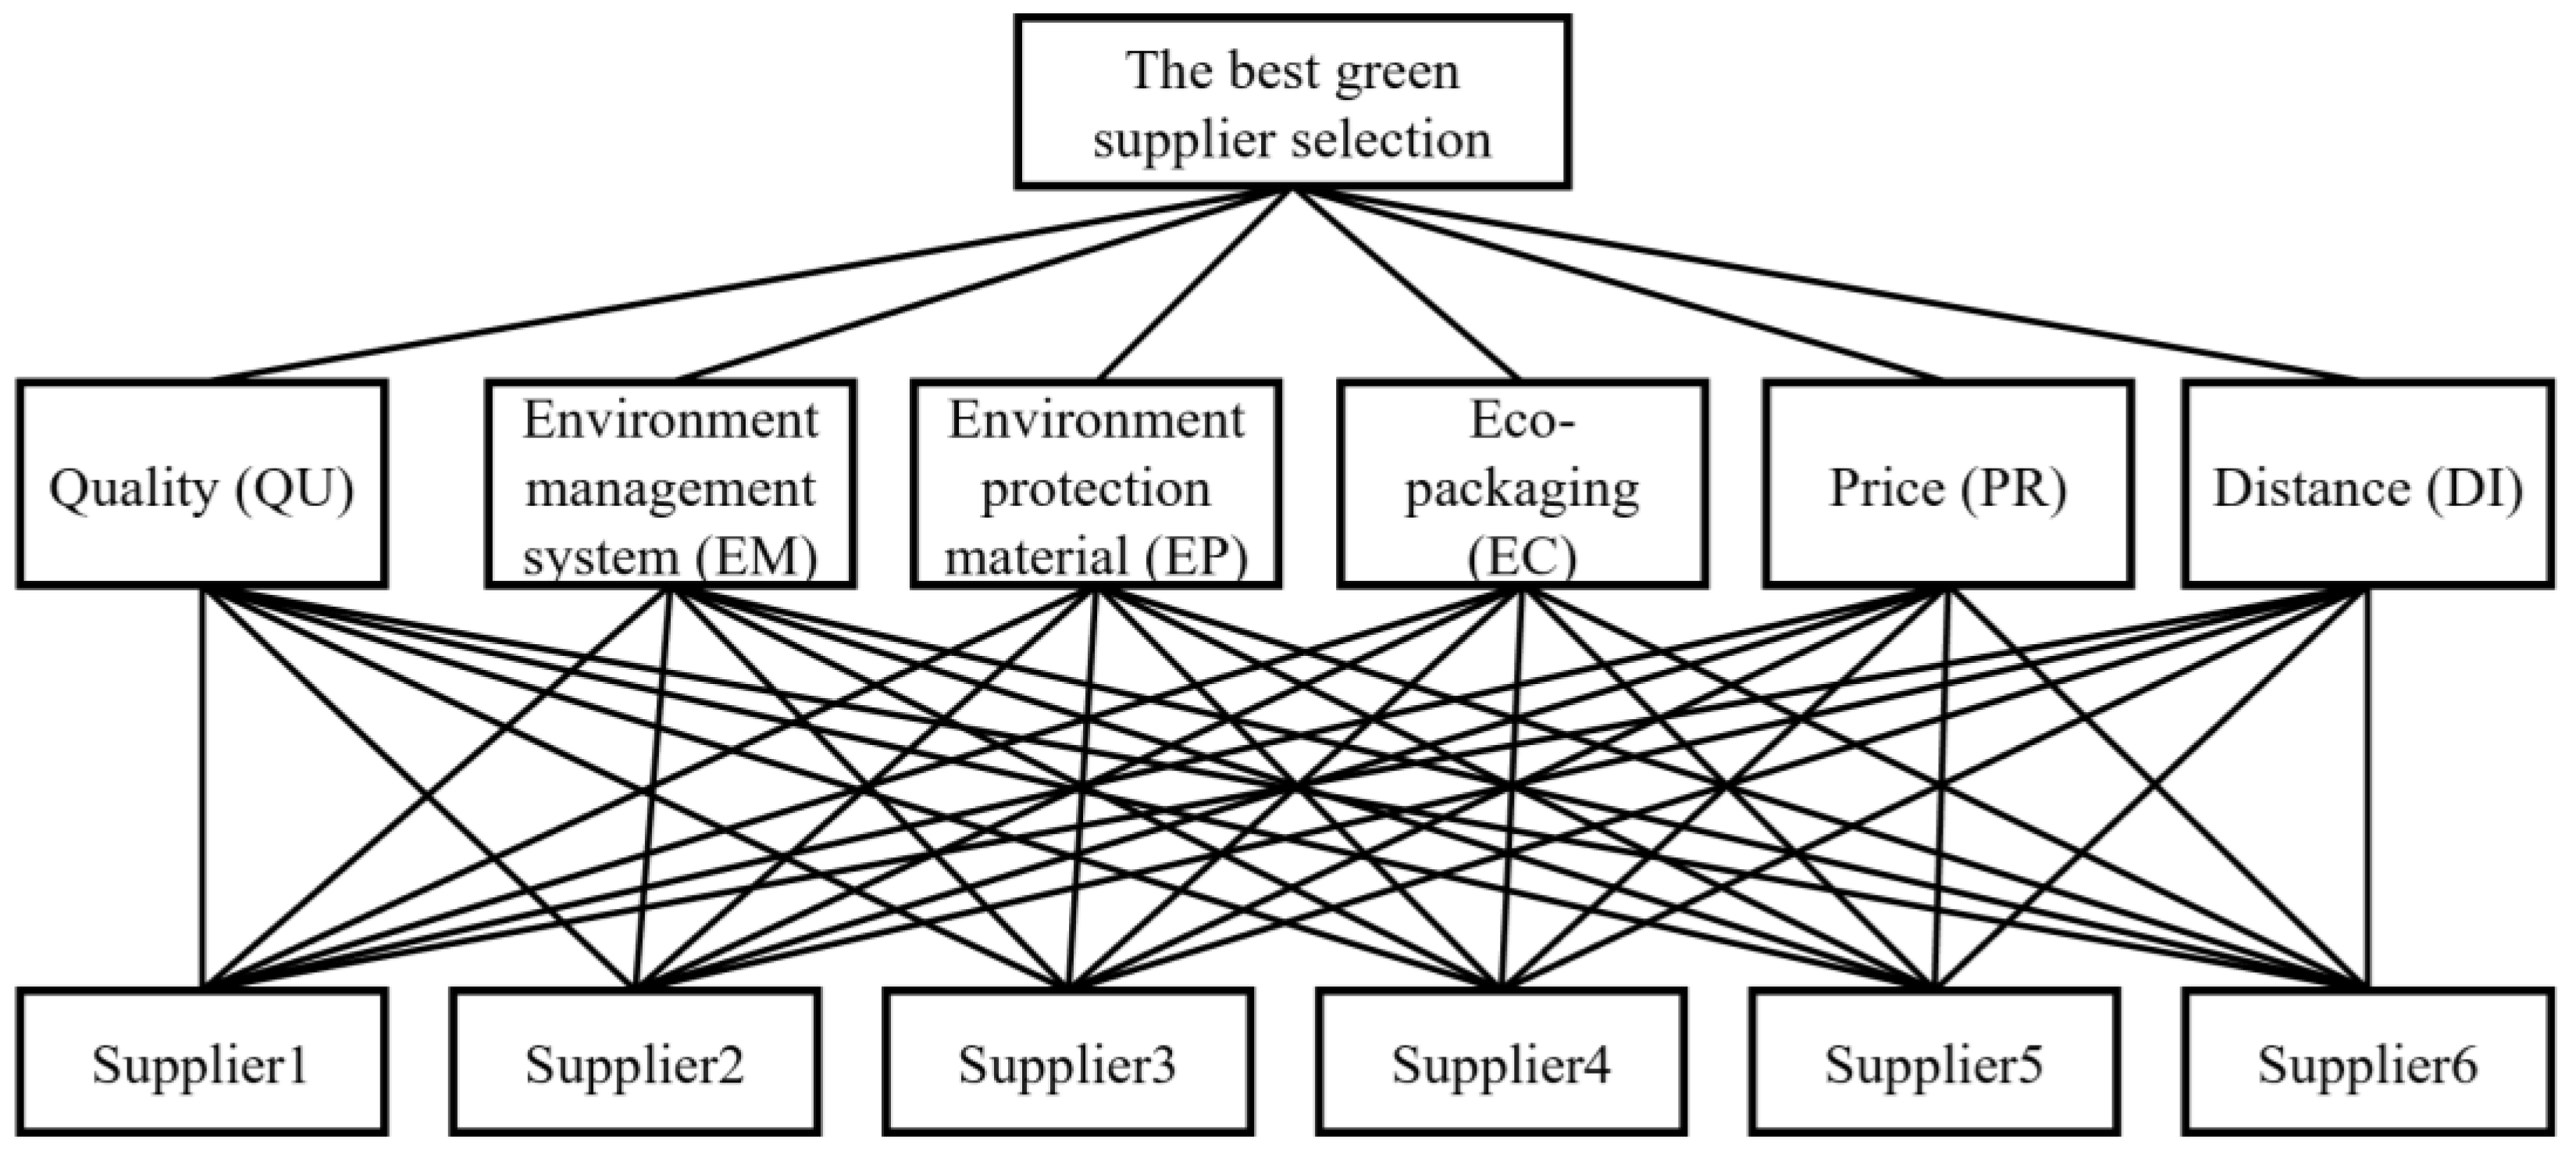
Table 4 shows the assessment results for the six suppliers in each criterion, while Figure 3 presents the structure. To evaluate and select the best among the six selected suppliers (S1–S6), we formed an advisory committee for green supplier selection comprising four experts (Expert 1, Expert 2, Expert 3, and Expert 4) who possess extensive practical experience in the fields of environmental protection and supplier selection. These experts conducted the fuzzy information evaluation of the supplier selection goals, as demonstrated in Table 5 and Table 6 (adapted from [45]).

4.2. Application of the Typical TOPSIS Method

The TOPSIS method is commonly used to solve MCDM problems by comparing the geometric distances between the alternative properties and the PIS and NIS. Aires and Ferreira [50] applied the TOPSIS method to effectively rank the alternatives in an MCDM problem, where the weight of the criteria was assumed to be the same. Table 6 shows that the normalized average data value was multiplied by the weighted value of each index 0.167 to determine the average weighted value, as depicted in Table 7.
Equations (11)–(16) were used to determine the PIS ( Z + ) and NIS ( Z ) for the six criteria, and the Euclidean distance of each alternative to the S i + and S i was measured using Equations (17) and (18). Equation (19) was utilized to calculate the closeness coefficient ( C i ). The complete calculation results are shown in Table 7.

4.3. Application of the Typical AHP–TOPSIS Method

The typical AHP–TOPSIS method combines the AHP and TOPSIS methods. This method first uses the AHP method to compute the different evaluation criteria weight for problem-solving and then ranks the alternatives effectively through the TOPSIS method. Azimifard et al. [27] used the AHP–TOPSIS methodologies to select a sustainable steel industry supplier, and the research results proved that this method can assist managers in handling supplier selection issues at the macro level. This study also utilized the AHP–TOPSIS method to evaluate and choose suitable green suppliers.
Table 5 shows that the weights of the six criteria were calculated using the AHP method. Since the AHP method can only handle crisp information, the TFN contents in Table 5 were converted to a crisp information comparison criteria matrix, as shown in Table 8.
Table 5 shows that the weights of the six criteria were calculated using the AHP method. Since the AHP method can only handle crisp information, the TFN contents in Table 5 were converted to a crisp information comparison criteria matrix. The operation procedure involves first performing the arithmetic mean calculation of the values obtained by the four experts in Table 5. Subsequently, defuzzification is carried out using Equation (5) to obtain a single value, as illustrated in Table 8.
As shown in Table 8, Equations (6)–(8) were used to determine the CR values by calculating λ m a x = 6.585 . The CI value was 0.117 and the CR value was 0.094. The calculation procedure is shown as follows:
C I = λ m a x n n 1 = 6.585 6 6 1 = 0.117
C R = C I R I = 0.117 1.240 = 0.094
After confirming that the CR value is <0.1, the expert-provided judgement can be tagged as consistent. The weight calculation can then be performed to obtain the weighted vectors (0.298, 0.101, 0.057, 0.029, 0.360, 0.156)T, with the results indicating that PR had the most important weight value, at 0.360, followed by the weights of QU (0.298), DI (0.156), EM (0.101), EP (0.057), and EC (0.029).
Data in Table 6 and Equation (9) were used to conduct the mean calculation, which was then multiplied by the respective weighted value of the six criteria. Following that, the weighted average value was determined, as shown in Table 9. Table 9 and Equations (11)–(16) illustrate how to find out the PIS ( Z + ) and NIS ( Z ) for the s criteria, while Equations (17) and (18) depict how the Euclidean distances of each alternative to the S i + and S i were measured. Equation (19) was used to calculate the closeness coefficient ( C i ), and the complete calculation results are illustrated in Table 9.

4.4. Application of the Proposed Novel Soft Fuzzy AHP–TOPSIS Method

This section used the proposed novel soft fuzzy AHP–TOPSIS method to evaluate the performance of the six suppliers. The method integrates the fuzzy AHP method, the TOPSIS method, and the 2-tuple FLM. Steps 1 to 6 are outlined in Section 3.2.
  • Step 1. Define decision problems and build problem hierarchies.
This step involves organizing a supplier selection committee to analyze the problem, defining the hierarchical structure of the MCDM problem, formulating feasible evaluation criteria, and looking for best green supplier.
  • Step 2. Determine the different evaluation criteria and conduct a questionnaire survey.
Experts discussed and determined the evaluation criteria based on the case of raw material suppliers of color painting and printing companies. Table 2 shows the expert-provided weight indicators of the pairwise comparison matrix for the green supplier selection of raw materials. The fuzzy evaluation scores for supplier selection objectives were also depicted in Table 2.
  • Step 3. Decide the assessment criteria weight.
As shown in Table 5 and Equation (5), the TFN value of each evaluation criteria in the comparison matrix was defuzzified and converted into the exact value. For example, Expert E1 gave the degree of importance of criteria EM for pairwise comparisons of criteria QU as (2/11, 1/5, 2/9), as shown in Table 5. Using the calculation involved in the COA method, the obtained score was 0.201.
D F i j = l i j + u i j l i j + m i j l i j 3 = 2 / 11 + 2 / 9 2 / 11 + 1 / 5 2 / 11 3 = 0.201
As shown in Table 5, Equation (22) was used to aggregate experts’ opinion and obtain the comparison matrix of fuzzy AHP methods expressed in Table 10.
As illustrated in Table 8, Equations (6)–(8) were used to determine the CR values by calculating the λ m a x = 6.513 . The computed CI value was 0.103 and the CR value was 0.083, confirming that the expert-provided information met CR < 0.1. The PR weight value (0.354) appeared to be the most important, followed by the weights of QU (0.301), DI (0.156), EM (0.100), EP (0.060), and EC (0.029).
  • Step 4. Calculate performance values of the alternative.
The proposed method adopted Equations (20)–(22) to perform semantic conversion on the questionnaire results in Table 6. The arithmetic mean of the supplier’s performance score was calculated and then it was multiplied by the evaluation criteria weighted value obtained in Step 3. Table 11 shows the obtained weighted average performance values of the alternatives.
  • Step 5. Rank the alternative.
This step applied Equations (11)–(16) to determine the PIS ( Z + ) and the NIS ( Z ) for the six criteria in Table 11. Equations (17) and (18) were then used to measure the separation distance of each alternative to the S i + and S i . Equation (19) was used to calculate the closeness coefficient ( C i ). The alternatives were ranked based on the C i value. Table 11 shows the whole calculation results.
  • Step 6. Provide suggestions for decision-making.
After completing the priorities of the alternatives in Step 5, decision makers or managers can sort the findings from large to small and provide the best green supplier selection suggestion.

4.5. Comparison and Discussion

This study proposed a soft fuzzy AHP–TOPSIS method that combines the fuzzy AHP method, the TOPSIS method, and the 2-tuple FLM to address issues relating to environmental protection supplier selection under a fuzzy information environment. To prove the accuracy and effectiveness of the proposed method, the calculation results compared the typical TOPSIS method and the AHP–TOPSIS method. Table 7, Table 9 and Table 11 show the calculation results of the three different research methods, while Table 12 shows the summarized results. The differences in the three different research methods in terms of information processing and weights were considered in evaluating the criteria, as shown in Table 13.
The following explains the several advantages of the proposed method.
(1)
Ability to handle qualitative and quantitative information simultaneously
The typical TOPSIS method can perform geometric calculations to obtain ideal solutions and conduct relative evaluations for existing alternatives and rankings. However, it cannot consider qualitative and quantitative information simultaneously. Both the AHP–TOPSIS method and the proposed method maximize the solving features of the AHP method, effectively decomposing complex decision-making problems into multiple levels and easy-to-handle subproblems, quantifying experts’ subjective scores on the evaluation criteria, and converting qualitative scores into quantitative values while ensuring that all qualitative and quantitative information is fully considered to improve the accuracy and reliability of their decision-making.
(2)
Ability to fully consider the differences of the weights between criteria
The traditional TOPSIS method ignores weight considerations, causing the evaluation results to deviate from the actual situation. Both the AHP–TOPSIS method and the proposed method can distinguish the relative importance of each criterion, making the evaluation results more suitable for the actual situation.
(3)
Objectively estimates the expert information
The AHP–TOPSIS method and the typical TOPSIS method can only deal with the crisp value and cannot handle fuzzy information. The proposed method can simultaneously consider the interval values of the fuzzy information, including the lower limit, center, and upper limit, and can consider the expert-provided information more objectively. Through the proposed method, subjective interpretations of the experts’ opinions can be avoided, as this may lead to biased results, thereby improving the accuracy of the evaluation. The proposed method also suits the actual situation of the evaluation and comparison results.
(4)
Fully consider available information
Since the traditional TOPSIS and AHP–TOPSIS methods calculate the arithmetic mean to obtain the crisp value during the operation process, some subtle information will be ignored or vanished easily. As seen in Table 6, the average mean value of Suppliers 2, 4, and 5 was 5 when grading the “QU” criteria, even though managers (decision makers) did not have the complete information. These conditions may result in some bias in the subsequent calculations. Therefore, the characteristics of the 2-tuple FLM were used in this study to deal with the aforementioned problems. In the “QU” criteria, the average mean values of Suppliers 2, 4, and 5 were (𝑠5, 0.250), (𝑠5, 0.000), and (𝑠5, −0.250), respectively. Therefore, the proposed novel soft fuzzy AHP–TOPSIS method can provide complete information and prevent erroneous analysis.
Although the proposed method has several advantages, there is one aspect that requires attention when applying the method. The proposed method utilizes the fuzzy AHP to calculate the relative weights of evaluation criteria. Therefore, it is essential for experts to have a basic understanding of the fuzzy AHP method in order to provide a suitable pairwise comparison matrix for the selection of a green supplier of raw materials.

5. Conclusions

Businesses are grappling with balancing economic development and sustainable environmental practices amidst a growing emphasis on environmental and ecological preservation. Issues related to environment-friendly materials, packaging, eco-landscaping, and production pollution management have become focal points of concern for industry and academia alike. Numerous scholars have shown interest in performing research to evaluate green manufacturing suppliers, particularly those in various industrial chains, aiming to mitigate the adverse impact of producing non-environment-friendly materials. In the past, weight evaluation methods commonly assumed equal weights for evaluation indices. However, the AHP enables the calculation of individual weights for each evaluation index, thereby minimizing subjective bias and effectively addressing MCDM problems. Nevertheless, assessments of this nature often involve uncertainty and ambiguity. To enhance the evaluation accuracy, this study employs the fuzzy AHP method to process fuzzy information. Regarding ranking, many research methods rely on simple weighted calculations. In contrast, the TOPSIS method aids evaluators in identifying the optimal solution by measuring the geometric distance between the optimal and worst solutions. This approach allows for a more objective and comprehensive assessment of the advantages and disadvantages of each option. Based on the above reasons, this study integrates the fuzzy AHP method, the TOPSIS method, and the 2-tuple FLM to evaluate the performance of green suppliers. Through numerical verification and a comparison between the AHP–TOPSIS and the traditional TOPSIS methods, the proposed novel soft fuzzy AHP–TOPSIS method presented the following advantages:
(1)
The proposed novel soft fuzzy AHP–TOPSIS method can simultaneously process qualitative and quantitative information in MCDM problems.
(2)
The proposed novel soft fuzzy AHP–TOPSIS method can fully consider the weight of different criteria in MCDM problems.
(3)
The proposed novel soft fuzzy AHP–TOPSIS method can take into account the objectively estimated information fully provided by experts.
(4)
The proposed novel soft fuzzy AHP–TOPSIS method can fully consider all relevant and available information.
As the overall economic environment remains unclear after the COVID-19 epidemic, experts are vulnerable to the unclear, missing, or incomplete evaluation of information when selecting suppliers. Future researchers may consider different fuzzy membership functions such as trapezoid and Gaussian, or pursue intuitionistic and picture fuzzy sets to fully consider the available fuzzy information offered by different experts to accurately reflect their inner thoughts. In terms of alternative performance evaluation, various research methods can be considered, such as CoCoSo, ELECTRE, and DEA. Additionally, the evaluation of expert decision preferences can also be incorporated. By doing so, not only can the breadth of research be expanded, but it can also align more closely with real-world problems.

Author Contributions

Conceptualization, H.-Y.C.; methodology, H.-Y.C., K.-H.C. and J.-C.Y.; validation, H.-Y.C. and K.-H.C.; data curation, H.-Y.C.; writing—original draft preparation, H.-Y.C., K.-H.C. and J.-C.Y.; writing—review and editing, H.-Y.C. and K.-H.C.; funding acquisition, H.-Y.C. and K.-H.C. All authors have read and agreed to the published version of the manuscript.

Funding

The authors would like to thank the National Science and Technology Council, Taiwan, for financially supporting this research under Contract Nos. MOST 110-2410-H-145-001, MOST 111-2221-E-145-003, and MOST 111-2221-E-145-004.

Data Availability Statement

The data presented in this study are available on request from the corresponding author.

Conflicts of Interest

The authors declare no conflict of interest.

References

  1. Ayough, A.; Shargh, S.B.; Khorshidvand, B. A new integrated approach based on base-criterion and utility additive methods and its application to supplier selection problem. Expert Syst. Appl. 2023, 221, 119740. [Google Scholar] [CrossRef]
  2. Zeng, S.Z.; Chen, W.D.; Gu, J.X.; Zhang, E.R. An integrated EDAS model for Fermatean fuzzy multi-attribute group decision making and its application in green-supplier selection. Systems 2023, 11, 162. [Google Scholar] [CrossRef]
  3. Chang, K.H. Integrating subjective-objective weights consideration and a combined compromise solution method for handling supplier selection issues. Systems 2023, 11, 74. [Google Scholar] [CrossRef]
  4. Liu, S.Y.; Lin, J.Q.; Xu, X.R. Selection and application of building material suppliers with intuitionistic fuzzy multiple attribute decision making method. J. Intell. Fuzzy Syst. 2023, 44, 4383–4395. [Google Scholar] [CrossRef]
  5. Roy, B. The outranking approach and the foundations of ELECTRE methods. Theory Decis. 1991, 31, 49–73. [Google Scholar] [CrossRef]
  6. Charnes, A.; Cooper, W.W.; Rhodes, E. Measuring the efficiency of decision making units. Eur. J. Oper. Res. 1979, 3, 339. [Google Scholar] [CrossRef]
  7. Saaty, T.L. The Analytic Hierarchy Process; McGraw-Hill: New York, NY, USA, 1980. [Google Scholar]
  8. Hwang, C.L.; Yoon, K.S. Method for Multiple Attribute Decision Making (Lecture Notes in Computer Science); Springer: Berlin, Germany, 1981; pp. 58–191. [Google Scholar]
  9. Yazdani, M.; Zarate, P.; Zavadskas, E.K.; Turskis, Z. A combined compromise solution (CoCoSo) method for multi–criteria decision–making problems. Manag. Decis. 2019, 57, 2501–2519. [Google Scholar] [CrossRef]
  10. Gabus, A.; Fontela, E. Perceptions of the World Problematique: Communication Procedure, Communicating with Those Bearing Collective Responsibility; Battelle Geneva Research Centre: Geneva, Switzerland, 1973. [Google Scholar]
  11. Brans, J.P.; Vincke, P. Note-A preference ranking organisation method. Manag. Sci. 1985, 31, 647–656. [Google Scholar] [CrossRef] [Green Version]
  12. Opricovic, S. Multi-Criteria Optimization of Civil Engineering Systems; Faculty of Civil Engineering: Belgrade, Serbia, 1998. [Google Scholar]
  13. Lee, H.C.; Chang, C.T. Comparative analysis of MCDM methods for ranking renewable energy sources in Taiwan. Renew. Sust. Energ. Rev. 2018, 92, 883–896. [Google Scholar] [CrossRef]
  14. Chang, K.H.; Chang, Y.; Chung, H.Y. A novel AHP-based benefit evaluation model of military simulation training systems. Math. Probl. Eng. 2015, 2015, 956757. [Google Scholar] [CrossRef] [Green Version]
  15. Zytoon, M.A. A decision support model for prioritization of regulated safety inspections using integrated Delphi, AHP and double-hierarchical TOPSIS approach. IEEE Access 2020, 8, 83444–83464. [Google Scholar] [CrossRef]
  16. Youssef, A.E. An integrated MCDM approach for cloud service selection based on TOPSIS and BWM. IEEE Access 2020, 8, 71851–71865. [Google Scholar] [CrossRef]
  17. Ecer, F. A consolidated MCDM framework for performance assessment of battery electric vehicles based on ranking strategies. Renew. Sust. Energ. Rev. 2021, 143, 110916. [Google Scholar] [CrossRef]
  18. Chen, W.D.; Zeng, S.Z.; Zhang, E.R. Fermatean fuzzy IWP-TOPSIS-GRA multi-criteria group analysis and its application to healthcare waste treatment technology evaluation. Sustainability 2023, 15, 6056. [Google Scholar] [CrossRef]
  19. Chang, K.H. A novel contractor selection technique using extended PROMETHEE II method. Math. Probl. Eng. 2021, 2021, 664709. [Google Scholar] [CrossRef]
  20. Meniz, B.; Ozkan, E.M. Vaccine selection for COVID-19 by AHP and novel VIKOR hybrid approach with interval type-2 fuzzy sets. Eng. Appl. Artif. Intell. 2023, 119, 105812. [Google Scholar] [CrossRef]
  21. Durmusoglu, Z.D.U. Assessment of techno-entrepreneurship projects by using analytical hierarchy process (AHP). Technol. Soc. 2018, 54, 41–46. [Google Scholar] [CrossRef]
  22. Ghimire, L.P.; Kim, Y. An analysis on barriers to renewable energy development in the context of Nepal using AHP. Renew. Energy 2018, 129, 446–456. [Google Scholar] [CrossRef]
  23. Han, Y.; Wang, Z.; Lu, X.; Hu, B. Application of AHP to road selection. ISPRS Int. J. Geo-Inf. 2020, 9, 86. [Google Scholar] [CrossRef] [Green Version]
  24. Zhang, C.; Kwon, S.; Oh, J.; Park, K. An integrated AHP-PROMETHEE II ranking method to evaluate the resilience of sewer networks considering urban flood and ground collapse risks. Water Sci. Technol. 2023, 87, 1438–1453. [Google Scholar] [CrossRef]
  25. Milosevic, M.R.; Milosevic, D.M.; Stevic, D.M.; Kovacevic, M. Interval valued Pythagorean fuzzy AHP integrated model in a smartness assessment framework of buildings. Axioms 2023, 12, 286. [Google Scholar] [CrossRef]
  26. Barrios, M.A.O.; De Felice, F.; Negrete, K.P.; Romero, B.A.; Arenas, A.Y.; Petrillo, A. An AHP-TOPSIS integrated model for selecting the most appropriate tomography equipment. Int. J. Inf. Technol. Decis. Mak. 2016, 15, 861–885. [Google Scholar] [CrossRef]
  27. Azimifard, A.; Moosavirad, S.H.; Ariafar, S. Selecting sustainable supplier countries for Iran’s steel industry at three levels by using AHP and TOPSIS methods. Resour. Policy 2018, 57, 30–44. [Google Scholar] [CrossRef]
  28. Liu, J.W.; Wang, D.J.; Lin, Q.L.; Deng, M.K. Risk assessment based on FMEA combining DEA and cloud model: A case application in robot-assisted rehabilitation. Expert Syst. Appl. 2023, 214, 119119. [Google Scholar] [CrossRef]
  29. Lei, F.; Wei, G.W.; Gao, H.; Wu, J.; Wei, C. TOPSIS method for developing supplier selection with probabilistic linguistic information. Int. J. Fuzzy Syst. 2020, 22, 749–759. [Google Scholar] [CrossRef]
  30. Silva, D.F.D.; Ferreira, L.; de Almeida, A.T. Preference disaggregation on TOPSIS for sorting applied to an economic freedom assessment. Expert Syst. Appl. 2023, 215, 119341. [Google Scholar] [CrossRef]
  31. Jin, J.L.; Garg, H. Intuitionistic fuzzy three-way ranking-based TOPSIS approach with a novel entropy measure and its application to medical treatment selection. Adv. Eng. Softw. 2023, 180, 103459. [Google Scholar] [CrossRef]
  32. Li, P.F.; Edalatpanah, S.A.; Sorourkhah, A.; Yaman, S.; Kausar, N. An integrated fuzzy structured methodology for performance evaluation of high schools in a group decision-making problem. Systems 2023, 11, 159. [Google Scholar] [CrossRef]
  33. Zadeh, L.A. Fuzzy sets. Inf. Control 1965, 8, 338–353. [Google Scholar] [CrossRef] [Green Version]
  34. Faizi, S.; Rashid, T.; Salabun, W.; Zafar, S.; Watrobski, J. Decision making with uncertainty using hesitant fuzzy sets. Int. J. Fuzzy Syst. 2018, 20, 93–103. [Google Scholar] [CrossRef] [Green Version]
  35. Garg, H.; Kumar, K. Linguistic interval-valued Atanassov intuitionistic fuzzy sets and their applications to group decision making problems. IEEE Trans. Fuzzy Syst. 2019, 27, 2302–2311. [Google Scholar] [CrossRef]
  36. Mathew, M.; Chakrabrotty, R.K.; Ryan, M.J. A novel approach integrating AHP and TOPSIS under spherical fuzzy sets for advanced manufacturing system selection. Eng. Appl. Artif. Intell. 2020, 96, 103988. [Google Scholar] [CrossRef]
  37. Wen, T.C.; Chung, H.Y.; Chang, K.H.; Li, Z.S. A flexible risk assessment approach integrating subjective and objective weights under uncertainty. Eng. Appl. Artif. Intell. 2021, 103, 104310. [Google Scholar] [CrossRef]
  38. Zadeh, L.A. The concept of a linguistic variable and its application to approximate reasoning-I. Inf. Sci. 1975, 8, 199–249. [Google Scholar] [CrossRef]
  39. Herrera, F.; Martinez, L. A 2-tuple fuzzy linguistic representation model for computing with words. IEEE Trans. Fuzzy Syst. 2000, 8, 746–752. [Google Scholar]
  40. Liu, P.D.; Chen, S.M. Multiattribute group decision making based on intuitionistic 2-tuple linguistic information. Inf. Sci. 2018, 430, 599–619. [Google Scholar] [CrossRef]
  41. Wen, T.C.; Chang, K.H.; Lai, H.H. Improving personnel selection by combining the minimal variance OWA operator and IPA. J. Intell. Fuzzy Syst. 2018, 35, 6229–6239. [Google Scholar] [CrossRef]
  42. Sohaib, O.; Naderpour, M.; Hussain, W.; Martinez, L. Cloud computing model selection for e-commerce enterprises using a new 2-tuple fuzzy linguistic decision-making method. Comput. Ind. Eng. 2019, 132, 47–58. [Google Scholar] [CrossRef]
  43. Li, G.F.; Li, Y.; Chen, C.H.; He, J.L.; Hou, T.W.; Chen, J.H. Advanced FMEA method based on interval 2-tuple linguistic variables and TOPSIS. Qual. Eng. 2020, 32, 653–662. [Google Scholar] [CrossRef]
  44. Lin, J.Q.; Yu, R.; Xu, X.R. Grey relational analysis method for building material suppliers selection based on the 2-tuple linguistic neutrosophic number. J. Intell. Fuzzy Syst. 2023, 44, 4185–4196. [Google Scholar] [CrossRef]
  45. Utama, D.M. AHP and TOPSIS integration for green supplier selection: A case study in Indonesia. J. Phys. Conf. Ser. 2021, 1845, 012015. [Google Scholar] [CrossRef]
  46. Karabasevic, D.; Ulutas, A.; Stanujkic, D.; Saracevic, M.; Popovic, G. A new fuzzy extension of the simple WISP method. Axioms 2022, 11, 332. [Google Scholar] [CrossRef]
  47. Rostamzadeh, R.; Sofian, S. Prioritizing effective 7Ms to improve production systems performance using fuzzy AHP and fuzzy TOPSIS (case study). Expert Syst. Appl. 2011, 38, 5166–5177. [Google Scholar] [CrossRef]
  48. Feizizadeh, B.; Roodposhti, M.S.; Jankowski, P.; Blaschke, T. A GIS-based extended fuzzy multi-criteria evaluation for landslide susceptibility mapping. Comput. Geosci. 2014, 73, 208–221. [Google Scholar] [CrossRef] [PubMed] [Green Version]
  49. Tao, Z.F.; Chen, H.Y.; Zhou, L.G.; Liu, J.P. 2-Tuple linguistic soft set and its application to group decision making. Soft Comput. 2015, 19, 1201–1213. [Google Scholar] [CrossRef]
  50. Aires, R.F.D.; Ferreira, L. A new approach to avoid rank reversal cases in the TOPSIS method. Comput. Ind. Eng. 2019, 132, 84–97. [Google Scholar] [CrossRef]
Figure 1. Example of a symbolic translation of the 2-tuple FLM.
Systems 11 00293 g001
Figure 2. The flowchart of the proposed novel soft fuzzy AHP–TOPSIS method.
Systems 11 00293 g002
Figure 3. Hierarchy analysis structure, displaying the decision-making problem.
Systems 11 00293 g003
Table 1. AHP method evaluation scale.
Evaluation DegreeImportance ComparisonDefinition
1Equally Both elements are regarded as equally important
3Slightly Tend to slightly value the more important element
5StronglyStrongly value the element that is more important
7Very strongly The element is highly associated with importance
9Absolutely Absolutely considers the element as more important than the other
2, 4, 6, 8Between each semanticImportance is a compromise between the criteria above
Table 2. Linguistic evaluation conversion in a triangular fuzzy set.
Linguistic VariableEvaluation ScaleTriangular Fuzzy SetThe Reciprocal of the ScaleThe Reciprocal of the Triangular Fuzzy Set
Same importance1(1, 1, 1)1(1, 1, 1)
2(3/2, 2, 5/2)1/2(2/5, 1/2, 2/3)
Slight importance3(5/2, 3, 7/2)1/3(2/7, 1/3, 2/5)
4(7/2, 4, 9/2)1/4(2/9, 1/4, 2/7)
Strong importance5(9/2, 5, 11/2)1/5(2/11, 1/5, 2/9)
6(11/2, 6, 13/2)1/6(2/13, 1/6, 2/11)
Very strong importance7(13/2, 7, 15/2)1/7(2/15, 1/7, 2/13)
8(15/2, 8, 17/2)1/8(2/17, 1/8, 2/15)
Absolute importance9(17/2, 9, 9)1/9(1/9, 1/9, 2/17)
Table 3. RI value for different matrix sizes.
Size of matrix (n)12345678910
RI0.000.000.580.901.121.241.321.411.451.49
Table 4. List of evaluation criteria.
ItemEvaluation CriteriaClassification
QUQuality Benefit
EMEnvironment management systemBenefit
EPEnvironmental protection materialBenefit
ECEco-package Benefit
PRPrice Cost
DIDistanceCost
Note: The unit of PR is per hundred thousand IDR; the unit of DI is kilometers.
Table 5. Indicators’ pairwise comparison matrix for the selection of a green supplier of raw materials.
ExpertQUEMEPECPRDI
QUE1(1, 1, 1)(9/2, 5, 11/2)(9/2, 5, 11/2)(13/2, 7, 15/2)(1, 1, 1)(7/2, 4, 9/2)
E2(1, 1, 1)(3/2, 2, 5/2)(7/2, 4, 9/2)(9/2, 5, 11/2)(2/7, 1/3, 2/5)(9/2, 5, 11/2)
E3(1, 1, 1)(5/2, 3, 7/2)(5/2, 3, 7/2)(11/2, 6, 13/2)(2/7, 1/3, 2/5)(5/2, 3, 7/2)
E4(1, 1, 1)(7/2, 4, 9/2)(11/2, 6, 13/2)(13/2, 7, 15/2)(2/5, 1/2, 2/3)(9/2, 5, 11/2)
EME1(2/11, 1/5, 2/9)(1, 1, 1)(1, 1, 1)(9/2, 5, 11/2)(2/11, 1/5, 2/9)(2/7, 1/3, 2/5)
E2(2/5, 1/2, 2/3)(1, 1, 1)(5/2, 3, 7/2)(7/2, 4, 9/2)(2/9, 1/4, 2/7)(2/11, 1/5, 2/9)
E3(2/7, 1/3, 2/5)(1, 1, 1)(3/2, 2, 5/2)(11/2, 6, 13/2)(2/5, 1/2, 2/3)(2/9, 1/4, 2/7)
E4(2/9, 1/4, 2/7)(1, 1, 1)(7/2, 4, 9/2)(9/2, 5, 11/2)(2/7, 1/3, 2/5)(2/5, 1/2, 2/3)
EPE1(2/11, 1/5, 2/9)(1, 1, 1)(1, 1, 1)(5/2, 3, 7/2)(2/9, 1/4, 2/7)(2/7, 1/3, 2/5)
E2(2/9, 1/4, 2/7)(2/7, 1/3, 2/5)(1, 1, 1)(3/2, 2, 5/2)(2/13, 1/6, 2/11)(2/9, 1/4, 2/7)
E3(2/7, 1/3, 2/5)(2/5, 1/2, 2/3)(1, 1, 1)(7/2, 4, 9/2)(2/11, 1/5, 2/9)(2/13, 1/6, 2/11)
E4(2/13, 1/6, 2/11)(2/9, 1/4, 2/7)(1, 1, 1)(9/2, 5, 11/2)(2/9, 1/4, 2/7)(2/7, 1/3, 2/5)
ECE1(2/15, 1/7, 2/13)(2/11, 1/5, 2/9)(2/7, 1/3, 2/5)(1, 1, 1)(2/15, 1/7, 2/13)(2/11, 1/5, 2/9)
E2(2/11, 1/5, 2/9)(2/9, 1/4, 2/7)(2/5, 1/2, 2/3)(1, 1, 1)(2/13, 1/6, 2/11)(2/17, 1/8, 2/15)
E3(2/13, 1/6, 2/11)(2/13, 1/6, 2/11)(2/9, 1/4, 2/7)(1, 1, 1)(2/15, 1/7, 2/13)(2/13, 1/6, 2/11)
E4(2/15, 1/7, 2/13)(2/11, 1/5, 2/9)(2/11, 1/5, 2/9)(1, 1, 1)(2/17, 1/8, 2/15)(2/13, 1/6, 2/11)
PRE1(1, 1, 1)(9/2, 5, 11/2)(7/2, 4, 9/2)(13/2, 7, 15/2)(1, 1, 1)(7/2, 4, 9/2)
E2(5/2, 3, 7/2)(7/2, 4, 9/2)(11/2, 6, 13/2)(11/2, 6, 13/2)(1, 1, 1)(5/2, 3, 7/2)
E3(5/2, 3, 7/2)(3/2, 2, 5/2)(9/2, 5, 11/2)(13/2, 7, 15/2)(1, 1, 1)(9/2, 5, 11/2)
E4(3/2, 2, 5/2)(5/2, 3, 7/2)(7/2, 4, 9/2)(15/2, 8, 17/2)(1, 1, 1)(7/2, 4, 9/2)
DIE1(2/9, 1/4, 2/7)(5/2, 3, 7/2)(5/2, 3, 7/2)(9/2, 5, 11/2)(2/9, 1/4, 2/7)(1, 1, 1)
E2(2/11, 1/5, 2/9)(9/2, 5, 11/2)(7/2, 4, 9/2)(15/2, 8, 17/2)(2/7, 1/3, 2/5)(1, 1, 1)
E3(2/7, 1/3, 2/5)(7/2, 4, 9/2)(11/2, 6, 13/2)(11/2, 6, 13/2)(2/11, 1/5, 2/9)(1, 1, 1)
E4(2/11, 1/5, 2/9)(3/2, 2, 5/2)(5/2, 3, 7/2)(11/2, 6, 13/2)(2/9, 1/4, 2/7)(1, 1, 1)
Table 6. Suppliers’ evaluation scores.
SuppliersExpertQUEMEPECPRDI
Supplier 1E1s3s4s4s46.5020
E2s4s5s6s5
E3s5s6s5s3
E4s6s4s4s2
Supplier 2E1s5s3s4s36.0025
E2s4s5s5s2
E3s6s5s5s2
E4s6s3s4s2
Supplier 3E1s4s4s3s36.2530
E2s3s3s3s5
E3s3s2s2s4
E4s4s3s4s2
Supplier 4E1s5s4s5s37.0050
E2s5s4s4s4
E3s6s5s6s5
E4s4s3s5s3
Supplier 5E1s4s3s3s46.2030
E2s4s5s4s5
E3s6s6s6s5
E4s5s4s5s3
Supplier 6E1s3s3s4s36.2030
E2s5s3s3s4
E3s4s3s4s3
E4s4s2s5s3
Note: The unit of PR is per hundred thousand IDR; the unit of DI is kilometers.
Table 7. Calculation results of the typical TOPSIS method.
SuppliersQUEMEPECPRDI S i + S i C i Rank
S10.0730.083 0.0750.0760.0690.042 0.005 0.088 0.943 1
S20.073 0.067 0.0750.0380.0640.053 0.043 0.065 0.604 3
S30.0580.050 0.0450.0760.0670.063 0.052 0.057 0.526 4
S40.073 0.067 0.0750.0760.0750.1060.066 0.053 0.444 6
S50.073 0.083 0.0750.0760.0660.063 0.021 0.074 0.778 2
S60.0580.050 0.0600.0570.0660.063 0.049 0.049 0.504 5
Z + 0.073 0.083 0.0750.0760.0640.042
Z 0.0580.050 0.0450.038 0.0750.106
Table 8. Comparison matrix of the typical AHP method.
CriteriaQUEMEPECPRDI
QU14561/24
EM1/41351/31/3
EP1/51/3141/51/4
EC1/61/51/411/71/6
PR235714
DI1/43461/41
Table 9. Calculation results of the typical AHP–TOPSIS method.
SuppliersQUEMEPECPRDI S i + S i C i Rank
S10.1300.0510.0250.0130.1500.0400.0120.0700.8581
S20.1300.0400.0250.0070.1390.0490.0160.0620.7992
S30.1040.0300.0150.0130.1440.0590.0400.0440.5215
S40.1300.0400.0250.0130.1620.0990.0640.0300.3206
S50.1300.0510.0250.0130.1430.0590.0200.0560.7343
S60.1040.0300.0200.0100.1430.0590.0390.0440.5304
Z + 0.1300.0510.0250.0130.1390.040
Z 0.1040.0300.0150.0070.1620.099
Table 10. Linguistic comparison matrix of the proposed novel soft fuzzy AHP–TOPSIS method.
CriteriaQUEMEPECPRDI
QU (1.000) (3.500) (4.500) (6.250) (0.550) (4.250)
EM (0.286) (1.000) (2.500) (5.000) (0.329) (0.329)
EP (0.222) (0.400) (1.000) (3.500) (0.219) (0.275)
EC (0.160) (0.200) (0.286) (1.000) (0.145) (0.165)
PR (1.817) (3.040) (4.576) (6.903) (1.000) (4.000)
DI (0.235) (3.040) (3.638) (6.046) (0.250) (1.000)
Table 11. Calculation results of the proposed method.
SuppliersQUEMEPECPRDI S + S CiRank
S1 (0.122) (0.050) (0.027) (0.012) (0.148) (0.040) (0.023) (0.070) (0.750)2
S2 (0.142) (0.042) (0.025) (0.008) (0.136) (0.049) (0.015) (0.074) (0.835)1
S3 (0.095) (0.031) (0.017) (0.012) (0.142) (0.059) (0.056) (0.043) (0.436)5
S4 (0.135) (0.042) (0.028) (0.013) (0.159) (0.099) (0.064) (0.044) (0.408)6
S5 (0.129) (0.047) (0.025) (0.015) (0.141) (0.059) (0.025) (0.059) (0.705)3
S6 (0.108) (0.029) (0.023) (0.011) (0.141) (0.059) (0.045) (0.046) (0.505)4
Z + (0.142) (0.050) (0.028) (0.015) (0.136) (0.040)
Z (0.095) (0.029) (0.017) (0.008) (0.159) (0.099)
Table 12. Comparison of the calculation results of the three different research methods.
Research MethodScoreRanking
TOPSIS Method [50]AHP–TOPSIS Method [27]Proposed Method TOPSIS Method [50]AHP–TOPSIS Method [27]Proposed Method
Supplier 10.943 0.858 (0.750)112
Supplier 20.604 0.799 (0.835)321
Supplier 30.526 0.521 (0.436)455
Supplier 40.444 0.320 (0.408)666
Supplier 50.778 0.734 (0.705)233
Supplier 60.504 0.530 (0.505)544
Table 13. Differences in information processing and weights considered for the three different research methods.
Research MethodHandle Qualitative and Quantitative Information SimultaneouslyFully Consider the Differences of Weight between CriteriaObjectively Estimate Information Provided by ExpertsFully Consider Available Information
TOPSIS method [50]XXXX
AHP–TOPSIS method [27]OOXX
Proposed methodOOOO
Disclaimer/Publisher’s Note: The statements, opinions and data contained in all publications are solely those of the individual author(s) and contributor(s) and not of MDPI and/or the editor(s). MDPI and/or the editor(s) disclaim responsibility for any injury to people or property resulting from any ideas, methods, instructions or products referred to in the content.

