Article

ICT Use, Environmental Quality Perception and Farmers’ Participation in Domestic Waste Separation: Micro-Survey Data from China

1
China Rural Policy and Practice Research Institute, Ningbo University, Ningbo 315211, China
2
School of Marine Sciences, Ningbo University, Ningbo 315211, China
3
School of Management, China University of Mining and Technology (Beijing), Beijing 100083, China
*
Author to whom correspondence should be addressed.
Systems 2023, 11(6), 295; https://doi.org/10.3390/systems11060295
Submission received: 18 April 2023 / Revised: 4 June 2023 / Accepted: 6 June 2023 / Published: 9 June 2023

Abstract

:
Encouraging farmers to participate in domestic waste sorting is an important initiative to optimize rural habitats and build a beautiful countryside. Using data from a sample of 2126 farmers obtained from a Chinese micro-survey, this paper empirically investigates the impact of ICT use on farmers’ domestic waste classification using OLS and ordered probability models and examines the mediating role of environmental quality perception. The study shows that ICT use has a significant negative effect on farmers’ environmental quality perceptions and a significant positive effect on farmers’ domestic waste sorting. Furthermore, the direct positive effect of ICT use on farmers’ domestic waste sorting is greater than its negative indirect effect through environmental quality perceptions. Finally, farmers with ICT use are more willing to participate in domestic waste sorting. This suggests that farmers may have a tendency to complain and express dissatisfaction on the internet but still behave in a way that is participatory in waste sorting. The results of the study still hold after a rigorous robustness test. In addition, there are significant differences in the impact of ICT use on different age and income groups, so policies should be tailored to different groups. More attention should be paid to the environmental welfare effects on older and lower-income groups.

1. Introduction

Rural household waste sorting is an important initiative to promote the improvement of rural habitats and build a beautiful countryside, and it is an important way to cope with the contradictions of economic development and green energy constraints [1]. In recent years, with the continuous economic and social development of some countries, farmers’ income has continued to improve, and their consumption patterns and consumption structure have undergone many important changes. With this, the production of various types of food packaging, various types of food waste and other household waste in rural areas has continued to increase [2]. This phenomenon is particularly prevalent in developing countries such as China [3]. According to the results of China’s seventh census in 2021, the population living in rural areas is 509.79 million. The average rural household produces 0.8 kg of household waste per person per day, which means that about 204 million tonnes of household waste are produced in rural areas every year. Nearly a quarter of household waste is not adequately sorted and recycled [4]. In addition, rural pollution is widespread, farmers’ awareness of environmental protection is weak and the lack of support systems for waste treatment has made the environmental pollution problem caused by rural domestic waste more and more serious [5]. This has had a significant negative impact on farmers’ quality of life and physical health, the public image of the government and the quality of economic development in China [6]. Encouraging farmers to participate in waste segregation and recycling is the most economical and effective measure to solve the problem of rural waste pollution. It is also an important concern for government policy formulation [7,8]. For example, the Ministry of Housing and Urban Rural Development of China issued the “Several Opinions on Further Promoting the Classification of Domestic Waste” in 2020, which stated that “it is encouraged to explore and utilize technological means such as big data, artificial intelligence, the Internet of Things, the internet, and mobile apps to promote the development of industries related to domestic waste classification”. Similar studies from Malaysia [9], Latin American and Caribbean countries [10], Pakistan [11] and others have also confirmed these findings. Therefore, one of the important research topics of environmental economics is to clarify the factors influencing farmers’ domestic-waste-sorting behavior and to find more efficient and economical solutions to improve farmers’ participation in domestic waste sorting, which also has positive implications for the policy of precision supply. It is of great theoretical importance and practical value to study this issue in depth.
Scholars have studied the factors that influence farmers’ domestic waste sorting behavior in depth. The study of farmers’ domestic-waste-sorting behavior is a cross-disciplinary study that includes areas of research from a variety of disciplinary backgrounds in economics, management, environmental science, psychology and agricultural science. In terms of individual characteristics, farmers’ gender [12], age [13], household income [14] and political status [15] may all influence farmers’ attitudes towards domestic waste sorting. In terms of intrinsic cognition, Arminda and Tânia (2017) [16] argue that cognition has a significant impact on behavior and that individuals’ perceptions of the environment can influence environmental decisions. For example, trust mechanisms between individuals can effectively address the cognitive-behavioral transition puzzle [17], and psychological qualities are an important factor influencing people’s internal perceptions [18]. Farmers’ educational level [19,20], residential living habits [21], internal belief characteristics [22] and adherence to moral ethics also drive changes in farmers’ household-waste-sorting behavior. At the social level, social capital [23], socially shared moral and value systems [24] and class characteristics [25] also unconsciously influence farmers’ internal perceptions and shape their behavioral characteristics related to environmental protection. In terms of external scenarios, shifts in government policy supply [26], changes in rural infrastructure [27] and improvements in the regulatory system for domestic waste recycling may influence individuals’ perceptions and behaviors. Looking further, technological progress is also an important variable in changing farmers’ behavior [28]. The development of information and communication technology, the widespread use of the internet and farmers’ original access to information are significantly enhanced, and the probability of moral hazards due to information asymmetry is significantly reduced [29]. ICT is an important representative feature of technological progress, and the use of communication technology may change the original social development pattern and research paradigm. Therefore, exploring the changes in farmers’ intrinsic environmental perceptions after the use of ICT and its relationship with farmers’ domestic waste separation is an advancement and extension of the existing research and has marginal advancement significance. As time changes, ICT-driven coercive or induced institutional changes occur gradually, the external conditions of people’s behavior may change and cognitive changes may be subtle, making farmers’ domestic-waste-sorting behavior change [30].
Specifically, the development of information and communication technology and the use of the internet may have direct and indirect effects on farmers’ domestic ICT use and may affect the way rural residents obtain information, change farmers’ education levels and skills and improve the way policies are delivered, thus directly influencing individual farmers’ behavior. In addition, ICT use may lead to changes in people’s internal perceptions, which in turn may affect individual farmers’ behavior based on the perceived changes [31]. That is, ICT use may also affect the perception of environmental quality, which in turn may affect farmers’ household-waste-sorting behavior. From this, it can be concluded that the possible mechanisms by which the use of the internet may affect an individual’s behavior may have direct mechanisms and indirect channels of action through perceived environmental quality. A systematic summary of the relationship between farmers’ perceptions of environmental quality and household waste sorting after ICT use will not only help to refine the mechanisms underlying the effect of ICT use on individual farmers’ environmental behavior but also help to provide accurate policy guidance in developing countries when promoting the use of the internet. Based on this, this paper is an attempt to empirically test the effect of ICT use on rural household waste sorting and the mediating effect of environmental quality perceptions in it by using data from a survey of 2126 farmers in China and to analyze the possible heterogeneity of different groups of farmers in it.
The main innovations of this paper are as follows: First, it somewhat expands the research on the influence of ICT and farmers’ domestic waste sorting. Previous studies in the literature may have studied individual farmers’ behavior only in terms of internal and external factors, ignoring the fact that ICT as an emerging variable exerts a dual mechanism on farmers’ internal cognition and external situation, which in turn acts on individual farmers’ behavior. Second, the association between ICT use and residents’ perceptions and residents’ environmental behaviors in the digital era is constructed, and the findings of the study can provide some basis for decision-making in the new era of policy adjustment. As people pay more and more attention to their own perceptions and intrinsic feelings, it makes changes in feelings and personal evaluations play an increasingly important influence on individual behaviors. We need to consider not only the impact a variable may have on external variables but also the change in people’s internal perceptions. The understanding will be more in-depth and detailed. Third, the survey uses data to empirically verify this effect, and through rigorous data modelling and testing, it becomes possible to draw more precise conclusions, and policy development may become more in-depth and detailed.
The paper is structured as follows: Section 2 presents the theoretical and research hypotheses of the paper. Section 3 presents the study’ data sources, study design and descriptive statistics. Section 4 analyzes the heterogeneity and robustness tests of ICT use and the perceived environmental quality on farmers’ domestic waste sorting. Section 5 shows the conclusions and makes policy recommendations.

2. Mechanism Analysis and Research Hypothesis

2.1. ICT Use and Farmers’ Perception of Environmental Quality

With the rapid development of China’s economy in recent years, environmental pollution problems have emerged along with it, and in particular, industrial pollution and agricultural livestock breeding pollution problems related to rural residents have become more frequent, with more emissions of waste gas, wastewater and livestock manure being emitted into the vicinity of their residence, thus directly affecting farmers’ perception of environmental quality. ICT use improves people’s lives without necessarily driving an increase in the perceived environmental well-being of the population [31]. Analysis has shown that the mobile internet has entered millions of households after the spread of ICT to the countryside, especially via smartphones. People can use the internet to express their opinions with a low threshold [32]. A survey showed that 76.2% of respondents would share information on social media, and 21% would follow the information shared by others [33]. When farmers are not satisfied with the quality of the environment around them, they may post dynamics on various internet platforms to convey this message of dissatisfaction; they may also pass on these negative feelings to others by sharing them with neighbors and people around them [34]. At the same time, people have wider access to information, and according to psychological and comparative sociological perspectives, people evaluate their choices and perceive their own welfare with different frames of reference. When farmers are linked to groups that are better off with them through the internet, using these groups as a frame of reference may exacerbate their own dissatisfaction. Specifically, certain kinds of good information do not come out, bad information spreads and ICT amplifies the seemingly bad effects of people’s dissatisfaction with this environment. In addition, the increased frequency of people using the internet also allows a degree of an increase in looking at people’s negative perceptions. As a result, we propose the following hypothesis:
Hypothesis 1:
ICT use may exacerbate farmers’ negative perceptions of environmental quality.

2.2. ICT Use and Farmers’ Participation in Domestic Waste Separation

The development of rural ICT has had an immeasurable effect on the access to information and the shaping of farmers’ life behaviors, and it is also subtly influencing their habits and values [35]. As rural residents use ICT, they learn about and are taught about ecological conservation and are exposed to increased external stimuli, which lead to the understanding that dirty waste piles and improper waste disposal can damage the ecological environment and thus the appearance of villages as well as endanger their own health [36]. At the same time, ICT greatly reduces the number of irrational choices caused by information asymmetry and information imbalance, and it also reduces the transaction costs of people needing to meet and communicate with each other, making decision-making simpler; the negative impact is that it may be subject to biased beliefs and irrationality brought about by information pluralism [37]. It can be seen that the use of ICT may greatly influence residents’ decisions to separate waste for recycling in rural areas. As a result, we propose the following hypothesis:
Hypothesis 2:
ICT use has a significant positive impact on farmers’ domestic waste sorting.

2.3. ICT Use, Environmental Quality Perception and Farmers’ Domestic Waste Separation

Farmers are being gradually exposed to new information and communication technologies, and their information exposure will become more and more enriched, and learning opportunities resulting from ICT use have greatly expanded the cognitive boundaries of farmers [38]. For developing countries or less-well-off peasant households, there are more opportunities to learn and understand that peasant environmental rights are also important rights for survival and development, and they will favor more long-term and sustainable decisions in their own decision-making [39]. Farmers who use ICT are more willing to participate in sorting domestic waste, which is good for farmers to be able to better enjoy a greater life and also helps the Pareto path of society. Another perspective is that after the use of ICT, farmers also compare spaces more and more, their reference system is different, their satisfaction with the environment around them declines, their satisfaction with their environmental rights and interests declines, and the decline in their environmental rights and interests may make farmers less inclined to carry out domestic waste sorting, thus their degree of behavioral activity is reduced. However, in general, farmers may be inclined to whine and express dissatisfaction on the internet, and yet they may behave in a way that is participatory in waste separation. After ICT use, farmers’ environmental quality perceptions may indirectly reduce the domestic waste behavior of farmers who use ICT; however, overall, the direct positive effects of ICT use on farmers’ domestic waste sorting is greater than its negative indirect effect through environmental quality perceptions, and, eventually, farmers who use ICT will be more willing to participate in domestic waste sorting As a result, we propose the following hypothesis:
Hypothesis 3:
The direct positive effect of ICT use on farmers’ domestic waste sorting is greater than its negative indirect effect through.
The relationship between the three core variables was therefore assumed to be as follows (Figure 1):

3. Model and Variables

3.1. Model Design

This paper examined the relationship between ICT use, perceived environmental quality and farmers’ domestic waste sorting. A mediating effects model was needed to identify the possible mediating effects of environmental quality perceptions. Referring to the way [40,41] set up their model, the empirical analysis model was constructed as follows:
E q p i = α 0 + α 1 I c t i + i = 2 α i c o n t r o l s i + υ i
D w s i = β 0 + β 1 I c t j + β 2 E q p j + j = 3 β j c o n t r o l s j + μ i
In Equation (1), E q p i represents perceived environmental quality, I c t i represents ICT use, i = 2 α i c o n t r o l s i represents the combination of control variables that may have an effect on perceived environmental quality and υ i represents a residual term. In Equation (2), D w s i represents the variable of farmers’ participation in domestic waste sorting, I c t j and E q p j have the same meaning as in Equation (1), j = 3 β j c o n t r o l s j represents a combination of other control variables that may have an impact on farmers’ participation in domestic waste sorting and μ i represents a residual term. The three core variable relationships of interest in this paper were identified according to the way the model of mediating effects is set up. When the regression coefficient α 1 of I c t i in Equation (1) is significant, it represents a significant effect of ICT use on farmers’ perceptions of environmental quality, and when the regression coefficients β 1 and β 2 of I c t j and E q p j in Equation (2) are also significant, they represent the ability of ICT use to influence domestic waste sorting through farmers’ perceptions of environmental quality. It is noteworthy that this mediating effect of environmental quality perception is complete when β 1 is not significant but β 2 is significant. In the process of calculation, in the base process, we used the OLS model for regression processing, and for more robust conclusions, Oprobit model processing was also adopted. Considering that the two core variables of environmental quality perception and domestic waste classification were chosen with an obvious ordering, both are discrete ordering variables, which are suitable for the ordered probability model, and the ordered probability model was used in the calculation process for model measurement.

3.2. Data Sources

A micro-survey is related to a macro-survey, and its main subject is the micro-individual, with a systematic investigation of micro-individuals in all aspects of a specific situation. A micro-survey is a better way to understand individual behaviors in detail and to study the laws behind individual behaviors. In this study, the survey was conducted by surveying farmers one by one, which is a typical micro-survey method. Questionnaire research is one of the most important ways to obtain data for studies, and we used questionnaire research to obtain the data we needed to use in conducting this study. The questionnaire was distributed on a trial basis in some areas in the previous period, and the collected data and recommendations were revised to form the final distribution data. Based on the final questionnaire, a large-scale data distribution was conducted, and the time period for collecting the data was from April 2020 to July 2020. We organized a wide range of undergraduate and some graduate students from Ningbo University as data collectors. In order to ensure the reliability of the data obtained, training was conducted for each participant, and each person was asked to collect no more than 10 copies of data. Based on the differences in the economic and social environments in eastern, central and western China, we selected 11 provinces in China and randomly selected counties and villages in each province. Then, we conducted the questionnaire research one by one in order to guarantee a more extensive and differentiated data acquisition. More than 2200 questionnaires were returned in the survey, and some missing values and some values that did not match the actual situation were found in the collation. After deleting these data, the number of questionnaires that could be used in the article was 2126.
We tried to sort the basic data of the questionnaires (see Table 1). A total of 46.52% of the sample was male, and the three variables age, net income and degree were also widely distributed. A total of 5.93% of the sample of village cadres, 16.42% of the sample of Chinese Communist Party members and 16.42% of the sample whose main income came from agricultural income made up 82.97% of the total sample, and 58.75% of the sample came from eastern China, with relatively more samples being obtained from the eastern region. Overall, the sample data were widely distributed and were representative of the actual situation in rural China.

3.3. Variables

3.3.1. Separation of Farmers’ Domestic Waste (Dws)

To measure this variable, and referring to the existing studies by [1,42], the questionnaire included the question, “how do you dispose of your household waste?” If the answer was not to sort the garbage, a value of 1 was assigned. Only those that could be sold for value were selected for classification, and this option was assigned a value of 2. After sorting those that could be sold for value, food waste was also sorted, and this option was assigned a value of 3. After sorting food waste that could be sold for value, hazardous waste was also sorted, and this option was assigned a value of 4. The statistics of the farmers’ domestic waste classification showed (see Table 2) that 1180 samples of the survey reported mixing domestic waste. That is to say that 55.50% of the farmers did not classify their domestic waste finely into three categories of treatment and four categories of treatment, and the proportion was 13.17% and 6.07%, respectively. This indicated that there are still a large proportion of rural areas in China where improvements to the space of rural household waste classification and treatment can be made, especially in some areas where the establishment of a waste-free zone is required. There is still a greater degree of need to guide farmers to participate more in waste classification and treatment.

3.3.2. Environmental Quality Satisfaction (Eqp)

In previous studies, a five-point scale has been used to measure residents’ perceptions of environmental quality [40], and with reference to the existing studies, we also used the question “Satisfaction with local environmental quality” to carefully identify the perceptions of environmental quality. The perception of environmental quality was an ordinal selection variable that was defined as follows: very dissatisfied = 1; relatively dissatisfied = 2; general = 3; relatively satisfied = 4; very satisfied = 5. According to the statistics, that the mean value of the perception of environmental quality was 3.456, and the standard deviation was 0.864.

3.3.3. ICT Use

ICT use is a variable that has received more widespread attention. The measurement of ICT use is divided into two broad areas: the adoption of ICT variables and the frequency of the use of ICT. In this study, the ICT adoption variable was used, and this measure is a relatively common and mature measure, which has been corroborated in the existing literature and has yielded relatively good results [43].
ICT use is the most typical result of digital technology applications in rural areas. The use of mobile phones, computers and other equipment is often used to measure ICT use in micro-survey data, and this approach has been widely validated in existing studies [40]. To better measure ICT use, we set the question “Do you use mobile phones, computers and other equipment to obtain information?” to identify ICT use, with reference to the existing studies of [41]. Farmers who used the internet answered yes, and those who did not use the internet answered no. According to the statistics, the number of farmers that used the internet among the 2126 rural households studied was 1683, reaching 79.16% of the total sample, which was higher than the average percentage of rural internet use in 2020 announced by China. The reason was that we had more samples from the eastern part of China in this survey, which is relatively developed and has richer access to information. This situation is in line with the rural reality.
The percentage of farmers using ICT who participated in waste separation was significantly higher than that of farmers using ICT who did not participate in waste separation. It was preliminarily seen that farmers using ICT were more inclined to participate in waste separation, but of course this conclusion was subject to the next empirical verification. The proportion of farmers using ICT who rated environmental quality as better was not significantly higher than the proportion of farmers using ICT who rated environmental quality as worse. It was preliminarily seen that farmers who used ICT did not evaluate environmental quality as better. There may be a negative relationship between ICT use and farmers’ perception of environmental quality.

3.3.4. Control Variables

According to previous studies, gender, age, education, income status, identity characteristics, village characteristics and surroundings may be influential factors in farmers’ behavior [44,45]. However, these variables were not the main variables of interest in this paper, so they were used as control variables to control for the possible effects of factors other than the core explanatory variables on the explained variables and to make the findings more robust [46]. For this purpose, this paper collected issues related to the individual characteristics of farmers and their business characteristics, external characteristics and geographical characteristics as control variables. The specific meanings and statistical values are shown in Table 3. The distribution of the control variables was seen to overall be relatively broad and representative and suitable for empirical analysis.

4. Analysis of the Results

4.1. Benchmark Regression Analysis Results

In this study, we first engaged in a benchmark regression analysis using an ordered probability model, and the regression analysis findings are presented in Table 4. To obtain more accurate results, this paper also measured the marginal effects of several variables such as ICT use, satisfaction with environmental quality and rural household waste sorting, as shown in Table 5. Columns (1) and (2) in Table 4 show that the regression coefficients of ICT variables on Eqs variables were significantly negative, and the R2 values were considerably increased without and with the addition of the control variables, respectively. This indicated that ICT use had a significant negative effect on the satisfaction with environmental quality among rural residents. This means that compared with farmers who did not use ICT, farmers’ satisfaction with local environmental quality decreased after using ICT, which was consistent with the findings of Zhang et al. (2020) [47]. The results of the marginal effects of Columns (1)–(5), as shown in Table 5, showed that, compared with farmers who did not use ICT, the probability of farmers who used ICT to rate their satisfaction with environmental quality as very dissatisfied, relatively dissatisfied and general increased by 0.375%, 1.19% and 1.87%, respectively, and the probability of them rating their satisfaction with environmental quality as relatively satisfied and very satisfied decreased by 1.95% and 1.49%, respectively. Possible explanations for this include the fact that the farmers that used ICT had gained more information about environmental pollution, etc., through the internet. Their thinking shifted, and their satisfaction ratings decreased. This verified the correctness of Hypothesis 1. Columns (3) and (4) in Table 4 show that the regression coefficients of the ICT variable on the Dws variable without and with the addition of control variables, respectively, were significantly positive at the 1% significance level, which indicated that a higher proportion of farmers using ICT participated in waste separation compared to farmers who did not use ICT. The regression coefficient of the Eqs variable on the Dws variable was extremely positive at the 1% significance level, indicating that the higher the satisfaction with environmental quality the more likely that rural residents were to sort their domestic waste. The results of the marginal effects shown in Columns (6)–(9) in Table 5 showed that, compared to farmers who did not use ICT, the probability of choosing 1 for domestic waste sorting decreased by 15.2% for farmers who used ICT; however, the proportions of those choosing 2, 3 and 4 increased by 3.92%, 6.10% and 5.13%, respectively. Compared to those with lower environmental quality satisfaction ratings, those with higher environmental quality satisfaction ratings were more likely to become more satisfied. The probability of choosing 1 for domestic waste classification decreased by 6.62%; however, the proportion of those choosing 2, 3 and 4 increased by 1.71%, 2.67% and 2.24%, respectively. This verified the correctness of Hypothesis 2. Thus, it can be seen that ICT use had both direct and indirect effects on farmers’ participation in rural domestic waste sorting. The use of ICT by rural residents could significantly improve the level of rural domestic waste sorting and indirectly affected the level of farmers’ domestic waste sorting to some extent by reducing rural environmental satisfaction. Specifically, the proportion of the indirect effect was 5.69% (0.123 × 0.189/(−0.123 × 0.189 + 0.432)) of the total effect. This was consistent with what was proposed in Hypothesis 3.
The regression analysis of the control variables showed a greater consistency with previous studies related to ICT use, with those whose income was mainly from farming and those who were closer to secondary schools participating in a lower proportion of household waste sorting, and those with a higher educational structure, party membership and monitoring facility installation characteristics participating in a higher proportion of waste sorting. We also found that individual characteristics such as age, party membership, their main source of income and the evaluation of publicity could affect farmers’ evaluation of environmental quality.
Considering some existing analyses such as those by [40,41], we used ordered probability models and the least-squares method to participate in the regression analysis. Using the least-squares method to participate in a regression analysis can make an article’s conclusions more robust, so we also tried to use the least-squares method for the regression analysis, as shown in Table 6. The results of the least-squares estimation showed great agreement with the results of Table 3, which also verified the robustness of the conclusions of the previous analysis.

4.2. Robustness Tests

4.2.1. Transformation Variables Set to Participate in the Regression Analysis

On the one hand, considering the actual situation of farmers’ participation in waste classification, there may have been more choices for both unclassified and classified domestic waste. Therefore, in the treatment of the explanatory variables, we constructed the binary variable Dws1, as used by ICT, which was assigned to 0 when the farmers mixed their domestic waste and 1 when the farmers started to sort their domestic waste. As Columns (1)–(4) in Table 7 show, when different explanatory variables were used to participate in the regression analysis, the use of ICT showed a significant negative effect on farmers’ perception of environmental quality, while ICT use directly and significantly promoted farmers’ domestic waste separation and indirectly affected farmers’ domestic waste separation level to some extent by reducing rural environmental satisfaction. On the other hand, considering the fact that different ways of setting explanatory variables for environmental quality evaluations may affect the final results, we tried to construct the binary variable Eqs1 for environmental quality evaluation, and we assigned a value of 0 to Eqs1 when the environmental quality evaluation was general, relatively unsatisfactory and very unsatisfactory, and we assigned a value of 1 to Eqs1 when the environmental quality evaluation was relatively satisfactory and very satisfactory. As shown in Columns (5)–(8) in Table 7, the empirical results were generally consistent with the results demonstrated in the benchmark regression analysis and in Columns (1)–(4) in Table 7, thus verifying the robustness of the benchmark regression analysis findings.

4.2.2. Transforming the Empirical Model

Next, the models were further measured for their changes in order to facilitate the elimination of possible problems with the robustness of the results caused by the particular model. From this, we tried to re-run the regression analysis using the Ologit model, and the results are shown in Table 8. The results shown in Columns (1)–(4) showed that the use of ICT showed a significant negative effect on farmers’ perceptions of environmental quality, while ICT use directly and significantly promoted farmers’ domestic waste separation, and indirectly affected farmers’ domestic waste separation level by reducing rural environmental satisfaction to some extent, which again verified the robustness of the empirical model.

4.3. Endogeneity Exploration

Given that the cross-sectional survey data we used may have had endogeneity problems due to survey sample bias or variable self-selection, we attempted to eliminate possible endogeneity problems by using the instrumental variables method. We use internet signal as an instrumental variable for internet usage, and the questionnaire statement was: “Your evaluation of home network signal: Very bad = 1; Poor comparison = 2; General = 3; Better = 4; Very good = 5. 4; Very good = 5”. The main reason was the idea that the better the internet signal, the more basic conditions there are for farmers to use the internet and the more convenient it is to obtain information from the internet, so farmers will be more willing and more likely to use the internet. At the same time, internet signal was not significantly associated with farmers’ participation in terms of waste segregation and was unlikely to influence farmers’ participation in waste segregation, meeting the antecedent conditions for the use of instrumental variables. The results of the regression analyses of the instrumental variables in stage 1 and stage 2 are presented in Table 9. Columns (1) and (2) show the results of the regression analysis of internet signal on ICT use, indicating that the better the network signal, the higher the probability of internet use. Columns (3) and (4) show the results of the regression analysis of the instrumental variables on Eqs and Dws, and the regression coefficients were significant at the mean 1% significance level, which was consistent with the results of the baseline regression analysis. In addition, after we tested the conclusions of the instrumental variables, the conclusions passed the test, indicating that the conclusions of the instrumental variables were robust and valid.

4.4. Exploring the Heterogeneity of Segmented Samples

To explore this in more detail, the samples were next subdivided into different sample groups to explore the issue of the possible heterogeneity of the different subdivided samples. According to the reality of Chinese rural farmer groups, 40 years old is often used as the boundary to divide different generations. In addition, other relevant studies have been divided into groups using the age of 40, such as Liu (2022) [42]. In this paper, we tried to divide the sample into two groups: a group aged 40 and below and a group aged 40 and above, and the regression analysis results are shown in Table 10. Farmers being under 40 years of age did not have a significant effect on the evaluation of ICT use on environmental quality and the level of rural household waste sorting, and there was no significant indirect effect of environmental quality evaluation. Among the farmers aged over 40, internet use had a significant negative effect on environmental quality assessment and a significant positive effect on the level of rural household waste sorting. A significant mediating mechanism existed that influenced the level of rural household waste sorting through environmental quality assessment. This showed that there was a mechanism by which farmers over 40 years of age had a negative impact of internet use on their evaluation of environmental quality, and this directly and indirectly influenced the sorting of rural household waste. This suggested that policy development could be more inclined to promote the use of the internet among people over 40 years of age, and that it may be more effective to develop publicity methods that are consistent with older people.
Different income groups may also have exhibited different effects on the empirical evidence of this paper. To identify the possible heterogeneous effects of different income groups, we tried to divide the samples based on income. According to the Chinese National Bureau of Statistics, the rural per capita income in 2019 (i.e., the year in which this article’s survey data were obtained) was CNY 16,021; the below-average group and the above-average group were bounded by CNY 15,000 against the actual situation in our sample data, as per the existing research [48]. The regression analysis results are shown in Table 11. First, compared with the below-average income group, the above-average income group showed a significant negative effect on the environmental quality evaluation, indicating that the satisfaction of this group and the satisfaction of the low-income group were higher. Second, farmers in the low-income group were more willing to participate more actively in waste separation and recycling after using ICT; this effect was lower in the above-average income group, and it inhibited the willingness of the high-income group to participate in rural waste separation and recycling to some extent through their environmental quality evaluation. This suggested that a more active provision of ICT access opportunities to the low-income group could expand their access to more information and could promote household waste sorting and habitat improvement measures more significantly in the low-income group.

5. Conclusions and Policy Implications

5.1. Conclusions and Limitations

Improving rural habitats is a key task proposed for implementation in China’s Central Document No. 1, and encouraging farmers to participate in domestic waste separation is an important measure to optimize farmers’ habitats and build a beautiful countryside. The detailed study of the impact of the use of emerging communication technology on farmers’ domestic waste sorting and the exploration of the possible mechanisms of action based on a new subjective perspective of environmental quality perceptions in this paper established a good connection between how new technology, an external scenario, affected farmers’ internal perceptions and thus drove their environmental behavior. This study is both in line with current policy practice and has positive implications for the expansion of research perspectives on farmers’ domestic waste separation. Thus, this paper empirically investigated the relationship between ICT use, perceived environmental quality and farmers’ domestic waste separation using OLS and ordered probability models using data from a sample of 2126 farmers obtained from a Chinese micro-survey, and it screened the mediating role of perceived environmental quality in the impact of ICT use on farmers’ domestic waste separation. The results were as follows.
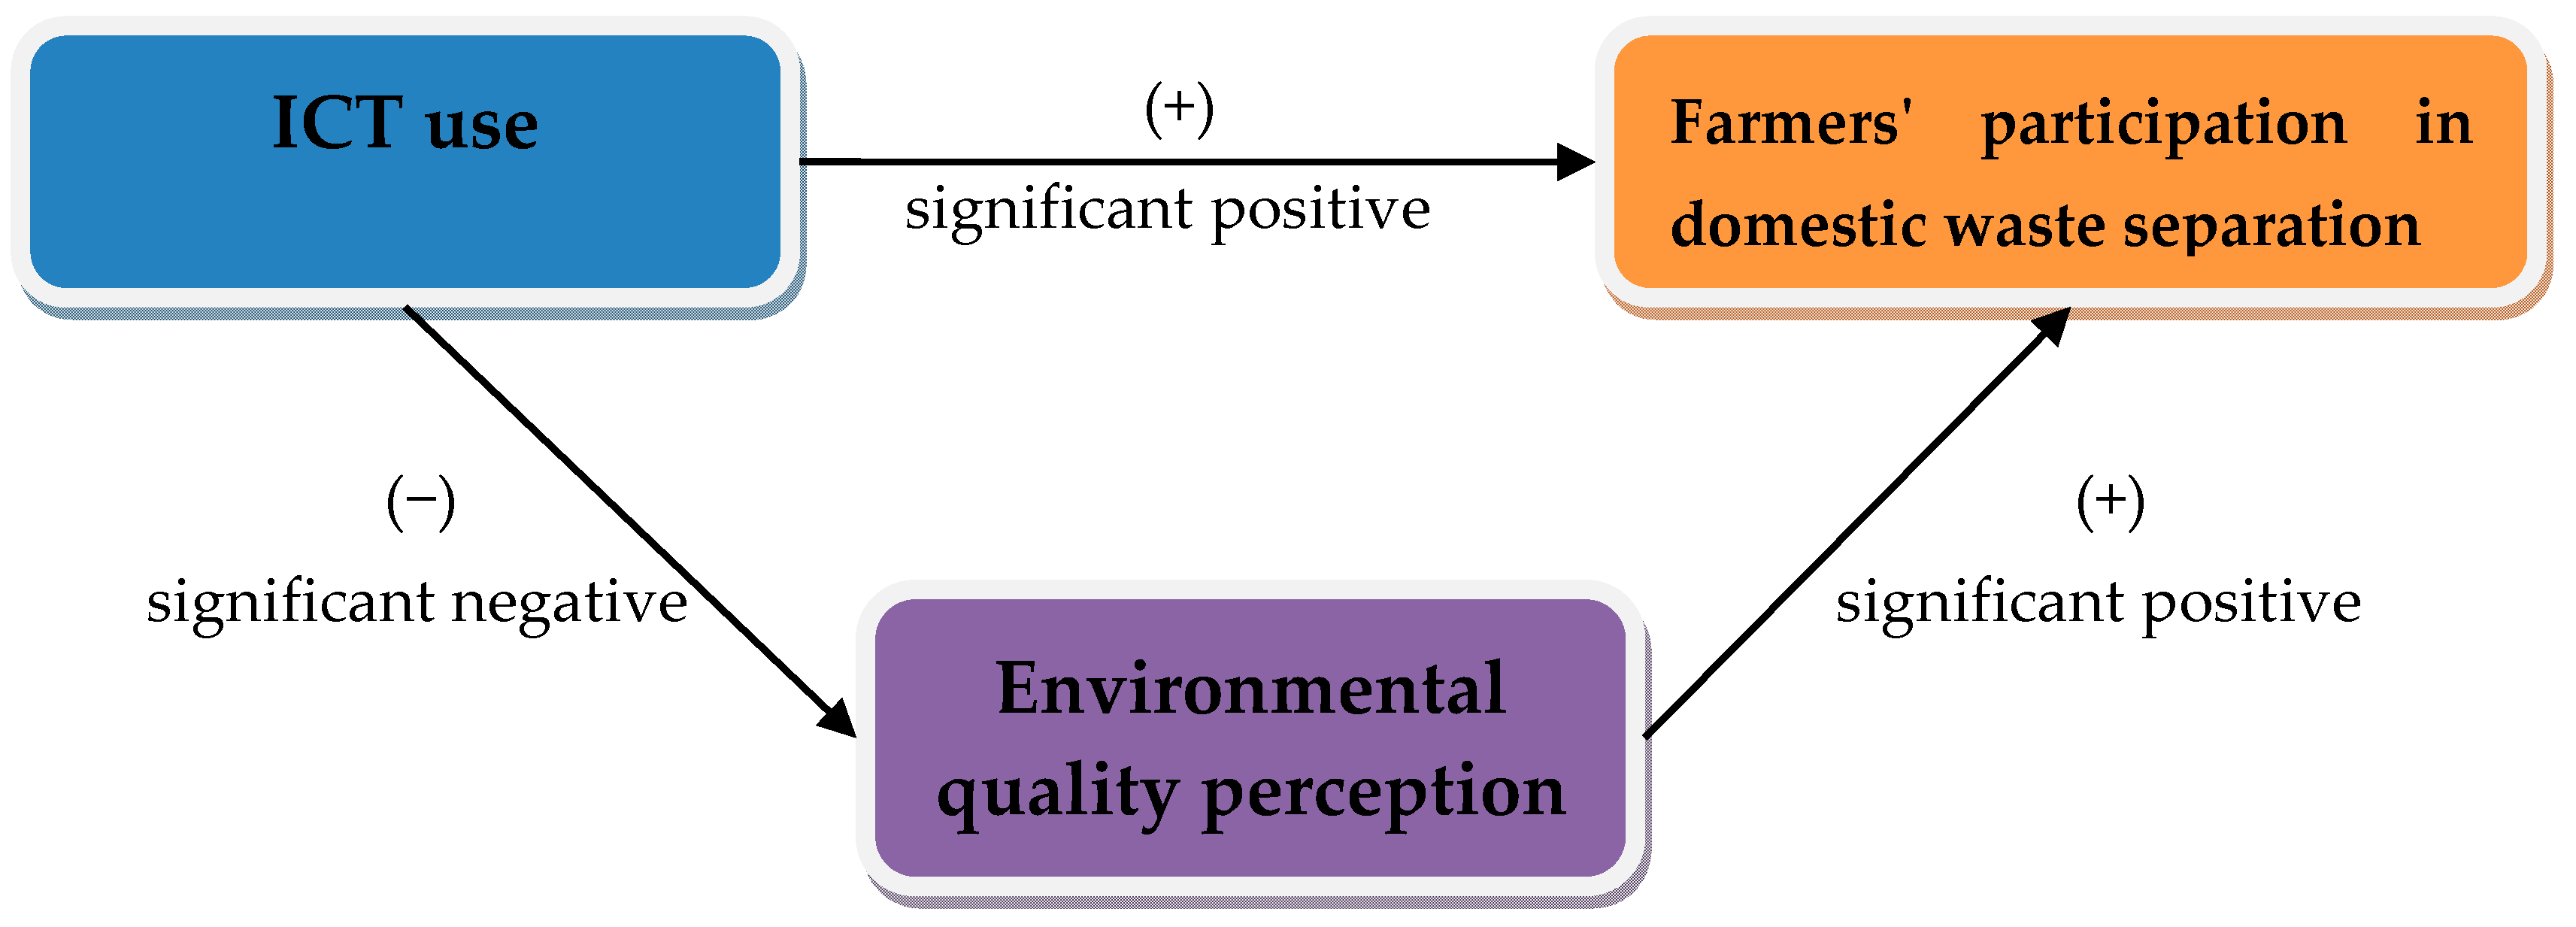
First, ICT use had a significant negative effect on farmers’ perceptions of environmental quality, meaning that farmers who used ICT rated environmental quality lower compared to those who did not use ICT, validating the correctness of Hypothesis 1, and this was consistent with the findings of [40,41]. This indicated that farmers may be exposed to the negative effects of environmental pollution and prone to negative bias after using the internet. With the rapid development of ICT technology, when ICT changes the external world, it also gradually changes the internal mechanisms of economic agents, a fact which has been ignored in previous studies by treating human perception as a fixed variable. In fact, in terms of economic development, people are paying more and more attention to their inner feelings, and their inner needs are gradually recovering, a trend that deserves attention and a factor in the formulation of policies that needs to be paid attention to.
Second, ICT use had a significant positive effect on farmers’ domestic waste sorting, indicating that farmers who used ICT were more willing to carry out domestic waste sorting, which verified Hypothesis 2. This was different from people’s intrinsic perception of this effect and also indicated that ICT use did expand farmers’ cognitive horizons, played an environmental education role and encouraged farmers’ environmental protection decisions to be more rational.
Third, there was a negative indirect effect of farmers’ environmental quality perception between ICT use and farmers’ participation in domestic waste sorting. That is, after ICT use, farmers’ perception of environmental quality may have indirectly reduced farmers’ domestic waste behavior through using ICT. However, overall ICT use had a greater direct positive effect on farmers’ domestic waste sorting than a negative indirect effect through environmental quality perception, and eventually, farmers who used ICT were more willing to participate in domestic waste sorting. This suggests that farmers may be inclined to whine and express dissatisfaction on the internet yet behave in a way that is participatory in terms of waste separation. This analysis was consistent with the actual situation and psychological characteristics of Chinese farmers. The above three conclusions still held after a rigorous robustness test.
Fourth, the heterogeneity analysis showed that compared to farmers aged 40 and below, internet use by farmers aged above 40 had a significantly negative impact on their environmental quality assessment and a quite positive impact on the level of rural household waste segregation, and an effective mediating mechanism existed that influenced the level of rural household waste segregation through environmental quality assessment. Compared with the high-income group, farmers in the low-income group had higher satisfaction and satisfaction after using ICT, and they were more willing to participate in waste separation and recycling more actively. The mechanism of suppressing the willingness of farmers to participate in rural waste separation and recycling through environmental quality assessment to some extent was more evident in the high-income group. This finding provides empirical evidence to support the impact of ICT use on the wellbeing of relatively older, low-income groups.
At the same time, we also found a number of limitations to this article, which we need to overcome in our subsequent research. For example, frequency variables could be used to measure ICT use; however, due to the lack of data available to us, there was no way to carry out a good validation, and there is room for further improvement in the selection of some control variables. This does not mean that this study is not relevant. In fact, this research work provides an interesting perspective on environmental issues and can provide some insight into the existing literature. It also suggests that more detailed and comprehensive thinking is needed in our ongoing work on similar studies in order to make this area of work more solid and inclusive.

5.2. Policy Implications

First, as new communication technologies become widespread in the world, policy makers should gradually pay more attention to the intrinsic perceptions of residents. In similar countries to China, when promoting ICT and improving technical conditions in rural areas, the inner feelings and inner wellbeing of farmers should be taken into account in policy considerations, and more attention should be paid to these people. Attention should be paid to enhancing farmers’ inner happiness and their environmental quality education by strengthening their education in using ICT platforms to channel and guide their inner emotions and negative feelings.
Second, when carrying out rural household waste sorting, more attention should be paid to combining online channels and using new technologies and tools so that rural residents can have better access to ICT technology and truly benefit from its use. Attention should be paid to strengthening the management of false information and rumors on ICT platforms to purify the network and the interconnection conditions around farmers.
Third, when formulating policies, policy provisions should be precisely adjusted according to the characteristics of different groups, with special attention being paid to strengthening the popularization and promotion of the internet among the elderly and low-income groups. During the survey, some older and low-income groups could not enjoy the advantages of the internet for economic or other reasons. It is necessary to pay more attention to the inclination of these groups in policy propaganda and promotion so that they can enjoy the benefits of the internet more.

Author Contributions

Formal analysis, C.Z.; resources, Z.W. and J.J.; writing—original draft, F.C. All authors have read and agreed to the published version of the manuscript.

Funding

This research received no external funding.

Data Availability Statement

The original contributions presented in the study are included in the article, and further inquiries can be directed to the corresponding authors.

Conflicts of Interest

The authors declare no conflict of interest.

References

  1. Li, C.; Li, G. Impact of China’s water pollution on agricultural economic growth: An empirical analysis based on a dynamic spatial panel lag model. Environ. Sci. Pollut. Res. 2021, 28, 6956–6965. [Google Scholar] [CrossRef] [PubMed]
  2. Ma, W.; Nie, P.; Zhang, P.; Renwick, A. Impact of Internet use on economic well-being of rural households: Evidence from China. Rev. Dev. Econ. 2020, 24, 503–523. [Google Scholar] [CrossRef]
  3. Li, X.; Bi, F.; Han, Z.; Qin, Y.; Wang, H.; Wu, W. Garbage source classification performance, impact factor, and management strategy in rural areas of China: A case study in Hangzhou. Waste Manag. 2019, 89, 313–321. [Google Scholar] [CrossRef]
  4. Zheng, D.; Shen, J.; Li, R.; Jian, B.; Zeng, J.; Mao, Y.; Zhang, X.; Halder, P.; Qu, M. Understanding the key factors determining rural domestic waste treatment behavior in China: A meta-analysis. Environ. Sci. Pollut. Res. 2022, 29, 11076–11090. [Google Scholar] [CrossRef] [PubMed]
  5. Liu, S.; Wang, D.; Zhu, C.; Zhou, D. Effect of Straw Return on Hydroxyl Radical Formation in Paddy Soil. Bull. Environ. Contam. Toxicol. 2021, 106, 211–217. [Google Scholar] [CrossRef]
  6. Mehmood, K.; Chang, S.; Yu, S.; Wang, L.; Li, P.; Li, Z.; Liu, W.; Rosenfeld, D.; Seinfeld, J.H. Spatial and temporal distributions of air pollutant emissions from open crop straw and biomass burnings in China from 2002 to 2016. Environ. Chem. Lett. 2018, 16, 301–309. [Google Scholar] [CrossRef]
  7. Tonini, D.; Wandl, A.; Meister, K.; Unceta, P.M.; Taelman, S.E.; Sanjuan-Delmás, D.; Dewulf, J.; Huygens, D. Quantitative sustainability assessment of household food waste management in the Amsterdam Metropolitan Area. Resour. Conserv. Recycl. 2021, 160, 104854. [Google Scholar] [CrossRef]
  8. Yang, X.; Wu, H.; Ren, S.; Ran, Q.; Zhang, J. Does the development of the internet contribute to air pollution control in China? Mechanism discussion and empirical test. Struct. Chang. Econ. Dyn. 2021, 56, 207–224. [Google Scholar] [CrossRef]
  9. Afroz, R.; Rahman, A.; Masud, M.M.; Akhtar, R. The knowledge, awareness, attitude and motivational analysis of plastic waste and household perspective in Malaysia. Environ. Sci. Pollut. Res. 2017, 24, 2304–2315. [Google Scholar] [CrossRef] [PubMed]
  10. Ali, A.; Abdulai, A. The Adoption of Genetically Modified Cotton and Poverty Reduction in Pakistan. J. Agric. Econ. 2010, 61, 175–192. [Google Scholar] [CrossRef]
  11. Ahmed, Z.; Nathaniel, S.P.; Shahbaz, M. The criticality of information and communication technology and human capital in environmental sustainability: Evidence from Latin American and Caribbean countries. J. Clean. Prod. 2021, 286, 125529. [Google Scholar] [CrossRef]
  12. Han, X.; Sun, T.; Feng, Q. Study on environmental pollution loss measurement model of energy consumption emits and its application in industrial parks. Sci. Total. Environ. 2019, 668, 1259–1266. [Google Scholar] [CrossRef]
  13. Zheng, H.; Ma, W. Impact of ICT adoption on cosmetic expenditure of Chinese residents: An exploration accounting for urban-rural differentials. Appl. Econ. Lett. 2021, 29, 1286–1291. [Google Scholar] [CrossRef]
  14. Acharya, B.; Lee, J.; Moon, H. Preference heterogeneity of local government for implementing ICT infrastructure and services through public-private partnership mechanism. Socio-Econ. Plan. Sci. 2022, 79, 101103. [Google Scholar] [CrossRef]
  15. Salahuddin, M.; Alam, K. Internet usage, electricity consumption and economic growth in Australia: A time series evidence. Telemat. Inform. 2015, 32, 862–878. [Google Scholar] [CrossRef]
  16. Paço, A.; Lavrador, T. Environmental knowledge and attitudes and behaviours towards energy consumption. J. Environ. Manag. 2017, 197, 384–392. [Google Scholar] [CrossRef] [PubMed]
  17. Adeleye, B.N.; Adedoyin, F.; Nathaniel, S. The criticality of ICT-trade nexus on economic and inclusive growth. Inf. Technol. Dev. 2021, 27, 293–313. [Google Scholar] [CrossRef]
  18. Alataş, S. The role of information and communication technologies for environmental sustainability: Evidence from a large panel data analysis. J. Environ. Manag. 2021, 293, 112889. [Google Scholar] [CrossRef] [PubMed]
  19. Tan, R.; Lin, B. Public perception of new energy vehicles: Evidence from willingness to pay for new energy bus fares in China. Energy Policy 2019, 130, 347–354. [Google Scholar] [CrossRef]
  20. Wang, B.; Shen, X.; Chen, S.; Bai, Y.; Yang, G.; Zhu, J.; Shu, J.; Xue, Z. Distribution characteristics, resource utilization and popularizing demonstration of crop straw in southwest China: A comprehensive evaluation. Ecol. Indic. 2021, 93, 998–1004. [Google Scholar] [CrossRef]
  21. Lei, L.; Yu, D.; Zhou, Y. Better educated children, better Internet-connected elderly parents. Res. Policy 2023, 52, 104743. [Google Scholar] [CrossRef]
  22. Liu, R.; Wang, Y. Farmers’ household waste disposal behavior and its influencing factors in developing countries: Evidence from jiangsu, china. Appl. Ecol. Environ. Res. 2019, 17, 8737–8748. [Google Scholar] [CrossRef]
  23. Wang, W.-J.; You, X.-Y. Benefits analysis of classification of municipal solid waste based on system dynamics. J. Clean. Prod. 2021, 279, 123686. [Google Scholar] [CrossRef]
  24. Nogueira, V.B.; Teixeira, D.G.; de Lima, I.A.C.N.; Moreira, M.V.C.; de Oliveira, B.S.C.; Pedrosa, I.M.B.; de Queiroz, J.W.; Jeronimo, S.M.B. Towards an inclusive digital literacy: An experimental intervention study in a rural area of Brazil. Educ. Inf. Technol. 2022, 27, 2807–2834. [Google Scholar] [CrossRef] [PubMed]
  25. Wu, H.; Hao, Y.; Ren, S.; Yang, X.; Xie, G. Does internet development improve green total factor energy efficiency? Evidence from China. Energy Policy 2021, 153, 112247. [Google Scholar] [CrossRef]
  26. Yin, H.; Zhao, W.; Li, T.; Cheng, X.; Liu, Q. Balancing straw returning and chemical fertilizers in China: Role of straw nutrient resources. Renew. Sustain. Energy Rev. 2017, 81, 2695–2702. [Google Scholar] [CrossRef]
  27. Chen, L.; Yan, Z.; Tang, W.; Yang, F.; Xie, X.; He, J. Mobile phone addiction levels and negative emotions among Chinese young adults: The mediating role of interpersonal problems. Comput. Hum. Behav. 2016, 55, 856–866. [Google Scholar] [CrossRef]
  28. Zhang, J.; Cheng, M.; Wei, X.; Gong, X.; Zhang, S. Internet use and the satisfaction with governmental environmental protection: Evidence from China. J. Clean. Prod. 2019, 212, 1025–1035. [Google Scholar] [CrossRef]
  29. Zou, B.; Mishra, A.K. How internet use affects the farmland rental market: An empirical study from rural China. Comput. Electron. Agric. 2022, 198, 107075. [Google Scholar] [CrossRef]
  30. Salahuddin, M.; Alam, K. Information and Communication Technology, electricity consumption and economic growth in OECD countries: A panel data analysis. Int. J. Electr. Power Energy Syst. 2016, 76, 185–193. [Google Scholar] [CrossRef] [Green Version]
  31. Añón Higon, D.; Gholami, R.; Shirazi, F. ICT and environmental sustainability: A global perspective. Telemat. Inform. 2017, 34, 85–95. [Google Scholar] [CrossRef]
  32. Chen, Y.; Yang, G.; Sweeney, S.; Feng, Y. Household biogas use in rural China: A study of opportunities and constraints. Renew. Sustain. Energy Rev. 2010, 14, 545–549. [Google Scholar] [CrossRef]
  33. Hou, L.; Chen, X.; Kuhn, L.; Huang, J. The effectiveness of regulations and technologies on sustainable use of crop residue in Northeast China. Energy Econ. 2019, 81, 519–527. [Google Scholar] [CrossRef]
  34. Asongu, S.A.; Le Roux, S. Enhancing ICT for inclusive human development in Sub-Saharan Africa. Technol. Forecast. Soc. Chang. 2017, 118, 44–54. [Google Scholar] [CrossRef] [Green Version]
  35. Gong, X.; Zhang, J.; Zhang, H.; Cheng, M.; Wang, F.; Yu, N. Internet use encourages pro-environmental behavior: Evidence from China. J. Clean. Prod. 2020, 256, 120725. [Google Scholar] [CrossRef]
  36. Hong, J.; Ren, L.; Hong, J.; Xu, C. Environmental impact assessment of corn straw utilization in China. J. Clean. Prod. 2016, 112, 1700–1708. [Google Scholar] [CrossRef]
  37. Chen, X.; Huang, B.; Lin, C.-T. Environmental awareness and environmental Kuznets curve. Econ. Model. 2019, 77, 2–11. [Google Scholar] [CrossRef]
  38. Chen, F.; Chen, W.; Hou, J.; Li, W. Research on the variations in individual waste separation behavior due to different information strategies–Mediating effects of psychological distance. J. Environ. Manag. 2021, 304, 114320. [Google Scholar] [CrossRef]
  39. Wang, X.; Yang, H.; Liu, J.; Wu, J.; Chen, W.; Wu, J.; Zhu, L.; Bian, X. Effects of ditch-buried straw return on soil organic carbon and rice yields in a rice–wheat rotation system. Catena 2015, 127, 56–63. [Google Scholar] [CrossRef]
  40. Zhang, Z.; Liu, D.; Wu, M.; Xia, Y.; Zhang, F.; Fan, X. Long-term straw returning improve soil K balance and potassium supplying ability under rice and wheat cultivation. Sci. Rep. 2021, 11, 22260. [Google Scholar] [CrossRef]
  41. Zhang, J.; Cheng, M.; Yu, N. Internet Use and Lower Life Satisfaction: The Mediating Effect of Environmental Quality Perception. Ecol. Econ. 2020, 176, 106725. [Google Scholar] [CrossRef]
  42. Liu, C.; Jing, Q.; Cong, J.; Zhang, W. How do integrity level and economic punishment affect residents’ willingness and behavior to separate household waste? New evidence from 1293 questionnaires in Jinan. J. Clean. Prod. 2022, 365, 132713. [Google Scholar] [CrossRef]
  43. Leng, C.; Ma, W.; Tang, J.; Zhu, Z. ICT adoption and income diversification among rural households in China. Appl. Econ. 2020, 52, 3614–3628. [Google Scholar] [CrossRef]
  44. Chen, C.; Wen, Z.; Wang, Y.; Zhang, W.; Zhang, T. Multi-objective optimization of technology solutions in municipal solid waste treatment system coupled with pollutants cross-media metabolism issues. Sci. Total. Environ. 2022, 807, 150664. [Google Scholar] [CrossRef]
  45. Chen, F.; Chen, H.; Jin, Y.; Wang, F.; Chen, W.; Wu, M.; Li, W.; Li, S.; Long, R. Impact of cognition on waste separation behavior—Nonlinear moderating effect by trustworthiness for links. J. Clean. Prod. 2021, 296, 126525. [Google Scholar] [CrossRef]
  46. Huang, X.; Cheng, L.; Chien, H.; Jiang, H.; Yang, X.; Yin, C. Sustainability of returning wheat straw to field in Hebei, Shandong and Jiangsu provinces: A contingent valuation method. J. Clean. Prod. 2019, 213, 1290–1298. [Google Scholar] [CrossRef]
  47. Polo Peña, A.I.; Frías Jamilena, D.M.; Rodríguez Molina, M.Á. Impact of Customer Orientation and ICT Use on the Perceived Performance of Rural Tourism Enterprises. J. Travel Tour. Mark. 2013, 30, 272–289. [Google Scholar] [CrossRef]
  48. Zhang, S.-H.; Yang, J.; Feng, C. Can internet development alleviate energy poverty? Evidence from China. Energy Policy 2023, 173, 113407. [Google Scholar] [CrossRef]
Figure 1. Framework diagram of this article’s environmental quality, showing significantly positive relationships.
Systems 11 00295 g001
Table 1. Descriptive statistics of the questionnaire.
VariableTypeNumberPercentage (%)
GenderFemale98946.52
Male113753.48
AgeUnder 18301.41
18~2527212.79
26~301697.95
31~4036116.98
41~5063329.77
51~6035316.60
Above 6030814.49
Net incomeLess than CNY 500038318.02
RMB 5000–10,00039518.58
11,000–15,00026312.37
16,000–20,0002129.97
20,000–30,00027612.98
Over 30,00059728.08
DegreePrimary school and below47222.20
Junior high school76135.79
High school/technical secondary school/technical school41519.52
College/undergraduate46021.64
Graduate and above 180.85
Village cadresNo 200094.07
Yes1265.93
Party memberNo177783.58
Yes 34916.42
Main income comes from farmingYes176482.97
No36217.03
RegionEast124958.75
Middle56326.48
West31414.77
Table 2. Statistical frequencies of core variables.
ICT Use
01Total
NumberPercentage (%)NumberPercentage (%)NumberPercentage (%)
Separation of farmers’ domestic waste
132515.2985540.22118055.50
2713.3441919.7149023.05
3341.6028013.1731414.77
4130.611296.071426.68
Environmental quality satisfaction
150.24 371.74 421.98
2411.93 1537.20 1949.13
31748.18 67731.84 85140.03
41627.62 66831.42 83039.04
5612.87 1486.96 2099.83
total44320.84168379.162126100
Table 3. Descriptive statistics of control variables.
VariableDefinitionMeanSD
ICT useDo you use mobile phones, computers and other equipment to obtain information? Yes = 1. No = 00.7920.406
GENFemale = 0; male = 10.5350.499
AGEUnder 18 = 1; 18~25 = 2; 26~30 = 3; 31~40 = 4; 41~50 = 5; 51~60 = 6; above 60 = 74.6871.586
DEGPrimary school and below = 1; junior high school = 2; high school/technical secondary school/technical school = 3; college/undergraduate = 4; graduate and above = 52.4321.084
VCAre you a village cadre? Yes = 1; no = 00.05880.235
PMAre you a party member? Yes = 1; no = 00.1630.37
CFPDoes the family’s main income come from farming? Yes = 1; no = 00.170.376
NIThe average net income of your family: less than CNY 5000 = 1; RMB 5000–10,000 = 2; 11,000–15,000 = 3; 16,000–20,000 = 4; 20,000–30,000 = 5; over 30,000 = 63.6551.904
SCAre security cameras installed in your village? Yes = 1; no = 00.7520.432
NJSDistance to township agricultural technical service station: within 1 km = 1; 1–3 km = 2; 3–5 km = 3; 5–10 km = 4; over 10 km = 52.0160.965
SEPSatisfaction with environmental public: very dissatisfied = 1; relatively dissatisfied = 2; general = 3; relatively satisfied = 4; very satisfied = 53.4560.864
EastYes = 1; no = 00.5870.492
MiddleYes = 1; no = 00.2650.441
WestYes = 1; no = 00.1480.355
Table 4. Basic regression analysis results of the Oprobit model.
VariableEqsDws
(1)(2)(3)(4)
ICT use−0.111 *−0.123 *0.606 ***0.432 ***
(0.06)(0.07)(0.07)(0.08)
Eqs 0.229 ***0.189 ***
(0.03)(0.03)
GEN 0.050 0.066
(0.05) (0.05)
AGE 0.040 * 0.001
(0.02) (0.02)
DEG −0.025 0.079 **
(0.03) (0.03)
VC 0.128 0.067
(0.11) (0.11)
PM −0.120 0.196 ***
(0.08) (0.08)
CFP −0.129 * −0.149 *
(0.07) (0.08)
NI 0.008 0.015
(0.01) (0.01)
SC −0.047 0.401 ***
(0.06) (0.07)
NJS 0.038 0.077 ***
(0.03) (0.03)
SEP 1.185 ***
(0.04)
East 0.106 0.237 ***
(0.08) (0.08)
Middle 0.068 −0.327 ***
(0.08) (0.09)
Pseudo R-squared0.0007130.2540.02880.0742
LR Chi2 (14)3.8151357138.4355.9
N2126212621262126
Standard errors are in parentheses; *** p < 0.01, ** p < 0.05 and * p < 0.1; *, ** and *** indicate level of significance at the 10%, 5% and 1% level, respectively.
Table 5. The marginal effect of the main explanatory variable.
VariableThe Marginal Effect of Eqs
Eqs = 1Eqs = 2Eqs = 3Eqs = 4Eqs = 5
(1)(2)(3)(4)(5)
ICT use0.00375 *0.0119 *0.0187 *−0.0195 *−0.0149 *
(0.00210)(0.00657)(0.0103)(0.0107)(0.00820)
N21262126212621262126
The marginal effect of Dws
Dws = 1Dws = 2Dws = 3Dws = 4
(6)(7)(8)(9)
ICT use−0.152 ***0.0392 ***0.0610 ***0.0513 ***
(0.0259)(0.00692)(0.0108)(0.00952)
Eqs−0.0662 ***0.0171 ***0.0267 ***0.0224 ***
(0.0105)(0.00287)(0.00436)(0.00384)
N2126212621262126
Standard errors are in parentheses; *** p < 0.01 and * p < 0.1; * and *** indicate level of significance at the 10% and 1% level, respectively.
Table 6. Basic regression analysis results of the OLS model.
VariableDependent Variable: EqsDependent Variable: Dws
(1)(2)(3)(4)
ICT use−0.088 *−0.065 *0.425 ***0.261 ***
(0.05)(0.04)(0.05)(0.05)
Eqs 0.179 ***0.144 ***
(0.02)(0.02)
GEN 0.026 0.050
(0.03) (0.04)
AGE 0.021 * 0.000
(0.01) (0.02)
DEG −0.014 0.064 ***
(0.02) (0.02)
VC 0.072 0.068
(0.06) (0.09)
PM −0.070 * 0.163 ***
(0.04) (0.06)
CFP −0.071 * −0.096 *
(0.04) (0.06)
NI 0.005 0.014
(0.01) (0.01)
SC −0.028 0.248 ***
(0.03) (0.05)
NJS 0.021 0.054 ***
(0.01) (0.02)
SEP 0.676 ***
(0.02)
East 0.059 0.179 ***
(0.04) (0.06)
Middle 0.041 −0.196 ***
(0.04) (0.06)
_cons3.526 ***1.016 ***0.772 ***0.425 ***
(0.04)(0.11)(0.09)(0.16)
R20.000.480.060.14
F3.623149.364.6926.52
N2126212621262126
Standard errors are in parentheses; *** p < 0.01 and * p < 0.1; * and *** indicate level of significance at the 10% and 1% level, respectively.
Table 7. Robustness test 1 with replacement variables for regression analysis.
VariableDependent Variable: EqsDependent Variable: Dws
(1)(2)(3)(4)
The explanatory variables in Columns (3) and (4) are replaced with Dws1
ICT use−0.088 *−0.065 *0.233 ***0.153 ***
(0.05)(0.04)(0.03)(0.03)
Eqs 0.092 ***0.070 ***
(0.01)(0.01)
Control variablesNoYesNoYes
Regional dummy variablesNoYesNoYes
_cons3.526 ***1.016 ***−0.059−0.286 ***
(0.04)(0.11)(0.05)(0.08)
R20.000.480.060.16
N2126212621262126
(5)(6)(7)(8)
The explanatory variables in Columns (5) and (6) are replaced with Eqs1
ICT use−0.018−0.0160.414 ***0.255 ***
(0.03)(0.02)(0.05)(0.05)
Eqs1 0.278 ***0.212 ***
(0.04)(0.04)
Control variablesNoYesNoYes
Regional dummy variablesNoYesNoYes
_cons0.503 ***−0.772 ***1.262 ***0.818 ***
(0.02)(0.07)(0.05)(0.14)
R20.000.350.050.14
F0.46685.8358.7825.52
N2126212621262126
Standard errors are in parentheses; *** p < 0.01 and * p < 0.1; * and *** indicate level of significance at the 10% and 1% level, respectively.
Table 8. Robustness test 2: Ologit model regression analysis results.
VariableDependent Variable: EqsDependent Variable: Dws
(1)(2)(3)(4)
ICT use−0.155−0.201 *1.044 ***0.705 ***
(0.10)(0.12)(0.12)(0.13)
Eqs 0.401 ***0.327 ***
(0.05)(0.05)
Control variablesNoYesNoYes
Regional dummy variablesNoYesNoYes
R20.000.350.050.14
F3.623149.367.2630.50
N2126212621262126
Standard errors are in parentheses; *** p < 0.01 and * p < 0.1; * and *** indicate level of significance at the 10% and 1% level, respectively.
Table 9. Endogeneity test and internet signal regression analysis results.
VariableFirst StageSecond Stage
ICT UseICT UseEqsDws
(1)(2)(3)(4)
Internet signal0.072 ***0.077 ***−2.070 ***0.801 ***
(0.01)(0.00)(0.41)(0.29)
Eqs 0.186 ***
(0.02)
Control variablesNoYesNoNo
Regional dummy variablesNoNoNoNo
_cons0.525 ***0.618 ***1.818 ***0.449 ***
(0.036)(0.009)(0.32)(0.27)
Adj R20.030.029
F56.4747.5425.7130.23
N2126212621262126
Standard errors are in parentheses; *** p < 0.01; *** indicate level of significance at the 1% level, respectively.
Table 10. Heterogeneity discussion 1: regression analysis of different age structures.
VariableDependent Variable: EqsDependent Variable: Dws
OlsOprobitOlsOprobit
(1)(2)(3)(4)
Age ≤ 40
ICT use0.1410.2440.0580.117
(0.09)(0.16)(0.13)(0.17)
Eqs 0.157 ***0.070 ***
(0.04)(0.01)
Control variablesYesYesYesYes
Regional dummy variablesYesYesYesYes
_cons0.799 *** 0.336
(0.19) (0.27)
R20.490.2590.130.0641
F61.51 9.433
N832832832832
(5)(6)(7)(8)
Age > 40
ICT use−0.074 *−0.137 *0.270 ***0.447 ***
(0.04)(0.08)(0.06)(0.09)
Eqs 0.145 ***0.195 ***
(0.03)(0.04)
Control variablesYesYesYesYes
Regional dummy variablesYesYesYesYes
_cons0.953 *** 0.789 ***
(0.18) (0.25)
R20.470.2540.150.0842
F87.49 17.60
N1294129412941294
Standard errors are in parentheses; *** p < 0.01 and * p < 0.1; * and *** indicate level of significance at the 10% and 1% level, respectively.
Table 11. Heterogeneity discussion 2: participation of different income groups in the regression analysis.
VariableDependent Variable: EqsDependent Variable: Dws
OlsOprobitOlsOprobit
(1)(2)(3)(4)
Below average
ICT use−0.059−0.1040.302 ***0.554 ***
(0.05)(0.09)(0.07)(0.11)
Eqs 0.089 ***0.114 **
(0.03)(0.04)
Control variablesYesYesYesYes
Regional dummy variablesYesYesYesYes
_cons1.059 *** 0.615 ***
(0.17) (0.21)
R20.440.2250.130.0783
F61.51 12.18
N1041104110411041
(5)(6)(7)(8)
Above average
ICT use−0.088 *−0.171 *0.230 ***0.327 ***
(0.05)(0.10)(0.08)(0.11)
Eqs 0.204 ***0.262 ***
(0.03)(0.04)
Control variablesYesYesYesYes
Regional dummy variablesYesYesYesYes
_cons0.927 *** 0.300
(0.19) (0.29)
R20.520.2890.130.0663
F89.37 12.80
N1085108510851085
Standard errors are in parentheses; *** p < 0.01, ** p < 0.05 and * p < 0.1; *, ** and *** indicate level of significance at the 10%, 5% and 1% level, respectively.
Disclaimer/Publisher’s Note: The statements, opinions and data contained in all publications are solely those of the individual author(s) and contributor(s) and not of MDPI and/or the editor(s). MDPI and/or the editor(s) disclaim responsibility for any injury to people or property resulting from any ideas, methods, instructions or products referred to in the content.

