Article

Trading Risk Spillover Mechanism of Rare Earth in China: New Perspective Based on Time-Varying Connectedness Approach

School of Economics, Hangzhou Dianzi University, Hangzhou 310018, China
*
Author to whom correspondence should be addressed.
Systems 2023, 11(4), 168; https://doi.org/10.3390/systems11040168
Submission received: 24 February 2023 / Revised: 17 March 2023 / Accepted: 22 March 2023 / Published: 23 March 2023
(This article belongs to the Special Issue Frontiers in Complex Network Theory and Its Applications)

Abstract

:
Our research contributes a new point of view on China’s rare earth dynamic risk spillover measurement; this was performed by combining complex network and multivariate nonlinear Granger causality to construct the time-varying connectedness complex network and analyze the formation mechanism using the impulse response. First, our empirical research found that for the dynamic characteristics of China’s rare earth market, due to instability, uncertainty, and geopolitical decisions, disruption can be captured well by the TVP-VAR-SV model. Second, except for praseodymium, oxides are all risk takers and are more affected by the impact of other assets, which means that the composite index and catalysts are main sources of risk spillovers in China’s rare earth trading complex network system. Third, from the perspective of macroeconomic variables, there are significant multivariate nonlinear impacts on the total connectedness index of China’s rare earth market, and they exhibit asymmetric shock characteristics. These findings indicate that the overall linkage of the risk contagion in China’s rare earth trading market is strong. Strengthening the interconnections among the rare earth assets is of important practical significance. Empirical results also provide policy recommendations for establishing trading risk protection measures under macro-prudential supervision. Especially for investors and regulators, rare earth oxides are important assets for risk mitigation. When rare earth systemic trading risk occur, the allocation of oxide rare earth assets can hedge part of the trading risk.
JEL Classification:
C32; C51; C52; C53

1. Introduction

Rare earth assets are essential ingredients for indispensable industrial raw materials of modern society, basic conventional clean energy production, and high-quality economic development. The specific catalytic and magnetic properties of rare earth make them necessary for high-tech industries and frontier science research [1]. Among other technologies, clean new energy, photovoltaic cells, wind energy turbines, and electric vehicles are decisive for a transition to a low-carbon, resilient economy [2]. The global demand for rare earth resources is increasing year-by-year [3], especially with the commitments made by many countries at the United Nations Climate Change Conference (UNCCC) to timely economic decarbonization. In this case, China is one of the most predominant rare earth supply centers in the world [2].
Hedging and investments in rare earth assets have recently attracted global investor attention due to global countries being actively involved in the changing new energy industrial chain and tech innovation perspective; however, the composition of these supply chains cannot reduce reliance on China’s rare earth resources [4]. Therefore, maintaining and expanding investment in China’s rare earth assets require a clear understanding of the formation mechanism of rare earth asset transaction risk contagion. In fact, it is difficult and complicated to characterize the contagion of rare earth trading risk in an inefficient primary trading market, especially in China [5,6]. Investor interest in China’s rare earth assets not only depends on their trading return, but also relates to the catalytic materials and oxides of the rare earth assets. Consequently, expanding investors’ understanding of the interconnection mechanisms of rare earth assets and the influence of macroeconomic variables is critical for gauging the relative performance of rare earth assets and the usefulness of hedging the trading portfolio risk. Indeed, understanding of the mechanism of the risk spillover effect of rare earth assets is also useful for policymaker decisions regarding the promotion of the mining process.
In this study, we investigated the trading risk spillover effect among China’s rare earth market assets, including catalysts and oxides in the Baotou Rare Earth Products Exchange (BREPE), and we analyzed the formation mechanism using the impulse response. Previous research has mostly focused on a single rare earth asset such as yttrium’s general characteristics or on rare earth stocks based on geological and geochemical data to investigate the trading risk [7]; however this has not occurred at the level of the entire rare earth trading market [8]. Furthermore, there is much research on cross-markets such as China and the USA as well as the linkage to traditional financial system or economic policy uncertainty [2,8,9]. In the field of exploring the formation mechanism of rare earth market transaction risk, there are few studies available. Hanif et al. [10] examined the impacts of COVID-19 on dynamic return and volatility spillovers between the rare earth and six renewable energy stock from 1 January 2018 to 15 May 2020. The results showed that COVID-19 triggered significant increases in co-movements and spillovers in returns and volatility, but no further influencing factors were explored. While considering the consumption of drive volatility transmission in financial markets, Haq et al. [8] documented that the weak financial contagion effect and connectedness across financial markets uncovers possible diversification opportunities. The results showed that the USA sustainable financial market was persistently not affected by volatility spillovers but that China and Australia needed to establish strict regulations to protect sustainable financial markets.
Highly interdependent systemic trading risks will trigger significant risk linkages and even seriously threaten the security and stability of the entire trading market [3]. It is worth noting that most of the early studies focused on the pairwise relationship between entities but ignored the overall network correlation of transaction risk, so it is difficult to accurately describe the systemic shocks that appear in complex networks [11]. By using a principal component analysis (PCA) and Granger causality analysis test, Diebold and Yilmaz [12] constructed a financial complex network, described the important relationship between financial institutions, and identified systemically important institutions. On the other hand, to examine market transaction risks, van de Leur et al. [11], Acharya and Volpin [13], and Acharya et al. [14,15] successively proposed methods such as CoVaR and MES to go beyond the pairwise association, tracking association, and risk linkage between individual assets and examine the overall transaction market.
In order to overcome the defect of traditional risk spillover measurement, which can only describe the correlation in one direction, Diebold and Yilmaz [12,16,17] proposed several connectedness measures built from pieces of variance decompositions, which effectively unified methods such as CoVaR and MES under the same framework. Grant and Yung [18] pointed that the robust-yet-fragile property was the most important characteristic in the complex network method, which meant that a high degree of interconnection between complex networks can effectively buffer and smooth most of the shocks; at the same time, though, it can be easier for risk to rapidly spread in the complex network system. For this reason, it has become an important research perspective in this field to investigate the shock spillover of trading risk from complex network topology and comprehensively analyze its contagion effect in different trading markets. For instance, Härdle et al. [19] adopted the TENET model based on the semiparametric quantile regression framework to estimate the complex network’s association of financial institutions according to the tail-driven spillover effect. Shi et al. [2] investigated the connectedness spillover effects between rare earth stocks and financial markets using the MS-VAR model.
Our empirical research contributes to the extant rare earth trading risk mechanism literature by investigating a suitable dynamic model for China’s rare earth market; we used a time-varying connectedness measurement and multivariate Granger causality-based method to observe the mechanisms and impulse response, as the dynamics of macroeconomic variables may influence the trading risk of China’s rare earth market. Using a high-dimensional setup, we quantify and extend the size of price return spillovers from/to Chinese rare earth assets to/from other Chinese rare earth assets using a time-varying parameter vector autoregressive with stochastic volatility (TVP-VAR-SV) model, which captures the bilateral direct price transmission channels across rare earth assets. Furthermore, the statistical significance of time-varying parameters is evaluated in 95% confidence intervals using a Markov chain Monte Carlo (MCMC) algorithm with 50,000 replications.
Our empirical research of China’s rare earth trading market provides new insights for investors and regulators in rare earth-related areas who hedge the risk of holding, mining, and selling rare earth assets in trading markets. In the Chinese financial market, there is no significant effective financial instruments related to rare earth assets for investors to avoid trading risk. The time-varying information of the risk contagion in China’s rare earth trading markets can help investors and hedgers make timely decisions. More specifically, our research investigates the mechanism of trading risk spillover between rare earth assets and macroeconomic variables, which means that changes in rare earth trading risk can be forewarned by dynamics of macroeconomic variables. All of this information can potentially lead to investor interest in rare earth trading and increase funding flows into rare earth markets. Finally, our empirical results also provide policy recommendations for the establishment of trading risk protection under macro-prudential supervision and have implications for public policies that are aimed at supporting the rare earth trading market.
The rest of paper is organized as follows. Section 2 outlines the dynamic trading risk spillover index (include in, out, and net connectedness spillover with time-varying measurement), volatility spillover complex network based on the connectedness approach, and impulse response methods with the macroeconomic-driven factors. Section 3 explains the data sources. In Section 4, we conduct the empirical research of China’s rare earth market trading risk, we investigate the bilateral trading risk spillover effects, and we discuss the driven factors with mechanism analyses at the same time. We provide conclusions in Section 5.

2. Model Specification and Estimation

We introduce and extend the econometric model below to characterize dynamic trading risk spillover based on the connectedness approach across the rare earth trading market and macroeconomic variables.

2.1. TVP-VAR-SV Model for Price Dynamics

In order to avoid the influence of the traditional Cholesky decomposition spillover index on the variable ordering, Koop et al. [20] and Pesaran and Shin [21] proposed a generalized vector autoregressive framework. Diebold and Yilmaz [12,16,17] measured both the total and directional dynamic volatility spillovers using the rolling window method. Building on these insights, we refer to Primiceri [22], Nakajima [23], and Antonakakis et al. [24] and enhance the dynamic trading connectedness measures with a time-varying parameter VAR model and stochastic volatilities (SV), which replaces the original rolling window technique. In terms of capturing the time-varying spillover effects, the TVP-VAR-SV model has an advantage over rolling window technique where it is suitable for large-scale Bayesian calculations without losing useful information in the original data. The time-varying variance decomposition spillover method can not only measure the direction of the trading risk spillover, but also the intensity of the trading risk spillover; especially, it can describe the characteristics of the risk contagion in a high-dimensional trading system. We define the standard structural VAR model as follows:
A y t = a 0 + B 1 y t 1 + . . . + B k y t k + ε t
y t is an explained variable that refer to the volatilities of all rare earth trading market assets; A , B 1 , . . . , B k are coefficient matrixes with n × n shape; ε t is a shock that follows the independent identical normal distribution ε t N 0 , Σ ; and k is the lag order. We define C k = A 1 B k and rewrite the structural VAR model into another minimalist form with an error term ϵ t N 0 , I n :
y t = A 1 a 0 + C 1 y t 1 + . . . + C k y t k + A 1 Σ 1 2 ϵ t
By using the Kronecker product and matrix form, we set β = v e c a 0 T , A 1 T , . . . , A k T and x t = I 1 , y t 1 T , . . . , y t k T . We further rewrite (2) into y t = β x t + A 1 Σ 1 2 ϵ t . Based on this, we expand the coefficient vector β , which has an AR(1) random walk form with an error term ϵ t , and define the standard TVP-VAR model:
y t = β t x t + A t 1 Σ t 1 2 ϵ t β t = β t 1 + ϵ t
As for a high-dimensional state-space model, due to the complexity of likelihood equation with stochastic volatility term, we estimate the time-varying parameters using the Bayesian sampling method and MCMC algorithm [25,26].
In the next part, we will evaluate the volatility spillover according to the characteristics of the sample log-return data and set the complex network to show the contagion effect of the rare earth market trading risk.

2.2. Volatility Spillover Measures and Graph Network

After constructing the TVP-VAR-SV model for price dynamics, we decompose the h-step forecast error variance of the explained variable y i . The contribution value θ i j that is obtained by the variance decomposition is the part that can be explained by y j when y i is impacted by exogenous factors. The proportion of prediction error components is one of the prerequisites for us to build a complex network.
θ i j h = σ i i 1 h = 0 H e i T A i Σ e j 2 h = 0 H e i T A i Σ A i T e j 2
Σ refers to the covariance matrix for the shock vectors. σ i i is the standard variance of ε t . The j t h element of e j equals to 1, whereas the other elements are 0. The variance decomposition square matrix of order N, which is composed of elements θ i j h , can be used to characterize the risk spillover effect of different rare earth assets, catalysts, and their oxides.
Θ h = θ 11 θ 12 . . . θ 1 N θ 21 θ 22 . . . θ 2 N . . . . . . . . . . . . θ N 1 θ N 2 . . . θ N N
In the above variance decomposition matrix Θ i j h i j , the off-diagonal elements represent the decomposition of the forecast error variance, which reflects the degree of the rare earth trading market risk spillover effect between asset i and asset j.
Therefore, the sum of row i in Θ i j h represents the total market trading risk spillover effect of all other rare earth assets which, at the same time, equals to the risk-taking ability of asset i. From the perspective of the columns in matrix Θ i j h , the sum of column j represents the total trading market risk spillover of assets j to all other assets in the rare earth market.
Based on the above description, we define the net spillover effect (net) as the difference between the external spillover effect (in) and the risk tolerance of spillover from other assets (from).
The average of all elements in matrix Θ i j h represents the trading market risk spillover level for the entire rare earth trading system. In order to analyze the volatility spillover effect and eliminate the dimensional influence between rare earth assets better, we normalize θ i , j h to ϑ i , j h and make the sum of columns equal to 1.
ϑ i j = θ i j h j = 1 N θ i j h
Furthermore, to explore the mechanism of the risk contagion in the rare earth trading market, we propose using the total connectedness index T C I h of the entire rare earth trading system.
T C I h = 100 × i , j = 1 , i j N ϑ i j h i , j = 1 N θ i j h
Finally, the statistical significance of different metrics is evaluated by T C I h in 95% confidence intervals using an MCMC algorithm of the TVP-VAR-SV model with 50,000 replications.

2.3. Multivariate Nonlinear Causality and Impulse Response
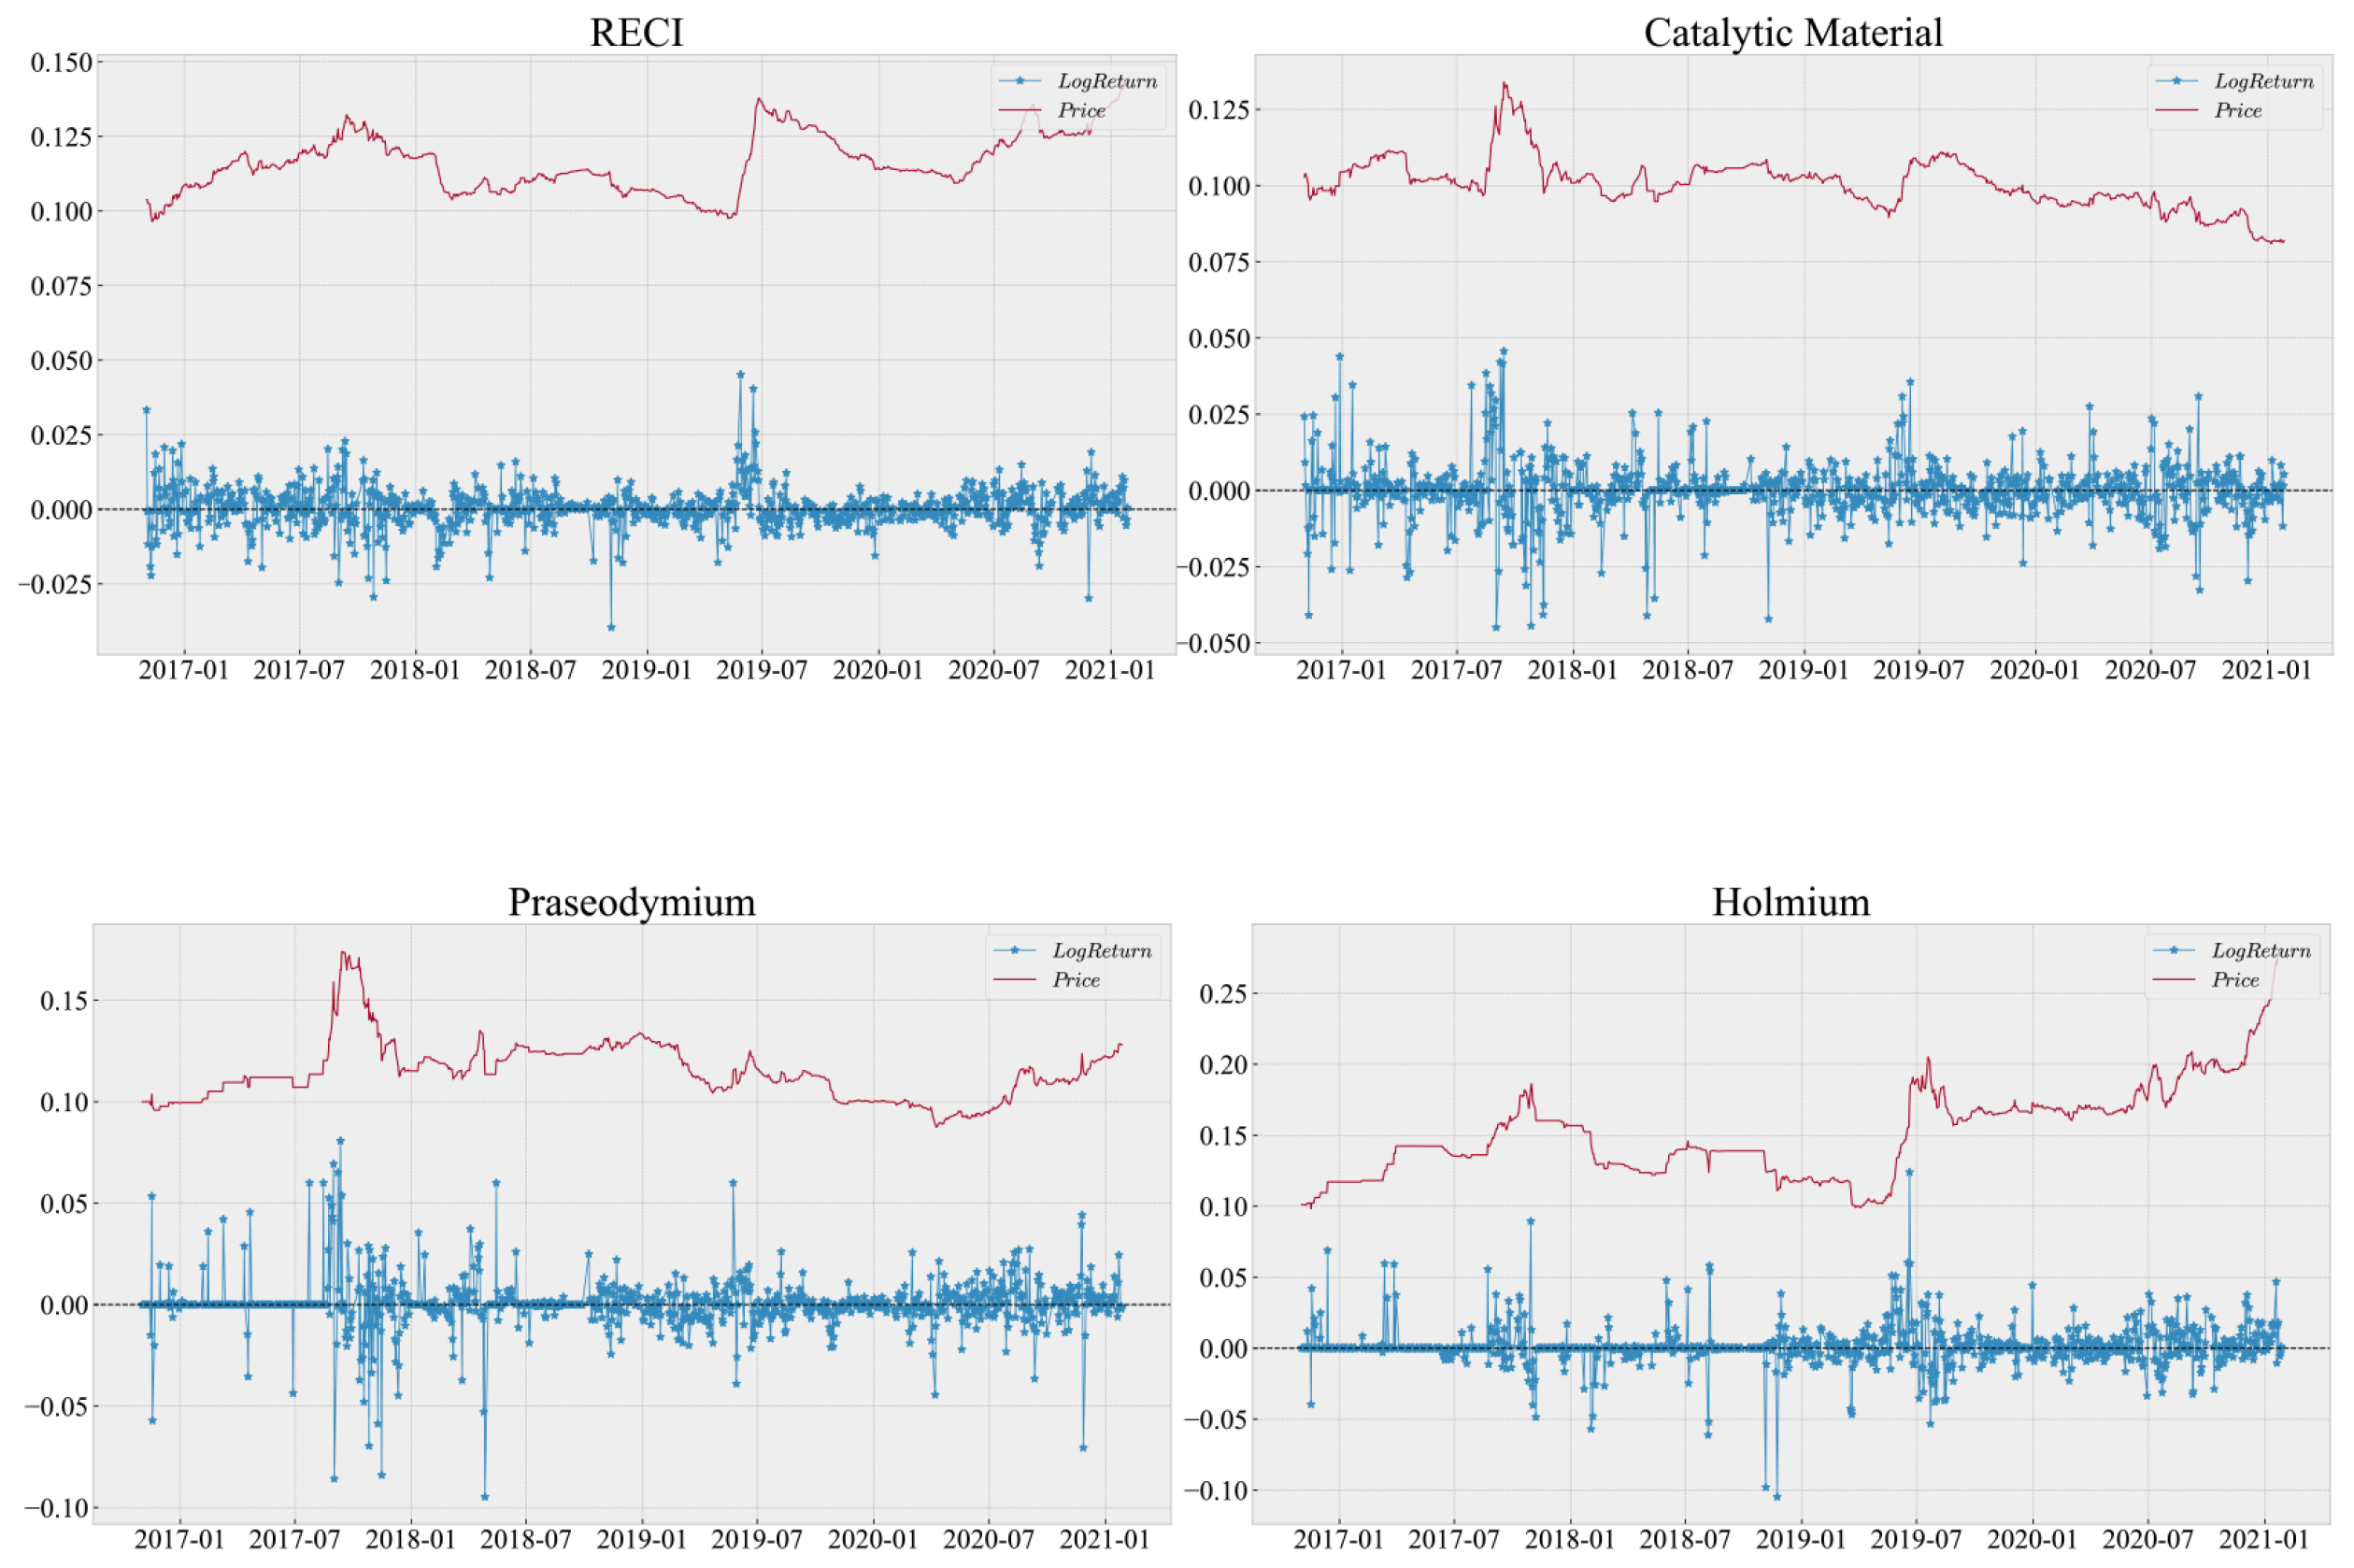
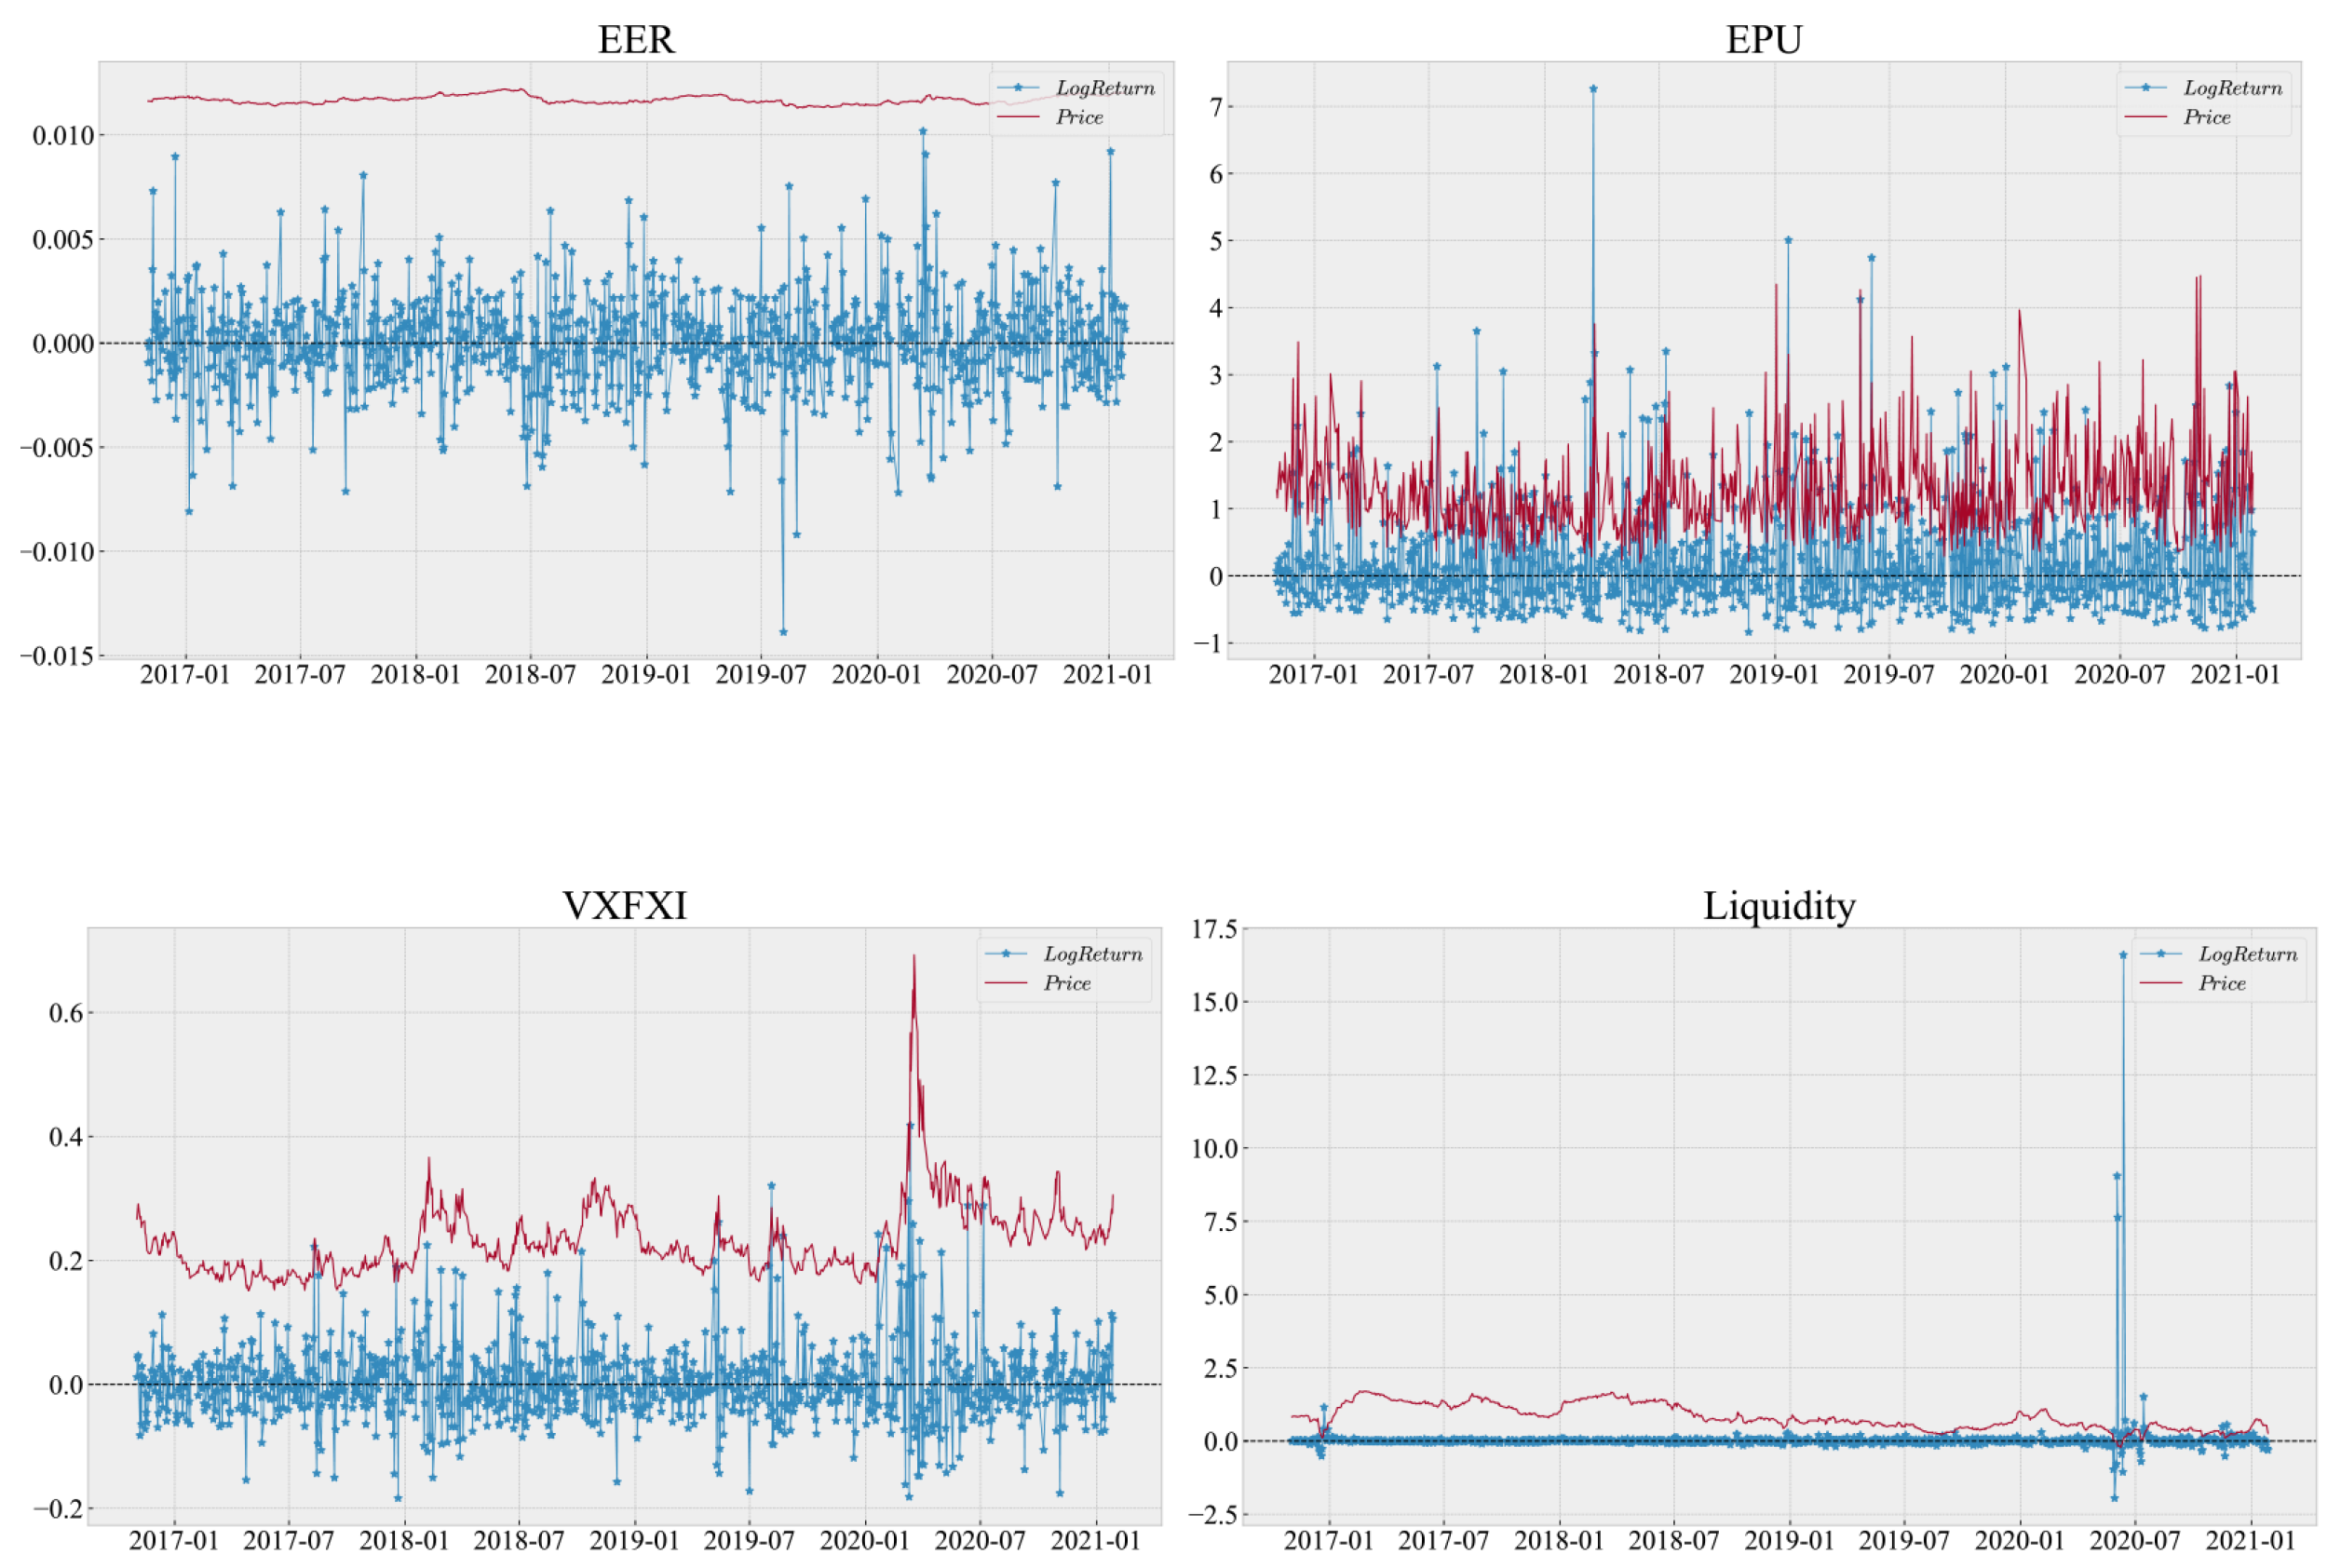
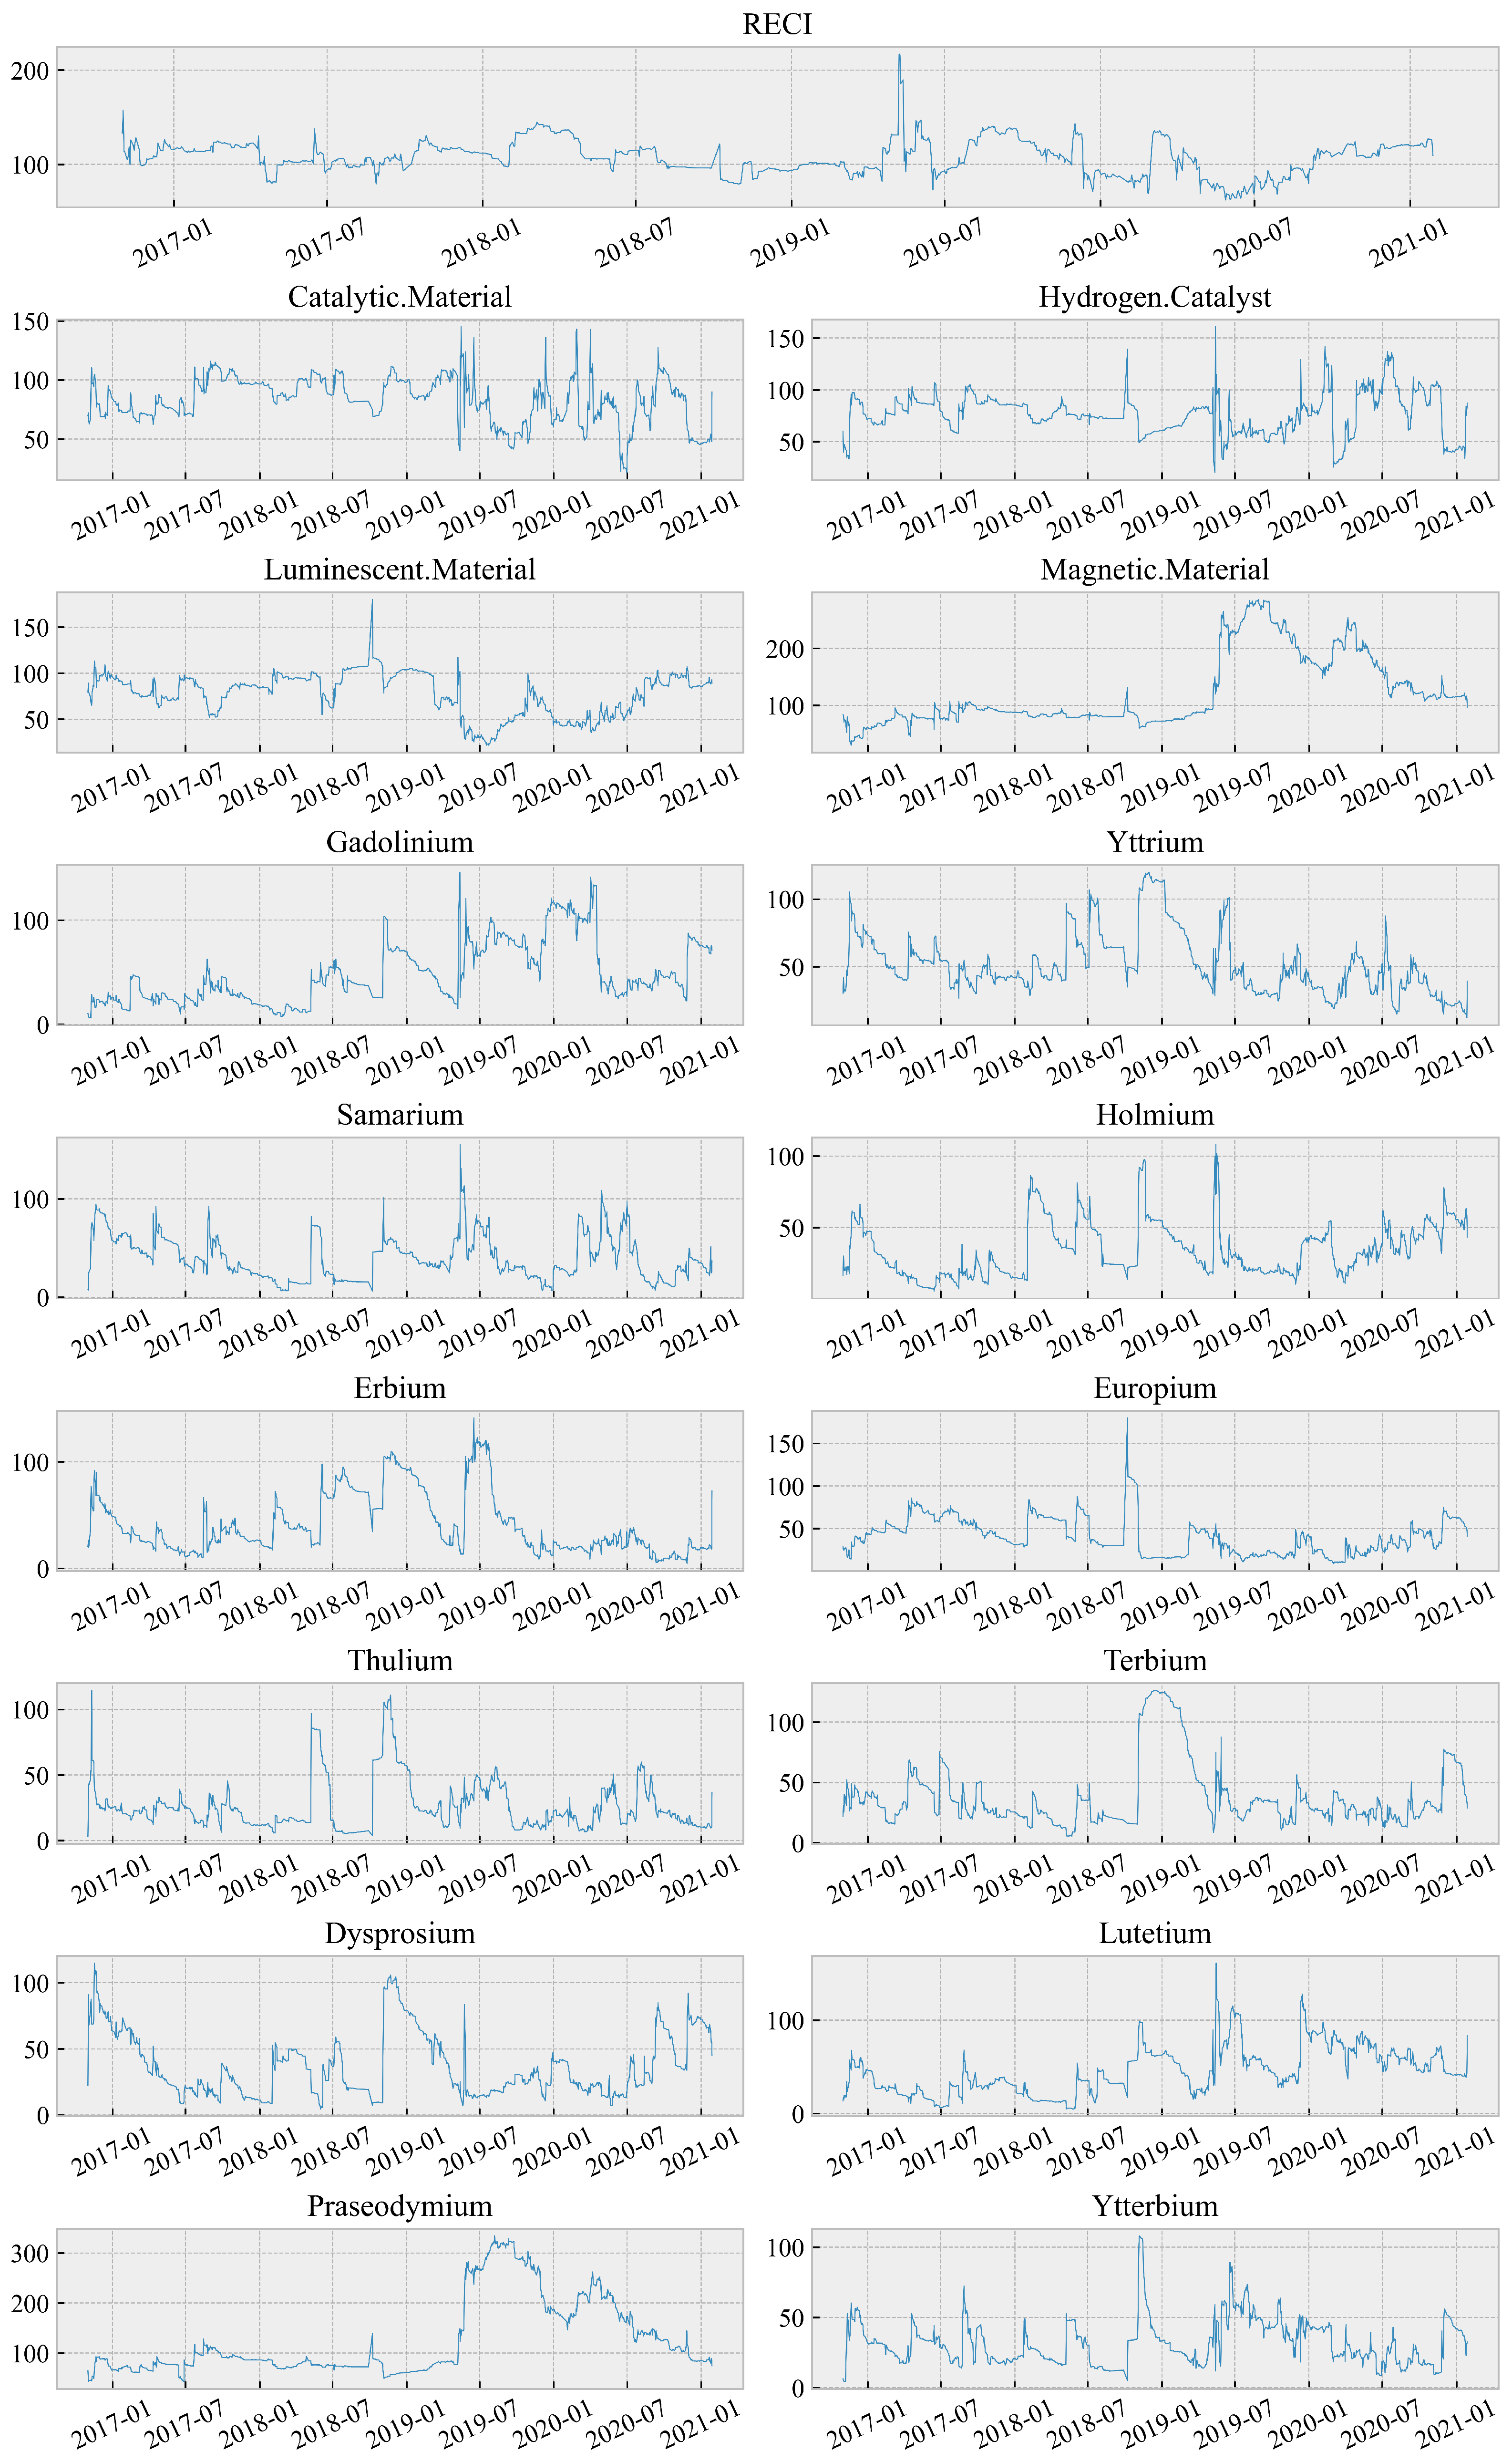
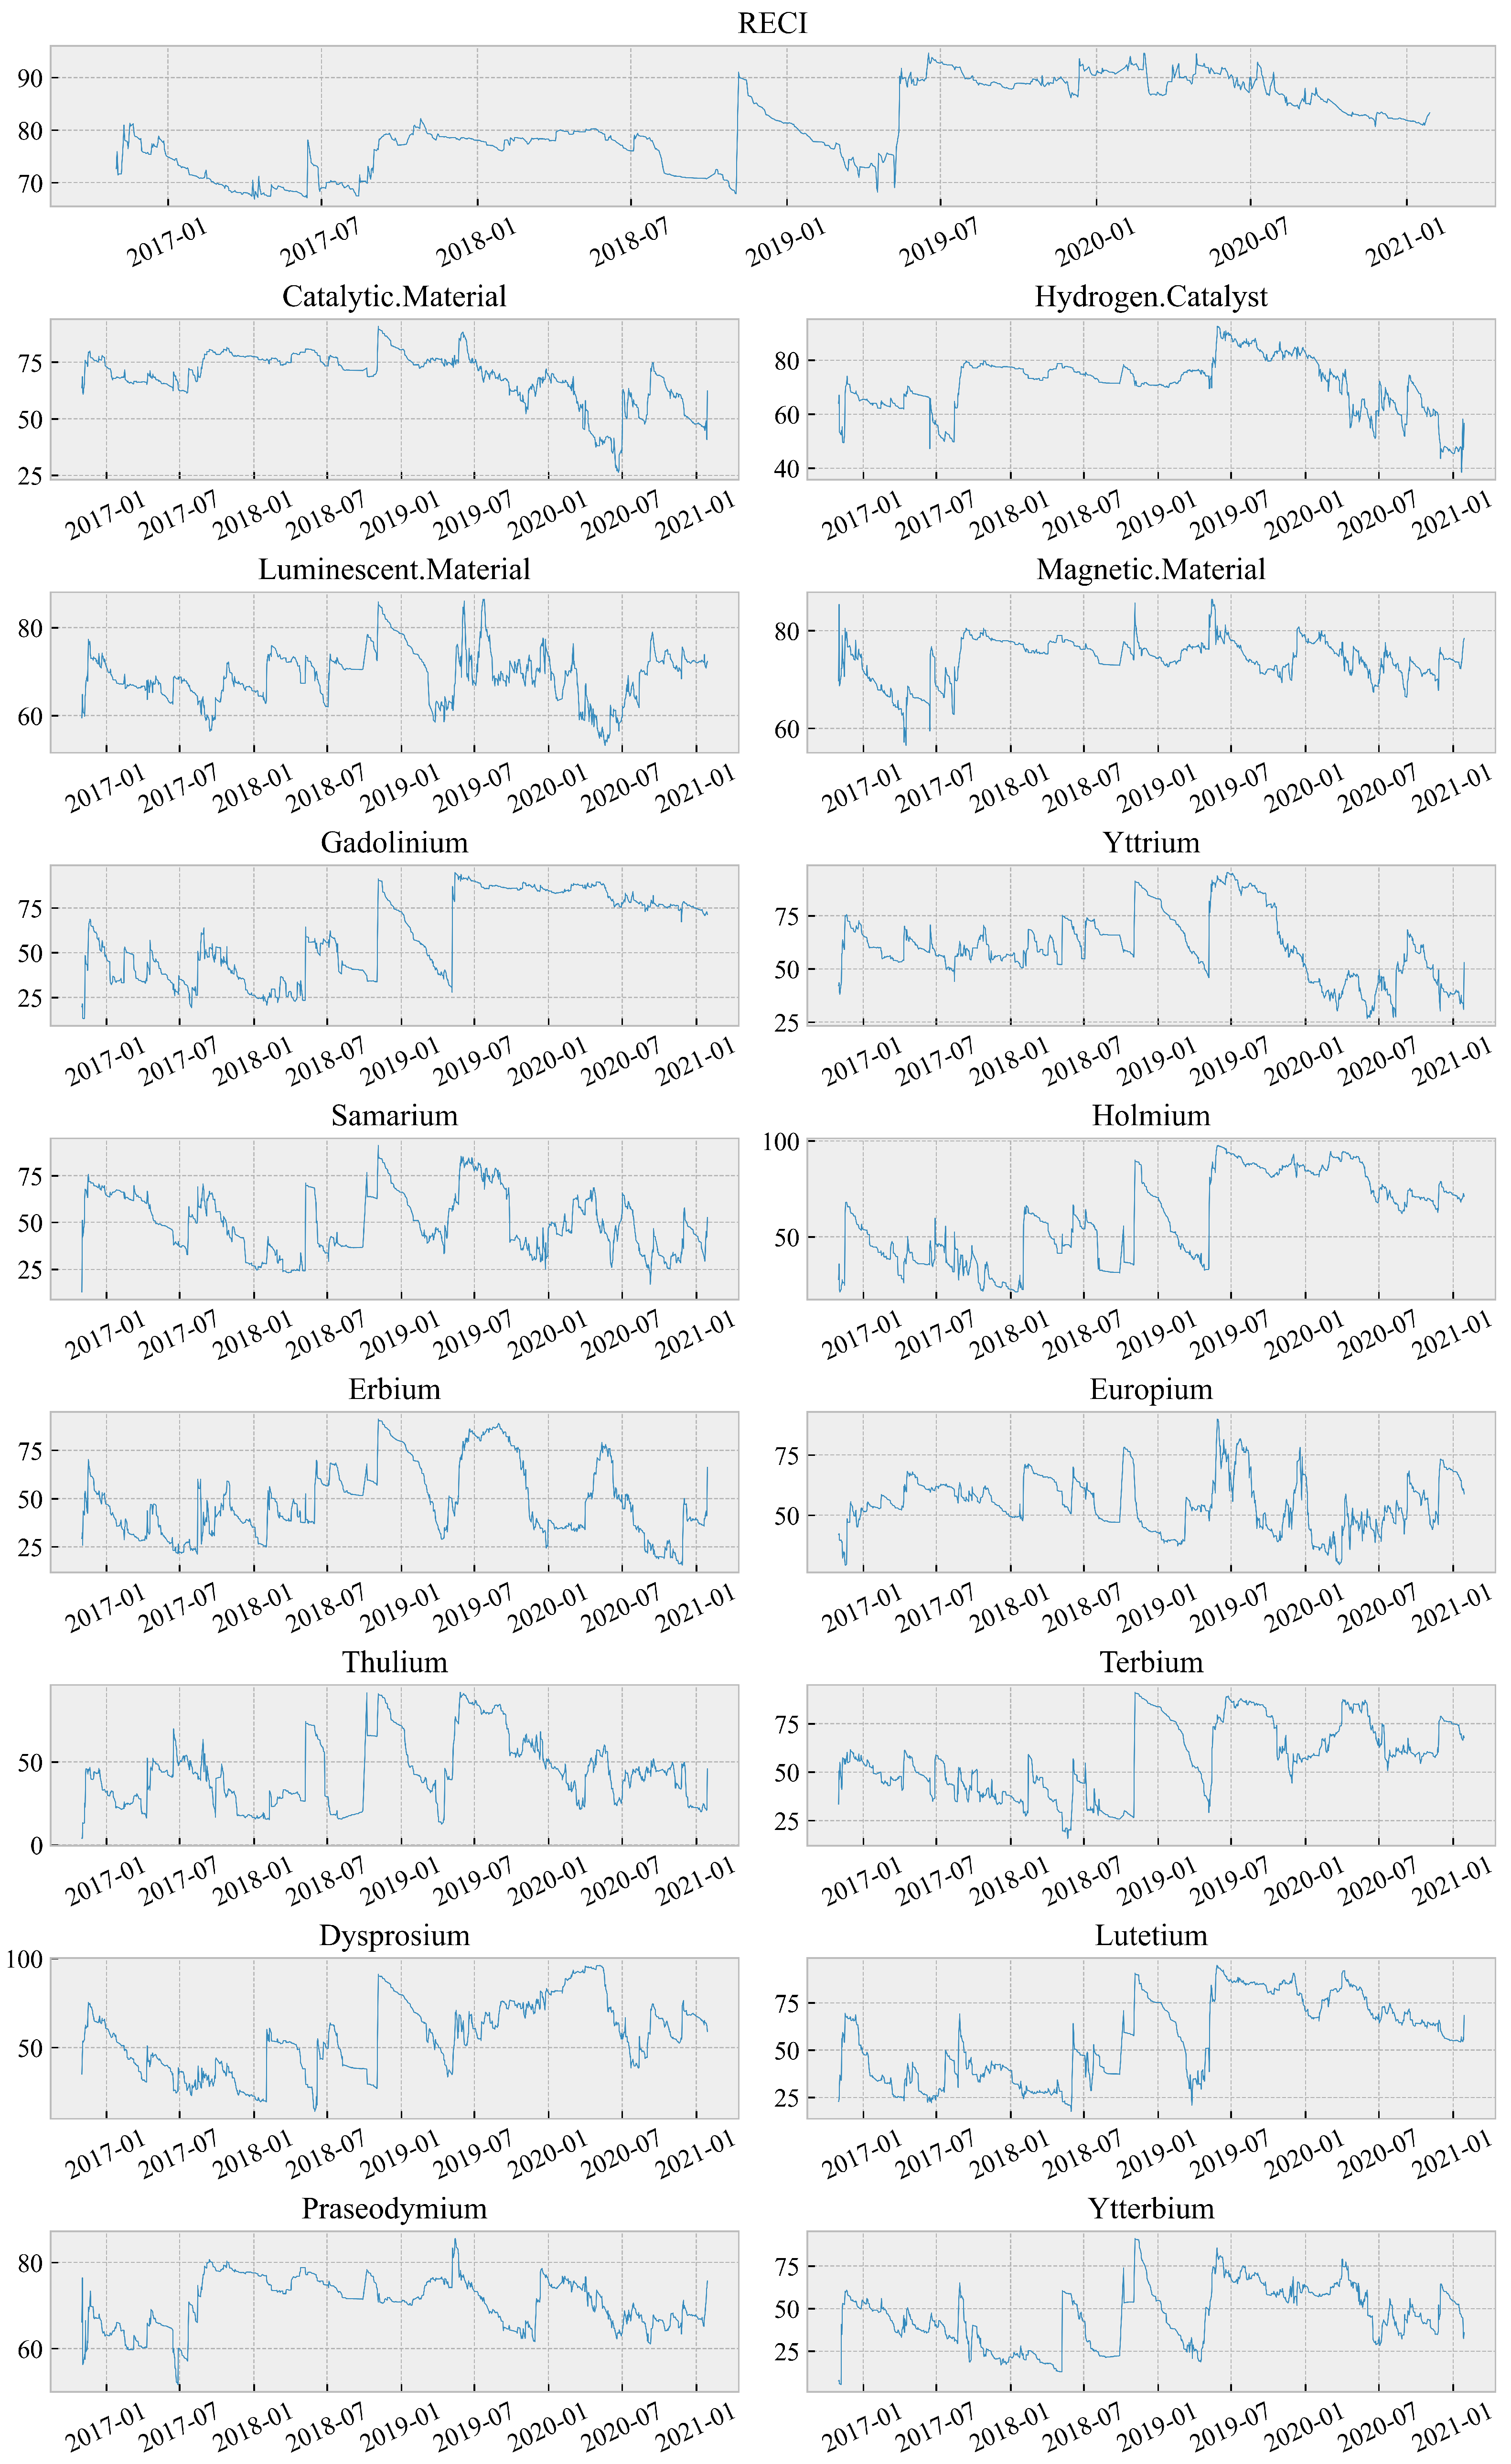
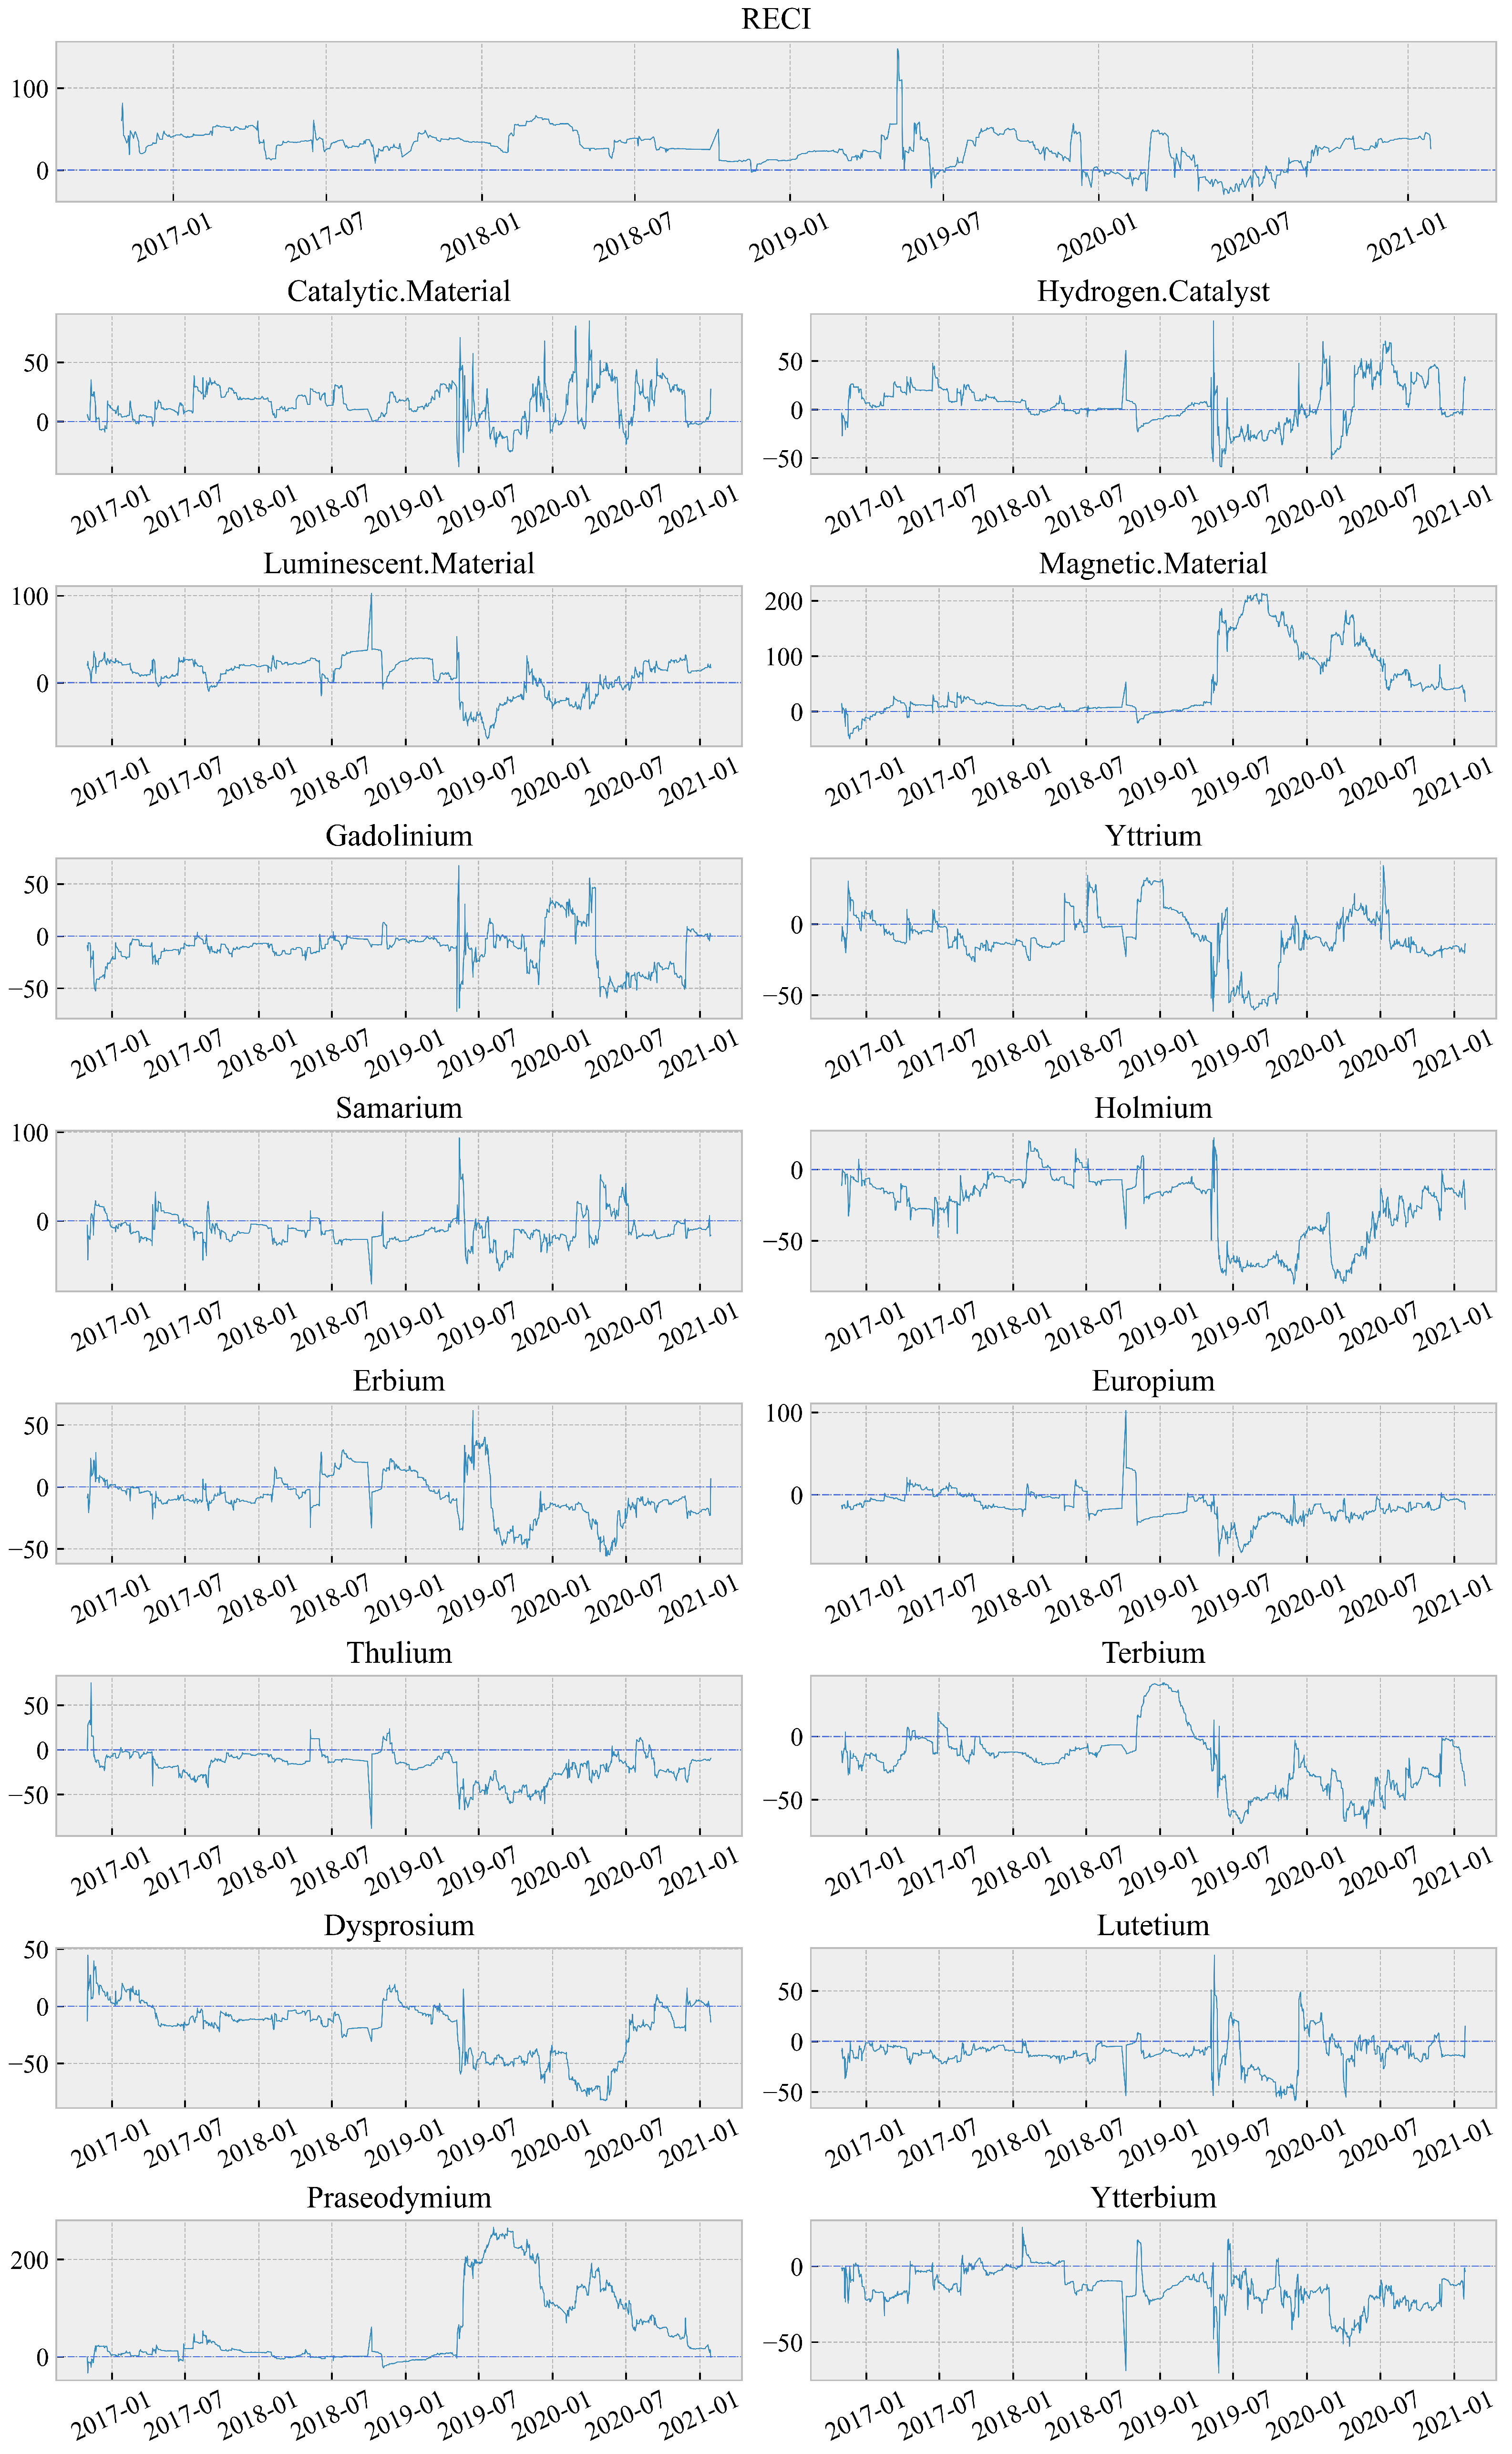
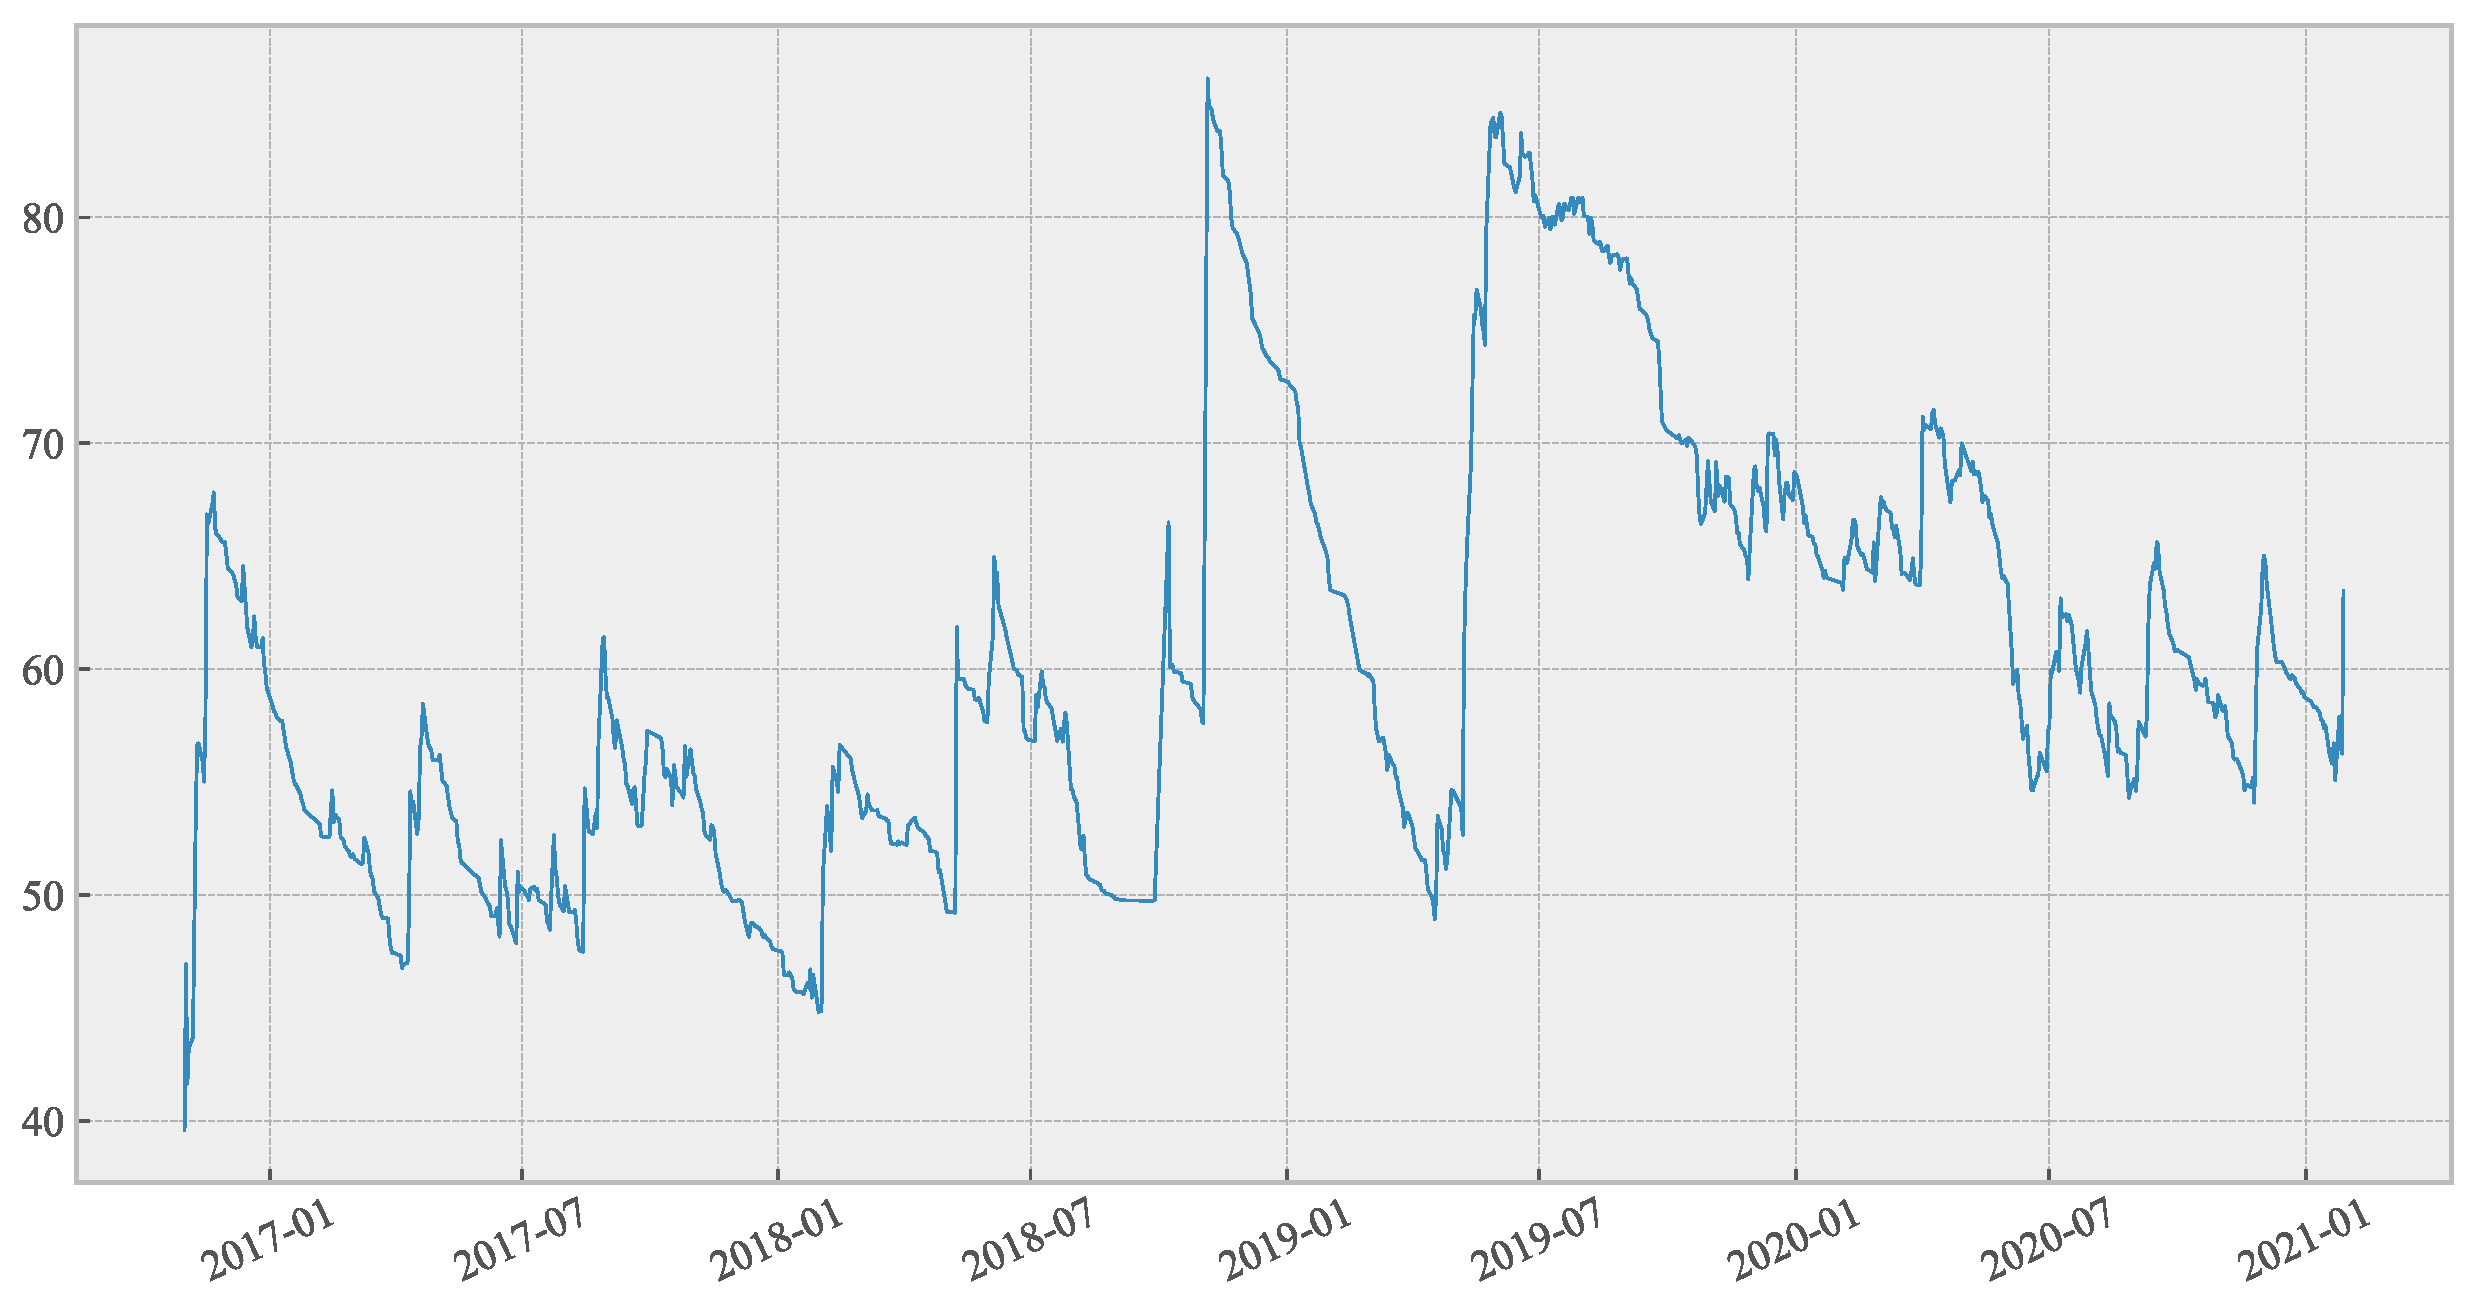
After measuring the T C I h of the entire rare earth trading system, we then consider exploring the mechanism of T C I h formation under the perspective of a multivariate nonlinear causality test and the impulse response with Chinese macroeconomic variables.
The residual components after the filtering of the classic VAR model have a nonlinear predictive relationship. When nonlinear features emerge from variables, the classical Granger causality test may provide an obvious bias on the research conclusions [27].
A bivariate nonlinear Granger causality test that is based on paired variables explores the nonlinear Granger causality between bivariate time series variables, which only uses the interaction information between two variables [28]; it fails to propose the confounding effect with other relevant variables [29].
Following the research of Diks and Wolski [30], we expand the nonlinear Granger causality test under heterogeneous market conditions. Then, we add the characteristics of high-dimensional heavy rare earth data to realize the multivariate nonlinear Granger causality discrimination. All technical details of the multivariate nonlinear Granger causality can be found in Appendix A.
After estimating the time-varying parameters with the Bayesian sampling method and MCMC algorithm, we use the multivariate nonlinear Granger test and TVP-VAR-SV model with impulse response analysis to take a deeper dive into the mechanism of the total connectedness index’s macroeconomic-driven factors.

3. Data

Rare earth processing and activities that produce catalysts and oxides are undertaken all over the world. As a major exporter of rare earth materials, China has the highest proportion (35%) in the Global Rare Earth/Strategic Metals Index (MVREMX). Table 1 summarizes all of the necessary information (name, frequency, length, explanation and source) and statistics of the variables (RECI, catalysts, representative oxides (holmium and praseodymium) and macroeconomic variables) used in this paper. RECI monitors the fluctuation in China’s rare earth market value well due to disruptions from instability, uncertainty, and geopolitical decisions. The price of rare earth catalysts and their oxide products should be included as the endogenous fluctuation factors of China’s rare earth market in our empirical research. The above variables will be used in our research on the risk spillover effect of China’s rare earth trading market.
During the pre-handling of original data, we consider the mismatch of trading days caused by differences in holidays among various assets and macroeconomic variables. We take the time periods when both assets and macroeconomic variables are all data-available as the sample for our research. After excluding the effects of holidays, we also fill backwards to make the data sample size as large as possible without affecting the empirical results. The log-return of each rare earth asset and macroeconomic variables are calculated as follows:
R t = 100 × ln P t ln P t 1
The mean values and standard deviations of both the assets and variables are similar. The skewness of all returns is positive, suggesting a greater probability of increases in these returns. The high kurtosis of the returns reveals that extreme value changes often occur when the tail of the return’s distribution shows fatness.
Figure 1 and Figure 2 depict in detail the time series process of the logarithmic returns of the analyzed rare earth assets and macroeconomic variables, which roughly reflects the magnitude of the rare earth index price trends in different times. Visual inspection reveals the general characteristics of rare earth assets as well as the volatility clustering of daily frequency macroeconomic variables. Rare earth market values evolve in tandem with catalysts and oxides and, to a lesser extent, with macroeconomic variables. When global public events occur, the volatility of the logarithmic return sequence significantly varies between variables.
The Jarque–Bera (J–B) test obviously rejects the normality of all series. According to the Ljung-Box (Q) statistic and autoregressive conditional heteroskedasticity Lagrange multiplier (ARCH-LM) statistic, all of the log-return series display evidence of autocorrelation and show evidence of heteroscedasticity.

4. Empirical Analysis in China’s Rare Earth Market

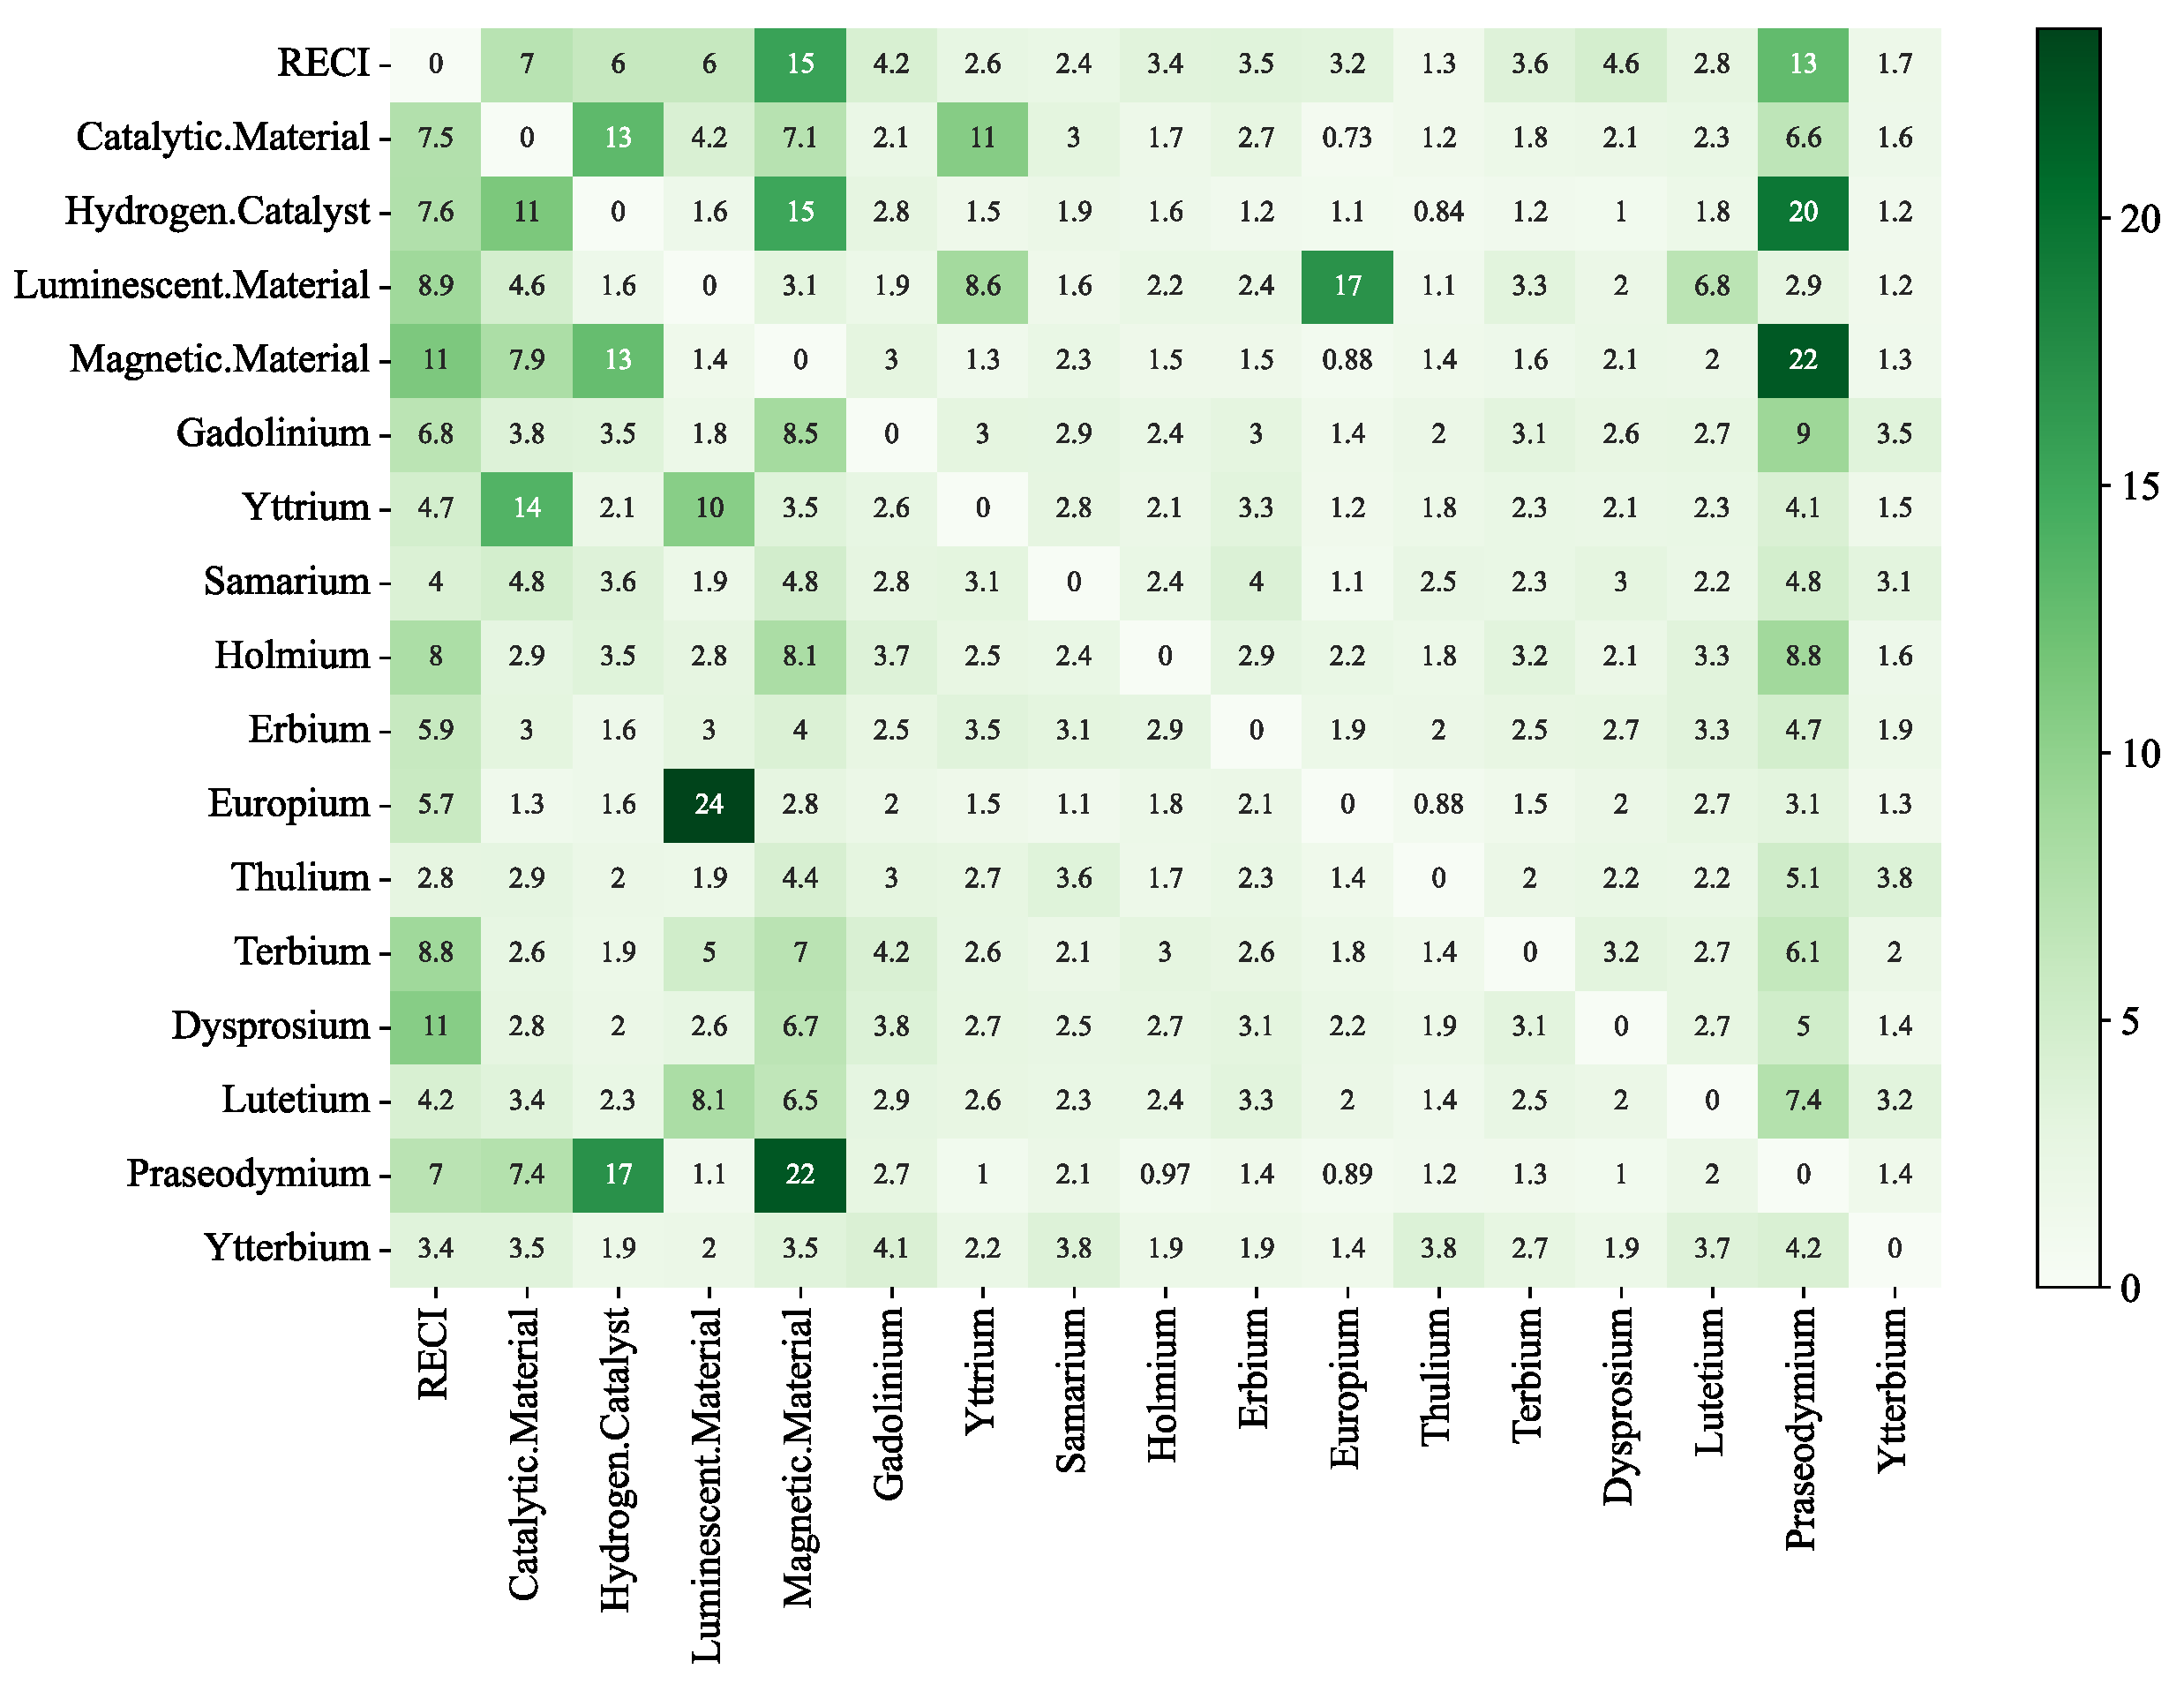
4.1. Risk Spillover of China’s Rare Earth Market

In this section, the TVP-VAR-SV model for all rare earth assets return series are estimated. The dynamic trading risk spillover indexes (including in, out, and net spillover) with time-varying measurements are calculated based on the connectedness approach.
Refer to Primiceri [22]; we use some samples as the training set, and the constant coefficients of the model are estimated based on the OLS method. The technical details of the MCMC method can be found in Appendix B.
Before calculating the TCI of China’s rare earth market, we build a TVP-VAR-SV model and decompose the generalized forecast error variance. Figure 3, Figure 4 and Figure 5 show the time-varying risk spillover effect of rare earth assets and the indexes from China’s rare earth markets. Risk spillover (From) indicates the degree of risk tolerance, which is subject to partial connectedness spillover from other rare earth assets. Risk spillover (To) represents a partial connectedness spillover effect on the rest of the other rare earth assets. Risk spillover (Net) is the risk tolerance minus the partial connectedness spillover.
From the view of the volatility spillover effect between rare earth assets and the composite index, gadolinium and magnetic material are important assets in China’s rare earth trading system. The spillover effect of the former to the latter asset is greater than the latter to the former one, which means the gadolinium plays a systematic important role in China’s rare earth trading system.
Praseodymium and magnetic material have an important impact on the import and export structure of China’s rare earth resources and the balance of international payments. When comparing the spillover effect values of two assets, the connectedness contagion intensity of the praseodymium to the magnetic material is higher.
It can be intuitively observed that the rare earth composite index is the main net exporter of connectedness shocks and also has a greater impact on other types of rare earth assets and oxide spillovers. However, dysprosium and holmium are mainly net importers of connectedness shocks, which are extremely susceptible to risk infection.
In May 2019, the rare earth policy departments of China banned the import of Myanmar’s rare earth mines into China; at the same time, the Chinese government completely stopped the export of rare earth-related materials to Myanmar. This behavior led to an increase in the comprehensive price of rare earths and caused great fluctuations in the rare earth trading market of China.
Reviewing the government’s public data [33], the ban on the import and export of rare earths between Chinese and Myanmarese ports was effective. The import volume of rare earth mines in Myanmar had continued to decline. According to the data from customs in 2019, since China Tengchong’s Customs began to implement import restriction measures in November 2018, the import volume in November, December, and January 2019 was 801 tons, 1079 tons, and 963 tons, respectively; that was only one-third to one-half of the monthly import volume compared with before the restricted time.
Because of this, since March 2019, the rare earth assets of praseodymium, dysprosium, holmium, and yttrium have mutated from their previous low-risk status to main assets with high-risk spillovers (Figure 3: praseodymium, dysprosium, holmium, and yttrium). This shows that the price changes of the four rare earth assets have a greater impact on China’s overall rare earth trading market and that the spillover effect is more obvious (Figure 5: Net risk spillover of RECI). They also became the main group of trading risk infection in China’s rare earth market, and the regulatory authorities need to pay enough attention to all high-volatility rare earth assets.
The risk spillover of rare earth assets has intensified, which is likely to be due to the immaturity of China’s heavy rare earth trading system. This also makes the resource transmission mechanism not completely smooth. Moreover, the derivatives of rare earth options and futures have not been fully allocated, which means that the sudden imported risks cannot be mitigated in time.
Finally, we calculate the TCI based on the TVP-VAR-SV methods (see Figure 6) to analyze the time-varying characteristics of the risk spillover effect of China’s entire rare earth trading market.
During the sampling period, the TCI of China’s rare earth trading system is between 40% and 96%, and the risk linkage is uncertain and volatile. The more significant impact stemmed from two policy adjustments made by China’s rare earth regulatory authorities in October 2018 and May 2019, respectively. The TCI shows that the overall fluctuation risk spillover level of China’s rare earth trading market is on the rise.
However, during the stable policy period of 2017–2018, China’s rare earth market volatility index was also relatively stable. After the policy adjustment, the spillover index reflects the risk change of the rare earth trading system in a short period of time, which further shows that the trading risk monitor model that we used can effectively capture the change in the systemic risk of the rare earth trading market.
It can be seen that the TCI calculated in our paper can truly reflect the overall risk level of China’s rare earth trading system, which is conducive to the dynamic monitoring of the risks for the rare earth regulatory department.
In addition to the two main political effects, there is a cyclical behavior in the index. The cyclical behavior of the financial time series is not only reflected in the traditional assets price and macroeconomics, but also reflected in the spillover effect of the trading risks. Due to the mean reversion characteristics of the asset prices and log-returns (these conclusions are derived from the weak form of the efficient market hypothesis and rational investor hypothesis in economics), the risk spillover effect caused by trading friction of different investors would also produce an obvious cyclical behavior. There is a causal relationship between mean reversion and periodicity, and that is the reason why the TCI has cyclical behavior. Especially, those obvious peaks are what we truly need to further discuss (such as interconnection with macroeconomic variables or regulations of the rare earth market). In addition to analyzing them from a macro perspective, further research on the specific reason of cyclical behavior from the micro perspective seems to also have important academic significance.

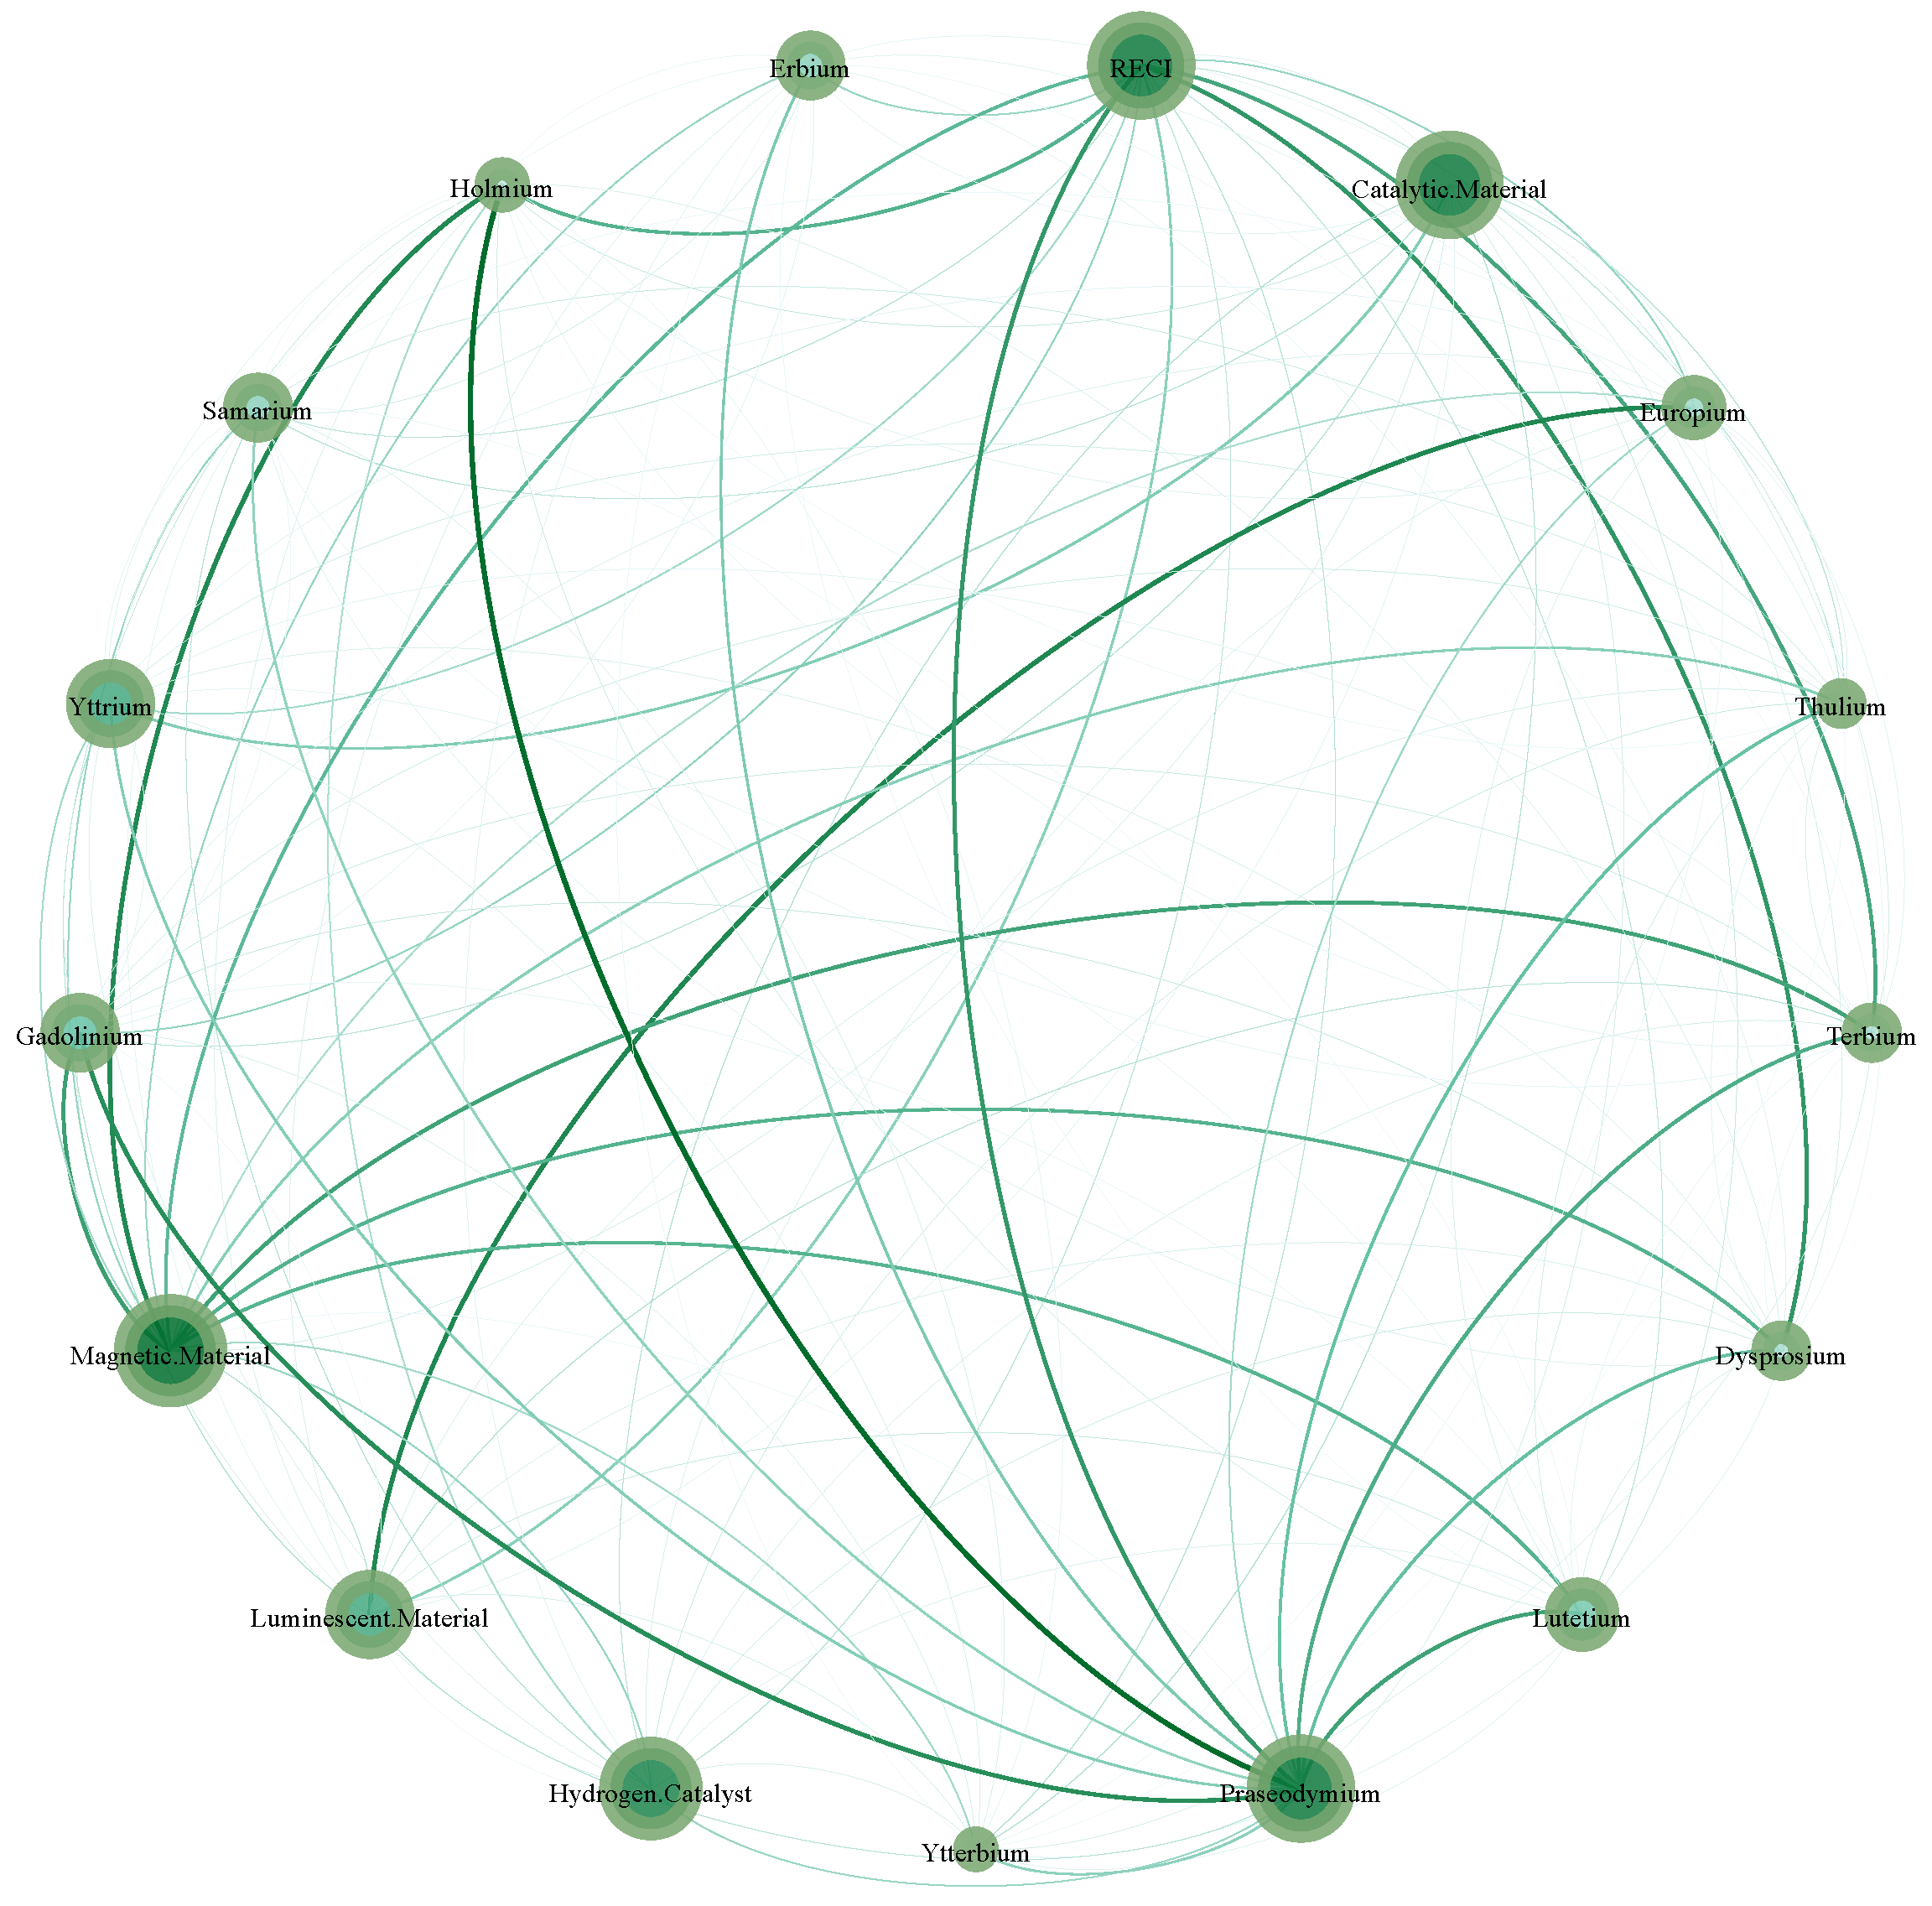
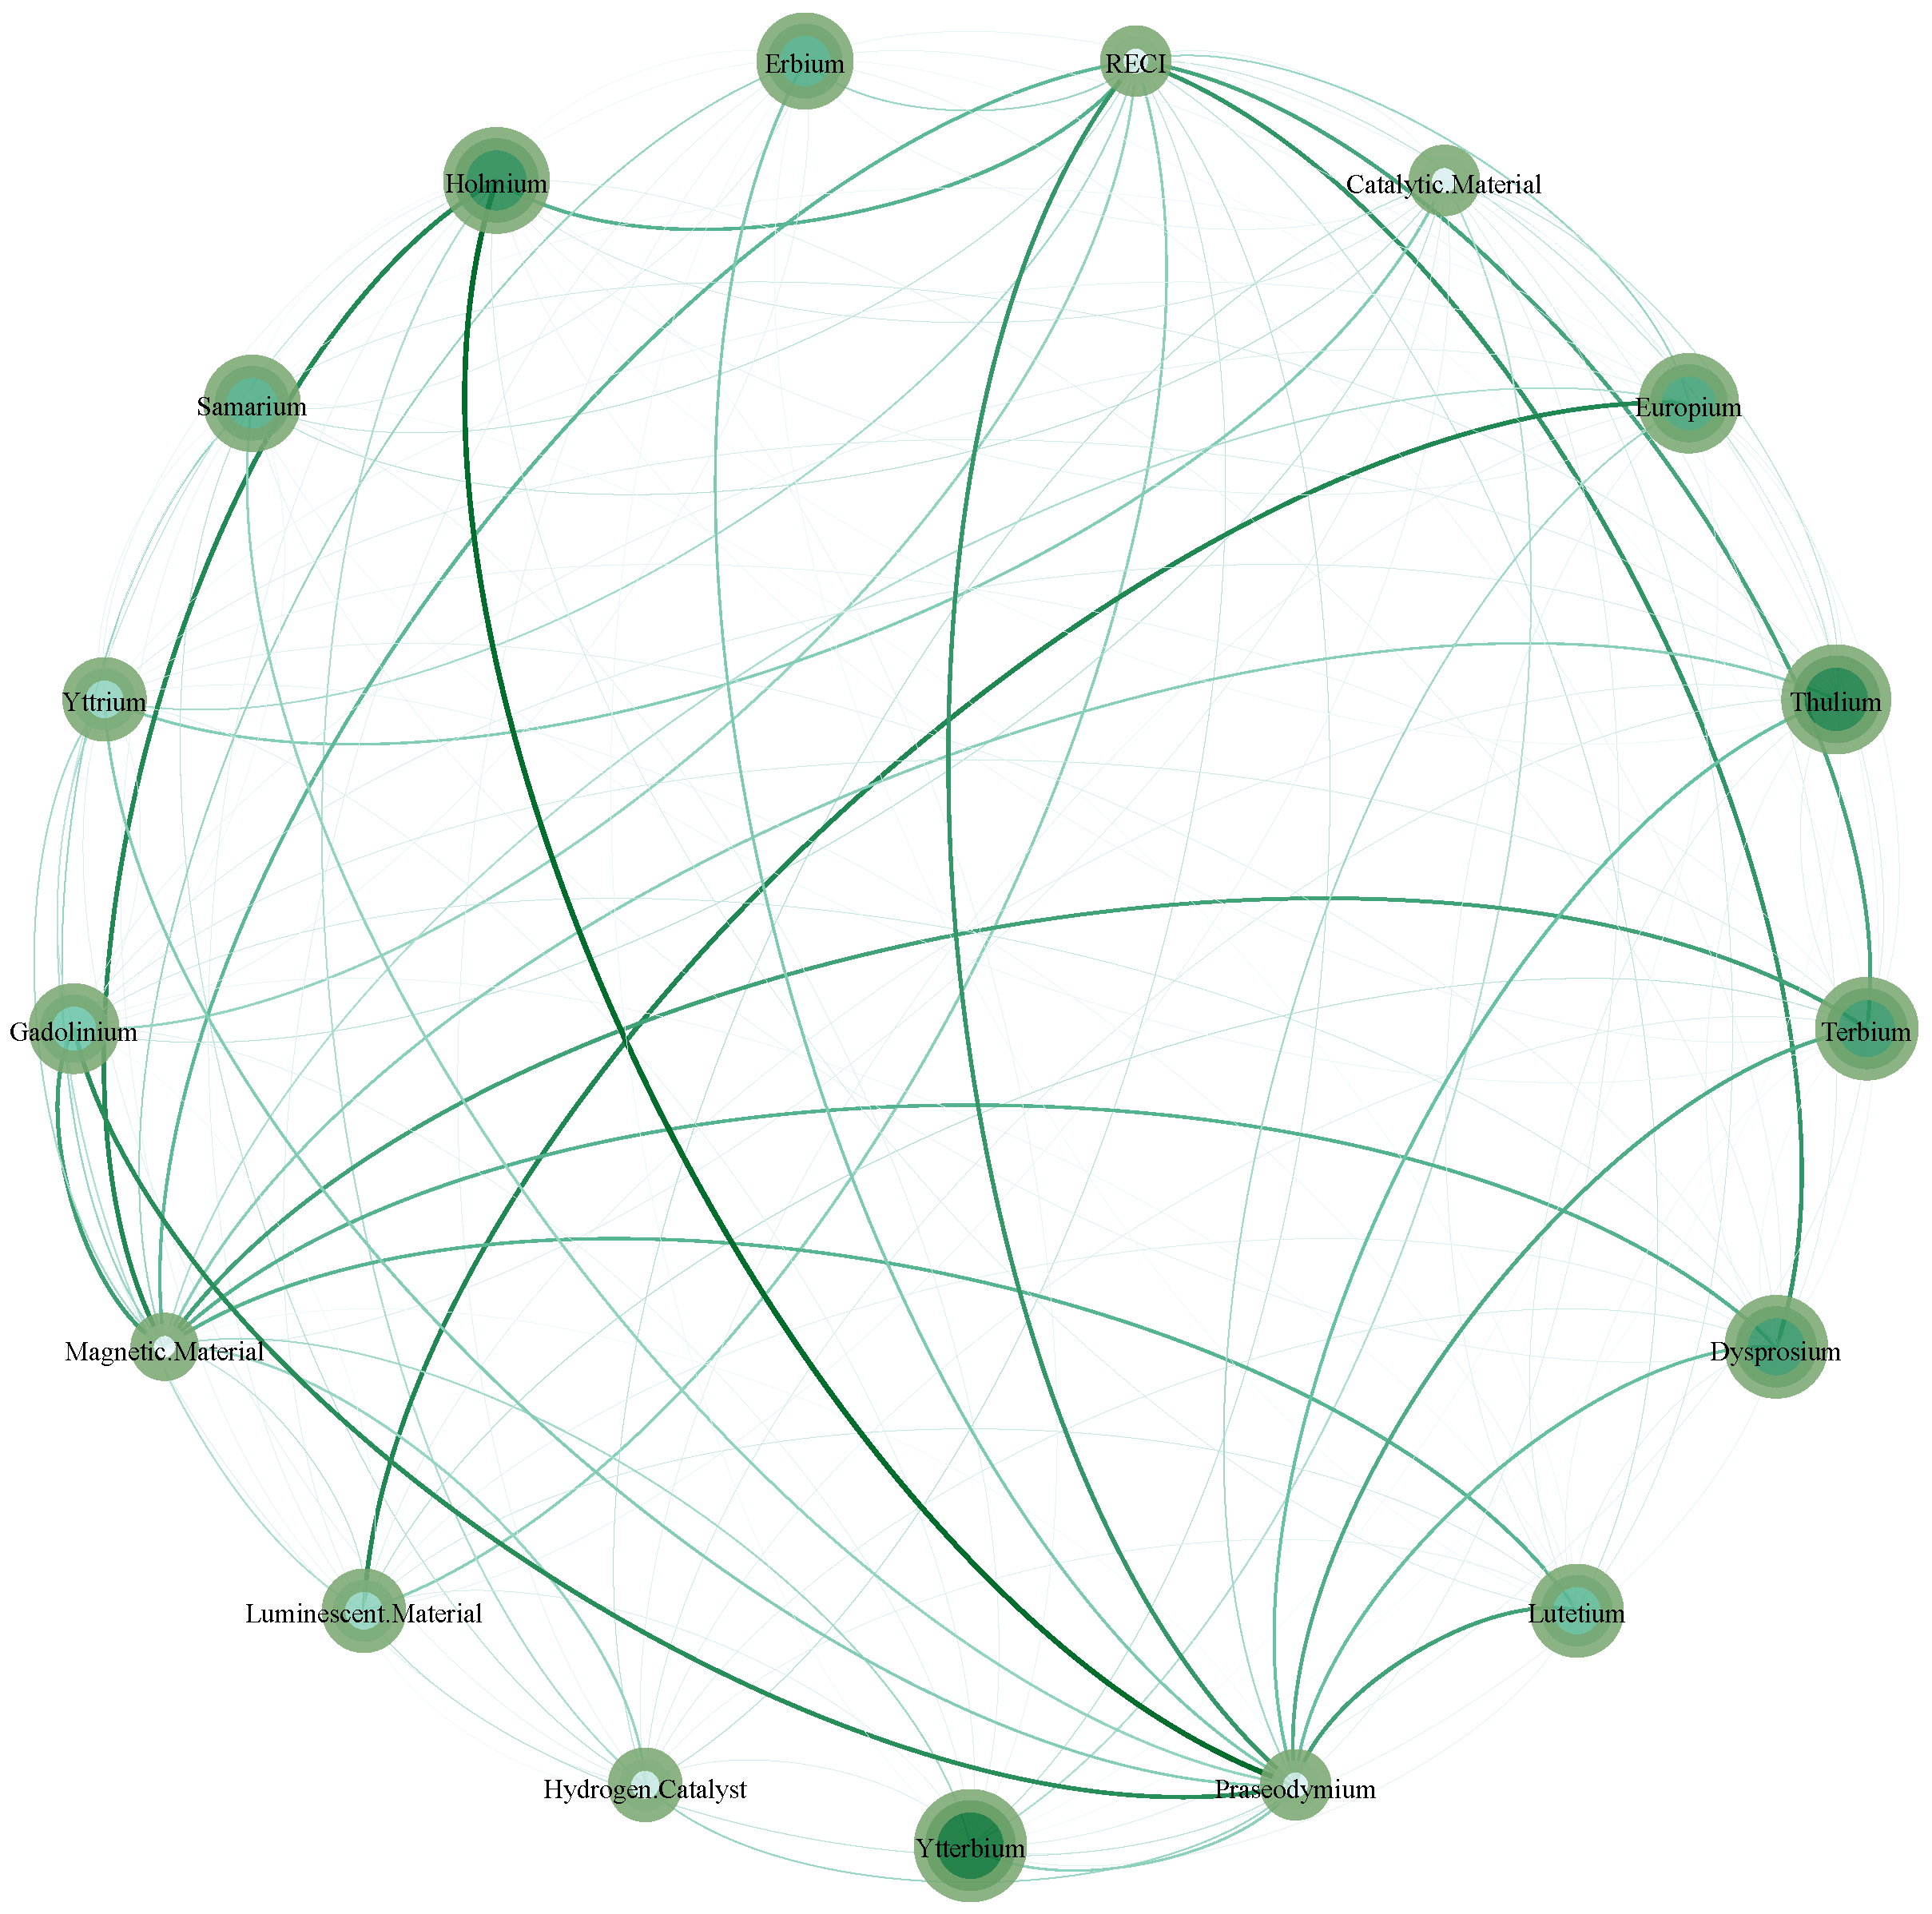
4.2. Bilateral Trading Risk Spillover Complex Network

To build a volatility spillover complex network, we obtained a partial connectedness spillover table of the trading risk volatility. Table 2 reports the risk spillover effect between different assets of China’s rare earth trading market, which was calculated based on the 17 rare earth assets from the 17-order variance decomposition risk spillover table.
The numbers on the diagonal in the table represent the lagged effect on the asset in the current period. Thulium’s lagged effect on itself is 56.11%. As for all the rare earth assets, thulium receives the greatest effect from its own dynamics. RECI is the least affected by its own dynamics, which is only by 19.40%. This shows that RECI’s market trading risk mainly comes from other assets in the rare earth trading market.
From the off-diagonal elements in Table 2, it can be seen that the risk spillover effect of China’s rare earth trading market shows volatility, asymmetry, and uncertainty. The overall linkage of the risk contagion in China’s rare earth trading market is strong.
Except from the perspective of the direction of risk spillover From, To, and Net) and the net spillover effects of the rare earth oxide (except for praseodymium, 55.49%), which are negative, the rest of assets (composite index and catalysts) are all positive. The rare earth composite index and catalysts are the main sources of risk spillovers. Except for praseodymium, oxides are all risk takers and are more affected by the impact of other assets. It shows that the external risk spillover effect of comprehensive rare earth assets is relatively large, while single rare earth oxides are more affected by the risk impact of other types of assets.
As for the external risk spillover, RECI has the highest spillover effect of 107.14%. It is in the leading position of information in the entire rare earth trading market. Furthermore, it is the primary source of trading risk in the rare earth market. During the research sample period, the average value of systemic volatility spillover in China’s rare earth market is 64.18%. The risk linkage within the rare earth trading market is relatively strong; trading risks are more likely to be transmitted through various channels.
We then drew a heat map (Figure 7) based on the results of the above risk spillover matrix, which more intuitively confirms our conclusion. The rare earth comprehensive index and its catalysts region have a darker color block with a higher concentration. The risk contagion between rare earth oxides is weak, mainly because of their trading volume and price fluctuations.
On the basis of obtaining the risk spillover measure, we took the target of China’s rare earth trading market as the node, the volatility spillover effect between assets as the connection edge of the complex network, and the variance contribution degree of the variance decomposition as the adjacency matrix. Finally, we constructed the volatility spillover complex network and used it to reflect changes in the risk contagion.
We used the representation convention in the field of graph theory. In this paper, we represent the clockwise connection of nodes as the information input and the counterclockwise connection as the information overflow.
Figure 8 and Figure 9 intuitively reflect the complex network of volatility spillover and volatility taking in China’s rare earth trading market throughout the sample period. The color and size represent the betweenness centrality, which means the degree of significance in China’s rare earth trading system. The darker and larger the node is, the greater total risk (in and out) of the target that it has. The edge represents the weighted degree, which means the intensity of risk (in and out). It can be clearly seen that during the entire transaction period, the complex network connection of risk diffusion is relatively tight. RECI, praseodymium, and catalysts are the main risk spillover assets, and their nodes are darker and larger. At the same time, the number of their connected edges far exceeds of rare earth oxides, which indicates that the nodes have more connectedness.

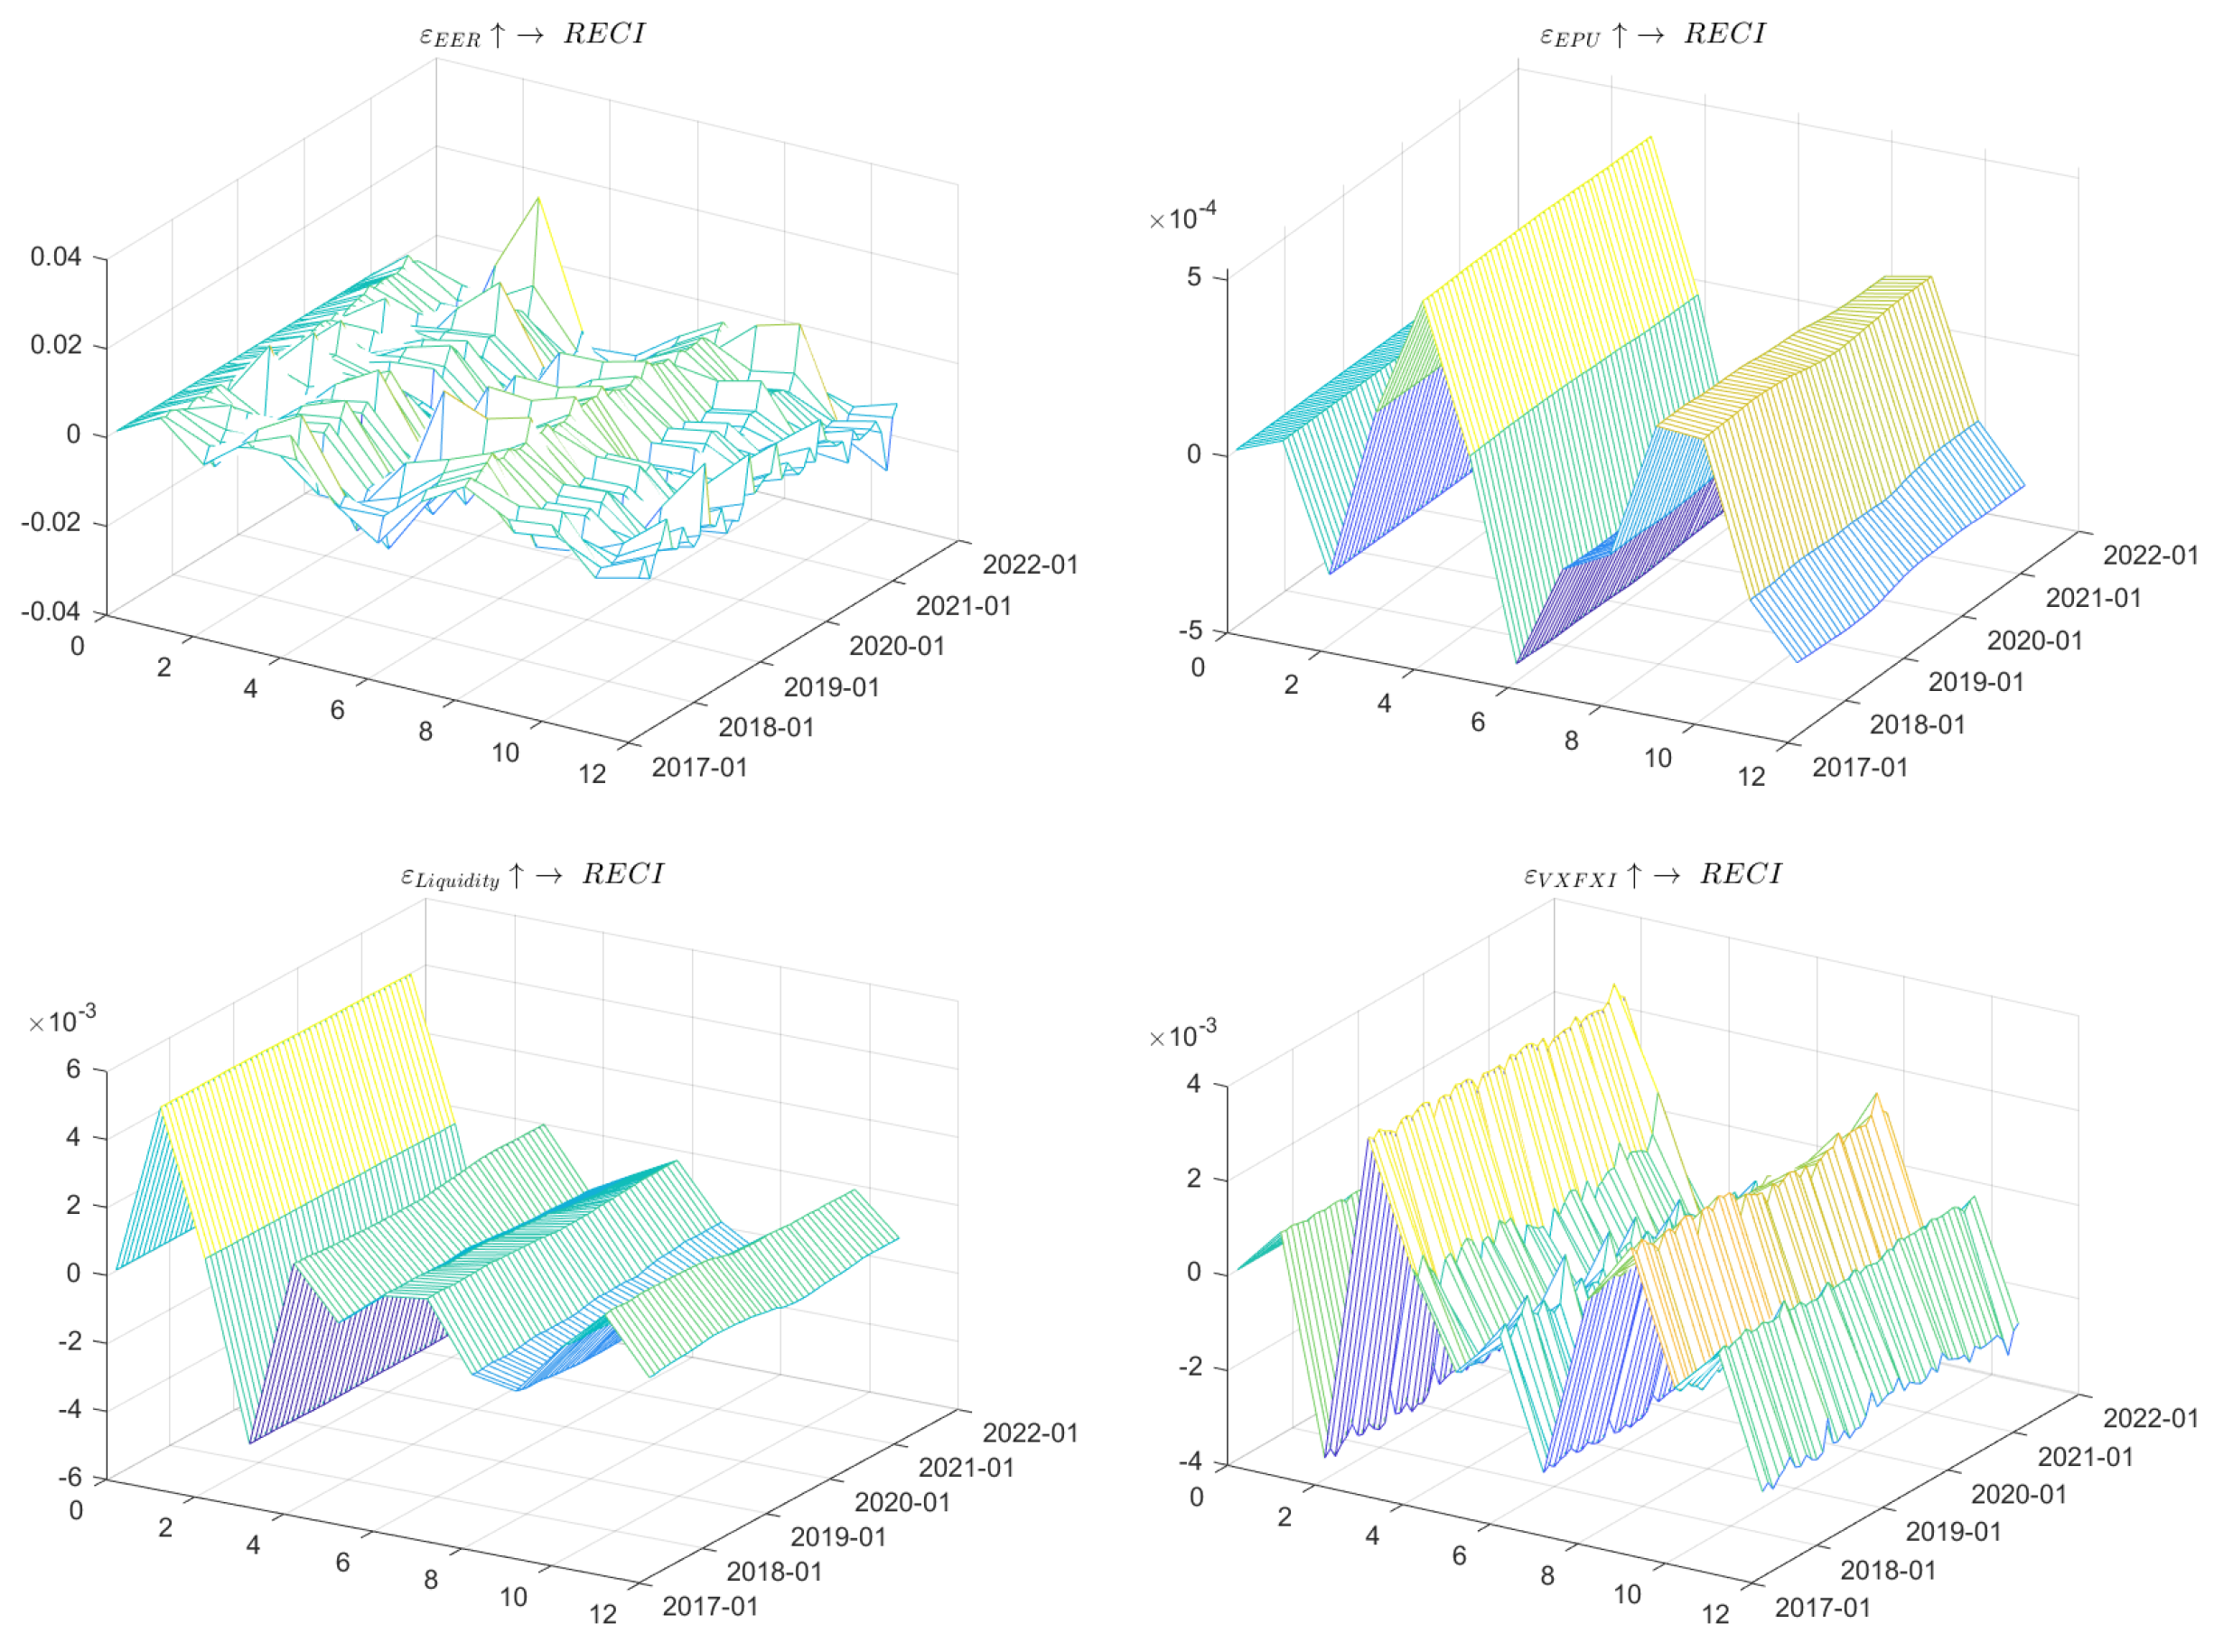
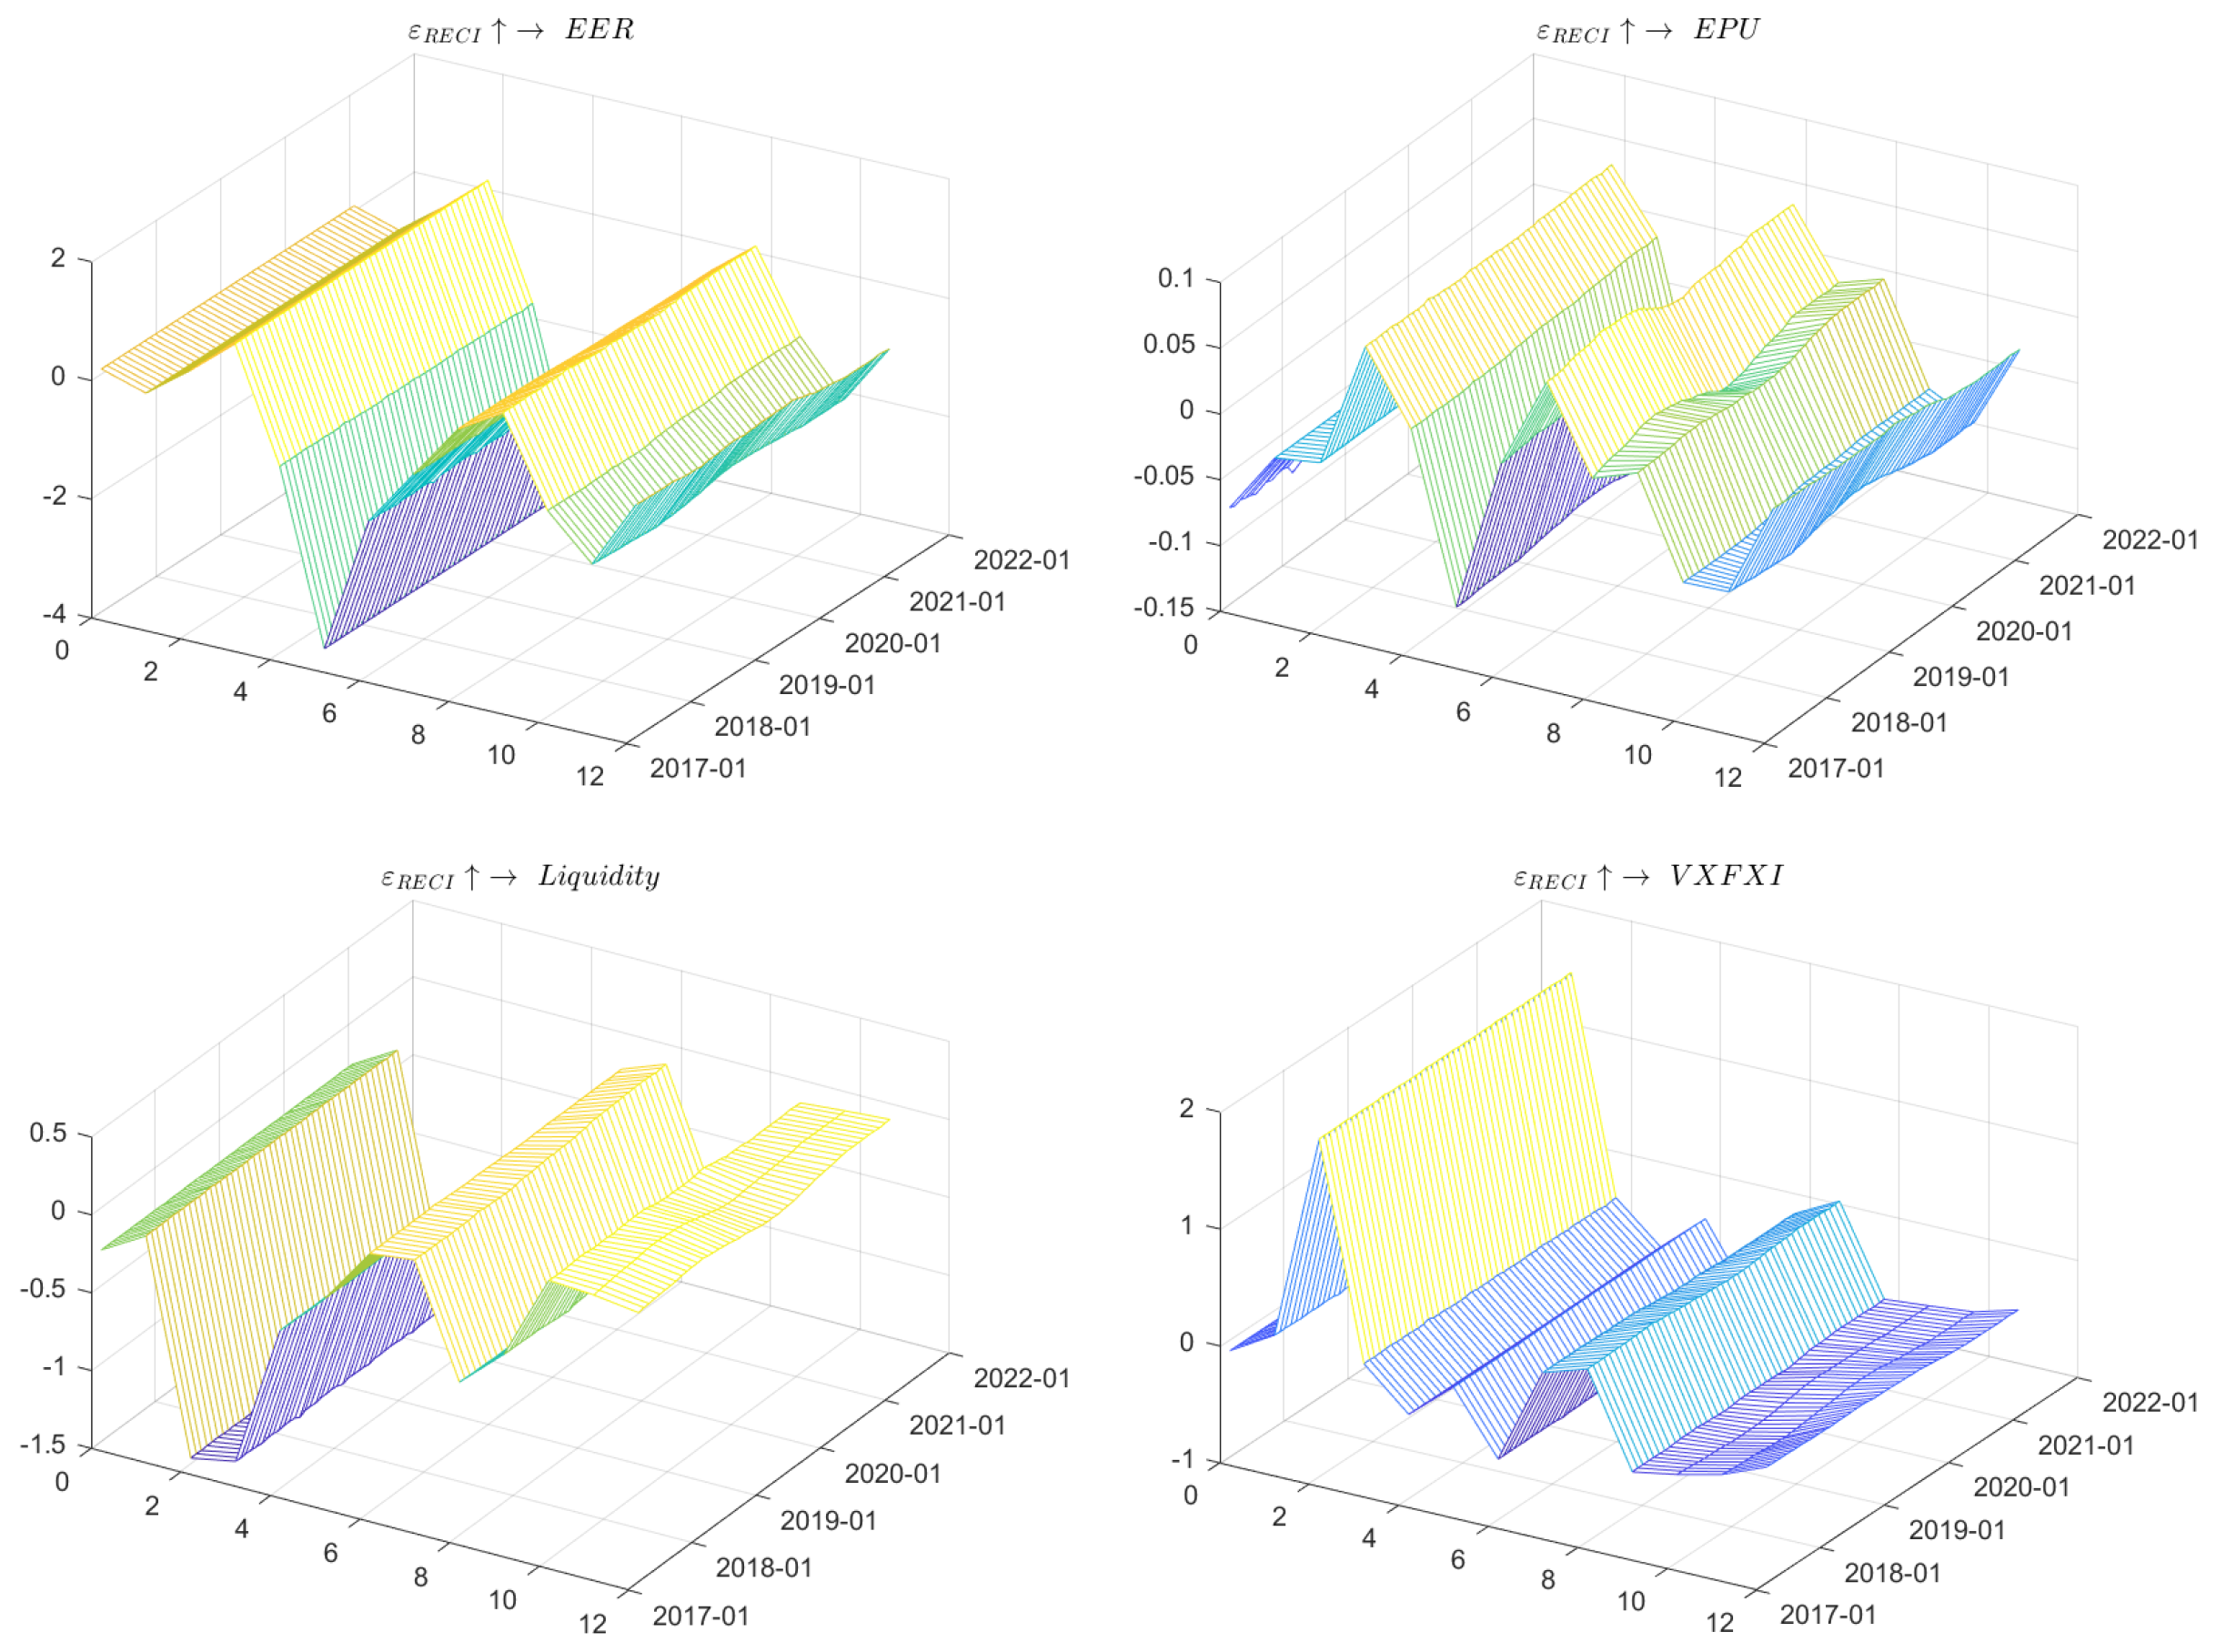
4.3. Risk Spillover Mechanism and Driven Factor Analysis

In this part, we used the TCI as a proxy variable for the risk spillover index of China’s rare earth trading system. In order to explore the formation mechanism of China’s rare earth trading market risk, we combined China’s macroeconomic variables (VXFXI, EER, EPU, and liquidity) and TCI proxy variables to construct the TVP-VAR-SV model again.
Before modeling with the TVP-VAR-SV model, we used a multivariate nonlinear Granger causality test to analysis the driven factors of China’s rare earth market trading risk spillover effect. Table 3 shows the multivariate nonlinear Granger causality test result of macroeconomic variables on China’s rare earth trading market TCI (RECI’s proxy variable).
Based on the test result of the multivariate nonlinear granger causality, nonlinear causal relationships are buried in four macroeconomic variables and the TCI (RECI’s proxy variable). Therefore, we further apply the TVP-VAR-SV model and impulse response to analyze the dynamic between the RECI and the four selected macroeconomic variables.
All parameters estimated from the RECI and macroeconomic variables are shown in Table 4. The number of samples for the MCMC method is set to 50,000 times and 5000 burnings before Bayesian sampling.
Moreover, to provide a reference for exploring the nonlinear factors and long-run persistence of the connectedness spillover effects, we drew 3D dynamic impulse response plots for analysis from the result of the TVP-VAR-SV model. Among them, the x-axis represents the lag period of the shock, the y-axis is the time axis, and the z-axis is the response intensity of the target, respectively.
To explore the long-term response results, we used daily frequency macroeconomic data for the model fitting. In order to make the data frequency match, we reduced the daily frequency to a monthly time series.
The impulse response result is shown in Figure 10 and Figure 11, where the time-varying impulse responses are computed using the average posterior mean of time-varying parameters from the TVP-VAR-SV model in every MCMC iteration.
The results show that the impact of the EER on the RECI is not significant; it is relatively unstable from the perspective of time axis, which means that we need to analyze it from a reverse perspective. As China is a major exporter of rare earth, the increase in transaction risks in the rare earth market has a significantly positive impact on the EER. The above conclusion is well proved in the impulse response function. Due to the lag of shocks, fluctuations in the rare earth market will be transmitted to the exchange rate market in 6 weeks.
As for the EPU, rising economic policy uncertainty will lead to a sudden increase in RECI for a short period of time, which will gradually stabilize over time. It is also a good proof of the large fluctuations in China’s rare earth trading market due to the policy effects during 2018–2019. Due to the bilateral nonlinear Granger causality between the RECI and EPU, from the perspective of the increase in RECI volatility, it has a seriously positive impact on the EPU.
From the perspective of the liquidity proxy variables represented by spreads between treasuries, the results of the impulse response are consistent with the results of the nonlinear Granger causality test. The increase in liquidity can simultaneously increase the fluctuation of the RECI in a short period of time, which means that the hysteresis effect is not obvious. The conclusion of the reverse shock is opposite to the forward shock.
The impact of rare earth (RECI) on the stock market (VXFXI) fluctuations is also more significant. Due to the large differences in market participants and effectiveness, the RECI in heterogeneous markets has a greater impact on semi-strong effective VXFXI in stock markets. From the perspective of the trading time, the impact of the VXFXI on the RECI is not stable enough, which is probably caused by different market participants and trading policies.

5. Conclusions

In the post-pandemic period, the recovery of the global economy has become the general trend. Rare earth mining, production, and recycling activities have progressively achieved prominence in recent years due to their importance in global trading and advanced technologies. There is no doubt that rare earth transactions have played a truly important role in the recovery of the international economy for China. However, the fluctuation in China’s rare earth market value due to disruptions from instability, uncertainty, and geopolitical decisions can impair the economic recovery process and even lead to the outbreak of systemic financial risk. In this context, analyzing the risk spillover mechanism of rare earth has important practical significance for regulators and investors.
This study used the TVP-VAR-SV model to extend the dynamic risk spillover measurement method based on the forecast error variance decomposition as well as macroeconomic variables’ dynamics. Based on the above discussion, we took the target of China’s rare earth trading market as the node, the volatility spillover effect between assets as the connection edge of the complex network, and the variance contribution degree of the variance decomposition as the adjacency matrix. Then, we constructed the volatility spillover complex network and used it to reflect changes in the risk contagion. In addition, we further discussed the mechanisms affecting risk spillover in China’s rare earth trading market using the impact and dynamic relationships of primarily four macroeconomic variables. Finally, the empirical results of China’s rare earth trading market show the size and direction of the risk spillover effect; moreover, the formation mechanisms are summarized to provide policy recommendations for trading risk protection establishment under macro-prudential supervision, which also serves as a reference for investors to allocate rare earth assets.
According to the empirical analysis, the risk spillover effect of China’s rare earth trading market show volatility, asymmetry, and uncertainty. The overall linkage of the risk contagion in China’s rare earth trading market is strong. The rare earth composite index and catalysts are the main sources of risk spillovers. Except for praseodymium, oxides are all risk takers and are more affected by the impact of other assets. The RECI has the highest spillover effect of 107.14% in the leading position of information in the entire rare earth trading market. The average value of systemic volatility spillover in China’s rare earth market is 64.18%. During the entire transaction period, in the rare earth complex trading network, the number of connected edges of the RECI, praseodymium, and catalysts far exceeds that of the rare earth oxides, which indicates that the nodes have greater connectedness. These findings indicate that the promulgation of new policies in 2019 suddenly altered China’s rare earth trading market risk structure and the size of the risk spillover.
As for the risk contagion mechanism of the rare earth trading market, the empirical results show that in the trading risk spilling period, the increase in transaction risks in the rare earth market has a significantly positive impact on the effective exchange rate (EER). Furthermore, rising economic policy uncertainty will lead to a sudden increase in the RECI for a short period of time. The increase in liquidity will simultaneously increase the fluctuation of the RECI in a short period of time, which means that the hysteresis effect is not obvious. The impact of the VXFXI on the RECI is not stable enough, which is probably caused by different market participants and trading policies. Therefore, China’s rare earth regulators should pay more attention to sudden changes on the risk spillover of China’s rare earth trading market. Moreover, they must also be alert to the systemic trading risks caused by the volatility of the EER, EPU, and VXFXI in China’s rare earth market.

Author Contributions

R.Y. and J.G. initiated the project and suggested the methodology; J.G. and X.X. developed the model and program and examined the theory validation; J.G. and X.X. conducted the empirical research and analyzed the results. The manuscript was written through the contribution of all authors. All authors discussed the results and reviewed and approved the final version of the manuscript.

Funding

This research was supported by the National Natural Science Foundation of China (NSFC No. 72103083) and the National Social Science Foundation of China (Grant No. 21BTJ068).

Data Availability Statement

The data that support the findings of this study are available from the Wind and BIS databases. Restrictions apply to the availability of these data, which were used under license for this study. Data are available from the authors with the permission of the Wind and BIS databases.

Acknowledgments

The authors would like to sincerely thank Dan Chen, Jiangze Du, Xingjian Tao, the editor, and the anonymous referees for their valuable suggestions and helpful comments, which greatly improved the article.

Conflicts of Interest

The authors declare no conflict of interest.

Appendix A

This appendix represents the technical details of the multivariate nonlinear Granger causality. During the test process, three strictly stationary and weakly correlated high-dimensional time series are given in X t , Y t , Q t ; let Z t represent 1 lagged times series of X t . They would degenerate synchronously to the results of the bivariate nonlinear Granger causality test of Diks and Panchenko [28].
The null hypothesis where there is no bivariate Granger causality was rewritten by Hiemstra and Jones [34] with a joint probability integral:
C X , Y , Z θ C X , Y θ = C Y , Z θ C Y θ
θ > 0 , C w θ is the joint probability integral of the high-dimensional time series; P is the probability function. Then, C w θ = P | | W 1 W 2 | | < θ and W 1 , W 2 W , where W and W k are the Wishart distribution. Hiemstra and Jones [34] built the HJ statistic:
C ^ w θ , n = 2 n n 1 Σ Σ I i j W
Then, Diks and Panchenko [28] proposed another nonparametric test statistic DP to overcome the shortcoming of the HJ statistic:
E f X , Y , Z X , Y , Z f Y Y f X , Y X , Y f Y , Z Y , Z = 0
q ^ n θ n = n 1 n n 2 E f ^ X , Y , Z X i , Y i , Z i f ^ Y Y i f ^ X , Y X i , Y i f ^ Y , Z Y i , Z i
f ( ) and f ^ ( ) are the joint probability function and local estimator, respectively. The null hypothesis that there is no Granger causality between the high-dimensional series can be described as:
E f X , Y , Z , Q X , Y , Z , Q f Y , Q Y , Q f X , Y , Q X , Y , Q f Y , Z , Q Y , Z , Q = 0
Z t = Y t + 1 using the local density estimators, and the following test statistics can be further constructed into:
q ^ n ε = n 1 n n 2 Σ i f ^ X , Y , Z , Q X i , Y i , Z i , Q i f ^ Y , Q Y i , Q i f ^ X , Y , Q X i , Y i , Q i f ^ Y , Z , Q Y i , Z i , Q i
f ^ W W i = n 1 ε d w Σ j i K W i W j / ε is the local density estimator for random vectors. K is for the kernel density estimation, and d w means the dimension of the Wishart distribution. Then, we refactor the method proposed by Diks and Wolski [30] and perform a local sharpening on the (13). We obtain the local density estimation of the random vector with a mapping of ψ p :
f ^ W s W i = n 1 ε d w Σ j i K W i ψ p W j / ε
Finally, the nonlinear Granger causality test statistics in multivariate scenarios are obtained by:
q ^ n ε = n 1 n n 2 Σ i f ^ X , Y , Z , Q s X i , Y i , Z i , Q i f ^ Y , Q s Y i , Q i f ^ X , Y , Q s X i , Y i , Q i f ^ Y , Z , Q s Y i , Z i , Q i

Appendix B

This appendix represents the technical details of the MCMC algorithm. With the prior information that was provided, the initial parameter estimates follow:
β 0 N β ^ O L S , 4 V β ^ O L S A 0 N A ^ O L S , 4 V A ^ O L S ln σ 0 N ln σ ^ O L S , I n
β ^ O L S , A ^ O L S , and ln σ ^ O L S represent the OLS estimators. V ( ) represents the variance. I W represents the inverse Wishart distribution. The variance-covariance matrix of β t , ln σ t , and A t is:
Q I W 0.0001 V β ^ O L S , 1
W I W 0.0001 n + 1 I n , n + 1
S j I W 0.0001 j + 1 V A ^ j , O L S , j + 1
Then, we perform the posterior distribution calculation of the MCMC algorithm. Define the collection of observation mappings: X t t = 1 T , β t t = 1 T , A t t = 1 T , and Σ t t = 1 T . V = Q , S , W is a variance-covariance matrix containing independent, identically distributed random variables.
In our case, we adopt the following MCMC simulation-based method to obtain the critical values to solve for the time-varying parameter of our model:
  • Give the initial value of X t t = 1 T , β t t = 1 T , A t t = 1 T , and Σ t t = 1 T ;
  • Sample β t from p β T | y T , A T , Σ T , X , subject to the given condition A t t = 1 T , Σ t t = 1 T , and X t t = 1 T ;
    Specifically, the observation equation corresponds to the linear Gaussian shocks of equation. For the observable vector y = y 1 , . . . , y t T , the state vector is X = X 1 T , . . . , X t T T and the set of the parameter vector is k = k 1 , . . . , k t T . We have the following conditional transformation, respectively:
    p x | y n = p x n | y n t = 1 n 1 p x t | y t , x t + 1 , p k | y n , x = p k n | x n , y n t = 1 n 1 p k t | x t , y t , x t + 1 ;
    Finally, with the mean and derivative of β t | t + 1 and P t | t + 1 , the conditional density function can be expressed as:
    p β T | y T , Σ T , A T , X = p β T | y T , Σ T , A T , X × t = 1 T 1 p β T | β T + 1 , β t | β t + 1 , y T , Σ T , A T , X N β t | t + 1 , P t | t + 1 ;
  • Sample A t from p A T | y T , β T , Σ T , X , subject to the given condition β t t = 1 T , Σ t t = 1 T , and X t t = 1 T ;
  • Sample X t from p X | y T , A T , Σ T , β , subject to the given condition A t t = 1 T , Σ t t = 1 T , and β t t = 1 T . Specifically, sample the independent identically distributed random variables Q, W, and S from p Q , W , S | y T , A T , Σ T , β ;
    p Q , W , S | y T , A T , Σ T , β = p Q | y T , A T , Σ T , β × p W | y T , A T , Σ T , β × i = 1 n 1 p S i | y T , A T , Σ T , β
  • Sample Σ t from p Σ T | y T , A T , β T , X , subject to the given condition A t t = 1 T , Σ t t = 1 T , and X t t = 1 T ;
  • Return to 2.

References

  1. Hossain, M.K.; Rubel, M.H.K.; Akbar, M.A.; Ahmed, M.H.; Haque, N.; Rahman, M.F.; Hossain, J.; Hossain, K.M. A review on recent applications and future prospects of rare earth oxides in corrosion and thermal barrier coatings, catalysts, tribological, and environmental sectors. Ceram. Int. 2022, 48, 32588–32612. [Google Scholar] [CrossRef]
  2. Shi, Y.; Feng, Y.; Zhang, Q.; Shuai, J.; Niu, J. Does China’s new energy vehicles supply chain stock market have risk spillovers? Evidence from raw material price effect on lithium batteries. Energy 2023, 262, 125420. [Google Scholar] [CrossRef]
  3. Naeem, M.A.; Yousaf, I.; Karim, S.; Yarovaya, L.; Ali, S. Tail-event driven NETwork dependence in emerging markets. Emerg. Mark. Rev. 2022, 1, 100971. [Google Scholar] [CrossRef]
  4. Shuai, J.; Peng, X.; Zhao, Y.; Wang, Y.; Xu, W.; Cheng, J.; Wang, J. A dynamic evaluation on the international competitiveness of China’s rare earth products: An industrial chain and tech-innovation perspective. Resour. Policy 2022, 75, 102444. [Google Scholar] [CrossRef]
  5. Xiao, S.; Geng, Y.; Rui, X.; Su, C.; Yao, T. Behind of the criticality for rare earth elements: Surplus of China’s yttrium. Resour. Policy 2022, 76, 102624. [Google Scholar] [CrossRef]
  6. Ilankoon, I.M.S.K.; Dushyantha, N.P.; Mancheri, N.; Edirisinghe, P.M.; Neethling, S.J.; Ratnayake, N.P.; Batapola, N.M. Constraints to rare earth elements supply diversification: Evidence from an industry survey. J. Clean. Prod. 2022, 331, 129932. [Google Scholar] [CrossRef]
  7. Yin, J.N.; Song, X. A review of major rare earth element and yttrium deposits in China. Aust. J. Earth Sci. 2022, 69, 1–25. [Google Scholar] [CrossRef]
  8. Haq, I.U.; Nadeem, H.; Maneengam, A.; Samantreeporn, S.; Huynh, N.; Kettanom, T.; Wisetsri, W. Do rare earths and energy commodities drive volatility transmission in sustainable financial markets? Evidence from China, Australia, and the US. Int. J. Financ. Stud. 2022, 10, 76. [Google Scholar] [CrossRef]
  9. Hau, L.; Zhu, H.; Yu, Y.; Yu, D. Time-frequency coherence and quantile causality between trade policy uncertainty and rare earth prices: Evidence from China and the US. Resour. Policy 2022, 75, 102529. [Google Scholar] [CrossRef]
  10. Hanif, W.; Mensi, W.; Gubareva, M.; Teplova, T. Impacts of COVID-19 on dynamic return and volatility spillovers between rare earth metals and renewable energy stock markets. Resour. Policy 2023, 80, 103196. [Google Scholar] [CrossRef]
  11. Van de Leur, M.C.; Lucas, A.; Seeger, N.J. Network, market, and book-based systemic risk rankings. J. Bank. Financ. 2017, 78, 84–90. [Google Scholar] [CrossRef] [Green Version]
  12. Diebold, F.X.; Yilmaz, K. Measuring financial asset return and volatility spillovers, with application to global equity markets. Econ. J. 2009, 119, 158–171. [Google Scholar] [CrossRef] [Green Version]
  13. Acharya, V.V.; Volpin, P.F. Corporate governance externalities. Rev. Financ. 2010, 14, 1–33. [Google Scholar] [CrossRef]
  14. Acharya, V.V.; Pedersen, L.H.; Philippon, T.; Richardson, M. Measuring systemic risk. Rev. Financ. Stud. 2017, 30, 2–47. [Google Scholar] [CrossRef] [Green Version]
  15. Acharya, V.V.; Engle, R.; Richardson, M. Capital shortfall: A new approach to ranking and regulating systemic risks. Am. Econ. Rev. 2012, 102, 59–64. [Google Scholar] [CrossRef] [Green Version]
  16. Diebold, F.X.; Yilmaz, K. Better to give than to receive: Predictive directional measurement of volatility spillovers. Int. J. Forecast. 2012, 28, 57–66. [Google Scholar] [CrossRef] [Green Version]
  17. Diebold, F.X.; Yilmaz, K. On the network topology of variance decompositions: Measuring the connectedness of financial firms. J. Econom. 2014, 182, 119–134. [Google Scholar] [CrossRef] [Green Version]
  18. Grant, E.; Yung, J. The double-edged sword of global integration: Robustness, fragility, and contagion in the international firm network. J. Appl. Econom. 2021, 36, 760–783. [Google Scholar] [CrossRef]
  19. Härdle, W.K.; Wang, W.; Yu, L. Tenet: Tail-event driven network risk. J. Econom. 2016, 192, 499–513. [Google Scholar] [CrossRef]
  20. Koop, G.; Pesaran, M.H.; Potter, S.M. Impulse response analysis in nonlinear multivariate models. J. Econom. 1996, 74, 119–147. [Google Scholar] [CrossRef]
  21. Pesaran, H.H.; Shin, Y. Generalized impulse response analysis in linear multivariate models. Econ. Lett. 1998, 58, 17–29. [Google Scholar] [CrossRef]
  22. Primiceri, G.E. Time varying structural vector autoregressions and monetary policy. Rev. Econ. Stud. 2005, 72, 821–852. [Google Scholar] [CrossRef]
  23. Nakajima, J. Time-varying parameter VAR model with stochastic volatility: An overview of methodology and empirical applications. Monet. Econ. Stud. 2011, 29, 107–142. [Google Scholar]
  24. Antonakakis, N.; Chatziantoniou, I.; Gabauer, D. Refined measures of dynamic connectedness based on time-varying parameter vector autoregressions. J. Risk Financ. Manag. 2020, 13, 84. [Google Scholar] [CrossRef] [Green Version]
  25. Koop, G.; Korobilis, D. Large time-varying parameter VARs. J. Econom. 2013, 177, 185–198. [Google Scholar] [CrossRef] [Green Version]
  26. Chan, J.C.; Eisenstat, E. Bayesian model comparison for time-varying parameter VARs with stochastic volatility. J. Appl. Econom. 2018, 33, 509–532. [Google Scholar] [CrossRef]
  27. Barigozzi, M.; Brownlees, C. Nets: Network estimation for time series. J. Appl. Econom. 2019, 34, 347–364. [Google Scholar] [CrossRef] [Green Version]
  28. Diks, C.; Panchenko, V. A new statistic and practical guidelines for nonparametric Granger causality testing. J. Econ. Dyn. Control 2006, 30, 1647–1669. [Google Scholar] [CrossRef] [Green Version]
  29. Du, J.; Chen, X.; Gong, J.; Lin, X.; Lai, K.K. Analysis of stock markets risk spillover with copula models under the background of Chinese financial opening. Int. J. Financ. Econ. 2022, 27, 1–23. [Google Scholar] [CrossRef]
  30. Diks, C.; Wolski, M. Nonlinear granger causality: Guidelines for multivariate analysis. J. Appl. Econom. 2016, 31, 1333–1351. [Google Scholar] [CrossRef] [Green Version]
  31. Wind Information Technology Co., Ltd. Wind Finaicial Database, Shanghai, China. Available online: https://www.wind.com.cn/ (accessed on 21 March 2023).
  32. Bank for International Settlements NPO. BIS Financial Database, Basel, Switzerland. Available online: https://www.bis.org/ (accessed on 21 March 2023).
  33. Li, K. Report on the Work of the Government, Beijing, China. Available online: http://www.gov.cn/zhuanti/2019qglh (accessed on 21 March 2023).
  34. Hiemstra, C.; Jones, J.D. Testing for linear and nonlinear Granger causality in the stock price-volume relation. J. Financ. 1994, 49, 1639–1664. [Google Scholar]
Figure 1. Logarithmic returns of rare earth assets.
Systems 11 00168 g001
Figure 2. Logarithmic returns of macroeconomic variables.
Systems 11 00168 g002
Figure 3. Risk spillover (To) in China’s rare earth trading system.
Systems 11 00168 g003
Figure 4. Risk spillover (From) in China’s rare earth trading system.
Systems 11 00168 g004
Figure 5. Risk spillover (Net) in China’s rare earth trading system.
Systems 11 00168 g005
Figure 6. Total connectedness index (TCI) in China’s rare earth trading system.
Systems 11 00168 g006
Figure 7. Heatmap of risk spillover based on the connectedness approach.
Systems 11 00168 g007
Figure 8. Complex network of risk spillover (Out) in China’s rare earth trading system.
Systems 11 00168 g008
Figure 9. Complex network of risk spillover (In) in China’s rare earth trading system.
Systems 11 00168 g009
Figure 10. Time-varying impulse response results (macroeconomic variables to RECI).
Systems 11 00168 g010
Figure 11. Time-varying impulse response results (RECI to macroeconomic variables).
Systems 11 00168 g011
Table 1. Data description.
NameRECICatalystsPraseodymiumHolmiumVXFXIEPUEERLiquidity
Info
Observation12491249124912491249124912491249
FrequencyDailyDailyDailyDailyDailyDailyDailyDaily
Mean0.000−0.0000.0000.0010.0020.1930.0000.034
Minimum−0.040−0.045−0.095−0.105−0.184−0.839−0.014−1.951
Maximum0.0450.0460.0810.1240.4187.2640.01016.592
1st Quartile−0.003−0.003−0.002−0.002−0.033−0.309−0.001−0.029
3rd Quartile0.0030.0030.0030.0030.0280.4370.0010.030
Variance0.0000.0000.0000.0000.0040.6390.0000.434
S.D.0.0070.0100.0130.0150.0630.8000.0020.659
Skewness0.2280.028−0.3290.5551.2752.396−0.10019.971
Kurtosis6.7325.44713.41714.3095.10310.1503.002449.406
J–B 1906.094 * * * 1242.977 * * * 7547.869 * * * 8615.170 * * * 1362.082 * * * 5268.712 * * * 379.897 * * * 7408.729 * * *
ARCH-LM 63.848 * * * 133.090 * * * 104.300 * * * 34.934 * * * 117.560 * * * 21.726 * * 32.562 * * * 97.098 * * *
Q(20) 168.960 * * * 81.515 * * * 73.460 * * * 111.790 * * * 101.330 * * * 159.340 * * * 19.193 238.150 * * *
ADF(10) 7.527 * * * 8.202 * * * 7.759 * * * 7.912 * * * 11.094 * * * 9.049 * * * 9.878 * * * 6.234 * * *
K–S0.0220.0380.0190.0200.0170.0150.0300.014
ExplanationChina’s rare earth composite indexCatalysts indexRare earth oxidesRare earth oxidesETF volatility index of ChinaEconomic policy uncertaintyEffective exchange rate3M-Spread of SHIBOR and treasury yield
SourceWind [31]Wind [31]Wind [31]Wind [31]Wind [31]BIS [32]Du et al. [29]Wind [31]
Note: *** and ** indicate the significance at a level of 1% and 5%, respectively. J–B represents the Jarque–Bera statistics, which tests the normality of the datasets. ARCH-LM stands for the autoregressive conditional heteroscedasticity test based on Lagrange multiplier statistics. Q(20) represents the 20th lagged Ljung-Box Q statistics. ADF(10) are the unit root test values after 10 lags with no constants and a time trend. K–S represents Kolmogorov–Smirnov test; these indicate that all series satisfy the normality assumption. Due to limitations, we only show representative rare earth time series. The remaining series (13 rare earth oxides) are reserved for retrieval and can be obtained from the corresponding author.
Table 2. Risk spillover table of China’s rare earth trading market.
RECICata.Hydr.Lumi.Magn.Gado.Yttr.Sama.Holm.Erbi.Euro.Thul.Terb.Dysp.Lute.Pras.Ytte.FROM
RECI19.407.046.036.0015.464.232.582.383.373.483.231.263.644.602.7612.851.6880.60
Cata.7.5431.6013.004.217.122.1310.643.041.692.720.731.231.782.062.266.611.6268.40
Hydr.7.5711.2329.011.5815.112.761.481.951.611.191.050.841.191.011.7719.521.1670.99
Lumi.8.914.621.6030.803.111.898.611.552.252.3816.921.143.301.976.842.851.2569.20
Magn.11.167.9312.581.4325.802.991.302.311.541.540.881.441.612.151.9822.041.3174.20
Gado.6.843.773.541.828.5239.942.962.912.362.951.432.023.152.562.739.033.4760.06
Yttr.4.7413.752.0810.433.512.6139.412.782.073.311.211.832.262.132.284.071.5360.59
Sama.4.024.753.631.884.832.783.0649.882.353.951.082.462.272.962.194.773.1550.12
Holm.7.982.943.542.838.093.712.502.3640.112.862.231.763.242.113.328.811.6259.89
Erbi.5.913.051.622.994.032.543.463.082.8851.441.891.992.502.683.334.691.9348.56
Euro.5.711.301.6523.542.791.981.531.151.832.0944.990.881.472.002.673.131.2755.01
Thul.2.762.891.991.874.382.952.693.581.682.341.4456.112.042.212.185.083.8043.89
Terb.8.832.611.874.986.964.202.612.082.982.561.831.4143.053.202.706.132.0156.95
Dysp.10.532.802.032.596.733.822.732.462.723.062.181.853.1344.192.725.041.4255.81
Lute.4.253.442.318.056.502.892.562.272.363.262.041.352.451.9743.717.363.2256.29
Pras.6.977.4317.101.1522.102.711.002.080.971.410.891.181.271.041.9929.321.3970.68
Ytte.3.413.451.892.023.494.102.173.751.891.851.423.812.721.873.674.1854.3145.69
TO107.1483.0076.4677.39122.7248.3051.9039.7334.5440.9540.4326.4538.0136.5345.39126.1731.8464.18/60.41
Note: Due to the column space limitations, we set the abbreviations as follows: rare earth composite index, RECI; catalytic, Cata.; hydrogen, Hydr.; luminescent, Lumi.; magnetic, Magn.; gadolinium, Gado.; yttrium, Yttr.; samarium, Sama.; holmium, Holm.; erbium, Erbi.; europium, Euro.; thulium, Thul.; terbium, Terb.; dysprosium, Dysp.; lutetium, Lute.; praseodymium, Pras.; ytterbium, Ytte.
Table 3. Multivariate nonlinear granger causality test result.
VXFXIEEREPULiquidity
Panel A ( H 0 : RECI is not the macroeconomic variables’ nonlinear Granger causality reason)
Statistics0.5967 2.3306 * * * 1.2915 * −1.6102
p-Value0.27530.00980.09830.9463
Panel B ( H 0 : Macroeconomic variables are not the RECI’s nonlinear Granger causality reason)
Statistics 3.5733 * * * 5.5691 * * * 1.9882 * * 1.4185 *
p-Value0.00020.00000.02340.0781
Note: ***, **, and * indicate significance at the level of 1%, 5%, and 10%, respectively. Macroeconomic variables are the nonlinear Granger causality of RECI at different significance levels (1%, 5% and 10%), and vice versa.
Table 4. TVP-VAR-SV model estimation result.
MeanS.D.95% C.I.GewekeConst.
Σ β 1 0.00230.0003[0.0018, 0.0029]0.67203.0600
Σ β 2 0.00230.0003[0.0018, 0.0029]0.00403.7300
Σ α 1 0.00560.0016[0.0034, 0.0097]0.700032.0000
Σ α 2 0.00550.0016[0.0034, 0.0094]0.739017.2000
Σ h 1 0.00220.0010[0.0016, 0.0057]0.1240274.9900
Σ h 2 0.00520.0017[0.0019, 0.0092]0.000094.0100
Note: We set the lag order to 5. The three parameters’ covariance matrix are the diagonal matrix. The priori distribution of three parameters follows Nakajima [23] and are set as ( Σ β ) i 2 ~Γ(40,0.02), ( Σ α ) i 2 ~Γ(4,0.02), and ( Σ h ) i 2 ~Γ(4,0.02). The Geweke statistics represents that all the parameters in the model are valid.
Disclaimer/Publisher’s Note: The statements, opinions and data contained in all publications are solely those of the individual author(s) and contributor(s) and not of MDPI and/or the editor(s). MDPI and/or the editor(s) disclaim responsibility for any injury to people or property resulting from any ideas, methods, instructions or products referred to in the content.

