
How to Measure Stress in Smart and Intelligent Manufacturing Systems: A Systematic Review


Department of Management and Production Engineering, Politecnico di Torino, 10129 Torino, Italy
Systems 2023, 11(4), 167; https://doi.org/10.3390/systems11040167
Submission received: 23 February 2023
/
Revised: 17 March 2023
/
Accepted: 22 March 2023
/
Published: 23 March 2023
(This article belongs to the Special Issue Smart Manufacturing Systems for Industry 5.0)
Abstract
:The Fourth Industrial Revolution has introduced innovative technologies to manufacturing, resulting in digital production systems with consequences on workers’ roles and well-being. From the literature emerges the necessity to delve into the work-related stress phenomenon since it affects workers’ health status and performance and companies’ productivity. This review summarises the stress indicators and other influential factors in order to contribute to a stress assessment of human workers in smart and intelligent manufacturing systems. The PRISMA methodology is adopted to select studies consistent with the aim of the study. The analysis reviews objective measurements, such as physical, physiological, and subjective measurements, usually driven by a psychological perspective. In addition, experimental protocols and environmental and demographic variables that influence stress are illustrated. However, the investigation of stress indicators combined with other factors leads to more reliable and effective results. Finally, it is discovered that standards regarding stress indicators and research variables investigated by experimental studies are lacking. In addition, it is revealed that environmental and demographic variables, which may reveal significant suggestions for stress investigation, are rather neglected. This review provides a theorical summary of stress indicators for advanced manufacturing systems and highlights gaps to inspire future studies. Moreover, it provides practical guidelines to analyse other factors that may influence stress evaluation.
1. Introduction
The growing trend of Industry 4.0 supports manufacturing companies to digitalise assets [1] through the adoption of artificial intelligence (AI), Internet of Things (IoT), virtual and augmented reality, and big-data technologies [2,3].The Fourth Industrial Revolution had great benefits for the manufacturing sector, such as increasing productivity and making production processes more efficient and flexible [4] through the real-time analysis and communication of data generated in a smart and intelligent work environment [5]. However, it is necessary to emphasise how concerns about the health and safety of workers have also grown [5], since the new industrial paradigm has been leading to new sources of stress for workers due to displacement or total replacement by robots [6]. In addition, changes in the role of workers from “operator” to “supervisor” of the manufacturing process [7] have led them to collect and interpret large amounts of data, as well as to face working compellingly with robots, which has significantly increased fatigue and mental-stress levels [8,9].
Work-related stress usually occurs when the demand exceeds the worker’s capacity to perform [10]. Exposure to stress has been shown to be related to adverse effects in the way people feel, think, and behave [11], and generally, it is demonstrated to have psychological consequences on workers, such as a negative emotional state of anxiety and frustration [12]. At the physiological level, it can alter unconscious vital processes, such as heart and breathing activity, whereas from the physical point of view, it affects natural posture and body activity [12]. Industry 5.0, as a new human-centred perspective, focuses on the role of workers in the current revolution, examining the new industrial paradigm by putting human workers at the centre of production processes and ensuring that technology adapts to their requirements [13]. However, stress has further consequences on production activity due to the positive correlation with errors and periods of distraction at work, reducing the quality and performance of the worker [14] and leading to new costs and losses for companies. Given the several consequences of stress on human health and companies’ efficiency, the necessity of studies that focus on the stress phenomenon related to smart and intelligent manufacturing systems emerges from the literature, suggesting appropriate indicators for stress evaluation in order to support the advancement of research in this field.
The purpose of this review, in line with the European commission’s goal [15], is to contribute to modelling human behaviour and reactions to stressful conditions in smart and intelligent manufacturing systems in order to take care of workers’ occupational health and well-being and provide benefits for companies.
There is a growing body of literature that recognises the importance of human-centred manufacturing systems [7,16], integration of new advanced technologies in manufacturing systems [17,18], and the consequent human factors, especially workload, physical and mental fatigue [19], and ergonomics [20,21,22] and related indicators [23,24]. However, a search of the literature revealed few studies that focused on work-related stress, mostly delving into a specific stress-assessment method or tool and proposing a specific design. From the psychological perspective, studies review traditional standard questionnaires in order to adapt them to new manufacturing contexts. For example, Lesage et al. [25] focused on the properties of the Perceived Stress Scale, whereas Widyanti et al. [26] concentrated on the adaptation of the Rating Scale Mental Effort. On the physiological perspective, the literature includes significant studies, such as that of Leone et al. [27], who proposed a multi-sensor platform for monitoring stress in manufacturing contexts; that of Han et al. [28], who designed a wearable device for the detection of work-related stress; and that of Setz et al. [29], who described a wearable device for discriminating the phenomenon of stress from the cognitive load. On the other hand, Khamaisi et al. [30] proposed strategies for identifying potential causes of stress for workers, which may be induced by collaboration with robots, as explored by Arai et al. [8]. The main gaps in the literature are due to the limited investigation of the stress phenomenon with respect to the other human factors investigated and to the variety of stress-evaluation methods that lack homogeneity. In addition, the dynamics of innovative technologies in working contexts lead to changes in the production tasks that, in combination with other factors, such as environmental factors and workers’ demographic profile, affect the potential sources of stress. These need to be analysed and evaluated by comparing different potential stress-measurement methods in order to develop solutions that reduce stress sources and, at the same time, increase companies’ productivity and efficiency.
Therefore, the purpose of this article is to review literature to summarise the measurements and the related indicators that are adopted in the literature for assessing the impact that smart and intelligent manufacturing processes have on the stress levels of human workers. Moreover, the investigation of stress indicators is deepened through the analysis of experimental conditions and other factors, such as environmental and demographic factors, in order to answer the following research questions:
- What are the most appropriate stress measurements in smart and intelligent manufacturing systems?
- What are the other factors that may influence the stress evaluation?
From the literature, it is possible to distinguish objective stress measurements, including physical and physiological indicators, and subjective measurements, such as psychological ones. The discussion of the potential analysis of multiple indicators combined with the investigation of the gap in the literature due to the missing consideration of other potential factors influencing stress, such as intrinsic experimental-context variables and external environmental and demographic factors of workers, makes this review particularly significant. Finally, the future directions provide several fundamental insights about the selection of the most appropriate indicators and other factors for comprehensive stress analysis.
On the one hand, this study proposes a theorical guide to researchers that aim to deepen stress measurements and indicators and other significant factors that may be considered while analysing stress levels and causes. On the other hand, it provides an overview of the great variety of stress indicators for manufacturing contexts that may be enriched, including the new indicators that will be adopted in future studies. Finally, this review acts also as a practical guide for the selection of appropriate stress indicators and research variables for future studies inspired by the emerging gaps in the literature.
The paper is divided into 10 sections. The first two sections illustrate the main definition of work-related stress and manufacturing contexts. The third section aims to deal with all the abbreviations that will be adopted in the following paragraphs, and the fourth describes all stages of the methodology adopted for the literature search. The next sections show and describe the results of the literature analysis on stress measurements and other related factors. The results are discussed, highlighting the main findings and the gaps in the literature. Finally, the last sections include conclusions and limitations and suggest new directions for future works.
2. Work-Related Stress
The work-related stress phenomenon is a particularly investigated concept in literature. Among the variety of work-related stress definitions, the most frequently adopted is the cognitive model [31], which states that this phenomenon occurs when the work demands exceed the worker’s capacity to perform them. The work-related stress phenomenon is not limited in time but has long-term consequences on workers’ health status. The forms in which it manifests are at the physical and psychological levels [11], such as chronic disorders and depression [28], undermining the general health and well-being of the worker. Therefore, lower levels of stress may lead to minor consequences for the operator, such as accumulating worries, whereas higher levels may divert workers’ attention [10], causing production errors or accidents. A negative correlation between stress and workers’ performance has been demonstrated, since as stress increases the quality of the performance decreases [32] and the task time completion increases [33], leading to a significant impact on the efficiency of the working system [34]. Decrements in companies’ productivity have repercussions at the economic level in the form of costs associated with worker turnover and presenteeism, i.e., the presence of workers with disorders and sick absenteeism due to stress-related disorders [35]. Finally, the stress phenomenon requires further investigations in order to design solutions that, at the same time, improve the health status of workers and reduce the economic impact it has on companies.
3. Smart and Intelligent Manufacturing Systems
The growing trend of Industry 4.0 supports manufacturing companies in the application of information and communication technologies (ICTs) for real-time interconnection and real-time data communication between the smart and intelligent systems integrated in the real industrial context [36]. This industrial revolution has great benefits for the manufacturing sector. However, it is necessary to emphasise how concerns about the health and safety of workers have also grown [5]. Indeed, the new industrial paradigm is supporting the introduction of new emerging technologies that improve efficiency and minimize manual work [37].
In the past industrial revolutions, human workers had to possess more manual skills, specific to the assigned workstation, and the complexity of manufacturing tasks was particularly low. As new technologies have been introduced into production industries, such as numerical control machines, co-robots, and advanced modelling software, the complexity of the tasks has increased, and currently, data-analytics skills, simulation capability, and culture for teamwork and improvement are required of workers [38].
This is leading to new sources of stress due to changes in human roles, especially in manual production inspection and quality-monitoring tasks, or to displacement and total replacement by robots [6]. In fact, the past human-based inspection processes, which were more inclined to errors, are currently substituted with smart automation technology, which is error free and guarantees more reliable inspection [39,40]. Despite expectations of reduced stress on both a physical and mental level by means of intelligent automation and digitisation of the workstation [41], currently, even monitoring new systems and robots can stress workers due to their complex interfaces [42]. Further sources of stress emerge when a process goes from a normal state to a disturbed state. In this condition, the operator is stressed very quickly by the high number of alarms generated that intend to notify an anomalous state of the system; a simplified and user-friendly interface may help the worker to find the system problem and solve it [43]. In order to adapt the new technologies’ usability to the workers’ needs, the European Commission [15] aims to model human behaviour and reaction to stressful conditions in digital manufacturing systems to take care of workers’ occupational health and well-being, promoting human-centred manufacturing systems. In line with European goals, this review provides new insight into stress indicators and related influential factors to contribute to the progress of the research in solving this social problem.
4. Methodology
The approach taken in this study is based on PRISMA methodology. It provides guidelines for conducting an appropriate search for studies through four selection steps: identification, screening, eligibility, and inclusion [44,45].
During the identification phase, a query was launched on the Scopus database.
The query, as shown in Figure 1, consisted of two parts. The first part was related to the research object, i.e., mental and physical stress. Other keywords related to workload and fatigue were added in order to include studies focused on other human factors but they yielded results relevant to stress evaluation. The second part of the query, which was linked through an AND condition to the first part, concerned the research domain and consisted of smart, intelligent, and advanced manufacturing-system keywords combined with Industry 4.0 and 5.0 ones.
The resulting studies were then selected and reviewed following the PRISMA methodology guidelines, as shown in Figure 2, in order to consider only those coherent with the objective of this review. The identification-phase selection criteria, as shown in Table 1, were applied via the Scopus automation tools.
During the screening phase, the abstract of each study was analysed and the studies that aimed to assess human factors in manufacturing contexts were selected. Finally, through a full-text analysis, only the studies that proposed at least one measurement for the evaluation of worker stress were evaluated as eligible and then included in the review.
5. Abbreviation
In order to improve the readability of this review, Table 2 below lists the abbreviations adopted in the following paragraphs and their descriptions.
6. Results of Stress-Evaluation Methods
Looking at the set of studies resulting from the literature review, an interesting trend emerged regarding the publication rate. In recent years, there has been an increasing amount of literature on stress in smart and intelligent manufacturing systems, as shown in Figure 3. The first study on this topic was published in 2018, but subsequently, no publications were recorded in 2019. In 2020, there was a slight increment, but then the number of studies decreased to zero in 2021. Finally, significant growth was evident in 2022. The unsteady trend may be related to the complexity of the stress phenomenon with respect to the other human factors that are being investigated in the context of manufacturing, delaying the publication of meaningful results. Although only one study included in this review was published in 2023, given the high number of publications in 2022, it is possible to foresee a growing trend and thus a considerable increase in studies about the stress phenomenon in advanced manufacturing systems over the following months and years.
In addition, the geographical distribution of studies, on the basis of the affiliation of each first author, highlighted a concentration of publications in Europe, as shown in Table 3. Most of the studies (13 out of 22, more than half) had first authors with affiliations in Italian universities. Moreover, on the national Italian level, the University of Modena and Reggio Emilia recorded the highest number of publications (4 studies out of 20), followed by the University of Marche (3 studies out of 20). The other cited studies were uniformly distributed in other Italian universities.
The set of included studies proposes a great variety of measurements for the evaluation of levels of stress in smart and intelligent manufacturing systems. They can be mainly divided into two main types: objective and subjective, and into three main categories: physical, physiological, and psychological, as shown in Table 4.
The objective type of measurement consists of collecting data related to stress conditions that are not influenced by their personal and subjective perceptions. Objective data regards the physical and the physiological unconscious processes of workers. The physical category of measurements consists of postural and behavioural indicators that consider the motion activity of workers and their body language to evaluate stress; as shown in Figure 4, they were adopted by the minority of the studies. The physiological category includes all measurements that involve recording the physiological and cognitive internal processes of workers to identify patterns that are related to stressful conditions.
Finally, the subjective type of measurement aims to evaluate stress on the basis of workers’ perceptions. It consists of adopting questionnaires and tests or tools to investigate the emotional state or the perceived stress of workers from a psychological perspective. As represented in Figure 4, the physiological and psychological measurements were the most adopted techniques in the literature for evaluating stress in smart and intelligent manufacturing systems.
6.1. Physical Measurements
The physical category of measurements involved stress investigation from the postural and behavioural perspectives. Posture data allowed how workers are placed while performing work tasks and how they use the tools and resources at their disposal to be analysed. Behavioural measurements were carried out by evaluating the worker’s conduct and attitude while carrying out the activities.
As in Figure 5, among the cited studies, only three based stress analysis on postural indicators, with the other two articles based on behavioural indicators.
6.1.1. Posture
From the literature analysis, four different indicators for stress evaluation emerged, as shown in Table 5.
- Peruzzini et al. [47] and Caterino et al. [49] discussed the complexity of the task and its impact on the worker’s posture through the Ovako working-posture analysis system (OWAS). This assessment is based on analysis of the position assumed by the main sections of the body (such as the back, legs, and arms) and also the weights the worker has to deal with during the task. The result of this assessment is a score associated with a specific colour depending on the risk level of the task analysed. An acceptable risk score is associated with the colour green; in this case, the task can be improved by reducing the postural load. A medium-risk level is associated with the colour orange, and some tasks modifications and improvements may be required. A high-risk level is associated with the colour red, and corrective actions on the tasks need to be taken urgently.
- The second indicator is called Rapid Entire Body Assessment (REBA) and was adopted by Peruzzini et al. [47] and Grandi et al. [48]. This indicator considers the position of the upper and lower limbs, trunk and wrists of the workers, the stability of their position, and the force required to perform the tasks. The result is a numerical score that can range from 1 to 15. Scores between 1 and 3 are associated with very low postural risk, scores between 4 and 7 scores indicate medium risk, for scores from 8 to 10 the risk is high, and scores over 11 are very high risk—in this case, urgent actions are required to improve and correct the tasks.
- The third indicator is the Rapid Upper Limb Assessment (RULA). It evaluates the postural risk and musculoskeletal problems in the upper body, taking into account the position of the worker’s legs, arms, trunk, wrists, and neck. The final score can vary from 1 to 7 and is directly proportional to the level of postural risk.
- The vector-magnitude units (VMU) indicator is calculated as the vectorial sum of the activity physically performed by the worker in the three orthogonal directions and is very useful in the analysis of the worker’s physical activity [46].
6.1.2. Behavioural Measurements
Studies about behavioural observations cannot be overlooked, since 55% of the communication of internal emotional state occurs through body movements [66]. However, only one study adopted body-language indicators, and two studies of 20 referred to body motion for the stress investigation.
Regarding body language, Lagomarsino et al. [50] considered self-touching an indicator of stress and anxiety. The study involved the analysis of body language through a video recording of workers performing tasks and assessed the number of times the workers touched their bodies. The indicator was calculated by measuring the distance between each hand and a predefined key point on the worker’s head. Whenever the distance value measured was less than the predefined threshold, an occurrence of the self-touching event was recorded and contributed to the final evaluation of the stress level, through the formula in Table 6.
The same authors stated that the analysis of human body movement could be crucial for assessing stress levels during periods of particularly intense activity. For this reason, they developed a body-motion indicator, defined as Hyperactivity. The calculation is made on the basis of a video recording of the movements performed by the worker, where the movement of each joint is calculated as the sum of the 3D position displacements, in two consecutive instants of time. The final value of the indicator is calculated as the average of the movements recorded for the joints of the upper body.
Finally, Rao Pabolu et al. [51] defined the assembly-line speed as an indicator of stress levels, as it has been shown that as operating speed increases, worker stress consequently grows. In turn, the operating speed is proportional to the assembly-line speed, i.e., the speed of the assembly-line conveyor in centimetres per second.
6.2. Physiological Measurements
At the physiological level, cardiac and electrodermal activity are the processes of greatest interest and were most frequently analysed in the literature, followed by breathing activity, as represented in Figure 6. All the techniques adopted to collect physiological signals were non-invasive.
6.2.1. Cardiac Activity
It was recorded in nine studies, as shown in Figure 6. This physiological process is significant for stress evaluation since the heart activity reflects the reaction of the autonomic nervous system to external or internal physical or emotional stimuli, such as stressful situations. It is usually measured by the electrocardiography (ECG) technique, which records the electrical activity of the human heart’s cardiac activity through the application of electrodes in standard position configurations or by other wearable devices such as smartwatches. The main stress indicator calculated through cardiac-activity measurement is heart rate variability (HRV), which refers both to the measurement of heart beats per minute (bpm) and changes in the time interval between two consecutive ECG R-waves (also known as the RR series, where R is one of the periodical ECG signal peaks) [67]. In addition to HRV, the literature has shown that there are no standard formulas or parameters; as a consequence, there was a wide range of indicators adopted, as shown in Table 7.
Papetti et al. [53] evaluated workers’ stress levels by monitoring HRV. Peruzzini et al. [47] calculated heart rate (HR) and HRV. Moreover, Ciccarelli et al. [55] only adopted HR. Bettoni et al. [54] assessed mental stress by means of an RR interval series, i.e., the time intervals between two consecutive beats and HRV. The latter was calculated by measuring both HR and RR every 5 min and comparing the most recent values with those obtained during the previous intervals. Brunzini et al. [12] adopted inter-beat RR intervals for stress assessment. Specifically, they calculated RR variability by adopting the formula in Table 7. Gervasi et al. [56] employed the root mean square of successive differences (RMSSD) of adjacent inter-beat intervals as an indicator of stress, replacing HRV. On the other hand, Grandi et al. [48] investigated mental-stress conditions by defining a new heart-activity (HA) indicator, closely related to HR, through a specific formula represented in Table 7.
6.2.2. Electrodermal Activity (EDA)
It was the second most recorded physiological activity; in this review, four cited articles recorded it for stress assessment, as shown in Figure 6.
EDA allows for the definition of a further stress indicator: skin conductance (SC). It is directly proportional to sweat secretion, which is related to the sympathetic nervous system’s reaction to stressful situations. The EDA signal can be decomposed into the tonic and the phasic components. The tonic component, also defined as the skin-conductance level (SCL), refers to the long-term fluctuations of the EDA signal due to the psychophysiological characteristics of the subject. The phasic component of the signal, also called the skin-conductance response (SCR), corresponds to the short-term reaction of the skin conductance in response to a stimulus; therefore, it is considered a valuable indicator of stress levels [29].
Papetti et al. [53], Ciccarelli et al. [55], and Gervasi et al. [56], as shown in Table 8, only took the phasic component of the EDA signal into account since it is associated with the reaction to external events and is considered a valid indicator of the arousal and stress levels during workers’ activity.
An exception was represented by Khamaisi et al. [30], who designed an indicator given by the combination of parameters from cardiac and electrodermal activity. It is the result of the sum of the absolute values of the changes in the EDA and RR signals. The absolute values are employed to solve the problems of the different correlations of EDA and RR variations with respect to stress levels: as stress increases, the EDA value increases and RR decreases.
6.2.3. Breathing Activity
Respiration is particularly influenced by emotional state and stress events, and has been recognized as more sensitive than the other physiological measures [68]. In this review, only two studies referred to breathing indicators, as shown in Table 9. Peruzzini et al. [46,47] calculated the breathing rate, measuring breaths per minute (BPM) combined with the measurement of skin temperature (ST), carrying out a complete analysis of the operator’s health conditions in the working environment in order to assess stress and fatigue.
6.2.4. Brain Activity
It is usually recorded through electroencephalography (EEG). EEG is a technique adopted for recording electrical activity generated by the brain. The data are collected by applying electrodes to the scalp, usually according to a standard position. Each electrode measures the voltage produced by neuronal activity from the region of the brain in which it is placed. The recorded signal is then divided into five different bands based on frequency: delta (0.5 to 4 Hz), theta (4 to 8 Hz), alpha (8 to 12 Hz), beta (12 to 25 Hz), or gamma (25 to 45 Hz). Each band is associated with specific cognitive processes. In the literature, only Eyam et al. [57] referred to EEG for the assessment of stress levels on the basis of the emotional states of workers. As shown in Table 10, the stress evaluation was based on signal recording focusing on activations in the beta band, which in turn was divided into sub-bands based on frequency: low beta, beta, and high beta bands. An EEG signal that falls into the latter category, high beta, is a perfect indicator of stress conditions; however, it can also indicate the execution of cognitive processes related to complex analyses or new experiences.
6.3. Psychological Measurements
Subjective measurements involve workers’ self-assessment of stress levels, based on their perceptions from the psychological perspective. This is usually carried out through the administration of questionnaires at the end of the work activity. In this category, it is possible to distinguish direct and indirect measurements of stress. Perceived stress measurements are direct measurements that involve questionnaires and tests asking the workers about their perceptions and feelings about this phenomenon; they were adopted by seven studies, as shown in Figure 7. Emotional-state measurements, adopted by five studies, can also be defined as indirect since they indagate the emotional state of workers and then, from the collected answers, the stress perception is discovered.
6.3.1. Emotional State
Ciccarelli et al. [55], as shown in Table 11, adopted the State–Trait Anxiety Inventory (STAI) questionnaire, where subjects indicated on a four-point scale (ranging from “almost never” to “almost always”) the frequency with which they experienced the 40 emotions/feelings listed, combining both positive feelings (such as “I feel pleasant,” “I feel satisfied with myself”) and negative feelings (“I feel nervous and restless,” “I feel like a failure”). This questionnaire was administered before the biomedical devices were put on, then after monitoring, and again a few days after the experimental activity had taken place.
On the other hand, Petrovic et al. [58] used the Depression Anxiety Stress Scales (DASS) for the evaluation of negative emotional states. Participants had to indicate how frequently (on a four-point Likert scale) they had experienced each of the listed feelings. These feelings, 42 in total, referred to negative emotional states such as depression, anxiety, and tension/stress.
In addition, Gervasi et al. [56] adopted the Self-Assessment Manikin technique. At the end of the entire experimental task, their perceptions of the valence, arousal, and dominance of their emotions and affective state were assessed on a scale of 1 to 9. In this model, “valence” refers to the nature of the emotion, explicating whether it is positive or negative (relaxation and enjoyment or fear, anger); “arousal” is associated with the intensity of the emotion, and “dominance” refers to the perception of having that particular emotion under control.
Eyam et al. [57] exploited the valence–arousal test by asking the participants to evaluate their feelings about emotions such as sadness, stress, and anger in a range of four levels (low, low–medium, medium–high, and high).
Finally, for the assessment of perceived cognitive and emotional conditions, Brunzini et al. [12] adopted the Numerical Analogue Scale (NAS) method both before and after the experimental task. The test requires the worker to indicate the level of perceived stress on a scale from 0 to 10, represented by a straight line divided into 10 intervals; higher scores are associated with a higher intensity of the perceived stress. By administering the test prior to the performance of the activity, it is possible to record the basal level of perceived stress. Then, the test can be repeated first to assess the stress perceived during the performance of the activity, and successively at the end of the procedure, after a period of rest for the worker, to check whether the perceived stress has returned to the basal level.
6.3.2. Perceived Stress
At the end of each experimental trial, Mailliez et al. [64] proposed that the participants conduct a mental-stress assessment, as shown in Table 11, based on the 10-item Perceived Stress Scale (PSS-10). This is a short self-assessment scale where subjects are asked to express on a five-point scale (0 = never, 4 = very often) how often they experienced the 10 proposed feelings. The proposed feelings include both positive ones, e.g., “Felt confident about your ability to handle your personal problems,” “Felt that things were going your way,” “Were able to control irritation in your life,” and “Felt that you were on top of things,” and negative ones such as “Upset because of something that happened unexpectedly,” “Unable to control the important things in your life,” “Nervous and stressed,” “Could not cope with all the things that you had to do,” “Angered because of things that happened that were beyond your control,” and “Difficulties were piling up so high that you could not overcome them” [25].
In their framework, Arkouli et al. [59] and Vijayakumar et al. [62] suggested the Subjective Workload Assessment Technique (SWAT) to ask participants to express themselves with respect to time load, mental load, and psychological-stress load.
Morton et al. [60] asked workers to indicate their perceived level of stress and frustration on a seven-point Likert scale, where the workers could express their agreement with the statement “While solving these tasks, I felt frustrated/stressed” on a scale from “totally disagree” to “totally agree.” This test was administered only at the end of each experimental condition performed. Gualtieri et al. [61] and Panchetti et al. [65] asked participants to rate items on a five-point semantic differential scale (e.g., “Irritated/Calm,” “Concerned/Quiet,” “Motivated to finish task/Demotivated to finish task,” “Skilled/Unqualified,” “At ease/Discomfort”) extrapolated from the Short Stress State Questionnaire (SSSQ) after each experimental scenario.
Moreover, for the assessment of physical stress, Kopp et al. [63] proposed the Body Chart (or rather, Body Part Discomfort [69]), a questionnaire that investigates the level of stress, on a numerical scale, for each region of the body.
Finally, Peruzzini et al. [47] proposed the NASA Kopp et al. [63], Task Load Index (NASA-TLX) questionnaire to evaluate perceived comfort. Although this questionnaire is widely adopted for workload assessment, in this case, it was limited to assessing the levels of anxiety, physical stress, and comfortable conditions on a seven-point scale.
7. Results of Other Factors
For a comprehensive stress investigation in smart and intelligent manufacturing contexts, this review includes an analysis of the experimental protocols adopted in the literature, together with experimental environmental factors and demographic data of participants, since they may influence the evaluation of human factors.
7.1. Experimental Protocols
The main aspects related to experimental protocols include the experimental tasks and environment, as shown in Table 12.
Concerning the experimental tasks, as shown in Figure 8a, the majority of the studies proposed traditional assembly activities, and almost half of them, as shown in Figure 8b, proposed to execute the task in collaboration with a robot. Moreover, only Petrovic et al. [58] included a push-vs.-pull task, whereas the other studies adopted a variety of tasks, such as real steps in an oil-replacement sequence [30] or a combination of motor and cognitive tasks.
In addition, the environments where the experiments were conducted were mainly distinguished as being in laboratories or real manufacturing systems for in-field measurements. With respect to the studies cited in this review, the majority of the experiments were conducted in laboratories, even implementing virtual-reality simulations in an attempt to faithfully reproduce the real manufacturing environments. On the other hand, only a minority of the studies, as shown in Figure 9, had the opportunity to carry out measurements on site, e.g., at automotive industrial plants [49,63].
7.2. Environmental Factors
The importance of environmental factors, including temperature and noise [70], air quality, and lighting conditions [71], is due to the fact that these can represent risk factors for the health of workers. As shown in Table 13 some studies specified the environmental-factor measures related to the context where the experimental activities were executed.
Only a few studies referred to the environmental factors and detailed the relative measures. As far as temperature is concerned, Lagomarsino et al. [50] and Brunzini et al. [12] specified that this was a constant value during the duration of the study, whereas Khamaisi et al. [30] pointed out that this value was considered variable and particularly affected by the outside temperature. Finally, Papetti et al. [53] illustrated methods for measuring and evaluating temperature and each of the other variables and provided a guideline with acceptable value limits.
The noise factor was quantitatively measured only by Khamaisi et al. [30], who reported the exact value in decibels (dB), whereas the other studies, especially those conducted in a laboratory, stated that absolute silence or traditional industrial sounds were reproduced in order to simulate real production contexts.
The lighting condition is among the environmental variables that may affect the perceptions of the workers. In particular, Papetti et al. [53] was the only one who also explored a method for its quantification by means of a colorimeter, whereas the other studies reported just the light source, distinguishing natural from artificial light.
7.3. Demographic Factors
In the demographic-factor analysis, the gender and age variables were considered together with the aspect related to background, expertise, and experience levels, as shown in Table 14 Among these, increasing age caused a regression of human capabilities with consequences for working performance, and a direct relationship between human–system errors and the age of workers was observed [72]. Only a few studies detailed results from demographic analysis, such as that of Cavallo et al. [52], who found a negative relation between cardiac-stress indicators and age, whereas Grandi et al. [48] noted that the performance of experts and non-experts was comparable.
After analysing these factors among the contributions, it emerged that only a few studies mentioned detailed information about these factors. Moreover, even fewer studies cross-analysed them with stress-indicator results.
As far as gender is concerned, the majority of studies recruited both females and males as participants; however, Petrovic et al. [58] and Papetti et al. [53] only recruited males.
The age range of the participants was quite wide, from 19-year-old participants recruited by Morton et al. [60] to 57-year-old participants in Gualtieri et al.’s [61] experiment.
Finally, some studies also specified other factors such as the background, expertise, and experience of the participants. In particular, Petrovic et al. [58], Lagomarsino et al. [50], and Grandi et al. [48] paid attention to how experienced the participants were in performing real or similar industrial tasks, whereas Gervasi et al. [56] and Gualtieri et al. [61] also investigated experience in collaborating with robots.
8. Discussion
The analysis of the results of this review demonstrates that there is a great variety of measurement categories and indicators for stress assessment in smart and intelligent manufacturing systems.
8.1. Objective Measurements
Concerning the physical measurements, the adoption of a specific postural indicator depends on the areas of the body of most interest for the evaluation. The REBA indicator, compared to OWAS, provides a more detailed assessment by considering not only the main parts of the body but also the trunk and wrists. In addition, it considers both the weight of the task and the force required. REBA is preferable for the analysis of postural stress, especially in the case of tasks to be performed standing up. On the other hand, RULA is preferable to provide a detailed analysis of the postural risk on the upper body [47].
The combination of several different indicators from postural measurements can improve the assessment of the quality of stress at the postural level for workers. On the one hand, the variety of postural indicators is advantageous since there are appropriate indicators for almost each area of the worker’s body on which the stress analysis is focused and, as a consequence, the results obtained are particularly specific and extremely detailed. Moreover, the postural analysis can provide significant suggestions and new requirements for the design and development of more ergonomic workstations. On the other hand, there are no standard postural indicators for different experimental conditions and the comparison of the postural assessment outcomes obtained in the literature is particularly complicated. Behavioural measurements include body motion and language indicators that, unfortunately, have not been adopted enough in the literature to execute a reliable comparison and to discuss their advantages and disadvantages. However, the analysis of body language is the best solution for automatic stress detection based on the analysis of video recordings of participants’ activity and data extrapolated from skeleton tracking [50].
Regarding the objective analyses, physiological measurements were widely adopted in the literature and cardiac and electrodermal activities were the most collected physiological signals. Among the several indicators related to cardiac activity, some were calculated in the time domain, such as the variability of RR interval duration [30] or the RMSSD [56], whereas the others, such as HR and HRV, were in the frequency domain. Moreover, although VO2 depends on the age and gender of the subject being assessed, it can still be considered an excellent indicator for stress assessment [52].
EDA is considered the ideal stress measurement, since it evaluates the conductance of the skin that is innervated only by the sympathetic nervous system. As a consequence, SC is the result of the pure physiological reaction of workers to stress situations [29]. An EDA recording device is more suitable for and less invasive to adoption during work activity than other biomedical devices; however, it entails some ethical complications. Furthermore, a lower variability is noted regarding the parameters based on EDA, since the contributions included in this review isolated and analysed only the phasic component of the signal. With regard to respiratory activity, the breathing rate seemed to be the only indicator adopted for evaluation. Finally, the EEG technique is a particularly accurate and reliable method for carrying out analyses of human emotions. However, this method may reduce the comfort of the worker during measurement and thus may be the least suitable in the case of experimental studies to be carried out in real manufacturing contexts [57].
The results of this review show that physiological measurements have both advantages and disadvantages. On the one hand, they allow for a better understanding of the reactions of the participants in the studies and provide a trace of the processes that occur unconsciously and allow for in-depth knowledge of the stress levels of the workers [56]. Moreover, the combination of more physiological signals can lead researchers to investigate how the same stressful phenomenon affects the physiological and unconscious processes from different physiological perspectives and carry out crossed analysis with cognitive-load indicators in order to test the relation between stress and other human factors [27]. On the other hand, physiological signals are not to be regarded as absolutely reliable. Indeed, the physiological data recorded are influenced by unconscious processes such as the valence of the emotion experienced, variations in emotion intensity, and mental-workload states, which influence the signals and thus the recognition of stress phenomena and assessment of stress levels through it [12]. Eventually, it is necessary to point out the complexity of integrating the use of biomedical devices into the industrial work environment [47]. The devices adopted for techniques such as ECG and EEG that require the use of particularly delicate electrodes and sensors may divert the workers’ attention from the task due to their sense of responsibility in not damaging them while executing the manufacturing tasks. Therefore, the type of devices adopted for the measurements can influence not only the quality of physiological data but also the stress perception of workers. For this reason, the choice of biodevices to collect data is also significant for the experimental activities. On the one hand, wearable technologies for data collection [22] are the most comfortable for participants. On the other hand, complex devices and systems, such as edge sensors that are combined with the AI cloud, allow for faster recognition of workers’ emotional, affective, and physiological states [73]. This factor should not be underestimated, since it can overload the worker, becoming a new source of stress and affecting the measurements and the results obtained from the indicators.
8.2. Subjective Measurement
At the psychological level, the object of the measurement is the emotional state of workers or, more directly, their perceived stress, but in both cases there are no standard indicators for the self-assessment. The emotional state related to the execution of a task is deepened by asking the workers their perceptions about the nature of their emotions and feelings, focusing on negative emotions such as anxiety, depression, tension, or frustration. Sometimes, the focus of the self-assessment is not on the positivity or negativity of the emotions but on their intensity and the perception that workers have about the capability to dominate and control them.
However, the perceived stress indicators are also affected by weakness due to a missing definitive definition of the stress phenomenon from the psychological perspective. Indeed, some indicators refer specifically to physical stress, others to mental stress, and others in general to perceived stress, without specification.
Moreover, the methods adopted for both emotional-state and perceived-stress evaluation are mostly questionnaires and rating scales. The great variety of questionnaires and self-assessment tests revealed that in this case there are also no standards; however, it is possible to point out some strengths and weaknesses of these methods.
For example, NAS is a simple technique to adopt for a quick assessment of perceived stress in industrial contexts. Moreover, by administering the questionnaire before, during, and after the execution of a task, it is possible to compare perceived stress levels under highly stressful conditions and under resting conditions [12]. The STAI questionnaire can be posed while performing the experimental task, during resting intervals, and on subsequent days to assess perceived-stress levels to verify that the tendency to provide the same responses is very limited a few days after the effort [55]. However, the Perceived Stress Scale is particularly sensitive to respondents’ perceptions [64]. In general, on a statistical level, it is difficult to obtain particularly reliable results if the sample of respondents is small. As a consequence, questionnaires and tests require the involvement of larger samples of participants to resolve this type of complication [61].
Overall, there seems to be some evidence to indicate that the combination of measurements of different types, such as physiological measurements and self-assessment techniques, is the most suitable method to measure workers’ stress, as evidenced in almost all the contributions included in this review. The cross-analysis of data collected through different methods allows for a complete and more reliable interpretation of stress indicators. Indeed, physiological signals are complex to interpret individually since they are influenced by other psychological and physical processes [53], and emotions and perceptions on a psychological level may also have a particular influence on vital parameters at the physiological level [74]. Therefore, the comparison of data collected through different methods enables the truthfulness of results to be tested. Moreover, objective measurements combined with subjective assessments, repeated before, during, and after the performance of the activity, provide the most consistent outcomes since the workers’ perceptions before the tasks, under resting conditions, support researchers while calibrating biomedical devices and reducing the possibility of interpretation and measurement errors.
Currently, there are no standards for both objective and subjective indicators. Objective indicators, especially the physiological ones, lack homogeneity not only in the mathematical formulas but also in their nomenclature. Each physiological signal is associated with a great variety of algorithms to calculate stress levels or the same indicators to which different labels and acronyms are attached, complicating the comparison of results among different studies. Moreover, the variety of devices for biometric-data collection represents a gap. Although the type of sensors adopted depends above all on the context in which the experimental activities are carried out, small wearable devices are the most appropriate for measuring the physiological and physical activities of workers in in-field experimental activities but do not allow the integral signal to be captured or the original and continuous vital processes of the workers to be carried out since they provide a direct measure of the indicators, limiting the potential detailed analysis of data. On the other hand, the most sensitive sensors and devices are difficult to integrate into real manufacturing systems, comporting a high percentage of artefacts and level of noise in the data collected, and their setup may cause discomfort to the participants and workers. Consequently, the literature lacks a compromise that justifies and standardises the large adoption of either type of device.
8.3. Other Factors
The analysis of the experimental protocols showed no correlation between the type of stress measurements and the experimental tasks and environment in which the activities were carried out.
Although the assembly processes were widely proposed, new investigations are required to compare the stress levels in relation to the execution of other typical production tasks, such as push and pull, quality monitoring, etc. Moreover, the tasks may be adapted through the interaction with smart and intelligent devices from manufacturing systems in order to provide reliable results and suggestions for workers’ stress and well-being in advanced, automated work contexts. New experimental tasks should not involve manual work phases for the worker but may adapt to the new role of supervisor of production processes.
Regarding the experimental contexts, laboratory experiments fail to consider some potential factors typical of real manufacturing systems, such as temperature, noise, and the worker’s sense of responsibility for the success of the production process or for unexpected breakdowns, which may influence stress. As a benefit, laboratory and virtual-/augmented-reality simulations allow the most sensitive measurements to be adopted that would not be suitable for measurement in a working environment, as their high sensitivity would lead to the recording and collection of data particularly affected by artefacts and not accurate for reliable analyses. On the other hand, measurements in real manufacturing contexts are extremely constrained by the production process of the company. Some variables related to the production process that may influence workers’ stress levels, such as production-line speed or time constraints, cannot be analysed since their variation can significantly influence the real production flow, damaging the efficiency and productivity of the companies. Hence, the measurements in real contexts may be less exact and detailed than in the laboratory.
The evidence presented in this section suggests that while designing experimental protocols, researchers may consider the adoption of tools and methods for stress measurements that do not limit the movements and normal execution of the tasks of the workers or participants both in the laboratory and in in-field experimental activities.
The main gap in the literature is represented by the conducting of stress measurements under different experimental conditions. Moreover, the absence of homogeneity and guidelines for selecting the proper type of stress measurements on the basis of experimental tasks and contexts leads to the adoption of a great variability of methods and new experimental approaches.
In addition, environmental factors are significant for stress evaluation. Indeed, it has been observed that both too-high and too-low temperatures are causes of a phenomenon for workers known as thermal discomfort, which represents a new potential source of stress [75]. Thermal discomfort, in combination with typical noise levels of real industrial environments, alters not only the physiological processes of workers but also their subjective perceptions of stress [76,77]. Moreover, the combination of noise and inadequate lighting conditions also causes errors in the perception of information while executing tasks [78]. The evaluation of these factors may help in the prevention of health problems for workers and physical damage to workers; on the other hand, this may also have positive consequences on the productivity of the company [79].
Finally, worker-specific factors such as gender, age, expertise, experience, or background may be considered for a more comprehensive analysis. Cases in which demographic factors were correlated with the specific stress indicators are limited. This shows that there is therefore a gap in the literature that needs to be filled.
Collectively, these contributions outline that the environmental conditions and the demographic data of the participants in the experiment may be useful first to investigate how these influence stress levels of the participants and workers and then to cross-analyse different experimental-condition results in order to generalise the relationship between these factors and stress indicators. The other factor analysis also demonstrated the presence of profound gaps in the literature, on the one hand, due to the fact that only a very small percentage of studies considered these variables in stress investigations, and on the other hand, because there are currently no standards for environmental and demographic factors. As far as the former is concerned, apart from temperature, the other factors are often reported with different units of measurement that are not compatible with those of the other studies or are simply measured with incompatible methods, which complicates the comparison with the results of the other studies. In addition, even the demographic data requested of the participants are not homogeneous, especially with regard to the data on background, expertise, or experience.
9. Conclusions
This review aimed to investigate stress indicators adopted in smart and intelligent manufacturing contexts and to explore the potential other factors that may affect the evaluations. The results revealed three main categories of measurements: physical, physiological, and cognitive. The first includes postural and behavioural indicators based on the worker’s body movements and language. The physiological category consists of indicators of cardiac, electrodermal, breathing, and brain activity. Then, psychological measurements track the workers’ perceptions and emotional states through questionnaires and tests. The main finding from the literature highlights that the most appropriate measurements for stress evaluation in smart and intelligent manufacturing systems are obtained from a combination of indicators of different categories, since it enables more reliable analysis and consistent results, reducing the probability of misinterpretation. In addition, stress indicators, especially physiological ones, can be selected in accordance with the experimental protocols since specific biomedical devices, such as wearables, are more likely to be adopted in laboratory experiments but lead to a limited analysis of the physiological and physical data. On the other hand, it may be complicated to integrate the most sensitive devices into the manufacturing contexts for in-field experiments. Moreover, other factors, such as environmental and demographic ones, may affect stress evaluations since critical temperatures, noise levels, lighting conditions, and worker characteristics such as age may increase the probability of errors while executing tasks and levels of stress.
Finally, this review contributes to the research by proposing a theorical summary of the specific methods adopted in the literature to measure stress in advanced manufacturing systems and related indicators. On the other hand, this study provides practical guidelines to select the most appropriate measurement methods in relation to other factors that may influence the results of future studies. Moreover, pointing out the gaps in the literature, this article aims to highlight the directions that still need to be deepened and focused on, providing inspiration for future studies.
From the analysis of the literature, no standards with respect to stress measurements and indicators emerged.
Conducting stress measurements under different experimental conditions represents the main gap in the literature nowadays. This is due to the lack of standards in stress measurements since for the same physiological indicators different formulas are adopted and an official nomenclature is still missing in the indicator acronym. Moreover, the gap is also in the non-conformity in the selection of ad hoc stress measurements for specific experimental tasks and contexts. In addition, the environmental and demographical factors are rarely specified in contributions and neglected or measured with no standard methods, compromising the comparison of experimental conditions and results from different studies.
Finally, the major limitation of this review lies in the number of studies included on the stress-measurement methods in advanced manufacturing systems. Since this study was focused on smart and intelligent manufacturing systems, a limited number of specific keywords related to this context were included in the research query adopted. Additional keywords can be added in order to broaden the research field and explore whether the stress methods cited in this review are also adopted for the investigation of other human factors in advanced manufacturing contexts. Moreover, it is expected that with the repetition of this research with an identical query in the coming months, the number of resulting contributions will grow exponentially, given the interest of researchers and academia on this topic and the urgency of solving this significant social issue. In the end, as advanced manufacturing systems are continuously improving and updated, there are no standard terms for their identification. The number of potential alternative keywords for manufacturing systems will probably also increase over time, as more and more distinct and varied ways of defining these contexts are emerging, and thus will be added to the original research query adopted in order to find a higher number of the final resulting contributions.
10. Future Directions
Future studies on the current topic are therefore recommended. In future investigations, it might be possible to deepen the phenomenon of stress in smart and intelligent manufacturing systems by implementing more detailed measurements, taking into account additional aspects that may influence the emotional state of the worker. Among the demographic variables, gender and background/expertise/experience could significantly contribute to a comprehensive stress investigation. Furthermore, workers’ disabilities may be considered as an additional factor in the analysis in order to improve the inclusiveness of the research and the manufacturing industry.
Additional research should be undertaken to investigate other measurement techniques for stress assessment, e.g., facial and speech recognition, as well as investigations of workers’ body language and how it changes in particularly stressful situations.
Finally, to develop a full picture of the stress phenomenon in smart and intelligent manufacturing systems, additional studies will be needed about other parameters concerning the working environment, such as the layout of the production system and time constraints, which may prove to be particularly influential on the worker’s state of stress.
Funding
The APC was funded by EIT Manufacturing.
Data Availability Statement
The contributions that support the findings of this study are available on Scopus.
Conflicts of Interest
The author declares no conflict of interest.
References
- Oztemel, E.; Gursev, S. Literature review of Industry 4.0 and related technologies. J. Intell. Manuf. 2020, 31, 127–182. [Google Scholar] [CrossRef]
- Wang, B.; Tao, F.; Fang, X.; Liu, C.; Liu, Y.; Freiheit, T. Smart Manufacturing and Intelligent Manufacturing: A Comparative Review. Engineering 2021, 7, 738–757. [Google Scholar] [CrossRef]
- Bongomin, O.; Yemane, A.; Kembabazi, B.; Malanda, C.; Mwape, M.C.; Mpofu, N.S.; Tigalana, D. Industry 4.0 Disruption and Its Neologisms in Major Industrial Sectors: A State of the Art. J. Eng. 2020, 2020, 8090521. [Google Scholar] [CrossRef]
- Breque, M.; De Nul, L.; Petridis, A. Industry 5.0: Towards a Sustainable, Human-Centric and Resilient European Industry; Publications Office of European Union: Luxembourg, 2021. [Google Scholar]
- Badri, A.; Boudreau-Trudel, B.; Souissi, A.S. Occupational health and safety in the industry 4.0 era: A cause for major concern? Saf. Sci. 2018, 109, 403–411. [Google Scholar] [CrossRef]
- Leso, V.; Fontana, L.; Iavicoli, I. The occupational health and safety dimension of Industry 4.0. Med. Lav. 2018, 110, 327–338. [Google Scholar] [PubMed]
- Wang, B.; Xue, Y.; Yan, J.; Yang, X.; Zhou, Y. Human-Centered Intelligent Manufacturing: Overview and Perspectives. Chin. J. Eng. Sci. 2020, 22, 139. [Google Scholar] [CrossRef]
- Arai, T.; Kato, R.; Fujita, M. Assessment of operator stress induced by robot collaboration in assembly. CIRP Ann. Manuf. Technol. 2010, 59, 5–8. [Google Scholar] [CrossRef]
- Zorzenon, R.; Lizarelli, F.L.; Daniel, D.B.A. What is the potential impact of industry 4.0 on health and safety at work? Saf. Sci. 2022, 153, 105802. [Google Scholar] [CrossRef]
- Wegner, D.M. Stress and mental control. In Handbook of Life Stress, Cognition and Health; Fisher, S., Reason, J., Eds.; John Wiley & Sons Ltd.: Hoboken, NJ, USA, 1988; pp. 683–697. [Google Scholar]
- Cox, T.; Griffiths, A. Work-related stress: Nature and assessment. In IEE Colloquium on Stress and Mistake-Making in the Operational Workplace; IET: London, UK, 1995. [Google Scholar]
- Brunzini, A.; Peruzzini, M.; Grandi, F.; Khamaisi, R.K.; Pellicciari, M. A preliminary experimental study on the workers’ workload assessment to design industrial products and processes. Appl. Sci. 2021, 11, 12066. [Google Scholar] [CrossRef]
- Yeow, J.A.; Ng, P.K.; Tan, K.S.; Chin, T.S.; Lim, W.Y. Effects of stress, repetition, fatigue and work environment on human error in manufacturing industries. J. Appl. Sci. 2014, 14, 3464–3471. [Google Scholar] [CrossRef] [Green Version]
- Zizic, M.C.; Mladineo, M.; Gjeldum, N.; Celent, L. From Industry 4.0 towards Industry 5.0: A Review and Analysis of Paradigm Shift for the People, Organization and Technology. Energies 2022, 15, 5221. [Google Scholar] [CrossRef]
- European Commission, Directorate-General for Research and Innovation. Factories of the Future: Multi-Annual Roadmap for the Contractual PPP under Horizon 2020. 2013. Available online: https://data.europa.eu/doi/10.2777/29815 (accessed on 3 February 2023).
- Nguyen Ngoc, H.; Lasa, G.; Iriarte, I. Human-centred design in industry 4.0: Case study review and opportunities for future research. J. Intell. Manuf. 2022, 33, 35–76. [Google Scholar] [CrossRef] [PubMed]
- Ho, P.T.; Albajez, J.A.; Santolaria, J.; Yagüe-Fabra, J.A. Study of Augmented Reality Based Manufacturing for Further Integration of Quality Control 4.0: A Systematic Literature Review. Appl. Sci. 2022, 12, 1961. [Google Scholar] [CrossRef]
- Cárdenas-Robledo, L.A.; Hernández-Uribe, Ó.; Reta, C.; Cantoral-Ceballos, J.A. Extended reality applications in industry 4.0.-A systematic literature review. Telemat. Inform. 2022, 73, 101863. [Google Scholar] [CrossRef]
- Villani, V.; Gabbi, M.; Sabattini, L. Promoting operator’s wellbeing in Industry 5.0: Detecting mental and physical fatigue. In Proceedings of the 2022 IEEE International Conference on Systems, Man, and Cybernetics (SMC), Prague, Czech Republic, 9–12 October 2022; pp. 2030–2036. [Google Scholar]
- Sgarbossa, F.; Grosse, E.H.; Neumann, W.P.; Battini, D.; Glock, C.H. Human factors in production and logistics systems of the future. Annu. Rev. Control. 2020, 49, 295–305. [Google Scholar] [CrossRef]
- Reiman, A.; Kaivo-oja, J.; Parviainen, E.; Takala, E.P.; Lauraeus, T. Human factors and ergonomics in manufacturing in the industry 4.0 context—A scoping review. Technol. Soc. 2021, 65, 101572. [Google Scholar] [CrossRef]
- Stefana, E.; Marciano, F.; Rossi, D.; Cocca, P.; Tomasoni, G. Wearable Devices for Ergonomics: A Systematic Literature Review. Sensors 2021, 21, 777. [Google Scholar] [CrossRef]
- Argyle, E.M.; Marinescu, A.; Wilson, M.L.; Lawson, G.; Sharples, S. Physiological indicators of task demand, fatigue, and cognition in future digital manufacturing environments. Int. J. Hum. Comput. Stud. 2021, 145, 102522. [Google Scholar] [CrossRef]
- Digiesi, S.; Manghisi, V.M.; Facchini, F.; Klose, E.M.; Foglia, M.M.; Mummolo, C. Heart rate variability based assessment of cognitive workload in smart operators. Manag. Prod. Eng. Rev. 2020, 11, 56–64. [Google Scholar]
- Lesage, F.X.; Berjot, S.; Deschamps, F. Psychometric properties of the French versions of the perceived stress scale. Int. J. Occup. Med. Environ. Health 2012, 25, 178–184. [Google Scholar] [CrossRef]
- Widyanti, A.; Johnson, A.; de Waard, D. Adaptation of the rating scale mental effort (RSME) for use in Indonesia. Int. J. Ind. Ergon. 2013, 43, 70–76. [Google Scholar] [CrossRef]
- Leone, A.; Rescio, G.; Siciliano, P.; Papetti, A.; Brunzini, A.; Germani, M. Multi sensors platform for stress monitoring of workers in smart manufacturing context. In Proceedings of the 2020 IEEE International Instrumentation and Measurement Technology Conference (I2MTC), Dubrovnik, Croatia, 25–28 May 2020; pp. 1–5. [Google Scholar]
- Han, L.; Zhang, Q.; Chen, X.; Zhan, Q.; Yang, T.; Zhao, Z. Detecting work-related stress with a wearable device. Comput. Ind. 2017, 90, 42–49. [Google Scholar] [CrossRef]
- Setz, C.; Arnrich, B.; Schumm, J.; La Marca, R.; Tröster, G.; Ehlert, U. Discriminating stress from cognitive load using a wearable EDA device. IEEE Trans. Inf. Technol. Biomed. 2009, 14, 410–417. [Google Scholar] [CrossRef] [PubMed]
- Khamaisi, R.K.; Brunzini, A.; Grandi, F.; Peruzzini, M.; Pellicciari, M. UX assessment strategy to identify potential stressful conditions for workers. Robot. Comput. -Integr. Manuf. 2022, 78, 102403. [Google Scholar] [CrossRef]
- Stephen, P.; Cary, C.; Kate, T. A Model of Work Stress to underpin the Health and Safety Executive advice for tackling work-related stress and stress risk assessments. In Counseling at Work, Winter; Center for Stress Management: London, UK, 2004. [Google Scholar]
- Yahaya, A.; Yahaya, N.; Bon, A.T.; Ismail, S.; Ing, T.C. Stress level and its influencing factors among employees in a plastic manufacturing and the implication towards work performance. Elixir Psychol. 2011, 41, 5932–5941. [Google Scholar]
- Lin, D.Y.; Hwang, S.L. The development of mental workload measurement in flexible manufacturing systems. Hum. Factors Ergon. Manuf. Serv. Ind. 1998, 8, 41–62. [Google Scholar] [CrossRef]
- Soltanpour Gharibdousti, M.; Azadeh, A. Performance Evaluation of Organizations Based on Human Factor Engineering Using Fuzzy Data Envelopment Analysis (FDEA). J. Soft Comput. Civ. Eng. 2019, 3, 63–90. [Google Scholar]
- Hassard, J.; Teoh, K.R.; Visockaite, G.; Dewe, P.; Cox, T. The cost of work-related stress to society: A systematic review. J. Occup. Health Psychol. 2018, 23, 1–17. [Google Scholar] [CrossRef] [Green Version]
- Zhou, L.; Jiang, Z.; Geng, N.; Niu, Y.; Cui, F.; Liu, K.; Qi, N. Production and operations management for intelligent manufacturing: A systematic literature review. Int. J. Prod. Res. 2022, 60, 808–846. [Google Scholar] [CrossRef]
- Shojaeinasab, A.; Charter, T.; Jalayer, M.; Khadivi, M.; Ogunfowora, O.; Raiyani, N.; Najjaran, H. Intelligent manufacturing execution systems: A systematic review. J. Manuf. Syst. 2022, 62, 503–522. [Google Scholar] [CrossRef]
- Wang, B.; Zheng, P.; Yin, Y.; Shih, A.; Wang, L. Toward human-centric smart manufacturing: A human-cyber-physical systems (HCPS) perspective. J. Manuf. Syst. 2022, 63, 471–490. [Google Scholar] [CrossRef]
- Sarkar, B.; Dey, B.K.; Sarkar, M.; Kim, S.J. A smart production system with an autonomation technology and dual channel retailing. Comput. Ind. Eng. 2022, 173, 108607. [Google Scholar] [CrossRef]
- Dey, B.K.; Seok, H. Intelligent inventory management with autonomation and service strategy. J. Intell. Manuf. 2022, 1–24. [Google Scholar] [CrossRef] [PubMed]
- Mayrhofer, W.; Rupprecht, P.; Schlund, S. One-fits-all vs. tailor-made: User-centered workstations for field assembly with an application in aircraft parts manufacturing. Procedia Manuf. 2019, 39, 149–157. [Google Scholar] [CrossRef]
- Sibona, F.; Cheng, P.D.C.; Indri, M.; Di Prima, D. PoinTap system: A human-robot interface to enable remotely controlled tasks. In Proceedings of the 2021 26th IEEE International Conference on Emerging Technologies and Factory Automation (ETFA), Vasteras, Sweden, 7–10 September 2021; pp. 1–8. [Google Scholar]
- Yen, G.G.; Acay, D. Adaptive user interfaces in complex supervisory tasks. ISA Trans. 2009, 48, 196–205. [Google Scholar] [CrossRef] [PubMed] [Green Version]
- Moher, D.; Liberati, A.; Tetzlaff, J.; Altman, D.G. Preferred reporting items for systematic reviews and meta-analyses: The PRISMA statement. PLoS Med. 2009, 6, e1000097. [Google Scholar] [CrossRef] [PubMed] [Green Version]
- Torres-Carrion, P.V.; Gonzalez-Gonzalez, C.S.; Aciar, S.; Rodriguez-Morales, G. Methodology for systematic literature review applied to engineering and education. In Proceedings of the 2018 IEEE Global Engineering Education Conference, EDUCON, Santa Cruz de Tenerife, Spain, 17–20 April 2018. [Google Scholar]
- Peruzzini, M.; Grandi, F.; Pellicciari, M. How to analyse the workers’ experience in integrated product-process design. J. Ind. Inf. Integr. 2018, 12, 31–46. [Google Scholar] [CrossRef]
- Peruzzini, M.; Grandi, F.; Pellicciari, M. Exploring the potential of Operator 4.0 interface and monitoring. Comput. Ind. Eng. 2020, 139, 105600. [Google Scholar] [CrossRef]
- Grandi, F.; Peruzzini, M.; Cavallaro, S.; Prati, E.; Pellicciari, M. Creation of a UX index to design human tasks and workstations. Int. J. Comput. Integr. Manuf. 2022, 35, 4–20. [Google Scholar] [CrossRef]
- Caterino, M.; Rinaldi, M.; Fera, M. Digital ergonomics: An evaluation framework for the ergonomic risk assessment of heterogeneous workers. Int. J. Comput. Integr. Manuf. 2023, 36, 239–259. [Google Scholar] [CrossRef]
- Lagomarsino, M.; Lorenzini, M.; De Momi, E.; Ajoudani, A. An Online Framework for Cognitive Load Assessment in Industrial Tasks. Robot. Comput. Integr. Manuf. 2022, 78, 102380. [Google Scholar] [CrossRef]
- Rao Pabolu, V.K.; Shrivastava, D.; Kulkarni, M.S. A Dynamic System to Predict an Assembly Line Worker’s Comfortable Work-Duration Time by Using the Machine Learning Technique. Procedia CIRP 2022, 106, 270–275. [Google Scholar] [CrossRef]
- Cavallo, D.; Facchini, F.; Mossa, G. Information-based processing time affected by human age: An objective parameters-based model. IFAC-PapersOnLine 2021, 54, 7–12. [Google Scholar] [CrossRef]
- Papetti, A.; Rossi, M.; Menghi, R.; Germani, M. Human-centered design for improving the workplace in the footwear sector. Procedia CIRP 2020, 91, 295–300. [Google Scholar] [CrossRef]
- Bettoni, A.; Montini, E.; Righi, M.; Villani, V.; Tsvetanov, R.; Borgia, S.; Secchi, C.; Carpanzano, E. Mutualistic and adaptive human-machine collaboration based on machine learning in an injection moulding manufacturing line. Procedia CIRP 2020, 93, 395–400. [Google Scholar] [CrossRef]
- Ciccarelli, M.; Papetti, A.; Germani, M.; Leone, A.; Rescio, G. Human work sustainability tool. J. Manuf. Syst. 2022, 62, 76–86. [Google Scholar] [CrossRef]
- Gervasi, R.; Aliev, K.; Mastrogiacomo, L.; Franceschini, F. User Experience and Physiological Response in Human-Robot Collaboration: A Preliminary Investigation. J. Intell. Robot. Syst. Theory Appl. 2022, 106, 36. [Google Scholar] [CrossRef]
- Eyam, A.T.; Mohammed, W.M.; Martinez Lastra, J.L. Emotion-Driven Analysis and Control of Human-Robot Interactions in Collaborative Applications. Sensors 2021, 21, 4626. [Google Scholar] [CrossRef]
- Petrovic, M.; Vukicevic, A.M.; Djapan, M.; Peulic, A.; Jovicic, M.; Mijailovic, N.; Milovanovic, P.; Grajic, M.; Savkovic, M.; Caiazzo, C.; et al. Experimental Analysis of Handcart Pushing and Pulling Safety in an Industrial Environment by Using IoT Force and EMG Sensors: Relationship with Operators’ Psychological Status and Pain Syndromes. Sensors 2022, 22, 7467. [Google Scholar] [CrossRef]
- Arkouli, Z.; Michalos, G.; Makris, S. On the Selection of Ergonomics Evaluation Methods for Human Centric Manufacturing Tasks. Procedia CIRP 2022, 107, 89–94. [Google Scholar] [CrossRef]
- Morton, J.; Zheleva, A.; Van Acker, B.B.; Durnez, W.; Vanneste, P.; Larmuseau, C.; De Bruyne, J.; Raes, A.; Cornillie, F.; Saldien, J.; et al. Danger, high voltage! Using EEG and EOG measurements for cognitive overload detection in a simulated industrial context. Appl. Ergon. 2022, 102, 103763. [Google Scholar] [CrossRef] [PubMed]
- Gualtieri, L.; Fraboni, F.; De Marchi, M.; Rauch, E. Development and evaluation of design guidelines for cognitive ergonomics in human-robot collaborative assembly systems. Appl. Ergon. 2022, 104, 103807. [Google Scholar] [CrossRef] [PubMed]
- Vijayakumar, V.; Sgarbossa, F.; Neumann, W.P.; Sobhani, A. Framework for incorporating human factors into production and logistics systems. Int. J. Prod. Res. 2022, 60, 402–419. [Google Scholar] [CrossRef]
- Kopp, V.; Holl, M.; Schalk, M.; Daub, U.; Bances, E.; García, B.; Schneider, U. Exoworkathlon: A prospective study approach for the evaluation of industrial exoskeletons. Wearable Technol. 2022, 3, e22. [Google Scholar] [CrossRef]
- Mailliez, M.; Hosseini, S.; Battaiä, O.; Roy, R.N. Decision Support System-like Task to Investigate Operators’ Performance in Manufacturing Environments. IFAC-PapersOnLine 2020, 53, 324–329. [Google Scholar] [CrossRef]
- Panchetti, T.; Pietrantoni, L.; Puzzo, G.; Gualtieri, L.; Fraboni, F. Assessing the Relationship between Cognitive Workload, Workstation Design, User Acceptance and Trust in Collaborative Robots. Appl. Sci. 2023, 13, 1720. [Google Scholar] [CrossRef]
- Vithanawasam, T.M.W.; Madhusanka, B.G.D.A. Face and upper-body emotion recognition using service robot’s eyes in a domestic environment. In Proceedings of the 2019 International Research Conference on Smart Computing and Systems Engineering (SCSE), Colombo, Sri Lanka, 28 March 2019. [Google Scholar]
- Castaldo, R.; Melillo, P.; Bracale, U.; Caserta, M.; Triassi, M.; Pecchia, L. Acute mental stress assessment via short term HRV analysis in healthy adults: A systematic review with meta-analysis. Biomed. Signal Process. Control. 2015, 18, 370–377. [Google Scholar] [CrossRef] [Green Version]
- Nicolò, A.; Massaroni, C.; Schena, E.; Sacchetti, M. The importance of respiratory rate monitoring: From healthcare to sport and exercise. Sensors 2020, 20, 6396. [Google Scholar] [CrossRef]
- Corlett, E.N.; Bishop, R.P.A. A technique for measuring postural discomfort. Ergonomics 1976, 9, 175–182. [Google Scholar] [CrossRef]
- Destouet, C.; Tlahig, H.; Bettayeb, B.; Mazari, B. Flexible job shop scheduling problem under Industry 5.0: A survey on human reintegration, environmental consideration and resilience improvement. J. Manuf. Syst. 2023, 67, 155–173. [Google Scholar] [CrossRef]
- Balasubramanian, V.; Narendran, T.T.; Sai Praveen, V. RBG risk scale: An integrated tool for ergonomic risk assessments. Int. J. Ind. Syst. Eng. 2011, 8, 104–116. [Google Scholar] [CrossRef]
- Di Pasquale, V.; Miranda, S.; Neumann, W.P. Ageing and human-system errors in manufacturing: A scoping review. Int. J. Prod. Res. 2020, 58, 4716–4740. [Google Scholar] [CrossRef]
- Kaklauskas, A.; Abraham, A.; Ubarte, I.; Kliukas, R.; Luksaite, V.; Binkyte-Veliene, A.; Vetloviene, I.; Kaklauskiene, L. A Review of AI Cloud and Edge Sensors, Methods, and Applications for the Recognition of Emotional, Affective and Physiological States. Sensors 2022, 22, 7824. [Google Scholar] [CrossRef] [PubMed]
- Abd Elgawad, Y.Z.; Youssef, M.I.; Nasser, T.M. New methodology to detect the effects of emotions on different biometrics in real time. Int. J. Electr. Comput. Eng. 2023, 13, 1358. [Google Scholar] [CrossRef]
- Mansi, S.A.; Cosoli, G.; Pisello, A.L.; Pigliautile, I.; Revel, G.M.; Arnesano, M. Thermal discomfort in the workplace: Measurement through the combined use of wearable sensors and machine learning algorithms. In Proceedings of the IEEE International Workshop on Metrology for Industry 4.0 & IoT, Trento, Italy, 7–9 June 2022. [Google Scholar]
- Abbasi, A.M.; Motamedzade, M.; Aliabadi, M.; Golmohammadi, R.; Tapak, L. Combined effects of noise and air temperature on human neurophysiological responses in a simulated indoor environment. Appl. Ergon. 2020, 88, 103189. [Google Scholar] [CrossRef]
- Martins Gnecco, V.; Pigliautile, I.; Pisello, A.L. Long-Term Thermal Comfort Monitoring via Wearable Sensing Techniques: Correlation between Environmental Metrics and Subjective Perception. Sensors 2023, 23, 576. [Google Scholar] [CrossRef]
- Ahmad, A.; Darmoul, S.; Dabwan, A.; Alkahtani, M.; Samman, S. Human error in multitasking environments. In Proceedings of the 6th International Conference on Industrial Engineering and Operations Management (IEOM 2016), Kuala Lumpur, Malaysia, 8–10 March 2016. [Google Scholar]
- Mura, M.D.; Dini, G. Improving ergonomics in mixed-model assembly lines balancing noise exposure and energy expenditure. CIRP J. Manuf. Sci. Technol. 2023, 40, 44–52. [Google Scholar] [CrossRef]
Figure 1.
Research query.

Figure 2.
Selection process.

Figure 3.
Number of studies vs. publication year.

Figure 4.
Number of studies vs. measurement categories.

Figure 5.
Number of studies vs. physical measurements.

Figure 6.
Number of studies vs. physiological measurements.

Figure 7.
Number of studies vs. psychological measurements.

Figure 8.
(a) Number of studies per task. (b) Number of studies vs. with/without robot.

Figure 9.
Number of studies per experimental context.


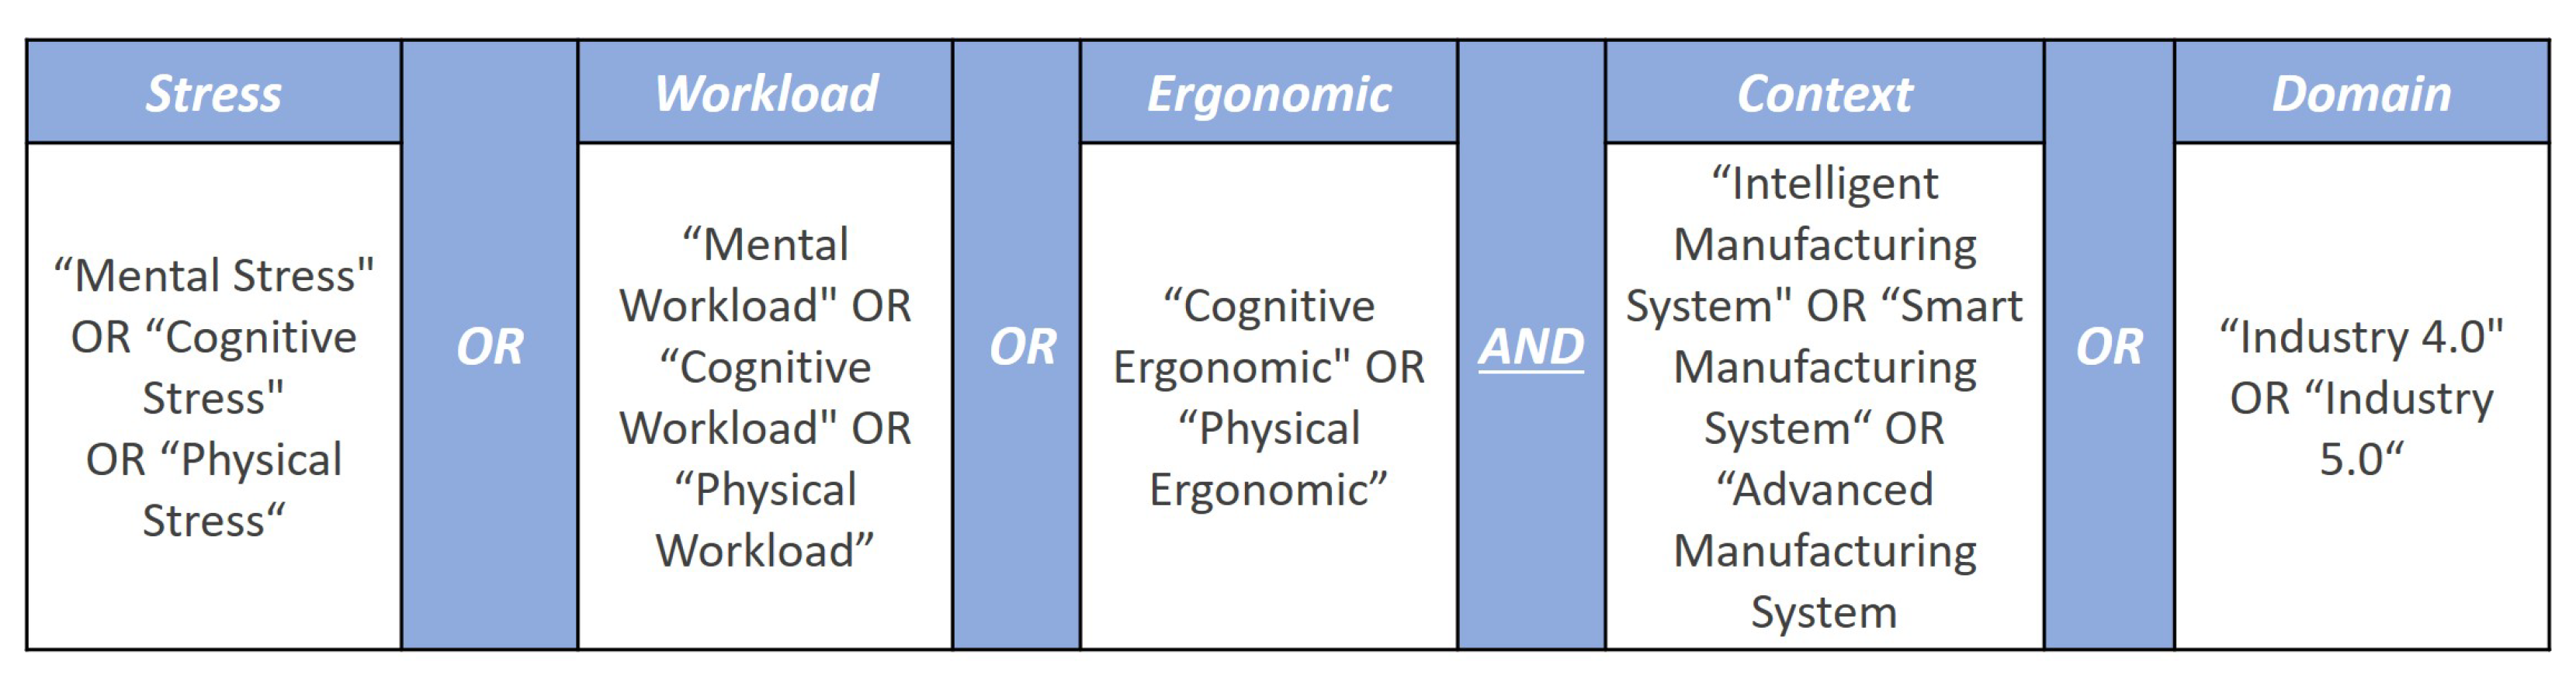
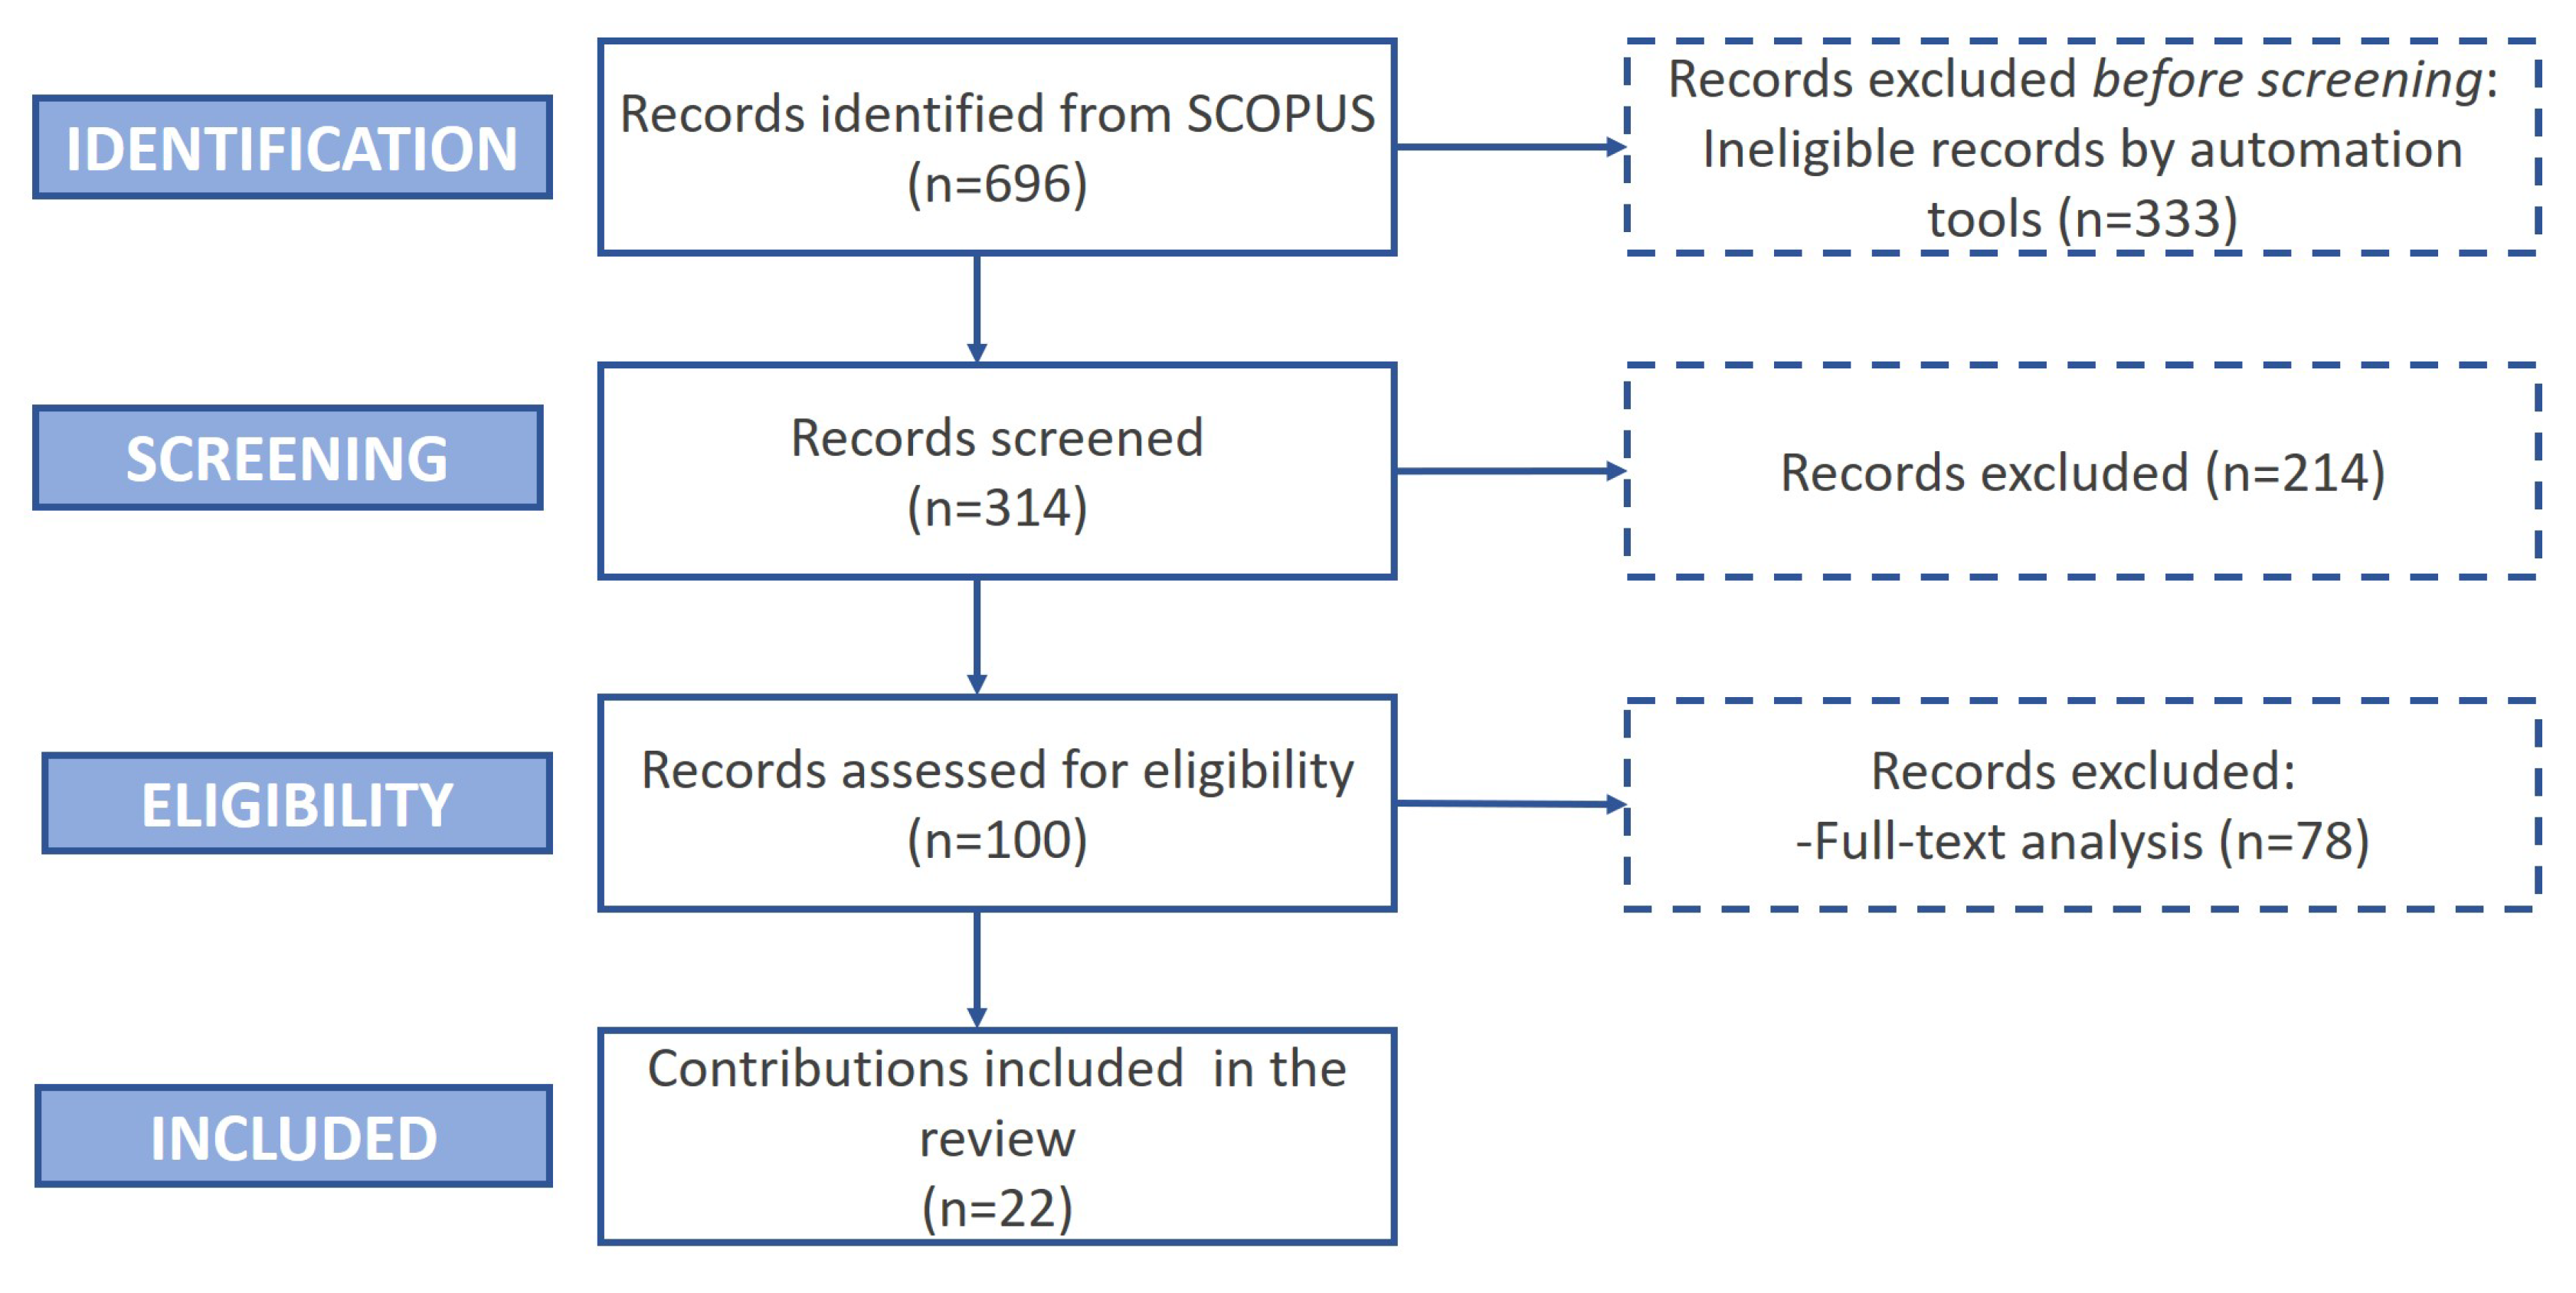
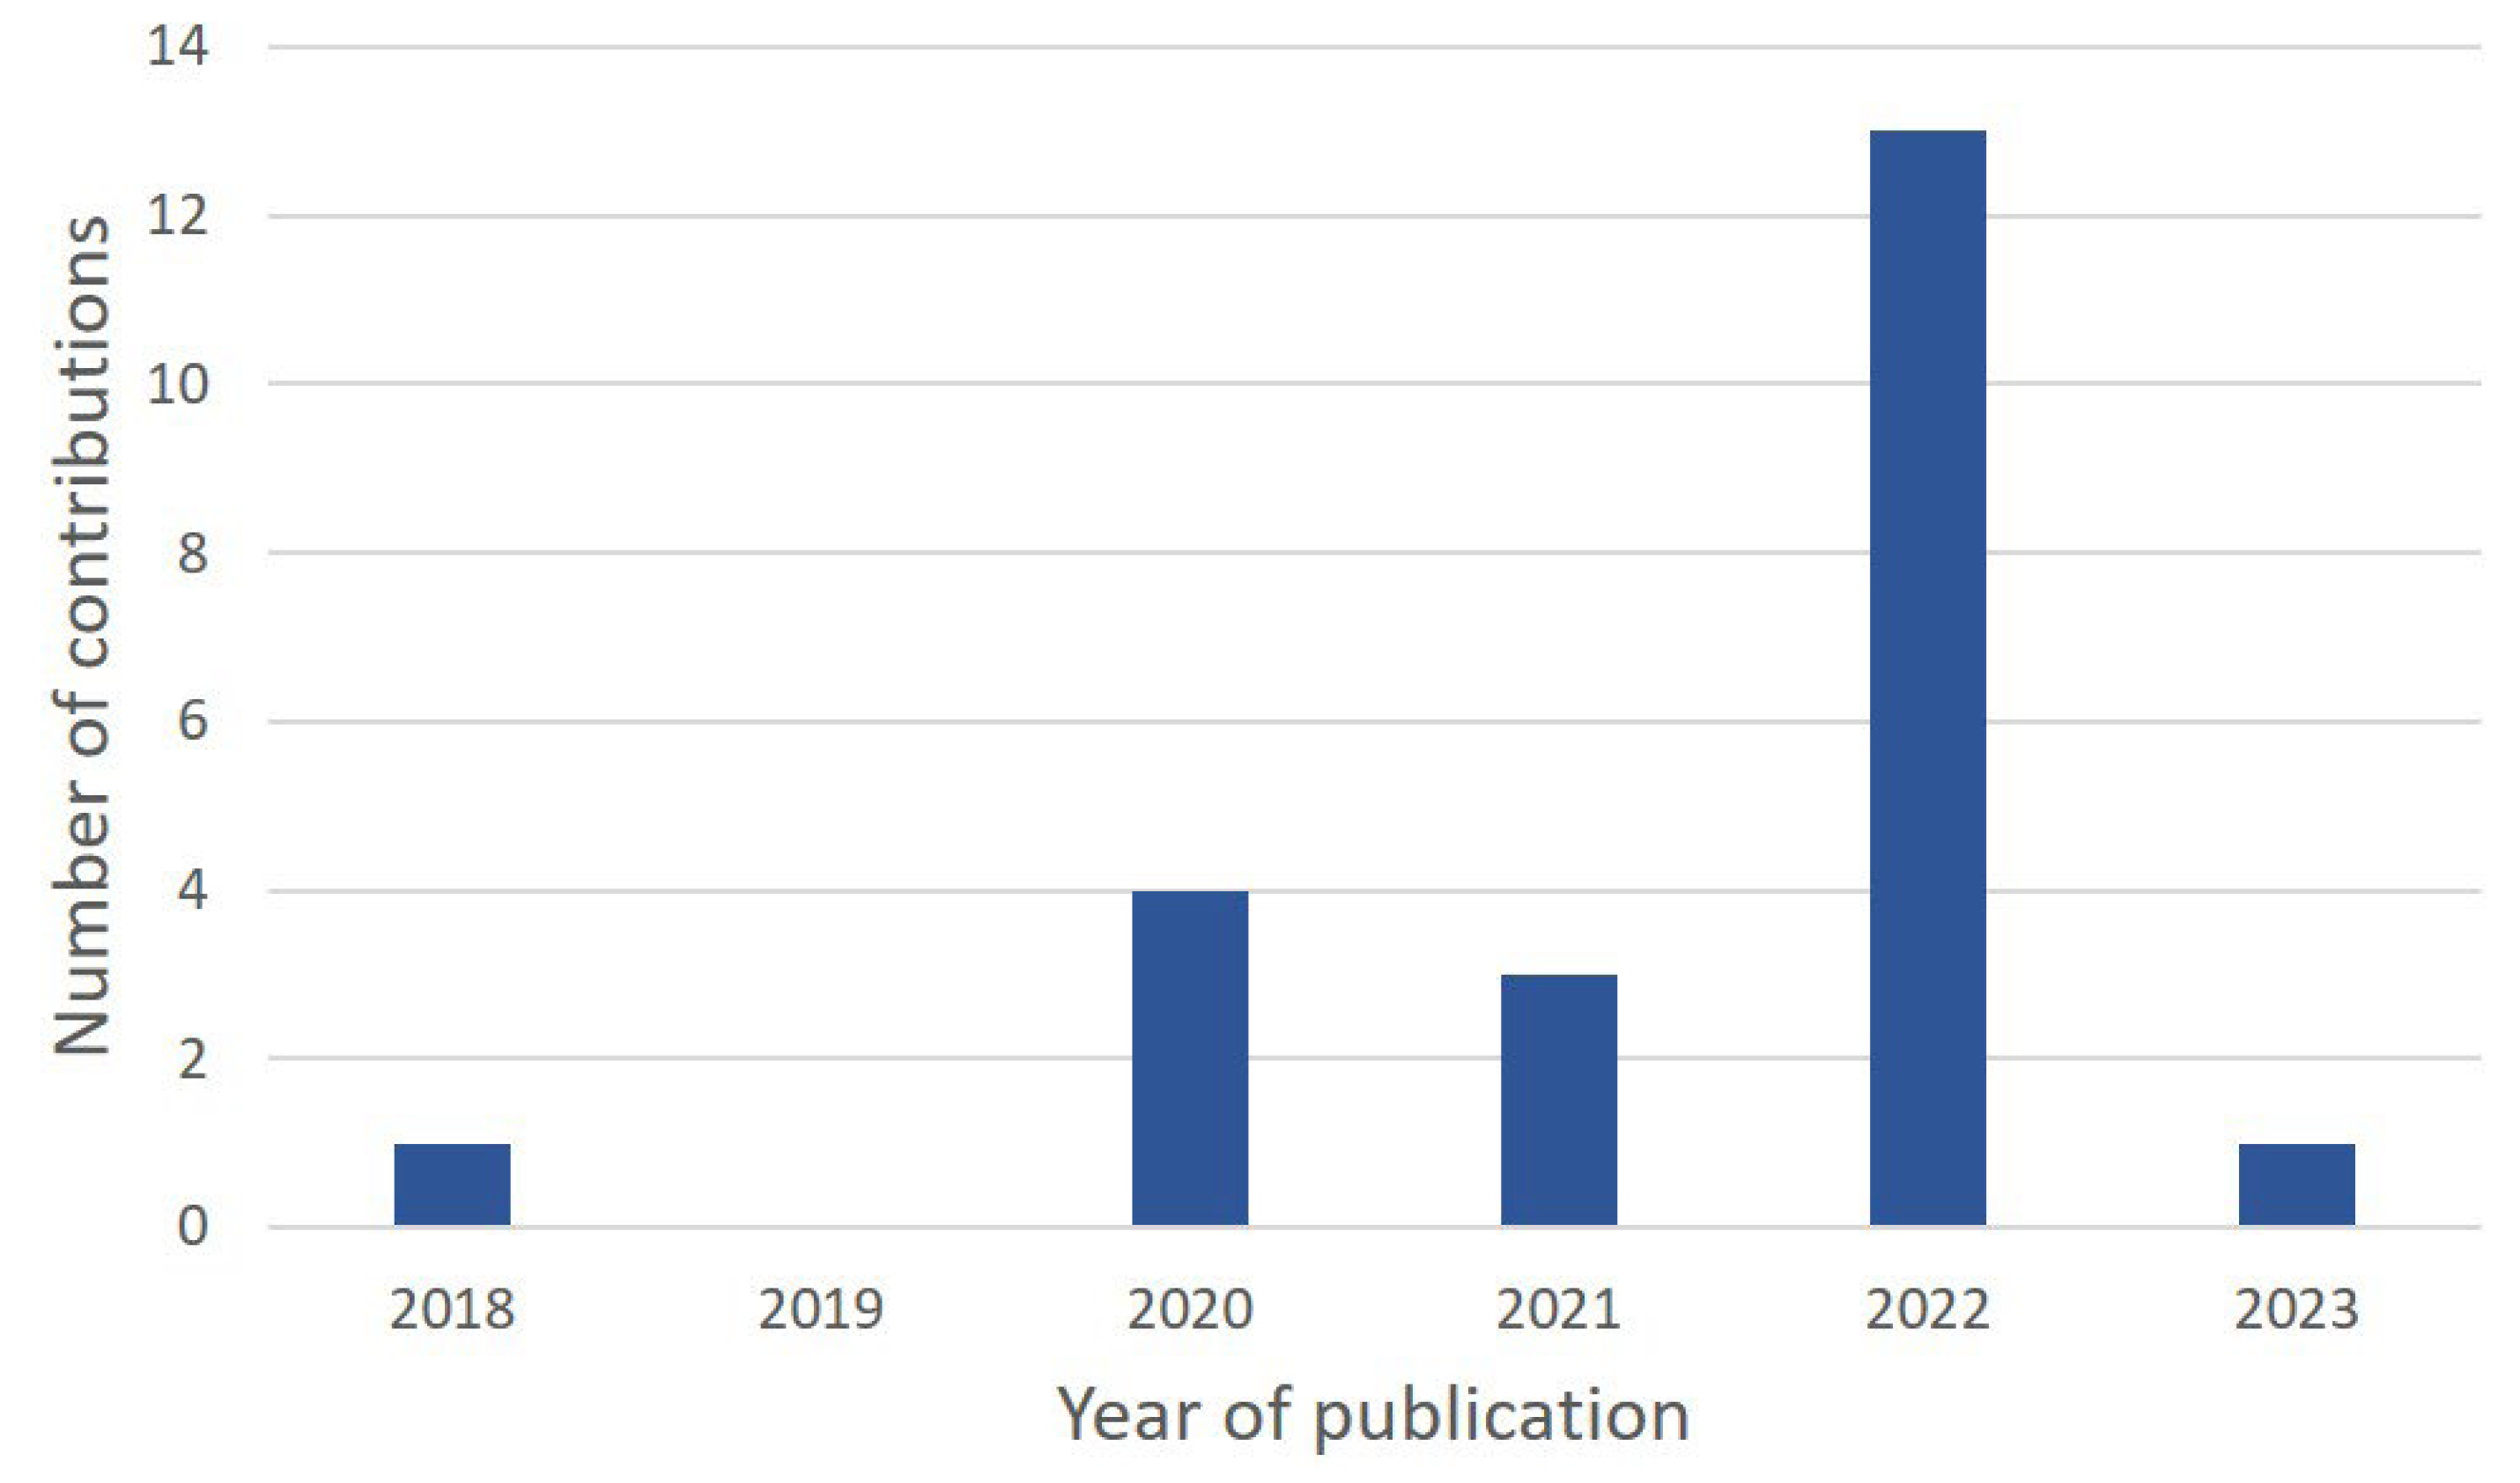
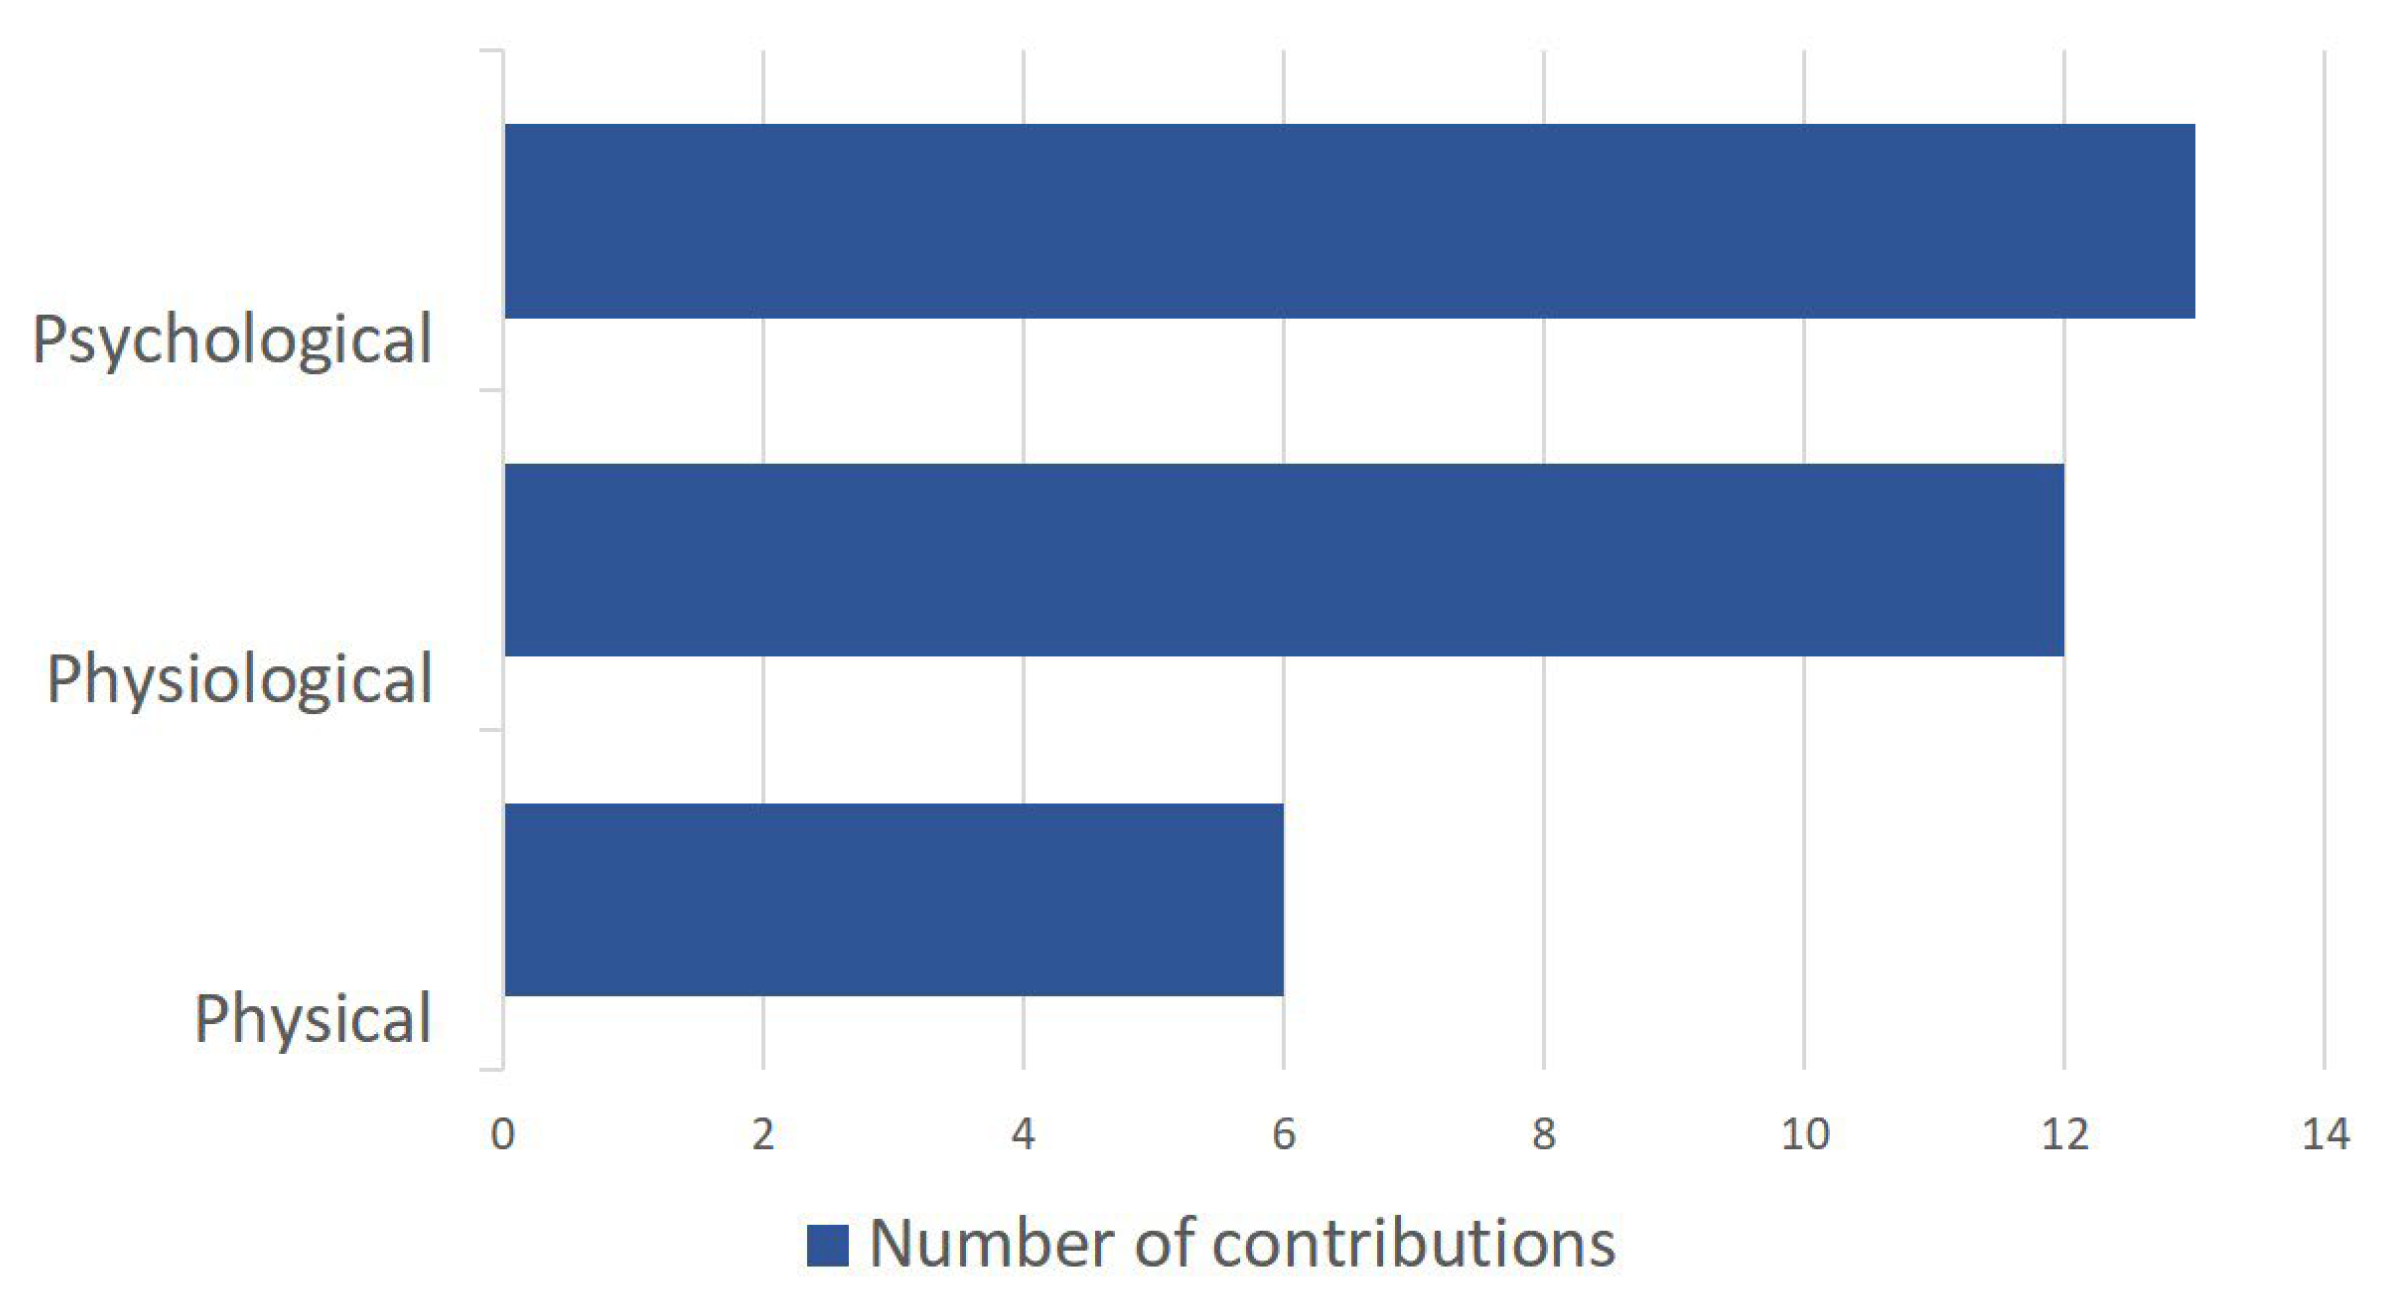
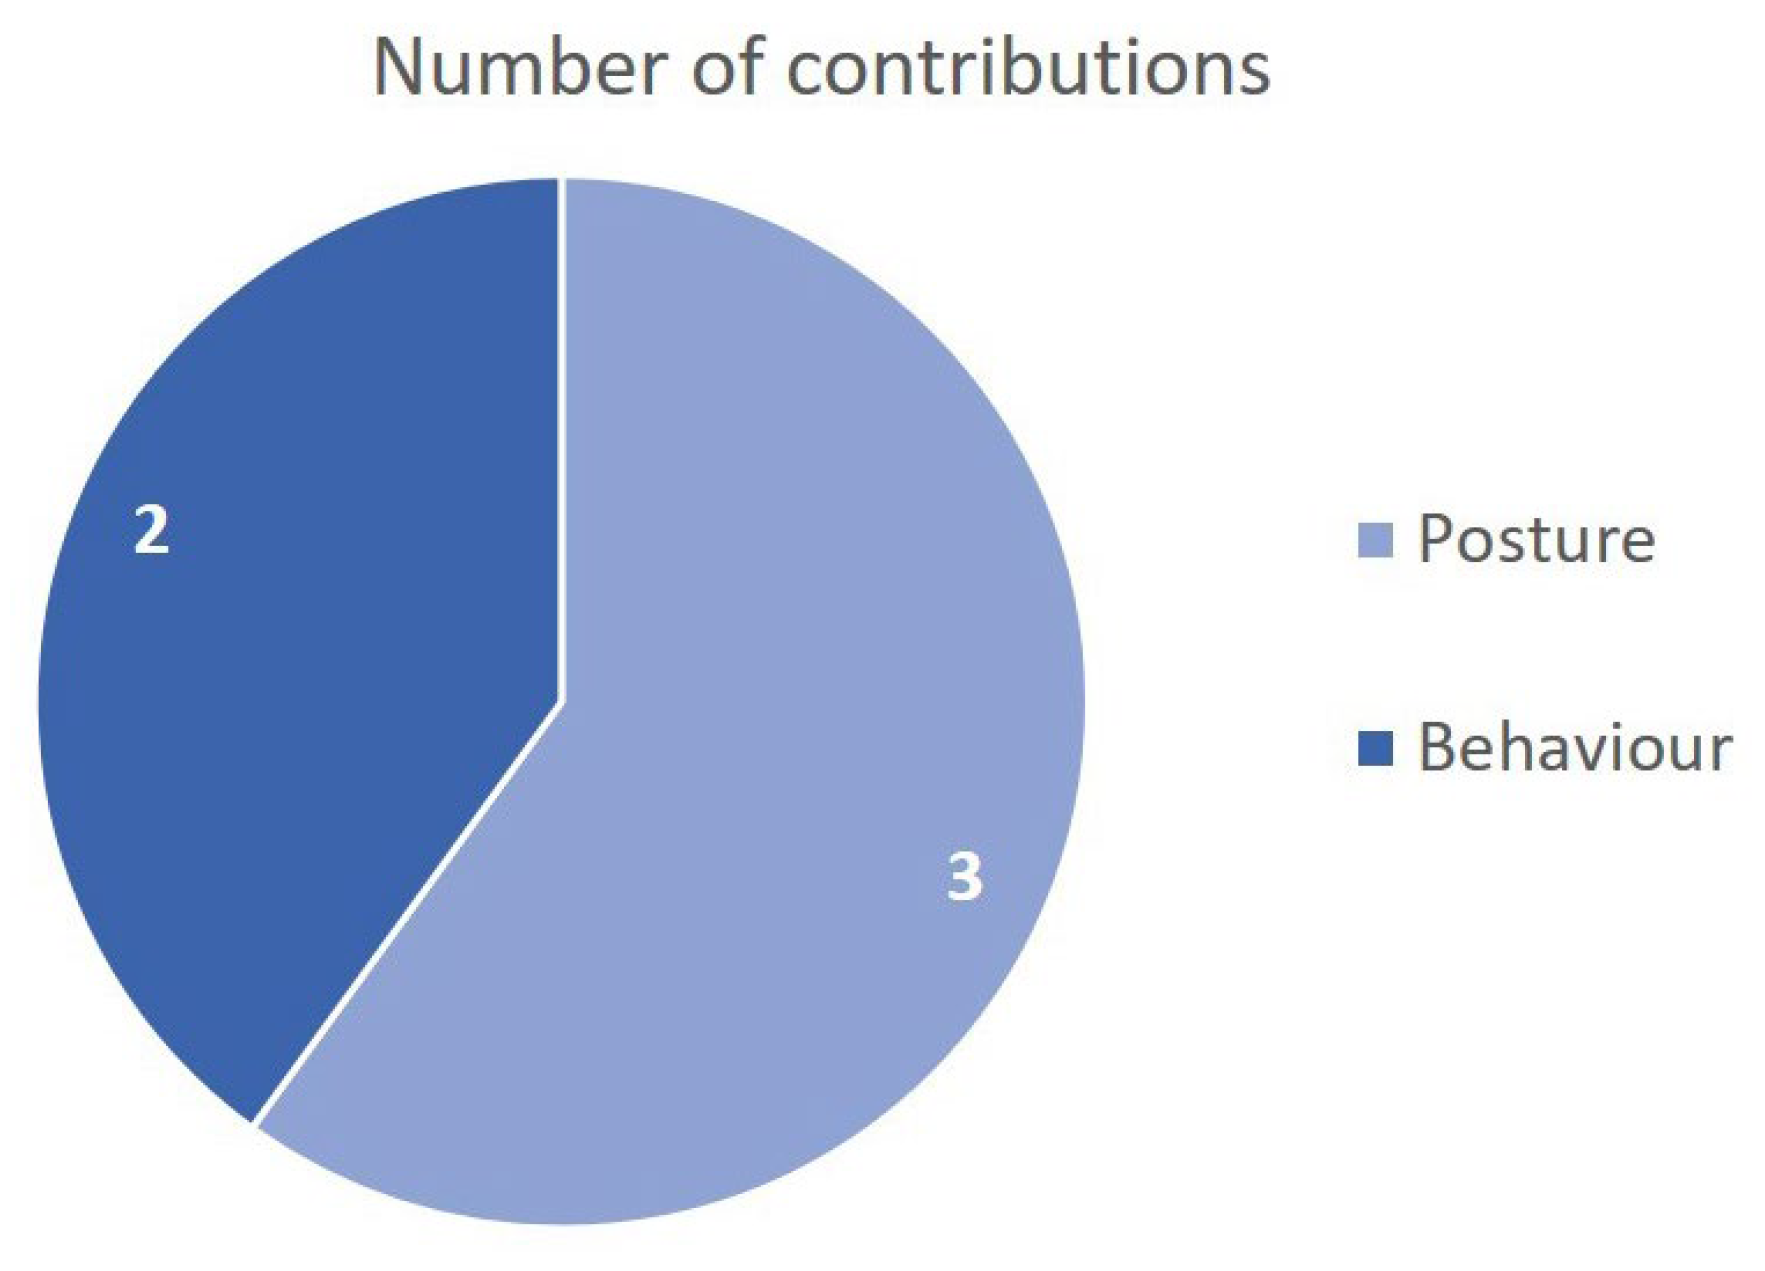
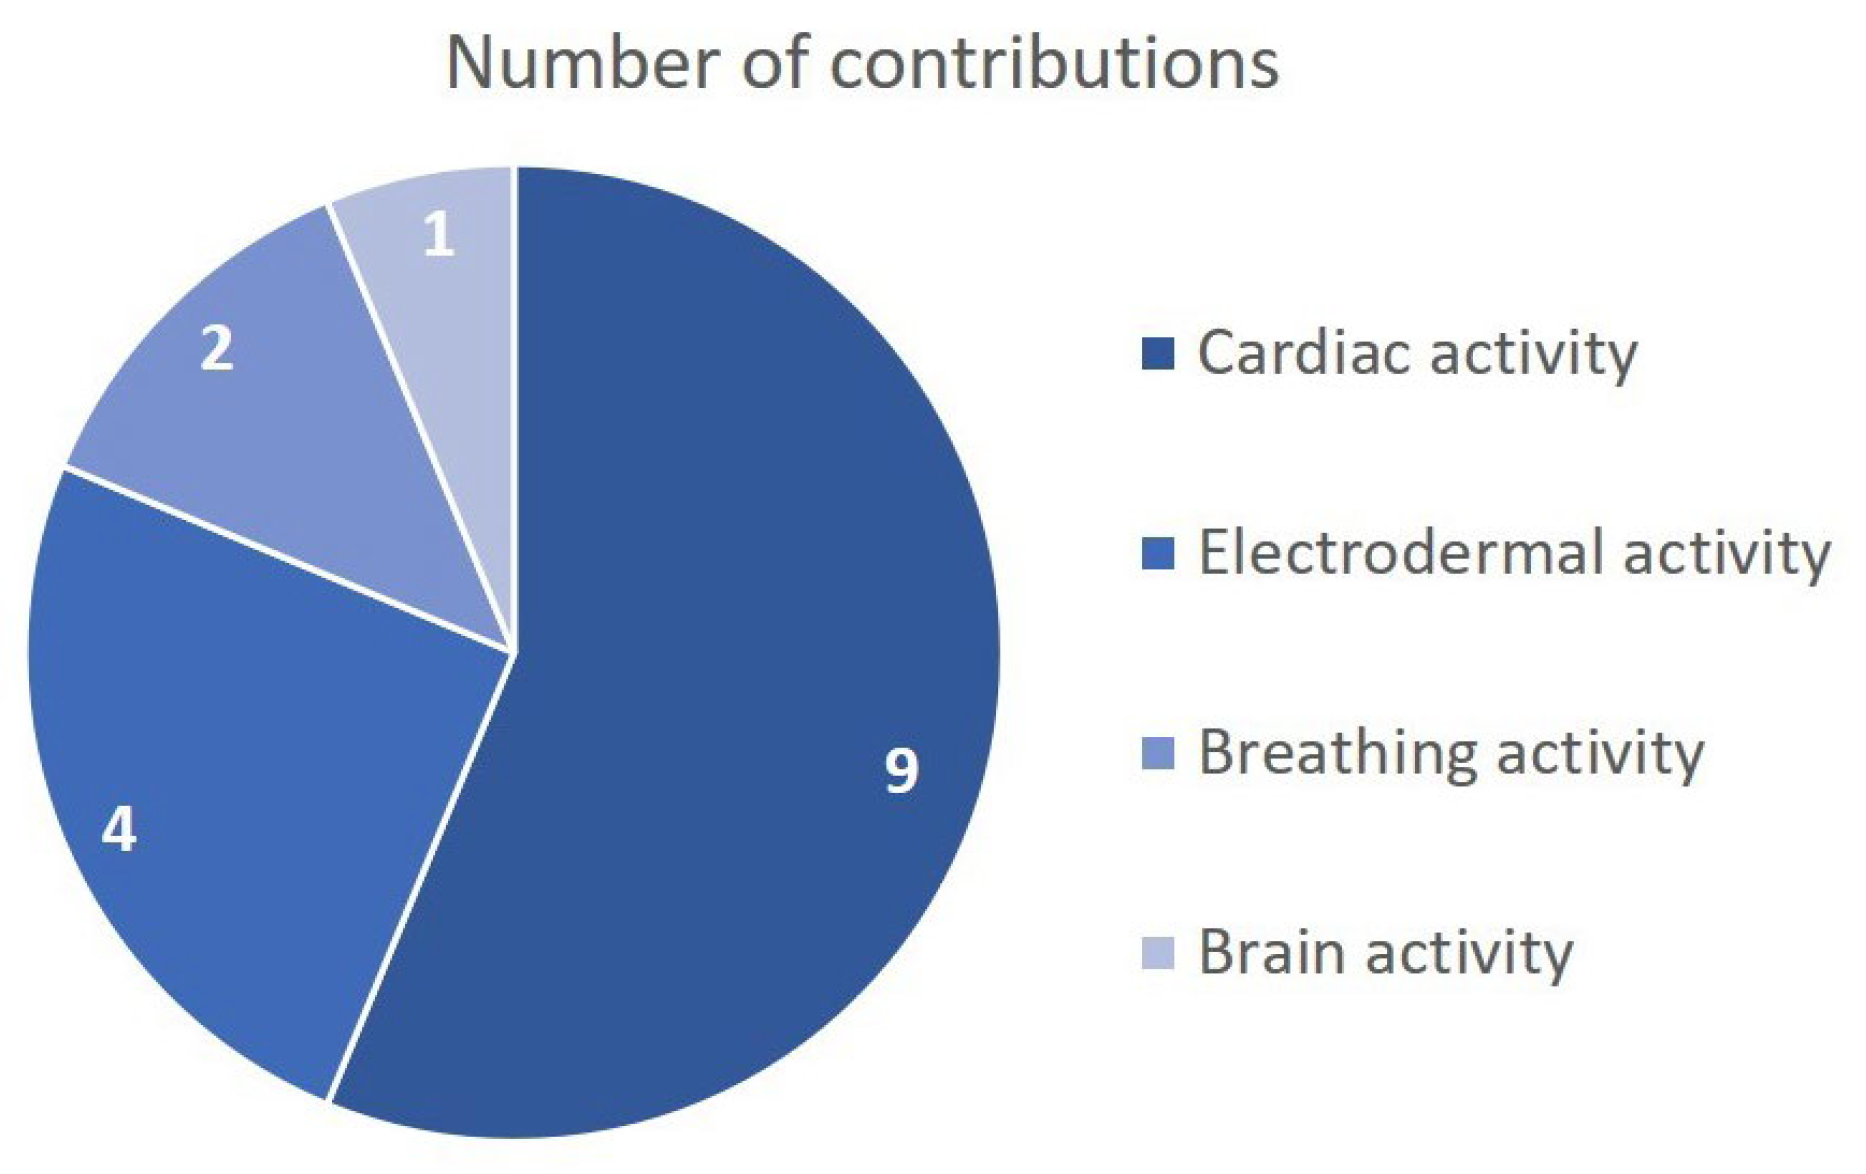
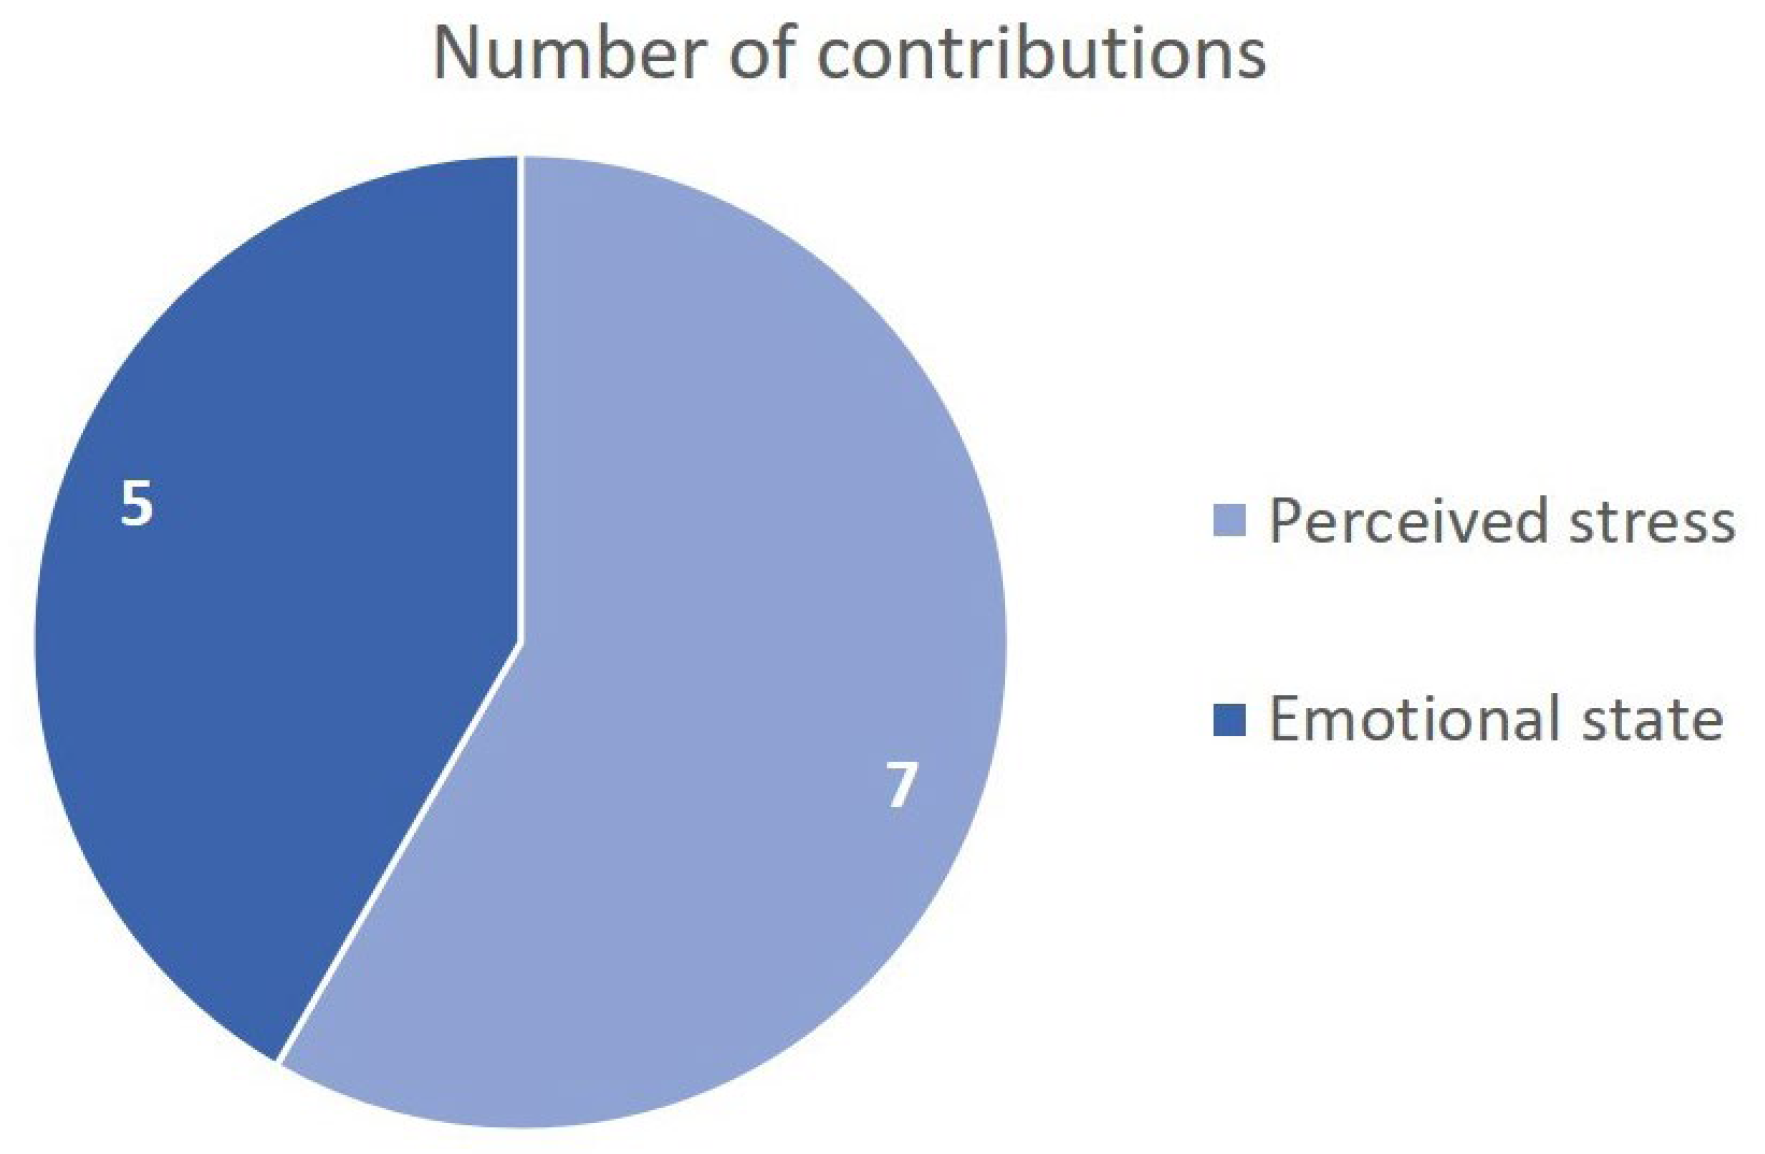
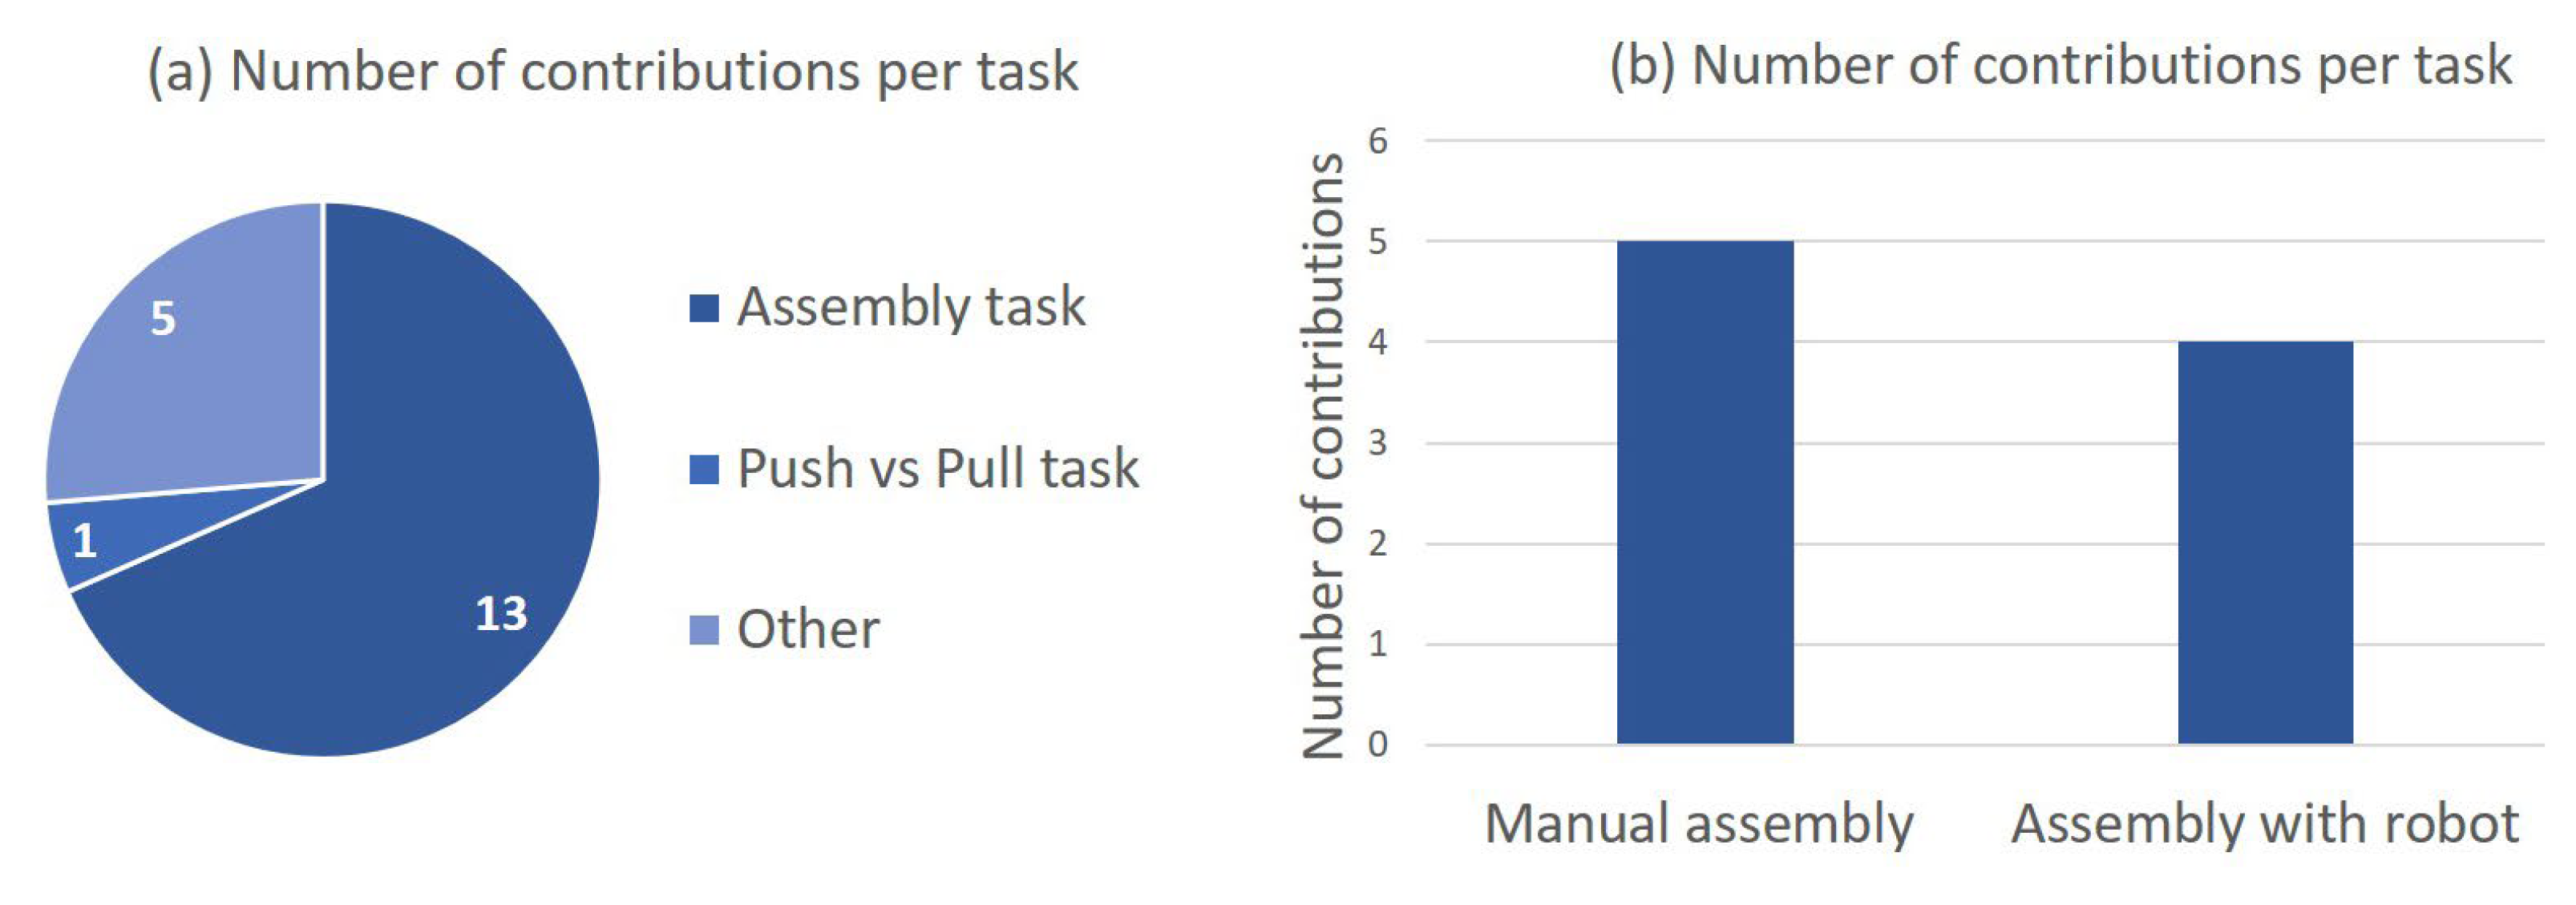
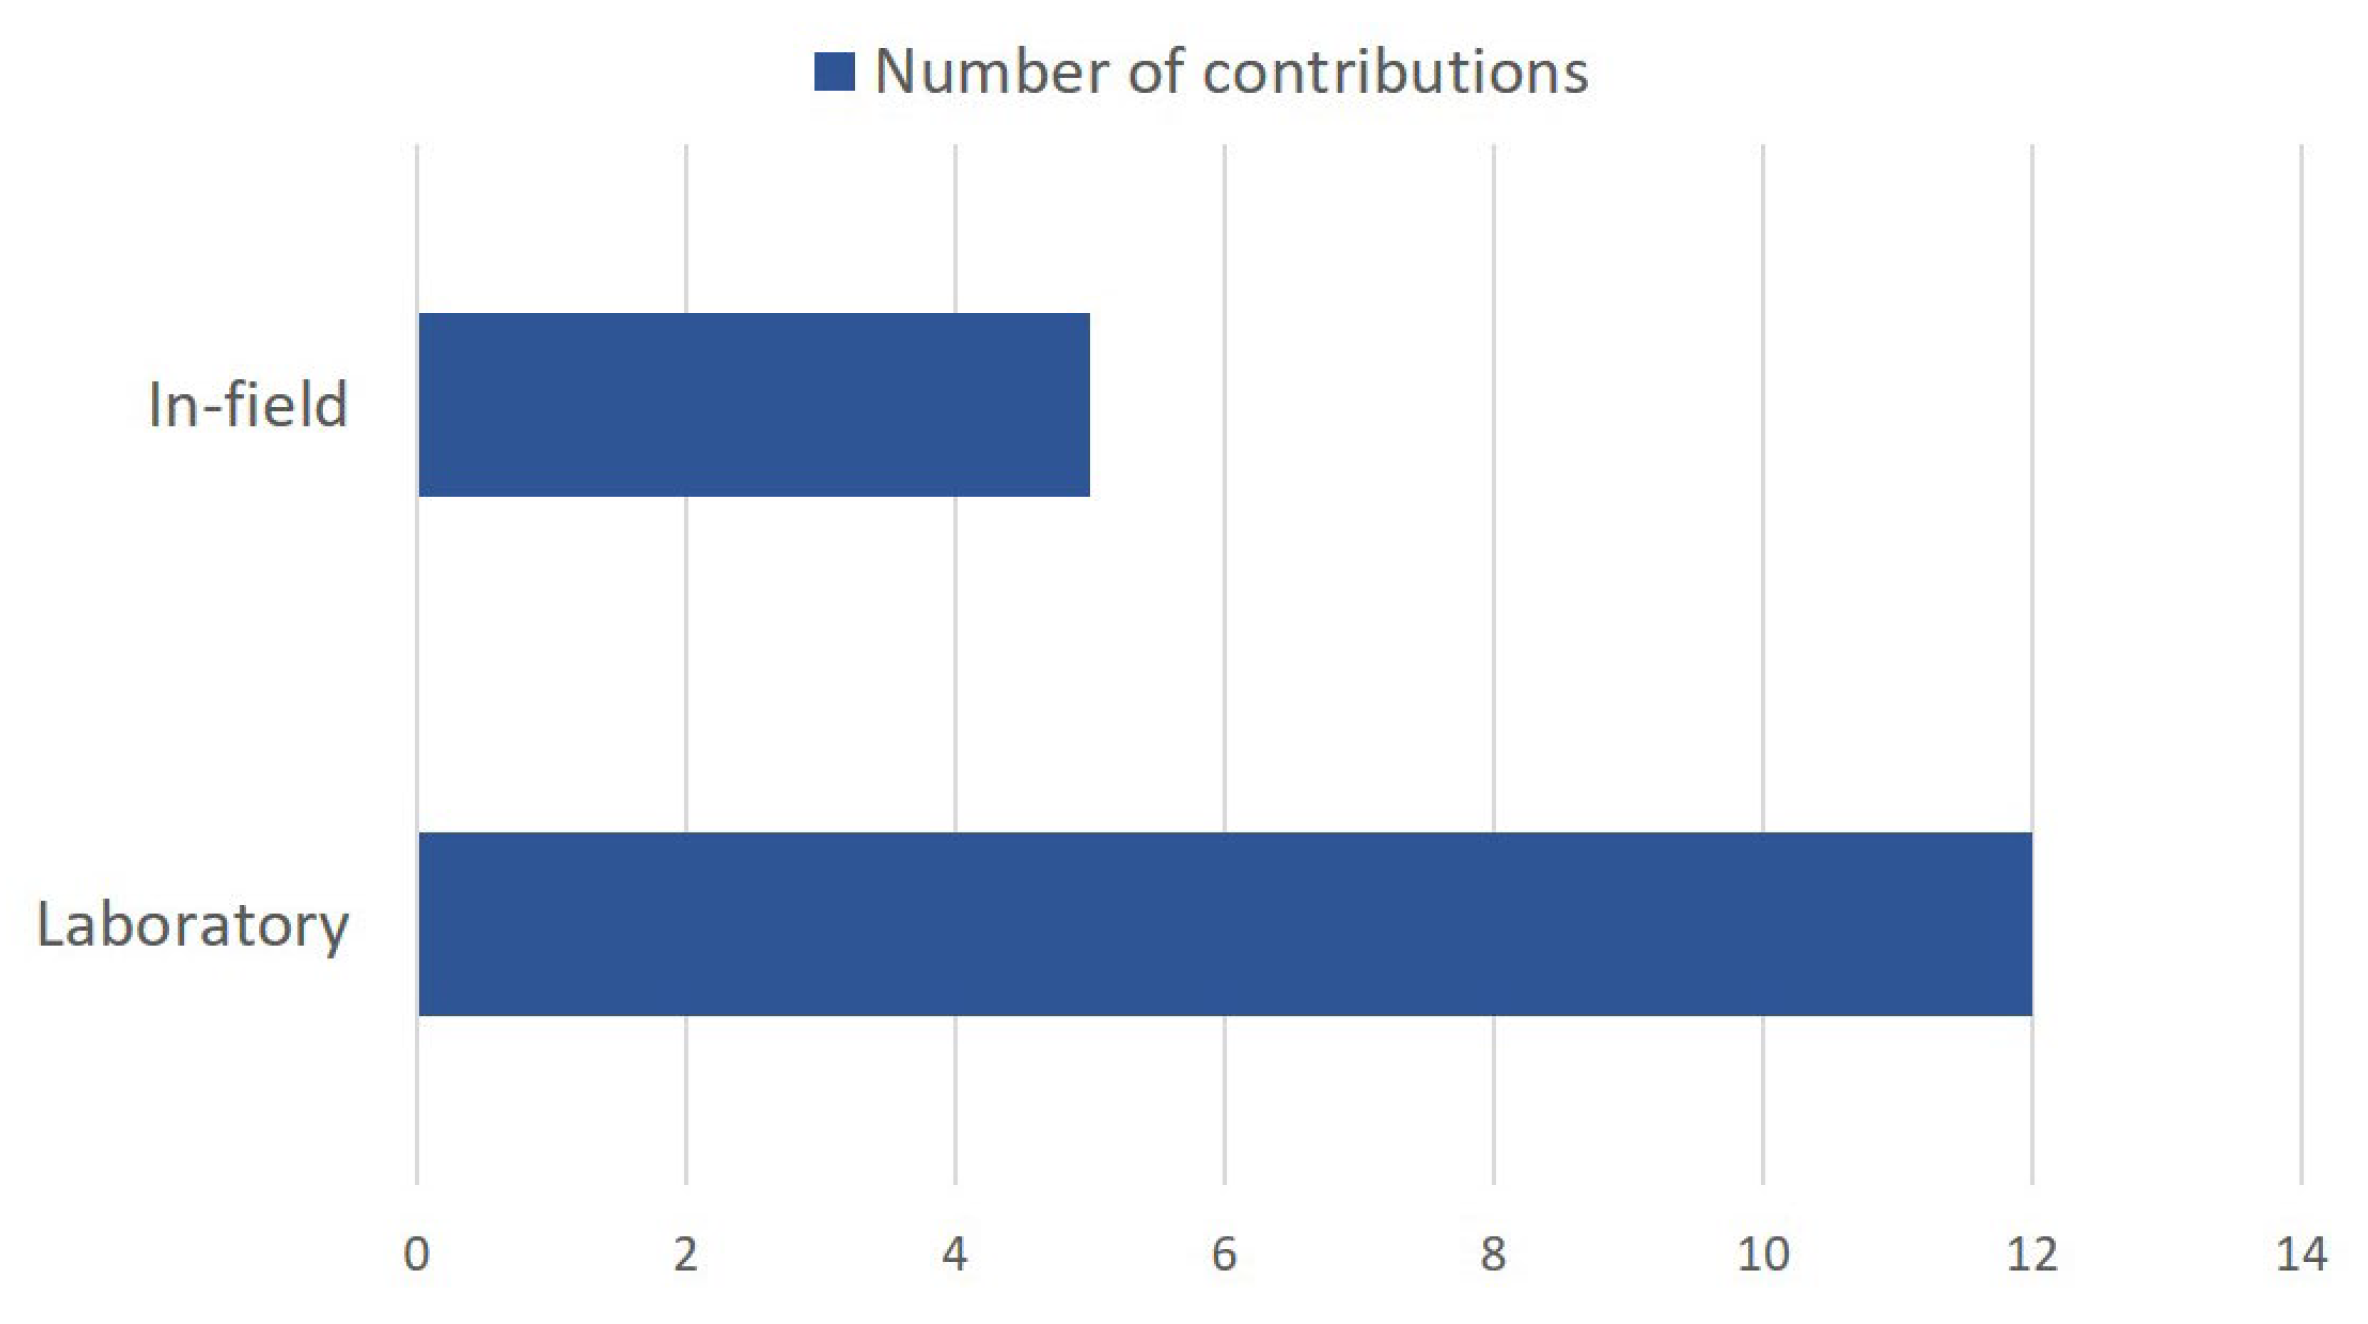
Table 1.
Selection criteria.
| Identification-Phase Criteria | Value |
|---|---|
| Subject area | Engineering |
| Document type | Article, conference paper |
| Source type | Journal, conference proceeding |
| Publication stage | Final |
| Language | English |
Table 2.
Abbreviations.
| Abbreviation | Description | Abbreviation | Description |
|---|---|---|---|
| BDP | Body Part Discomfort Scale | OCRA | Occupational repetitive action |
| CLAM | Cognitive Load Assessment for Manufacturing | OWAS | Ovako working-posture analysis system |
| DASS | Depression Anxiety Stress Scales | PSS | Perceived Stress Scale |
| ECG | Electrocardiography | REBA | Rapid Entire Body Assessment |
| EDA | Electrodermal activity | RULA | Rapid Upper Limb Assessment |
| HR | Heart rate | RSME | Rating Scale Mental Effort |
| HRV | Heart-rate variability | SSSQ | Short Stress State Questionnaire |
| ISA | Instantaneous Self-Assessment | SC | Skin conductance |
| MCH | Modified Cooper–Harper Scale | STAI | State–Trait Anxiety Inventory |
| NASA-TLX | National Aeronautics Space Administration–Task Load Index | SWAT | Subjective workload-assessment technique |
| NAS | Numeric Analog Scale | VMU | Vector-magnitude units |
| WP | Workload profile |
Table 3.
Number of studies vs. first author’s affiliation.
| Country | First Author’s Affiliation | Number of Studies |
|---|---|---|
| Belgium | imec-mict-UGent, Gent | 1 |
| Finland | Tampere University, Tampere | 1 |
| France | Université de Toulouse, Toulouse | 1 |
| Germany | Fraunhofer Institute for Manufacturing Engineering and Automation IPA, Stuttgart | 1 |
| Greece | University of Patras, Rion Patras | 1 |
| Italy | Università Politecnica delle Marche, Ancona | 3 |
| Polytechnic University of Bari, Bari | 1 | |
| Politecnico di Torino, Turin | 1 | |
| University of Modena and Reggio Emilia, Modena | 4 | |
| University of Bozen-Bolzano, Bolzano | 1 | |
| University of Campania | 1 | |
| University of Bologna | 1 | |
| Istituto Italiano di Tecnologia, Genoa | 1 | |
| India | Shiv Nadar University, Uttar Pradesh | 1 |
| Norway | Norwegian University of Science and Technology, Trondheim | 1 |
| Serbia | University of Belgrade, Belgrade | 1 |
| Switzerland | University of Applied Sciences and Arts of Southern Switzerland, Manno | 1 |
Table 4.
Measurement classification.
| Measurement | References | ||
|---|---|---|---|
| Type | Category | Object | |
| Objective | Physical | Posture | [46,47,48,49] |
| Behaviour | [50,51] | ||
| Physiological | Cardiac activity | [12,30,46,47,48,52,53,54,55] | |
| Electrodermal activity | [30,53,55,56] | ||
| Breathing activity | [46,47] | ||
| Brain activity | [57] | ||
| Subjective | Psychological | Emotional state | [12,32,34,35,58] |
| Perceived stress | [47,59,60,61,62,63,64,65] | ||
Table 5.
Postural indicators.
| Postural Measurements | Indicators | References |
|---|---|---|
| Entire Body Assessment | OWAS | [47,49] |
| Entire Body Assessment | REBA | [47,48] |
| Upper Limb Assessment | RULA | [47] |
| Entire Body Assessment | VMU |
Table 6.
Body-language and body-motion indicators.
| Behavioural Measurement | Indicators | References |
|---|---|---|
| Body language | S is equal to the number of occurrences recorded in a 1 min interval from time t-60 to time t; t indicates the time in seconds | [50] |
| Body motion | Assembly-line speed | [51] |
| Hyperactivity | [50] |
Table 7.
Cardiac-activity indicators.
| Physiological Measurement | Indicators | References |
|---|---|---|
| Cardiac activity | HR, HRV | [46,47,53,54,55] |
HRuser is the mean value of the specific user’s HR as recorded during the task simulation; HRbaseline is the mean HR value as recorded during the user’s baseline phase; HRmax is the maximum HR value as recorded for each user during the entire test | [48] | |
RR baseline refers to the RR value during a resting phase of the activity participant; RR mean and RR max refer to values calculated under stress | [12] | |
| [30] | ||
| RMSSD | [56] | |
VO2 corresponds to individual oxygen consumption; VO2max corresponds to the maximum individual oxygen consumption; HR is the heart rate; RHR is the resting heart rate | [52] |
Table 8.
Electrodermal-activity indicators.
| Physiological Measurement | Indicators | References |
|---|---|---|
| Electrodermal activity | [30] | |
| SC | [53,55,56] |
Table 9.
Breathing-activity indicator.
| Physiological Measurement | Indicators | References |
|---|---|---|
| Breathing activity | BR | [46,47] |
Table 10.
Brain-activity indicator.
| Neurophysiological Measurement | Indicators | References |
|---|---|---|
| Brain activity | High-beta frequency band (23 to 38 Hz) | [57] |
Table 11.
Psychological parameters.
| Psychological Measurements | Indicators | References |
|---|---|---|
| Emotional state | Trait and state anxiety | [55] |
| Depression, anxiety, and tension/stress | [58] | |
| Interest, excitement, focus, and relaxation alterations | [57] | |
| Pleasure–arousal–dominance of the affective state of the participants | [56] | |
| Perceived cognitive and emotional conditions | [12] | |
| Perceived stress | Mental stress | [64] |
| Time load, mental load, and psychological-stress load | [59,62] | |
| Stress level | [60,61,65] | |
| Body-area stress | [63] | |
| Perceived comfort | [47] |
Table 12.
Experimental condition of studies.
| Reference | Indicators | Experimental Task | Experimental Environment | ||
|---|---|---|---|---|---|
| Physiological | Physical | Psychological | |||
| [54] | HRV | Plastic-injection assembly line | Injection-moulding manufacturing line | ||
| [12] | RR | Perceived cognitive and emotional conditions | Engine oil-filter replacement sequence | Laboratory | |
| [52] | Cognitive task Motor task | Laboratory | |||
| [57] | EEG | Interest, excitement, focus, and relaxation alterations | Assembling a wooden box alone/with the cobot | Laboratory | |
| [56] | SCR, RMSSD | Pleasure–arousal–dominance of the affective state of the participants | Human–robot collaboration for an assembly task | Laboratory | |
| [48] | HA | REBA | Tractor assembly | Virtual simulation | |
| [61] | Stress level | Pneumatic cylinder assembly with collaborative robot. | Laboratory | ||
| [30] | ΔEDA, ΔRR | Oil- and gas-pipes manufacturing sequence | Virtual-reality simulation | ||
| [63] | Body-area stress | Assembly and disassembly | Automotive plant | ||
| [50] | Self-touching, Hyperactivity | Assembly | Laboratory | ||
| [60] | Stress level | Assembly and cognitive | Laboratory | ||
| [53] | HRV, EDA | Assembly | Real manufacturing environment | ||
| [46] | HR, HRV, BR Skin temperature | Body activity | Motor task | Mixed reality: virtual model and real items in a laboratory context | |
| [47] | BR | OWAS, REBA, RULA, VMU | Perceived comfort | Air-cabin filter assembly | Virtual-reality simulation |
| [58] | Depression, Anxiety, and tension/stress | Pushing and pulling | Industrial environment | ||
| [65] | SSSQ | Perceived stress | Assembly task with collaborative robots | Laboratory | |
| [49] | OWAS | Stress | Manual assembly | Automotive Italian company | |
Table 13.
Environmental factors.
| Reference | Environmental Temperature | Environmental Noise | Environmental Light | Environmental Air Quality |
|---|---|---|---|---|
| [12] | Constant temperature at 24 °C | Silence (no sources of noise) | Totally artificial light sources (neon lamps positioned on the ceiling) | |
| [30] | Temperature is variable with the external one. | Around 85–135 dB | Artificial light | High presence of dust |
| [50] | Constant | Constant lighting conditions | ||
| [60] | Ambient factory-floor sounds were played | |||
| [53] | Temperature, based on operators’ clothing and activity | Noise exposure evaluated by a sound-level meter and according to the Daily Personal Noise Exposure Level (LEP, d) established by the Directive 2003/10/EC | A colorimeter is used to measure the colour temperature and lux. | Global pollution index (GPI), a weighted compound of the different pollutants measured |
Table 14.
Workers’ demographic factors.
| Reference | Gender | Age | Expertise/Experience/Background |
|---|---|---|---|
| [54] | 1 female, 3 males | ||
| [12] | 1 female, 7 males | Mean age: 25.6 years | |
| [52] | Males and females | Different ages for each task | |
| [56] | 42 participants (71.4% males, 28.6% females) | Mean age: 28.24 ± 8.1 years | ● 28.6% of participants had never interacted with a cobot; ● 45.2% of participants had never interacted with a cobot but knew of them; ● 16.7% of participants had already interacted with a cobot; ● 9.5% of participants had already programmed and interacted with a cobot. |
| [48] | Five users with different levels of expertise | ||
| [61] | 12 males, 2 females | The age of participants ranged from 23 to 57 years old | -No previous experience with collaborative robots and minimal experience in manufacturing operations. Different backgrounds: researchers, master student, technicians/administrative |
| [63] | Young experts | ||
| [50] | Model calibration experiment: 5 males; Multi-subject cognitive-load-assessment experiments: 5 males, 5 females | Model-calibration experiment: (Mean age: 27.6 ± 2.0 years) Multi-subject cognitive-load-assessment experiments: (Mean age: 26.6 ± 3.7 years) | No previous expertise or experience |
| [60] | 25 females, 21 males | 46 participants between 19 and 40 years old Mean age: 25.8 ± 4.19 years | Variability in participants’ educational background (from secondary education to PhD) |
| [53] | 2 males | 31 and 28 years old | |
| [58] | 20 males | Mean age: 35.0 ± 5.8 years | Experienced and non-experienced in industrial physical tasks |
| [65] | 11 males, 3 females | Mean age: 31.6 ± 4 years |
Disclaimer/Publisher’s Note: The statements, opinions and data contained in all publications are solely those of the individual author(s) and contributor(s) and not of MDPI and/or the editor(s). MDPI and/or the editor(s) disclaim responsibility for any injury to people or property resulting from any ideas, methods, instructions or products referred to in the content. |
© 2023 by the author. Licensee MDPI, Basel, Switzerland. This article is an open access article distributed under the terms and conditions of the Creative Commons Attribution (CC BY) license (https://creativecommons.org/licenses/by/4.0/).
Share and Cite
MDPI and ACS Style
Blandino, G. How to Measure Stress in Smart and Intelligent Manufacturing Systems: A Systematic Review. Systems 2023, 11, 167. https://doi.org/10.3390/systems11040167
AMA Style
Blandino G. How to Measure Stress in Smart and Intelligent Manufacturing Systems: A Systematic Review. Systems. 2023; 11(4):167. https://doi.org/10.3390/systems11040167
Chicago/Turabian StyleBlandino, Graziana. 2023. "How to Measure Stress in Smart and Intelligent Manufacturing Systems: A Systematic Review" Systems 11, no. 4: 167. https://doi.org/10.3390/systems11040167
Note that from the first issue of 2016, this journal uses article numbers instead of page numbers. See further details here.