Article

Carbon Reduction Countermeasure from a System Perspective for the Electricity Sector of Yangtze River Delta (China) by an Extended Logarithmic Mean Divisia Index (LMDI)

1
School of Geography and Environment, Jiangxi Normal University, Nanchang 330022, China
2
Key Laboratory of Poyang Lake Wetland and Watershed Research, Ministry of Education, Jiangxi Normal University, Nanchang 330022, China
3
College of Finance, Jiangxi Normal University, Nanchang 330022, China
*
Author to whom correspondence should be addressed.
Systems 2023, 11(3), 117; https://doi.org/10.3390/systems11030117
Submission received: 31 December 2022 / Revised: 15 February 2023 / Accepted: 21 February 2023 / Published: 23 February 2023

Abstract

:
The electricity sector is a complex system, especially in the Yangtze River Delta (YRD) of China. Thus, the carbon dioxide (CO2) emission of YRD’s electricity sector during 2000–2020 was first calculated and then evaluated from two systematical dimensions of cross-region and the whole process (production, trade, transmission, and consumption) by an extended logarithmic mean Divisia index (LMDI). (1) During 2000–2020, the CO2 emission of YRD’s electricity sector increased from 228.12 Mt to 807.55 Mt, with an average annual growth rate of 6.52%. Compared to other regions, the YRD’s electricity mix effect had the strongest mitigation impact on CO2 growth. Therefore, it is important for YRD to build a low-carbon electricity system itself, including the de-carbonization of electricity production and the carbon reduction of the electricity-use process. (2) Nationally, electricity trade had an overall mitigating impact on emission growth during 2000–2020. This result means that cross-regional cooperation or trade in the electricity sector is beneficial to emission reduction. So, it is important to improve the national power grids to promote trade. (3) Jiangsu had the largest CO2 emissions, while Anhui had the fastest average annual growth rate (9.71%). Moreover, the economic activity effect was the most significant driver in all provinces, especially in Jiangsu and Anhui. Thus, Jiangsu and Anhui should strive to improve the quality of economic growth while vigorously cutting carbon emissions. (4) Electricity transmission loss had an overall driving impact on emission growth in each YRD province, especially in Zhejiang and Anhui. Meanwhile, electricity structure, electricity trade, and electricity intensity were the inhibiting factors. Particularly, the inhibiting effect of Shanghai’s electricity structure was notably weak (−2.17 Mt). So, Shanghai should try hard to increase the proportion of renewable energy, while Zhejiang and Anhui should upgrade their electricity transmission equipment.

1. Introduction

Global climate change is aggravated by anthropogenic carbon dioxide (CO2) emissions, and how to reduce CO2 emissions has become an important issue for countries around the world [1,2]. With the rapid economic development, China’s CO2 emissions and total energy consumption surpassed the United States in 2007 [3]. Moreover, there are serious pollution problems in China because environmental regulations are loose, and there is insufficient attention to environmental protection [4]. Therefore, the Chinese government has proposed to see the peak at CO2 emissions before 2030 and achieve CO2 neutrality before 2060 at the general debate during the 75th session of the UN General Assembly on 22 September 2020 [5].
China’s electricity sector has huge CO2 emissions because the energy structure of thermal power generation has been dominated by fossil energy sources (i.e., coal) for decades. CO2 emissions from China’s power sector accounted for 48.19% of the country’s total CO2 emissions and 13.57% of the world’s total CO2 emissions from fossil energy in 2016 [6]. Thus, China needs to pay attention to the low-carbon development within the electricity sector to achieve its long-term carbon reduction goals [7,8]. On 24 October 2021, China’s State Council issued the “Action Plan for Carbon Peaking by 2030”, pointing out that the green and low-carbon transformation of energy was one of the key tasks of carbon peaking. So, China should vigorously develop new or renewable energy (i.e., hydropower, wind, or even nuclear power) according to local conditions to accelerate the construction of new electricity systems [9,10]. To accurately point out the development direction of the electricity system and provide theoretical support to the low-carbon development policies, it is necessary to conduct a systematical analysis of the CO2 emission drivers in the electricity sector [11].
Structural decomposition analysis (SDA) and index decomposition analysis (IDA) are the main methods for decomposing the drivers of energy consumption, and the CO2 emission changes [12,13,14,15,16]. The IDA has a lower data requirement and is more flexible than the SDA [17,18,19]. Thus, the IDA is used in this study. The IDA includes several different methodological branches, e.g., the Laspeyres index, the Paasche index, the arithmetic mean Divisia index, and the logarithmic mean Divisia index (LMDI) [20]. The LMDI has been widely used in different spatial scales and various industries due to the advantages of being easy to use, having a solid theoretical foundation, the ability to resolve the zero-value problem, and the fact that the decomposition results have no residual terms [21,22,23,24]. For example, Chen et al. [25] analyzed six factors influencing CO2 emissions in the Organization for Economic Cooperation and Development (OECD) from 2001–2015 based on the LMDI model. Yang et al. [26] used the LMDI to analyze the factors influencing CO2 emissions from energy consumption in China from 1996–2016 and found that economic activity and energy intensity were the most important factors driving and inhibiting the growth of CO2 emissions, respectively. Fatima et al. [27] explored the main drivers of the CO2 emissions in China’s industry during 1991–2016, combined with the labor force effect through the LMDI approach. Zhang et al. [28] used the LMDI to decompose the CO2 emissions of energy consumption on both national and interprovincial scales and further quantify the impact of each industry on regional CO2 emissions. Wang et al. [29] decomposed the factors influencing CO2 emissions in Northeast China from an investment perspective based on the LMDI technique. Jia et al. [30] analyzed the driving forces of industrial energy consumption in Nanchang between 1998–2014 by using the LMDI decomposition analysis. Chen et al. [31] concentrated on CO2 emission reduction in the agricultural sector in China. Zhang et al. [32] focused on the heating energy consumption of the building sector in China by using LMDI to analyze and compare the evolution of CO2 emissions in five effects between 2004 and 2016. It can be seen that the LMDI model has a solid theoretical and practical basis. Therefore, it makes sense to use it in the electricity sector.
Some other literature studied the driving factors influencing CO2 emission change and electricity consumption in the electricity sector (Table 1). From the literature, it becomes obvious that most of the existing studies concentrate on the national [7,33,34,35,36,37] or provincial scale [11,38,39,40,41,42]. However, the factors influencing the CO2 emission growth in the electricity sector of the Yangtze River Delta (YRD) have not received enough attention. This fact will lead to a lack of targeted carbon mitigation policies and can be detrimental to the sustainable development of the YRD. The YRD is one of the most economically developed regions in China with high electricity demand, so its CO2 emissions from the electricity sector should be given sufficient attention. In addition, some scholars [38,39,40] used the clustering method to categorize provinces into different types and make policy recommendations for each category. However, due to the different clustering criteria adopted by different scholars, the results of clustering vary a lot, and the provinces of the same category are often spatially discontinuous. This can result in difficulties in the implementation of the policy.
Moreover, the existing studies on the decomposition of electricity consumption and CO2 emissions in the electricity sector mainly considered electricity production [11,41] or consumption factors [7,33,36,37,40,42,43]. Nevertheless, few studies considered the factors of electricity trade, transmission, and other macro factors systematically. The factors affecting CO2 emissions in the electricity sector are multifaceted. Thus, the analysis of CO2 emission drivers of the electricity sector from various aspects needs to be systematic and thorough in order to understand the corresponding multifaceted effect. What’s more, SDA is contracted on an input–output (I-O) table, which restricts its application scope. This creates inconvenience for related scholars in using SDA models [13,36,37,43]. On the contrary, IDA is more diverse in decomposition forms than SDA.
Compared with existing studies, the primary contributions of this paper are as follows:
(1) this study is the first to explore the factors influencing CO2 emissions in YRD’s electricity sector, and the decomposed results of YRD’s electricity sector are compared with other regional grids;
(2) the decomposition involves the whole process of electricity production, trade, transmission, and consumption;
(3) the study period is extended to the year 2020, when we calculate the CO2 emissions and explore the driving factors of CO2 emissions change in China’s electricity sector.
To sum up, the electricity sector is a complex system, especially in the YRD of China. Thus, the CO2 emission of YRD’s electricity sector during 2000–2020 was first calculated in the present study and then evaluated from two systematical dimensions of the cross-region and whole process (production, trade, transmission, and consumption) by an extended LMDI. The data processing and the explanation of related theoretical methods are discussed in Section 2. The detailed results were analyzed and discussed in Section 3. Some reasonable conclusions and policy suggestions are listed in Section 4.

2. Data and Methodology

2.1. Data Description

In this study, the physical quantities of 21 fossil fuels, electricity transmission loss, and terminal electricity consumption from 2000 to 2020 are taken from the Energy Balance Table by Region in the China Energy Statistical Yearbook. Moreover, thermal power generation, total electricity production, and total electricity consumption in 30 provinces are also obtained from China Energy Statistical Yearbook. Among them, the energy consumption data of Ningxia in 2000–2002 and Hainan in 2002 were lost, so the interpolation method was used to fill in the data. In addition, the various parameters in accounting for CO2 emissions come from Wang et al. [41] (Table A1). Moreover, the population and GDP data are derived from the China Statistical Yearbook. To eliminate the influence of price change, gross domestic product (GDP) is dealt with at the 2015 constant price.
According to the “Electricity System Reform Plan” issued by the State Council in 2002, China’s power system is divided into six regional power grids. They are North China Power Grid (NG), Northeast China Power Grid (NEG), East China Power Grid (EG), Central China Power Grid (CG), Northwest China Power Grid (NWG), and South Power Grid (SG). It is worth noting that the YRD and Fujian are included in the EG. Therefore, YRD is treated as a separate region, and Fujian is integrated into the SG (Figure 1 and Table A2).

2.2. Method of CO2 Emission Inventory

The CO2 emission of China’s electricity sector is measured based on the methodology provided by the Intergovernmental Panel on Climate Change (IPCC) [44]. CO2 emissions are calculated for 21 types of fossil energy, including coal, oil, and natural gas. The formula for calculating CO2 emission is as follows:
C = i = 1 21 E i N C V i N i O i 44 / 12 ,
where C is CO2 emissions from the electricity sector, the subscript i denotes fuel type, Ei is the physical amount of different energy consumption, NCVi represents the average net calorific value of diverse energy, Ni denotes the carbon content per unit calorific value of different energy sources, Oi refers to the carbon oxidation rate of i energy, and 44 / 12 is the conversion factor for CO2.

2.3. LMDI Model

The LMDI method is established to decompose the CO2 emissions of the provincial electricity sector. The decomposition formula for the change in CO2 emissions from electricity generation in a year is given as follows:
C = i = 1 21 C i = i = 1 21 C i E i E i E E T P T P E G E G E C E C = i = 1 21 C C i S i I E S E T E C ,
where Ci denotes the amount of CO2 emissions of the i-type energy, E refers to energy consumption, TP is thermal power generation, EG represents total electricity production, and EC is the total electricity consumption. CCi, Si, I, ES, and ET refer to the CO2 emission factor of the i-type energy, energy structure, energy efficiency, electricity structure, and electricity trade, respectively.
Based on the LMDI model [45,46], the decomposition formula of CO2 emission change in the electricity sector can be expressed as follows:
Δ C = C T C t = Δ C C C + Δ C S + Δ C I + Δ C E S + Δ C E T + Δ C E C ,
where T and t are the terminal and base year, respectively. ΔCCC is the CO2 emission factor effect, which takes the value of zero since the CO2 emission factors of various energy sources are constant in this study. ΔCS, ΔCI, ΔCES, ΔCET, and ΔCEC are the energy structure effect, energy efficiency effect, electricity structure effect, electricity trade effect, and electricity consumption scale effect, respectively. They represent the effect of the change in Si, I, ES, ET, and EC on the CO2 emission growth from t to T year, respectively.
ΔCS, ΔCI, ΔCES, ΔCET, and ΔCEC are calculated as follows [38]:
Δ C S = i = 1 21 C i T C i t ln C i T C i t ln S i T S t
Δ C I = i = 1 21 C i T C i t ln C i T C i t ln I i T I t
Δ C E S = i = 1 21 C i T C i t ln C i T C i t ln E S i T E S t
Δ C E T = i = 1 21 C i T C i t ln C i T C i t ln E T i T E T t
Δ C E C = i = 1 21 C i T C i t ln C i T C i t ln E C i T E C t
Only factors from the production and consumption process of the electricity industry are included in the decomposition. This is inadequate to provide a systematical decomposition of the factors influencing CO2 emissions in the electricity sector. The influence of electricity transmission and social macro factors should also be considered. Thus, we further decomposed EC depending on the following [38]:
E C = E L + F ,
where EL represents the electricity transmission loss, and F is the terminal electricity consumption.
F can be decomposed as follows:
F = F A A P P = E I G P ,
where A refers to GDP, and P is the population scale. EI and G refer to electricity intensity and economic activity, respectively.
Therefore, the driving factors contributing to the change in terminal electricity consumption can be shown as follows:
Δ C E C = Δ C E C T Δ C E C t = Δ C E L + Δ C E I + Δ C G + Δ C P ,
where ΔCEL, ΔCEI, ΔCG, and ΔCP are the electricity transmission loss effect, electricity intensity effect, economic activity effect, and population scale effect, respectively. They are the impacts of changes in EL, EI, G, and P on the CO2 emission growth from t to T year, respectively.
The calculation formula is shown below [38]:
Δ C E L = Δ C E C E L T E L t E C T E C t
Δ C E I = Δ C E C E C T E C t F T F t ln F T F t ln E I T E I t
Δ C G = Δ C E C E C T E C t F T F t ln F T F t ln G T G t
Δ C P = Δ C E C E C T E C t F T F t ln F T F t ln P T P t
It should be noted that these factors can be divided into non-electricity mix effect (ΔCNEM) and electric mix effect (ΔCEM). Non-electricity mix effect can include energy structure, energy efficiency, economic activity, and population scale. This is because these factors are macro variables mainly affected by the social environment and overall development status throughout the country. In contrast, the effects of electricity structure, electricity trade, electricity transmission loss, and electricity intensity are micro variables that only exist in the electricity system itself. So, they can be called as electricity mix effect. They are directly influenced by the whole process of production, distribution, transportation, and consumption of electricity. Thus, the decomposition analysis of this article focuses on the following two steps. First, it concentrated on comparing the differences between regions and provinces from the perspective in terms of four macro effects and the electricity mix effect. Second, the impact of four micro effects on each region and province is further analyzed to explore more targeted low-carbon development paths for the electricity sector of YRD.

3. Results

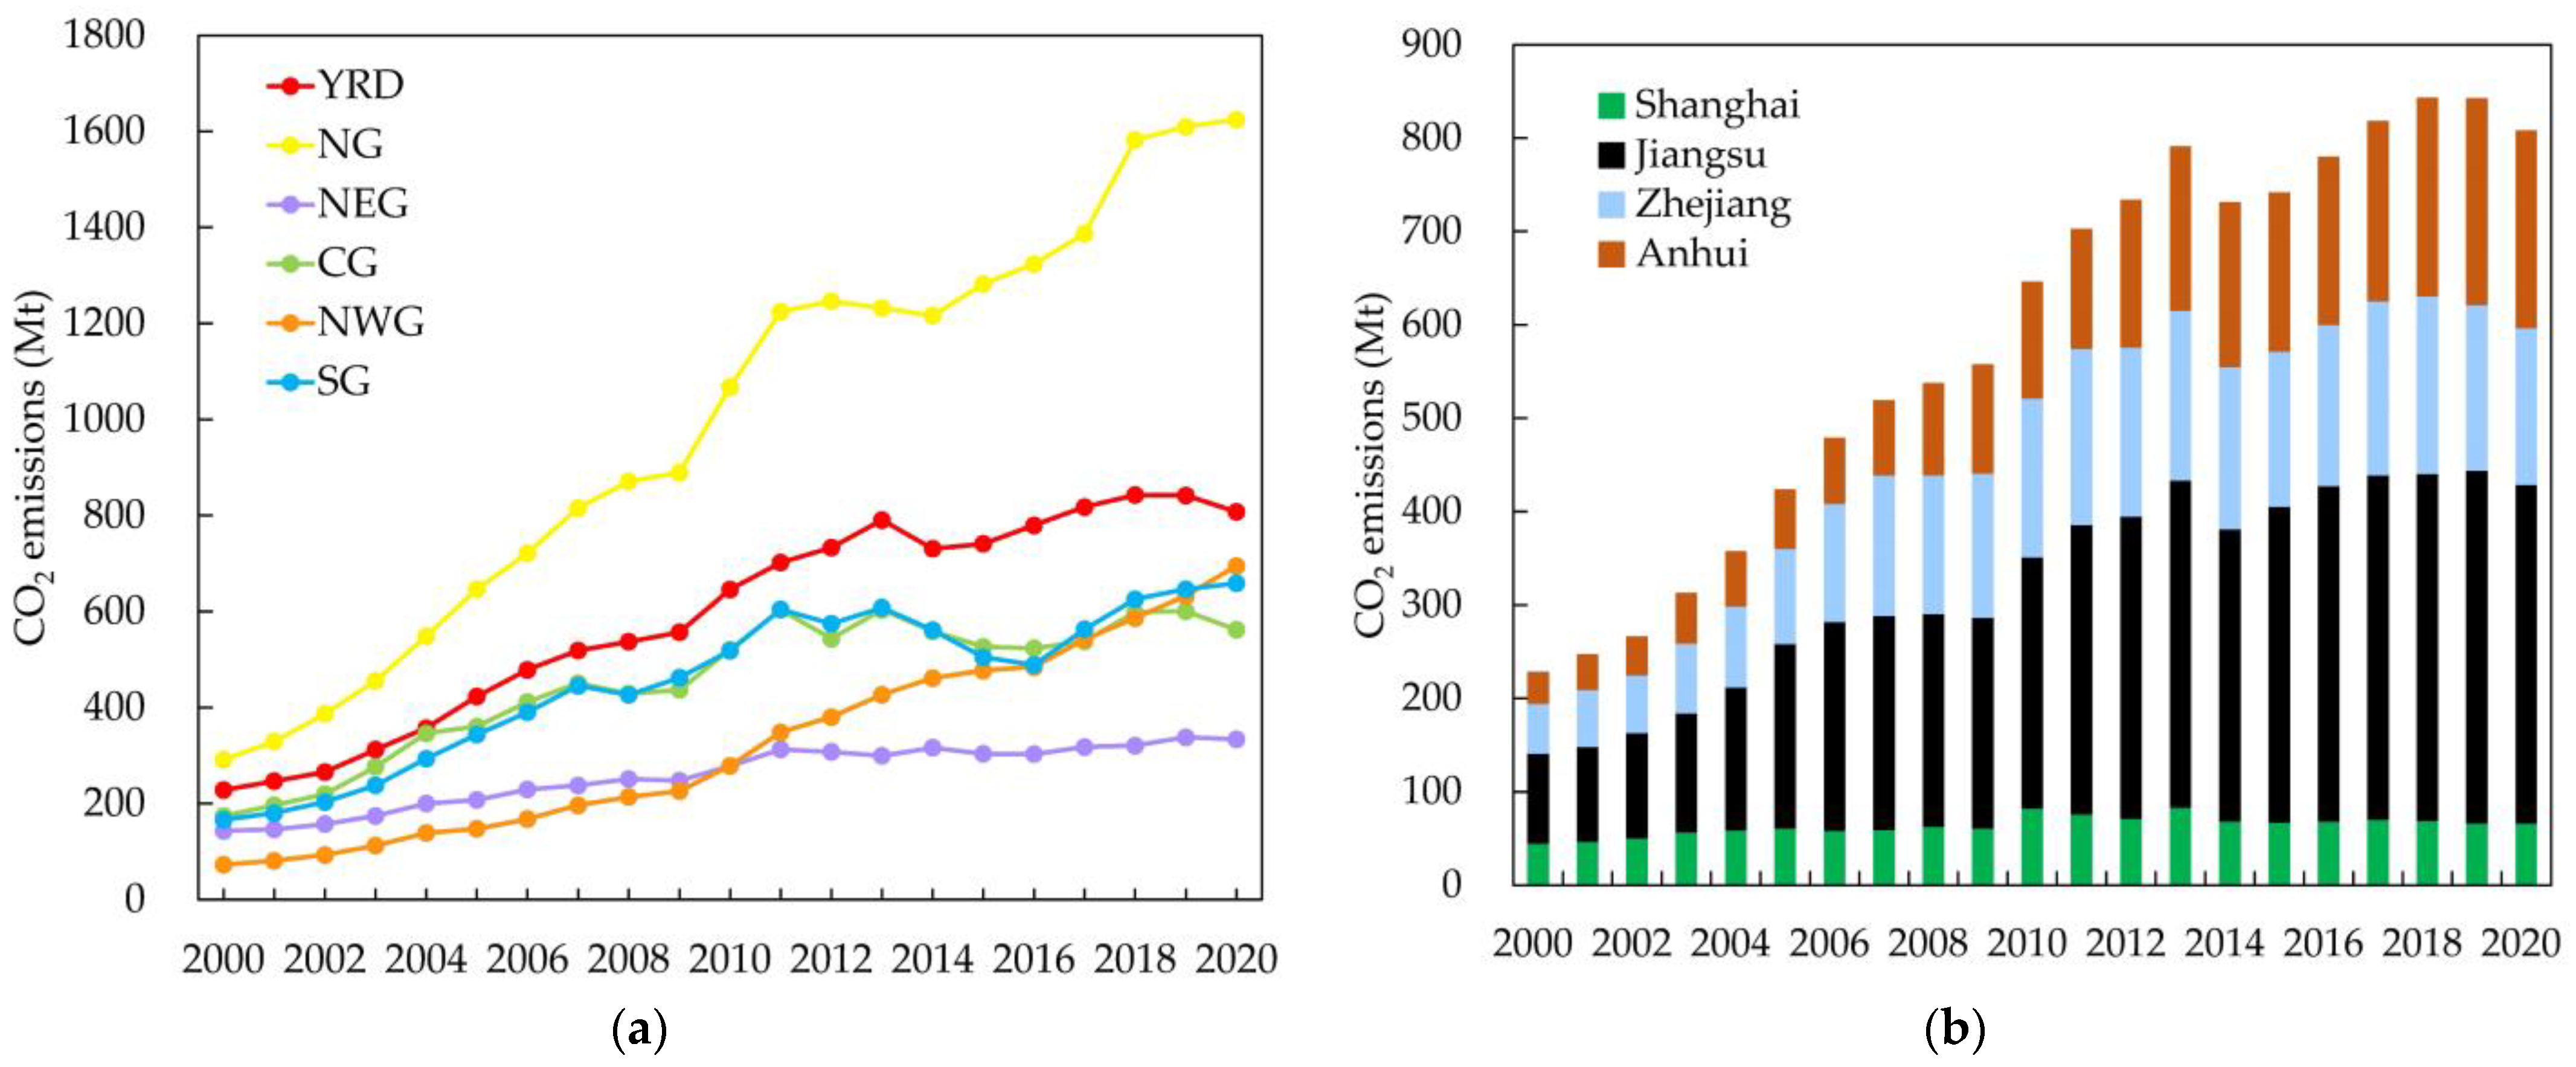
3.1. CO2 Emissions of the Electricity Sector

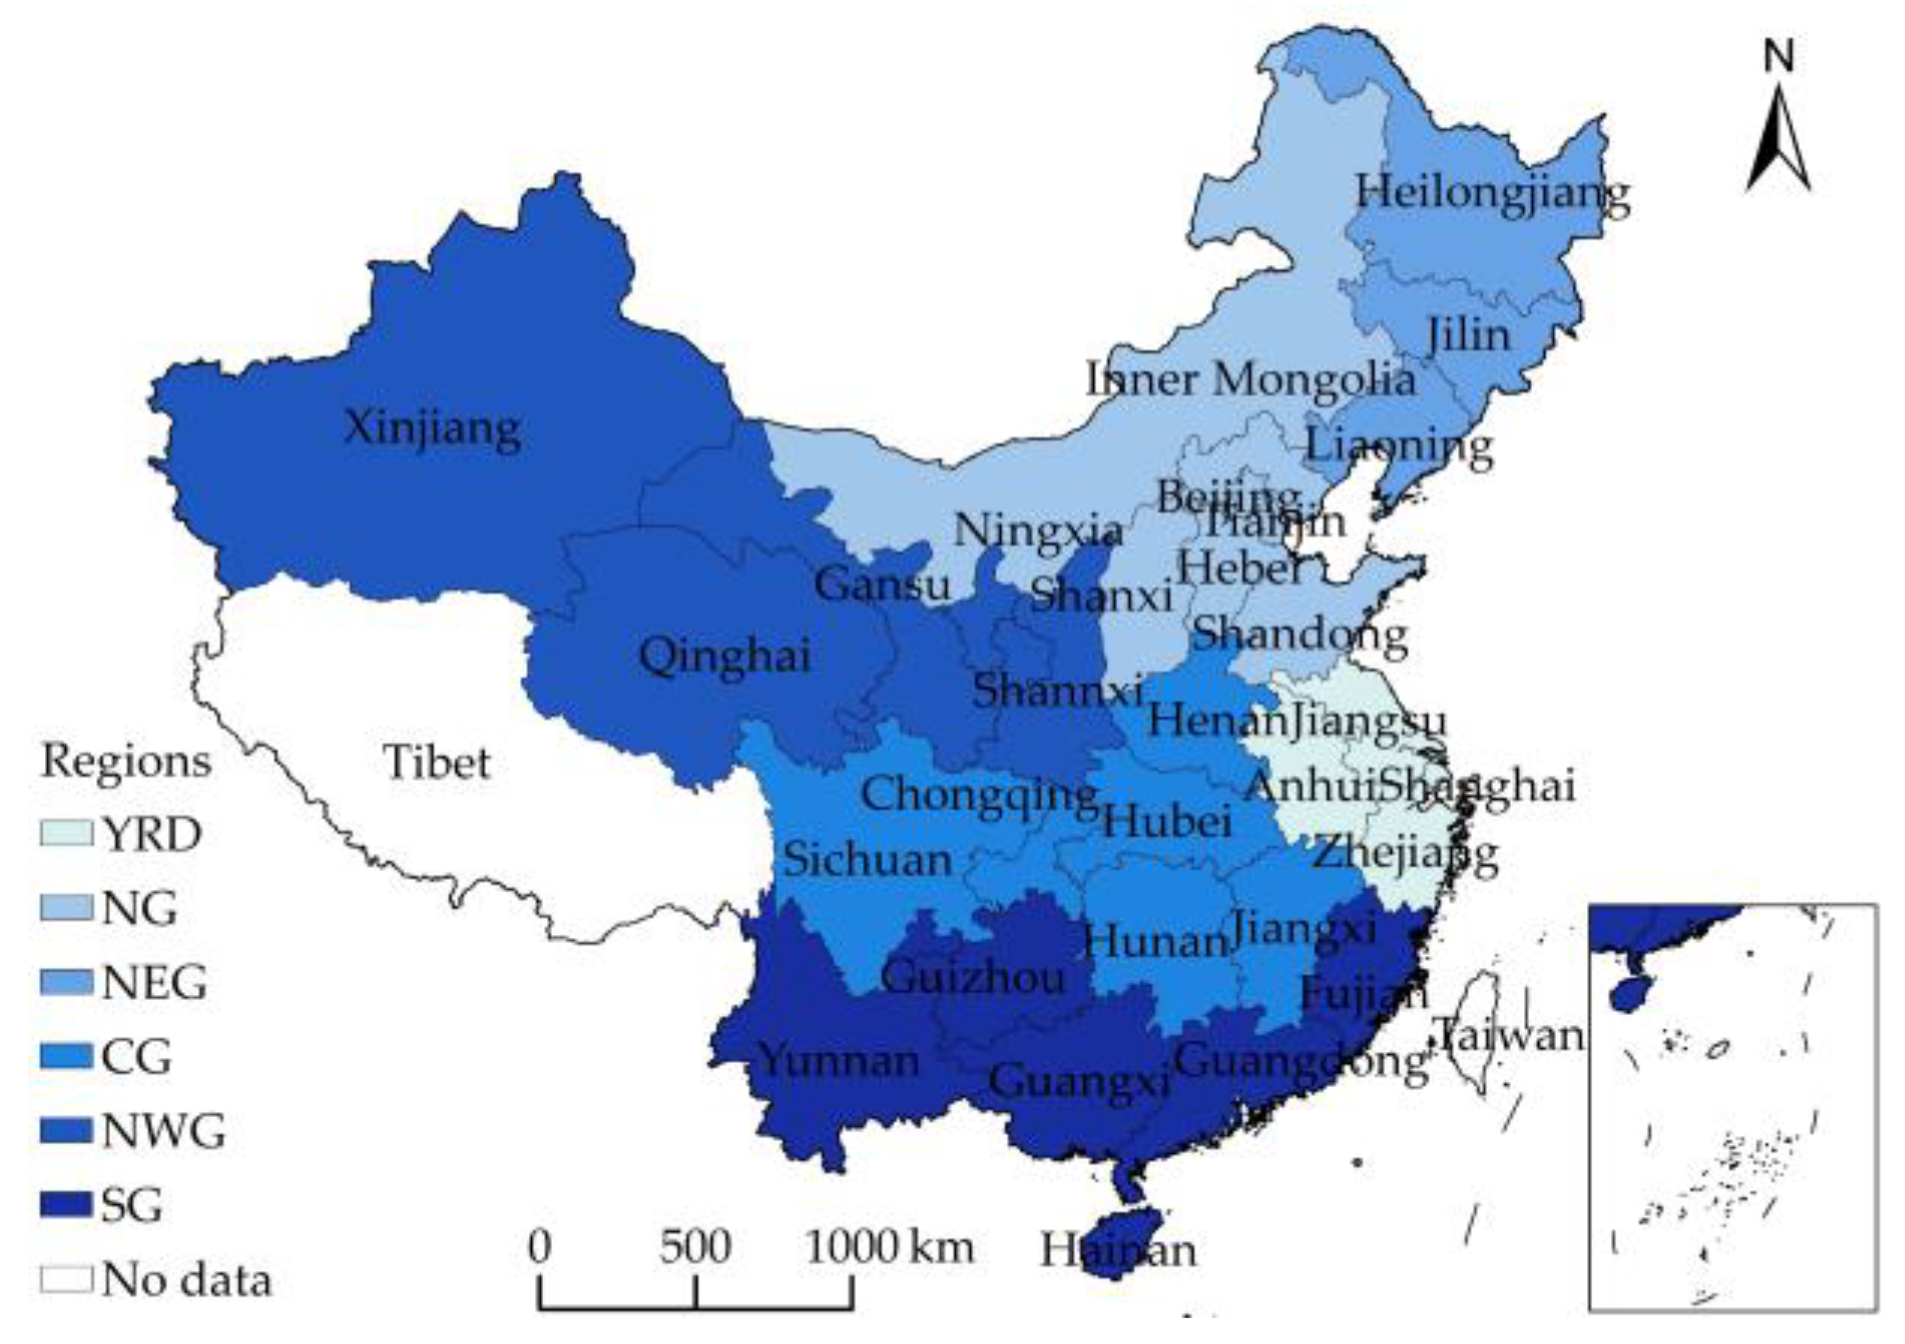
3.1.1. Regional CO2 Emissions of the Electricity Sector

Figure 2a represents the CO2 emissions of the electricity sector in six regions from 2000 to 2020. NG and YRD accounted for more than half of the cumulative CO2 emissions, with contributions of 32.29% and 19.23%, respectively. They were followed by SG (14.78%), CG (14.75%), NWG (10.52%), and NEG (8.44%). Among them, the CO2 emissions of YRD consistently ranked second during the study period. The reason might be that YRD is located in an area with a large number of industries and a massive population. Therefore, it is urgent for the YRD region to build a green and low-carbon electricity system. It can be clearly seen that the CO2 emissions of YRD increased from 228.12 million Metric tons (Mt) in 2000 to 807.55 Mt in 2020 (Figure 2a), with an average annual growth rate of 6.52%. Particularly during 2000–2013, YRD’s CO2 emissions from the electricity sector showed a remarkable increasing trend, with an average annual growth rate of 10.03%. This can be explainable because after China joined the World Trade Organization (WTO) in 2001, being the frontier area of reform and opening up, YRD was extremely active in foreign trade. Thus, the CO2 emissions from electricity consumption were rising quickly. Nevertheless, the growth of YRD’s CO2 emissions slowed down significantly from 2013 to 2020, with an average annual growth rate of only 0.31%. There were three years (2014, 2019, and 2020) in which the CO2 emissions showed negative growth. What were the reasons? On the one hand, this might be because in the context of the “new normal”, the YRD focused on adjusting the economic structure and eliminating backward production capacity; meanwhile, traditional thermal power was gradually replaced by renewable energy generation. Furthermore, the decline in CO2 emissions in 2020 might be attributed to the influence of the COVID-19 pandemic in slowing down the economy.
It is to be noted that although CO2 emission growth slowed sharply in YRD, the total amount of CO2 emissions was still huge. Therefore, it is of great importance to seek a low-carbon development path to achieve the national carbon peak target and regional sustainable development, especially in the electricity sector of the YRD.

3.1.2. Provincial CO2 Emissions of the Electricity Sector

Figure 2b represents the CO2 emissions of the electricity sector in four provinces from 2000 to 2020. In 2020, CO2 emissions by province, in descending order, were Jiangsu (362.25 Mt), Anhui (210.25 Mt), Zhejiang (167.82 Mt), and Shanghai (67.22 Mt). The ratio of CO2 emissions from the electricity sector in Jiangsu reached 44.86% in 2020, and it maintained first place in YRD during the study period. This result indicates that Jiangsu is a key province for carbon reduction in the YRD’s electricity sector. It is very important for Jiangsu to accelerate the green transformation within the electricity system. On the other hand, Anhui’s CO2 emissions from the electricity sector grew at the fastest growth rate from 2000 to 2020. The average annual growth rate was 9.71%. Therefore, Anhui should be cautious in approving new thermal power plant projects and should adopt new technologies to improve the efficiency of electricity generation.
From 2000 to 2010, the CO2 emissions of all provinces showed an increasing trend, and the changes were in the descending order of Jiangsu (172.42 Mt), Zhejiang (116.69 Mt), Anhui (90.71 Mt), and Shanghai (37.73 Mt). However, during the period 2010–2020, the situation changed dramatically. The changes in CO2 emissions in this period were in descending order in Jiangsu (93.28 Mt), Anhui (86.60 Mt), Zhejiang (−2.39 Mt), and Shanghai (−15.62 Mt). So, it is very obvious that the incremental CO2 emissions of each province from 2010 to 2020 have been reduced. In particular, Shanghai and Zhejiang presented negative growth. This result might be mainly because the national policy of energy saving and emission reduction had exerted influence and had an effect. For example, the “Action Plan for Energy Conservation and Emission Reduction and Low Carbon Development for 2014–2015” and the “13th Five-Year Plan for Energy Development” set quantitative targets for energy conservation and emission reduction. In the process of implementing these above policies, Shanghai and Zhejiang effectively controlled the growth of CO2 emissions.

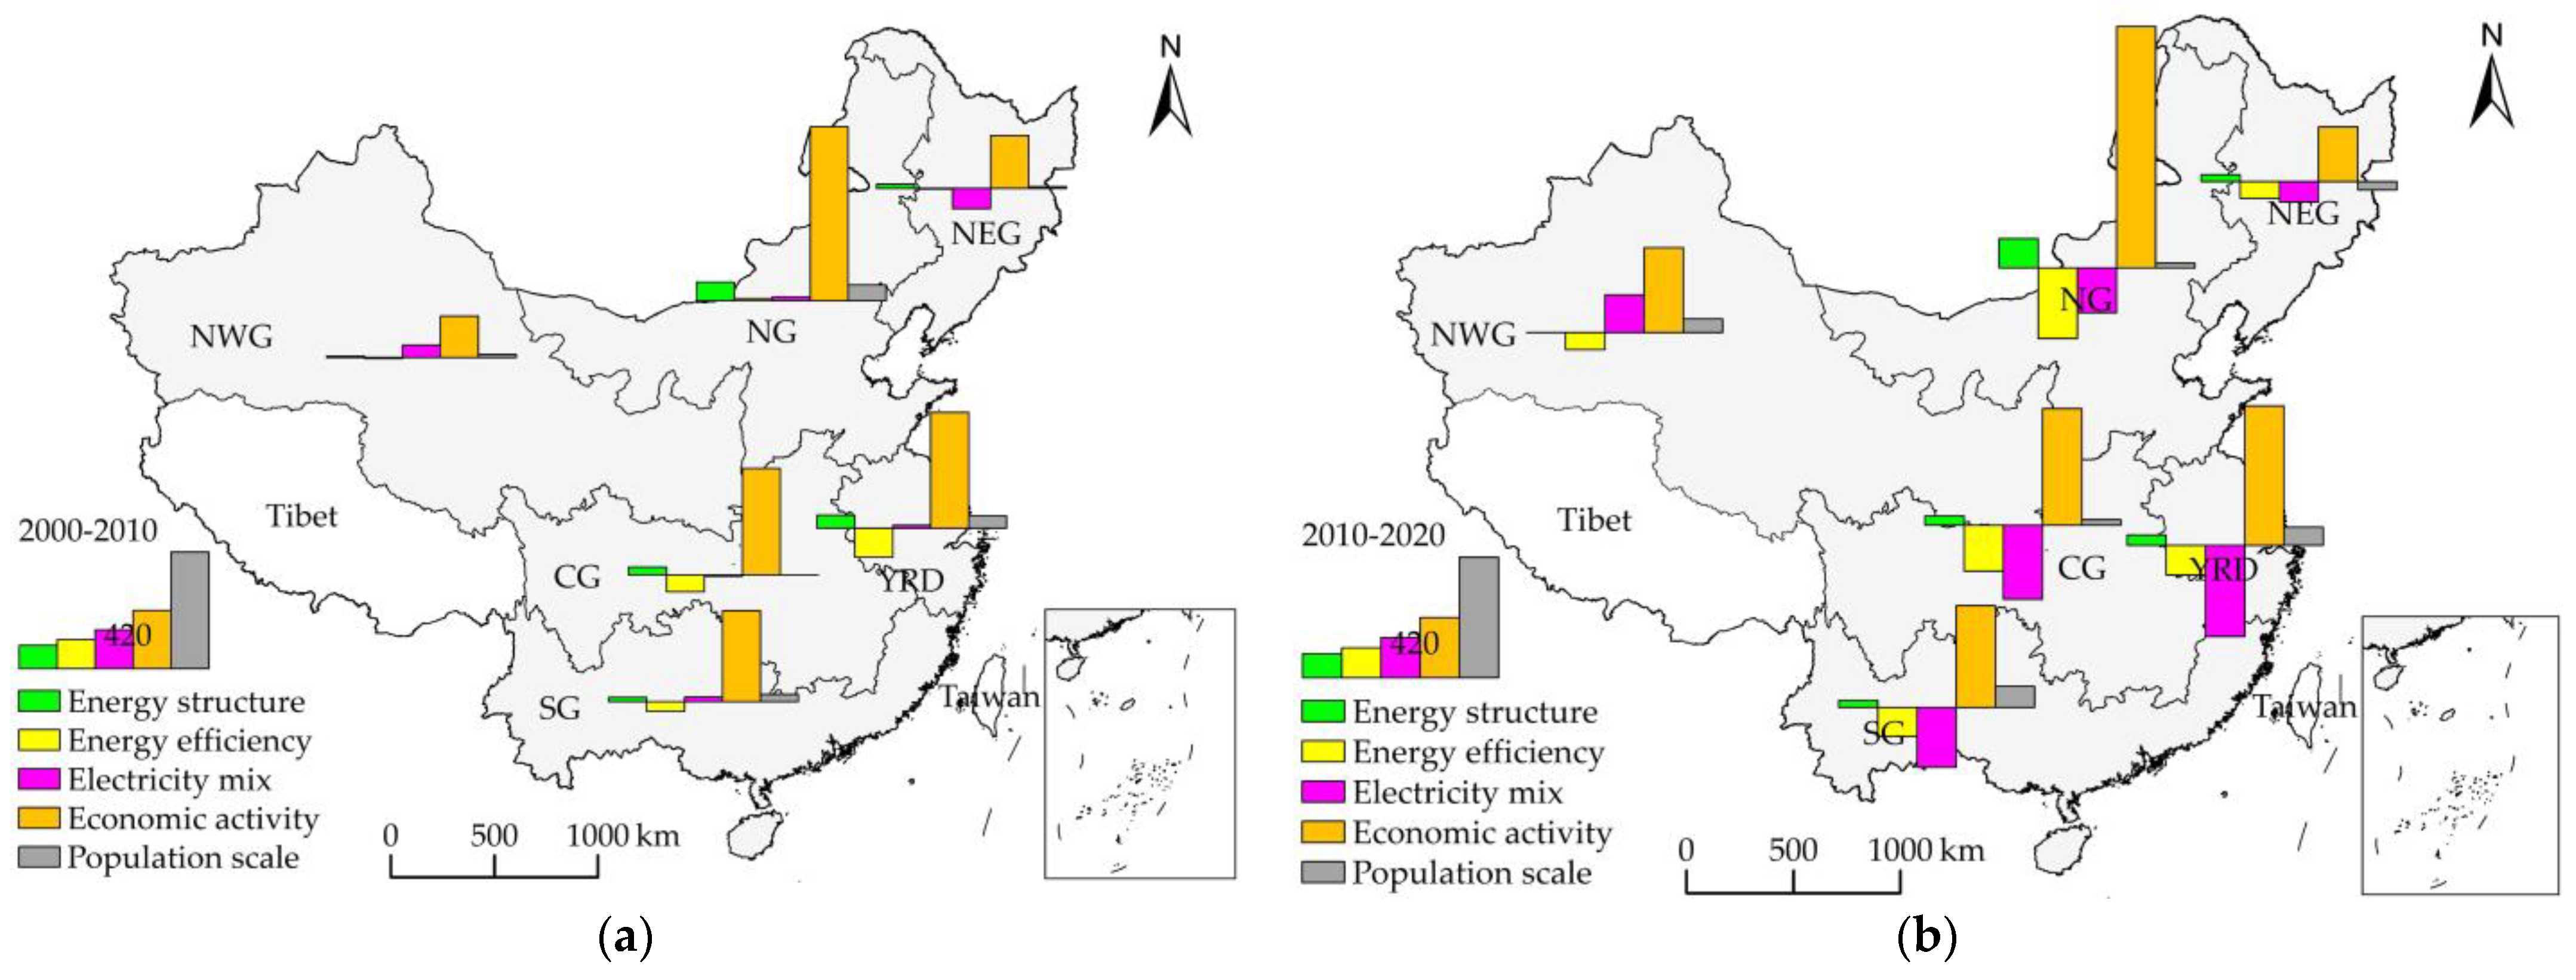
3.2. CO2 Emission Decomposition of the Electricity Sector from the Cross-Region Perspective

3.2.1. Decomposition Analysis of Regional CO2 Emissions of the Electricity Sector

The decomposition results of CO2 emission of the electricity sector from YRD, NG, NEG, CG, NWG, and SG during the periods of 2000–2010 and 2010–2020 are shown in Figure 3. Their corresponding contributions are shown in Table 2. From 2000–2010, it can be observed that the economic activity in all regions was the major driving factor behind the CO2 emission change in the electricity sector (Figure 3a and Table 2). It accounted for 58.13% of the national emission growth (Table 2). Moreover, energy structure and population scale also drove the CO2 emission growth in all regions, each driving the emission at 4.96% and 4.06%, respectively. It can also be observed that these effects have been slightly counterbalanced by the energy efficiency in most regions (except NG), with an average total contribution of −5.45%. This result indicates that the national policy of shutting down small thermal power plants and eliminating out-of-date production capacity has already had a positive impact on carbon abatement. It should be noteworthy that the overall impact of the electricity mix was minimal, with an average total contribution of only 0.22%.
A slowing down of the increased rates of CO2 can be easily seen during 2010–2020 in most regions (except NWG) when compared with 2000–2010. This result is related to the enhanced suppression effect of CO2 emissions from several factors. The most obvious factor is the electricity mix, which exerts a negative effect in most regions (except NWG), with a corresponding contribution of −24.43% (Figure 3b and Table 2). It is followed by energy efficiency, which played a role in carbon reduction in all regions, with a total contribution of −20.24%. This result indicates that the modernization of the electricity system and technological advances in the electricity sector can significantly reduce CO2 emissions. Hence, it is necessary to accelerate economic restructuring and improve the quality of economic development to avoid inefficient and disorderly expansion.
For the YRD, the driving factors during 2000–2010 included economic activity (417.53 Mt), energy structure (47.52 Mt), population scale (45.30 Mt), and electricity mix (11.11 Mt), all of which contributed to a total increase rate of 14.46% (Figure 3a and Table 2). These were counterbalanced by the effect in the energy efficiency (−103.91 Mt), which brought about an actual suppression in the CO2 emissions of −2.88%. Compared with other regions, YRD had larger incremental CO2 emissions in the electricity sector, with only energy efficiency playing a counterbalancing effect on the increasing state. As a frontier region in technology research and development, the use of advanced technologies in the YRD moderately reduced the consumption of fossil energy by electricity generation. In sum, the pressure of carbon reduction in the YRD’s electricity sector was huge during 2000–2010. Multiple measures were required to reduce CO2 emissions.
The CO2 emissions during 2010–2020 from the electricity sector of the YRD were moving in a green direction compared with 2000–2010. The reason is that electricity mix (−317.96 Mt) and energy efficiency (−103.86 Mt) played a crucial role in curbing the growth of CO2 emissions, with a total contribution of −8.82% and −2.88%, respectively (Figure 3b and Table 2). It shows that the electricity sector in the YRD made remarkable achievements in carbon reduction. Consequently, there is no doubt that the electricity sector of YRD should keep working on these domains and take the path of low-carbon development. However, it is worth noting that economic activity (485.83 Mt) remained the dominant factor in the increase of CO2 emissions in YRD, with a total contribution of 13.47%. Given that the YRD is in a leading position of economic transformation and deserves to be a model of economic development for the other regions, it should pay more attention to promoting high-tech industries and focus on the ecological benefits of economic development. Moreover, the population scale (62.34 Mt) and energy structure (35.53 Mt) were also the driving factors in the increase in CO2 emissions in YRD, with a total contribution of 1.73% and 0.99%, respectively (Table 2). Thus, the YRD government should encourage people to form a green lifestyle and, at the same time, strive to reduce its energy dependence on electricity from coal.
Based on the above analysis, it is clear that the YRD has great potential for CO2 reduction in the electricity system. In particular, it is necessary to take advantage of advanced technologies to further enhance the inhibiting effect of electricity mixing effect on CO2 emissions, as well as to improve energy utilization efficiency. In addition, improving the quality of the economy is a more urgent task, and the YRD should become a model for the economic development of other regions.

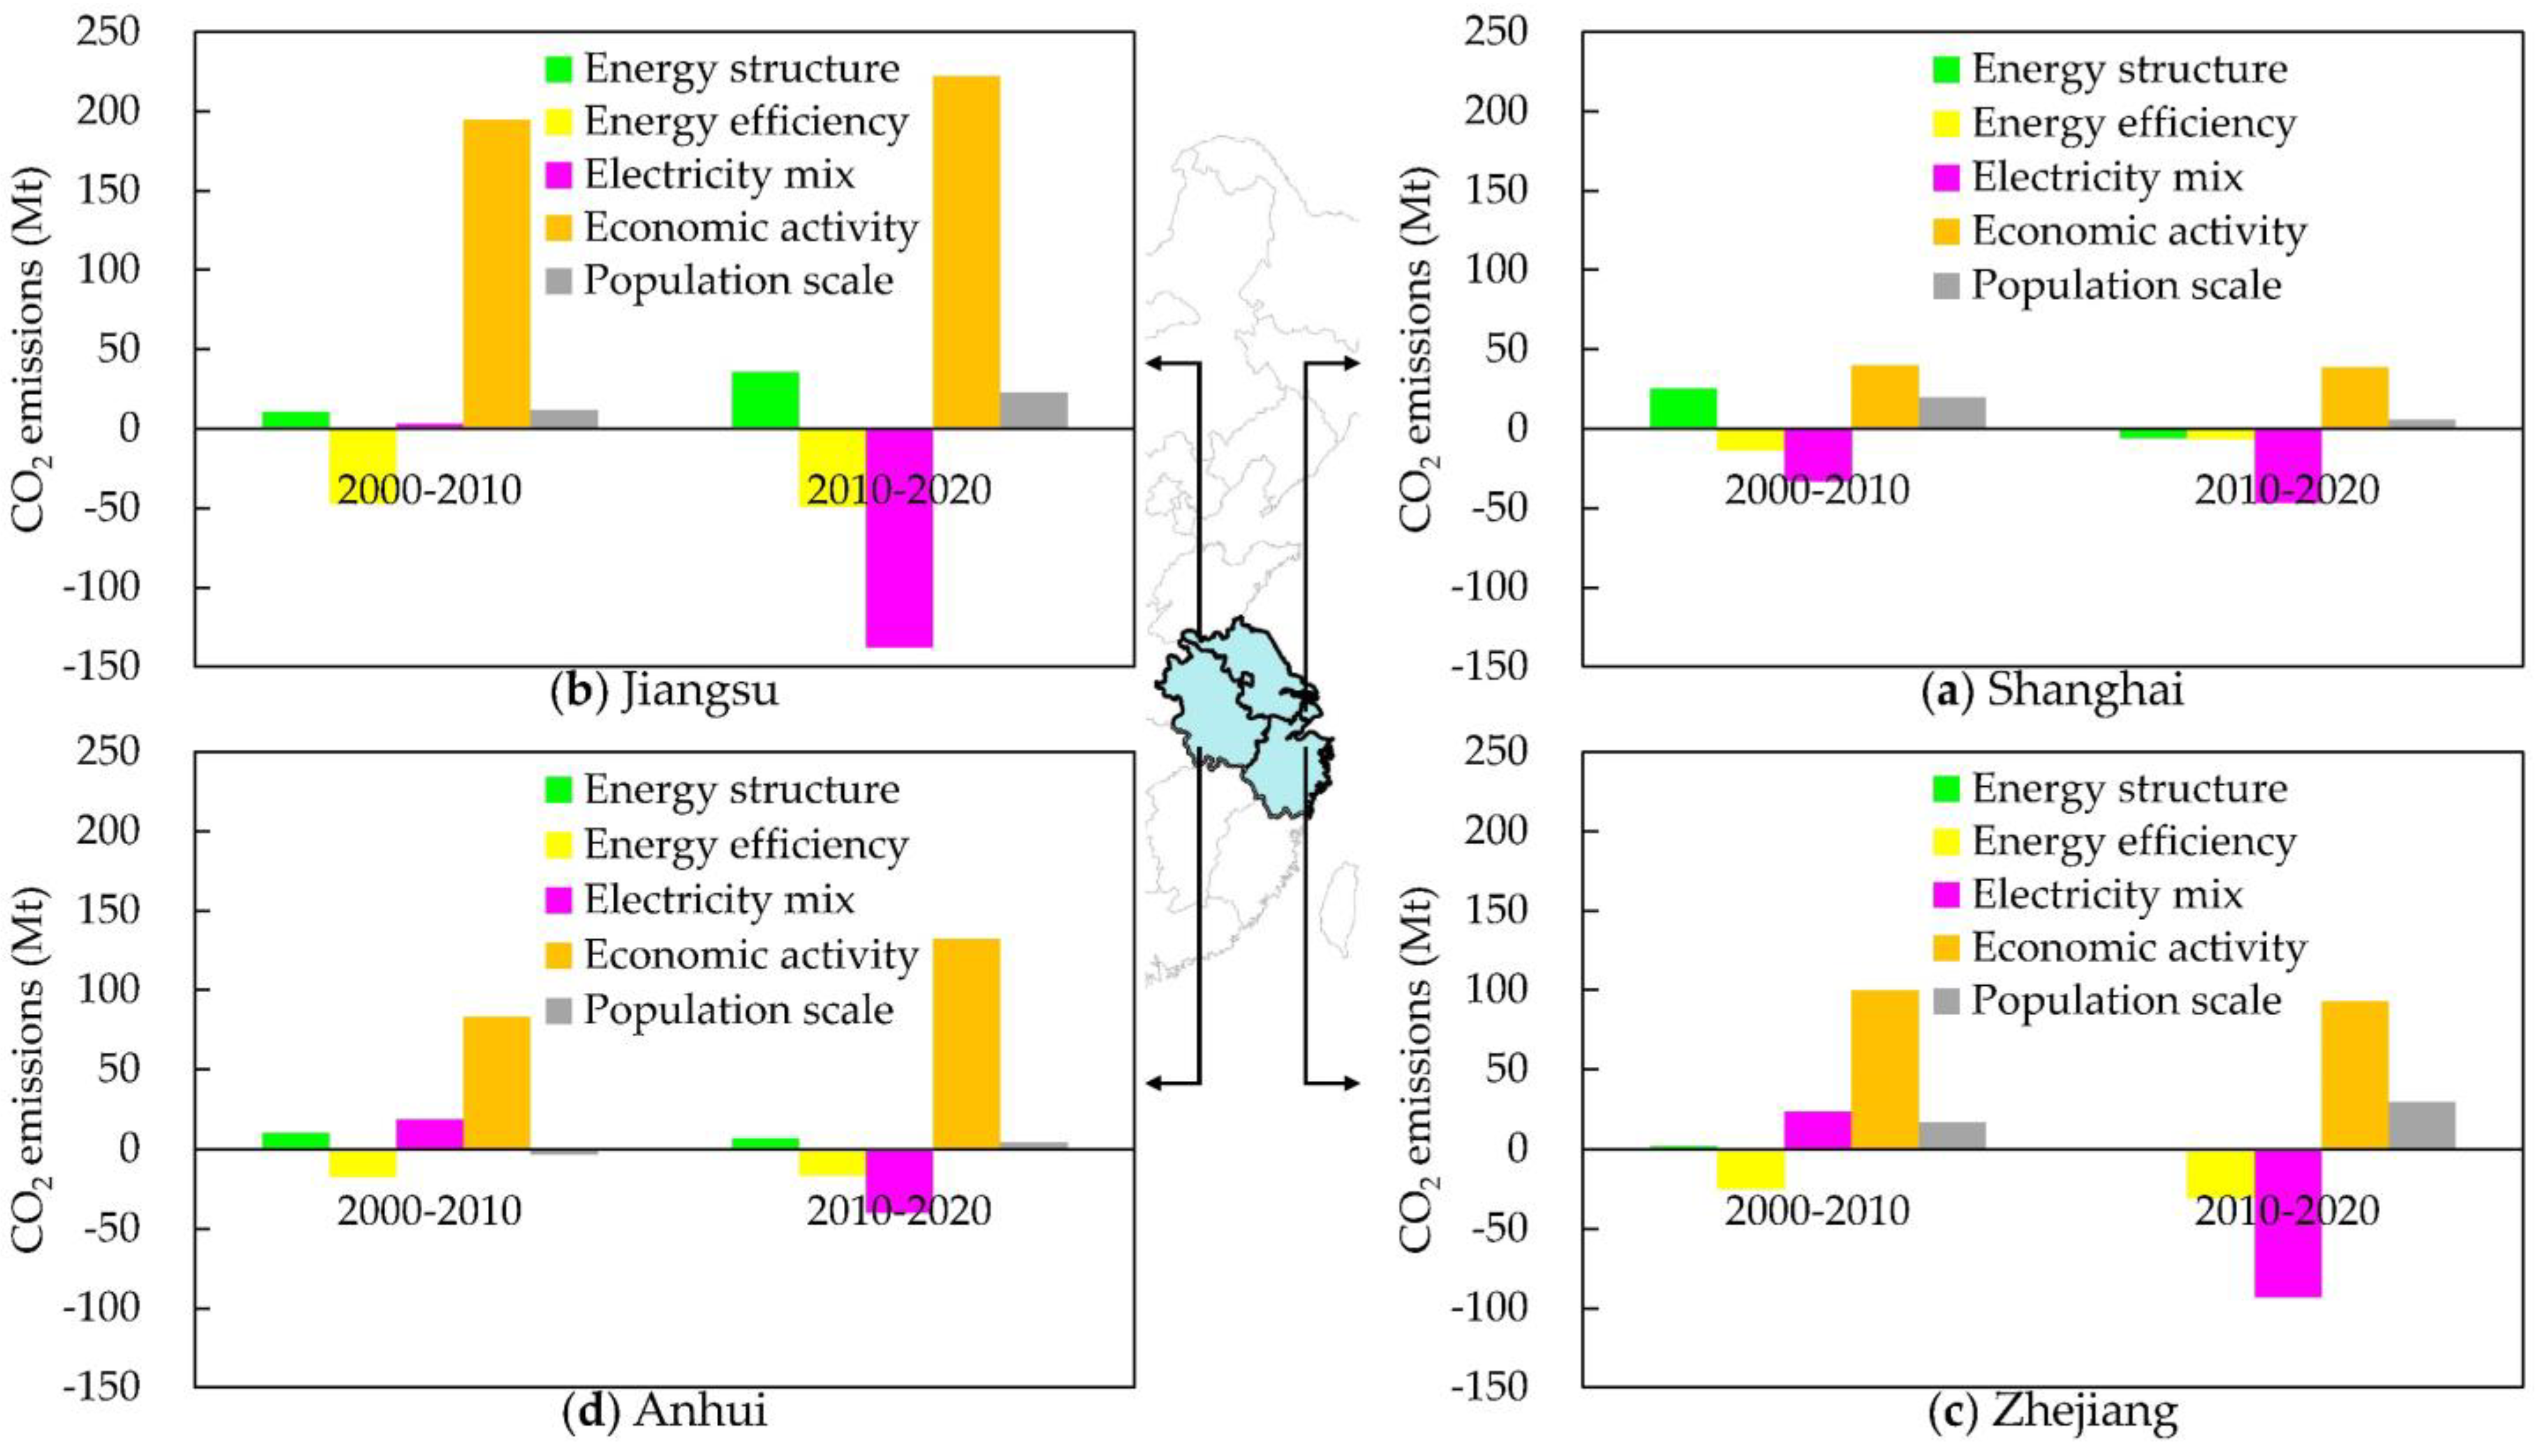
3.2.2. Decomposition Analysis of Provincial CO2 Emissions of the Electricity Sector

The decomposition results of CO2 emission of the electricity sector from Shanghai, Jiangsu, Zhejiang, and Anhui during the periods of 2000–2010 and 2010–2020 are shown in Figure 4. Their corresponding contributions are shown in Table 3. It can be seen that the different factors changed quite dramatically between the two study periods for each province. Electricity mix and energy efficiency played an important role in curbing CO2 emissions in all provinces from 2010–2020. On the other hand, economic activity was still the most critical and driving factor in the increase of CO2 emissions in each province. Moreover, the population scale had an increasingly positive effect on the CO2 emissions in all provinces, while the energy structure began to inhibit the growth of CO2 emissions in Shanghai and Zhejiang during 2010–2020.
From 2000 to 2010, the energy structure always had a positive impact on CO2 emission growth in all provinces. The corresponding increasing amounts of Shanghai, Jiangsu, Anhui, and Zhejiang were 25.30 Mt, 10.47 Mt, 9.89 Mt, and 1.85 Mt, and the contribution rates to total CO2 growth were 4.37%, 1.81%, 1.71%, and 0.32%, respectively (Figure 4 and Table 3). Nevertheless, energy structure started to have an inhibiting effect on the CO2 emissions in Shanghai (−6.15 Mt) and Zhejiang (−0.75 Mt) during 2010–2020, while it still had an increasing effect on the CO2 emissions in Jiangsu (25.55 Mt) and Anhui (6.88 Mt) (Figure 4). This result indicates that the energy structure of thermal power generation in Jiangsu and Anhui has more potential for optimization, and it is urgent for Jiangsu to reduce its dependence on electricity from coal.
Energy efficiency had a mitigating impact on CO2 emission growth between 2000–2010. The corresponding changing effects (contributions) of Jiangsu, Anhui, Zhejiang, and Shanghai were −47.51 Mt (−8.20%), −25.05 Mt (−4.32%), −17.45 Mt (−3.01%), and −13.92 Mt (−2.40%), respectively (Figure 4 and Table 3). Similarly, it always had a mitigating impact on the growth of CO2 emissions in the four provinces between 2010–2020. The corresponding changing effects (contributions) were −49.61 Mt (−8.56%), −16.66 Mt (−2.88%), −30.86 Mt (−5.33%), and −6.72 Mt (−1.16%). It is worth noting that the mitigation effect in Shanghai weakened, which suggests that the YRD can continue to adopt more efficient facilities for electricity generation, especially in Shanghai.
Electricity mix played a role in curbing CO2 emissions only in Shanghai (−33.67 Mt) in 2000–2010 (Figure 4a). However, the situation changed dramatically in 2010–2020 because the electricity mix became the most significant inhibitor of CO2 emissions in Jiangsu, Zhejiang, Shanghai, and Anhui. Their corresponding changing effects (contributions) were −138.06 Mt (−23.83%), −93.12 Mt (−16.07%), −46.93 Mt (−8.10%), and −39.86 Mt (−6.88%) (Figure 4 and Table 3). This result indicates that carbon reduction in the electricity sector is worthy of more attention, the whole process of electricity generation in particular. Of course, the electricity mix needs to be explored in depth to propose more specific policy recommendations.
Economic activity has always had a driving impact on CO2 emission growth. The driving effects (contributions) of Jiangsu, Zhejiang, Anhui, and Shanghai were 194.55 Mt (33.58%), 99.89 Mt (17.24%), 83.05 Mt (14.33%), and 40.04 Mt (6.91%), respectively, in 2000–2010 (Figure 4 and Table 3). Similarly, their increasing effects (contributions) during 2010–2020 were 222.38 Mt (38.38%), 92.77 Mt (16.01%), 132.10 Mt (22.80%), and 38.58 Mt (6.66%). Economic activity was the most significant effect of increasing CO2 emissions in all provinces’ electricity sectors during the investigated period. The main reason is that YRD’s economy has been growing at a fast pace for a long time, which has, in turn, led to a rapid growth in industrial and residential demand for electricity. Although the economic activity effect drove the CO2 emission growth in all provinces, the annual data showed that the economic activity of the YRD experienced a downward trend after the “new normal” of the economy (Table A3). Thus, it is desirable for the YRD to accelerate economic restructuring and improve the quality of economic development, especially in Jiangsu and Anhui.
From 2000–2010, the population scale had an overall driving effect (except for Anhui). The corresponding changing effects (contributions) of Shanghai, Zhejiang, Jiangsu, and Anhui were 19.96 Mt (3.45%), 16.54 Mt (2.86%), 11.96 Mt (2.06%), and −3.17 Mt (−0.55%), respectively (Figure 4 and Table 3). Similarly, in 2010–2020, it also had a driving effect on the growth of CO2 emissions. Zhejiang had the largest effect on the population scale (5.10%) (Table 3). This result might be arising from a large number of jobs in the YRD, which could attract lots of people moving in from other regions. Consequently, it is worthwhile for the YRD to strengthen the education of people on electricity saving, especially in Zhejiang.

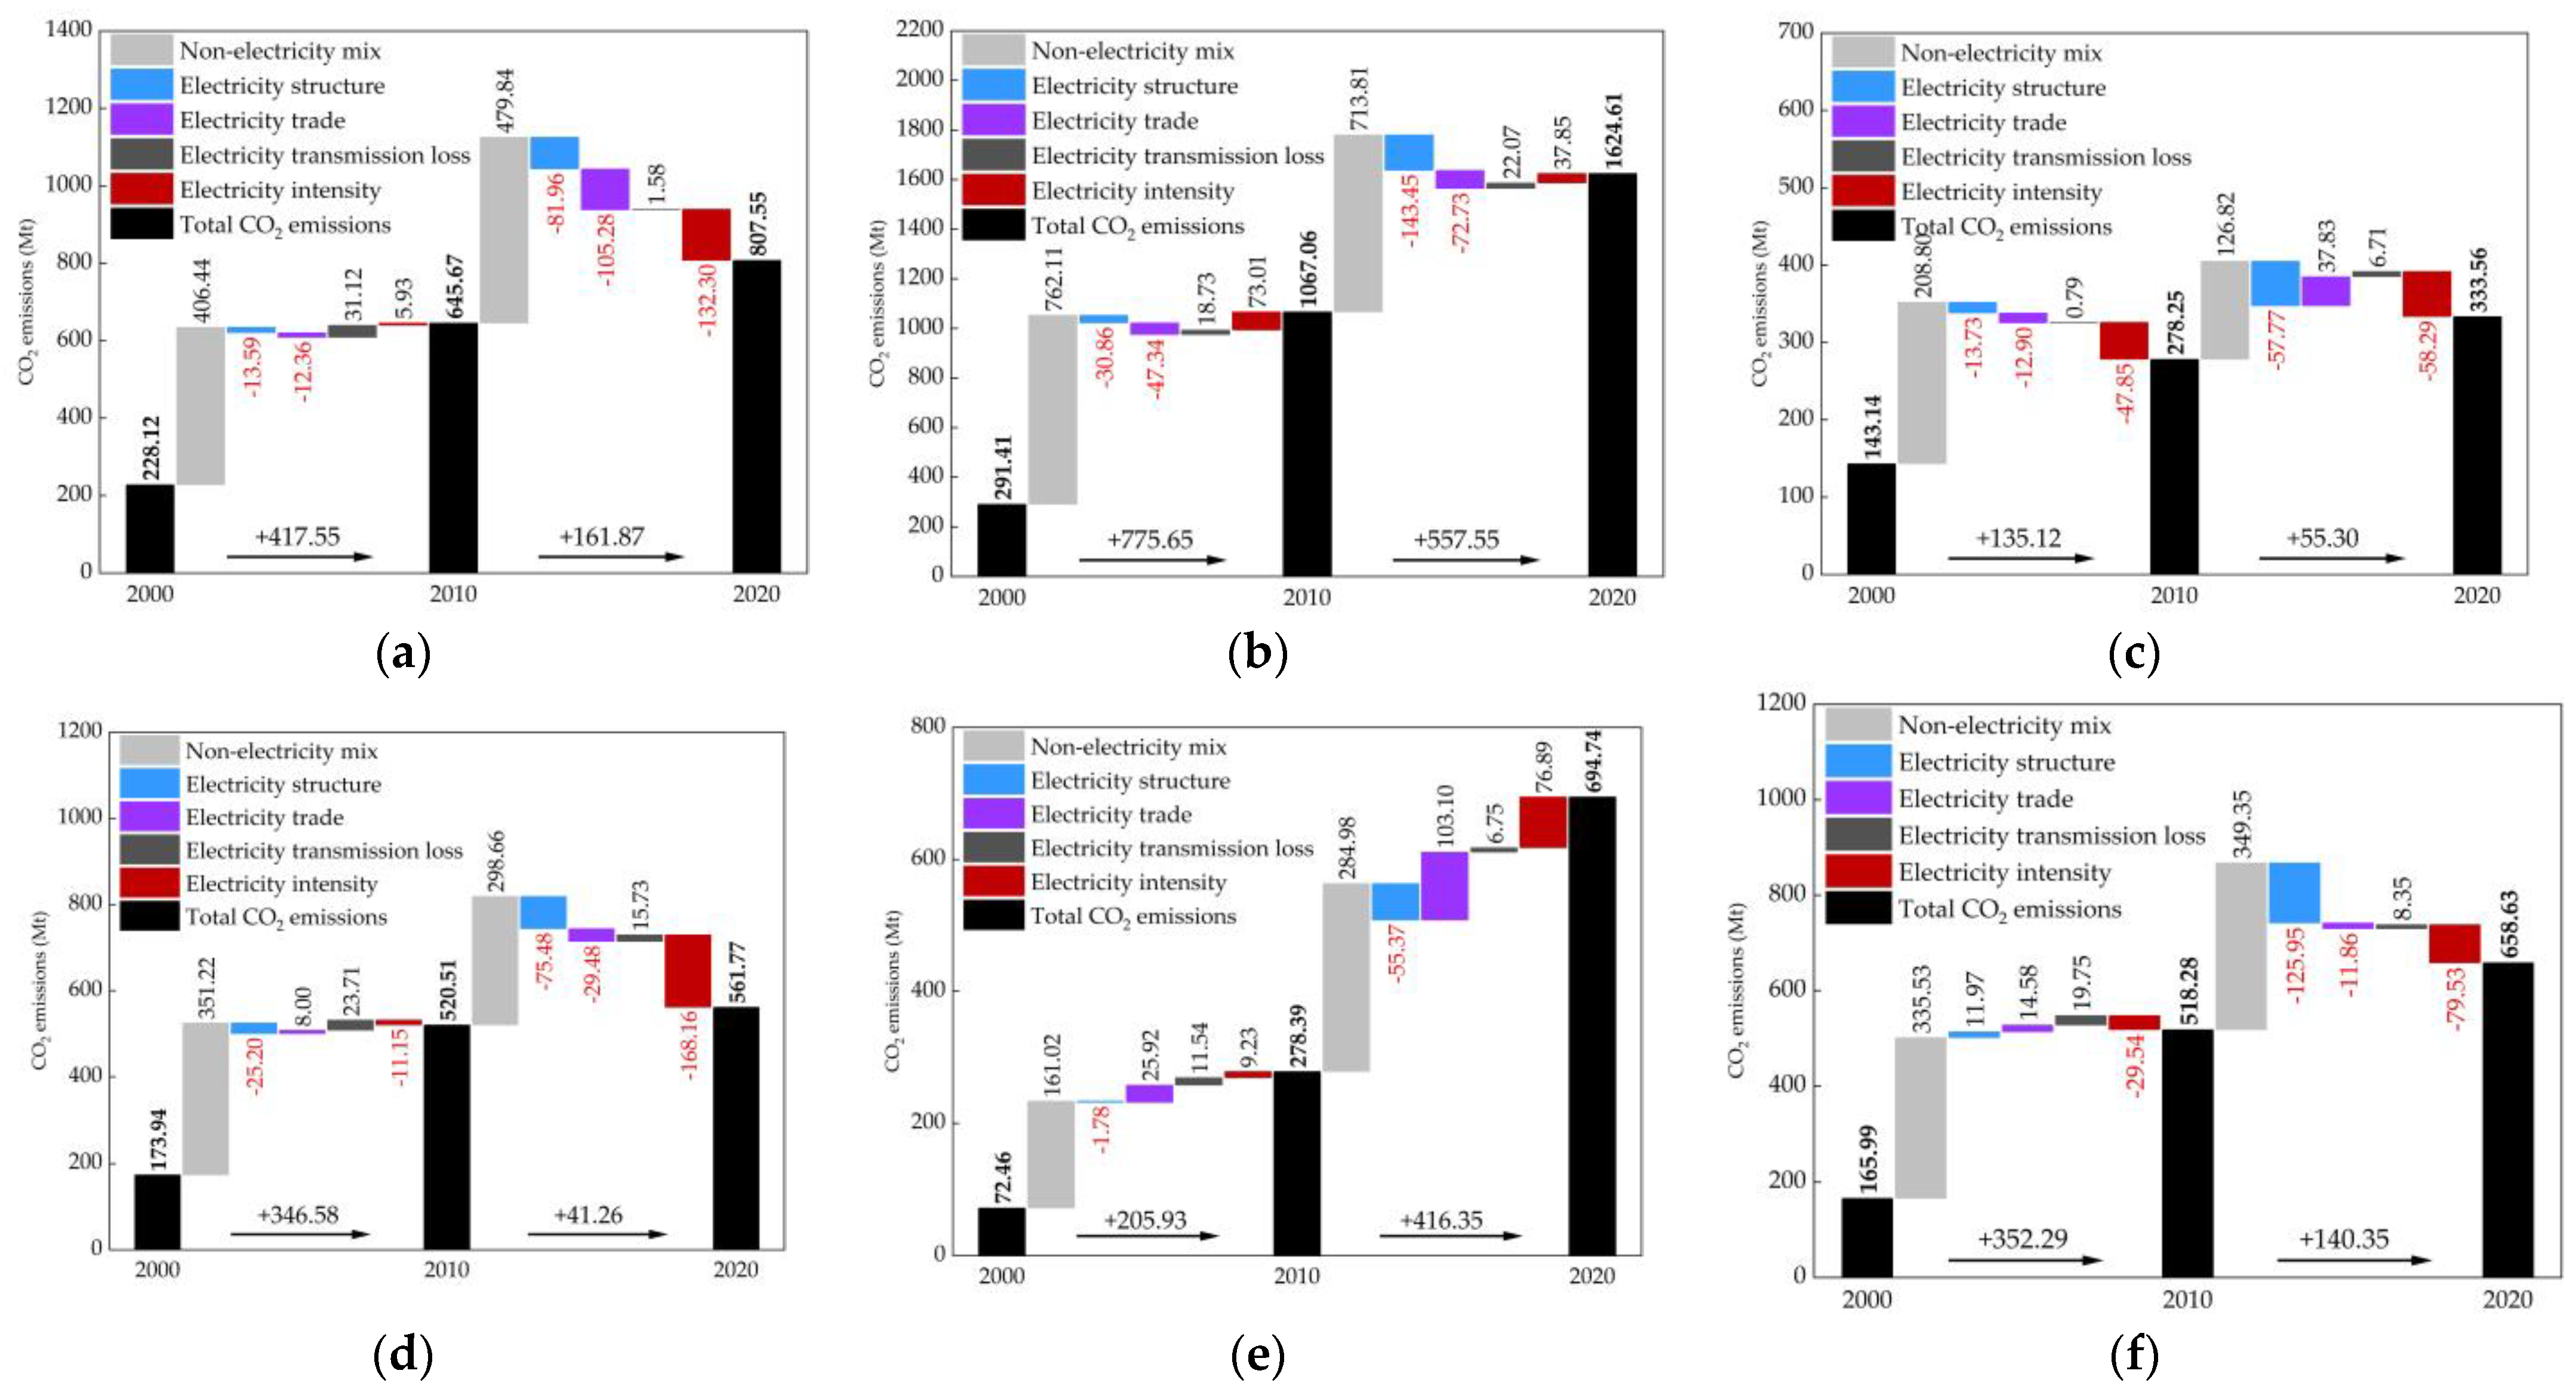
3.3. CO2 Emission Decomposition of the Electricity Sector from the Whole-Process Perspective

3.3.1. Decomposition Analysis of the Whole-Process Factors for Regional Electricity Sector

The decomposition results of whole-process factors of the electricity sector from YRD, NG, NEG, CG, NWG, and SG during the periods of 2000–2010 and 2010–2020 are presented in Figure 5. Their corresponding contributions are shown in Table 4. It can be seen that the changes in CO2 emissions in the YRD, NG, NEG, CG, NWG, and SG were 417.55 Mt, 775.65 Mt, 135.12 Mt, 346.58 Mt, 205.93 Mt, and 352.29 Mt, respectively, in 2000–2010 (Figure 5). The corresponding changes in these regions were 161.87 Mt, 557.55 Mt, 55.30 Mt, 41.26 Mt, 416.35 Mt, and 140.35 Mt in 2010–2020. So, the CO2 emissions increased in all regions during the study period. However, the growth rate of CO2 emissions in most regions (except NWG) decreased during 2010–2020 when compared with those in 2000–2010. This might be attributed to arising from the huge inhibiting effect of the electricity mix.
YRD: The electricity structure always had a mitigating impact on CO2 emission growth, with the change effects of −13.59 Mt and −81.96 Mt and the contributions of −0.38% and −2.27%, respectively, during the two periods of 2000–2010 and 2010–2020 (Figure 5a and Table 4). Similarly, electricity trade also always had a mitigating impact on CO2 emission growth, with the change effects (contributions) of −12.36 Mt (−0.34%) and −105.28 Mt (−2.92%), respectively. However, electricity transmission loss had an overall driving impact on CO2 emission growth, with the driving effects (contributions) of 31.12 Mt (0.86%) and 1.58 Mt (0.04%). The electricity intensity had an overall mitigating impact on CO2 emission growth, with the change effects (contributions) of 5.93 Mt (0.16%) and −132.30 Mt (−3.67%).
NG: Similarly, the electricity structure always had a mitigating impact on CO2 emission growth, with the change effects (contributions) of −30.86 Mt (−0.86%) and −143.45 Mt (−3.98%), respectively, during 2000–2010 and 2010–2020 (Figure 5b and Table 4). Electricity trade also always had a mitigating impact, with the change effects (contributions) of −47.34 Mt (−1.31%) and −72.73 Mt (−2.02%). However, electricity transmission loss always had a driving impact on CO2 emission growth, with increasing effects (contributions) of 18.73 Mt (0.52%) and 22.07 Mt (0.61%). Electricity intensity also always had a driving impact, with increasing effects (contributions) of 73.01 Mt (2.02%) and 37.85 Mt (1.05%).
NEG: Electricity structure always had a mitigating impact on CO2 emission growth, with the change effects (contributions) of −13.73 Mt (−0.38%) and −57.77 Mt (−1.60%), respectively, during 2000–2010 and 2010–2020 (Figure 5c and Table 4). Electricity trade had an overall driving impact, with increasing effects (contributions) of −12.90 Mt (−0.36%) and 37.83 Mt (1.05%). Electricity transmission loss always had a small but driving influence on CO2 emissions, with the changing effects (contributions) of 0.79 Mt (0.02%) and 6.71 Mt (0.19%). However, electricity intensity always had a strong mitigation influence on CO2 emissions, with the change effects (contributions) of −47.85 Mt (−1.33%) and −58.29 Mt (−1.62%).
CG: Electricity structure always had a mitigating impact on CO2 emission growth, with the change effects (contributions) of −25.20 Mt (−0.70%) and −75.48 Mt (−2.09%), respectively, during 2000–2010 and 2010–2020 (Figure 5d and Table 4). Electricity trade had an overall mitigation impact, with the change effects (contributions) of 8.00 Mt (0.22%) and −29.48 Mt (−0.82%). Electricity transmission loss always had a driving impact on CO2 emission growth, with increasing effects (contributions) of 23.71 Mt (0.66%) and 15.73 Mt (0.44%). However, electricity intensity always had a mitigating influence, with the change effects (contributions) of −11.15 Mt (−0.31%) and −168.16 Mt (−4.66%).
NWG: Electricity structure always had a mitigating impact on CO2 emission growth, with the change effects (contributions) of −1.78 Mt (−0.05%) and −55.37 Mt (−1.54%), respectively, during 2000–2010 and 2010–2020 (Figure 5e and Table 4). However, electricity trade always had a driving impact, with increasing effects (contributions) of 25.92 Mt (0.72%) and 103.10 Mt (2.86%). The electricity transmission loss also always had a driving impact, with increasing effects (contributions) of 11.54 Mt (0.32%) and 6.75 Mt (0.19%). Similarly, electricity intensity always had a driving impact, with the change effects (contributions) of 9.23 Mt (0.26%) and 76.89 Mt (2.13%).
SG: The electricity structure effect had an overall mitigating impact on CO2 emission growth, with the changing effects (contributions) of 11.97 Mt (0.33%) and −125.95 Mt (−3.49%), respectively, during 2000–2010 and 2010–2020 (Figure 5f and Table 4). The electricity trade effect had an overall driving impact, with increasing effects (contributions) of 14.58 Mt (0.40%) and −11.86 Mt (−0.33%). Electricity transmission loss always had a driving impact, with increasing effects (contributions) of 19.75 Mt (0.55%) and 8.35 Mt (0.23%). However, electricity intensity always had a mitigating impact, with the changing effects (contributions) of −29.54 Mt (−0.82%) and −79.53 Mt (−2.21%).
Overall, the electricity structure almost always had a mitigating effect (except in the first period in SG) on CO2 emission growth, especially in the second stage of NG and SG. The reason might be arising from the vigorous development of wind power and solar power in Inner Mongolia and Hebei in the NG, as well as the rapid development of hydropower in Yunnan. Moreover, electricity intensity had a mitigating effect in most regions (except in NG and NWG). These results might be arising from the fact that there was still a lot of electrical waste in these developing provinces, such as Inner Mongolia and Ningxia. Moreover, the electricity trading effect had an overall mitigating impact on the growth of emissions during 2000–2020. However, it was significantly different in specific regions. For example, it inhibited the CO2 emissions growth in the YRD (−117.64 Mt) while driving the CO2 emission growth in the NWG (129.02 Mt) during the period of 2000–2020 (Figure 5). This result might be arising from the West–East Power Transmission Project, in which the Northwest could deliver abundant clean power to the YRD to achieve the carbon reduction of YRD. Therefore, the YRD should develop new energy according to its own conditions. It is supposed to strengthen cross-region cooperatives and bring in more clean electricity from the SG and NWG.

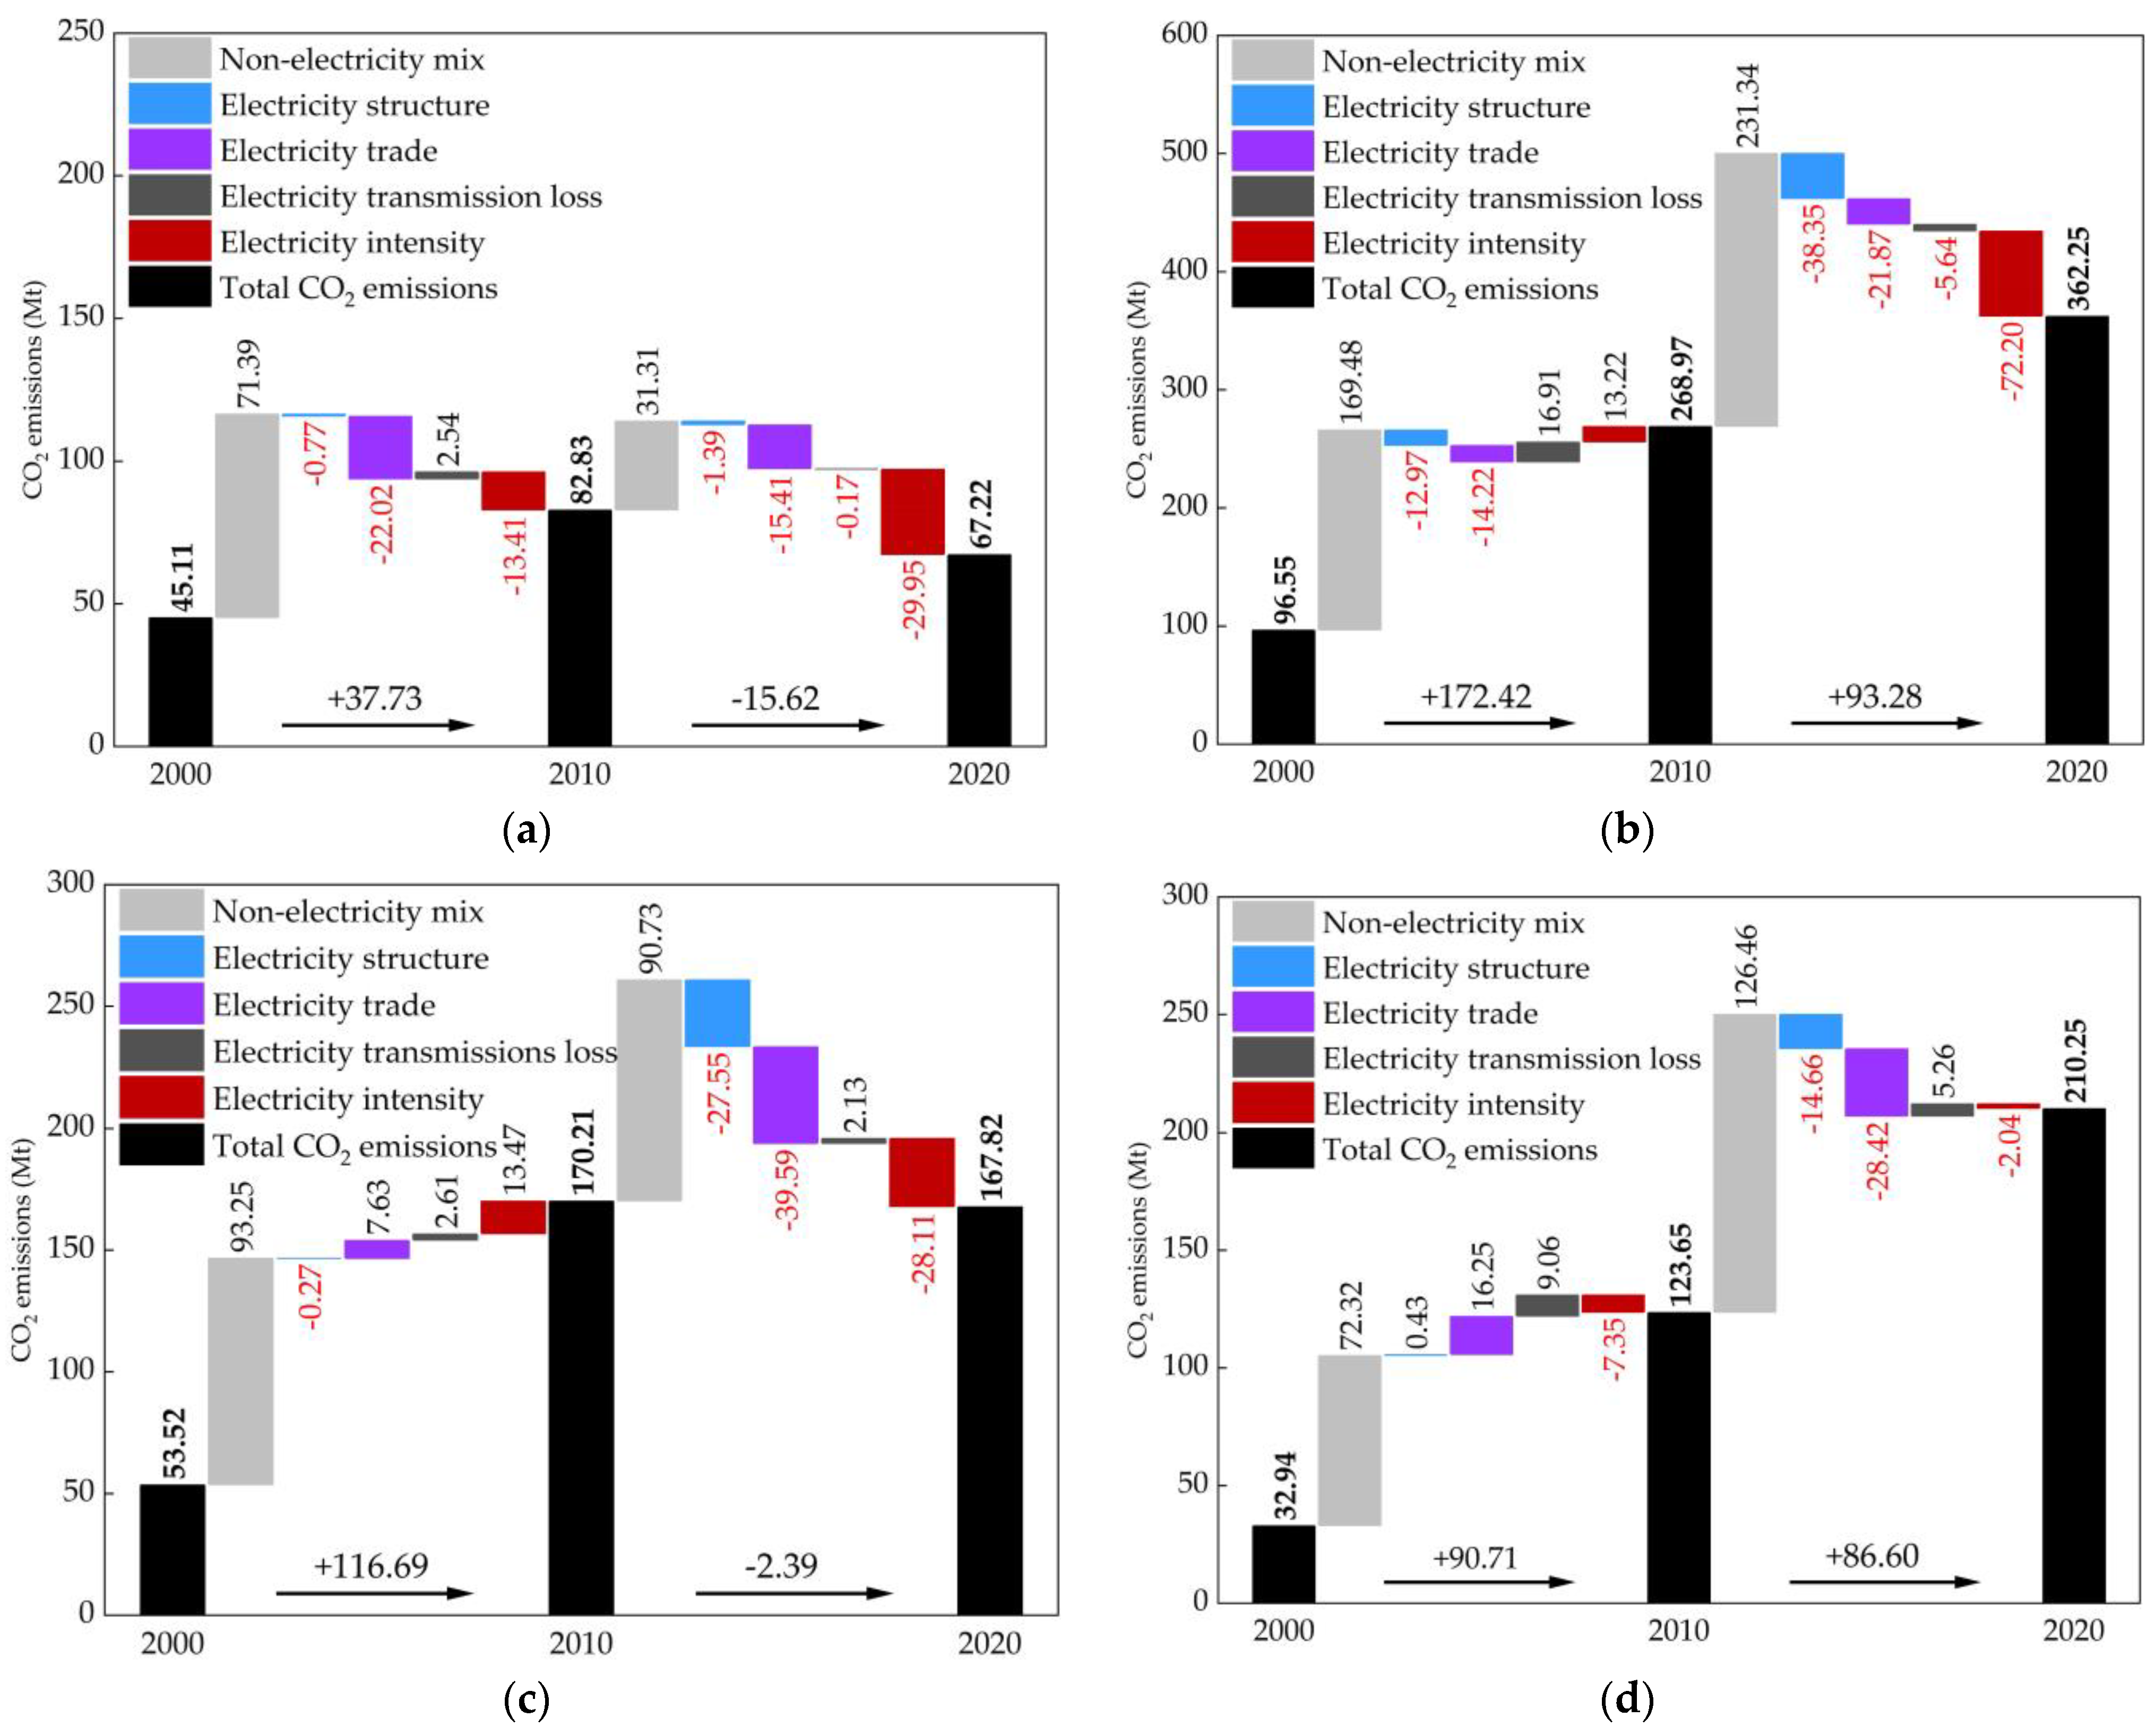
3.3.2. Decomposition Results of the Whole-Process Factors for Provincial Electricity Sector in the YRD

The decomposition results of whole-process factors of the electricity sector from Shanghai, Jiangsu, Zhejiang, and Anhui during the periods of 2000–2010 and 2010–2020 are presented in Figure 6. Their corresponding contributions are shown in Table 5. It is obvious that the CO2 emission changes of Shanghai, Jiangsu, Zhejiang, and Anhui during 2000–2010 were 37.73 Mt, 172.42 Mt, 116.69 Mt, and 90.71 Mt (Figure 6). The corresponding changes were −15.62 Mt, 93.28 Mt, −2.39 Mt, and 86.60 Mt during 2010–2020. It is easy to find that a decline existed in the growth rates of CO2 emissions in all provinces during 2010–2020 when compared with those in 2000–2010. This result might mainly arise from the mitigating effect of the electricity mix on CO2 emissions.
Shanghai: The electricity structure always had an inhibiting impact on CO2 emission growth, which was consistent with the previous studies [47,48]. During 2000–2010 and 2010–2020, the corresponding change effects (contributions) were −0.77 Mt (−0.13%) and −1.39 Mt (−0.24%), respectively (Figure 6a and Table 5). Electricity trade also always had an inhibiting impact, with the change effects (contributions) of −22.02 Mt (−3.80%) and −15.41 Mt (−2.66%). Electricity transmission loss had an overall positive influence, with the change effects (contributions) of 2.54 Mt (0.44%) and −0.17 Mt (−0.03%). The electricity intensity effect always had a mitigating influence, with the change effects (contributions) of −13.14 Mt (−2.31%) and −29.95 Mt (−5.17%).
Jiangsu: Electricity structure had an overall mitigating impact, with the change effects (contributions) of −12.97 Mt (−2.24%) and −38.35 Mt (−6.62%), respectively, during 2000–2010 and 2010–2020 (Figure 6b and Table 5). Similarly, electricity trade also had a mitigating impact, with the change effects (contributions) of −14.22 Mt (−2.45%) and −21.87 Mt (−3.77%). However, electricity transmission loss had an overall increasing effect with the change effects (contributions) of 16.91 Mt (2.92%) and −5.64 Mt (−0.97%), which was consistent with this study [49]. The electricity intensity had an overall mitigating influence with the change effects (contributions) of 13.22 Mt (2.28%) and −72.20 Mt (−12.46%), which was similar to this study [50,51].
Zhejiang: Electricity structure always had a negative impact, with the change effects (contributions) of −0.27 Mt (−0.05%) and −27.55 Mt (−4.76%), respectively, during 2000–2010 and 2010–2020 (Figure 6c and Table 5). Electricity trade had an overall inhibiting effect with the change effects (contributions) of 7.63 Mt (1.32%) and −39.59 Mt (−6.83%), which was consistent with this study [52]. The electricity transmission loss always had a driving impact, with increasing effects (contributions) of 2.61 Mt (0.45%) and 2.13 Mt (0.37%). However, electricity intensity had an overall mitigating impact, with the change effects (contributions) of 13.47 Mt (2.33%) and −28.11 Mt (−4.85%).
Anhui: The electricity structure had an overall mitigating impact, with the change effects (contributions) of 0.43 Mt (0.07%) and −14.66 Mt (−2.53%) (Figure 6d and Table 5). Similarly, electricity trade had an overall mitigating impact, with the change effects (contributions) of 16.25 Mt (2.80%) and −28.42 Mt (−4.90%). Moreover, while the electricity transmission loss always had a driving impact, with the increasing effects (contributions) of 9.06 Mt (1.56%) and 5.26 Mt (0.91%), electricity intensity always had a mitigating impact, with the change effects (contributions) of −7.35 Mt (−1.27%) and −2.04 Mt (−0.35%).
It is obvious that the electricity structure had an overall mitigating impact on CO2 emission growth (except for the first period in Anhui). This is because the YRD has abundant clean energy, such as wind and solar energy, as well as the advantage of developing nuclear power. However, such an impact is quite limited in Shanghai (−2.17 Mt). Thus, it will be beneficial for the YRD’s electricity sector to increase the proportion of renewable power generation, especially in Shanghai. In addition, the electricity trade also had an overall mitigating impact on CO2 emission growth (except for the first period in Anhui and Zhejiang). This result can be mainly attributed to the West–East Electricity Transmission Project, which transmits a lot of thermal power and clean power from the western region to the YRD through the extra-high voltage (EHV) grids. As we know, the YRD is a region with high energy demand but poor in fossil energy. Therefore, it is conducive for the YRD to strengthen the rational allocation of resources through inter-regional electricity trade and cooperation.
Moreover, the impact of electricity transmission loss on the YRD was mild from 2000–2010, and its positive impact further diminished from 2010–2020. This result might arise from the construction and renewal of the power grid. Thus, the YRD should further optimize its power transmission grids, especially in Anhui and Zhejiang. In addition, electricity intensity had an overall mitigating impact on CO2 emission growth (except for the first period in Zhejiang and Jiangsu). This might be related to the industrial upgrading in the YRD, where electricity consumption was significantly inhibited due to the elimination and transfer of high energy-consuming industries. Finally, the mitigation effect of Anhui’s electricity intensity on CO2 emission growth was quite weak (−2.04 Mt) during 2010–2020, which was consistent with this study [53,54] and might be due to the fact that Anhui had a lower level of economic development compared with Jiangsu, Zhejiang, and Shanghai.

4. Discussion

Currently, it is necessary to acknowledge that our research has the potential for further development. The LMDI model is extensively applied, but there are still some limitations. For example, it is obvious that LMDI cannot examine the impact of all relative and absolute factors simultaneously, and factor interdependence limits the decomposition results of LMDI. Vaninsky [55] put forward Generalized Divisia Index Method (GDIM), which allows for non-linear interrelationships among underlying factors concluded with a better decomposition analysis. Furthermore, the decomposition result of the identities is too descriptive. It might be helpful to take econometrics methods into consideration. Moreover, limited by the length and purpose of the article, this manuscript does not further analyze the implications of conclusions for economic policy. Therefore, we think that further analyses can be performed in future work.
The reliability and stability of the results in this paper are indisputable. However, these results may also have a few errors. The main sources of errors are as follows. First, the statistical data source itself might produce errors. However, these errors can have a very slight impact on the results of this study. Furthermore, some small errors (although they can be ignored) might be produced by our computations, e.g., using the rounded integer arithmetic method, in the whole study process.

5. Conclusions and Suggestions

5.1. Conclusions

The present study first calculated the CO2 emissions from the electricity sector in China’s six regions during 2000–2020. It then investigated the factors affecting CO2 emissions and found the main challenge of sustainable carbon reduction in YRD’s electricity sector. We further extended the LMDI model based on the electricity process of production, distribution, transmission, and consumption to complete these works. The major findings obtained are as follows:
(1)
During 2000–2020, the CO2 emission of YRD’s electricity sector ranked second among the six regions (YRD, NG, NEG, CG, NWG, and SG). It increased from 228.12 Mt to 807.55 Mt, with an average annual growth rate of 6.52%. Compared to the electricity mix effect of other regions, the YRD had the strongest mitigation impact on CO2 growth. Therefore, it is important for YRD to build a low-carbon electricity system itself, including the de-carbonization of electricity production and the carbon reduction of the electricity-use process;
(2)
Nationally, electricity trade had an overall mitigating impact on the growth of emissions during 2000–2020 and had a stronger impact on some specific regions, such as the YRD and the NWG. These results mean that cross-regional cooperation or trade in the electricity sector could be beneficial to regional emission reduction, especially in the YRD. So, it is important for the national power grids to promote trade;
(3)
Jiangsu had the highest CO2 emissions, accounting for 44.86% of the total CO2 emissions in the YRD in 2020. Moreover, Anhui had the fastest growth rate of CO2 emissions, with an average annual growth rate of 9.71%. Moreover, the economic activity effect was the most significant driver in all provinces, especially in Jiangsu and Anhui. Thus, Jiangsu and Anhui should strive to adjust the economic structure and development mode, improving the quality of economic growth while vigorously cutting down carbon emissions;
(4)
Electricity transmission loss had an overall driving impact on emission growth in all six regions and each YRD province, especially Zhejiang and Anhui. Meanwhile, electricity structure, electricity trade, and electricity intensity were the inhibiting factors. Particularly, the inhibiting effect of Shanghai’s electricity structure was notably weak (−2.17 Mt). So, Shanghai should try hard to increase the proportion of renewable energy, while Zhejiang and Anhui should upgrade their electricity transmission equipment.

5.2. Suggestions

Based on these findings, some policy recommendations for the YRD to confront these above challenges can be made as follows:
(1)
A low-carbon electricity system itself is important for the YRD. Thus, firstly, a green and sustainable economic development pattern should be encouraged in this region. Then, the YRD’s government should make full use of abundant scientific research resources to develop energy-saving technologies to improve energy efficiency and reduce the intensity of electricity consumption. For example, they should increase the proportion of renewable energy in the electricity production system and promote the clean use of coal to optimize the electricity structure or energy structure. Moreover, education and propaganda work on green development should be strengthened to improve people’s awareness of electricity saving and cultivate good habits of electricity consumption;
(2)
It is important for the YRD to improve the national power grids to promote trade. It should also strengthen its cooperation with the central and western regions. Moreover, it is necessary for the YRD region to develop the EHV technology and accelerate the construction of cross-regional power grids, including the upgrade of the transmission lines and the old circuit equipment;
(3)
Jiangsu and Anhui should strive to improve the quality of economic growth while vigorously cutting down carbon emissions. Thus, some specific countermeasures can be listed. The government, first, should encourage a green economic development pattern to improve economic growth quality. Second, people should accelerate the replacement of coal with oil and natural gas and promote the development of clean coal technologies (CCTs) to optimize the energy structure. Third, the development of wind power and solar power needs to be accelerated to increase the proportion of clean-energy use and reduce carbon emissions;
(4)
Shanghai should increase the proportion of renewable energy use, while Zhejiang and Anhui should upgrade their electricity transmission equipment. Therefore, for the city of Shanghai, it is still necessary to take advantage of its resource talents (i.e., wind power resources) to develop new technologies for renewable-energy use. It should encourage people to use Integrated Gasification Combined Cycle (IGCC) to improve energy efficiency. For Zhejiang province, first, the electricity transmission lines should be updated and upgraded immediately. It is also reasonable to advocate green living and green travel so that people can form a low-carbon lifestyle. Last, it should also focus on the development of renewable energy, such as hydropower, pumped storage power plants, and nuclear power, under the premise of ensuring safety. For Anhui province, the focus of carbon mitigation from the electricity sector lies in promoting the intensively developmental style of the economy and avoiding the traditional economic development model. Furthermore, high-energy-consuming industries should be eliminated immediately, and electricity-saving devices should be promoted to reduce the intensity of electricity consumption. Last, the government of Anhui province should accelerate the renovation of old power lines in rural areas.

Author Contributions

Conceptualization, J.J. and J.C.; methodology, J.C. and C.Z.; validation, L.W., C.Z. and B.W.; formal analysis, J.C.; investigation, J.C.; resources, J.C. and B.W.; data curation, C.Z. and B.W.; writing—original draft preparation, J.J. and J.C.; writing—review and editing, J.J. and L.W.; visualization, J.C. and L.W.; supervision, J.J. and L.W.; project administration, L.W. and C.Z.; funding acquisition, J.J. and B.W. All authors have read and agreed to the published version of the manuscript.

Funding

This research was funded by the National Natural Science Foundation of China (Grant No. 72264016), the Foundation Project of Philosophy and Social Science in Jiangxi Province (Grant No. 21JL03), and the Research Project of Humanities and Social Science from Jiangxi’s Provincial Department of Education (Grant No. GL19225).

Institutional Review Board Statement

Not applicable.

Informed Consent Statement

Not applicable.

Data Availability Statement

The data presented in this study are available on request from the corresponding author.

Acknowledgments

The authors would like to thank the anonymous reviewers and editors for their constructive comments and suggestions to improve the quality of this article.

Conflicts of Interest

The authors declare no conflict of interest. The funders had no role in the design of the study, in the collection, analyses, or interpretation of data, in the writing of the manuscript, or in the decision to publish the results.

Appendix A

Table A1. Conversion factors for different fuel types to calculate CO2 emissions and conversion factors from physical to coal equivalent.
Fossil-Fuel Energy Type
(Unit)
Average Net Calorific Value
(kJ/kg or kJ/m3)
Carbon Content of Unit Heat
(tC/TJ)
Carbon Oxidation Factor
(%)
Standard Coal Coefficient
(kg ce/kg)
Raw Coal20,90825.81000.714
Cleaned Coal26,34425.81000.900
Other Washed Coal836325.81000.286
Briquettes20,90826.61000.700
Gangue837225.81000.179
Coke28,43529.21000.971
Coke Oven Gas16,72612.11000.614 a
Blast Furnace Gas376770.81001.286 b
Converter Gas795349.61002.714 b
Other Gas522712.11000.657 a
Other Coking Products28,43525.81001.500
Crude Oil41,81620.01001.429
Gasoline43,07018.91001.471
Diesel Oil42,65220.21001.457
Fuel Oil41,81621.11001.429
Petroleum Coke31,98026.61001.092
Liquefied Petroleum Gas50,17917.21001.714
Refinery Gas46,05515.71001.571
Other Petroleum Products41,81620.01001.400
Natural Gas38,93115.31001.330 a
Liquefied Natural Gas51,48615.31001.757
a The unit is kg ce/m3. b The unit is kg ce/104 m3.
Table A2. The six regions included in this study and their scope.
RegionProvincial Power Grids
YRDShanghai, Jiangsu, Zhejiang, and Anhui
NGBeijing, Tianjin, Hebei, Shanxi, Shandong, and Inner Mongolia
NEGLiaoning, Jilin, and Heilongjiang
CGJiangxi, Henan, Hebei, Hunan, Chongqing, and Sichuan
NWGShaanxi, Gansu, Qinghai, Ningxia, and Xinjiang
SGGuangdong, Guangxi, Guizhou, Yunnan, Hainan, and Fujian
Table A3. Contribution of economic activity effect in Shanghai, Jiangsu, Zhejiang, and Anhui from 2000–2020.
YearShanghaiJiangsuZhejiangAnhui
2000–20012.79 8.55 4.96 2.86
2001–20023.77 10.31 6.49 3.52
2002–20034.37 13.28 7.68 4.00
2003–20044.77 15.78 8.26 5.86
2004–20054.53 20.34 9.58 7.27
2005–20064.68 25.36 12.27 7.87
2006–20075.18 27.43 15.54 9.67
2007–20083.27 24.30 12.05 10.18
2008–20092.89 23.44 10.66 13.13
2009–20103.79 25.76 12.40 18.68
2010–20114.30 22.94 10.93 14.34
2011–20123.82 25.29 10.16 13.80
2012–20134.11 26.85 10.93 14.83
2013–20144.39 22.82 9.50 14.13
2014–20154.63 24.50 10.00 13.07
2015–20164.09 22.56 9.45 13.17
2016–20174.50 22.64 10.15 13.66
2017–20184.14 22.24 9.51 13.98
2018–20193.69 19.84 8.72 13.77
2019–20200.91 12.70 3.41 7.34
The unit is Mt.
Table A4. Data source and reference source description.
Graphs or TablesSource
Table 1[7,11,13,33,34,35,36,37,38,39,40,41,42,43]
Figure 1 and Table A2http://www.gov.cn/zhengce/content/2017-09/13/content_5223177.htm (accessed on 10 May 2022)
Figure 2Equation (1)
Figure 3 and Figure 4, Table 2 and Table 3Equations (4)–(7), (12)–(15)
Figure 5 and Figure 6, Table 4 and Table 5Equations (4)–(7), (12), (13)
Table A1[39]
Table A3Equation (14)

References

  1. Jiang, T.Y.; Yang, J.; Huang, S.J. Evolution and driving factors of CO2 emissions structure in China’s heating and power industries: The supply-side and demand-side dual perspectives. J. Clean. Prod. 2020, 264, 121507. [Google Scholar] [CrossRef]
  2. Jia, J.S.; Jian, H.Y.; Xie, D.M.; Gu, Z.Y.; Chen, C.D. Multi-scale decomposition of energy-related industrial carbon emission by an extended logarithmic mean divisia index: A case study of Jiangxi, China. Energy Effic. 2019, 12, 2161–2186. [Google Scholar] [CrossRef] [Green Version]
  3. Yan, D.; Lei, Y.L.; Li, L.; Song, W. Carbon emission efficiency and spatial clustering analyses in China’s thermal power industry: Evidence from the provincial level. J. Clean. Prod. 2017, 156, 518–527. [Google Scholar] [CrossRef]
  4. Chen, B.; Jin, Y.M. Adjusting productivity measures for CO2 emissions control: Evidence from the provincial thermal power sector in China. Energy Econ. 2020, 87, 104707. [Google Scholar] [CrossRef]
  5. Wang, C.; Zhang, Y.X. Implementation pathway and policy system of carbon neutrality vision. Chin. J. Environ. Manag. 2020, 12, 58–64. (In Chinese) [Google Scholar] [CrossRef]
  6. Zhao, Y.H.; Cao, Y.; Shi, X.P.; Li, H.; Shi, Q.L.; Zhang, Z.H. How China’s electricity generation sector can achieve its carbon intensity reduction targets? Sci. Total Environ. 2020, 706, 135689. [Google Scholar] [CrossRef]
  7. Yang, L.S.; Lin, B.Q. Carbon dioxide-emission in China’s power industry: Evidence and policy implications. Renew. Sustain. Energy Rev. 2016, 60, 258–267. [Google Scholar] [CrossRef]
  8. Li, J.J.; Zhang, Y.L.; Tian, Y.J.; Cheng, W.J.; Yang, J.D.; Xu, D.P.; Wang, Y.G.; Xie, K.C.; Ku, A.Y. Reduction of carbon emissions from China’s coal-fired power industry: Insights from the province-level data. J. Clean. Prod. 2020, 242, 118518. [Google Scholar] [CrossRef]
  9. Jia, J.S.; Rong, Y.Y.; Chen, C.D.; Xie, D.M.; Yang, Y. Contribution of renewable energy consumption to CO2 emissions mitigation: A comparative analysis from the income levels’ perspective in the Belt and Road Initiative (BRI) region. Int. J. Clim. Chang. Strateg. 2021, 13, 266–285. [Google Scholar] [CrossRef]
  10. Jia, J.S.; Lei, J.; Chen, C.D.; Song, X.; Zhong, Y.X. Contribution of renewable energy consumption to CO2 emissions mitigation: A comparative analysis from a global geographic perspective. Sustainability 2021, 13, 3853. [Google Scholar] [CrossRef]
  11. Chen, G.J.; Hou, F.J.; Li, J.Q.; Chang, K.L. Decoupling analysis between carbon dioxide emissions and the corresponding driving forces by Chinese power industry. Environ. Sci. Pollut. Res. 2021, 28, 2369–2378. [Google Scholar] [CrossRef] [PubMed]
  12. Zhang, P.F.; Cai, W.Q.; Yao, M.T.; Wang, Z.Y.; Yang, L.Z.; Wei, W.D. Urban carbon emissions associated with electricity consumption in Beijing and the driving factors. Appl. Energy 2020, 275, 115425. [Google Scholar] [CrossRef]
  13. Wei, Y.J.; Zhao, T.; Wang, J.; Zhang, X.P. Exploring the impact of transition in energy mix on the CO2 emissions from China’s power generation sector based on IDA and SDA. Environ. Sci. Pollut. Res. 2021, 28, 30858–30872. [Google Scholar] [CrossRef]
  14. Li, X.; Wang, J.M.; Zhang, M.; Ouyang, J.M.; Shi, W.T. Regional differences in carbon emission of China’s industries and its decomposition effects. J. Clean. Prod. 2020, 270, 122528. [Google Scholar] [CrossRef]
  15. Goh, T.; Ang, B.W.; Xu, X.Y. Quantifying drivers of CO2 emissions from electricity generation–current practices and future extensions. Appl. Energy 2018, 231, 1191–1204. [Google Scholar] [CrossRef]
  16. Lin, B.; Raza, M.Y. Coal and economic development in pakistan: A necessity of energy source. Energy 2020, 207, 118244. [Google Scholar] [CrossRef]
  17. Ma, X.J.; Wang, C.X.; Dong, B.Y.; Gu, G.C.; Chen, R.M.; Li, Y.F.; Zou, H.F.; Zhang, W.F.; Li, Q.N. Carbon emissions from energy consumption in China: Its measurement and driving factors. Sci. Total Environ. 2019, 648, 1411–1420. [Google Scholar] [CrossRef] [PubMed]
  18. Wen, L.; Li, Z.K. Provincial-level industrial CO2 emission drivers and emission reduction strategies in China: Combining two-layer LMDI method with spectral clustering. Sci. Total Environ. 2020, 700, 134374. [Google Scholar] [CrossRef]
  19. De Oliveira-De Jesus, P.M. Effect of generation capacity factors on carbon emission intensity of electricity of Latin America & the Caribbean, a temporal IDA-LMDI analysis. Renew. Sustain. Energy Rev. 2019, 101, 516–526. [Google Scholar] [CrossRef]
  20. Jia, J.S.; Gong, Z.H.; Gu, Z.; Chen, C.D.; Xie, D.M. Multi-perspective comparisons and mitigation implications of SO2 and NOX discharges from the industrial sector of China: A decomposition analysis. Environ. Sci. Pollut. Res. 2018, 25, 9600–9614. [Google Scholar] [CrossRef]
  21. Ang, B.W. Decomposition analysis for policymaking in energy. Energy Policy 2004, 32, 1131–1139. [Google Scholar] [CrossRef]
  22. Ang, B.W.; Liu, N. Handling zero values in the logarithmic mean divisia index decomposition approach. Energy Policy 2007, 35, 238–246. [Google Scholar] [CrossRef]
  23. Ang, B.W. LMDI decomposition approach: A guide for implementation. Energy Policy 2015, 86, 233–238. [Google Scholar] [CrossRef]
  24. Zhao, Y.H.; Li, H.; Zhang, Z.H.; Zhang, Y.F.; Wang, S.; Liu, Y. Decomposition and scenario analysis of CO2 emissions in China’s power industry: Based on LMDI method. Nat. Hazards 2016, 86, 645–668. [Google Scholar] [CrossRef]
  25. Chen, J.D.; Wang, P.; Cui, L.B.; Huang, S.; Song, M.L. Decomposition and decoupling analysis of CO2 emissions in OECD. Appl. Energy 2018, 231, 937–950. [Google Scholar] [CrossRef]
  26. Yang, J.; Cai, W.; Ma, M.D.; Li, L.; Liu, C.H.; Ma, X.; Li, L.L.; Chen, X.Z. Driving forces of China’s CO2 emissions from energy consumption based on Kaya-LMDI methods. Sci. Total Environ. 2020, 711, 134569. [Google Scholar] [CrossRef]
  27. Fatima, T.; Xia, E.J.; Cao, Z.; Khan, D.; Fan, J.L. Decomposition analysis of energy-related CO2 emission in the industrial sector of China: Evidence from the LMDI approach. Environ. Sci. Pollut. Res. 2019, 26, 21736–21749. [Google Scholar] [CrossRef]
  28. Zhang, H.N.; Zhang, X.P.; Yuan, J.H. Driving forces of carbon emissions in China: A provincial analysis. Environ. Sci. Pollut. Res. 2021, 28, 21455–21470. [Google Scholar] [CrossRef]
  29. Wang, X.; Li, L.; Zhao, F.S. Decomposition analysis of CO2 emissions in Northeast China: Insights from investment factors. Front. Energy Res. 2021, 9, 777290. [Google Scholar] [CrossRef]
  30. Jia, J.S.; Gong, Z.H.; Xie, D.M.; Chen, J.H.; Chen, C.D. Analysis of drivers and policy implications of carbon dioxide emissions of industrial energy consumption in an underdeveloped city: The case of Nanchang, China. J. Clean. Prod. 2018, 183, 843–857. [Google Scholar] [CrossRef]
  31. Chen, J.D.; Cheng, S.L.; Song, M.L. Changes in energy-related carbon dioxide emissions of the agricultural sector in China from 2005 to 2013. Renew. Sustain. Energy Rev. 2018, 94, 748–761. [Google Scholar] [CrossRef]
  32. Zhang, L.H.; Ma, X.; Wang, Y.X.; Song, R.; Li, J.J.; Yuan, W.C.; Zhang, S.S. The increasing district heating energy consumption of the building sector in China: Decomposition and decoupling analysis. J. Clean. Prod. 2020, 271, 122696. [Google Scholar] [CrossRef]
  33. Zhang, C.; Su, B.; Zhou, K.L.; Yang, S.L. Analysis of electricity consumption in China (1990–2016) using index decomposition and decoupling approach. J. Clean. Prod. 2019, 209, 224–235. [Google Scholar] [CrossRef]
  34. Li, R.; Dong, J.; Pa, L.D. Driving forces analysis of CO2 emissions from China’s electric industry based on two-phase LMDI decomposition method. J. Renew. Sustain. Energy 2021, 13, 015901. [Google Scholar] [CrossRef]
  35. Cui, H.R.; Zhao, T.; Wu, R.R. CO2 emissions from China’s power industry: Policy implications from both macro and micro perspectives. J. Clean. Prod. 2018, 200, 746–755. [Google Scholar] [CrossRef]
  36. Luo, F.; Guo, Y.; Yao, M.T.; Cai, W.Q.; Wang, M.; Wei, W.D. Carbon emissions and driving forces of China’s power sector: Input-output model based on the disaggregated power sector. J. Clean. Prod. 2020, 268, 121925. [Google Scholar] [CrossRef]
  37. Ma, J.-J.; Du, G.; Xie, B.-C. CO2 emission changes of China’s power generation system: Input-output subsystem analysis. Energy Policy 2019, 124, 1–12. [Google Scholar] [CrossRef]
  38. Liao, C.Y.; Wang, S.G.; Zhang, Y.Y.; Song, D.; Zhang, C.H. Driving forces and clustering analysis of provincial-level CO2 emissions from the power sector in China from 2005 to 2015. J. Clean. Prod. 2019, 240, 462–475. [Google Scholar] [CrossRef]
  39. He, Y.; Xing, Y.T.; Zeng, X.C.; Ji, Y.J.; Hou, H.M.; Zhang, Y.; Zhu, Z. Factors influencing carbon emissions from China’s electricity industry: Analysis using the combination of LMDI and K-means clustering. Environ. Impact Assess. Rev. 2022, 93, 106724. [Google Scholar] [CrossRef]
  40. Wen, L.; Hao, Y.X. Factor decomposition and clustering analysis of CO2 emissions from China’s power industry based on shapley value. Energy Source Part A 2020, 67, 1776795. [Google Scholar] [CrossRef]
  41. Wang, Y.X.; Yan, Q.Y.; Li, Z.Y.; Balezentis, T.; Zhang, Y.; Gang, L.; Streimikiene, D. Aggregate carbon intensity of China’s thermal electricity generation: The inequality analysis and nested spatial decomposition. J. Clean. Prod. 2020, 247, 119139. [Google Scholar] [CrossRef]
  42. Yan, Q.Y.; Wang, Y.X.; Balezentis, T.; Streimikiene, D. Analysis of China’s regional thermal electricity generation and CO2 emissions: Decomposition based on the generalized divisia index. Sci. Total Environ. 2019, 682, 737–755. [Google Scholar] [CrossRef] [PubMed]
  43. Wang, S.G.; Zhu, X.J.; Song, D.; Wen, Z.G.; Chen, B.; Feng, K.S. Drivers of CO2 emissions from power generation in China based on modified structural decomposition analysis. J. Clean. Prod. 2019, 220, 1143–1155. [Google Scholar] [CrossRef]
  44. Chen, G.J.; Hou, F.J.; Chang, K.L.; Zhai, Y.B.; Du, Y.Q. Driving factors of electric carbon productivity change based on regional and sectoral dimensions in China. J. Clean. Prod. 2018, 205, 477–487. [Google Scholar] [CrossRef]
  45. Zhang, F.Q.; Ang, B.W. Methodological issues in cross-country/region decomposition of energy and environment indicators. Energy Econ. 2001, 23, 179–190. [Google Scholar] [CrossRef]
  46. Ang, B.W. The LMDI Approach to Decomposition Analysis: A Practical Guide. Energy Policy 2005, 33, 867–871. [Google Scholar] [CrossRef]
  47. Wei, W.D.; Zhang, P.F.; Yao, M.T.; Xue, M.; Miao, J.W.; Liu, B.; Wang, F. Multi-scope electricity-related carbon emissions accounting: A case study of Shanghai. J. Clean. Prod. 2020, 252, 119789. [Google Scholar] [CrossRef]
  48. Gnansounou, E.; Dong, J.; Bedniaguine, D. The strategic technology options for mitigating CO2 emissions in power sector: Assessment of Shanghai electricity-generating system. Ecol. Econ. 2004, 50, 117–133. [Google Scholar] [CrossRef]
  49. Zhang, M.Y.; Zhang, K.W.; Hu, W.Y.; Zhu, B.Z.; Wang, P.; Wei, Y.M. Exploring the climatic impacts on residential electricity consumption in Jiangsu, China. Energy Policy 2020, 140, 111398. [Google Scholar] [CrossRef]
  50. Sun, L.; Zhou, K.L.; Yang, S.L. Regional difference of household electricity consumption: An empirical study of Jiangsu, China. J. Clean. Prod. 2017, 171, 1415–1428. [Google Scholar] [CrossRef]
  51. Zhang, M.; Cheng, C.H.; Ma, H.Y. Projection of residential and commercial electricity consumption under SSPs in Jiangsu province, China. Adv. Clim.Chang. Res. 2020, 11, 131–140. [Google Scholar] [CrossRef]
  52. Wang, P.; Wang, C.S.; Hu, Y.K.; Varga, L.; Wang, W. Power generation expansion optimization model considering multi-scenario electricity demand constraints: A case study of Zhejiang province, China. Energies 2018, 11, 1498. [Google Scholar] [CrossRef] [Green Version]
  53. Ye, B.; Ge, F.; Rong, X.T.; Li, L. The influence of nonlinear pricing policy on residential electricity demand—A case study of Anhui residents. Energy Strateg. Rev. 2016, 13–14, 115–124. [Google Scholar] [CrossRef]
  54. Ge, F.; Ye, B.; Xing, S.N.; Wang, B.; Sun, S. The analysis of the underlying reasons of the inconsistent relationship between economic growth and the consumption of electricity in China–A case study of Anhui province. Energy 2017, 128, 601–608. [Google Scholar] [CrossRef]
  55. Vaninsky, A. Factorial decomposition of CO2 emissions: A generalized Divisia index approach. Energy Econ. 2014, 45, 389–400. [Google Scholar] [CrossRef]
Figure 1. The six regions and their scope redefined in this study.
Systems 11 00117 g001
Figure 2. (a) Regional CO2 emissions from the electricity sector in 2000–2020 and (b) Provincial CO2 emissions from the electricity sector in 2000–2020.
Systems 11 00117 g002
Figure 3. (a) Related effects of the driving factors on CO2 emissions from the regional electricity sector in 2000–2010; (b) Related effects of the driving factors on CO2 emissions from the regional electricity sector in 2010–2020.
Systems 11 00117 g003
Figure 4. Related effects of the driving factors in CO2 emissions from the provincial electricity sector in the period of 2000–2010 and 2010–2020.
Systems 11 00117 g004
Figure 5. Decomposition results of the whole-process factors for six regions in 2000–2020. (a) YRD; (b) NG; (c) NEG; (d) CG; (e) NWG; (f) SG.
Systems 11 00117 g005
Figure 6. Decomposition results of the whole-process factors for four provinces of YRD in 2000–2020. (a) Shanghai; (b) Jiangsu; (c) Zhejiang; (d) Anhui.
Systems 11 00117 g006
Table 1. Relevant literature on investigation of driving forces in China’s electricity sector.
AuthorsRegion and PeriodType of Driving FactorsMethodsLimitations and Innovation
Zhang et al. [33]China 1990–2016Production and consumptionLMDI and TapioThese studies were limited to a single spatial scale, rarely focused on regional and provincial scales.
Yang et al. [7]China 1985–2010Production and consumptionLMDI
Li et al. [34]China 2004–2015Production, trade, transmission, and consumptionTwo-phase LMDI
Cui et al. [35] China 1995–2016Production, transmission, and consumptionExtended STIRPAT
Liao et al. [38]China and its 30 provinces 2005–2015Production, trade, transmission, and consumptionLMDI and K-means cluster analysisThe results of clustering are strongly influenced by the selected indicators, which makes it difficult to propose recommendations.
He et al. [39]China and its 30 provinces 2005–2019Production, trade, transmission, and consumptionLMDI and K-means cluster analysis
Wen et al. [40]China and its 30 provinces 2005–2017Production and consumptionShapley value and Spectral clustering
Chen et al. [11]China and its 30 provinces 2003–2017ProductionLMDI and TapioThe decomposition is mainly limited to factors in the electricity production and consumption process.
Wang et al. [41]6 power grids and 30 provinces in China 2000–2016ProductionTheil index, nested spatial decomposition and LMDI
Yan et al. [42]6 power grids and 30 provinces in China 2000–2016Production and consumptionThe Generalized Divisia Index Model (GDIM)
Luo et al. [36]China 2007–2015Production and consumptionSDASDA is difficult to obtain continuous data since the input-output tables are published with gaps of several years [13].
Ma et al. [37]China 2007–2015Production and consumptionSDA
Wang et al. [43]5 power grids in China 2007–2012Production and consumptionSDA
Table 2. The percentage change of CO2 emissions and the contribution rates of drivers from six regions in 2000–2010 and 2010–2020.
RegionsPeriodsΔC aΔCS bΔCI bΔCEM bΔCG bΔCP b
YRD2000–201011.58%1.32%−2.88%0.31%11.58%1.26%
2010–20204.49%0.99%−2.88%−8.82%13.47%1.73%
NG2000–201021.51%1.88%0.25%0.38%17.41%1.6%
2010–202015.46%2.83%−6.82%−4.33%23.34%0.45%
NEG2000–20103.75%0.43%−0.06%−2.04%5.27%0.16%
2010–20201.53%0.68%−1.63%−1.98%5.28%−0.81%
CG2000–20109.61%0.78%−1.68%−0.13%10.63%0.01%
2010–20201.14%0.90%−4.44%−7.14%11.29%0.54%
NWG2000–20105.71%0.13%−0.10%1.25%4.15%0.30%
2010–202011.55%0.00%−1.65%3.64%8.22%1.34%
SG2000–20109.77%0.44%−0.96%0.47%9.10%0.73%
2010–20203.89%0.66%−2.82%−5.80%9.82%2.03%
Total2000–201061.93%4.96%−5.45%0.22%58.13%4.06%
2010–202038.07%6.05%−20.24%−24.43%71.42%5.27%
a means the change of CO2 emissions during the two different periods; b means the decomposed driving factors.
Table 3. The percentage change of CO2 emission and the contribution rates of drivers from four provinces of the YRD in 2000–2010 and 2010–2020.
RegionsPeriodsΔC aΔCS bΔCI bΔCEM bΔCG bΔCP b
Shanghai2000–20106.51%4.37%−2.40%−5.81%6.91%3.45%
2010–2020−2.70%−1.06%−1.16%−8.10%6.66%0.97%
Jiangsu2000–201029.76%1.81%−8.20%0.51%33.58%2.06%
2010–202016.10%6.13%−8.56%−23.83%38.38%3.97%
Zhejiang2000–201020.14%0.32%−4.32%4.05%17.24%2.86%
2010–2020−0.41%−0.13%−5.33%−16.07%16.01%5.10%
Anhui2000–201015.66%1.71%−3.01%3.17%14.33%−0.55%
2010–202014.95%1.19%−2.88%−6.88%22.80%0.72%
a means the change of CO2 emissions during the two different periods; b means the decomposed driving factors.
Table 4. The percentage change of CO2 emission and the contribution rates of drivers from six regions in 2000–2010 and 2010–2020.
RegionsPeriodsΔC aΔCNEM bΔCES bΔCET bΔCEL bΔCEI b
YRD2000–201011.58%11.27%−0.38%−0.34%0.86%0.16%
2010–20204.49%13.31%−2.27%−2.92%0.04%−3.67%
NG2000–201021.51%21.14%−0.86%−1.31%0.52%2.02%
2010–202015.46%19.80%−3.98%−2.02%0.61%1.05%
NEG2000–20103.75%5.79%−0.38%−0.36%0.02%−1.33%
2010–20201.53%3.52%−1.60%1.05%0.19%−1.62%
CG2000–20109.61%9.74%−0.70%0.22%0.66%−0.31%
2010–20201.14%8.28%−2.09%−0.82%0.44%−4.66%
NWG2000–20105.71%4.47%−0.05%0.72%0.32%0.26%
2010–202011.55%7.90%−1.54%2.86%0.19%2.13%
SG2000–20109.77%9.31%0.33%0.40%0.55%−0.82%
2010–20203.89%9.69%−3.49%−0.33%0.23%−2.21%
a means the change of CO2 emissions during the two different periods; b means the decomposed driving factors.
Table 5. Contributions of the CO2 emissions growth and decomposition results for six regions in 2000–2010 and 2010–2020.
RegionsPeriodsΔC aΔCNEM bΔCES bΔCET bΔCEL bΔCEI b
Shanghai2000–20106.51%12.32%−0.13%−3.80%0.44%−2.31%
2010–2020−2.70%5.40%−0.24%−2.66%−0.03%−5.17%
Jiangsu2000–201029.76%29.25%−2.24%−2.45%2.92%2.28%
2010–202016.10%39.93%−6.62%−3.77%−0.97%−12.46%
Zhejiang2000–201020.14%16.09%−0.05%1.32%0.45%2.33%
2010–2020−0.41%15.66%−4.76%−6.83%0.37%−4.85%
Anhui2000–201015.66%12.48%0.07%2.80%1.56%−1.27%
2010–202014.95%21.82%−2.53%−4.90%0.91%−0.35%
a means the change of CO2 emissions during the two different periods; b means the decomposed driving factors.
Disclaimer/Publisher’s Note: The statements, opinions and data contained in all publications are solely those of the individual author(s) and contributor(s) and not of MDPI and/or the editor(s). MDPI and/or the editor(s) disclaim responsibility for any injury to people or property resulting from any ideas, methods, instructions or products referred to in the content.

