Article

Time and Frequency Spillovers between the Green Economy and Traditional Energy Markets

1
School of Economics, Zhejiang University, Hangzhou 310058, China
2
School of Business, Yangzhou University, Yangzhou 225127, China
3
School of Public Affairs and Institute for Public Policy, Zhejiang University, Hangzhou 310058, China
*
Author to whom correspondence should be addressed.
Systems 2023, 11(3), 153; https://doi.org/10.3390/systems11030153
Submission received: 29 January 2023 / Revised: 12 March 2023 / Accepted: 15 March 2023 / Published: 17 March 2023

Abstract

:
The green economy is aimed at decreasing the dependence of the global economy on traditional fossil energy, thereby resolving conflicts between economic development and environmental issues and achieving sustainable economic development. Thus, the relation between the green economy and traditional energy markets is of great importance for both policymakers and portfolio managers. In this study, we investigate the dynamic spillover effects between the green economy and traditional energy markets by applying time and frequency spillover measures based on the TVP-VAR model. The results reveal a strong spillover relationship between the green economy and traditional energy system, and the spillover direction is mainly from green economy markets to traditional energy markets. Our analysis further reveals the heterogeneity of these spillover effects, both within green economy markets and between these markets and traditional energy markets. The performance of the U.S. green economy market is similar to that of Europe, whereas the Asian green economy market is more complex. The frequency domain results demonstrate that the spillover effects are mainly dominated by short-term (1–5 days) components, whereas medium- and long-term components have less of an effect. In addition, we find a sharp increase in the level of spillover effects during the COVID-19 pandemic.

1. Introduction

In response to the challenges posed by climate change, the green economy has developed rapidly and attracted extensive academic attention. Global economic development is inseparable from the increasing use of traditional fossil fuels, which leads to rapid increases in global warming, pollution and extreme weather events. To address the conflicts between economic development and environmental degradation, the green economy has been proposed as a sustainable economic development path (Ali et al., 2021) [1]. At the United Nations Conference on Sustainable Development in 2012, it was stated that the core of the green economy is to achieve green development, which involves the coordinated development of ecology and economy and the aim of eradicating poverty. The concept is based on a low-carbon economy model that is aimed at simultaneously achieving low energy consumption, pollution and emissions reduction, and economic development (Jin, 2012) [2]. The green economy has been widely applied, and 137 countries worldwide have committed to achieving carbon neutrality targets by around 2050. For example, China is striving to achieve carbon peaking by 2030 and carbon neutrality by 2060.
Despite the rapid development of the green economy over the last decade, the proportion of traditional fossil fuels in the global energy mix has remained high, at around 80% (IEA, 2022) [3]. Global crude oil prices have also been volatile since mid-2008. Thus, a strong risk of spillover between the two sectors is likely. On the one hand, increasing oil prices may drive investors and consumers to use cheaper substitutes, which can encourage the use of clean energy and increase green economic activities. On the other hand, traditional fossil fuels, such as oil and gas, also have a significant influence on global financial markets and, therefore, the global economy. Factors such as the Russia–Ukraine conflict and the pandemic have led global oil and gas prices to become highly volatile, which has had a negative shock on industrial production and household consumption. Thus, both global economic activities and the green economy have been affected.
In this study, we investigate the dynamic links between the green economy and traditional energy markets. We apply the NASDAQ OMX Green Economy Index, a common measure of green economy activities (Ren et al., 2022; Urom et al., 2022; Sharma et al., 2022) [4,5,6]. The stock market is typically viewed as a barometer of the economy, and price fluctuations of “green” stocks can reflect the degree of green economic activity (Ding et al., 2022) [7]. Regional differences in global green economy markets may also significantly influence any spillover effects, so we further investigate this issue at a regional level. We examine the green economies of the U.S., Europe and Asia to assess the risk contagion effects within these green markets and between them and traditional energy markets. We obtain data from the NASDAQ OMX Green Economy US Index, NASDAQ OMX Green Economy Europe USD Index and the NASDAQ OMX Green Economy Asia USD Index.
We explore the dynamic frequency spillovers in the COVID-19 pandemic period, due to its significant impact on global economic markets. Hosseini (2020) [8] argued that the COVID-19 pandemic had a significant negative impact on renewable energy facilities, supply chains and businesses, thus slowing the pace of global green development. This negative impact can be observed in three areas: a sharp decrease in investment in renewable energy projects (Hoang et al., 2021) [9], delays in equipment delivery for energy projects (Eroğlu, 2021) [10], and a reduced public demand for renewable energy at the source (Bhuiyan et al., 2021) [11].
We use time domain and frequency domain spillover indices based on the TVP-VAR model. To measure linkages in different assets or markets, various models have been proposed, such as VAR, GARCH and Copulas. Among them, the VAR-based spillover method proposed by Diebold and Yilmaz (2012) [12] (DY spillover) is widely used to study complicated correlations among different asset markets. Korobilis and Yilmaz (2018) [13] improved this DY approach by developing a dynamic spillover index method based on the time-varying parameter VAR (TVP-VAR) model. The TVP-VAR model has certain advantages over the original VAR-based DY model. First, it overcomes the arbitrary set of window sizes, which leads to very erratic or flattened parameters. Second, valuable observations are not lost when estimating the model’s time-varying parameters. Third, the model is not sensitive to outliers. It can also compare and analyze the interaction relationship between variables and the internal reasons when different policy factors impact at different periods. For example, Antonakakis (2019) [14] studied the spillover effects of international monetary policies based on the TVP-VAR model and found that the spillover effects were heterogeneous in different periods.
However, investors’ risk appetites are different, e.g., speculators prefer to invest in the short term, but institutional investors invest in the long term. The DY framework fails to capture the time investment horizon, as it focuses on the time domain only. Barunik and Krehlik (2018) [15] further extended the DY model into the frequency domain by applying the spectral decomposition of Stiassny (1996) [16]. This overcomes the limitation of DY spillover by decomposing the aggregate spillovers in the time domain into different frequencies, thus enabling the frequencies that are most important to the connectedness of a system to be identified. The time–frequency spillover index of Barunik and Krehlik (2018) [15] (BK spillover) enables the magnitude and direction of spillovers across frequencies to be evaluated. In addition, some of the literature has used a wavelet-based framework to examine relationships in the frequency domain. For example, Reboredo et al. (2017) [17] applied discrete and continuous wavelets to measure the relationship between renewable energy and crude oil. The closest work to ours is that of Bouoiyour et al. (2023) [18], who used a wavelet-based methodology from 2010 to 2022 to investigate the relationship between crude oil and several renewable energy stock sector indices in the time–frequency domain. The wavelet-based framework may concentrate on investigating the connectedness of pairwise variables, such as the WTI–wind and WTI–solar pairs. By employing the BK framework, we can examine the total spillover of the “green economy–traditional energy” system, the individual spillover of each market and the pairwise spillover between markets at different time scales. Then, we can not only see the role of an individual market in the whole system but also the interactive role within green economy markets.
Our study makes four main contributions to the literature. First, we extend the academic literature on the relationship between traditional energy and stock markets from a green economy perspective. The spillover effects between green energy (Li et al., 2023) [19] or renewable/clean energy stocks (Saeed et al., 2020; Saeed et al., 2021; Xi et al., 2022; Ferrer et al., 2018; Bouoiyour et al., 2023) [18,20,21,22,23] and traditional energy markets have been examined, but limited research into the relationship between green economic activity and traditional energy markets has been conducted. One exception is a recent study concerning the hedging effects of green economy stocks on gas futures (Chen et al., 2023) [24]. We address this gap by using the NASDAQ OMX Green Economy Index as a proxy for the level of green economic activity and investigating spillovers in a “green economy–traditional energy” system. Second, we complete the current literature related to environmental economics and energy economics by providing evidence of regional heterogeneity. Many current studies focus on a single regional market (Li et al., 2023) [18] or a single traditional energy market (e.g., Chen et al. (2023) [24] only investigated the effects of global green economy stocks on the gas market), which may ignore regional differences and market heterogeneity. We not only consider the regional differences among U.S., European and Asian green economy markets, but we also take both traditional energy markets into account. Third, we use a combination of time and frequency domain tests, which enable us to demonstrate dynamic spillovers in the long, medium and short terms. As Strohsal et al. (2019) [25] noted, the time domain cannot sufficiently capture all the information, as some important relations only occur with a specific frequency. We apply both the time domain method (DY spillover) and frequency domain approach (BK spillover) to explore the dynamic correlations between green economy markets and traditional energy markets in the long, medium and short terms. This can help short-term and long-term investors acquire accurate information so that they can manage their portfolios appropriately. Last, we provide new evidence of the influence of an extreme shock, such as the COVID-19 pandemic, on spillovers among markets. Other studies (Saeed et al., 2021 [21] and references therein) observed asymmetric behavior in the return connectedness of energy investments. Our findings further confirm the significant effect of an extreme shock on the relationships between energy markets and economic conditions, thus helping investors assess and compare portfolio choices in periods of crisis.
Our key empirical results can be summarized as follows. First, we find a strong spillover relationship between green economy markets and traditional energy markets, and the direction is mainly from green economy markets to traditional energy markets. This suggests that crude oil is not the main driving force of green economy markets, which is consistent with the findings of Ferrer et al. (2018) [23], who found that crude oil prices are not a key driver of the stock market performance of renewable energy companies in the short or long term. Our study further reveals that price interactions in the whole system are regionally heterogeneous. For example, the U.S. and European green economy markets perform similarly, but the Asian green economy market is more complex. In addition, the spillover results show that the global and U.S. green economy markets are net contributors, whereas the other markets are net receivers (Urom et al., 2021; Gunay et al., 2022) [26,27], except for the crude oil market, which switches between being a net receiver of and a contributor to spillover, depending on the frequency band. Second, we find that the proportion of spillovers in the medium and long term is lower than that in the short term (1–5 days). Short-term spillovers are likely generated by investors’ irrational behavior, such as the herding effect and convergence effect. The dominant role of short-term spillover is also found in the connectedness between the oil and clean energy markets (Naeem et al., 2020) [28]. Finally, the total spillover is time-varying and increases dramatically during the COVID-19 pandemic, which suggests that the connectedness between traditional energy and green economy markets is sensitive to extreme events (Urom et al., 2021) [26]. The time-varying features and sensitivity to extreme events are similar to those of the connectedness between the oil and clean energy markets (Naeem et al., 2020; Foglia and Eliana, 2020) [28,29].
The remainder of this paper proceeds as follows. In the Section 2, we introduce the used model, and we describe the data and the statistics in the Section 3. The Section 4 provides an analysis of the empirical results, and the Section 5 concludes the paper.

2. Empirical Methodology

We use the DY and BK spillover indices to construct spillover networks in the time and frequency domains, respectively. The DY method is based on the notion of forecast error variance decomposition within the VAR framework, and it assesses the magnitude and direction of connectedness in the time domain. The BK model considers variations in investors’ anticipation and risk appetites and extends the DY method by decomposing the spillovers into different frequencies, which enables the estimation of the spillover effects at frequencies that represent short, intermediate and long horizons.
Both of these spillover indices are based on the VAR model, but this is sensitive to outliers and may lead to sample information loss. We therefore construct a DY and BK spillover index based on the forecast error variance decomposition within the TVP-VAR framework to investigate dynamic spillovers between green economy markets and traditional energy markets.

2.1. Time-Varying Parameter Vector Auto-Regression (TVP-VAR)

We apply the TVP-VAR model proposed by Antonakakis et al. (2018) [30], which avoids issues of the loss of sample information and sensitivity to outliers caused by setting a rolling window in the constant parameter rolling window VAR model. The TVP-VAR(p) model can be written as
Y t = β t Z t 1 + ε t , ε t | Ω t 1 ~ N ( 0 , t )
β t = β t 1 + υ t , υ t | Ω t 1 ~ N ( 0 , R t )
where  Y t = Y 1 t , Y 2 t , , Y N t  is an  N × 1  dimensional vector,  Z t 1 = Y t 1 , Y t 2 , , Y t p  is an  N p × 1  dimensional vector,  β t = β 1 t , β 2 t , , β p t  is an  N × N p  matrix of dimensional time-varying coefficients that follows a random walk model,  ε t  is an  N  dimensional perturbation vector, and  Ω t 1  represents all available information at  t 1  time.
To calculate the generalized forecast error variance decomposition (GFEVD), we transform the model in Equation (1) into a vector moving average (VMA) to represent
Y t = i = 0 Θ i t ε t i
where  Θ i t  is an  N × N  dimensional coefficient matrix.

2.2. DY Spillover Index

Based on the method proposed by Diebold and Yilmaz (2012) [12], to construct the DY spillover index in the time domain, first, we apply the H-step-ahead GFEVD  θ j k H  forecasting variable  j  due to shocks to variable  k , namely
θ j k H = σ kk 1 h = 0 H 1 ( e j Θ h e k ) 2 h = 0 H 1 ( e j Θ h Θ h e j )
where  j , k = 1 , 2 , , N Σ  denotes the covariance matrix of the error vector  ε t σ k k  is the standard deviation of  ε t  for the  k th equation, and  e k  denotes the selection vector with the  k th element being 1 and the remaining elements being 0.
The covariance decomposition matrix  D j k H  constructed from element  θ j k H  can be expressed as
D j k H = θ 11 θ 12 θ 1 N θ 21 θ 22 θ 2 N θ N 1 θ N 2 θ N N
θ j k H  is then normalized such that the sum of the elements in each row of the variance decomposition matrix is 1:
θ ˜ j k H = θ j k H k = 1 N θ j k H
with  k = 1 N θ ˜ j k H = 1 , j , k = 1 N θ ˜ j k H = N .
From this, the total spillover index  T O T A L H  can be constructed to represent the intensity of shocks spilling over between different markets:
T O T A L H = j , k = 1 j k N θ ˜ j k H j , k = 1 N θ ˜ j k H 100 = j , k = 1 j k N θ ˜ j k H N 100
Next, the total spillover index is decomposed, and then the spillover index  F R O M j H , which measures the total spillover received by variable  j  from all other variables  k , can be expressed as
F R O M j H = k = 1 k j N θ ˜ j k H j , k = 1 N θ ˜ j k H 100 = k = 1 k j N θ ˜ j k H N 100
Similarly, the spillover index  T O j H  from the output of variable  j  to all other variables  k  is
T O j H = k = 1 k j N θ ˜ k j H j , k = 1 N θ ˜ k j H 100 = k = 1 k j N θ ˜ k j H N 100
Combining Equations (6) and (7), the net spillover index  N E T j H  of variable  j  to all other variables  k  can be defined as
N E T j H = T O j H F R O M j H

2.3. BK Spillover Index

We further use the generalized decomposition spectrum defined by Barunik and Krehlik (2018) [15] to construct the BK spillover index in the frequency domain. First, based on the frequency response function  Θ e i ω = h e i ω h Θ h , the spectral density  S X ω  of  X t  at frequency  ω  can be defined as
S X ω = h = E X t X t h e i ω h = Θ e i ω Θ e + i ω
where  Θ e i ω  is obtained by performing the Fourier transform of  Θ h i = 1 S X ω  is the parameter that describes the specific distribution of the variance of  X t  over the frequency  ω , which is the key parameter for understanding the frequency dynamics.
The generalized causal spectrum can be defined as:
f ω j k σ k k 1 Θ e i ω j k 2 Θ e i ω Θ e + i ω j j
where  f ω j k  denotes the fraction of the spectrum of variable  j  at a given frequency  ω  that is caused by the shock of variable  k . Because the denominator of the above equation is the spectrum of variable  j  at a given frequency  ω f ω j k  can be interpreted as a causal relationship within frequencies.
The following further introduces the frequency share of the  j th variable as a weighting function:
Γ j ω = Θ e i ω Θ e + i ω j j 1 2 π π π Θ e i λ Θ e + i λ j j d λ
Γ j ω  denotes the power of variable  j  at a given frequency. Then, the generalized variance decomposition over the frequency band  d  is defined as
θ j k d = 1 2 π d Γ j ω f ω j k d ω
where  d = a , b , a , b π , π , a < b  and under  H θ j k = 1 2 π - π π Γ j ω f ω j k d ω  and  θ j k H  are equal in the time domain.  θ j k d  can be further normalized as
θ ˜ j k d = θ j k d k θ j k
θ ˜ j k d  measures the level of spillover from variable  k  to variable  j  on the frequency band  d . The total spillover index  T O T A L d  on frequency band  d  is
T O T A L d = k , j = 1 , k j N θ ˜ j k d N 100
The spillover index  F R O M j d  received by variable  j  from all other variables  k  can be expressed as
F R O M j d = k = 1 , k j N θ ˜ j k d N 100
Similarly, the spillover index  T O j d  of variable  j  to all other variables  k  can be expressed as
T O j d = k = 1 , k j N θ ˜ k j d N 100
The net spillover index  N E T j d  of variable  j  to all other variables  k  is then equal to
N E T j d = T O j d - FROM j d

3. Data and Summary Statistics

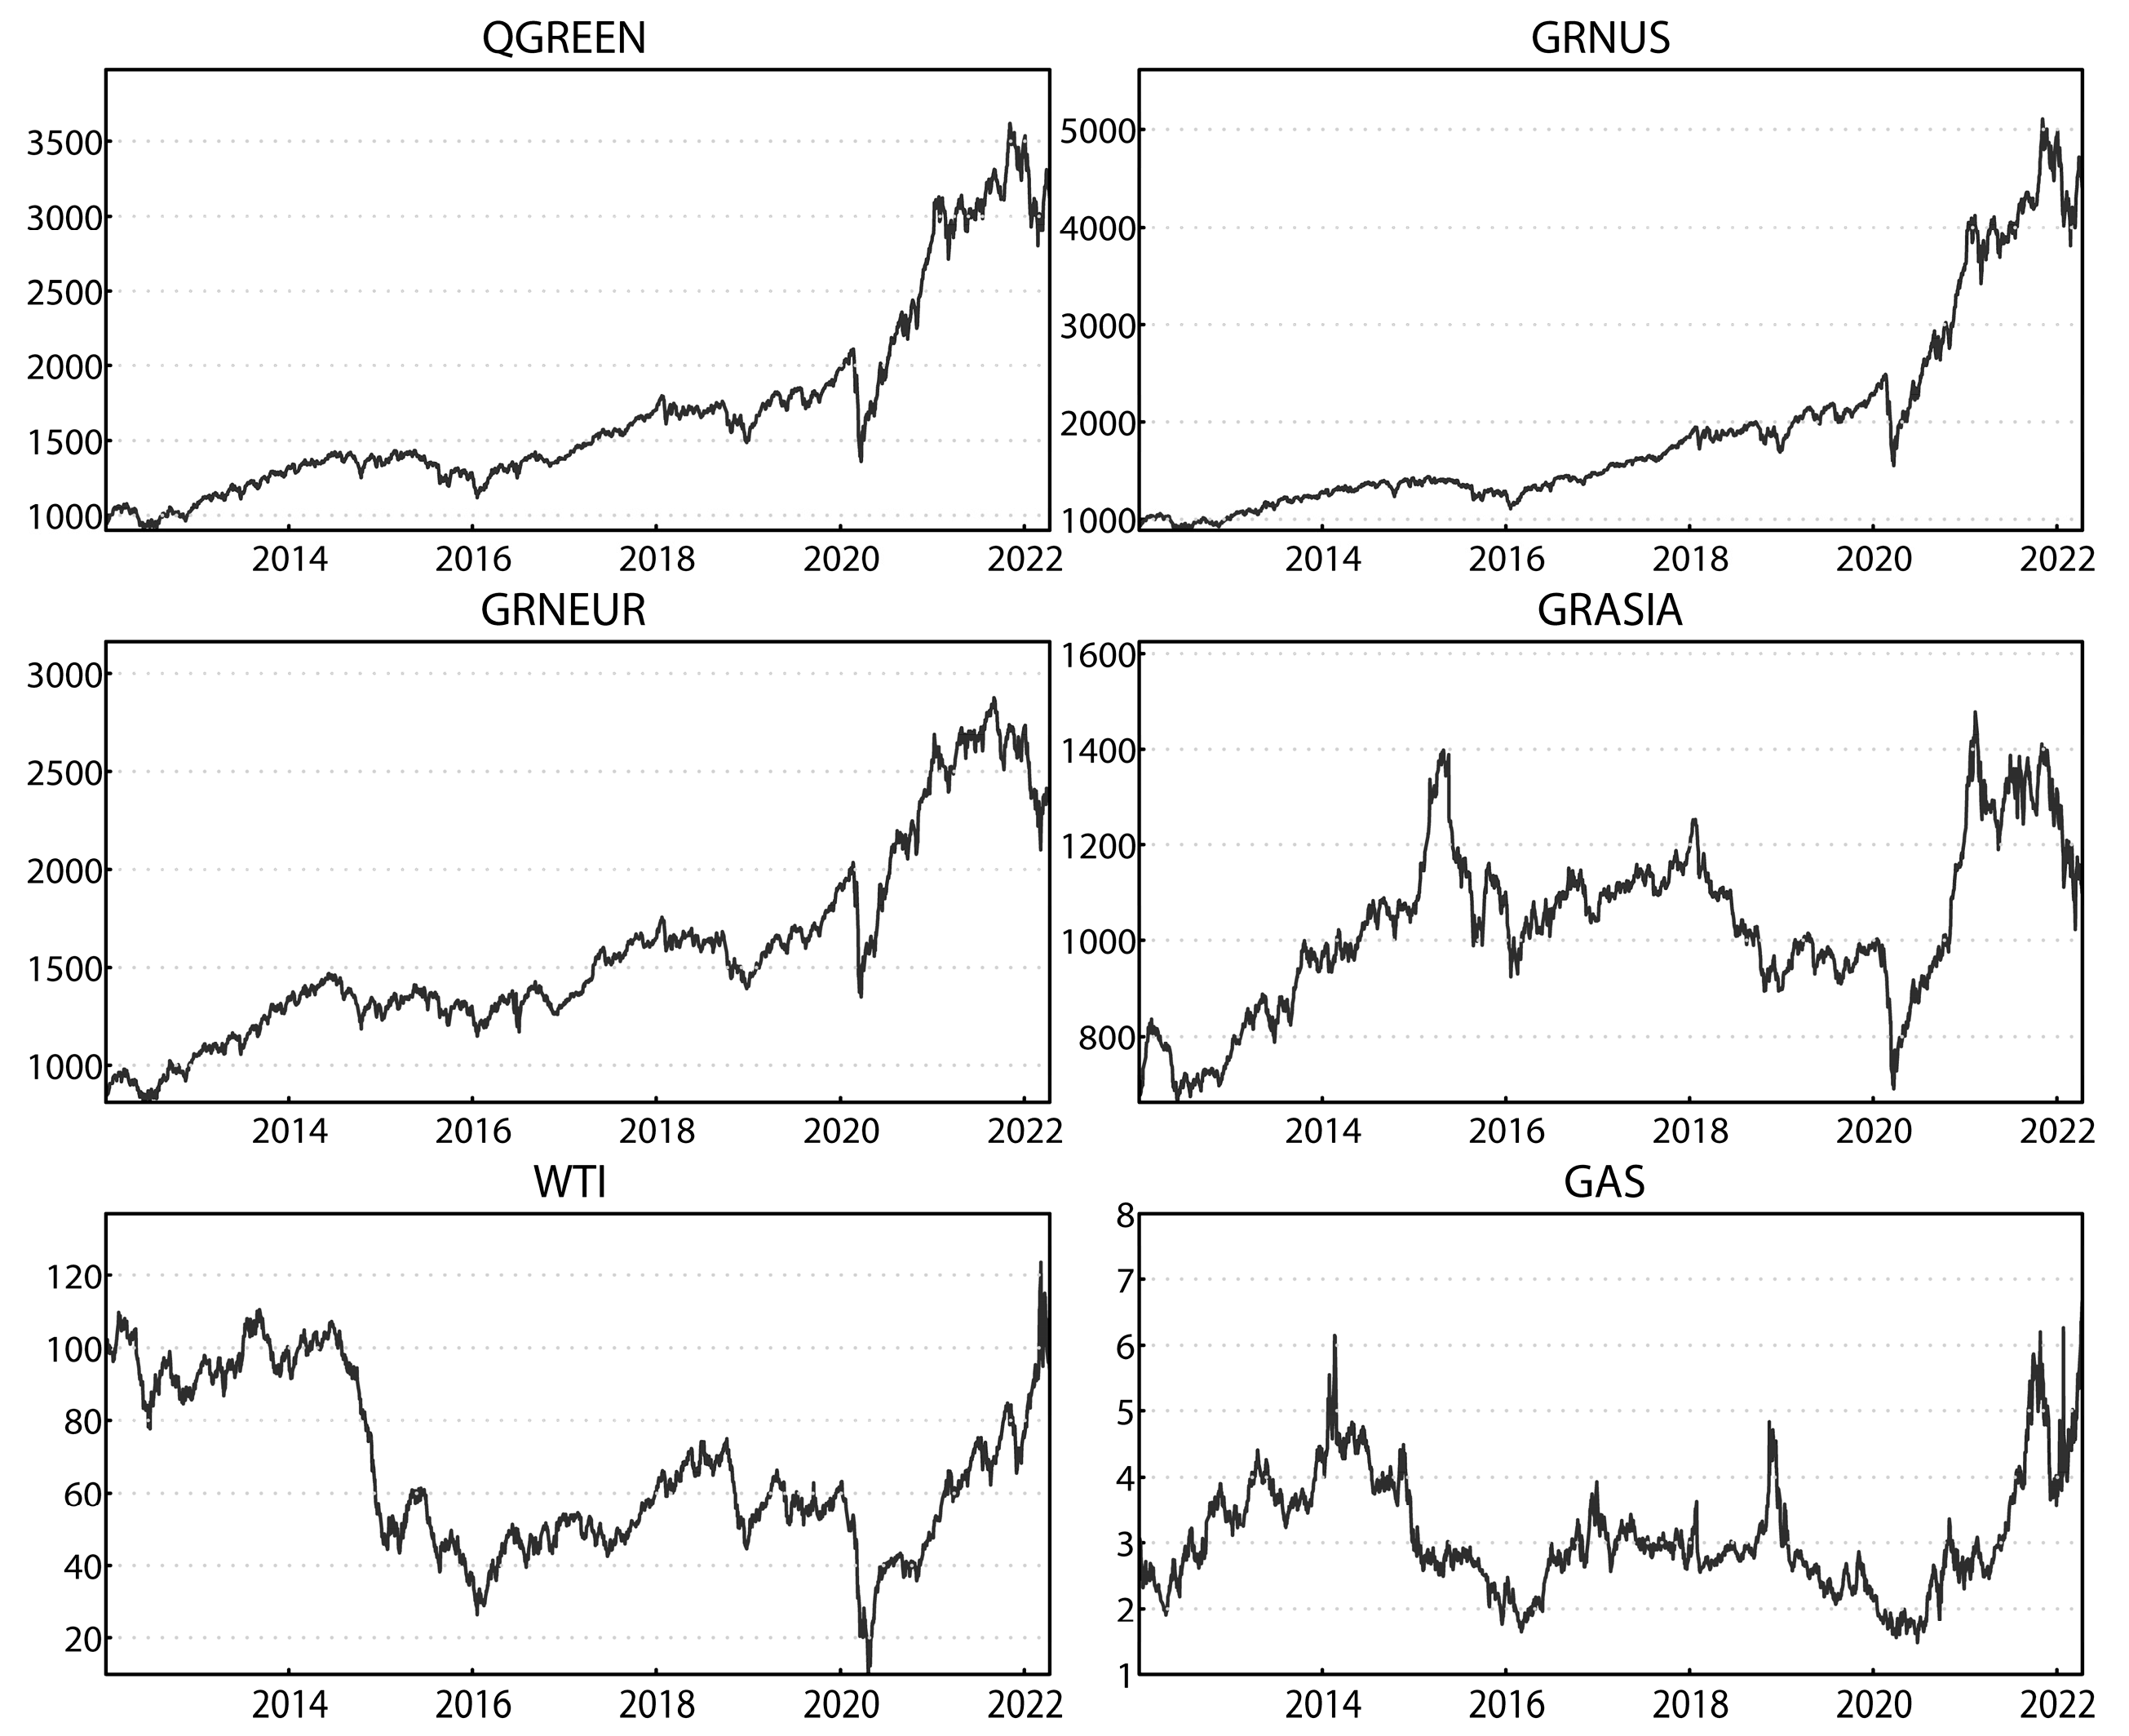
3.1. Sample and Data

The NASDAQ OMX Green Economy Index Family includes companies involved in advanced materials, clean fuels, energy efficiency, renewable energy generation, healthy living and green buildings. It tracks the stock price performance of these companies across industries associated with the sustainable economic model in every sector. We select the NASDAQ OMX Green Economy Index (QGREEN), NASDAQ OMX Green Economy US Index (GRNUS), NASDAQ OMX Green Economy Europe USD Index (GRNEUR) and NASDAQ OMX Green Economy Asia USD Index (GRNASIA), as these reflect the degree of green economy development in the global, U.S., European and Asian regions, respectively. Crude oil and natural gas are two important components of traditional energy, and the West Texas Intermediate (WTI) and natural gas (GAS) futures prices represent the benchmarks for crude oil and natural gas markets, respectively. We therefore select the WTI and GAS futures prices as proxy variables for traditional energy markets. The sample period is from 4 January 2012 to 12 April 2022, and the sample consists of 14,340 daily observations. This covers several turbulent periods and crises, including the 2014 sharp drop in oil prices and the COVID-19 pandemic. The NASDAQ Green Economy Index data are obtained from the Quandl database, and the crude oil and natural gas data are obtained from the U.S. Energy Information Administration (EIA).
Figure 1 plots the time-varying price fluctuations of both green economy markets and traditional energy markets. A clear upward trend is observed for QGREEN, GRNUS and GRNEUR during the sample period, except around the outbreak of COVID-19 in January of 2020. The three variables follow a very similar increasing trend during the sample period and suffer a drop in early 2020, except for GRNEUR, which demonstrates frequent fluctuations in price. The fluctuations in GRNASIA are the most dramatic and frequent among the national markets, reflecting the complexity and volatility of the Asian green economy market. Its average price is also lower than those of GRNUS and GRNEUR, suggesting that the Asian market is still in the initial stage of development. Most Asian countries in the green economy market are developing, so it presents them with both a challenge and an opportunity. Green economy and traditional energy markets fell significantly due to the impact of the COVID-19 pandemic in 2020, so we specifically analyze the spillover effects of the COVID-19 pandemic and discuss this in later sections of the paper.

3.2. Descriptive Statistics

Table 1 reports the descriptive statistics on the log returns. We observe that crude oil has a negative mean return, and all the other variables have positive mean returns. The green economy index of the U.S. has the largest mean value. In terms of the level of risk as measured by the standard deviation, traditional energy markets (crude oil and natural gas) appear to be riskier than green economy markets are, due to their complex risk attributes and strategic positions. We also observe negative skewness for all the return series except natural gas. The kurtosis values of the green economy and traditional energy indices are much greater than three, indicating a leptokurtic distribution with fat tails. The Jarque–Bera test reveals that the normality hypothesis is rejected for all series at the 1% significance level, indicating that the log returns of all variables do not obey a normal distribution. The ADF tests results indicate that all series are stationary and can be examined using the TVP-VAR model.

4. Empirical Analysis

In this section, we first analyze the return spillover effects in the time domain based on the DY spillover index. We then investigate the return spillover effects in the frequency domain based on the BK spillover index. Finally, we examine the return spillovers under the COVID-19 pandemic in both the time and frequency domains.

4.1. DY Spillover Analysis

4.1.1. Static Analysis

Table 2 shows that approximately 42.57% of the forecast error variations can be explained by the spillovers between the total regional green markets and traditional energy markets. This indicates that the spillovers in the system composed of green economy markets and traditional energy markets are significant over the sample period. The significantly positive “NET” values for the global and the U.S. green economy markets indicate that the two markets are net exporters of shocks, whereas the other markets are net recipients of systemic shocks. The spillover effect between the U.S. and Europe green economy markets is greater than those between the U.S. and Asia or Europe and Asia. The global green economy market has the largest effect on other markets. For example, it contributes 34.55% of the U.S., 29.46% of the European and 18.89% of the Asian green economy market spillover. The contribution values of the U.S., European and Asian green economy markets to the global green economy market are correspondingly larger than those of the crude oil and natural gas markets to the global green economy market. Therefore, the results show heterogeneity in the price interactions within green economy markets.
However, our main focus is on the spillovers between green economy markets and traditional energy markets. The shocks originating from some green economy markets appear to bring more variations to traditional energy markets than others do. The global green economy market transmits the most spillovers to the crude oil market (5.41%), followed by the U.S. green economy market (4.94%) and the European green economy market (4.03%). Similarly, the global and U.S. green economy markets also significantly contribute to the natural gas market, accounting for 1.04% and 0.79%, respectively. Traditional energy markets absorb small shocks from the Asian green economy market. In terms of comparisons between the crude oil and natural gas markets, the crude oil market experiences a greater spillover from green economies than the natural gas market does.
The impact of traditional energy markets on green economy markets also shows regional heterogeneity. The levels of spillover from the crude oil market to the global green economy market (3%), that of the U.S. (2.9%) and that of Europe (2.76%) are larger than those to the Asian green market (1.88%). The spillover index of the global green economy market to the natural gas market is lower than that to the crude oil market. Interestingly, for the whole sample, the spillover from natural gas to the Asian green economy market (0.75%) is greater than the reverse spillover effect (0.59%) and thus differs from the spillover of other regional green economy markets to traditional energy markets. Green economy markets therefore appear to have a closer interaction with crude oil than they do with natural gas.
The static spillover results show that the green economies have a greater impact on traditional energy markets of crude oil and natural gas than the reverse effect. This indicates that the transmission path of “green economy–demand–traditional energy” is greater and more stable than the reverse path. The development of the green economy is supported by national policies, and the drive to implement them is relatively strong. Therefore, its effects on the crude oil and natural gas markets are greater than the reverse effects. The green economy is also in its initial stage of development and is therefore less mature than the crude oil and natural gas markets. However, all these markets are vulnerable to the effects of market noise through policy regulation, development planning and other financial markets. Thus, crude oil may not be the main driver of the development of the green economy, but the rapid development of the green economy may have a major effect on crude oil and natural gas prices.

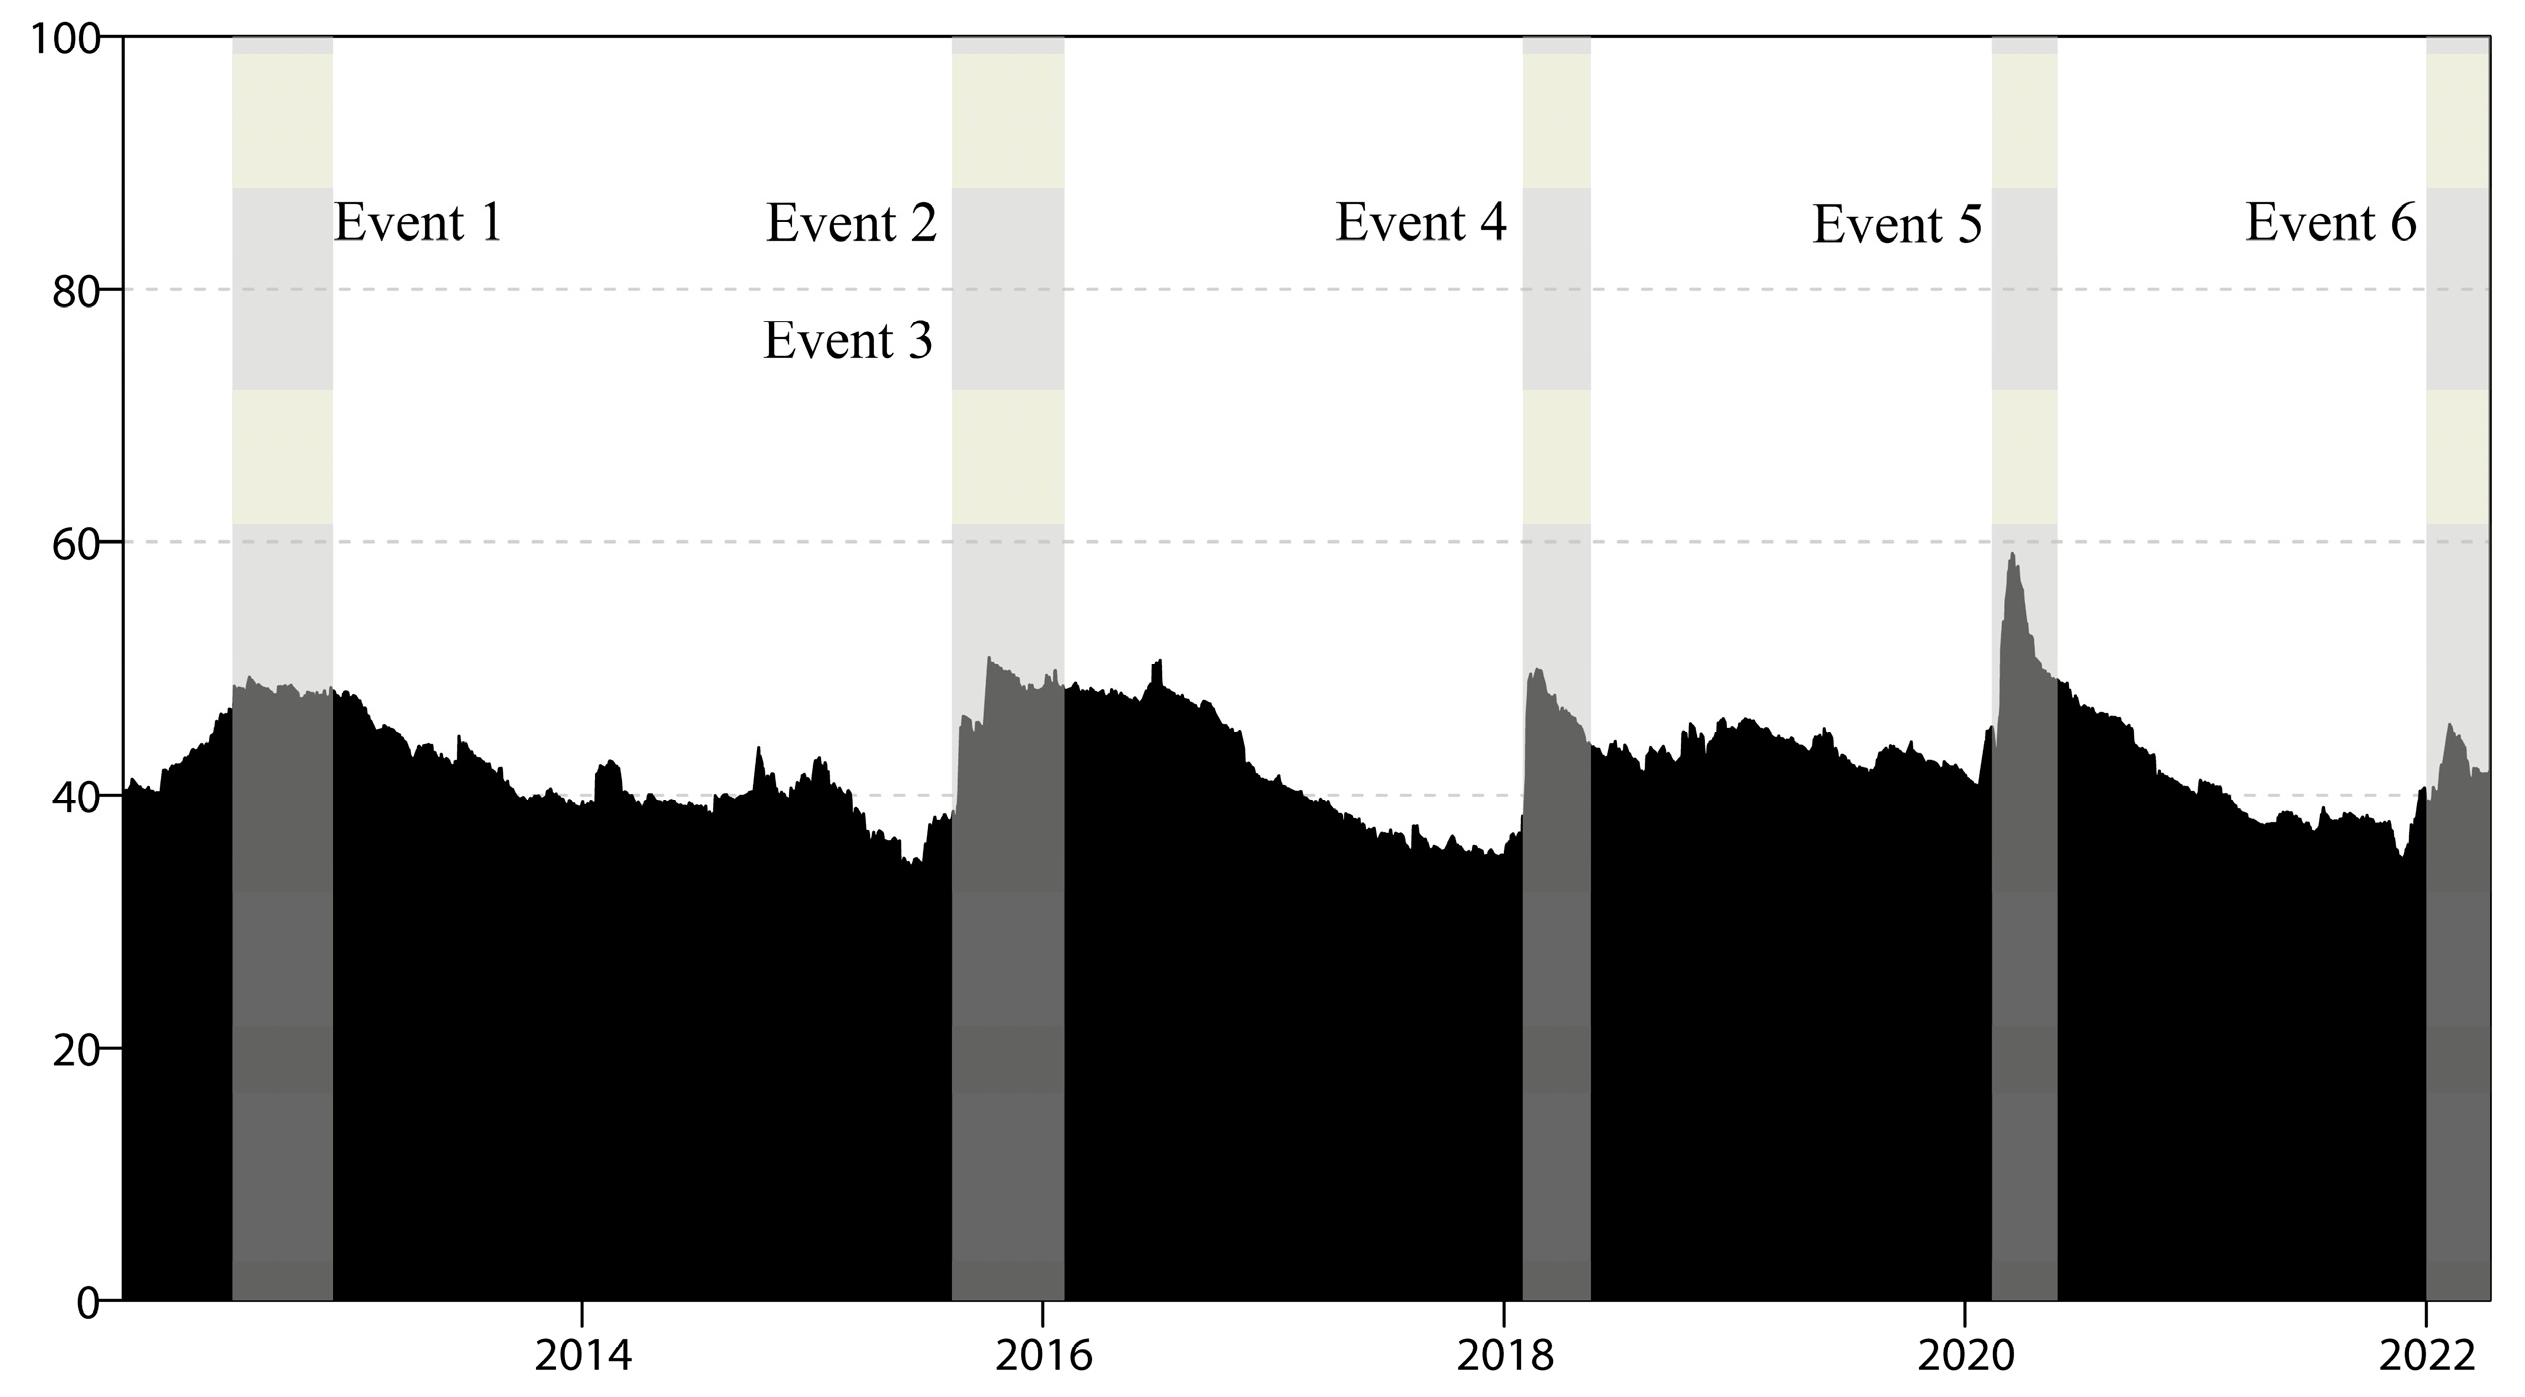
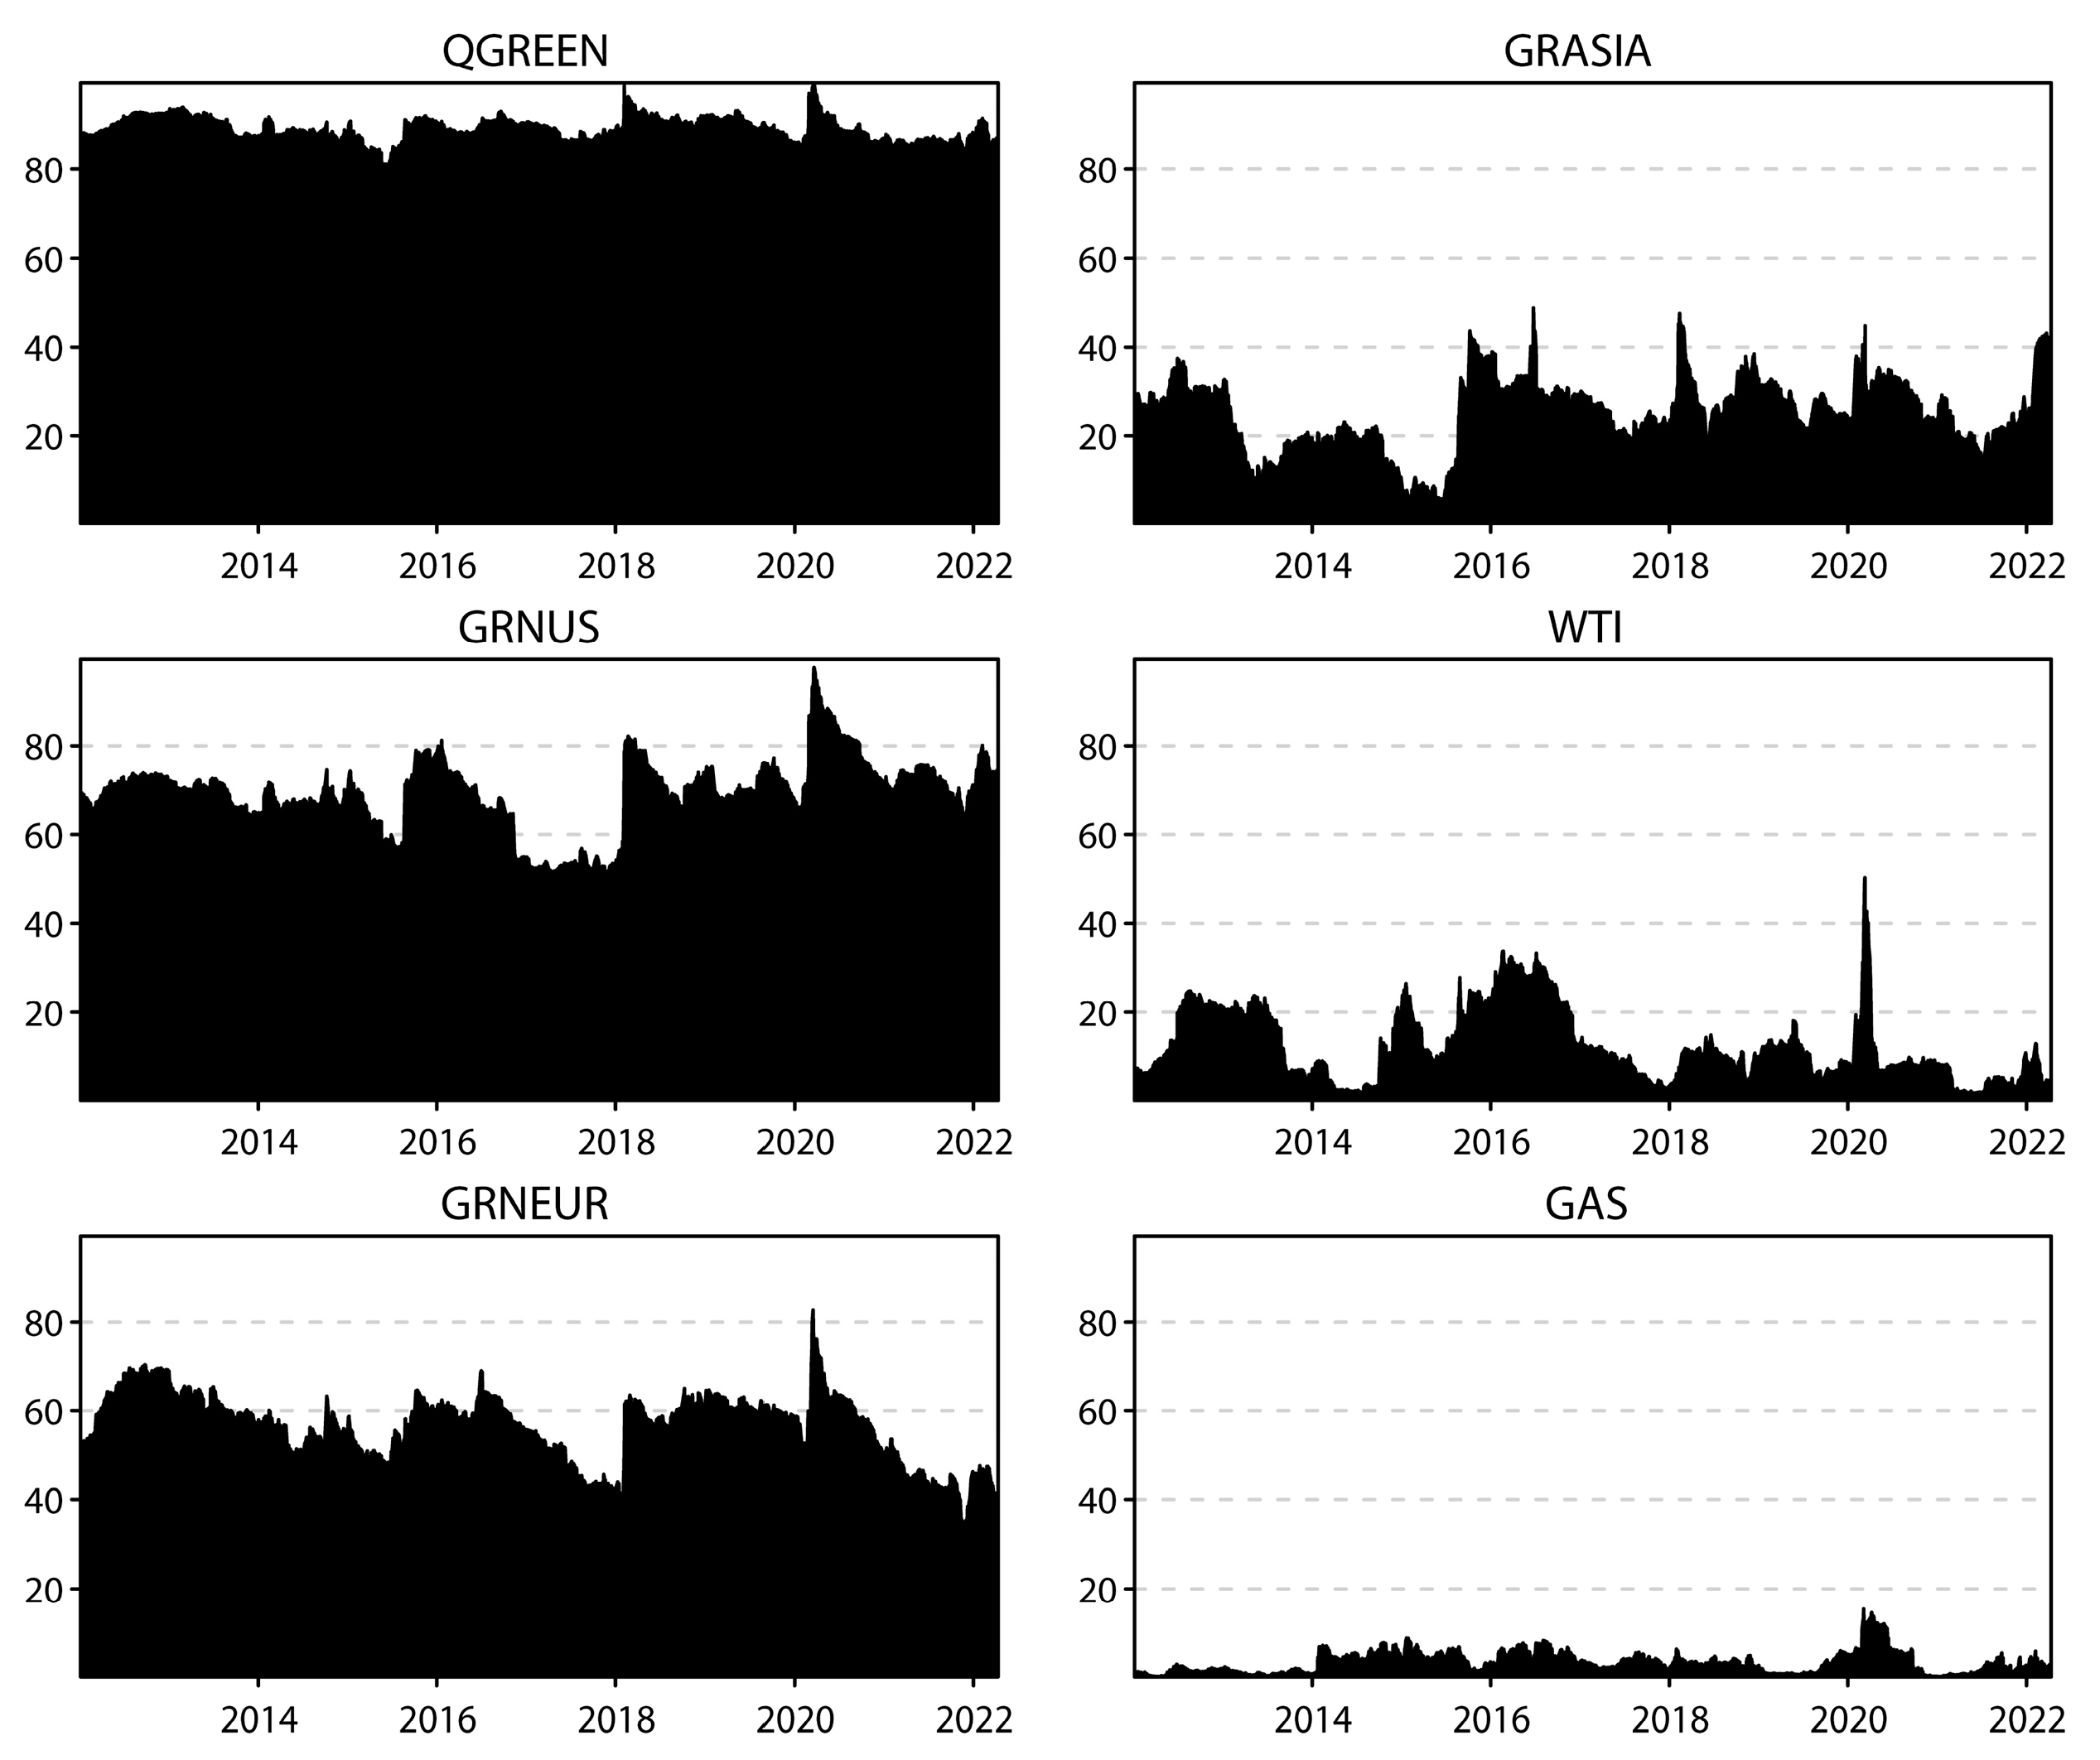
4.1.2. Dynamic Spillover Analysis

We conduct a full-sample analysis to measure the average return spillover between green economy markets and traditional energy markets during the sample observation period. However, major events may lead the actual spillover effect to fluctuate, so we use the rolling window to investigate variations in these effects over time. Figure 2 illustrates the trend of the total spillover level in the time domain. We find that the spillover level among markets varies from 34.41% to 59.10%, and the spillover effect increases significantly with the influence of major contingencies. We identify five peaks in the spillover effect, which correspond to June 2012, August 2015, February 2018, January 2020 and January 2022.
The slowdown in the economic development of emerging countries and the sovereign debt crisis of certain European countries in 2012 led to a broad contraction in crude oil market demand. However, the supply of crude oil from the U.S. and OPEC member countries continued to increase. The resulting imbalance between supply and demand drove oil prices down, with the total premium index gradually climbing to a maximum of 49.20% and then returning to the previous level as oil prices bottomed out. The premium level was then relatively stable at around 40% for a long period. On 24 August 2015, the world suffered a major stock market crash referred to as “Black Monday,” in which stocks plunged, including those in the green economy sector. Oil prices also fell hard, as they were affected by the U.S. oil glut and the geopolitical crisis, and the WTI oil price on Black Monday fell to a record low of 38.24. The total spillover level also increased from 40.23% to 45.36% and remained at a high level for a long period, peaking at 50.90%. On 5 February 2018, U.S. stocks plummeted, with the Dow posting its biggest one-day drop in its history. The exchange rates of many currencies dove in response, and companies in the U.S. green industry were then affected, with the total spillover index rising to a high of 49.90%. In January 2020, COVID-19 quickly spread globally, resulting in economies suffering heavy losses worldwide, with risks being passed across markets. The total spillover index soared to 59.10%. However, the impact of the pandemic was relatively short-lived and began to fall back after the outbreak was under control. Until January 2022, a complex set of international events (the deteriorating situation in Russia and Ukraine; the disruption of oil production in Libya; the volatile situation in Kazakhstan; the attack on the Middle East oil producer, the United Arab Emirates; and the disruption of the Iraqi pipeline) pushed up international crude oil prices and, subsequently, natural gas prices. The total spillover index increased at this time but to a much lesser extent than it did at the beginning of the outbreak.
The results of our examination of the directional spillover index of each market to all the other markets (corresponding to the “TO” row in Table 2) are shown in Figure 3. The combined spillovers of the global, U.S. and the European green economy markets to all other markets is relatively large compared to that of the Asian green economy market. The spillover index of this market only reached 50% by March 2020, whereas those of the global, U.S. and the European green economy markets peaked at 99.34%, 97.46% and 82.62%, respectively. The crude oil and natural gas markets have lower levels of external spillover than the green economy markets do, with a spike in early 2020 due to the COVID-19 pandemic. Fluctuations in the crude oil market’s spillover index were related to the events that caused oil price fluctuations.
Figure 4 shows the time-varying results regarding the spillover that each market receives from all the other markets (corresponding to the “FROM” column in Table 2). The global green economy market receives an even level of spillovers from the other markets, and so do the U.S. and the European green economy markets. Spillovers into the Asian green economy market and the crude oil and natural gas markets have relatively large fluctuations. A difference of up to 53.97% between the maximum and minimum spillovers received by the crude oil market is observed. Figure 3 and Figure 4 clearly indicate that the global, U.S. and European green economies perform similarly, whereas the Asian green economy’s performance is more complex. The U.S., as the world’s largest economy, has the highest level of development and global influence, and thus its stock market fluctuations reflect the global stock market dynamics, which represents the weathervane of the global economy. Europe is the pioneer and main promoter of green economic transformation, and green activities in Europe have had a solid public opinion base and legal protection for many years. The U.S. and Europe are the two major developed regional representatives of the green economy and have a similar level of green development, thus reflecting most of the global green economy. Thus, the green economies of the U.S. and Europe should be similar to the overall performance of the global green economy. However, in comparison, the development of the Asian green economy has not yet stabilized. Asia is a region dominated by developing countries, so its capital markets vary in terms of both opportunities and challenges. Asian countries also differ greatly in their levels of financial marketization, so they are more vulnerable to shocks from other financial markets. Many investors may only have a weak grasp of the concept of the green economy, and its implementation started relatively recently in most Asian countries. National emission reduction targets, the extent of green technology implementation, and financial support also vary greatly. Thus, the development of the Asian green economy lags behind that of Europe and the U.S., and its complex nature is reflected in its relationship with traditional energy markets. However, the Asian economy has expanded in recent years, and the market is more active, thus providing a broader space for green economic development.
Figure 5 shows that the global and U.S. green economy markets are net exporters of shocks. The net spillover index of the global green economy market reached 33.76% on 6 February 2018, the day after the U.S. stock crash, and that of the U.S. green economy market surged to 28.35% during the COVID-19 period. Conversely, the European and Asian green economy markets were net recipients of spillovers. The return spillover index of the Asian green economy market was more volatile than that of the European green economy market, and its highest net spillover value occurred during the COVID-19 period. Traditional energy markets are also net recipients of spillovers, and the crude oil market became a net exporter of risk for a brief period in April 2020. Thus, it appears to be more influenced by other markets than by the natural gas market. However, at this time, the risk spillovers that this market received increased to 13.64%, likely due to the significant decline in global crude oil demand and the financial and commodity market volatility, which complicated investment decisions.
Based on the results in Figure 3, Figure 4 and Figure 5, we draw the following conclusions. First, green economy markets and traditional energy markets are relatively closely connected. The global and the U.S. green economy markets are net exporters of shocks, and the other markets are net recipients of systemic shocks. Second, we observe regional heterogeneity within green economy markets. The global green economy market and those of the U.S. and Europe perform similarly, whereas the pattern in the Asian green economy market is more complex. Third, the crude oil market has closer interactions with green economy markets than with the natural gas market, but crude oil is not the main driving factor of the green economy. Finally, the spillover between the green economy and traditional energy markets has obvious time-varying characteristics. We find that spillovers between markets spike in times of extreme global events, such as the global stock market crash, the oil price crisis and the COVID-19 pandemic.

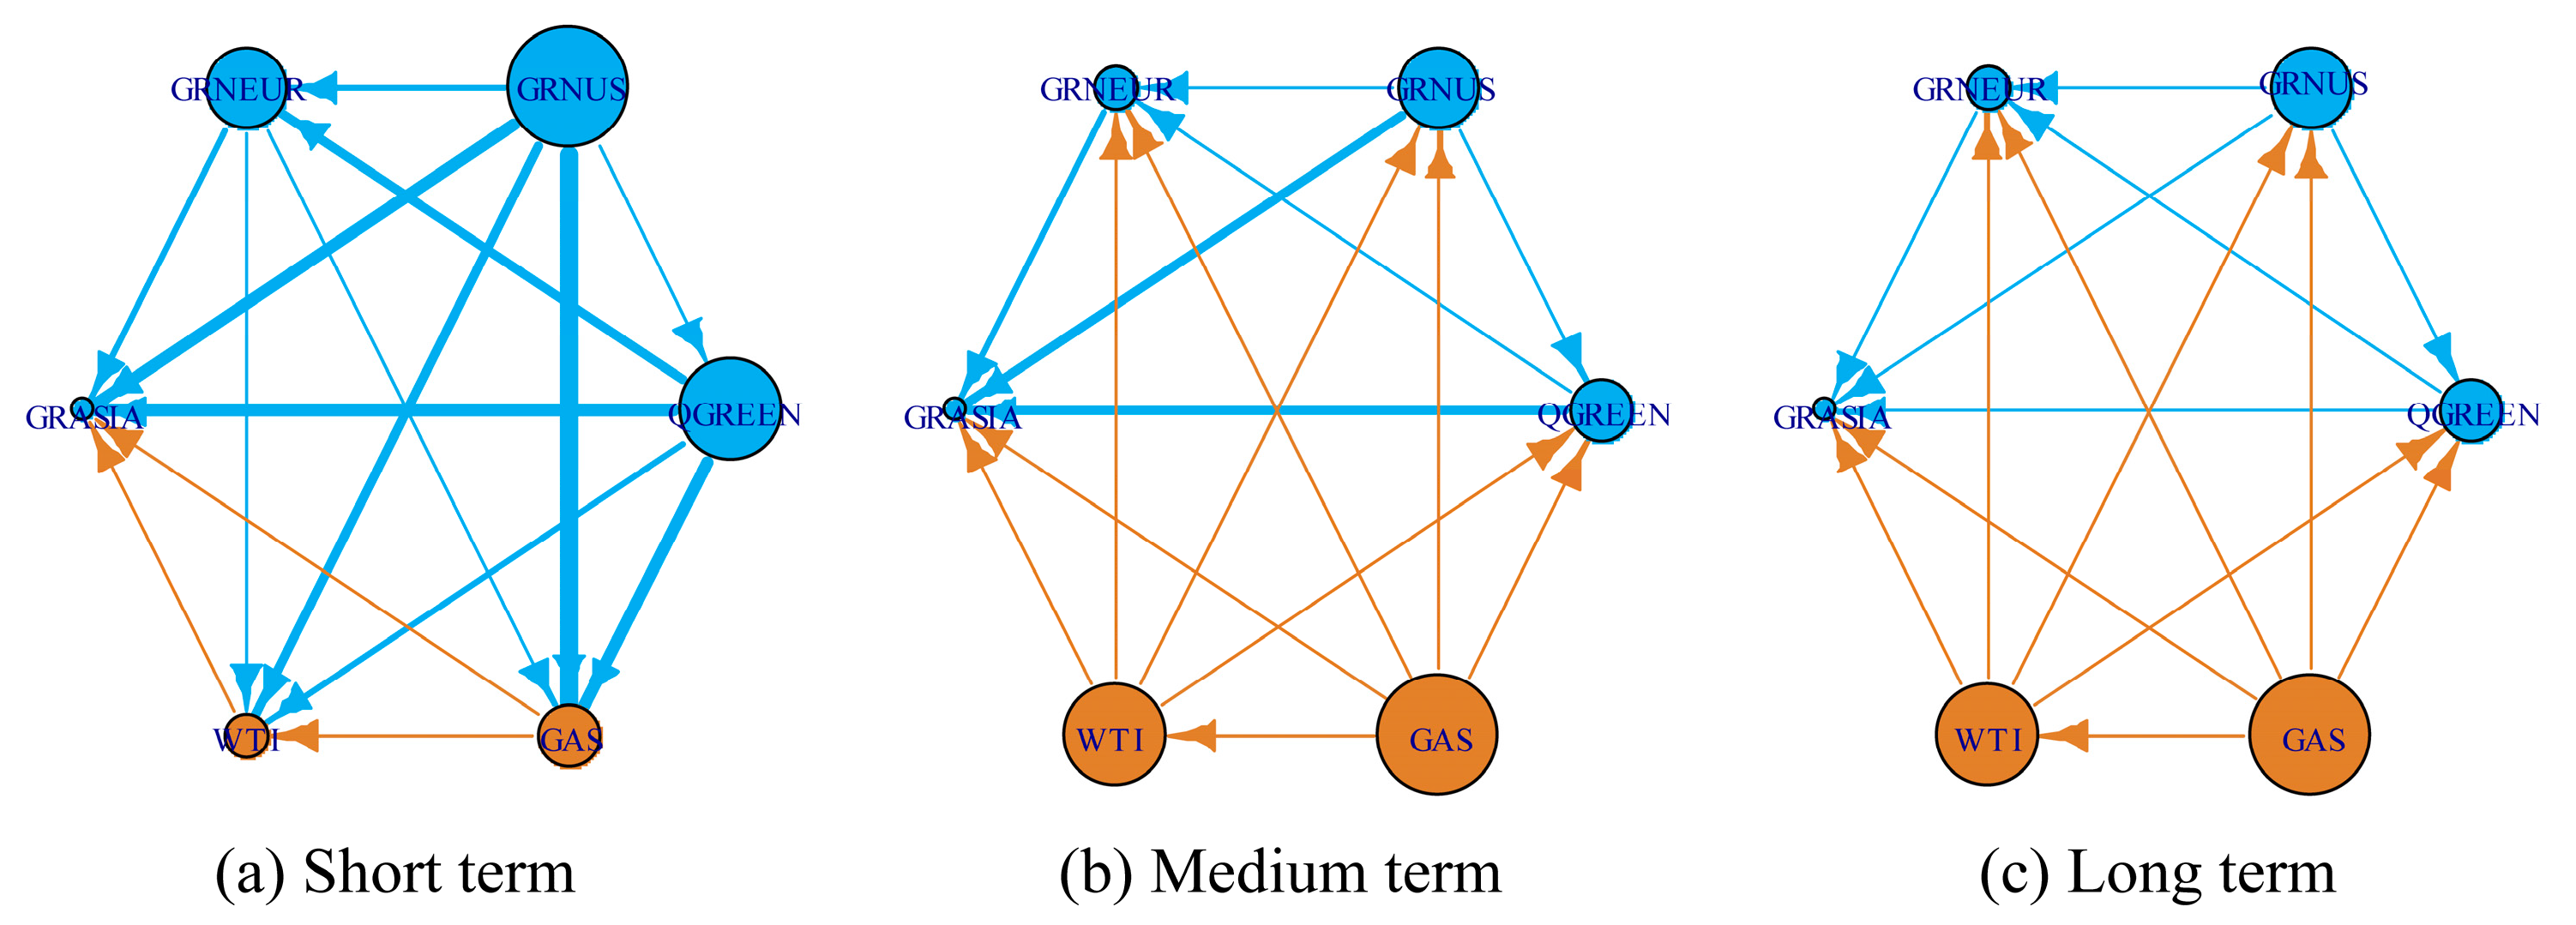
4.2. Frequency Domain Analysis

4.2.1. Static Results

In this section, we report the green economy–traditional energy system spillovers, as estimated for different horizons. We decompose the dynamics of the total return spillover into short-term (1–5 days), medium-term (5–20 days) and long-term (20 days–infinite duration) frequency bands using the BK spillover index. The results are reported in Table 3, of which Panels A, B, and C summarize the short-, medium- and long-term spillovers, respectively. The short-term spillover is 26.31%, the medium-term spillover is 10.99%, and the long-term spillover is 5.92%, implying that spillovers occurring within 1–5 days are the largest among the three frequency bands and thus constitute the majority of the total spillovers. Barunik and Krehlik (2018) [15] argued that short-term components usually correspond to noisy trading behaviors, such as herding effects and investor sentiments, whereas long-term components generally refer to long-term persistent behaviors, such as economic fundamentals’ fluctuations. From this perspective, the spillover effects between global green economy markets and traditional energy markets, mainly generated in the short term, occur through the channels of irrational investor behaviors, such as the herding effect, the convergence effect and limited rationality.
The results regarding the short-term spillover are in line with those findings in the time domain analysis. For example, both the global and the U.S. green economy markets are net exporters of shocks, and the other markets are net recipients of systemic shocks. The results are similar when estimating the strength of these shocks, as crude oil absorbs many more shocks than natural gas does in the short term. We also note that the global green economy market remains the main contributor to traditional energy markets.
In terms of medium-term spillover, we find that net receivers and senders remain the same as they do in the short-term. One exception is that the crude oil market became a net sender. Additionally, the magnitudes of “NET” for the U.S., European and Asian green economy markets are larger than those found for their counterparts with short-term returns. Second, the spillovers in all the green economy markets are transmitted into traditional energy markets to a lesser degree than those found for short-term returns. Similarly, traditional energy markets transmit less to green economy markets relative to the short-term analysis. These findings show that the total return spillover in the short-term is greater than that in the medium term. Third, the impact of green economy market spillovers on crude oil remains higher relative to that of natural gas.
The long-term result resembles that of the medium-term analysis. The net receivers and senders remain constant in the transmission process. However, the magnitude of spillovers in the long term is the smallest of the three frequency bands.

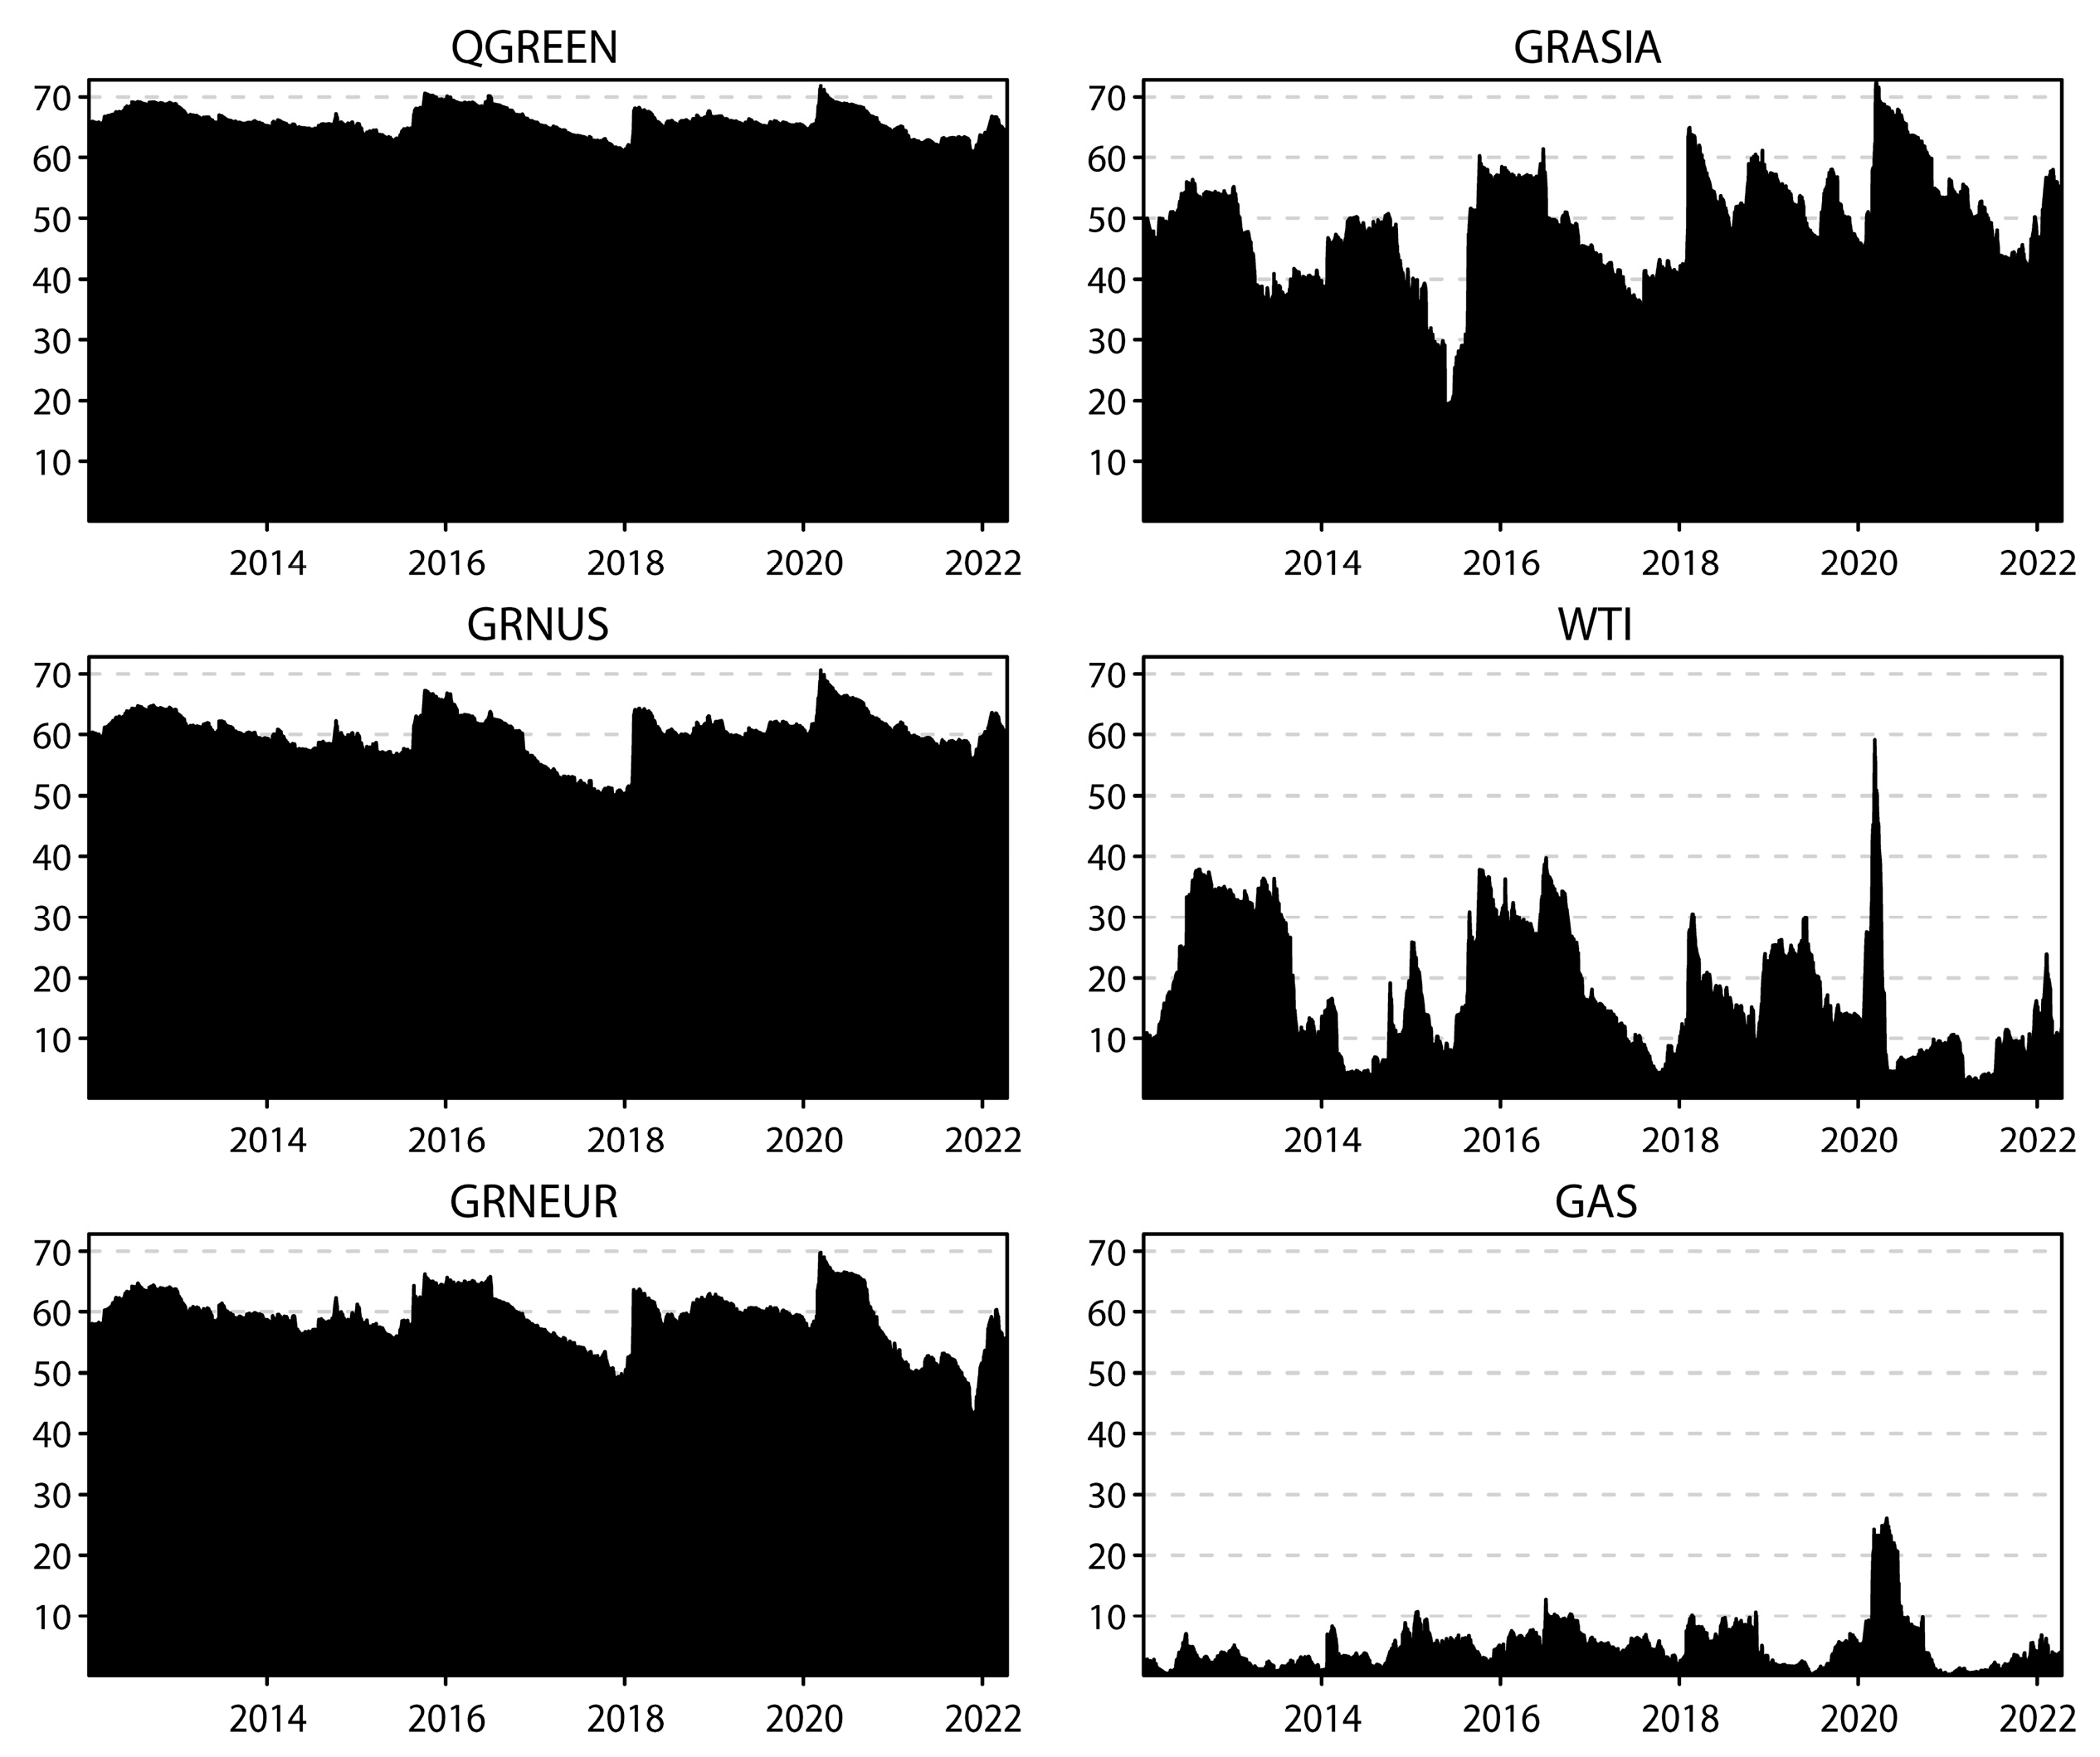
4.2.2. Dynamic Results

As in the analysis of the time domain, we compute the dynamic spillover in the frequency domain. Figure 6 illustrates the dynamics of the total spillover effects. The spillover level in the various frequency domains is highly consistent with that in the time domain, and the spillover level over the short term in the full sample is much larger than those of the medium and long terms and fluctuates between 17.71% and 34.42%. This suggests that the total spillover effect across the green economy markets and the traditional energy markets is mainly driven by shocks in the short term. In periods of rising economic uncertainty and geopolitical risks, investors who do not consider the economic fundamentals tend to be risk-averse and sell off risky assets in large quantities, leading to the spread of risk between green economy markets and traditional energy markets. The correlation among the markets increases significantly in the short term and drives sharp fluctuations in the level of total spillovers in the time domain.
Figure 7, Figure 8 and Figure 9 show the time-varying graphs of the net directional spillover index in various frequency bands. The net spillover index based on the short period clearly fluctuates more frequently. The global green economy market is the net exporter, and the Asian green economy market is the net recipient, regardless of the frequency band. The results based on DY show that the U.S. green economy market is a net exporter, but in the short term, this only holds in phases. The European green economy market and the crude oil and natural gas markets also display the same pattern. This demonstrates the importance of considering frequency bands when researching cross-market information spillover. This result has important implications for asset allocation, hedging and diversified portfolio strategies.
To conclude, the results of frequency domain tests can be summarized as follows. First, we confirm the net transmitter roles of the global and U.S. green economies. Second, the spillover is time-varying; for example, the crude oil market is the recipient of shock in the short term, whereas it becomes the exporter in the medium and long terms. Third, the short-term spillover component plays a dominant role.

4.3. COVID-19 Pandemic Impact Analysis

Through the above analysis, we find that the COVID-19 pandemic greatly increased the correlation among markets, and the spillover level significantly increased. We then further analyze the spillovers before and after the outbreak of COVID-19. On 30 January 2020, the World Health Organization classified COVID-19 as a public health emergency of international concern. On 26 April 2020, the last patient was discharged from a hospital in Wuhan, which represents a landmark in pandemic prevention and control. Following the research of Dai et al. (2022) [31], we divide the whole sample period into three sub-periods to analyze the evolution over time of return spillovers. The three subperiods are pre-COVID-19 (from 1 November 2019 to 23 January 2020), COVID-19 (from 3 February 2020 to 26 April 2020), and post-COVID-19 (from 27 April 2020 to 12 April 2022). As the sub-periods are not equal in length, estimation bias may result, so we also use the sub-period from 27 April 2020 to 17 July 2020 as the post-COVID-19 sample to make the subsample intervals equal. The results are consistent with those reported.
Table 4 shows the spillover relationship between green economy markets and traditional energy markets before and after the outbreak of the COVID-19 pandemic. Before the pandemic, the total spillover is 44.51%, but it increases significantly to 56.92% after the outbreak. Except the crude oil market, the levels of “TO” spillovers in other markets increase significantly, and particularly the spillover level of the U.S. green economy market to other markets, which increase from 65.73% to 97.91%. Similarly, “FROM” spillovers also increase sharply, with the largest difference in spillover levels found in the Asian green economy market, reaching 37.47% (73.79–36.32%). These data show that the outbreak of COVID-19 significantly increased the level of shock linkage between green economy markets and traditional energy markets, and the risk spillover in green economy markets significantly increases.
In terms of the “NET” index, the global green economy market and the U.S. green economy market are both net transmitters of return spillovers. Their net spillovers are all positive across the sample period, but the values peak during the pandemic at 24.49% and 28.41%, respectively. The Asian green economy market and the crude oil and natural gas markets remain the net receivers of return spillovers. The net spillover index of the European green economy market is negative before and after the pandemic, but it becomes positive and small during the pandemic.
During the COVID-19 pandemic, economic growth declined in the short term, and economic uncertainty increased in the medium and long term, which directly affected green economy markets (Wang et al., 2022) [32]. The economic downturn aggravated the imbalance between the environment and the economy, affecting the development of green economies. Government support for the green economy also weakened. Enterprises in the green sector were affected (Jiang et al., 2021) [33], and green development faced a greater funding gap (Hoang et al., 2021) [9]. In addition, the pandemic may also have indirectly affected the green economy market through the traditional energy market. The shrinking demand for energy and the imbalance between supply and demand led to the decline of crude oil and natural gas prices, greatly increasing the opportunity cost of renewable energy use and increasing the uncertainty of renewable energy development (Li et al., 2022) [34], thus affecting the green economy transition process. This is reflected in the static spillover in Table 4, Panel B. The direct impact of the COVID-19 pandemic, along with the indirect impact of the traditional energy markets, led the spillover level of the green economy markets to increase significantly, and then risks continued to be transmitted to the traditional energy markets.
However, this short economic downturn does not change the fundamentals of green economic development. The pandemic also brought new opportunities for global green development. In the post-pandemic era, many governments have regarded green transformation as an important means of economic recovery. The European Commission announced the intention to invest up to 750 billion euros in a stimulus plan prioritizing green investments, such as renewable energy, a circular economy and clean transport logistics. The Chinese government has increased low-carbon investment and new infrastructure construction to stimulate the economy in a sustainable way. As the global economy rebounded after the pandemic, the total spillover level fell back to 39.13%. The degree of spillover from the green economy market in the post-COVID-19 period decreased compared with that during the pandemic, but it remains higher than the level before the pandemic. The findings for traditional energy markets are similar, and the spillover effects between the green economy and crude oil markets are more evident than those with natural gas.
In Panel B of Table 4, the spillover effects are decomposed into short, medium and long terms. Figure 10 plots the net pairwise directional spillovers between green economy markets and traditional energy markets during the COVID-19 period. The lines in Figure 10a are clearly thicker than those in Figure 10b,c, indicating that the spillover levels in the short term are significantly higher than those in the long and medium terms, both in the total and directional spillover indices. The greater number of blue lines in Figure 10a indicates that the net spillover level of the global green economy and regional green economy markets to other markets is higher in the short term, and the traditional energy market is more vulnerable to this short-term impact. However, this situation changes in the medium and long terms. In Figure 10b,c, the number of orange lines increases, and the nodes representing WTI and natural gas markets become larger, indicating that the spillover capacity of the green economy market weakens in the medium and long terms, and the net spillover scale of the traditional energy market increases accordingly. In addition, the global and U.S. green economy markets mainly transmit spillover effects, regardless of whether it is in the short, medium or long terms, and the Asian green market is the main recipient of the spillover. Moreover, the net spillover direction in the short term is exactly the same as that found in the time domain. Clearly, the spillover effect during the pandemic was mainly driven by shocks in the short term. During this period, green sector stock indices plunged, and the prices of crude oil and natural gas fluctuated dramatically due to market sentiment, herding effects and other market factors. The correlation between the two is strengthened in the short term.
Thus, we derive the following results from the spillover network. First, the connectedness between green economy markets and traditional energy markets is time-varying. Second, spillover effects are more evident between green economies and crude oil than those between green economies and natural gas. Third, the global and U.S. green economy markets are again the main senders of shocks to other markets. Finally, and most importantly, the spillover in the short term is more pronounced than the medium- and long-term spillover in all the market states.

5. Conclusions

The green economy is an important component of sustainable development and has gained worldwide attention due to the challenges posed by climate changes and the need for carbon peaking and carbon neutrality. Green development also helps to reduce traditional energy use and can transform the energy structure. Characterizing the relationship between green economy markets and traditional energy markets is therefore important. In this study, we focus on the time and frequency dynamics and demonstrate the direction and magnitude of spillovers between the green economy markets and traditional energy markets.
We apply the DY spillover index and find that the total spillover index value of the green economy–traditional energy system is 42.57% across the sample period. The spillover direction is mainly from the green economy market to the traditional energy market. We find that crude oil is not the main driver of the green economy market; rather, it is driven by factors such as technological development, capital investment and government policies. The global and U.S. green economy markets are net contributors, whereas the remaining markets are net receivers of spillovers in the system. In addition, the spillover is time-varying and sensitive to extreme events. Its peaks are found to accompany extreme global events, such as the global stock market crash, the oil price crisis and the COVID-19 pandemic. In addition, the results point to regional heterogeneity in spillovers within green economy markets. The performance of the U.S. and the European green economy markets are similar, whereas the Asian green economy market differs, as it is more complex.
We apply the BK spillover index and show that the short-term spillover of the green economy–traditional energy system is greater than that in the medium and long term. The crude oil market is a net receiver in the short term and a net contributor in the medium and long terms. Our analysis of net pairwise directional connectedness demonstrates that the crude oil market receives more shocks from green economy markets than the natural gas market receives. Consistent with the time domain results, the frequency domain results also support that global and U.S. green economies are net contributors of spillovers in all frequency bands. The European and Asian green economy markets, along with the natural gas market, are net receivers regardless of the time horizon.
Our analysis of the COVID-19 period reveals that the spillover intensified during the pandemic. We found that the outbreak of the COVID-19 pandemic significantly increased the level of spillovers among various markets, and in the short term, it improved the risk diffusion ability of the green economy market. However, in the later stage of the pandemic, the transformation of the global green economy accelerated, which also brought new impetus to the economic recovery of various regions. However, it may take longer to fully recover and reach pre-pandemic levels.
Our empirical findings have crucial implications for various international investors and policymakers in terms of portfolio construction and risk management at different investment horizons (Mensi et al., 2022) [35]. For short-term investors and portfolio managers, they should avoid traditional energy and green economy stocks, especially the U.S. and European green economy stocks in a portfolio due to the strong short-term spillovers among them. Moreover, short-term investors with traditional energy in their portfolio could profit from significant information on global green economy stocks in the early stage of an extreme event, such as the COVID-19 pandemic. For investors and portfolio managers with longer horizons, as the total spillover between traditional energy and green economy stocks decreases in the long term, they may be able to use information on traditional energy prices for hedging and diversifying green economy stock price risk. Finding evidence of heterogeneity in regional green economy stocks indicates that international investors in different regions cannot adopt similar investment strategies all the time and should update weights in portfolios of regional green economy stocks and traditional energy assets following specific market conditions. Additionally, policymakers should be aware that global green economy sectors do not need specific policy measures of protection against crude oil and gas price shocks. Instead, the traditional energy markets should adopt policy measures for shocks from global green economy stocks.

Author Contributions

Conceptualization, L.Z. and F.Z.; methodology, L.Z.; software, W.H. and A.W.; validation, L.Z.; formal analysis, L.Z.; investigation, W.H.; resources, W.H.; data curation, W.H. and A.W.; writing—original draft preparation, W.H. and A.W.; writing—review and editing, L.Z. and F.Z.; visualization, F.Z.; supervision, L.Z.; project administration, L.Z.; funding acquisition, L.Z. and F.Z. All authors have read and agreed to the published version of the manuscript.

Funding

This research was funded by the Philosophy and Social Science Research Project for Colleges and Universities of Jiangsu Province (grant number 2018SJA1148), Science and Technology Plan Project of Yangzhou (SRK2019000068), the Natural Science Foundation of China (NO.72201240), the Natural Science Foundation of Zhejiang Province (LQ20G030027) and the Fundamental Research Funds for the Central Universities.

Data Availability Statement

Not applicable.

Acknowledgments

This research received technical support from Hong Shen.

Conflicts of Interest

The authors declare no conflict of interest.

References

  1. Ali, E.B.; Anufriev, V.P.; Amfo, B. Green economy implementation in Ghana as a road map for a sustainable development drive: A review. Sci. Afr. 2021, 12, e00756. [Google Scholar] [CrossRef]
  2. Jin, X. Guang Yuan Low-carbon Development Path Based on SWOT Analysis. J. Sustain. Dev. 2012, 5, 78–83. [Google Scholar] [CrossRef] [Green Version]
  3. IEA. World Energy Outlook 2022. 2022. Available online: https://www.iea.org/reports/world-energy-outlook-2022/executive-summary (accessed on 16 March 2023).
  4. Ren, B.; Lucey, B. A clean, green haven?—Examining the relationship between clean energy, clean and dirty cryptocurrencies. Energy Econ. 2022, 109, 105951. [Google Scholar] [CrossRef]
  5. Urom, C.; Mzoughi, H.; Ndubuisi, G.; Guesmi, K. Directional predictability and time-frequency spillovers among clean energy sectors and oil price uncertainty. Q. Rev. Econ. Financ. 2022, 85, 32–341. [Google Scholar] [CrossRef]
  6. Sharma, G.D.; Sarker, T.; Rao, A.; Talan, G.; Jain, M. Revisiting conventional and green finance spillover in post-COVID world: Evidence from robust econometric models. Glob. Financ. J. 2022, 51, 100691. [Google Scholar] [CrossRef]
  7. Ding, Q.; Huang, J.; Zhang, H. Time-frequency spillovers among carbon, fossil energy and clean energy markets: The effects of attention to climate change. Int. Rev. Financ. Anal. 2022, 83, 102222. [Google Scholar] [CrossRef]
  8. Hosseini, S.E. An outlook on the global development of renewable and sustainable energy at the time of COVID-19. Energy Res. Soc. Sci. 2020, 68, 101633. [Google Scholar] [CrossRef]
  9. Hoang, A.T.; Nižetić, S.; Olcer, A.I.; Ong, H.C.; Chen, W.H.; Chong, C.T.; Thomas, S.; Bandh, S.A.; Nguyen, X.P. Impacts of COVID-19 pandemic on the global energy system and the shift progress to renewable energy: Opportunities, challenges, and policy implications. Energy Policy 2021, 154, 112322. [Google Scholar] [CrossRef]
  10. Eroğlu, H. Effects of COVID-19 outbreak on environment and renewable energy sector. Environ. Dev. Sustain. 2021, 23, 4782–4790. [Google Scholar] [CrossRef]
  11. Bhuiyan, M.A.; An, J.; Mikhaylov, A.; Moiseev, N.; Danish, M.S.S. Renewable Energy Deployment and COVID-19 Measures for Sustainable Development. Sustainability 2021, 13, 4418. [Google Scholar] [CrossRef]
  12. Diebold, F.X.; Yilmaz, K. Better to give than to receive: Predictive directional measurement of volatility spillovers. Int. J. Forecast. 2012, 28, 57–66. [Google Scholar] [CrossRef] [Green Version]
  13. Korobilis, D.; Yilmaz, K. Measuring Dynamic Connectedness with Large Bayesian VAR Models. SSRN Electron. J. 2018, 3099725. [Google Scholar] [CrossRef] [Green Version]
  14. Antonakakis, N.; Gabauer, D.; Gupta, R. International monetary policy spillovers: Evidence from a time-varying parameter vector autoregression. Int. Rev. Financ. Anal. 2019, 65, 101382. [Google Scholar] [CrossRef]
  15. Baruník, J.; Křehlík, T. Measuring the Frequency Dynamics of Financial Connectedness and Systemic Risk*. J. Financ. Econom. 2018, 16, 271–296. [Google Scholar] [CrossRef]
  16. Stiassny, A. A spectral decomposition for structural VAR models. Empir. Econ. 1996, 21, 535–555. [Google Scholar] [CrossRef]
  17. Reboredo, J.C.; Rivera-Castro, M.A.; Ugolini, A. Waveletbased test of co-movement and causality between oil and renewable energy stock prices. Energy Econ. 2017, 61, 241–252. [Google Scholar] [CrossRef]
  18. Bouoiyour, J.; Gauthier, M.; Bouri, E. Which is leading: Renewable or brown energy assets? Energy Econ. 2023, 117, 106339. [Google Scholar] [CrossRef]
  19. Li, J.; Umar, M.; Huo, J. The spillover effect between Chinese crude oil futures market and Chinese green energy stock market. Energy Econ. 2023, 119, 106568. [Google Scholar] [CrossRef]
  20. Saeed, T.; Bouri, E.; Tran, D.K. Hedging strategies of green assets against dirty energy assets. Energies 2020, 13, 3141. [Google Scholar] [CrossRef]
  21. Saeed, T.; Bouri, E.; Alsulami, H. Extreme return connectedness and its determinants between clean/green and dirty energy investments. Energy Econ. 2021, 96, 105017. [Google Scholar] [CrossRef]
  22. Xi, Y.; Zeng, Q.; Lu, X.; Huynh, T.L. Oil and renewable energy stock markets: Unique role of extreme shocks. Energy Econ. 2022, 109, 105995. [Google Scholar] [CrossRef]
  23. Ferrer, R.; Shahzad, S.J.H.; López, R.; Jareño, F. Time and frequency dynamics of connectedness between renewable energy stocks and crude oil prices. Energy Econ. 2018, 76, 1–20. [Google Scholar] [CrossRef]
  24. Chen, Y.; Wei, Y.; Bai, L.; Zhang, J. Can Green Economy stocks hedge natural gas market risk? Evidence during Russia-Ukraine conflict and other crisis periods. Financ. Res. Lett. 2023, 53, 103632. [Google Scholar] [CrossRef]
  25. Strohsal, T.; Proaño, C.R.; Wolters, J. Characterizing the financial cycle: Evidence from a frequency domain analysis. J. Bank. Financ. 2019, 106, 568–591. [Google Scholar] [CrossRef] [Green Version]
  26. Urom, C.; Mzoughi, H.; Abid, I.; Brahim, M. Green markets integration in different time scales: A regional analysis. Energy Econ. 2021, 98, 105254. [Google Scholar] [CrossRef]
  27. Gunay, S.; Muhammed, S.; Elkanj, N. Risk transmissions between regional green economy indices: Evidence from the US, Europe and Asia. J. Clean. Prod. 2022, 379, 134752. [Google Scholar] [CrossRef]
  28. Naeem, M.A.; Peng, Z.; Suleman, M.T.; Nepal, R.; Shahzad, S.J.H. Time and frequency connectedness among oil shocks, electricity and clean energy markets. Energy Econ. 2020, 91, 104914. [Google Scholar] [CrossRef]
  29. Foglia, M.; Eliana, A. Volatility Connectedness between Clean Energy Firms and Crude Oil in the COVID-19 Era. Sustainability 2020, 12, 9863. [Google Scholar] [CrossRef]
  30. Antonakakis, N.; Gabauer, D.; Gupta, R.; Plakandaras, V. Dynamic connectedness of uncertainty across developed economies: A time-varying approach. Econ. Lett. 2018, 166, 63–75. [Google Scholar] [CrossRef] [Green Version]
  31. Dai, Z.; Zhu, H.; Zhang, X. Dynamic spillover effects and portfolio strategies between crude oil, gold and Chinese stock markets related to new energy vehicle. Energy Econ. 2022, 109, 105959. [Google Scholar] [CrossRef]
  32. Wang, Q.; Wang, L.; Li, R. Renewable energy and economic growth revisited: The dual roles of resource dependence and anticorruption regulation. J. Clean. Prod. 2022, 337, 130514. [Google Scholar] [CrossRef]
  33. Jiang, P.; Fan, Y.; Klemeš, J.J. Impacts of COVID-19 on energy demand and consumption: Challenges, lessons and emerging opportunities. Appl. Energy 2021, 285, 116441. [Google Scholar] [CrossRef]
  34. Li, S.; Wang, Q.; Jiang, X.; Li, R. The negative impact of the COVID-19 on renewable energy growth in developing countries: Underestimated. J. Clean. Prod. 2022, 367, 132996. [Google Scholar] [CrossRef]
  35. Mensi, W.; Kharusi, S.A.; Vo, X.V.; Kang, S.H. Frequency connectedness and spillovers among oil and Islamic sector stock markets: Portfolio hedging implications. Borsa Istanb. Rev. 2022, 22, 1098–1117. [Google Scholar] [CrossRef]
Figure 1. Price trend of the green economy and traditional energy markets. Note: The graphs in this figure show the evolution of the 4 green economy markets and 2 traditional energy markets considered over the sample period from 4 January 2012 to 12 April 2022 (a total of 14,340 daily observations). QGREEN, GRNUS, GRNEUR and GRNASIA, respectively, denote the degree of development of the green economy in the global, U.S., European and Asian regions. In turn, WTI and GAS are the crude oil and natural gas futures contracts, respectively.
Systems 11 00153 g001
Figure 2. Dynamic “TOTAL” spillover based on the time domain. Note: This figure shows the time-varying behavior of the total return spillover index among 4 green economy markets and 2 traditional energy markets under study computed using the approach of Diebold and Yilmaz (2012) [12] and important events over time. “TOTAL” represents the total- spillover of the “green economy–traditional energy” system, as shown in Equation (7). Timetable for important events: (1) Event 1: European sovereign debt crisis, crude oil supply and demand imbalance (June 2012); (2) Event 2: Global stock market crash (24 August 2015); (3) Event 3: Global crude oil oversupply with uncertain demand outlook and oil price slump (24 August 2015); (4) Event 4: U.S. stocks plunge (5 February 2018); (5) Event 5: Outbreak of the COVID-19 pandemic; WHO classified the COVID-19 pandemic’s outbreak as a public health emergency of international concern (30 January 2020); (6) Event 6: The deteriorating situation in Russia and Ukraine and the disruption of crude oil and natural gas supply (January–February 2022).
Systems 11 00153 g002
Figure 3. Dynamic “TO” directional spillover based on the time domain. Note: This figure displays the time-varying behavior of the “TO” directional return spillover index among 4 green economy markets and 2 traditional energy markets under study computed using the approach of Diebold and Yilmaz (2012) [12]. “TO” represents the directional return spillovers transmitted by the corresponding market to all other markets, as shown in Equation (9).
Systems 11 00153 g003
Figure 4. Dynamic “FROM” directional spillover based on the time domain. Note: This figure displays the time-varying behavior of the “FROM” directional return spillover index among 4 green economy markets and 2 traditional energy markets under study computed using the approach of Diebold and Yilmaz (2012) [12]. “FROM” represents the directional return spillovers received by the corresponding market from all other markets, as shown in Equation (8).
Systems 11 00153 g004
Figure 5. Dynamic “NET” directional spillover based on the time domain. Note: This figure depicts the time-varying behavior of the net return spillover index among 4 green economy markets and 2 traditional energy markets under study computed using the method of Diebold and Yilmaz (2012) [12]. “NET” return spillover indices are calculated by subtracting directional “TO” spillovers from directional “FROM” spillovers, as shown in Equation (10). Positive (negative) values of spillovers indicate that the corresponding market is a net transmitter (receiver) of return spillover effects “TO” (“FROM”) all remaining markets of the system.
Systems 11 00153 g005
Figure 6. Dynamic “TOTAL” spillover based on the frequency domain. Note: This figure depicts the frequency dynamics of the total return spillover among 4 green economy markets and 2 traditional energy markets under study computed using the method of Barunik and Krehlik (2018) [15]. “TOTAL” represents the total- spillover of the “green economy–traditional energy” system, as shown in Equation (16). The blue area indicates the total spillover in the long-term period of 20–infinite days. The green area reflects the spillover in the medium-term horizon of 5–20 days. The red area represents the spillover in the short-term horizon of 1–5 days. The black area is the time domain spillover.
Systems 11 00153 g006
Figure 7. Dynamic “NET” directional spillover in the short term (1–5 days) based on the frequency domain. Note: This figure depicts the frequency dynamics of the net return spillover index among 4 green economy markets and 2 traditional energy markets under study computed using the method of Barunik and Krehlik (2018) [15] in the short term. “NET” return spillover indices are calculated by subtracting directional “TO” spillovers from directional “FROM” spillovers, as shown in Equation (19). Positive (negative) values of spillovers indicate that the corresponding variable is a net transmitter (receiver) of return spillover effects “TO” (“FROM”) all the remaining variables of the system.
Systems 11 00153 g007
Figure 8. Dynamic “NET” directional spillover in the medium term (5–20 days) based on the frequency domain. Note: This figure depicts the frequency dynamics of the net return spillover index among 4 green economy markets and 2 traditional energy markets under study computed using the method of Barunik and Krehlik (2018) [15] in the medium term. “NET” return spillover indices are calculated by subtracting directional “TO” spillovers from directional “FROM” spillovers, as shown in Equation (19). Positive (negative) values of spillovers indicate that the corresponding variable is a net transmitter (receiver) of return spillover effects “TO” (“FROM”) all the remaining variables of the system.
Systems 11 00153 g008
Figure 9. Dynamic “NET” directional spillover in the long term (20–infinite days) based on the frequency domain. Note: This figure depicts the frequency dynamics of the net return spillover index among 4 green economy markets and 2 traditional energy markets under study computed using the method of Barunik and Krehlik (2018) [15] in the long term. “NET” return spillover indices are calculated by subtracting directional “TO” spillovers from directional “FROM” spillovers, as shown in Equation (19). Positive (negative) values of spillovers indicate that the corresponding variable is a net transmitter (receiver) of return spillover effects “TO” (“FROM”) all the remaining variables of the system.
Systems 11 00153 g009
Figure 10. Spillover network diagram during COVID-19 based on the frequency domain: (a) 1–5 days; (b) 5–20 days; (c) 20–infinite days. Note: This figure depicts the network graphs of the net pairwise directional spillover among 4 green economy markets and 2 traditional energy markets under consideration computed using the approach of Barunik and Krehlik (2018) [15] in different time horizons. Green economy markets and traditional energy markets and their outgoing edges are marked by brown and blue, respectively. The size of the node represents its frequency of output in spillover transmission. The edges reveal the pairwise spillover effects, and the thickness of the edge highlights the magnitude of the net spillover effects, with the arrows pointing from the net exporter to the net receiver.
Systems 11 00153 g010
Table 1. Descriptive statistics.
QGREENGRNUSGRNEURGRASIAWTIGAS
Mean0.04980.06530.04120.0197−0.00110.0322
Median0.10350.12360.10690.05010.10740.0000
Maximum7.85298.62626.32838.493831.963438.1727
Minimum−11.3357−10.1756−14.8709−10.0905−60.2675−30.0480
Std. Deviation1.01911.15141.14521.11253.09733.3470
Skewness−0.8060−0.3911−1.8066−0.3934−3.06060.4983
Kurtosis15.173611.763822.136611.014580.801815.1663
JB15,010 ***7,706.1 ***37,753 ***6,455.4 ***606,267 ***14,833 ***
ADF−30.8465 ***−31.7342 ***−32.0431 ***−32.9478 ***−37.4365 ***−37.0858 ***
Note: This table presents the summary statistics and unit root tests of the daily series over the period from 4 January 2012 to 12 April 2022. QGREEN, GRNUS, GRNEUR and GRNASIA, respectively, denote the degree of development of the green economy in the global, U.S., European and Asian regions. In turn, WTI and GAS are the crude oil and natural gas futures contracts, respectively. JB refers to the Jarque–Bera test statistics for normality. ADF is the statistics of the ADF (Augmented Dickey–Fuller) unit root test. Log difference returns are used for all variables. *** indicates statistical significance at the 1% level.
Table 2. Full sample static spillover results based on the time domain.
QGREENGRNUSGRNEURGRASIAWTIGASFROM
QGREEN34.1630.6423.038.7630.4165.84
GRNUS34.5539.8715.786.382.90.5360.13
GRNEUR29.4618.4441.187.832.760.3358.82
GRASIA18.8914.1113.0851.291.880.7548.71
WTI5.414.944.031.4782.741.4117.26
GAS0.791.040.530.591.7495.314.69
TO89.169.1756.4425.0312.283.43255.44
NET23.269.04−2.38−23.68−4.98−1.2642.57
Note: This table presents the return spillover results among 4 green economy markets and 2 traditional energy markets under study computed using the approach of Diebold and Yilmaz (2012) [12] during the entire period from 4 January 2012 to 12 April 2022. The ij-th element in the  6 × 6  (from QGREEN to GAS) sub-matrix shows the ij-th pairwise directional spillover [see Equation (6)], representing the forecast error variance of market i to shocks from market j. “FROM”, “TO” and “NET” represent the from- spillover, to- spillover, and net- spillover of market i, as shown in Equations (8)–(10), respectively.
Table 3. Full-sample static spillover results based on the frequency domain.
Panel A: Short Term (1–5 days)
QGREENGRNUSGRNEURGRASIAWTIGASFROM
QGREEN21.3218.9714.495.661.780.2541.16
GRNUS22.1925.7110.034.181.750.3538.5
GRNEUR18.1210.926.224.961.620.235.8
GRASIA10.287.367.2332.81.070.4526.4
WTI3.923.572.951.0260.71.0312.49
GAS0.60.780.410.431.2870.593.49
TO55.1141.5835.116.267.512.29157.84
ALL76.4367.2861.3249.0668.2172.88TCI
NET13.953.08−0.7−10.14−4.98−1.2126.31
Panel B: Medium Term (5–20 days)
QGREENGRNUSGRNEURGRASIAWTIGASFROM
QGREEN8.287.865.391.930.890.1116.17
GRNUS7.989.313.781.380.840.1214.09
GRNEUR7.615.369.031.820.810.0815.69
GRASIA6.184.914.1110.490.560.1815.94
WTI1.010.930.710.3314.620.253.23
GAS0.140.190.080.10.3116.50.82
TO22.9119.2514.075.553.420.7465.94
ALL31.1928.5523.116.0418.0417.24TCI
NET6.745.15−1.62−10.390.19−0.0810.99
Panel C: Long Term (20–infinite days)
QGREENGRNUSGRNEURGRASIAWTIGASFROM
QGREEN4.434.222.871.010.480.068.64
GRNUS4.224.922.010.720.450.067.48
GRNEUR4.12.924.790.970.450.058.48
GRASIA3.442.762.285.470.310.098.89
WTI0.520.480.360.177.310.131.66
GAS0.070.10.040.050.168.190.4
TO12.3510.487.562.921.850.3935.55
NET3.713−0.92−5.970.19−0.015.92
Note: This table presents the return spillover results among 4 green economy markets and 2 traditional energy markets under study computed during the entire period from 4 January 2012 to 12 April 2022 in different time horizons based on the Barunik and Krehlik (2018) [15] frequency domain framework. The ij-th element in the  6 × 6  (from QGREEN to GAS) sub-matrix shows the ij-th pairwise directional spillover [see Equation (15)] in the corresponding frequency, representing the forecast error variance of market i to shocks from market j. “FROM”, “TO” and “NET” represent the from- spillover, to- spillover and net- spillover of market I, as shown in Equations (17)–(19), respectively.
Table 4. Comparison before, during and after COVID-19 based on the time domain.
Panel A: Pre-COVID-19
QGREENGRNUSGRNEURGRASIAWTIGASFROM
QGREEN34.9928.4723.078.1423.3365.01
GRNUS34.9339.6514.954.221.644.6260.35
GRNEUR28.0213.1546.026.054.462.353.98
GRASIA11.835.859.2463.684.854.5636.32
WTI5.6711.720.884.9272.863.9727.14
GAS4.886.543.655.144.0675.7224.28
TO85.3265.7351.7928.4617.0118.78267.08
NET20.315.38−2.19−7.86−10.14−5.544.51
Panel B: COVID-19
QGREENGRNUSGRNEURGRASIAWTIGASFROM
QGREEN28.1628.4721.8911.873.266.3471.84
GRNUS2830.5118.711.993.287.5269.49
GRNEUR27.223.5530.9611.582.574.1369.04
GRASIA22.8823.5319.5226.213.084.7873.79
WTI6.67.314.311.179.171.520.83
GAS11.6415.056.142.890.8263.4736.53
TO96.3297.9170.5739.4313.0124.27341.52
NET24.4928.411.53−34.36−7.82−12.2656.92
Panel C: Post-COVID-19
QGREENGRNUSGRNEURGRASIAWTIGASFROM
QGREEN37.3335.3816.349.111.650.262.67
GRNUS38.1141.7510.677.51.690.2758.25
GRNEUR25.1816.4350.436.571.20.1849.57
GRASIA19.3416.639.3852.761.310.5947.24
WTI4.153.732.052.6286.860.5913.14
GAS0.740.930.820.820.6396.073.93
TO87.5173.139.2626.626.481.83234.79
NET24.8414.85−10.31−20.62−6.66−2.139.13
Note: This table presents the return spillover results among 4 green economy markets and 2 traditional energy markets during the pre-COVID-19, COVID-19 and post-COVID-19 subsamples. It reports the spillover results based on the method of Diebold and Yilmaz (2012) [12]. The ij-th element in the  6 × 6  (from QGREEN to GAS) sub-matrix shows the ij-th pairwise directional spillover [see Equation (6)], representing the forecast error variance of market i to shocks from market j. “FROM”, “TO” and “NET” represent the from- spillover, to- spillover and net- spillover of market I, as shown in Equations (8)–(10), respectively.
Disclaimer/Publisher’s Note: The statements, opinions and data contained in all publications are solely those of the individual author(s) and contributor(s) and not of MDPI and/or the editor(s). MDPI and/or the editor(s) disclaim responsibility for any injury to people or property resulting from any ideas, methods, instructions or products referred to in the content.

