
The Expression of the Endocannabinoid Receptors CB2 and GPR55 Is Highly Increased during the Progression of Alzheimer’s Disease in AppNL-G-F Knock-In Mice

 , , and
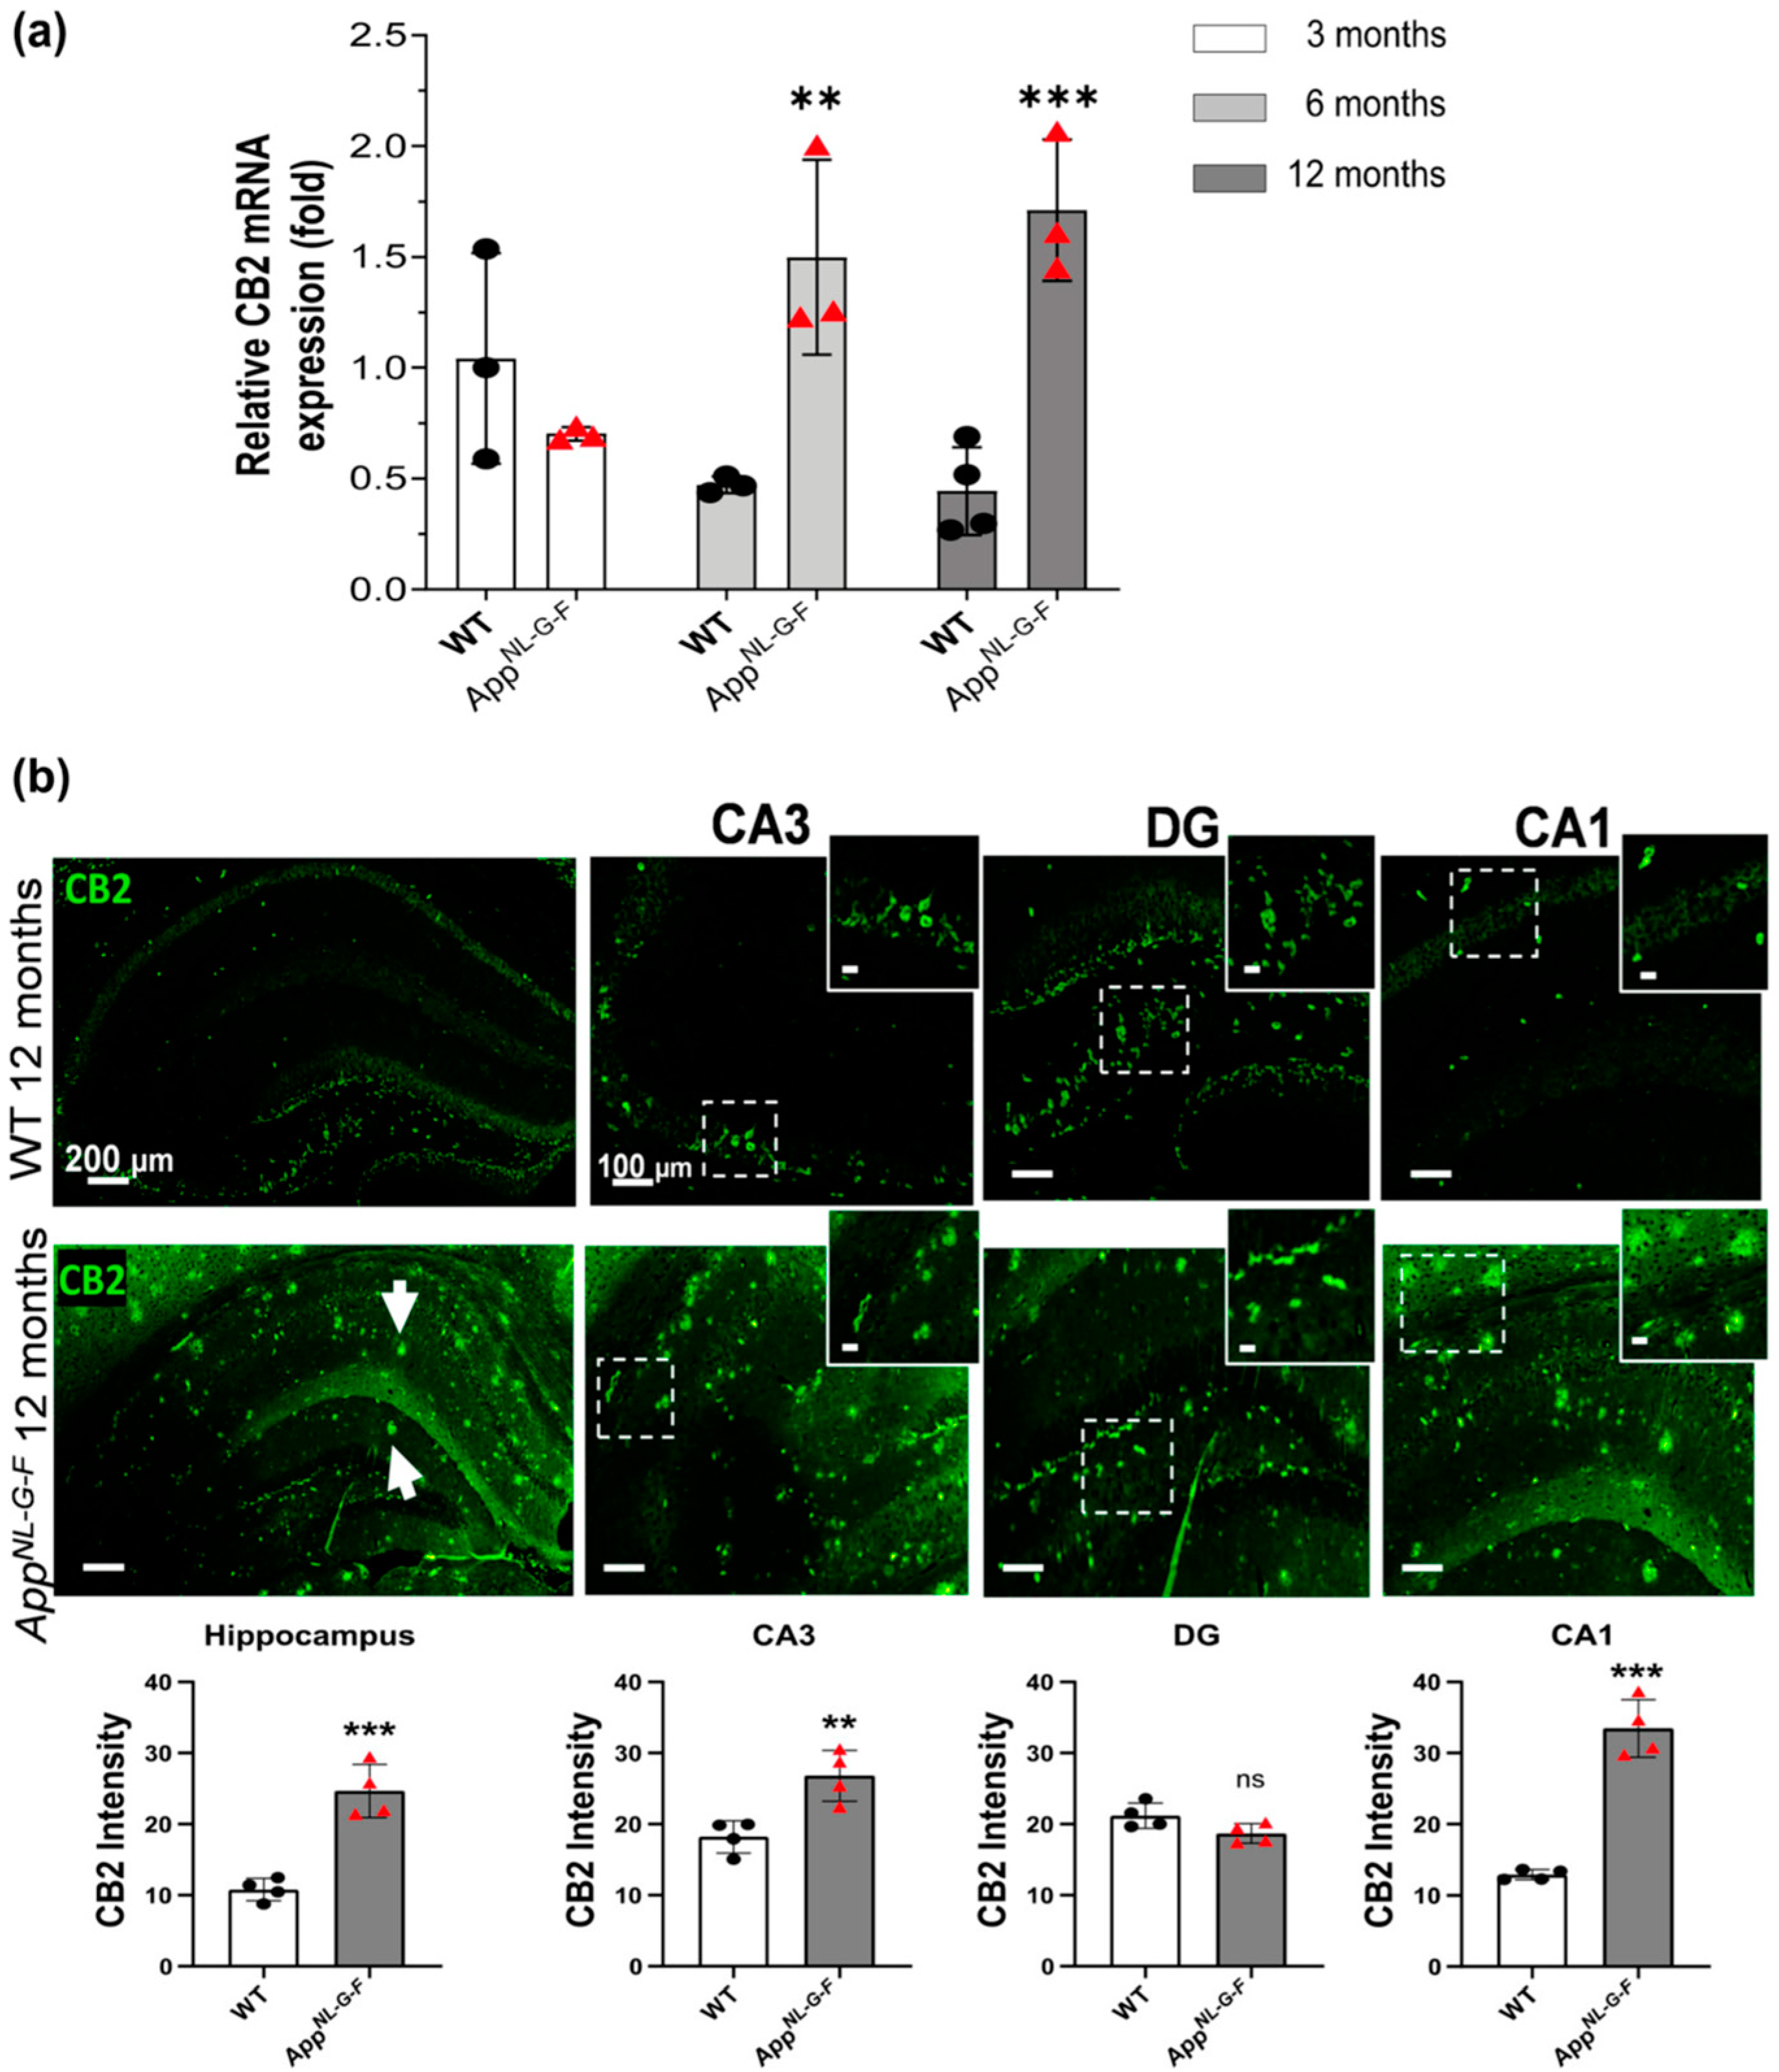
Abstract
:Simple Summary
Abstract
1. Introduction
2. Materials and Methods
2.1. Animals and Ethics Statement
2.2. RNA Isolation, and qPCR
2.3. Histological and Immunofluorescence Analysis
2.4. Primary Cell Cultures
2.5. Aβ42 Production
2.6. Cell Treatment
Immunocytochemistry
2.7. Microscopy and Fluorescence Intensity Quantification
2.8. Statistical Analyses
3. Results
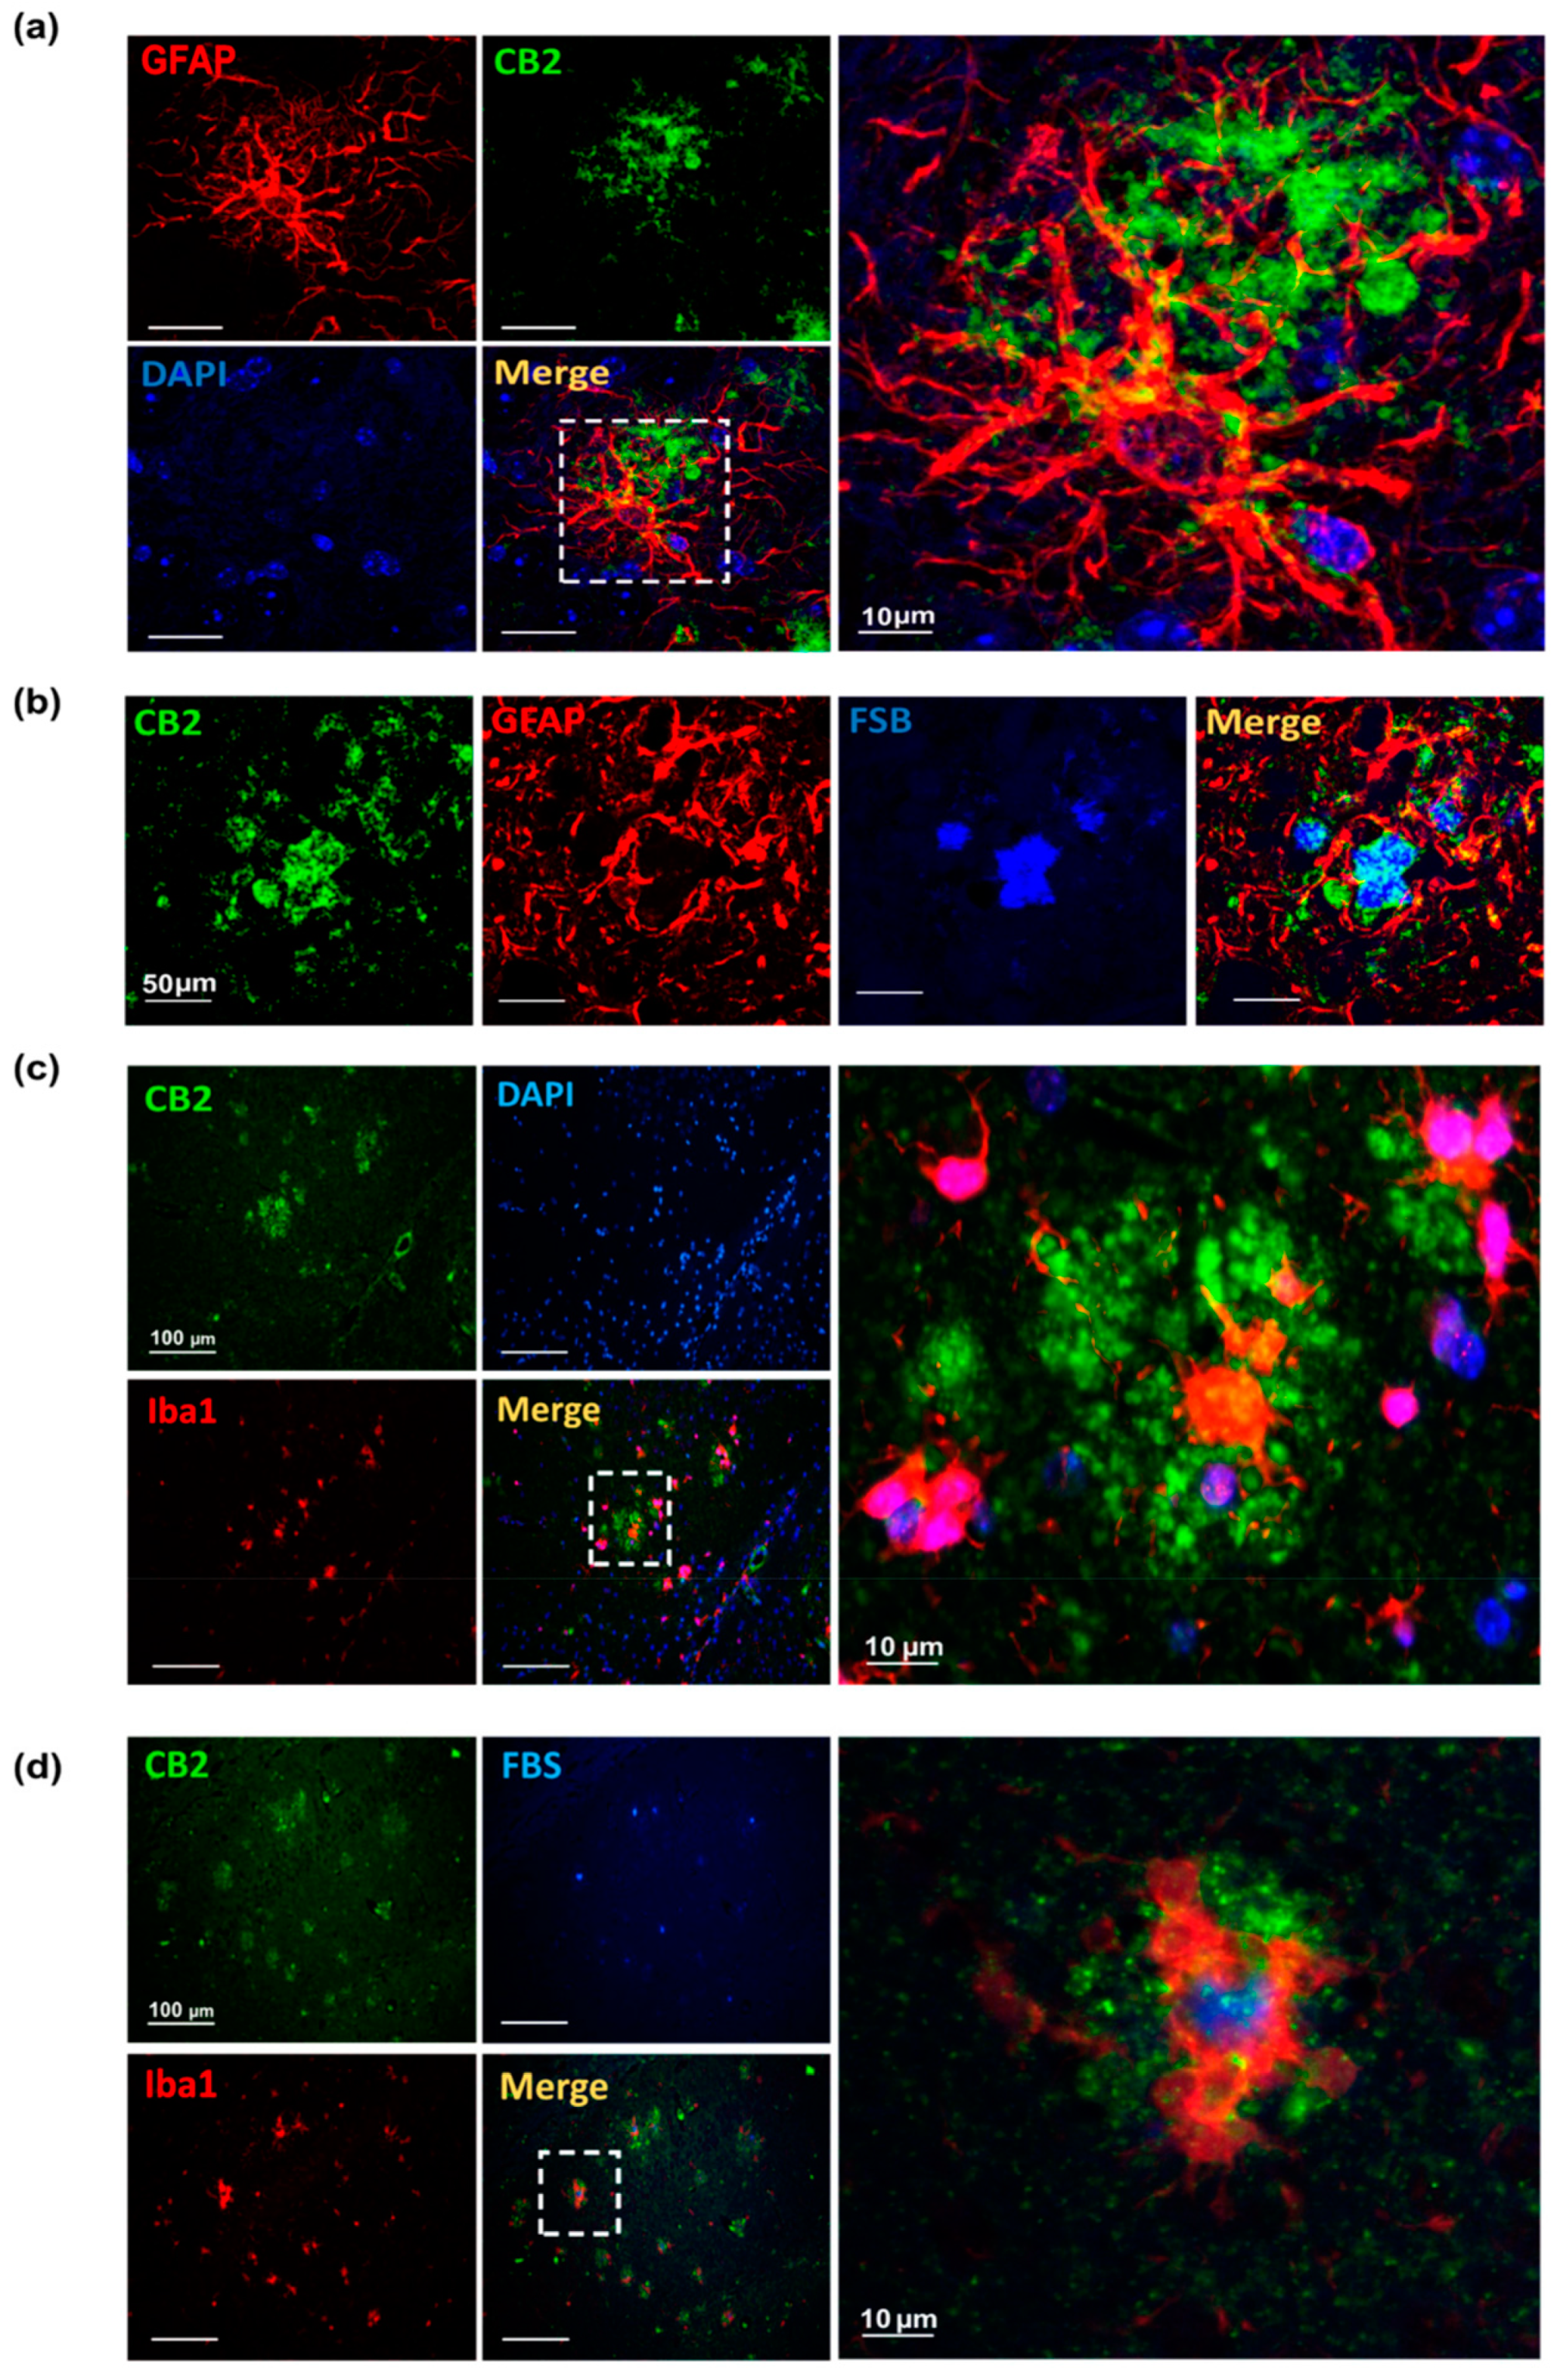
3.1. CB2 Expression Significantly Increases at 6, and 12 Months of Age in AppNL-G-F Mice
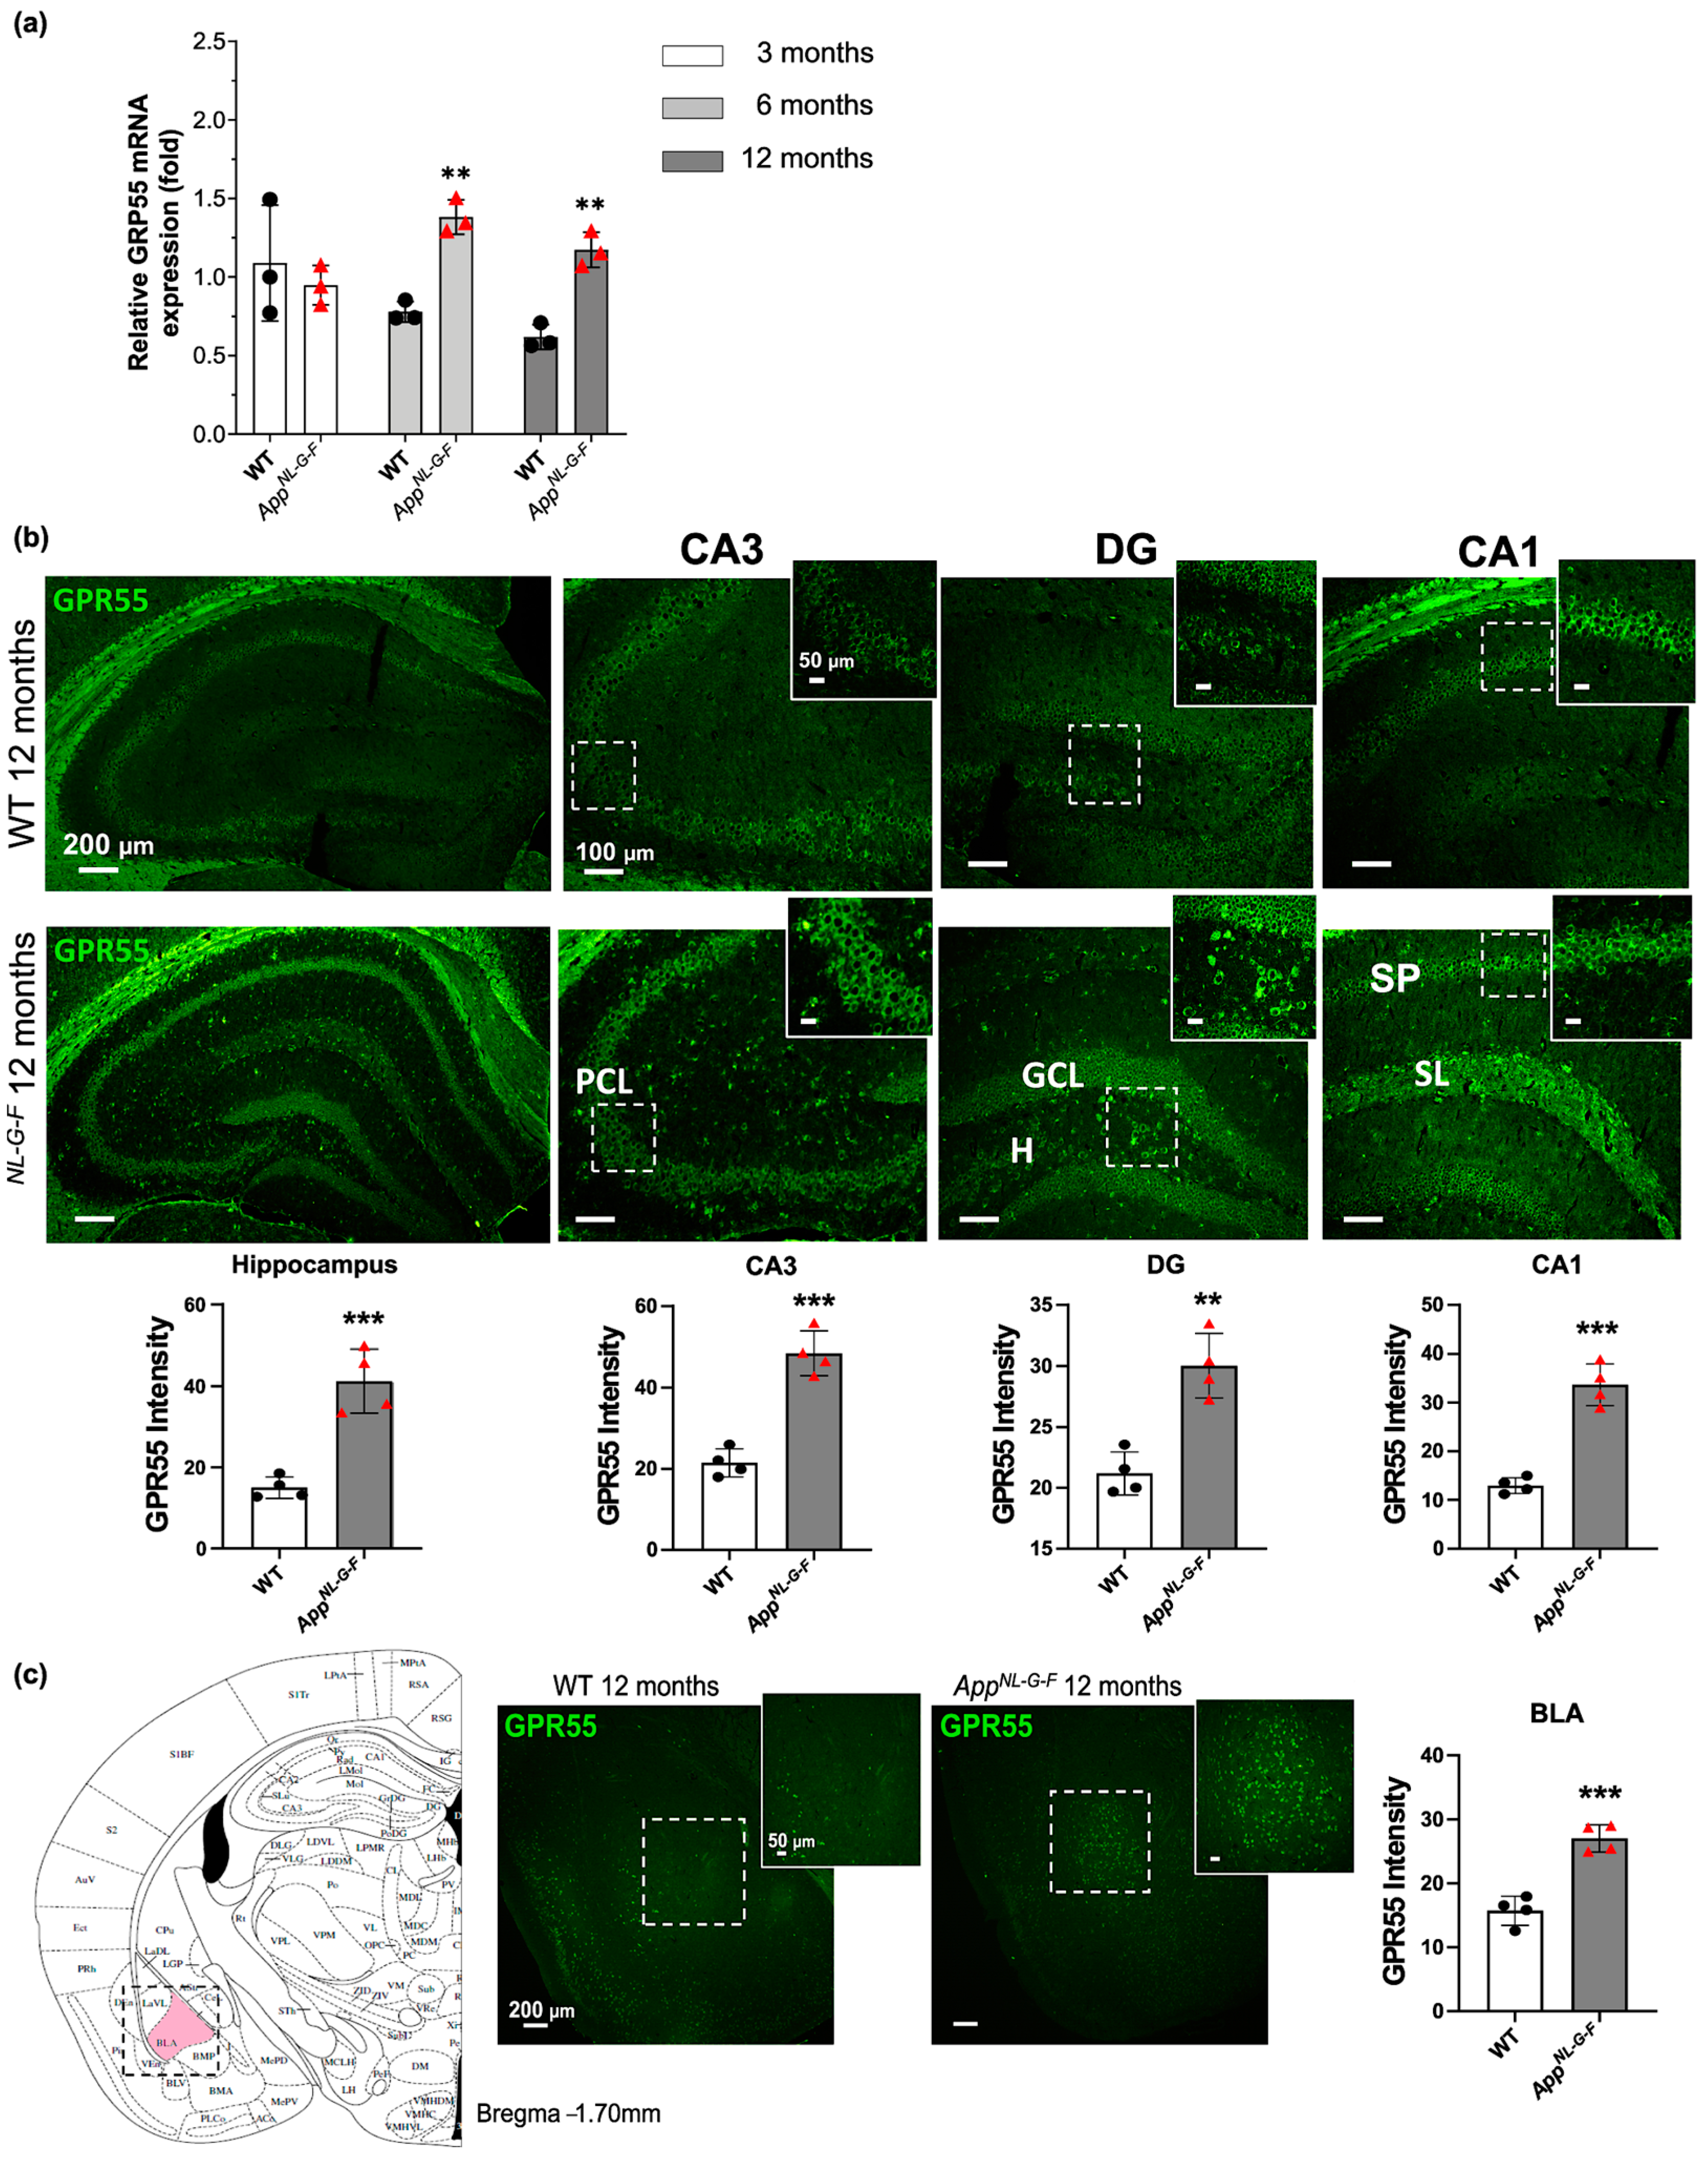
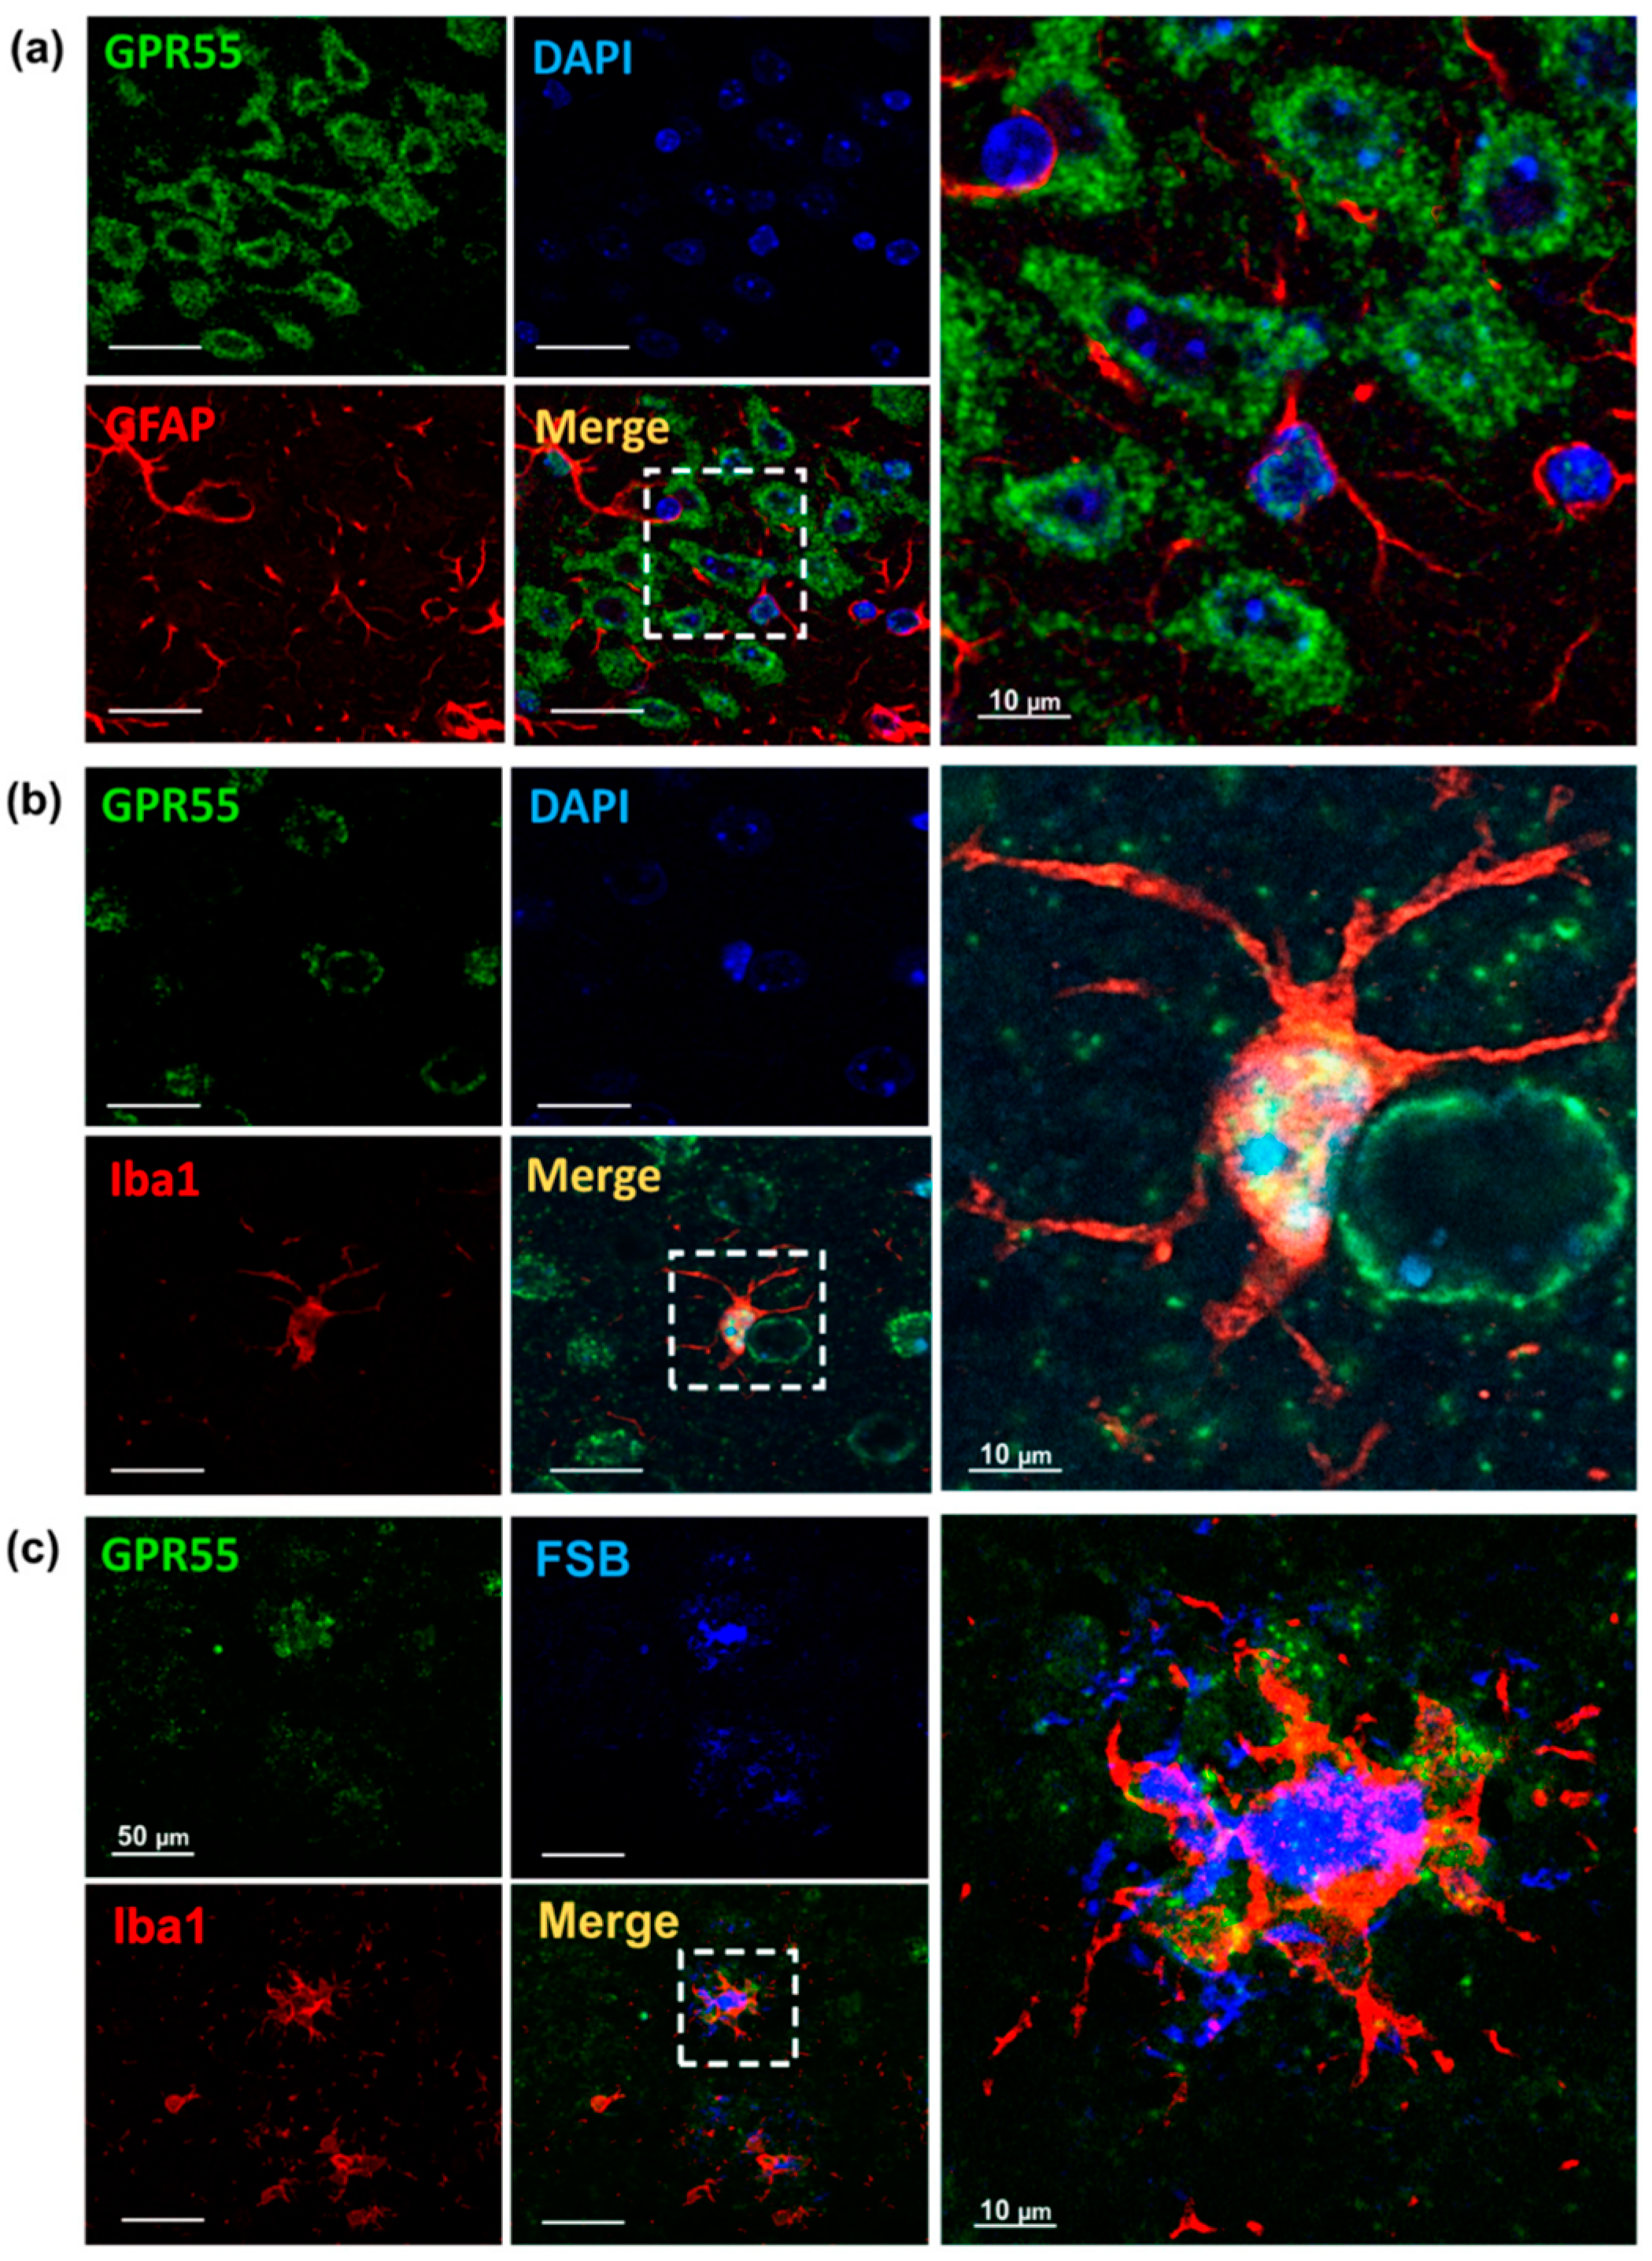
3.2. Increased GPR55 mRNA Levels and Immunoreactivity in AppNL-G-F Mice
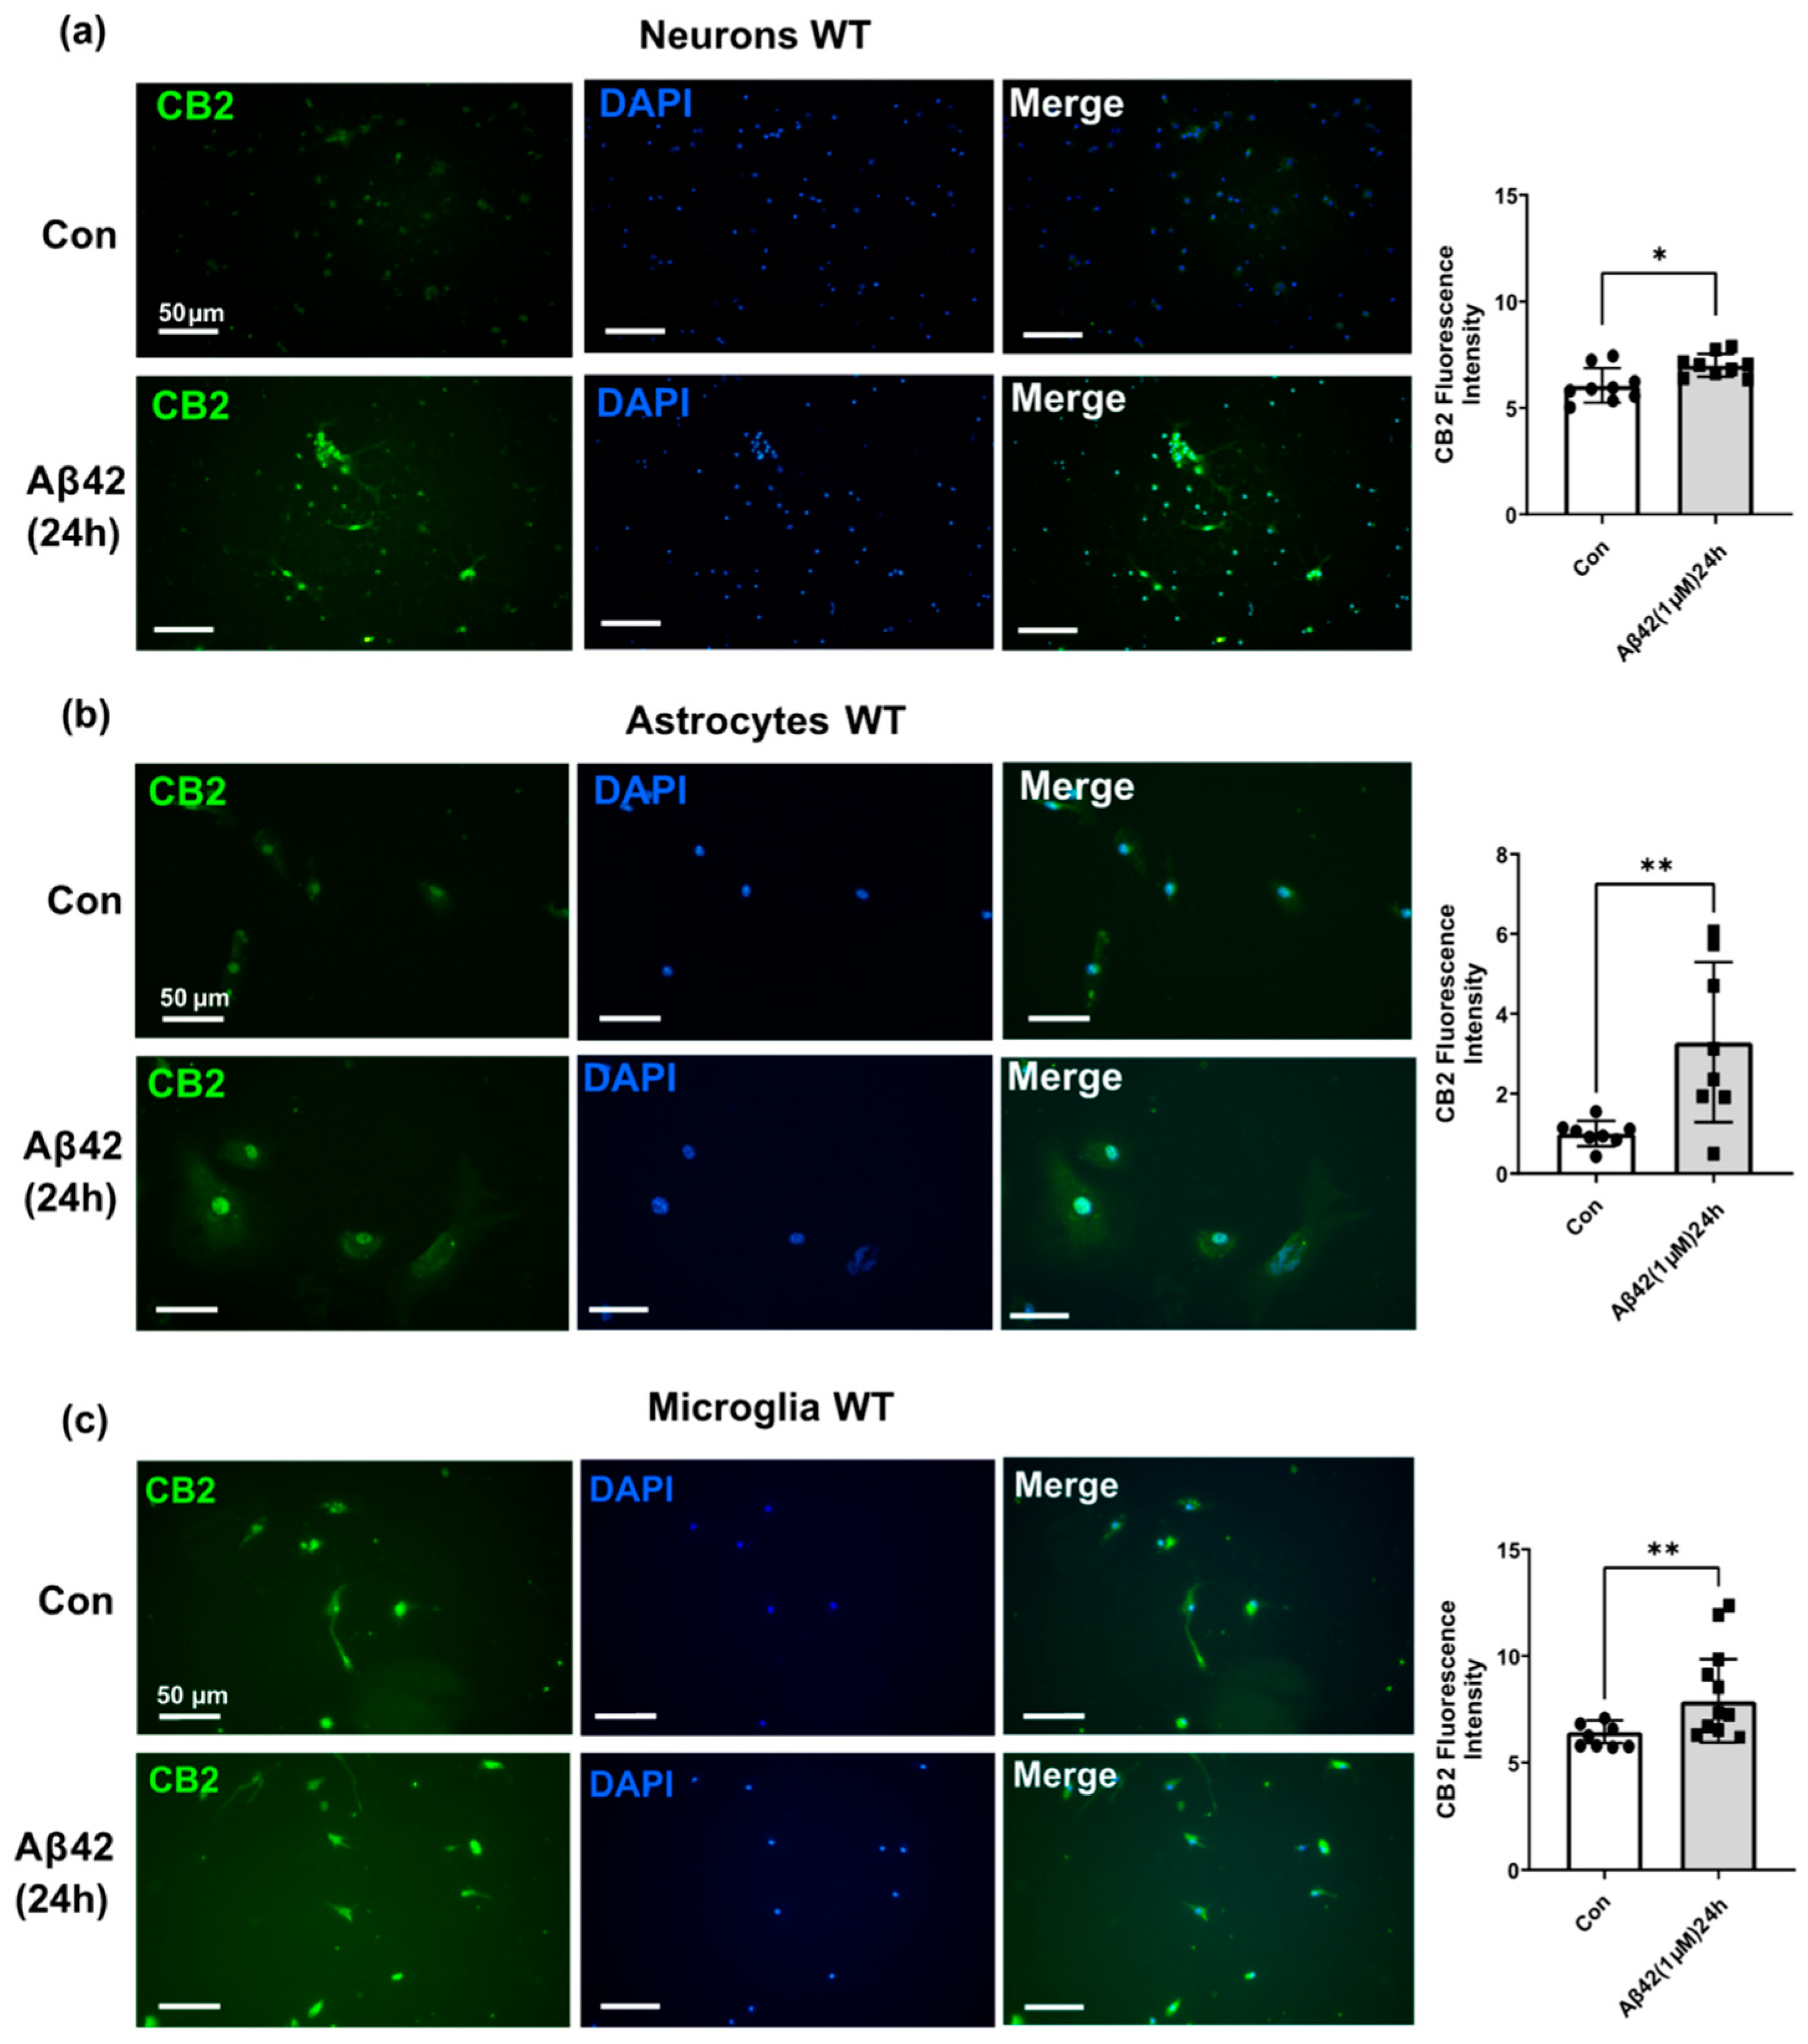
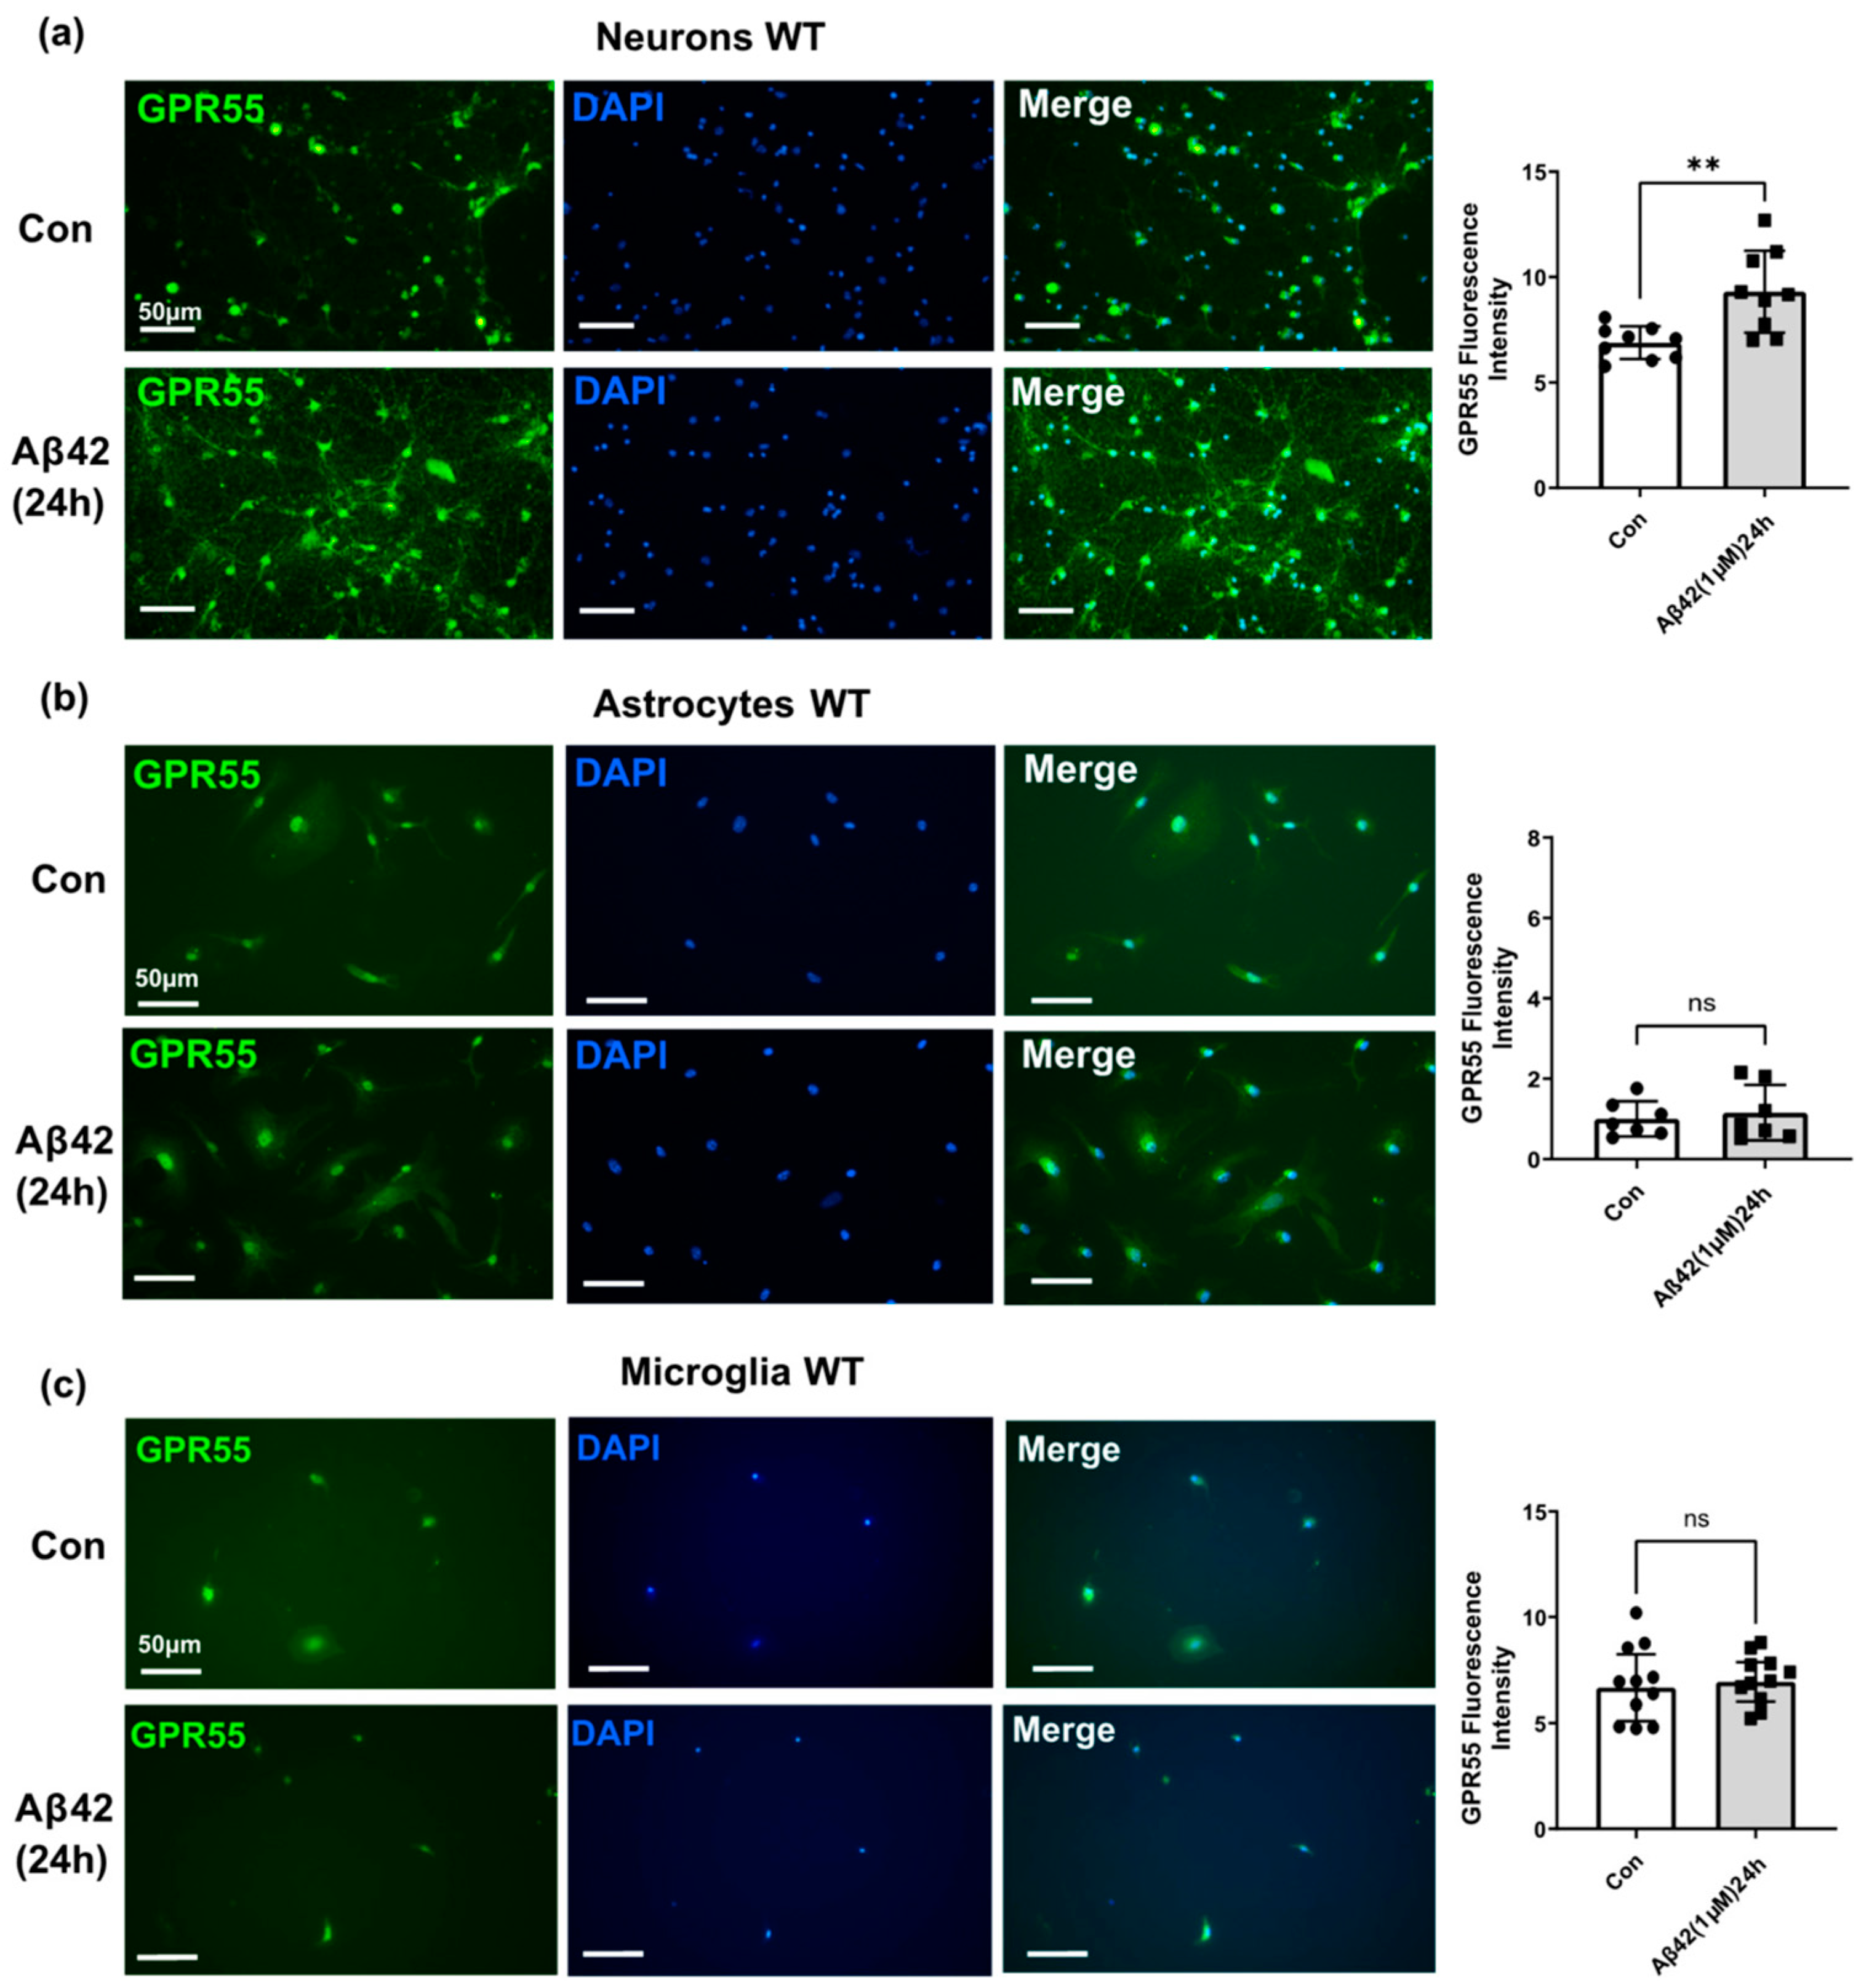
3.3. Aβ42 Treatment Induces CB2 and GPR55 Overexpression in WT Mouse Primary Neuronal Cell Culture, and CB2 in Primary Glial Cell Culture but Not for GPR55
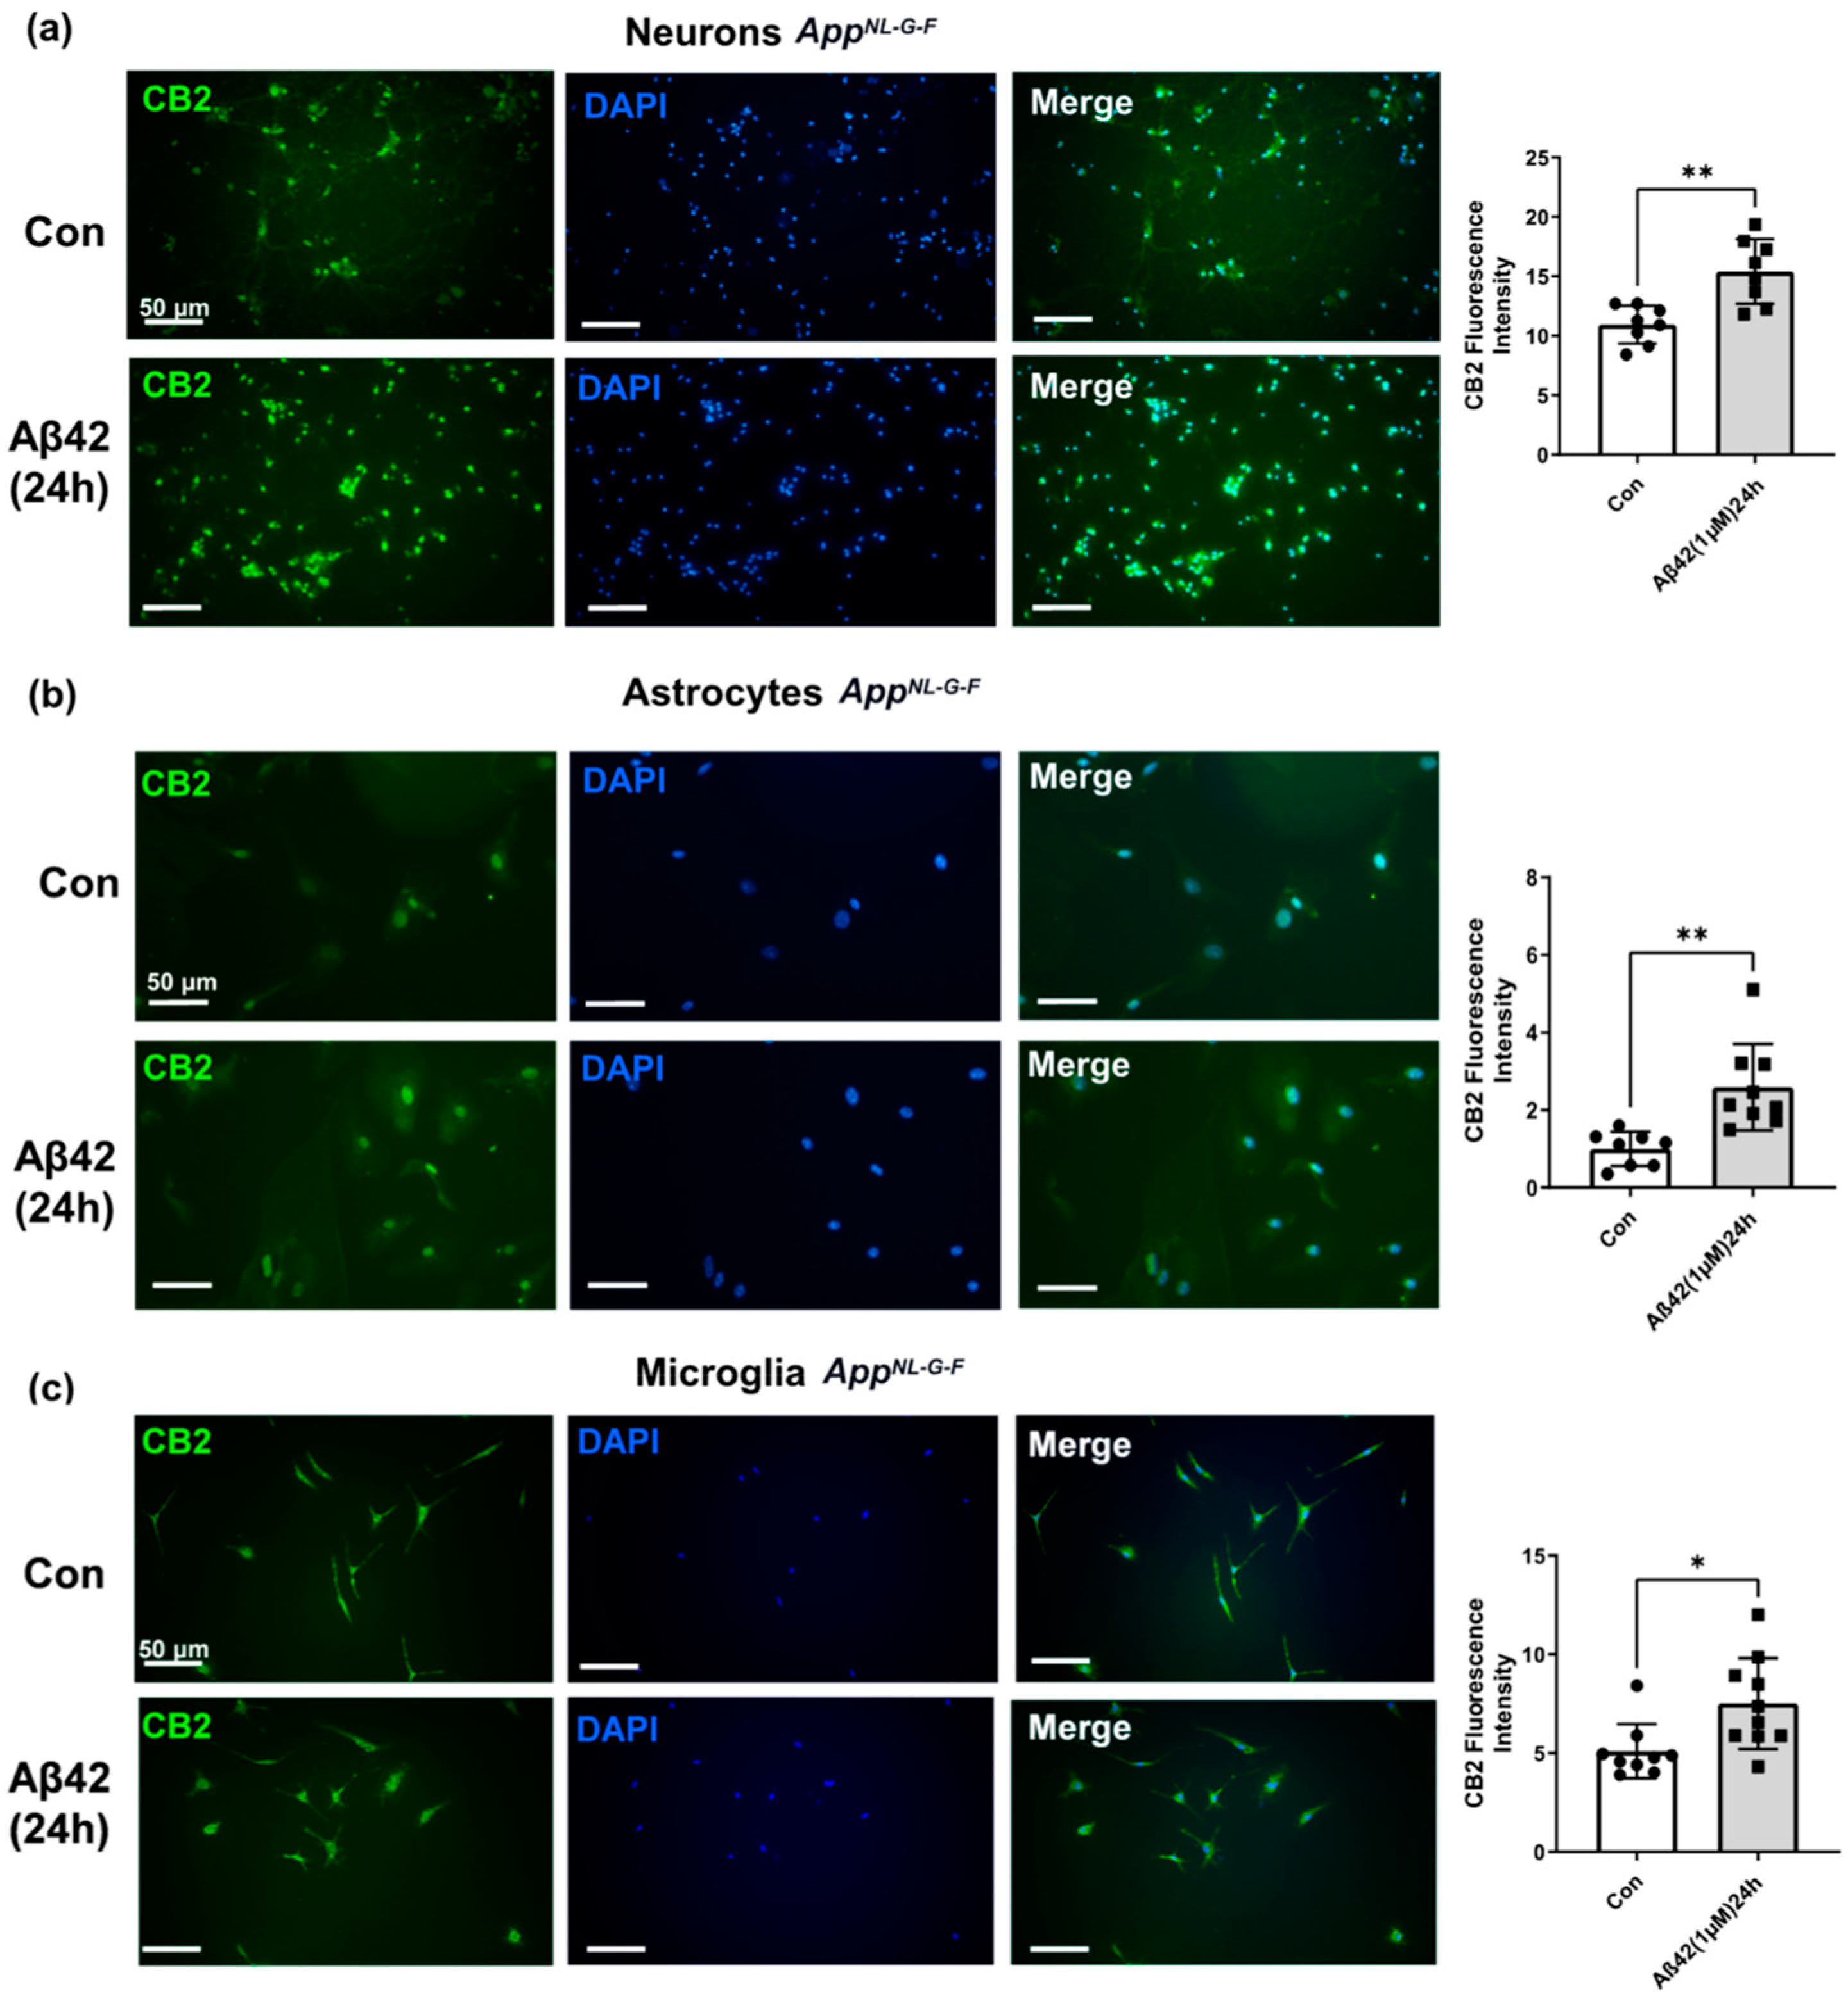
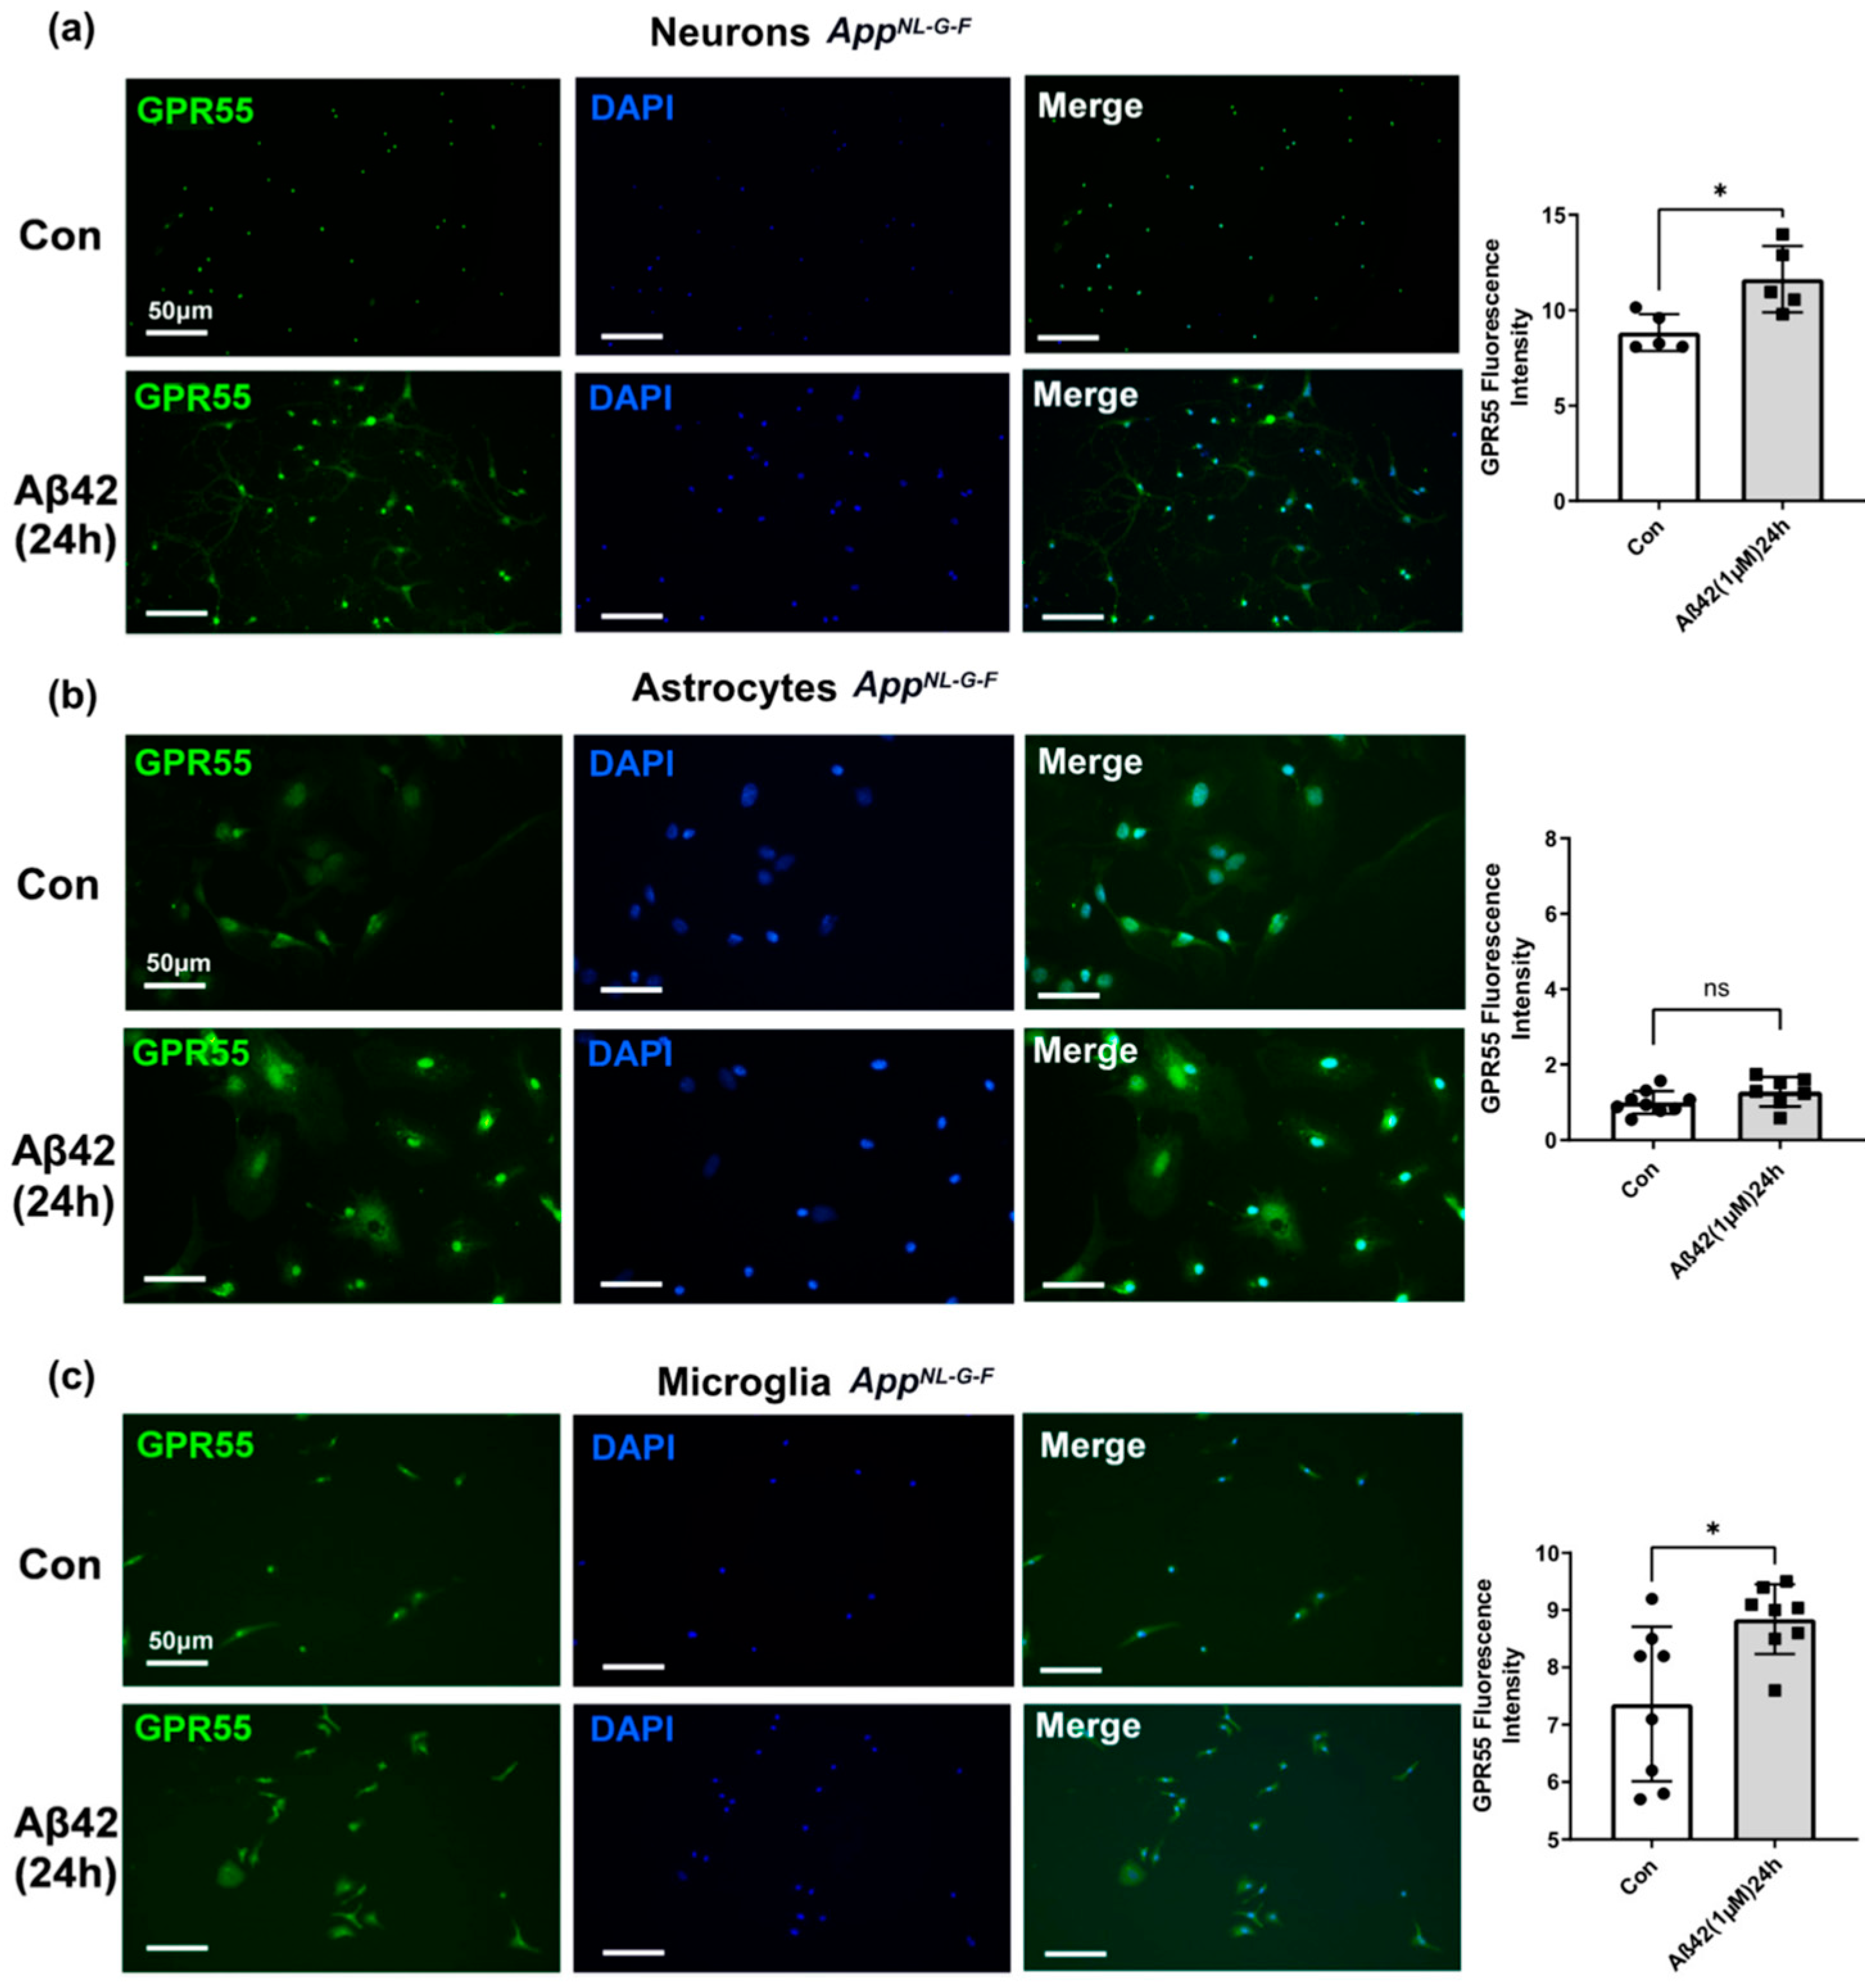
3.4. Aβ42 Exposure Induced Upregulation of CB2 and GPR55 in AppNL-G-F Mouse Primary Neuronal Cell Culture and in Primary Glial Cell Culture for CB2 But Not for GPR55
4. Discussion
5. Conclusions
Supplementary Materials
Author Contributions
Funding
Institutional Review Board Statement
Informed Consent Statement
Data Availability Statement
Acknowledgments
Conflicts of Interest
Abbreviations
References
- Sengupta, U.; Nilson, A.N.; Kayed, R. The Role of Amyloid-β Oligomers in Toxicity, Propagation, and Immunotherapy. EBioMedicine 2016, 6, 42–49. [Google Scholar] [CrossRef] [PubMed]
- Voet, S.; Srinivasan, S.; Lamkanfi, M.; Loo, G. Inflammasomes in Neuroinflammatory and Neurodegenerative Diseases. EMBO Mol. Med. 2019, 11, e10248. [Google Scholar] [CrossRef] [PubMed]
- Wyss-Coray, T. Inflammation in Alzheimer Disease: Driving Force, Bystander or Beneficial Response? Nat. Med. 2006, 12, 1005–1015. [Google Scholar]
- Hardy, J.; Selkoe, D.J. The Amyloid Hypothesis of Alzheimer’s Disease: Progress and Problems on the Road to Therapeutics. Science 2002, 297, 353–356. [Google Scholar] [CrossRef]
- Herrup, K. The Case for Rejecting the Amyloid Cascade Hypothesis. Nat. Neurosci. 2015, 18, 794–799. [Google Scholar] [CrossRef] [PubMed]
- Calsolaro, V.; Edison, P. Neuroinflammation in Alzheimer’s Disease: Current Evidence and Future Directions. Alzheimer’s Dement. 2016, 12, 719–732. [Google Scholar] [CrossRef] [PubMed]
- Heneka, M.T.; Carson, M.J.; Khoury, J.E.; Landreth, G.E.; Brosseron, F.; Feinstein, D.L.; Jacobs, A.H.; Wyss-Coray, T.; Vitorica, J.; Ransohoff, R.M.; et al. Neuroinflammation in Alzheimer’s Disease. Lancet Neurol. 2015, 14, 388–405. [Google Scholar] [CrossRef]
- Obulesu, M.; Jhansilakshmi, M. Neuroinflammation in Alzheimer’s Disease: An Understanding of Physiology and Pathology. Int. J. Neurosci. 2014, 124, 4. [Google Scholar] [CrossRef]
- Mackie, K. Cannabinoid Receptors as Therapeutic Targets. Annu. Rev. Pharmacol. Toxicol. 2006, 46, 101–122. [Google Scholar] [CrossRef]
- Gowran, A.; Noonan, J.; Campbell, V.A. The Multiplicity of Action of Cannabinoids: Implications for Treating Neurodegeneration. CNS Neurosci. Ther. 2011, 17, 637–644. [Google Scholar] [CrossRef]
- Bisogno, T.; Di Marzo, V. The Role of the Endocannabinoid System in Alzheimers Disease: Facts and Hypotheses. Curr. Pharm. Des. 2008, 14, 2299–3305. [Google Scholar] [CrossRef] [PubMed]
- Rojo-Bustamante, E.; Íñigo-Marco, I.; Abellanas, M.A.; Vinueza-Gavilanes, R.; Baltanás, A.; Luquin, E.; Arrasate, M.; Aymerich, M.S. Cb2 Receptors and Neuron–Glia Interactions Modulate Neurotoxicity Generated by Magl Inhibition. Biomolecules 2020, 10, 1198. [Google Scholar] [CrossRef] [PubMed]
- Lauckner, J.E.; Jensen, J.B.; Chen, H.Y.; Lu, H.C.; Hille, B.; Mackie, K. GPR55 Is a Cannabinoid Receptor That Increases Intracellular Calcium and Inhibits M Current. Proc. Natl. Acad. Sci. USA 2008, 105, 2699–2704. [Google Scholar] [CrossRef]
- Yang, H.; Zhou, J.; Lehmann, C. GPR55—A Putative “Type 3” Cannabinoid Receptor in Inflammation. J. Basic. Clin. Physiol. Pharmacol. 2016, 27, 297–302. [Google Scholar] [CrossRef] [PubMed]
- Atwood, B.K.; MacKie, K. CB 2: A Cannabinoid Receptor with an Identity Crisis. Br. J. Pharmacol. 2010, 160, 467–479. [Google Scholar] [CrossRef]
- Fernández-Ruiz, J.; Pazos, M.R.; García-Arencibia, M.; Sagredo, O.; Ramos, J.A. Role of CB2 Receptors in Neuroprotective Effects of Cannabinoids. Mol. Cell. Endocrinol. 2008, 286, S91–S96. [Google Scholar] [CrossRef]
- Benito, C.; Tolón, R.M.; Pazos, M.R.; Núñez, E.; Castillo, A.I.; Romero, J. Cannabinoid CB2 Receptors in Human Brain Inflammation. Br. J. Pharmacol. 2008, 153, 277–285. [Google Scholar] [CrossRef]
- Sawzdargo, M.; Nguyen, T.; Lee, D.K.; Lynch, K.R.; Cheng, R.; Heng, H.H.Q.; George, S.R.; O’Dowd, B.F. Identification and Cloning of Three Novel Human G Protein-Coupled Receptor Genes GPR52, ΨGPR53 and GPR55: GPR55 Is Extensively Expressed in Human Brain. Mol. Brain Res. 1999, 64, 193–198. [Google Scholar] [CrossRef]
- Ryberg, E.; Larsson, N.; Sjögren, S.; Hjorth, S.; Hermansson, N.O.; Leonova, J.; Elebring, T.; Nilsson, K.; Drmota, T.; Greasley, P.J. The Orphan Receptor GPR55 Is a Novel Cannabinoid Receptor. Br. J. Pharmacol. 2007, 152, 1092–1101. [Google Scholar] [CrossRef]
- Zhou, J.; Burkovskiy, I.; Yang, H.; Sardinha, J.; Lehmann, C. CB2 and GPR55 Receptors as Therapeutic Targets for Systemic Immune Dysregulation. Front. Pharmacol. 2016, 7, 264. [Google Scholar] [CrossRef]
- Armin, S.; Muenster, S.; Abood, M.; Benamar, K. GPR55 in the Brain and Chronic Neuropathic Pain. Behav. Brain Res. 2021, 406, 113248. [Google Scholar] [CrossRef]
- Ramírez, B.G.; Blázquez, C.; Gómez Del Pulgar, T.; Guzmán, M.; De Ceballos, M.L. Prevention of Alzheimer’s Disease Pathology by Cannabinoids: Neuroprotection Mediated by Blockade of Microglial Activation. J. Neurosci. 2005, 25, 1904–1913. [Google Scholar] [CrossRef] [PubMed]
- Solas, M.; Francis, P.T.; Franco, R.; Ramirez, M.J. CB2 Receptor and Amyloid Pathology in Frontal Cortex of Alzheimer’s Disease Patients. Neurobiol. Aging 2013, 34, 805–808. [Google Scholar] [CrossRef]
- Kurano, M.; Saito, Y.; Uranbileg, B.; Saigusa, D.; Kano, K.; Aoki, J.; Yatomi, Y. Modulations of Bioactive Lipids and Their Receptors in Postmortem Alzheimer’s Disease Brains. Front. Aging Neurosci. 2022, 14, 1066578. [Google Scholar] [CrossRef]
- Oakley, H.; Cole, S.L.; Logan, S.; Maus, E.; Shao, P.; Craft, J.; Guillozet-Bongaarts, A.; Ohno, M.; Disterhoft, J.; Van Eldik, L.; et al. Intraneuronal β-Amyloid Aggregates, Neurodegeneration, and Neuron Loss in Transgenic Mice with Five Familial Alzheimer’s Disease Mutations: Potential Factors in Amyloid Plaque Formation. J. Neurosci. 2006, 26, 10129–10140. [Google Scholar] [CrossRef] [PubMed]
- Ohno, M.; Chang, L.; Tseng, W.; Oakley, H.; Citron, M.; Klein, W.L.; Vassar, R.; Disterhoft, J.F. Temporal Memory Deficits in Alzheimer’s Mouse Models: Rescue by Genetic Deletion of BACE1. Eur. J. Neurosci. 2006, 23, 251–260. [Google Scholar] [CrossRef] [PubMed]
- Medina-Vera, D.; Rosell-Valle, C.; López-Gambero, A.J.; Navarro, J.A.; Zambrana-Infantes, E.N.; Rivera, P.; Santín, L.J.; Suarez, J.; de Fonseca, F.R. Imbalance of Endocannabinoid/Lysophosphatidylinositol Receptors Marks the Severity of Alzheimer’s Disease in a Preclinical Model: A Therapeutic Opportunity. Biology 2020, 9, 377. [Google Scholar] [CrossRef]
- Hong, I.; Kang, T.; Yoo, Y.C.; Park, R.; Lee, J.; Lee, S.; Kim, J.; Song, B.; Kim, S.Y.; Moon, M.; et al. Quantitative Proteomic Analysis of the Hippocampus in the 5XFAD Mouse Model at Early Stages of Alzheimer’s Disease Pathology. J. Alzheimer’s Dis. 2013, 36, 321–334. [Google Scholar] [CrossRef]
- Saito, T.; Matsuba, Y.; Mihira, N.; Takano, J.; Nilsson, P.; Itohara, S.; Iwata, N.; Saido, T.C. Single App Knock-in Mouse Models of Alzheimer’s Disease. Nat. Neurosci. 2014, 17, 661–663. [Google Scholar] [CrossRef]
- Nilsberth, C.; Westlind-Danielsson, A.; Eckman, C.B.; Condron, M.M.; Axelman, K.; Forsell, C.; Stenh, C.; Luthman, J.; Teplow, D.B.; Younkin, S.G.; et al. The “Arctic” APP Mutation (E693G) Causes Alzheimer’s Disease by Enhanced Aβ Protofibril Formation. Nat. Neurosci. 2001, 4, 887–893. [Google Scholar] [CrossRef]
- Kilkenny, C.; Browne, W.J.; Cuthill, I.C.; Emerson, M.; Altman, D.G. Improving Bioscience Research Reporting: The Arrive Guidelines for Reporting Animal Research. PLoS Biol. 2010, 8, e1000412. [Google Scholar] [CrossRef]
- Saura, J.; Tusell, J.M.; Serratosa, J. High-Yield Isolation of Murine Microglia by Mild Trypsinization. Glia 2003, 44, 183–189. [Google Scholar] [CrossRef] [PubMed]
- Schneider, C.A.; Rasband, W.S.; Eliceiri, K.W. NIH Image to ImageJ: 25 Years of Image Analysis. Nat. Methods 2012, 9, 671–675. [Google Scholar] [CrossRef] [PubMed]
- Fenclová, E.; Albrecht, J.; Harsa, P.; Jirák, R. Risk Factors for Alzheimer’s Disease. Ceska Slov. Psychiatr. 2020, 116, 59–65. [Google Scholar] [CrossRef]
- Berry, A.J.; Zubko, O.; Reeves, S.J.; Howard, R.J. Endocannabinoid System Alterations in Alzheimer’s Disease: A Systematic Review of Human Studies. Brain Res. 2020, 1749, 147135. [Google Scholar] [CrossRef] [PubMed]
- Rudge, J.D.A. A New Hypothesis for Alzheimer’s Disease: The Lipid Invasion Model. J. Alzheimers Dis. Rep. 2022, 6, 129–161. [Google Scholar] [CrossRef] [PubMed]
- Westlake, T.M.; Howlett, A.C.; Bonner, T.I.; Matsuda, L.A.; Herkenham, M. Cannabinoid Receptor Binding and Messenger RNA Expression in Human Brain: An in Vitro Receptor Autoradiography and in Situ Hybridization Histochemistry Study of Normal Aged and Alzheimer’s Brains. Neuroscience 1994, 63, 637–652. [Google Scholar] [CrossRef]
- Kalifa, S.; Polston, E.K.; Allard, J.S.; Manaye, K.F. Distribution Patterns of Cannabinoid CB1 Receptors in the Hippocampus of APPswe/PS1ΔE9 Double Transgenic Mice. Brain Res. 2011, 1376, 94–100. [Google Scholar] [CrossRef]
- Bedse, G.; Romano, A.; Cianci, S.; Lavecchia, A.M.; Lorenzo, P.; Elphick, M.R.; Laferla, F.M.; Vendemiale, G.; Grillo, C.; Altieri, F.; et al. Altered Expression of the CB1 Cannabinoid Receptor in the Triple Transgenic Mouse Model of Alzheimer’s Disease. J. Alzheimer’s Dis. 2014, 40, 701–712. [Google Scholar] [CrossRef]
- Abate, G.; Uberti, D.; Tambaro, S. Potential and Limits of Cannabinoids in Alzheimer’s Disease Therapy. Biology 2021, 10, 542. [Google Scholar] [CrossRef]
- Farkas, S.; Nagy, K.; Palkovits, M.; Kovács, G.G.; Jia, Z.; Donohue, S.; Pike, V.; Halldin, C.; Máthé, D.; Harkany, T.; et al. [125I]SD-7015 Reveals Fine Modalities of CB 1 Cannabinoid Receptor Density in the Prefrontal Cortex during Progression of Alzheimer’s Disease. Neurochem. Int. 2012, 60, 286–291. [Google Scholar] [CrossRef] [PubMed]
- Manuel, I.; de San Román, E.G.; Giralt, M.T.; Ferrer, I.; Rodríguez-Puertas, R. Type-1 Cannabinoid Receptor Activity during Alzheimer’s Disease Progression. J. Alzheimer’s Dis. 2014, 42, 761–766. [Google Scholar] [CrossRef]
- Mu, Y.; Gage, F.H. Adult Hippocampal Neurogenesis and Its Role in Alzheimer’s Disease. Mol. Neurodegener. 2011, 6, 85. [Google Scholar] [CrossRef]
- Nilsson, P.; Saito, T.; Saido, T.C. New Mouse Model of Alzheimer’s. ACS Chem. Neurosci. 2014, 5, 499–502. [Google Scholar] [CrossRef]
- Stella, N. Cannabinoid and Cannabinoid-like Receptors in Microglia, Astrocytes, and Astrocytomas. Glia 2010, 58, 1017–1030. [Google Scholar] [CrossRef]
- Hurst, K.; Badgley, C.; Ellsworth, T.; Bell, S.; Friend, L.; Prince, B.; Welch, J.; Cowan, Z.; Williamson, R.; Lyon, C.; et al. A Putative Lysophosphatidylinositol Receptor GPR55 Modulates Hippocampal Synaptic Plasticity. Hippocampus 2017, 27, 985–998. [Google Scholar] [CrossRef]
- Xiang, X.T.; Wang, X.; Jin, S.Y.; Hu, J.; Wu, Y.M.; Li, Y.Y.; Wu, X. Activation of GPR55 Attenuates Cognitive Impairment and Neurotoxicity in a Mouse Model of Alzheimer’s Disease Induced by Aβ1–42 through Inhibiting RhoA/ROCK2 Pathway. Prog. Neuropsychopharmacol. Biol. Psychiatry 2022, 112, 110423. [Google Scholar] [CrossRef] [PubMed]
- Xiang, X.T.; Wang, X.; Wu, Y.M.; Hu, J.; Li, Y.Y.; Jin, S.Y.; Wu, X. Activation of GPR55 Attenuates Cognitive Impairment, Oxidative Stress, Neuroinflammation, and Synaptic Dysfunction in a Streptozotocin-Induced Alzheimer’s Mouse Model. Pharmacol. Biochem. Behav. 2022, 214, 173340. [Google Scholar] [CrossRef] [PubMed]
- Mendez, M.F. The Relationship between Anxiety and Alzheimer’s Disease. J. Alzheimers Dis. Rep. 2021, 5, 171–177. [Google Scholar] [CrossRef] [PubMed]
- Shi, Q.X.; Yang, L.K.; Shi, W.L.; Wang, L.; Zhou, S.M.; Guan, S.Y.; Zhao, M.G.; Yang, Q. The Novel Cannabinoid Receptor GPR55 Mediates Anxiolytic-like Effects in the Medial Orbital Cortex of Mice with Acute Stress. Mol. Brain 2017, 10, 38. [Google Scholar] [CrossRef]
- Rahimi, A.; Hajizadeh Moghaddam, A.; Roohbakhsh, A. Central Administration of GPR55 Receptor Agonist and Antagonist Modulates Anxiety-Related Behaviors in Rats. Fundam. Clin. Pharmacol. 2015, 29, 185–190. [Google Scholar] [CrossRef]
- Papadopoulou, L.; Alexandri, F.; Tsolaki, A.; Moraitou, D.; Konsta, A.; Tsolaki, M. Neuropsychiatric Symptoms in Dementia. The Added Value of Cannabinoids. Are They a Safe and Effective Choice? Case Series with Cannabidiol 3%. Ann. Case Rep. 2022, 7, 799. [Google Scholar] [CrossRef]
- Romero-Zerbo, S.Y.; Rafacho, A.; Díaz-Arteaga, A.; Suárez, J.; Quesada, I.; Imbernon, M.; Ross, R.A.; Dieguez, C.; de Fonseca, F.R.; Nogueiras, R.; et al. Role for the Putative Cannabinoid Receptor GPR55 in the Islets of Langerhans. J. Endocrinol. 2011, 211, 177–185. [Google Scholar] [CrossRef]
- Wang, W.Y.; Tan, M.S.; Yu, J.T.; Tan, L. Role of Pro-Inflammatory Cytokines Released from Microglia in Alzheimer’s Disease. Ann. Transl. Med. 2015, 3, 136. [Google Scholar] [PubMed]
- Gamba, P.; Testa, G.; Gargiulo, S.; Staurenghi, E.; Poli, G.; Leonarduzzi, G. Oxidized Cholesterol as the Driving Force behind the Development of Alzheimer’s Disease. Front. Aging Neurosci. 2015, 7, 119. [Google Scholar] [CrossRef] [PubMed]
- Parlar, A.; Arslan, S.O.; Doğan, M.F.; Çam, S.A.; Yalçin, A.; Elibol, E.; Özer, M.K.; Üçkardeş, F.; Kara, H. The Exogenous Administration of CB2 Specific Agonist, GW405833, Inhibits Inflammation by Reducing Cytokine Production and Oxidative Stress. Exp. Ther. Med. 2018, 16, 4900–4908. [Google Scholar] [CrossRef]
- Ehrhart, J.; Obregon, D.; Mori, T.; Hou, H.; Sun, N.; Bai, Y.; Klein, T.; Fernandez, F.; Tan, J.; Shytle, D. Stimulation of Cannabinoid Receptor 2 (CB2) Suppresses Microglial Activation. J. Neuroinflamm. 2005, 2, 29. [Google Scholar] [CrossRef] [PubMed]
- Abd El-Rahman, S.S.; Fayed, H.M. Improved Cognition Impairment by Activating Cannabinoid Receptor Type 2: Modulating CREB/BDNF Expression and Impeding TLR-4/ NFκBp65/M1 Microglia Signaling Pathway in D-Galactose-Injected Ovariectomized Rats. PLoS ONE 2022, 17, e0265961. [Google Scholar] [CrossRef] [PubMed]
- Wu, J.; Hocevar, M.; Foss, J.F.; Bie, B.; Naguib, M. Activation of CB2 Receptor System Restores Cognitive Capacity and Hippocampal Sox2 Expression in a Transgenic Mouse Model of Alzheimer’s Disease. Eur. J. Pharmacol. 2017, 811, 12–20. [Google Scholar] [CrossRef] [PubMed]
- Martín-Moreno, A.M.; Brera, B.; Spuch, C.; Carro, E.; García-García, L.; Delgado, M.; Pozo, M.A.; Innamorato, N.G.; Cuadrado, A.; de Ceballos, M.L. Prolonged Oral Cannabinoid Administration Prevents Neuroinflammation, Lowers β-Amyloid Levels and Improves Cognitive Performance in Tg APP 2576 Mice. J. Neuroinflamm. 2012, 9, 8. [Google Scholar] [CrossRef]
- Wu, J.; Bie, B.; Yang, H.; Xu, J.J.; Brown, D.L.; Naguib, M. Activation of the CB2 Receptor System Reverses Amyloid-Induced Memory Deficiency. Neurobiol. Aging 2013, 34, 791–804. [Google Scholar] [CrossRef] [PubMed]
- Hill, J.D.; Zuluaga-Ramirez, V.; Gajghate, S.; Winfield, M.; Sriram, U.; Rom, S.; Persidsky, Y. Activation of GPR55 Induces Neuroprotection of Hippocampal Neurogenesis and Immune Responses of Neural Stem Cells Following Chronic, Systemic Inflammation. Brain Behav. Immun. 2019, 76, 165–181. [Google Scholar] [CrossRef] [PubMed]
- Staton, P.C.; Hatcher, J.P.; Walker, D.J.; Morrison, A.D.; Shapland, E.M.; Hughes, J.P.; Chong, E.; Mander, P.K.; Green, P.J.; Billinton, A.; et al. The Putative Cannabinoid Receptor GPR55 Plays a Role in Mechanical Hyperalgesia Associated with Inflammatory and Neuropathic Pain. Pain 2008, 139, 225–236. [Google Scholar] [CrossRef]
- Saliba, S.W.; Jauch, H.; Gargouri, B.; Keil, A.; Hurrle, T.; Volz, N.; Mohr, F.; van der Stelt, M.; Bräse, S.; Fiebich, B.L. Anti-Neuroinflammatory Effects of GPR55 Antagonists in LPS-Activated Primary Microglial Cells. J. Neuroinflamm. 2018, 15, 322. [Google Scholar] [CrossRef]
- Laguerre, A.; Keutler, K.; Hauke, S.; Schultz, C. Regulation of Calcium Oscillations in β-Cells by Co-Activated Cannabinoid Receptors. Cell. Chem. Biol. 2021, 28, 88–96.e3. [Google Scholar] [CrossRef]
- Brusco, A.; Tagliaferro, P.A.; Saez, T.; Onaivi, E.S. Ultrastructural Localization of Neuronal Brain CB2 Cannabinoid Receptors. Ann. N. Y. Acad. Sci. 2008, 1139, 450–457. [Google Scholar] [CrossRef]
- Baek, J.H.; Zheng, Y.; Darlington, C.L.; Smith, P.F. Cannabinoid CB2 Receptor Expression in the Rat Brainstem Cochlear and Vestibular Nuclei. Acta Otolaryngol. 2008, 128, 961–967. [Google Scholar] [CrossRef]
- Andradas, C.; Caffarel, M.M.; Pérez-Gómez, E.; Salazar, M.; Lorente, M.; Velasco, G.; Guzmán, M.; Sánchez, C. The Orphan G Protein-Coupled Receptor GPR55 Promotes Cancer Cell Proliferation via ERK. Oncogene 2011, 30, 245–252. [Google Scholar] [CrossRef] [PubMed]
- Latif-Hernandez, A.; Sabanov, V.; Ahmed, T.; Craessaerts, K.; Saito, T.; Saido, T.; Balschun, D. The Two Faces of Synaptic Failure in App NL-G-Fknock-in Mice. Alzheimers Res. Ther. 2020, 12, 100. [Google Scholar] [CrossRef]
- Sasaguri, H.; Nilsson, P.; Hashimoto, S.; Nagata, K.; Saito, T.; De Strooper, B.; Hardy, J.; Vassar, R.; Winblad, B.; Saido, T.C. APP Mouse Models for Alzheimer’s Disease Preclinical Studies. EMBO J. 2017, 36, 2473–2487. [Google Scholar] [CrossRef]
- Wang, L.; Liu, B.J.; Cao, Y.; Xu, W.Q.; Sun, D.S.; Li, M.Z.; Shi, F.X.; Li, M.; Tian, Q.; Wang, J.Z.; et al. Deletion of Type-2 Cannabinoid Receptor Induces Alzheimer’s Disease-Like Tau Pathology and Memory Impairment Through AMPK/GSK3β Pathway. Mol. Neurobiol. 2018, 55, 4731–4744. [Google Scholar] [CrossRef] [PubMed]


Disclaimer/Publisher’s Note: The statements, opinions and data contained in all publications are solely those of the individual author(s) and contributor(s) and not of MDPI and/or the editor(s). MDPI and/or the editor(s) disclaim responsibility for any injury to people or property resulting from any ideas, methods, instructions or products referred to in the content. |
© 2023 by the authors. Licensee MDPI, Basel, Switzerland. This article is an open access article distributed under the terms and conditions of the Creative Commons Attribution (CC BY) license (https://creativecommons.org/licenses/by/4.0/).
Share and Cite
Medina-Vera, D.; Zhao, H.; Bereczki, E.; Rosell-Valle, C.; Shimozawa, M.; Chen, G.; de Fonseca, F.R.; Nilsson, P.; Tambaro, S. The Expression of the Endocannabinoid Receptors CB2 and GPR55 Is Highly Increased during the Progression of Alzheimer’s Disease in AppNL-G-F Knock-In Mice. Biology 2023, 12, 805. https://doi.org/10.3390/biology12060805
Medina-Vera D, Zhao H, Bereczki E, Rosell-Valle C, Shimozawa M, Chen G, de Fonseca FR, Nilsson P, Tambaro S. The Expression of the Endocannabinoid Receptors CB2 and GPR55 Is Highly Increased during the Progression of Alzheimer’s Disease in AppNL-G-F Knock-In Mice. Biology. 2023; 12(6):805. https://doi.org/10.3390/biology12060805
Chicago/Turabian StyleMedina-Vera, Dina, Hongjing Zhao, Erika Bereczki, Cristina Rosell-Valle, Makoto Shimozawa, Gefei Chen, Fernando Rodríguez de Fonseca, Per Nilsson, and Simone Tambaro. 2023. "The Expression of the Endocannabinoid Receptors CB2 and GPR55 Is Highly Increased during the Progression of Alzheimer’s Disease in AppNL-G-F Knock-In Mice" Biology 12, no. 6: 805. https://doi.org/10.3390/biology12060805